Embed Size (px)
Citation preview
JAN FIDRMUCDAVID G MAYES
Crises, Reforms and Ideology
Introduction
Why do reforms take place when they do?What determines their scope, depth and
direction? Important economic and political changes
often follow after economic crises New Deal in the US, Nazism in Germany Communism in Russia and China Latin American hyperinflations End of communism in China and Eastern Europe Arab Spring and the Occupy Movement
Crises Beget Reforms
Alesina and Drazen (1991) Moderate crises costly but often sustained
over long periods War of attrition about distributional implications of
reform During major crises, all agree on the need for
changeEmpirical evidence supporting this
relationship: Bruno and Easterly (1996), Drazen and Easterly (2001), Pitlik and Wirth (2003), Pitlik (2011), Fidrmuc and Tichit (2012).
Ideology and Reform
Parties have an ideological bias for certain policies E.g. deregulation in the UK under Thatcher
Cukierman and Tommasi (1998): reform proposals more likely to succeed if made by unlikely politicians E.g. deregulation in NZ under Labour Voters cannot tell whether policy proposals motivated
by shocks to state of nature or ideological shocks Politicians observe state of nature but their
pronouncements are not credible Unlikely politicians can credibly signal the need for
costly reform
Motivation
Do crises affect probability that reform takes place?
Does government’s ideology play a role?Do right and left wing governments respond
to crises differently?Do right and left wing governments
implement reform following different kinds of crises?
What We Do?
Effect of crises on reform Economic liberalization and deregulation Democratization
Different types of crises Economic contractions High inflation episodes
Effect of ideologyInteraction of ideology and crisis
Data
Economic data (World Development Indicators) GDP per capita growth, inflation 1960-2009
Economic Freedom of the World (Fraser Institute) Every 5 years 1970-2000, every years thereafter Summary index and 5 sub-indexes
Democracy (Freedom House) Political rights and civil liberties ,1972-2009
Ideology
Niklas Potrafke’s Index, University of Konstanz Originally 1-5 scale (right to left): 1 (over 2/3 right
wing), 2 (1/3-2/3 right wing), 3 (centrist or mixed), etc Reformatted as 1-2 (right), 4-5 (left) and 3
(centrist/mixed) OECD (1950-2009) and CEE (1989-2007)
Comparative Political Data Set III (CPDS), University of Berne Share of cabinet seats held by right wing, left wing
and centrist/independent politicians OECD and EU countries, 1990-2009
Definitions of Crises
Economic contraction Growth lower by 2/3/4/5% than the average of
preceding 4 years Average growth during preceding 4 years 0/-1/-2/-3 %
or lessHigh inflation
Inflation higher by 5/10/20/30% than the average of preceding 4 years
Average inflation during preceding 4 years 10/20/30/40% or higher
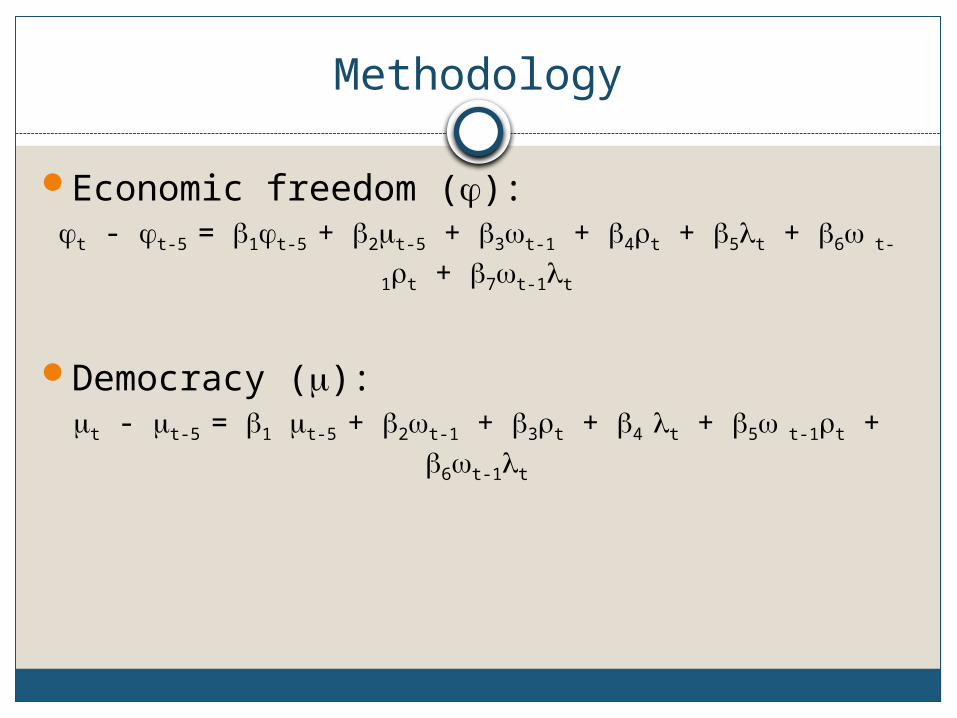
Methodology
Economic freedom ():t - t-5 = 1t-5 + 2t-5 + 3t-1 + 4t + 5t + 6 t-1t + 7t-1t
Democracy ():t - t-5 = 1 t-5 + 2t-1 + 3t + 4 t + 5 t-1t + 6t-1t
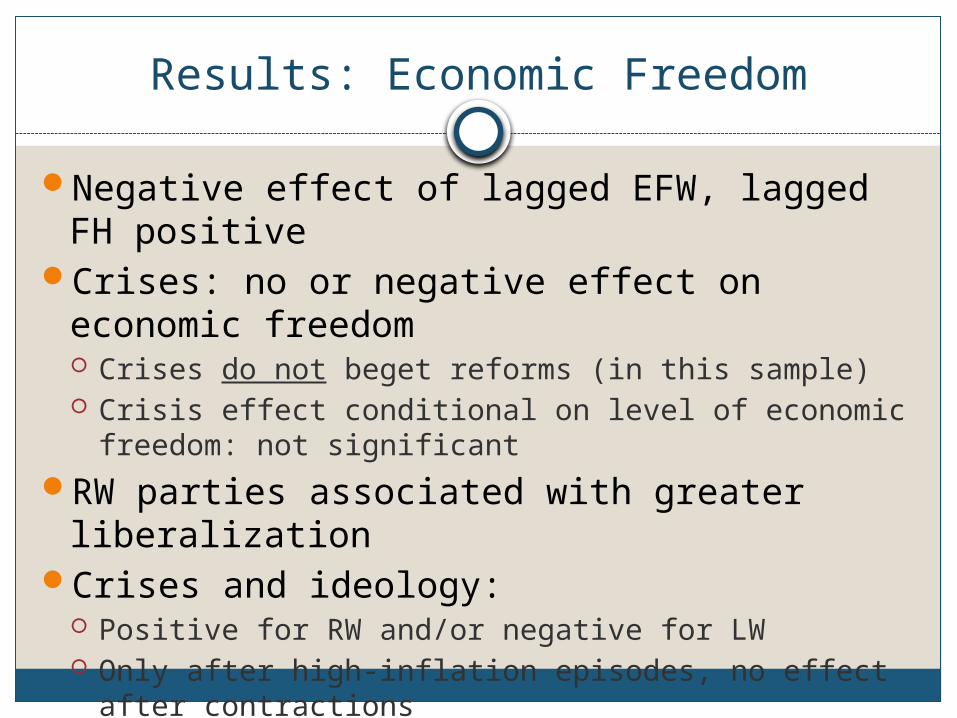
Results: Economic Freedom
Negative effect of lagged EFW, lagged FH positive
Crises: no or negative effect on economic freedom Crises do not beget reforms (in this sample) Crisis effect conditional on level of economic freedom:
not significantRW parties associated with greater
liberalizationCrises and ideology:
Positive for RW and/or negative for LW Only after high-inflation episodes, no effect after
contractions EFW sub-indexes: effect mainly on EFW3 – sound
money
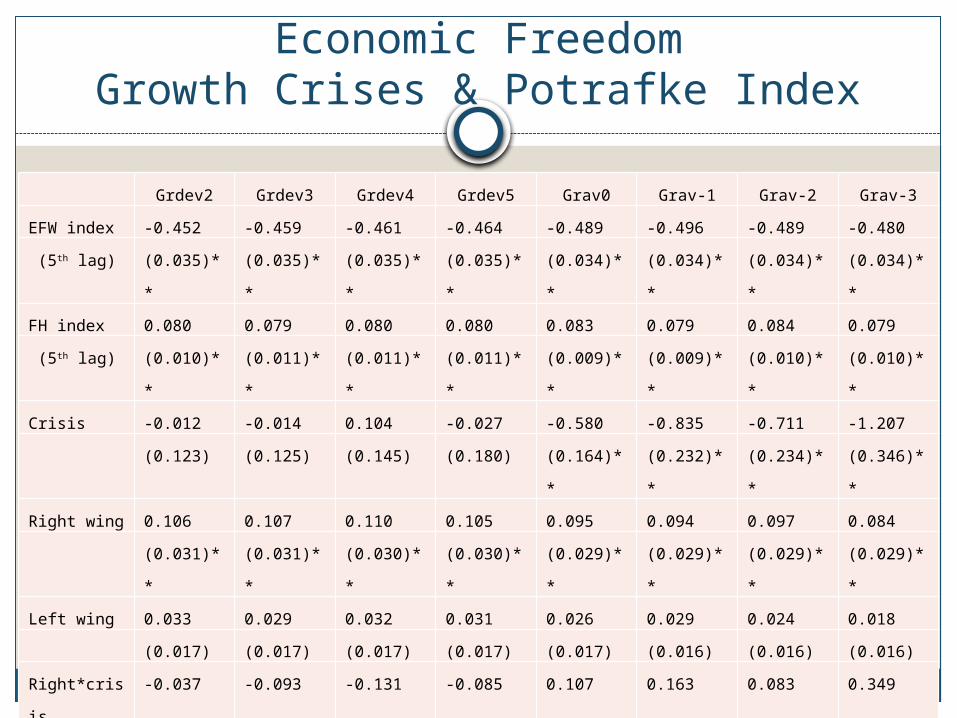
Economic FreedomGrowth Crises & Potrafke Index
Grdev2 Grdev3 Grdev4 Grdev5 Grav0 Grav-1 Grav-2 Grav-3
EFW index -0.452 -0.459 -0.461 -0.464 -0.489 -0.496 -0.489 -0.480
(5th lag) (0.035)** (0.035)** (0.035)** (0.035)** (0.034)** (0.034)** (0.034)** (0.034)**
FH index 0.080 0.079 0.080 0.080 0.083 0.079 0.084 0.079
(5th lag) (0.010)** (0.011)** (0.011)** (0.011)** (0.009)** (0.009)** (0.010)** (0.010)**
Crisis -0.012 -0.014 0.104 -0.027 -0.580 -0.835 -0.711 -1.207
(0.123) (0.125) (0.145) (0.180) (0.164)** (0.232)** (0.234)** (0.346)**
Right wing 0.106 0.107 0.110 0.105 0.095 0.094 0.097 0.084
(0.031)** (0.031)** (0.030)** (0.030)** (0.029)** (0.029)** (0.029)** (0.029)**
Left wing 0.033 0.029 0.032 0.031 0.026 0.029 0.024 0.018
(0.017) (0.017) (0.017) (0.017) (0.017) (0.016) (0.016) (0.016)
Right*crisis -0.037 -0.093 -0.131 -0.085 0.107 0.163 0.083 0.349
(0.077) (0.094) (0.144) (0.205) (0.111) (0.146) (0.171) (0.241)
Left*crisis -0.082 -0.076 -0.106 -0.074 0.064 0.055 0.056 0.183
(0.042) (0.060) (0.062) (0.068) (0.050) (0.069) (0.084) (0.106)
Constant 1.792 1.836 1.825 1.865 2.005 2.124 1.988 2.022
(0.246)** (0.254)** (0.254)** (0.254)** (0.242)** (0.246)** (0.246)** (0.249)**
R2 0.49 0.48 0.48 0.47 0.51 0.52 0.50 0.50
N 295 295 295 295 295 295 295
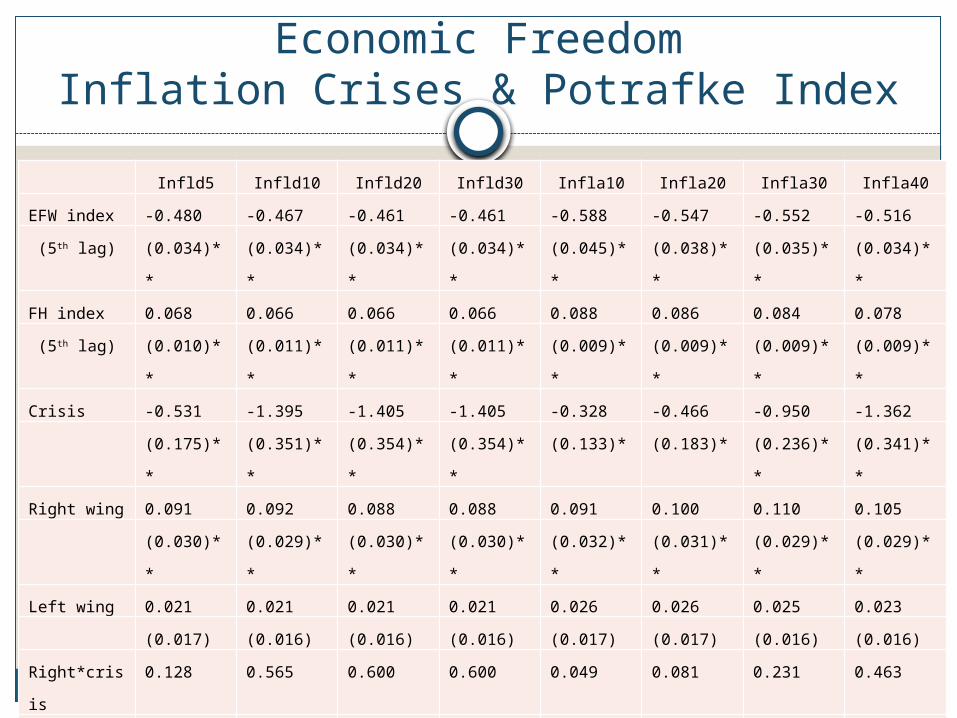
Economic FreedomInflation Crises & Potrafke Index
Infld5 Infld10 Infld20 Infld30 Infla10 Infla20 Infla30 Infla40
EFW index -0.480 -0.467 -0.461 -0.461 -0.588 -0.547 -0.552 -0.516
(5th lag) (0.034)** (0.034)** (0.034)** (0.034)** (0.045)** (0.038)** (0.035)** (0.034)**
FH index 0.068 0.066 0.066 0.066 0.088 0.086 0.084 0.078
(5th lag) (0.010)** (0.011)** (0.011)** (0.011)** (0.009)** (0.009)** (0.009)** (0.009)**
Crisis -0.531 -1.395 -1.405 -1.405 -0.328 -0.466 -0.950 -1.362
(0.175)** (0.351)** (0.354)** (0.354)** (0.133)* (0.183)* (0.236)** (0.341)**
Right wing 0.091 0.092 0.088 0.088 0.091 0.100 0.110 0.105
(0.030)** (0.029)** (0.030)** (0.030)** (0.032)** (0.031)** (0.029)** (0.029)**
Left wing 0.021 0.021 0.021 0.021 0.026 0.026 0.025 0.023
(0.017) (0.016) (0.016) (0.016) (0.017) (0.017) (0.016) (0.016)
Right*crisis 0.128 0.565 0.600 0.600 0.049 0.081 0.231 0.463
(0.101) (0.184)** (0.186)** (0.186)** (0.070) (0.097) (0.124) (0.175)**
Left*crisis -0.013 0.205 0.207 0.207 -0.031 -0.002 0.129 0.234
(0.060) (0.093)* (0.093)* (0.093)* (0.039) (0.055) (0.069) (0.090)*
Constant 2.230 2.168 2.140 2.140 2.633 2.362 2.432 2.285
(0.258)** (0.254)** (0.258)** (0.258)** (0.330)** (0.276)** (0.258)** (0.253)**
R2 0.51 0.51 0.51 0.51 0.51 0.51 0.53 0.53
N 295 295 295 295 295 295 295 295
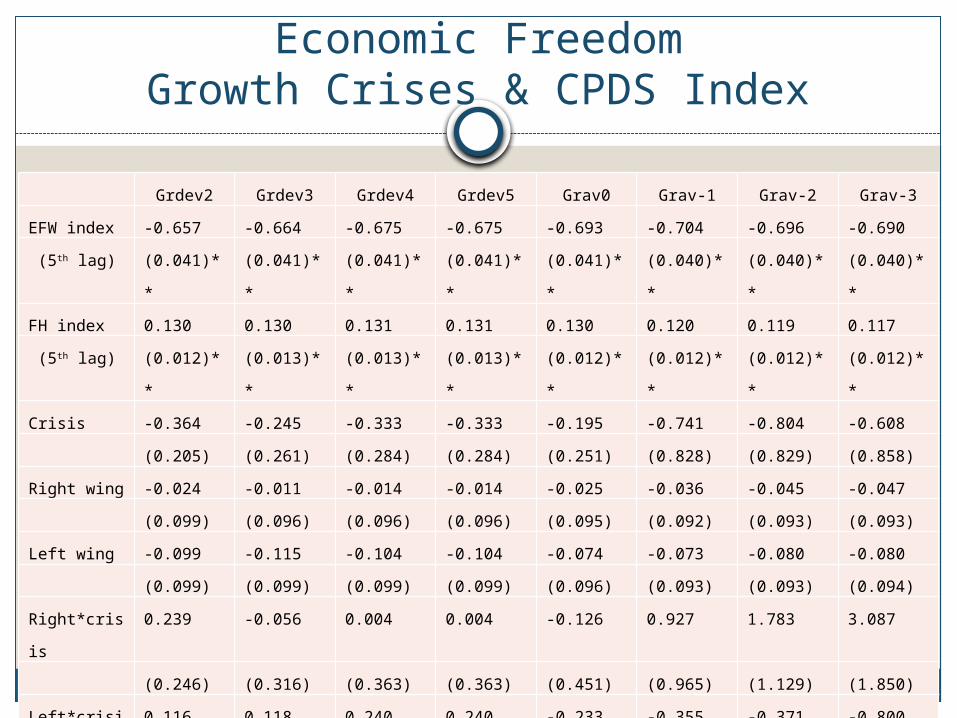
Economic FreedomGrowth Crises & CPDS Index
Grdev2 Grdev3 Grdev4 Grdev5 Grav0 Grav-1 Grav-2 Grav-3
EFW index -0.657 -0.664 -0.675 -0.675 -0.693 -0.704 -0.696 -0.690
(5th lag) (0.041)** (0.041)** (0.041)** (0.041)** (0.041)** (0.040)** (0.040)** (0.040)**
FH index 0.130 0.130 0.131 0.131 0.130 0.120 0.119 0.117
(5th lag) (0.012)** (0.013)** (0.013)** (0.013)** (0.012)** (0.012)** (0.012)** (0.012)**
Crisis -0.364 -0.245 -0.333 -0.333 -0.195 -0.741 -0.804 -0.608
(0.205) (0.261) (0.284) (0.284) (0.251) (0.828) (0.829) (0.858)
Right wing -0.024 -0.011 -0.014 -0.014 -0.025 -0.036 -0.045 -0.047
(0.099) (0.096) (0.096) (0.096) (0.095) (0.092) (0.093) (0.093)
Left wing -0.099 -0.115 -0.104 -0.104 -0.074 -0.073 -0.080 -0.080
(0.099) (0.099) (0.099) (0.099) (0.096) (0.093) (0.093) (0.094)
Right*crisis 0.239 -0.056 0.004 0.004 -0.126 0.927 1.783 3.087
(0.246) (0.316) (0.363) (0.363) (0.451) (0.965) (1.129) (1.850)
Left*crisis 0.116 0.118 0.240 0.240 -0.233 -0.355 -0.371 -0.800
(0.259) (0.377) (0.402) (0.402) (0.357) (1.156) (1.168) (1.263)
Constant 2.448 2.498 2.538 2.538 2.686 2.962 2.923 2.928
(0.288)** (0.293)** (0.295)** (0.295)** (0.297)** (0.299)** (0.298)** (0.298)**
R2 0.60 0.59 0.58 0.58 0.59 0.61 0.61 0.61
N 266 266 266 266 266 266 266 266
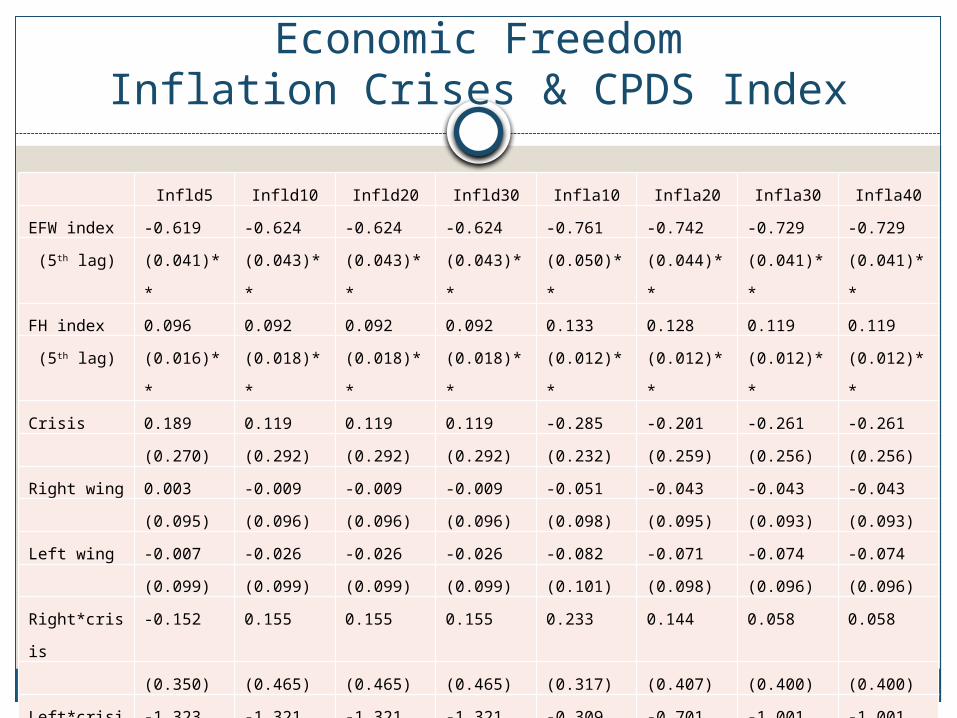
Economic FreedomInflation Crises & CPDS Index
Infld5 Infld10 Infld20 Infld30 Infla10 Infla20 Infla30 Infla40
EFW index -0.619 -0.624 -0.624 -0.624 -0.761 -0.742 -0.729 -0.729
(5th lag) (0.041)** (0.043)** (0.043)** (0.043)** (0.050)** (0.044)** (0.041)** (0.041)**
FH index 0.096 0.092 0.092 0.092 0.133 0.128 0.119 0.119
(5th lag) (0.016)** (0.018)** (0.018)** (0.018)** (0.012)** (0.012)** (0.012)** (0.012)**
Crisis 0.189 0.119 0.119 0.119 -0.285 -0.201 -0.261 -0.261
(0.270) (0.292) (0.292) (0.292) (0.232) (0.259) (0.256) (0.256)
Right wing 0.003 -0.009 -0.009 -0.009 -0.051 -0.043 -0.043 -0.043
(0.095) (0.096) (0.096) (0.096) (0.098) (0.095) (0.093) (0.093)
Left wing -0.007 -0.026 -0.026 -0.026 -0.082 -0.071 -0.074 -0.074
(0.099) (0.099) (0.099) (0.099) (0.101) (0.098) (0.096) (0.096)
Right*crisis -0.152 0.155 0.155 0.155 0.233 0.144 0.058 0.058
(0.350) (0.465) (0.465) (0.465) (0.317) (0.407) (0.400) (0.400)
Left*crisis -1.323 -1.321 -1.321 -1.321 -0.309 -0.701 -1.001 -1.001
(0.379)** (0.483)** (0.483)** (0.483)** (0.314) (0.414) (0.430)* (0.430)*
Constant 2.771 2.887 2.887 2.887 3.129 3.081 3.160 3.160
(0.307)** (0.328)** (0.328)** (0.328)** (0.357)** (0.323)** (0.311)** (0.311)**
R2 0.60 0.59 0.59 0.59 0.59 0.60 0.62 0.62
N 266 266 266 266 266 266 266 266
Results: Economic Freedom (cont’d)
Relevance: Crisis management and recovery: RW parties more
averse to inflation than LW parties Long-term effect: EFW important determinant of
economic growth (de Haan and Sturm, 2000; Doucouliagos and Ulubasoglu, 2006)
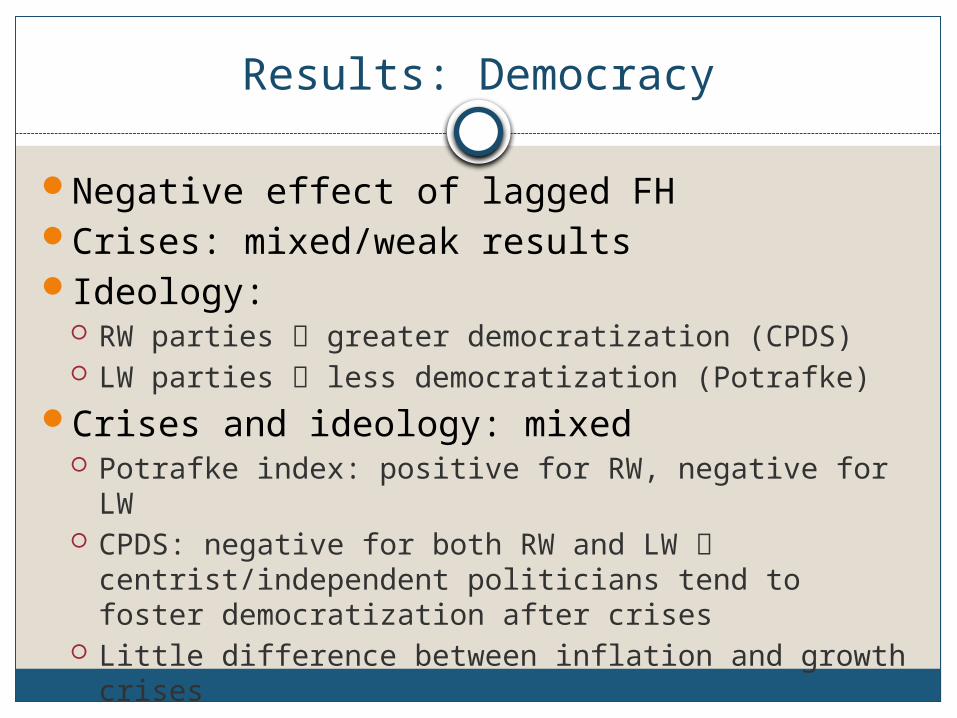
Results: Democracy
Negative effect of lagged FHCrises: mixed/weak resultsIdeology:
RW parties greater democratization (CPDS) LW parties less democratization (Potrafke)
Crises and ideology: mixed Potrafke index: positive for RW, negative for LW CPDS: negative for both RW and LW
centrist/independent politicians tend to foster democratization after crises
Little difference between inflation and growth crises
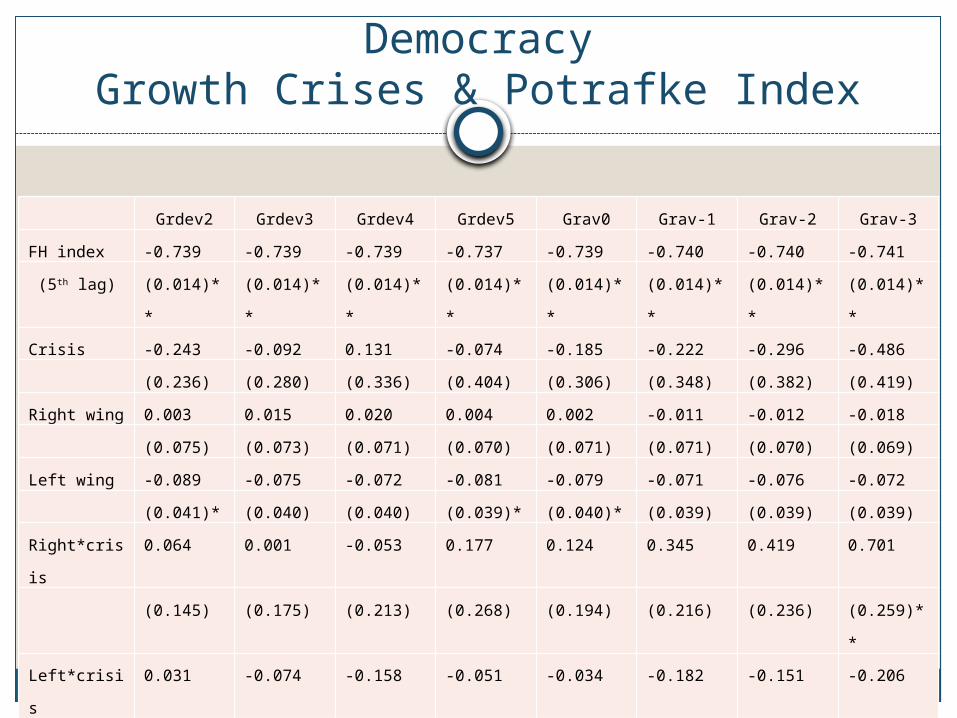
DemocracyGrowth Crises & Potrafke Index
Grdev2 Grdev3 Grdev4 Grdev5 Grav0 Grav-1 Grav-2 Grav-3
FH index -0.739 -0.739 -0.739 -0.737 -0.739 -0.740 -0.740 -0.741
(5th lag) (0.014)** (0.014)** (0.014)** (0.014)** (0.014)** (0.014)** (0.014)** (0.014)**
Crisis -0.243 -0.092 0.131 -0.074 -0.185 -0.222 -0.296 -0.486
(0.236) (0.280) (0.336) (0.404) (0.306) (0.348) (0.382) (0.419)
Right wing 0.003 0.015 0.020 0.004 0.002 -0.011 -0.012 -0.018
(0.075) (0.073) (0.071) (0.070) (0.071) (0.071) (0.070) (0.069)
Left wing -0.089 -0.075 -0.072 -0.081 -0.079 -0.071 -0.076 -0.072
(0.041)* (0.040) (0.040) (0.039)* (0.040)* (0.039) (0.039) (0.039)
Right*crisis 0.064 0.001 -0.053 0.177 0.124 0.345 0.419 0.701
(0.145) (0.175) (0.213) (0.268) (0.194) (0.216) (0.236) (0.259)**
Left*crisis 0.031 -0.074 -0.158 -0.051 -0.034 -0.182 -0.151 -0.206
(0.080) (0.098) (0.121) (0.140) (0.102) (0.120) (0.136) (0.147)
Constant 13.656 13.622 13.586 13.583 13.629 13.644 13.647 13.654
(0.262)** (0.262)** (0.262)** (0.261)** (0.266)** (0.268)** (0.268)** (0.266)**
R2 0.73 0.73 0.73 0.73 0.73 0.74 0.74 0.74
N 1,089 1,089 1,089 1,089 1,089 1,089 1,089 1,089
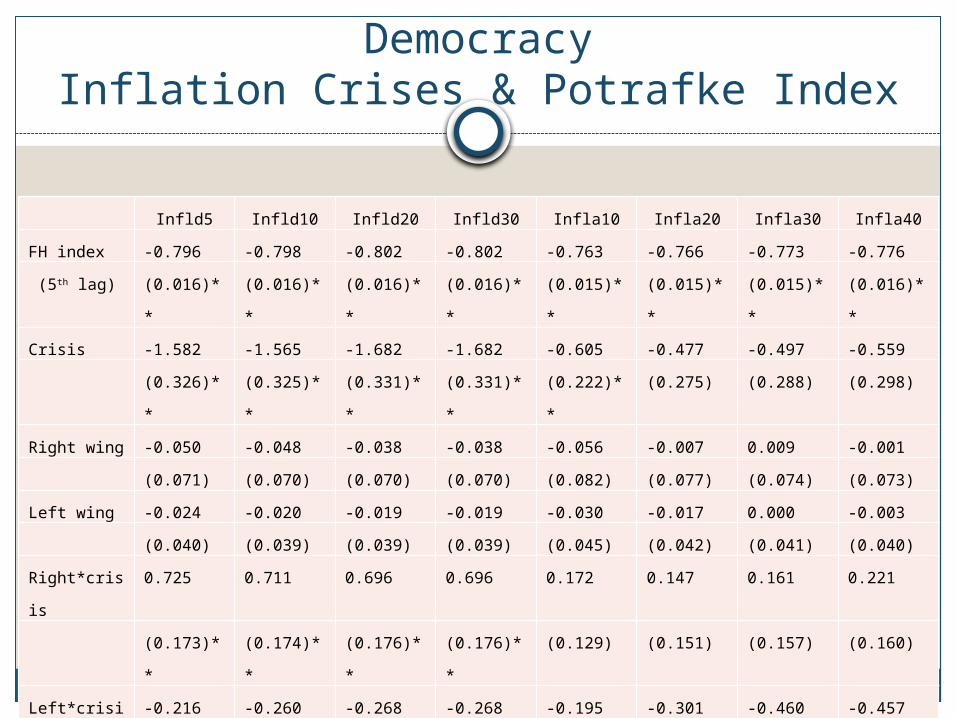
DemocracyInflation Crises & Potrafke Index
Infld5 Infld10 Infld20 Infld30 Infla10 Infla20 Infla30 Infla40
FH index -0.796 -0.798 -0.802 -0.802 -0.763 -0.766 -0.773 -0.776
(5th lag) (0.016)** (0.016)** (0.016)** (0.016)** (0.015)** (0.015)** (0.015)** (0.016)**
Crisis -1.582 -1.565 -1.682 -1.682 -0.605 -0.477 -0.497 -0.559
(0.326)** (0.325)** (0.331)** (0.331)** (0.222)** (0.275) (0.288) (0.298)
Right wing -0.050 -0.048 -0.038 -0.038 -0.056 -0.007 0.009 -0.001
(0.071) (0.070) (0.070) (0.070) (0.082) (0.077) (0.074) (0.073)
Left wing -0.024 -0.020 -0.019 -0.019 -0.030 -0.017 0.000 -0.003
(0.040) (0.039) (0.039) (0.039) (0.045) (0.042) (0.041) (0.040)
Right*crisis 0.725 0.711 0.696 0.696 0.172 0.147 0.161 0.221
(0.173)** (0.174)** (0.176)** (0.176)** (0.129) (0.151) (0.157) (0.160)
Left*crisis -0.216 -0.260 -0.268 -0.268 -0.195 -0.301 -0.460 -0.457
(0.095)* (0.096)** (0.097)** (0.097)** (0.069)** (0.082)** (0.088)** (0.090)**
Constant 14.735 14.776 14.840 14.840 14.254 14.153 14.255 14.304
(0.301)** (0.300)** (0.297)** (0.297)** (0.298)** (0.302)** (0.301)** (0.306)**
R2 0.76 0.76 0.76 0.76 0.75 0.75 0.75 0.75
N 1,089 1,089 1,089 1,089 1,089 1,089 1,089 1,089
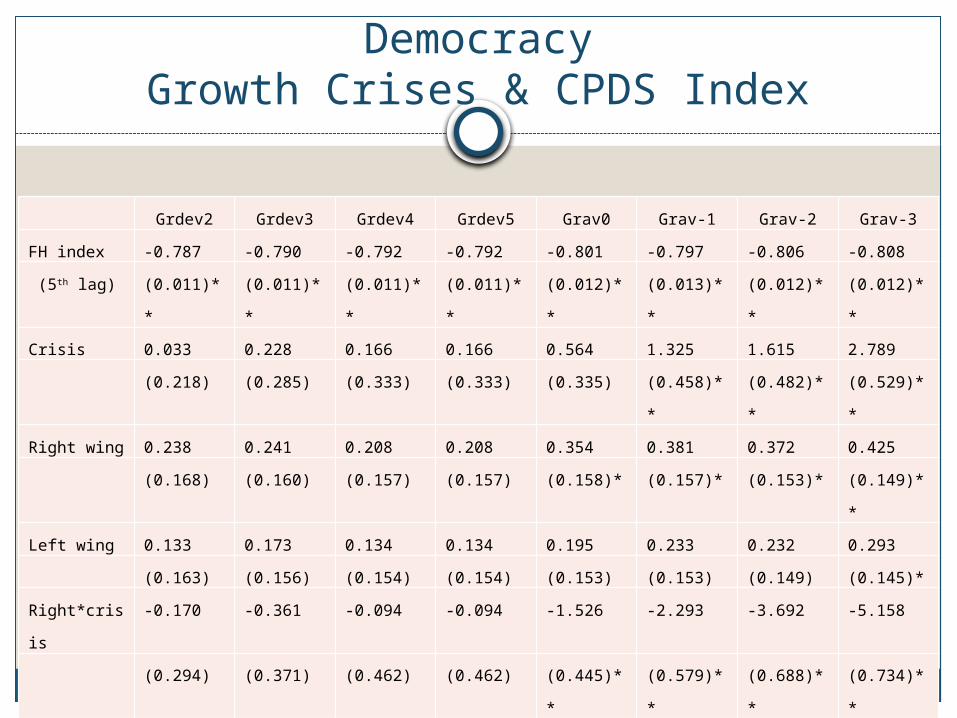
DemocracyGrowth Crises & CPDS Index
Grdev2 Grdev3 Grdev4 Grdev5 Grav0 Grav-1 Grav-2 Grav-3
FH index -0.787 -0.790 -0.792 -0.792 -0.801 -0.797 -0.806 -0.808
(5th lag) (0.011)** (0.011)** (0.011)** (0.011)** (0.012)** (0.013)** (0.012)** (0.012)**
Crisis 0.033 0.228 0.166 0.166 0.564 1.325 1.615 2.789
(0.218) (0.285) (0.333) (0.333) (0.335) (0.458)** (0.482)** (0.529)**
Right wing 0.238 0.241 0.208 0.208 0.354 0.381 0.372 0.425
(0.168) (0.160) (0.157) (0.157) (0.158)* (0.157)* (0.153)* (0.149)**
Left wing 0.133 0.173 0.134 0.134 0.195 0.233 0.232 0.293
(0.163) (0.156) (0.154) (0.154) (0.153) (0.153) (0.149) (0.145)*
Right*crisis -0.170 -0.361 -0.094 -0.094 -1.526 -2.293 -3.692 -5.158
(0.294) (0.371) (0.462) (0.462) (0.445)** (0.579)** (0.688)** (0.734)**
Left*crisis -0.515 -1.414 -1.728 -1.728 -1.607 -2.693 -3.124 -4.828
(0.311) (0.421)** (0.524)** (0.524)** (0.442)** (0.572)** (0.589)** (0.648)**
Constant 15.142 15.184 15.237 15.237 15.351 15.245 15.411 15.410
(0.225)** (0.223)** (0.225)** (0.225)** (0.234)** (0.251)** (0.249)** (0.243)**
R2 0.89 0.89 0.89 0.89 0.89 0.89 0.89 0.90
N 682 682 682 682 682 682 682 682
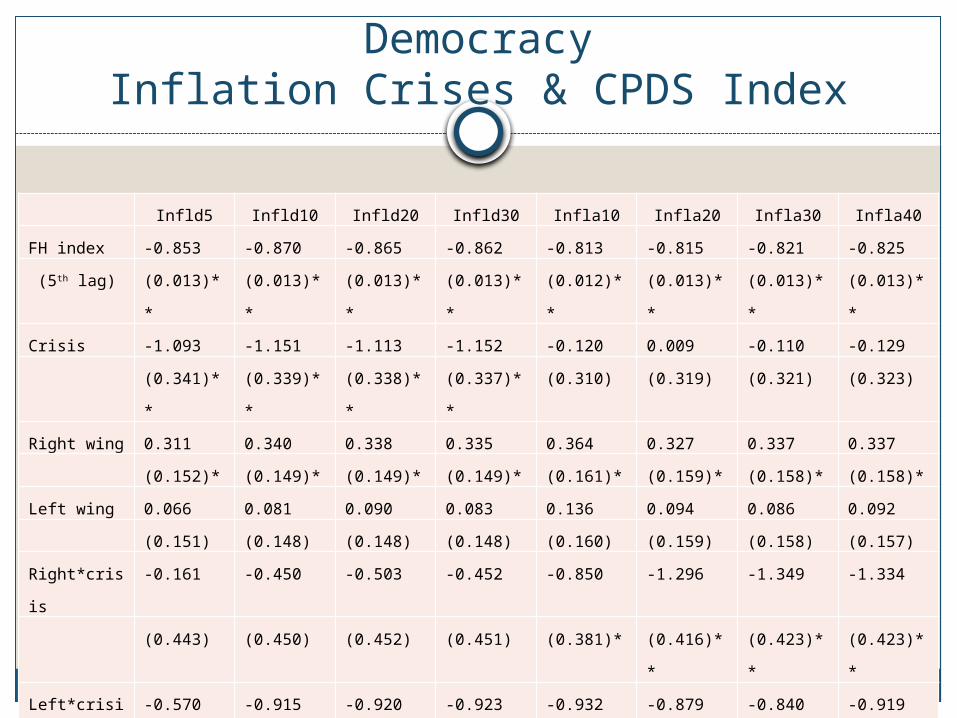
DemocracyInflation Crises & CPDS Index
Infld5 Infld10 Infld20 Infld30 Infla10 Infla20 Infla30 Infla40
FH index -0.853 -0.870 -0.865 -0.862 -0.813 -0.815 -0.821 -0.825
(5th lag) (0.013)** (0.013)** (0.013)** (0.013)** (0.012)** (0.013)** (0.013)** (0.013)**
Crisis -1.093 -1.151 -1.113 -1.152 -0.120 0.009 -0.110 -0.129
(0.341)** (0.339)** (0.338)** (0.337)** (0.310) (0.319) (0.321) (0.323)
Right wing 0.311 0.340 0.338 0.335 0.364 0.327 0.337 0.337
(0.152)* (0.149)* (0.149)* (0.149)* (0.161)* (0.159)* (0.158)* (0.158)*
Left wing 0.066 0.081 0.090 0.083 0.136 0.094 0.086 0.092
(0.151) (0.148) (0.148) (0.148) (0.160) (0.159) (0.158) (0.157)
Right*crisis -0.161 -0.450 -0.503 -0.452 -0.850 -1.296 -1.349 -1.334
(0.443) (0.450) (0.452) (0.451) (0.381)* (0.416)** (0.423)** (0.423)**
Left*crisis -0.570 -0.915 -0.920 -0.923 -0.932 -0.879 -0.840 -0.919
(0.434) (0.439)* (0.440)* (0.438)* (0.375)* (0.410)* (0.417)* (0.419)*
Constant 16.431 16.741 16.628 16.582 15.668 15.702 15.807 15.869
(0.257)** (0.259)** (0.255)** (0.249)** (0.260)** (0.263)** (0.266)** (0.270)**
R2 0.90 0.90 0.90 0.90 0.89 0.89 0.89 0.89
N 682 682 682 682 682 682 682 682
Are Reforms Preceded by Crises?
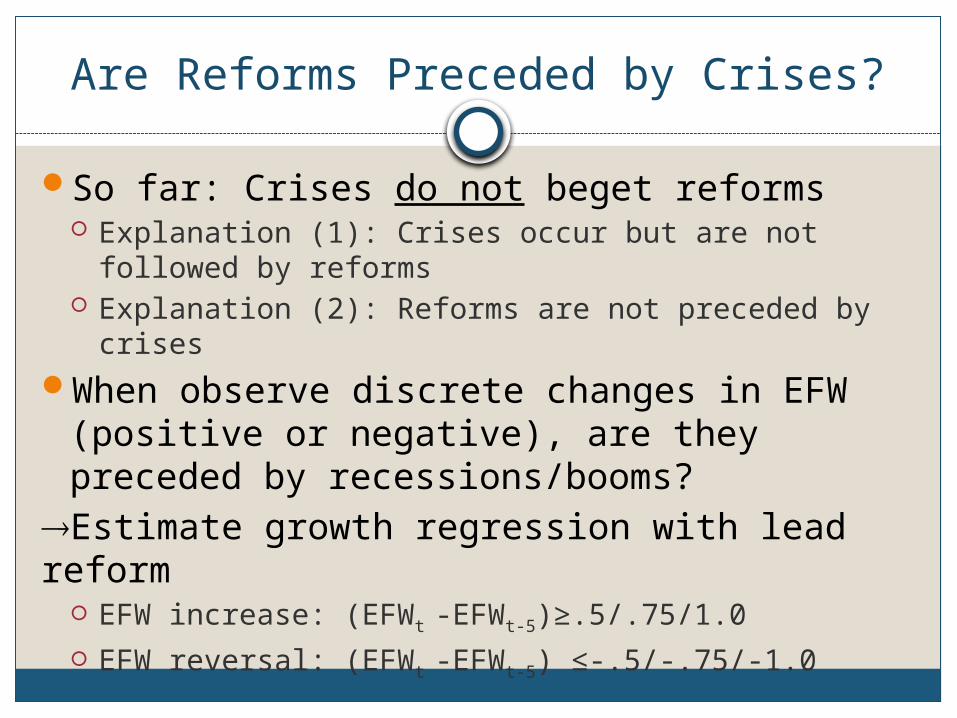
So far: Crises do not beget reforms Explanation (1): Crises occur but are not followed by
reforms Explanation (2): Reforms are not preceded by crises
When observe discrete changes in EFW (positive or negative), are they preceded by recessions/booms?
Estimate growth regression with lead reform EFW increase: (EFWt -EFWt-5)≥.5/.75/1.0 EFW reversal: (EFWt -EFWt-5) ≤-.5/-.75/-1.0
Are Reforms Preceded by Crises? Results
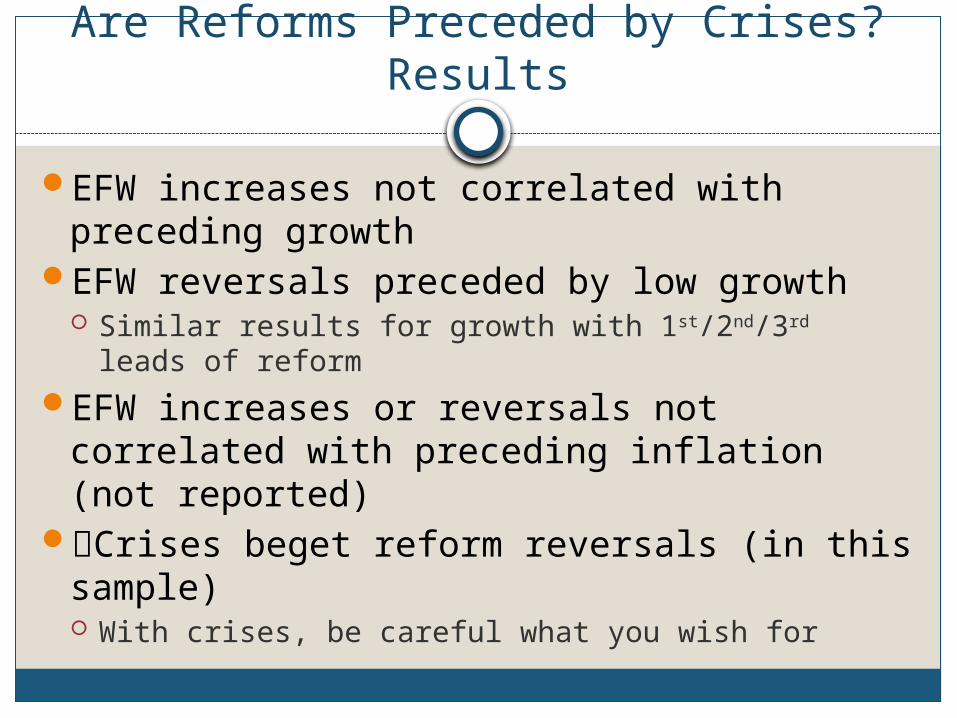
EFW increases not correlated with preceding growth
EFW reversals preceded by low growth Similar results for growth with 1st/2nd/3rd leads of
reform EFW increases or reversals not correlated
with preceding inflation (not reported)Crises beget reform reversals (in this
sample) With crises, be careful what you wish for
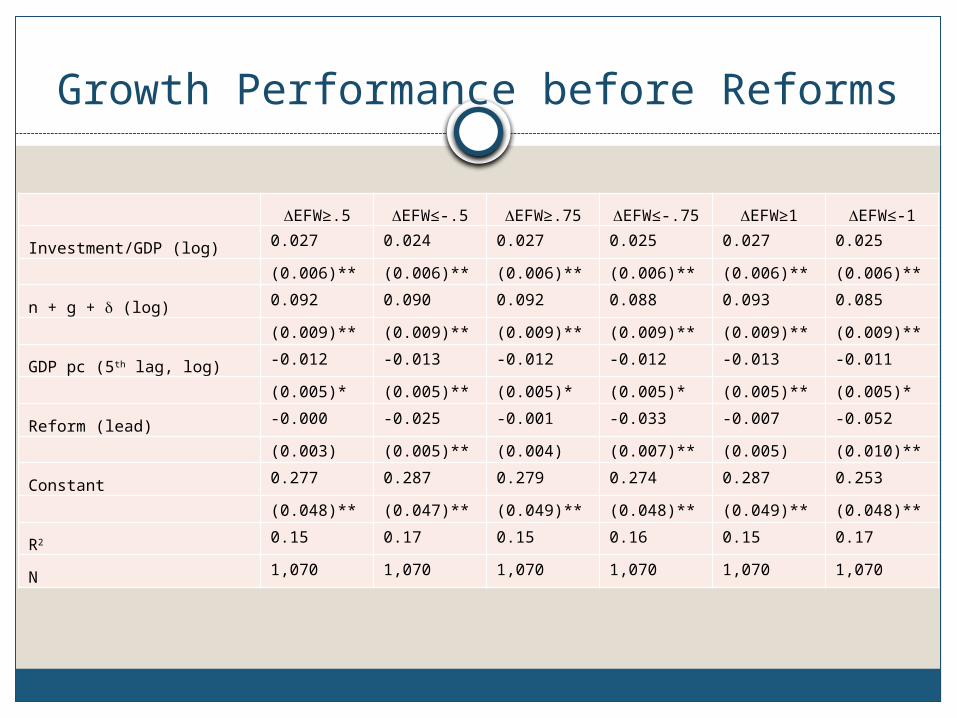
Growth Performance before Reforms
EFW≥.5 EFW≤-.5 EFW≥.75 EFW≤-.75 EFW≥1 EFW≤-1
Investment/GDP (log) 0.027 0.024 0.027 0.025 0.027 0.025
(0.006)** (0.006)** (0.006)** (0.006)** (0.006)** (0.006)**
n + g + (log) 0.092 0.090 0.092 0.088 0.093 0.085
(0.009)** (0.009)** (0.009)** (0.009)** (0.009)** (0.009)**
GDP pc (5th lag, log) -0.012 -0.013 -0.012 -0.012 -0.013 -0.011
(0.005)* (0.005)** (0.005)* (0.005)* (0.005)** (0.005)*
Reform (lead) -0.000 -0.025 -0.001 -0.033 -0.007 -0.052
(0.003) (0.005)** (0.004) (0.007)** (0.005) (0.010)**
Constant 0.277 0.287 0.279 0.274 0.287 0.253
(0.048)** (0.047)** (0.049)** (0.048)** (0.049)** (0.048)**
R2 0.15 0.17 0.15 0.16 0.15 0.17
N 1,070 1,070 1,070 1,070 1,070 1,070
Conclusions
Crises can have important effects on economic policy making and political developments alike
Crises can induce tightly regulated countries to embrace reform and deregulation
Or they can cause backlash against economic freedom and capitalism
Ideology of the incumbent government may play a role
Conclusions
Right-wing parties associated with greater economic freedom in general
RW parties liberalize economy more after crises
Especially if crisis associated with high inflation
Mixed results for crisis effect on democratization
Reforms implemented by unlikely politicians seem exception rather than rule
Political motives important: political clientelism after crises
Conclusions
Little consistent evidence of crises begetting reforms Mainly relatively liberal countries analysed
Crises beget change: reform or reform reversal Latin America and Eastern Europe in 1980s-90s vs
Greece and Occupy Movement today