Embed Size (px)
Citation preview
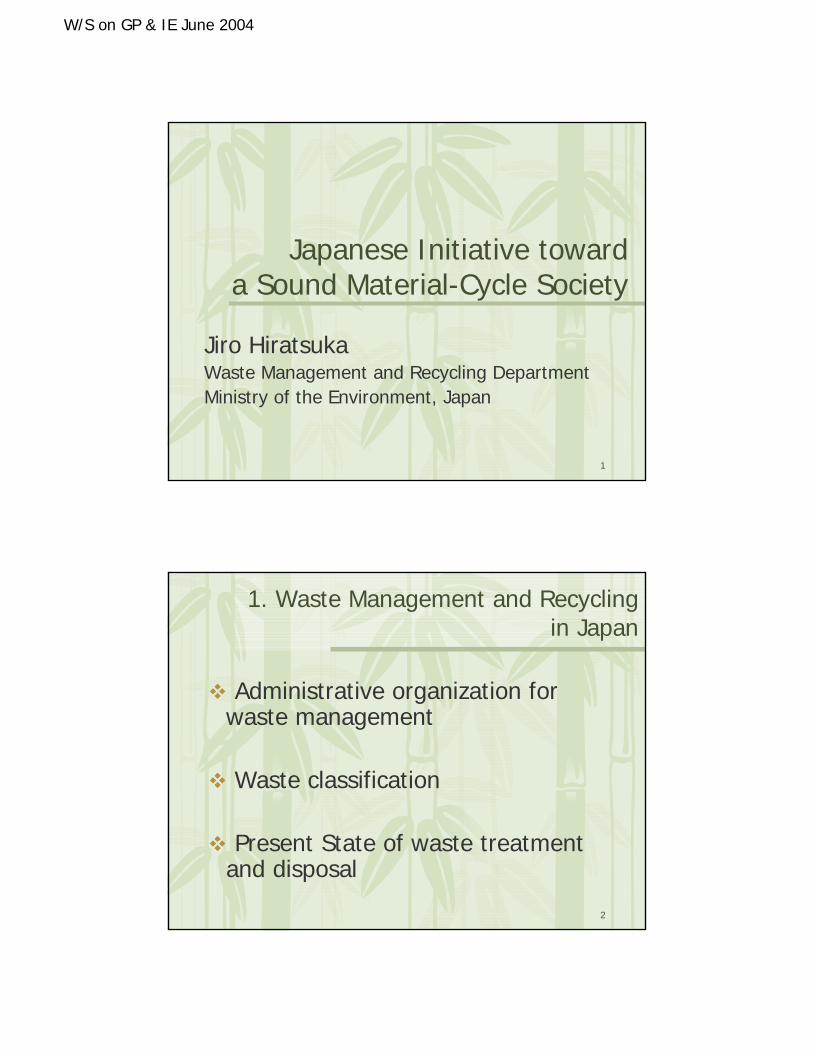
W/S on GP & IE June 2004
1
Japanese Initiative toward a Sound Material-Cycle Society
Jiro HiratsukaWaste Management and Recycling DepartmentMinistry of the Environment, Japan
2
1. Waste Management and Recycling in Japan
Administrative organization for waste management
Waste classification
Present State of waste treatment and disposal
W/S on GP & IE June 2004
3
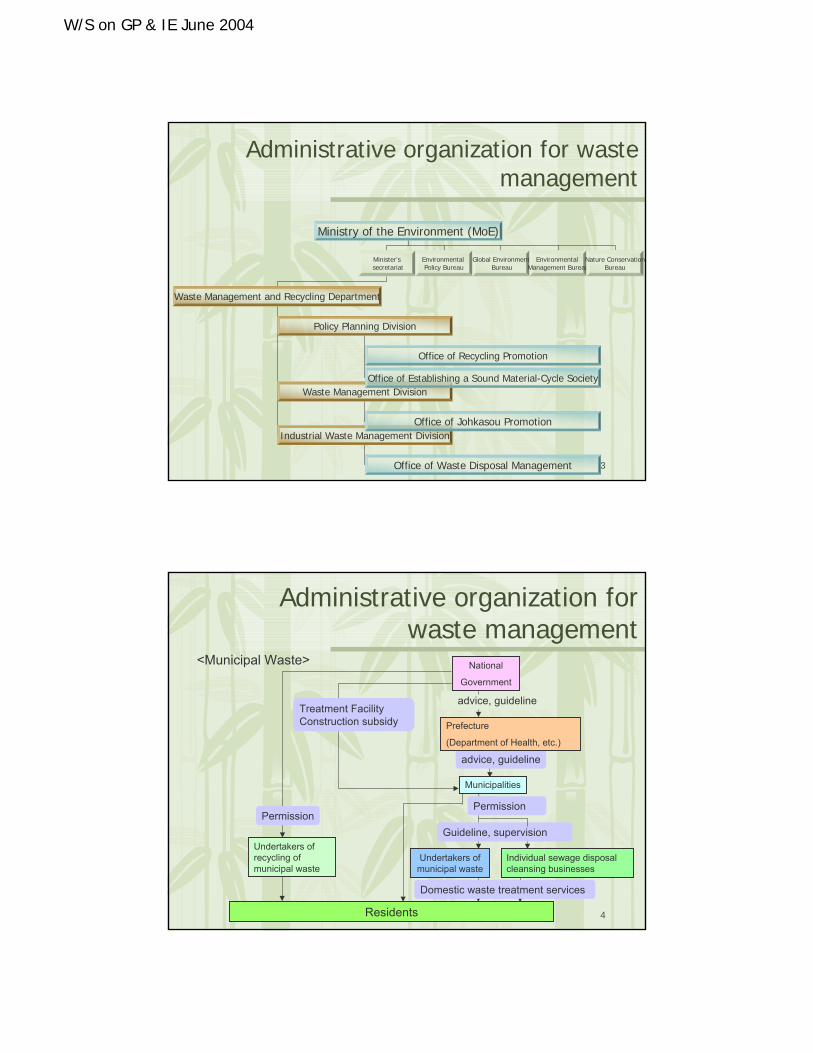
Administrative organization for waste management
Ministry of the Environment (MoE)
Minister’ssecretariat
Waste Management and Recycling Department
Policy Planning Division
Industrial Waste Management Division
Waste Management Division
Office of Recycling Promotion
Office of Johkasou Promotion
Office of Waste Disposal Management
Office of Establishing a Sound Material-Cycle Society
Environmental Policy Bureau
Global EnvironmentBureau
Environmental Management Bureau
Nature ConservationBureau
4
<Municipal Waste>
advice, guideline
Residents
Permission
Treatment FacilityConstruction subsidy
Individual sewage disposalcleansing businesses
Undertakers ofrecycling ofmunicipal waste
Guideline, supervision
Domestic waste treatment services
Undertakers ofmunicipal waste
Administrative organization for waste management
National
Government
Permission
advice, guideline
Prefecture
(Department of Health, etc.)
Municipalities
W/S on GP & IE June 2004
5
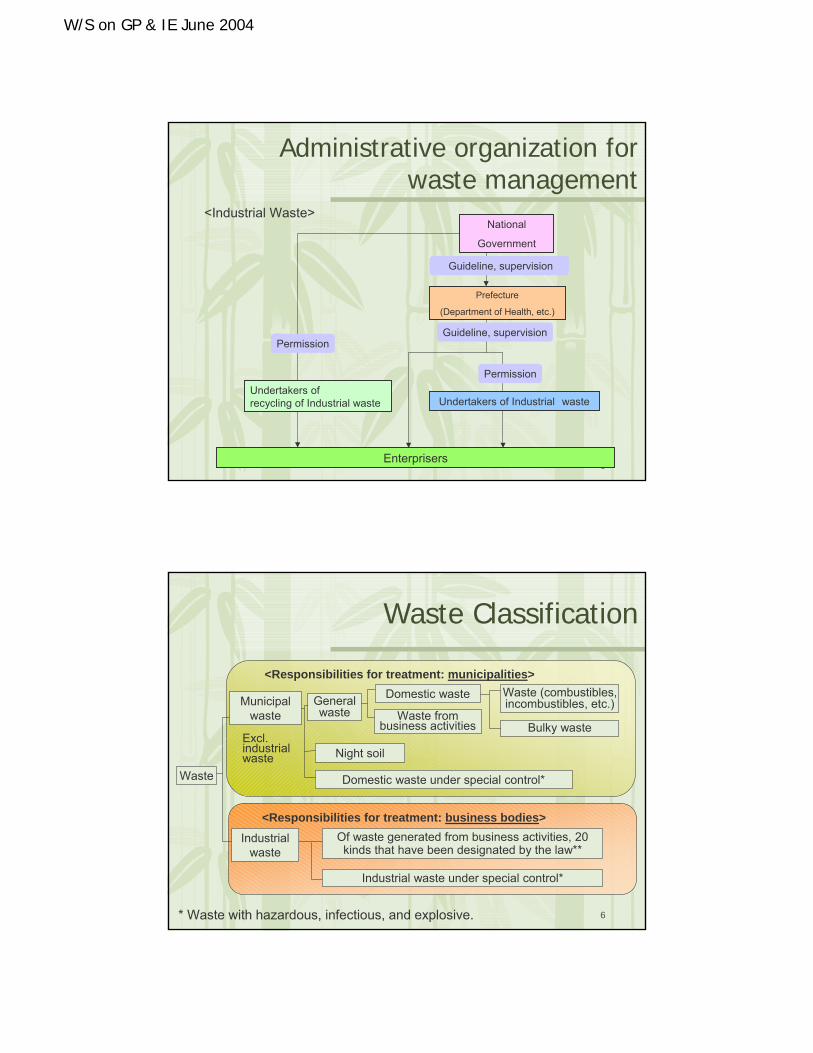
<Industrial Waste>
Guideline, supervision
Enterprisers
Guideline, supervisionPermission
Undertakers ofrecycling of Industrial waste
Prefecture
(Department of Health, etc.)
National
Government
Permission
Undertakers of Industrial waste
Administrative organization for waste management
6
Waste Classification
* Waste with hazardous, infectious, and explosive.
<Responsibilities for treatment: municipalities>Waste (combustibles, incombustibles, etc.)
Waste from business activities
Night soil
Domestic waste under special control*
Excl. industrial waste
<Responsibilities for treatment: business bodies>Of waste generated from business activities, 20 kinds that have been designated by the law**
Industrial waste under special control*
General waste
Waste
Domestic wasteMunicipal waste
Industrial waste
Bulky waste
W/S on GP & IE June 2004
7
Waste Classification
<industrial waste>1. combustion
residue2. sludge3. waste oil4. waste acid5. waste alkali6. waste plastics7. waste papers*8. wood chips*9. waste textiles*10. animal and plant
residues*
11.animal residue from slaughterhouses*
12.waste rubber13.scrap metal14.waste glass and ceramics15.slag16.construction and demolition
waste17.animal excretions*18.animal carcass*19.dust*20.waste generated from
industrial waste treatment
8
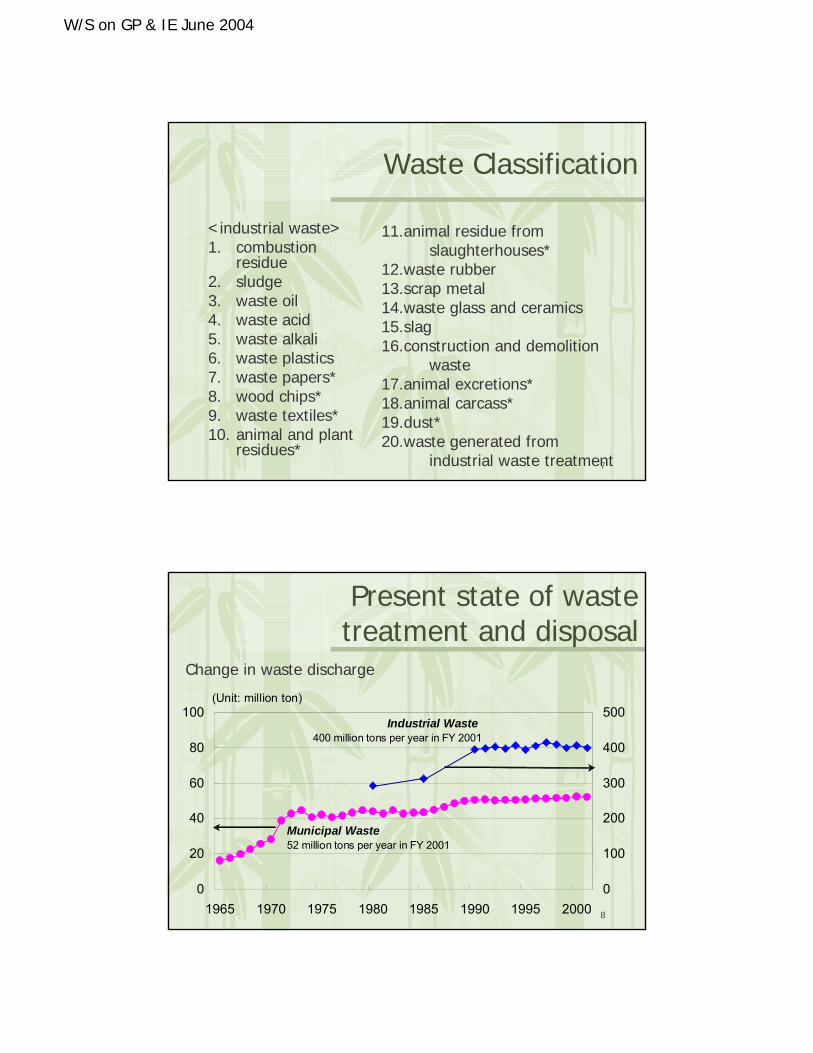
Present state of waste treatment and disposal
0
20
40
60
80
100
1965 1970 1975 1980 1985 1990 1995 20000
100
200
300
400
500(Unit: million ton)
Municipal Waste52 million tons per year in FY 2001
Industrial Waste400 million tons per year in FY 2001
Change in waste discharge
W/S on GP & IE June 2004
9
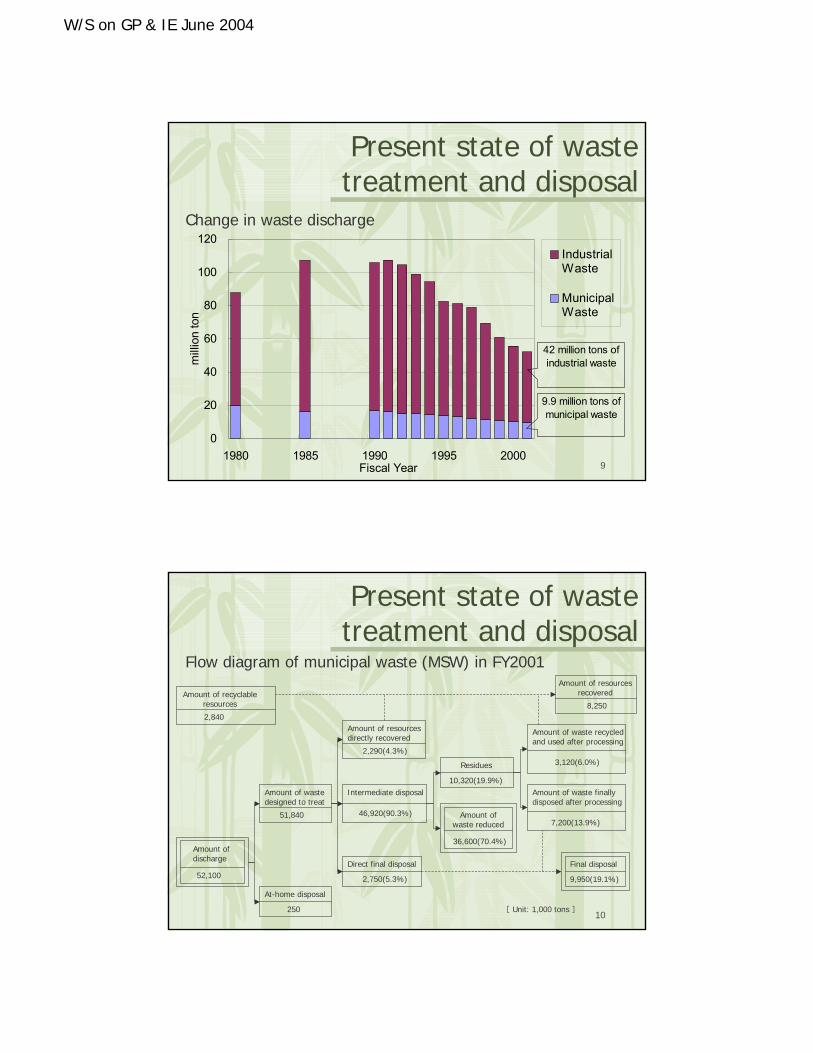
Present state of waste treatment and disposal
Change in waste discharge
0
20
40
60
80
100
120
1980 1985 1990 1995 2000Fiscal Year
mill
ion
ton
IndustrialWaste
MunicipalWaste
9.9 million tons ofmunicipal waste
42 million tons ofindustrial waste
10
Present state of waste treatment and disposal
Flow diagram of municipal waste (MSW) in FY2001
Amount of waste recycled and used after processing
3,120(6.0%)
Amount of recyclable resources
2,840
Amount of waste designed to treat
51,840
At-home disposal
250
Amount of resources directly recovered
2,290(4.3%)
Intermediate disposal
46,920(90.3%)
Direct final disposal
2,750(5.3%)
Residues
10,320(19.9%)
[ Unit: 1,000 tons ]
Amount of resources recovered
8,250
Amount of waste finally disposed after processing
7,200(13.9%)Amount of
waste reduced
36,600(70.4%)Amount of discharge
52,100Final disposal
9,950(19.1%)

W/S on GP & IE June 2004
11
Present state of waste treatment and disposal
Flow diagram of industrial waste (ISW) in FY2001
Amount of waste directly recycled and utilized
82,000(20%)
Amount of waste treated intermediately
297,000(74%)
Amount of direct final disposal
21,000(5%)
Residues
122,000(30%)
Amount of waste reduced
175,000(44%)
Amount of discharge
400,000(100%)
Amount of waste recycled and used after processing
101,000(25%)
Amount of waste finally disposed after processing
21,000(5%)
Final disposal
42,000(10%)
Amount of waste recycled and used
183,000(46%)
[ Unit: 1,000 tons ]
12
0
5
10
15
20
25
1980 1985 1990 1992 1994 1996 1998 20000
5
10
15
20
25Remaining Years (year)Final Disposal Amount (million ton)
Present state of waste treatment and disposal
Remaining years of final disposal sites and final disposal amount (municipal waste)
W/S on GP & IE June 2004
13
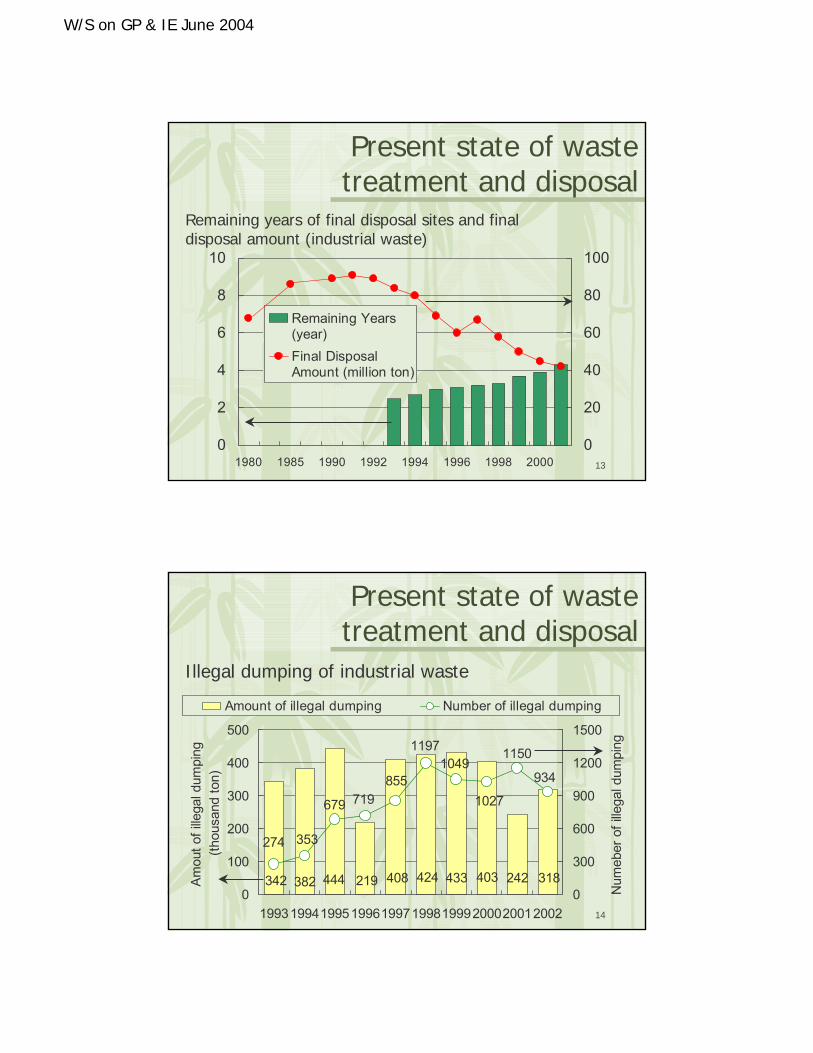
Present state of waste treatment and disposal
0
2
4
6
8
10
1980 1985 1990 1992 1994 1996 1998 20000
20
40
60
80
100
Remaining Years(year)Final DisposalAmount (million ton)
Remaining years of final disposal sites and final disposal amount (industrial waste)
14
318382342 444 219 408 424 433 403 242
934
1027
10491197
855719679
353274
1150
0
100
200
300
400
500
1993199419951996199719981999200020012002
Am
out o
f ille
gal d
umpi
ng(th
ousa
nd to
n)
0
300
600
900
1200
1500
Num
eber
of i
llega
l dum
ping
Amount of illegal dumping Number of illegal dumping
Present state of waste treatment and disposal
Illegal dumping of industrial waste
W/S on GP & IE June 2004
15
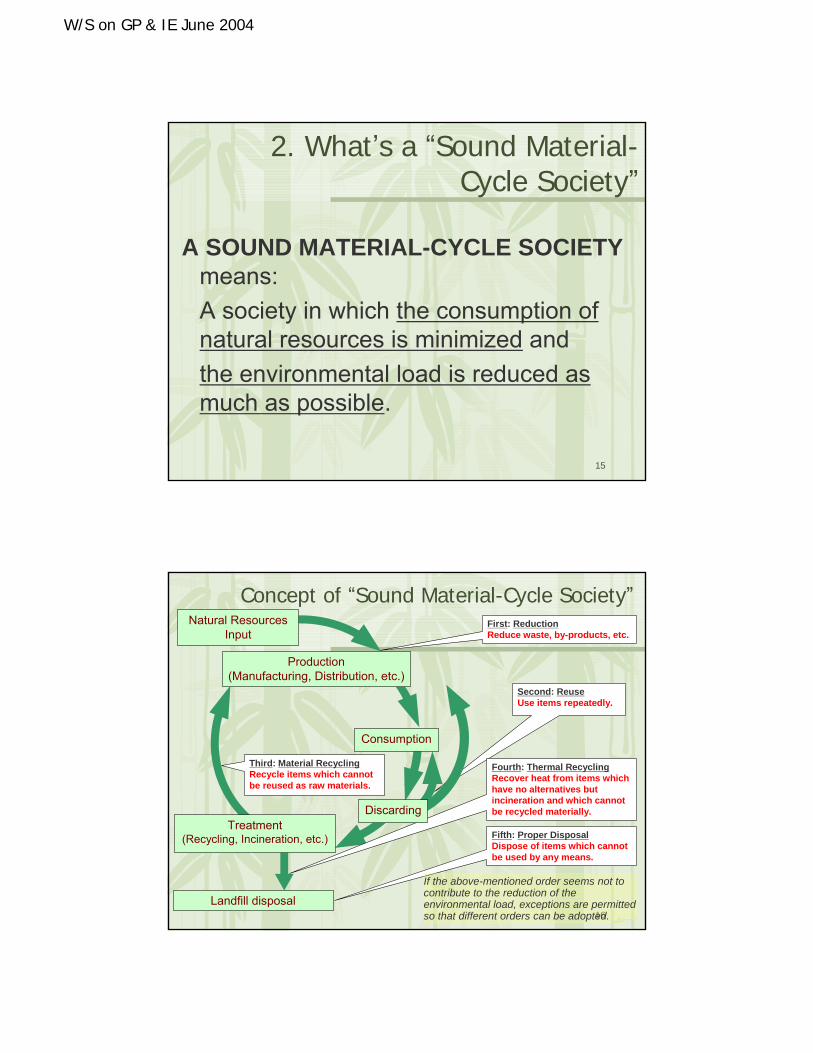
A SOUND MATERIAL-CYCLE SOCIETYmeans:A society in which the consumption of natural resources is minimized and the environmental load is reduced as much as possible.
2. What’s a “Sound Material-Cycle Society”
16
Second: ReuseUse items repeatedly.
Landfill disposal
Third: Material RecyclingRecycle items which cannot be reused as raw materials.
First: ReductionReduce waste, by-products, etc.
Fifth: Proper DisposalDispose of items which cannot be used by any means.
Fourth: Thermal RecyclingRecover heat from items which have no alternatives but incineration and which cannot be recycled materially.
Treatment(Recycling, Incineration, etc.)
Natural Resources Input
If the above-mentioned order seems not to contribute to the reduction of the environmental load, exceptions are permitted so that different orders can be adopted.
Production(Manufacturing, Distribution, etc.)
Consumption
Discarding
Concept of “Sound Material-Cycle Society”
W/S on GP & IE June 2004
17
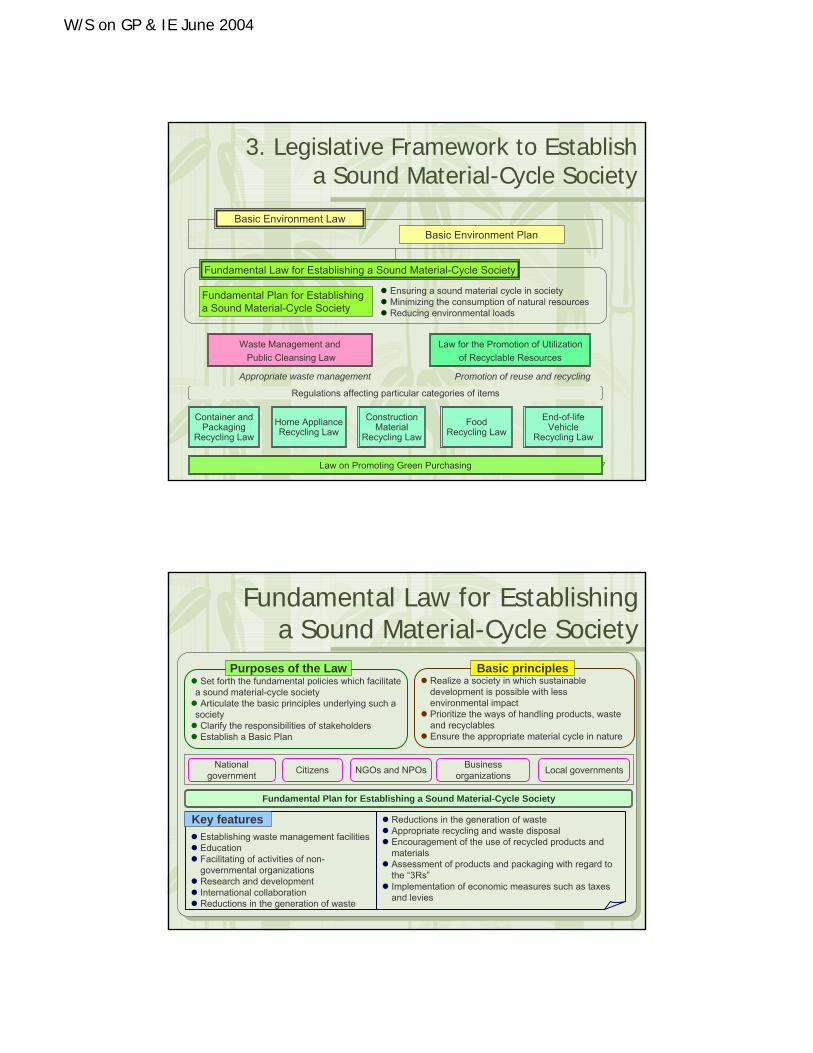
Basic Environment LawBasic Environment Plan
Fundamental Plan for Establishing a Sound Material-Cycle Society
Appropriate waste management Promotion of reuse and recycling
Law for the Promotion of Utilization of Recyclable Resources
Waste Management andPublic Cleansing Law
Fundamental Law for Establishing a Sound Material-Cycle Society
Ensuring a sound material cycle in societyMinimizing the consumption of natural resourcesReducing environmental loads
Law on Promoting Green Purchasing
Container and Packaging
Recycling LawHome Appliance Recycling Law
Construction Material
Recycling Law Food
Recycling Law End-of-life
Vehicle Recycling Law
Regulations affecting particular categories of items
3. Legislative Framework to Establish a Sound Material-Cycle Society
18
Fundamental Law for Establishing a Sound Material-Cycle Society
Set forth the fundamental policies which facilitate a sound material-cycle societyArticulate the basic principles underlying such a
societyClarify the responsibilities of stakeholdersEstablish a Basic Plan
Realize a society in which sustainable development is possible with less environmental impactPrioritize the ways of handling products, waste and recyclablesEnsure the appropriate material cycle in nature
Basic principles
Fundamental Plan for Establishing a Sound Material-Cycle Society
Purposes of the Law
Reductions in the generation of waste Appropriate recycling and waste disposalEncouragement of the use of recycled products and materialsAssessment of products and packaging with regard to the “3Rs”Implementation of economic measures such as taxes and levies
Business organizationsCitizens Local governmentsNational
government NGOs and NPOs
Establishing waste management facilitiesEducationFacilitating of activities of non-governmental organizations Research and developmentInternational collaborationReductions in the generation of waste
Key features

W/S on GP & IE June 2004
19
Follow-up on Johannesburg Plan of Implementation (JPOI)
Paragraph 15. Encourage and promote the development of a 10-year framework of programmes in support of regional and national initiatives to accelerate the shift towards sustainableconsumption and production… delinking economic growth and environmental degradation….
All countries should take action, with developed countries taking the lead….
In line with the JPOI, the Government of Japan established “The Basic Plan for Establishing a Sound Material-Cycle Society”
as a 10-year framework of programmes.
In March 2003
20
Outline of the Fundamental PlanPresent Situation and ProblemPresent Situation and Problem
Image of Sound-Material Cycle SocietyImage of Sound-Material Cycle Society
1. Targets for Indicators Based on Material Flow Accounts a) Input: Resource Productivityb) Cycle: Cyclical Use Ratec) Output: Final Disposal Amount
2. Targets for Indices related to EffortsReducing the quantity of municipal solid wasteExpanding the market size and the extent of employment generated
Quantitative Targets: FY2000-2010Quantitative Targets: FY2000-2010
National Government, Citizens, Business Organizations, NPOs/NGOs, Local GovernmentsNational Government, Citizens, Business Organizations, NPOs/NGOs, Local GovernmentsEfforts of StakeholdersEfforts of Stakeholders
Lifestyle: Use of high-quality goods with care; adoption of “slow-paced” lifestyleManufacturing: DfE (Design for Environment), long-life products, lease & rental
Present Situation: Unsustainable behavior patterns of the 20th centuryTasks: Realization of Socio-Economic Systems Based on 3R
Resolution of Waste-related Problems

W/S on GP & IE June 2004
21
Waste management and public Cleansing Law
Municipal solid waste Industrial waste
BCD
Governors of
Prefectures
MSW Treatment Bodies• shall receive permission each district• shall observe treatment standard• be banned to re-commission• be banned to name-lending
Governor of M
unicipalities
Governor of
Prefectures
MunicipalitiesResponsibility for Treatment• shall specified a “municipal solid waste management plan” in their respective administrative areas• shall collect, transport and dispose municipal solid waste according to the plan before they interfere with the conservation of the living environment
ABCD
ABCD
ABC
ABC
ISW Treatment Bodies• shall receive permission each district• shall observe treatment standard• be banned to re-commission in principle• be banned to name-lending
MSW Facility-Setting Bodies• shall receive permission for •establishment and handover
ISW Facility-Setting Bodies• shall receive permission for •establishment and handover
A: permission, B: collection of reports, C: commission for improvement, D: commission for measure
Discharging AgenciesResponsibility for Treatment• shall treat ISW themselves• shall observe storage standard until carriage• shall observe treatment standard• be responsible concerning commission• shall observe commission standard
Governors of P
refectures
22
Container and Packaging Recycling Law
Trans-parency
ConsumerCooperate separate discharge
Municipalities (Become valuable byseparate collection)
Ex) Glass bottle Ex) Steel can
Separate Collection
Businesses [recycling]
Designated Organization
(Consign) Cullet(Become valuable)
RecyclingRecyclingSold
Sold
‘Separated Glass Bottle’
(Separated according to its color and removed stains)
PET bottle, other containers and packaging of plastic and paper
aluminum canpaper packaging corrugated carton
Separate collection
Wash and Crush into pieces
BrownOthers
Area covered by the Law

W/S on GP & IE June 2004
23
plastic materials/ blast furnace materials/chemicalmaterials/fuel
Containers and packaging wastes collected separately are recycled as raw materials in the following way.
Metalaluminum materials
steel materials
Glass☺glass bottlematerials☺constructionmaterials
Plastics
raw materials
Paper
paper materials
☺materials for paper and construction☺solid fuel
shredded flakes/pellets/monomers
pellets/blast furnace materials/oil/gas
Aluminum
Steel
Non-colored
Brown
PET bottles
Other forms
Other colors
Other materials
Cardboard
Paper cartons
cleaning/cullet
no obligation to recycle since these are considered to be valuable materials when collected by municipalities.
valuable when collected
Con
tain
ers
and
pack
agin
g w
aste
s
sorting/compaction
24
Home Appliance Recycling Law
Discharged person☺payment of fees for collection and recycling (recycling fee: Air-conditioner \3,500, Television \2,700, Refrigerator \4,600, Washing machine \2,400)
Discharged person☺payment of fees for collection and recycling (recycling fee: Air-conditioner \3,500, Television \2,700, Refrigerator \4,600, Washing machine \2,400)
Discharge
RetailerRetailer MunicipalityMunicipalityCollection and Transportation
Manufacturer / ImporterManufacturer / ImporterDesignated corporation
Designated corporation MunicipalityMunicipality
Recycling
Obligation to collect
Standard: Air-conditioner 60%, Television 55%, Refrigerator 50%, Washing machine 50%
Designated collecting siteDesignated collecting site
380 Designated collecting sites39 Recycling Plants
Bankruptcy / SMEs formerly manufactured or imported
Obligation of recycling
Obligation to collect
Obligation to transfer
Securing R
eliable Transportation
formerly sold / part-exchange
Manifest system

W/S on GP & IE June 2004
25
Construction Material Recycling Law
a contract agreement must specify work costs etc
Governor of the prefectures
b) Sorting C&D material generated from demolition workDemolition waste must be sorted based on the standards
c) Recycling C&D materialsPossible to consign
Registration of demolition work companies Treatment (recycling,
incineration, landfill, etc.)
Wood chips Timber boards, etc.(incineration if recycling is difficult)Concrete Roadbed materials,
aggregate, etc.Asphalt Recovered asphalt,
roadbed materials, etc.
wood chips concreteasphalt
Other wastes
Advice, recomm., order .
Guidelines of prefectural
governments
Basic policy of the Government
Order to change for inappropriate plan
Advice, recomm., order .
d) A completion report from prime contractor to orderer
a) An orderer of construction work
Large C&D work submits the notification to the prefectural government
26
Food-related businesses (manufacturers, distributors, restaurants, etc) one million firms
Food Recycling LawBasic Policy by the Agriculture Minister, the Environment Minister, etc.
target of the amount of recycling (20% of recycling rate in 2006)Measure to recyclingStandard for waste prevention, reduction and recycling
☺Prevention Recycling of food waste
Guidance and suggestion to Food relating businesses
Measurer to Facilitate Recycling
Recommendation and order(if remarkable inappropriate)
1) Registration system for recycling businesses(promotion recycling by consignment)
2) Authorization system of the recycling businesses plan by food-related firms (intentional recycling including utilization of generated fertilizers)
Consumer
☺Waste Prevention☺Using recycled product
Businesses who generate more than one million tons (16 thousand firms and 60% of total waste generation)
W/S on GP & IE June 2004
27
End-of-life Vehicle Recycling Law
ELVs (5 million cars)
Car manufacturers / Importer
Car owners
Car dealers (18,000) Used car stores (50,000) Auto repair shops (80,000)
Reuse parts 20-30%(engine,body parts,
electric parts)
Recycle parts 15%(engine,catalyst,
nonferrous metal, tire)
Body shells 55-65%(the state of only the outer frame which removed engine, tire, etc.)
Dismantling companies (5,000)
Shredding companies (140)
Recycle (as parts)20~30%
Recycle (as materials)50~55%
ASR20~25%
Recycle 75~80%
Landfill or Incineration
25% 70%
Car dealers etc.
Export(1 million cars)
5%
The flow of a manifest
New/imported cars (5,610/270 thousand cars)
28
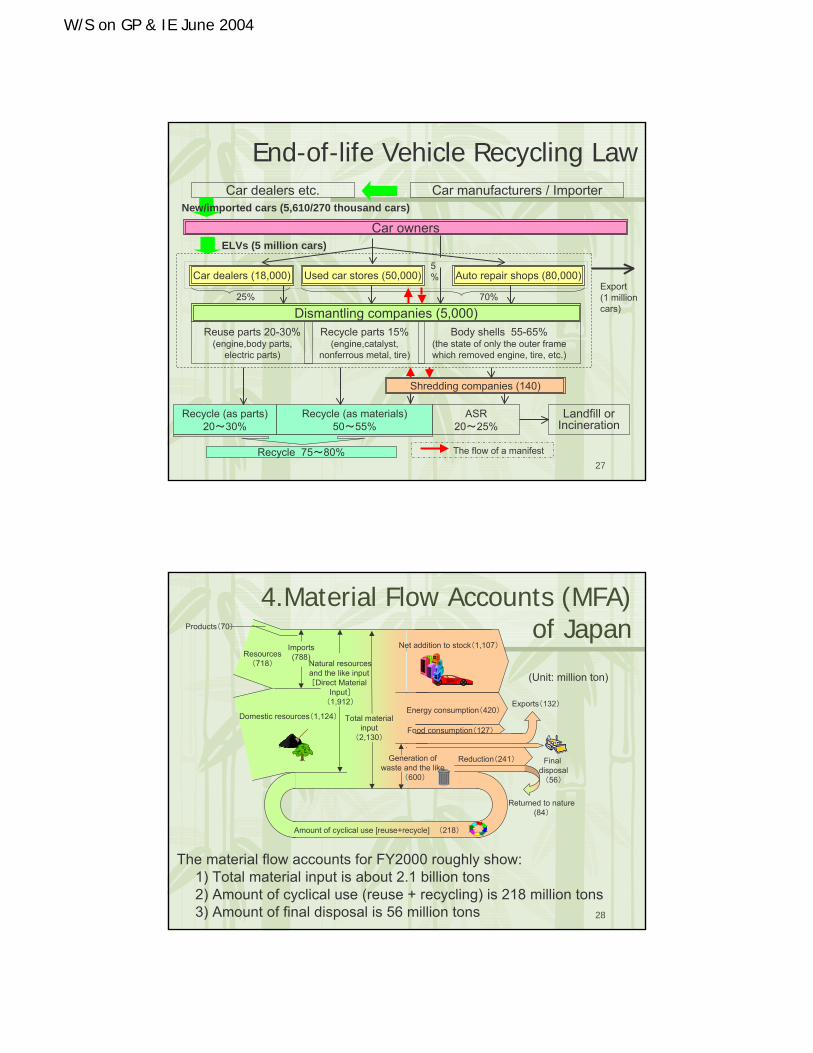
4.Material Flow Accounts (MFA) of Japan
The material flow accounts for FY2000 roughly show:1) Total material input is about 2.1 billion tons2) Amount of cyclical use (reuse + recycling) is 218 million tons3) Amount of final disposal is 56 million tons
(Unit: million ton)
Domestic resources(1,124)
Exports(132)
Returned to nature(84)
Final disposal
(56)
Reduction(241)
Amount of cyclical use [reuse+recycle] (218)
Net addition to stock(1,107)Resources
(718)
Products(70)
Natural resourcesand the like input [Direct Material
Input](1,912)
Energy consumption(420)
Imports(788)
Total material input
(2,130)
Generation of waste and the like
(600)
Food consumption(127)
W/S on GP & IE June 2004
29
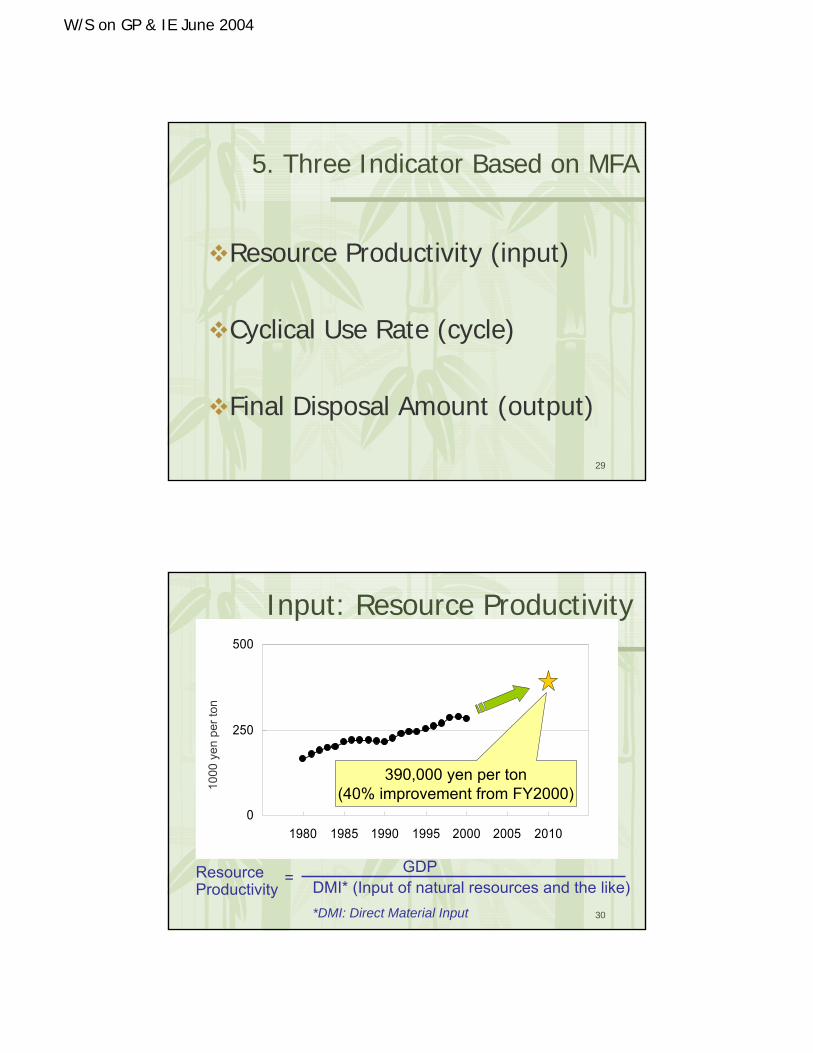
5. Three Indicator Based on MFA
Resource Productivity (input)
Cyclical Use Rate (cycle)
Final Disposal Amount (output)
30
0
250
500
1975 1980 1985 1990 1995 2000 2005 2010 2015
1000
yen
per
ton
GDPDMI* (Input of natural resources and the like)*DMI: Direct Material Input
390,000 yen per ton(40% improvement from FY2000)
ResourceProductivity
=
Input: Resource Productivity
W/S on GP & IE June 2004
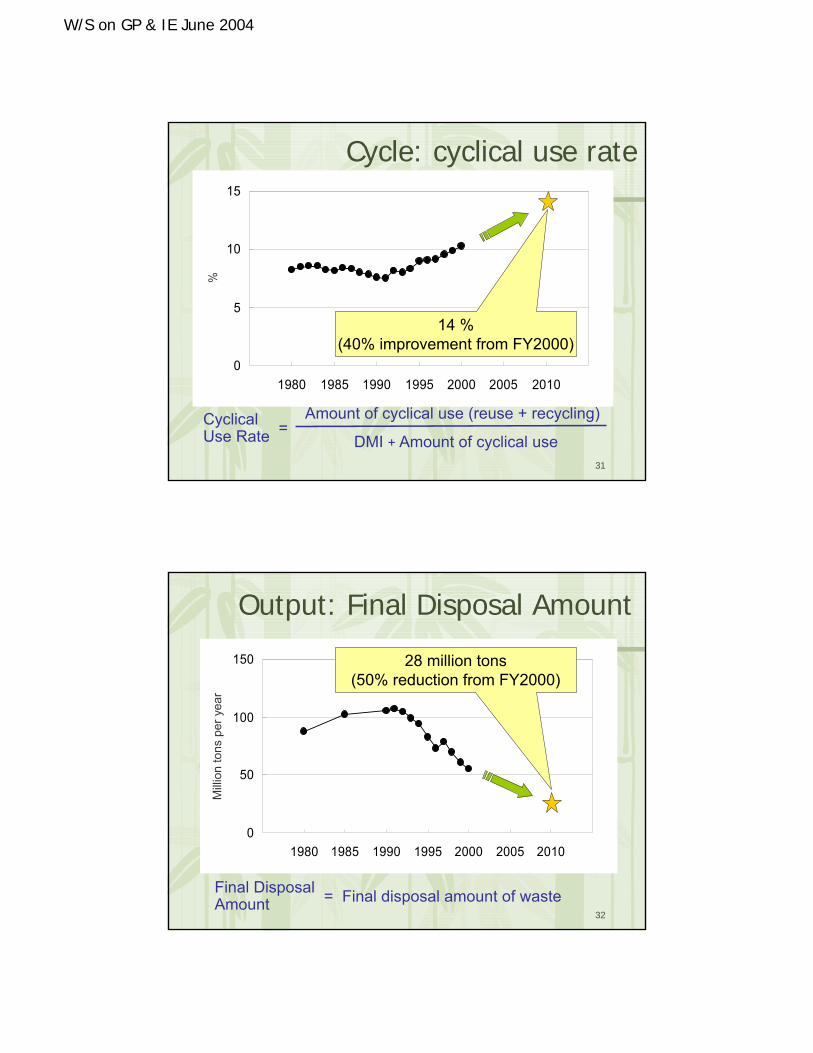
31
0
5
10
15
1975 1980 1985 1990 1995 2000 2005 2010 2015
%
Amount of cyclical use (reuse + recycling)
DMI + Amount of cyclical useCyclical Use Rate =
14 %(40% improvement from FY2000)
Cycle: cyclical use rate
32
0
50
100
150
1975 1980 1985 1990 1995 2000 2005 2010 2015
Milli
on to
ns p
er y
ear
Output: Final Disposal Amount
= Final disposal amount of wasteFinal DisposalAmount
28 million tons(50% reduction from FY2000)
W/S on GP & IE June 2004
33
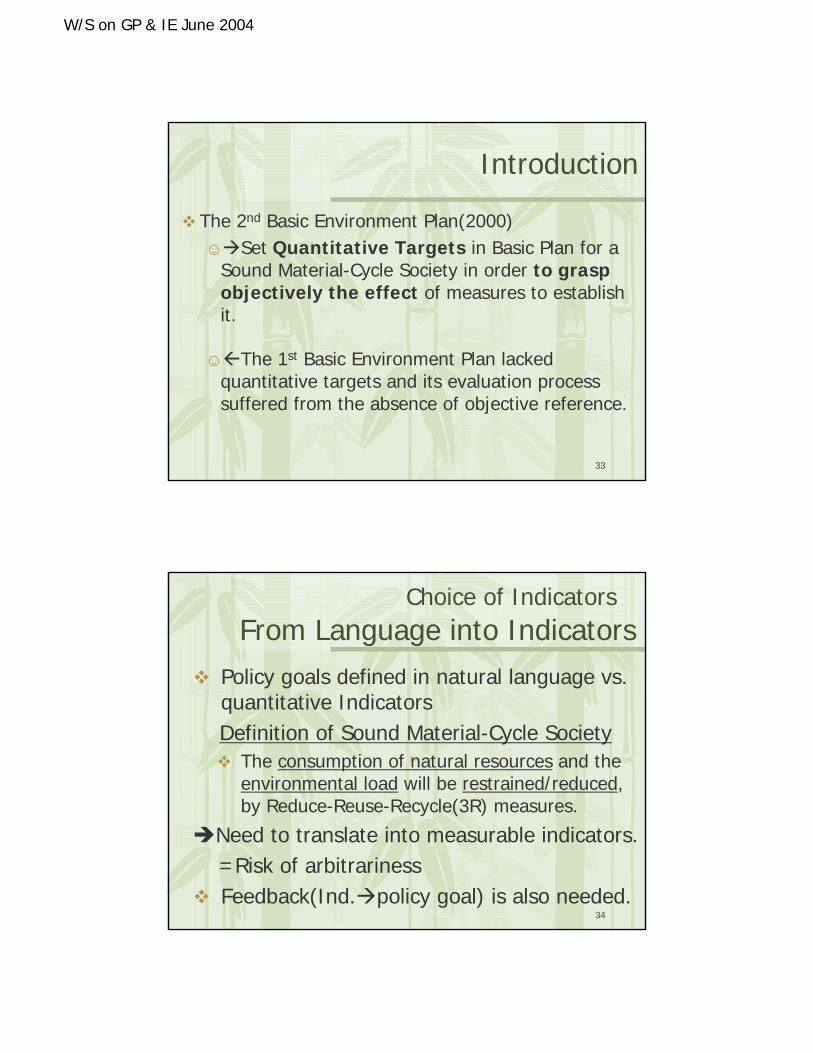
Introduction
The 2nd Basic Environment Plan(2000)☺ Set Quantitative Targets in Basic Plan for a
Sound Material-Cycle Society in order to grasp objectively the effect of measures to establish it.
☺ The 1st Basic Environment Plan lacked quantitative targets and its evaluation process suffered from the absence of objective reference.
34
Choice of Indicators From Language into Indicators
Policy goals defined in natural language vs. quantitative IndicatorsDefinition of Sound Material-Cycle Society
The consumption of natural resources and the environmental load will be restrained/reduced, by Reduce-Reuse-Recycle(3R) measures.
Need to translate into measurable indicators. =Risk of arbitrarinessFeedback(Ind. policy goal) is also needed.
W/S on GP & IE June 2004
35
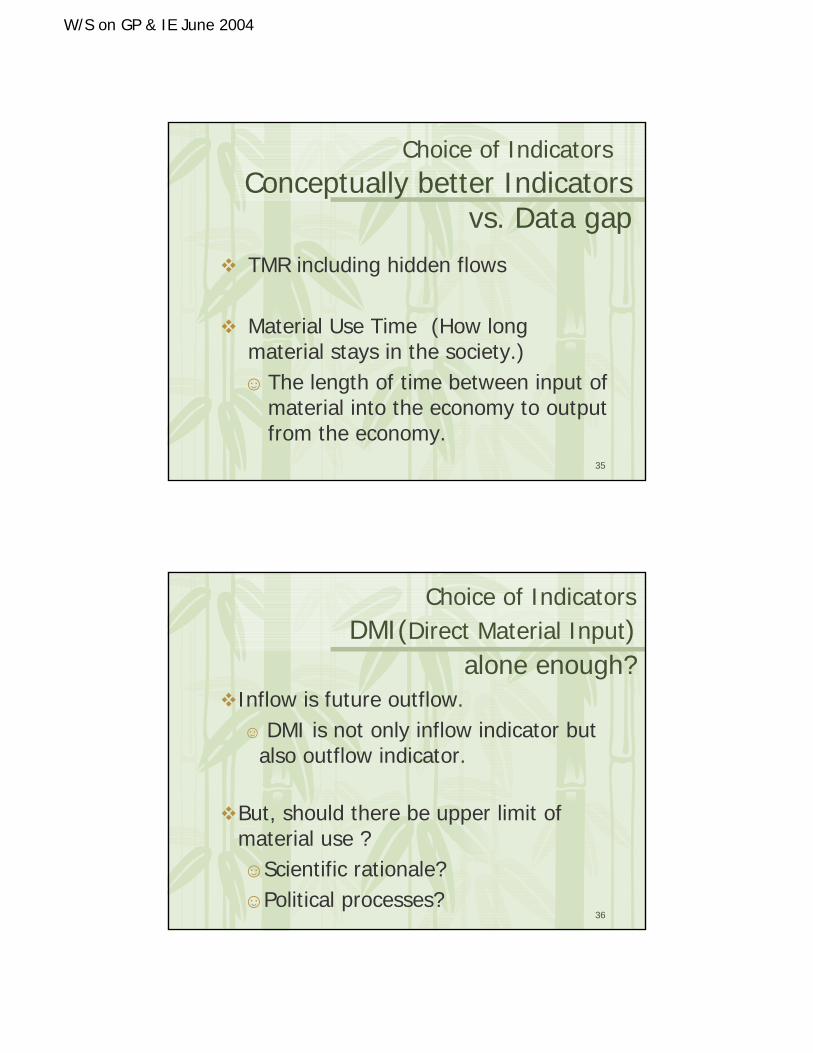
Choice of Indicators Conceptually better Indicators
vs. Data gapTMR including hidden flows
Material Use Time (How long material stays in the society.)☺ The length of time between input of
material into the economy to output from the economy.
36
Choice of IndicatorsDMI(Direct Material Input)
alone enough?Inflow is future outflow. ☺ DMI is not only inflow indicator but
also outflow indicator.
But, should there be upper limit of material use ?☺Scientific rationale?☺Political processes?
W/S on GP & IE June 2004
37
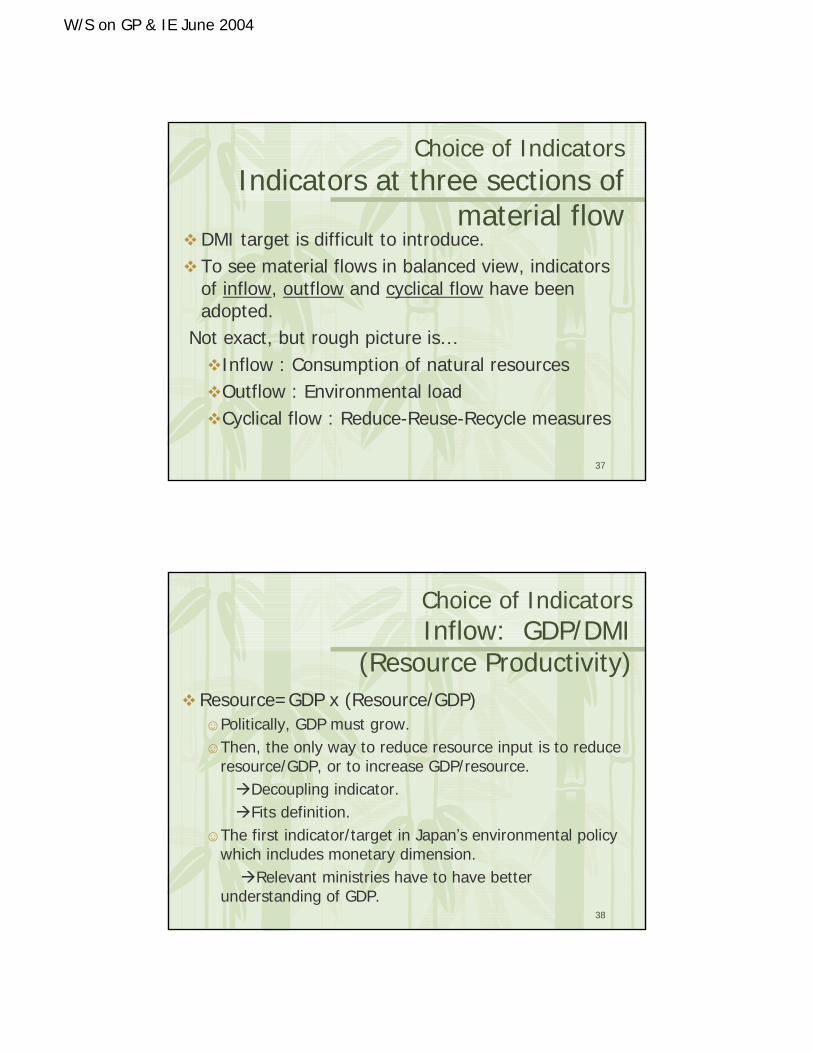
Choice of IndicatorsIndicators at three sections of
material flowDMI target is difficult to introduce.To see material flows in balanced view, indicators of inflow, outflow and cyclical flow have been adopted.
Not exact, but rough picture is…Inflow : Consumption of natural resourcesOutflow : Environmental loadCyclical flow : Reduce-Reuse-Recycle measures
38
Choice of IndicatorsInflow: GDP/DMI
(Resource Productivity)Resource=GDP x (Resource/GDP)☺Politically, GDP must grow.☺Then, the only way to reduce resource input is to reduce
resource/GDP, or to increase GDP/resource.Decoupling indicator.Fits definition.
☺The first indicator/target in Japan’s environmental policy which includes monetary dimension.
Relevant ministries have to have better understanding of GDP.
W/S on GP & IE June 2004
39
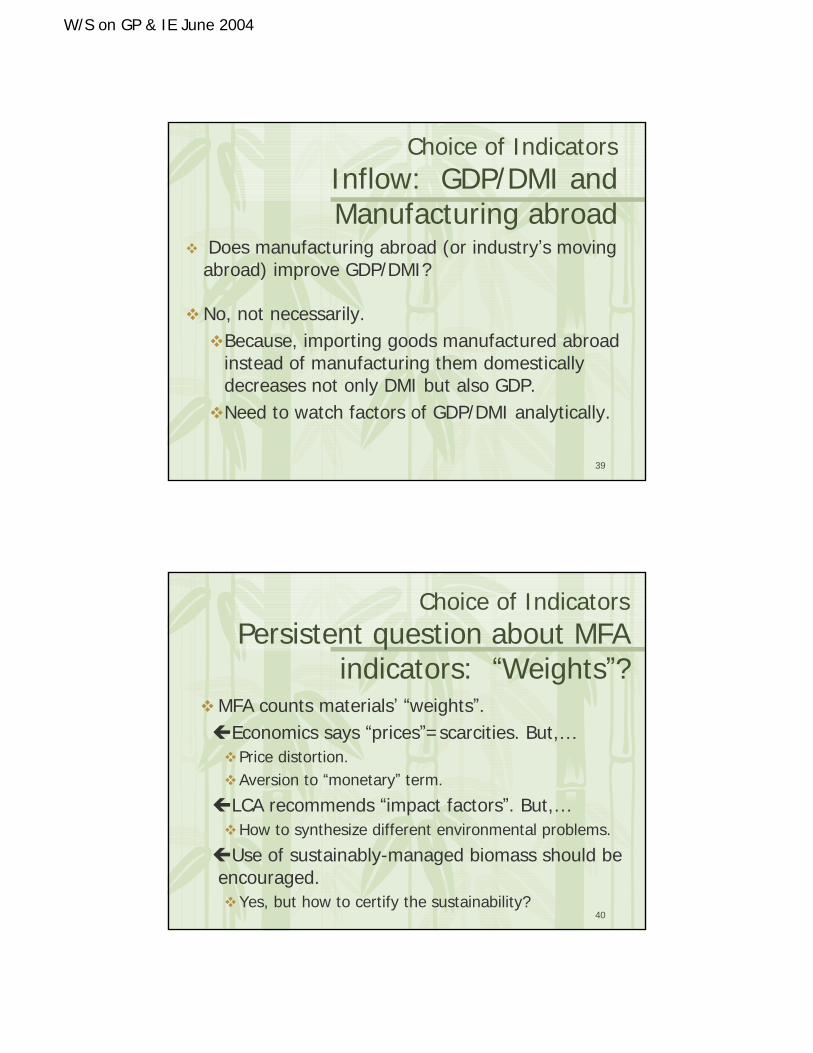
Choice of IndicatorsInflow: GDP/DMI and Manufacturing abroad
Does manufacturing abroad (or industry’s moving abroad) improve GDP/DMI?
No, not necessarily.Because, importing goods manufactured abroad instead of manufacturing them domestically decreases not only DMI but also GDP.Need to watch factors of GDP/DMI analytically.
40
Choice of IndicatorsPersistent question about MFA
indicators: “Weights”?MFA counts materials’ “weights”.
Economics says “prices”=scarcities. But,…Price distortion.Aversion to “monetary” term.
LCA recommends “impact factors”. But,…How to synthesize different environmental problems.
Use of sustainably-managed biomass should be encouraged.
Yes, but how to certify the sustainability?
W/S on GP & IE June 2004
41
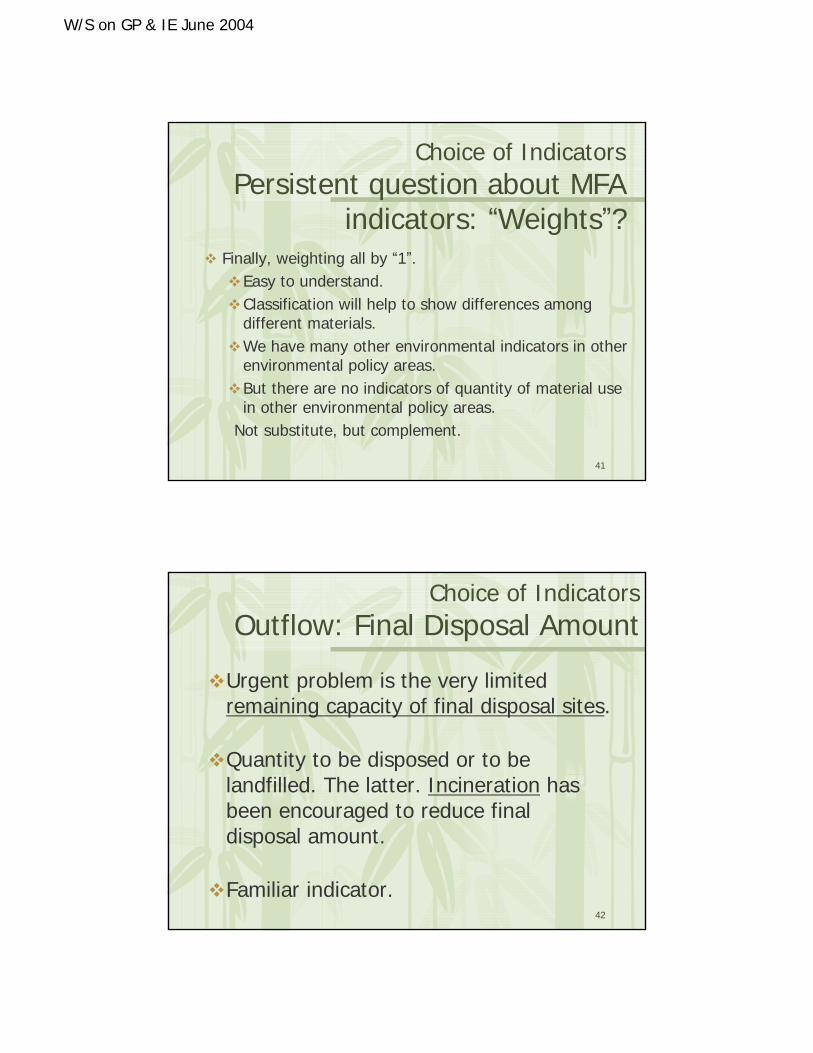
Choice of IndicatorsPersistent question about MFA
indicators: “Weights”?Finally, weighting all by “1”.
Easy to understand.Classification will help to show differences among different materials.We have many other environmental indicators in other environmental policy areas.But there are no indicators of quantity of material use in other environmental policy areas.
Not substitute, but complement.
42
Choice of IndicatorsOutflow: Final Disposal Amount
Urgent problem is the very limited remaining capacity of final disposal sites.
Quantity to be disposed or to be landfilled. The latter. Incineration has been encouraged to reduce final disposal amount.
Familiar indicator.
W/S on GP & IE June 2004
43
Choice of IndicatorsCyclical flow: Cyclical Use Rate
Theoretical measurement problem of the amount of cyclical use, similar to “length-of-coastline problem”.
Need to define rule of measurement, including trade of used goods/materials.Differentiate between inside production recycling and consumption-production recycling? No, according to tradition.
Practical data gaps of the amount of cyclical use.e.g. Heat recovery. ……Costs?
Again, need of measurement rule
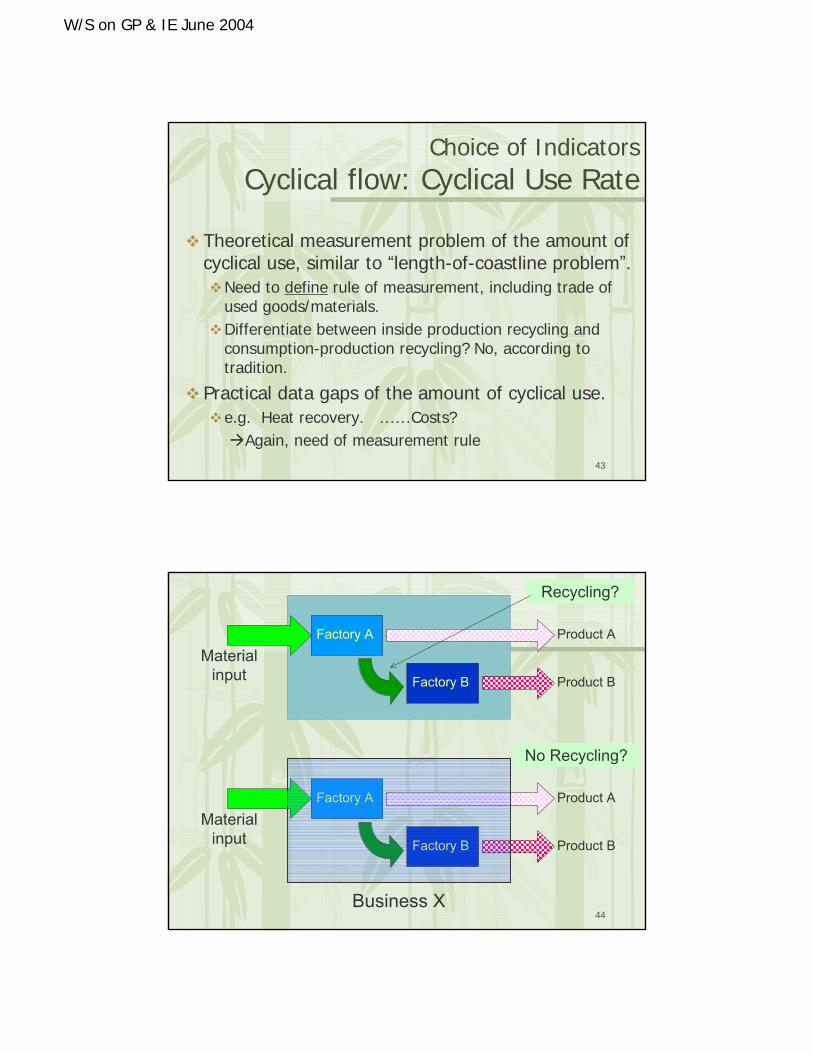
44
Factory A
Factory B
Material input
Product A
Product B
Factory A
Factory B
Material input
Product A
Product B
Business X
Recycling?
No Recycling?

W/S on GP & IE June 2004
45
Choice of IndicatorsCyclical flow: Cyclical Use Rate:
Against What?Which rate? Cyclical use amount …
over outflow amount (waste generated) ?over inflow amount (DMI + cyclical use) ?The latter. As the former might send message
“it is OK to generate any large amount of waste, as long as you use them cyclically”, which is against hierarchy of waste managementadopted in the Basic law for SMCS.
Reduce > Reuse > Recycle
46
6. Indices Related to Efforts
Changing in thoughts and actions to establishing a Sound Material-Cycle SocietyReducing the quantity of waste and the likesPromoting businesses relating a Sound Material-Cycle Society
W/S on GP & IE June 2004
47
Changing in thoughts and actions
about 90 percent of respondents should have an intention of reducing the quantity of waste, cyclical use, and green purchasing,
and 50 percent should take concrete actions as to these matters.
In the year 2010 …
48
Reducing the quantity of waste and the likes
1) Reducing the quantity of municipal solid waste
20% reduction of the amount of garbage discharged from households per person per dayand from offices per day (compare to 2000)
2) Reducing the quantity of industrial waste75% reduction of the final disposal amount of industrial waste (compare to 1990)
In the year 2010 …
W/S on GP & IE June 2004
49
Promoting businesses relating a Sound Material-Cycle Society
1) Promoting green purchasing50 percent of all the local governments and companies listed in Stock Exchanges, and about 30 percent of the unlisted companies (with 500 employees or more) surveyed, will implement organization-wide green purchasing.
2) Promoting environmental business management50 percent of the listed companies and about 30 percent of the unlisted companies surveyed will publish an environmental report and conduct environmental accounting
In the year 2010 …
50
7. Activities by governments, citizens, NGOs/NPOs, and private firms
Measures to Be Taken
Green Procurement
Environmental Report
Material flows and target setting

W/S on GP & IE June 2004
51
Measures by national government
Secure material cycle in natureChange lifestyle [Re-style]Promoting businesses relating a Sound Material-Cycle SocietyRealize Safe and secure treatment and disposal of wasteEstablish the basis for supporting a Sound Material-Cycle Society
52
Measures by citizens
refraining from using disposable products
refusing excessive packaging and promoting simple packaging, using “eco-bags”
selecting green products and services that impose smaller environmental loads (recycled products and refillable products, and rental and leasing services)
cooperate in sorting collected waste to reduce its quantity and recycling
participate or cooperate in environmental education, environmental learning, and activities for environmental preservation
W/S on GP & IE June 2004
53
Measures by NGOs/NPOs
activities for preserving the environment of local areas, such as the promotion of the 3Rs, and assistance for local residents to change their lifestylesenvironmental education, environmental learning and enlightenment activities to promote actions by citizens and businesses for establishing a sound material-cycle societysustainable and expandable activities as community businesses
54
Measures by private firmsrestrict the production and distribution of disposable products and packagingextend the life of products, use materials, products and services with environmental loadstake back products no longer usedas for products, reduce environmental loads at various stages, including resource extraction, production, distribution, consumption and disposal, through life cycle assessment (LCA) diffuse green products and servicesprovide consumers with information through environmental labeling disclose and provide information through the publication of environmental reports
W/S on GP & IE June 2004
55
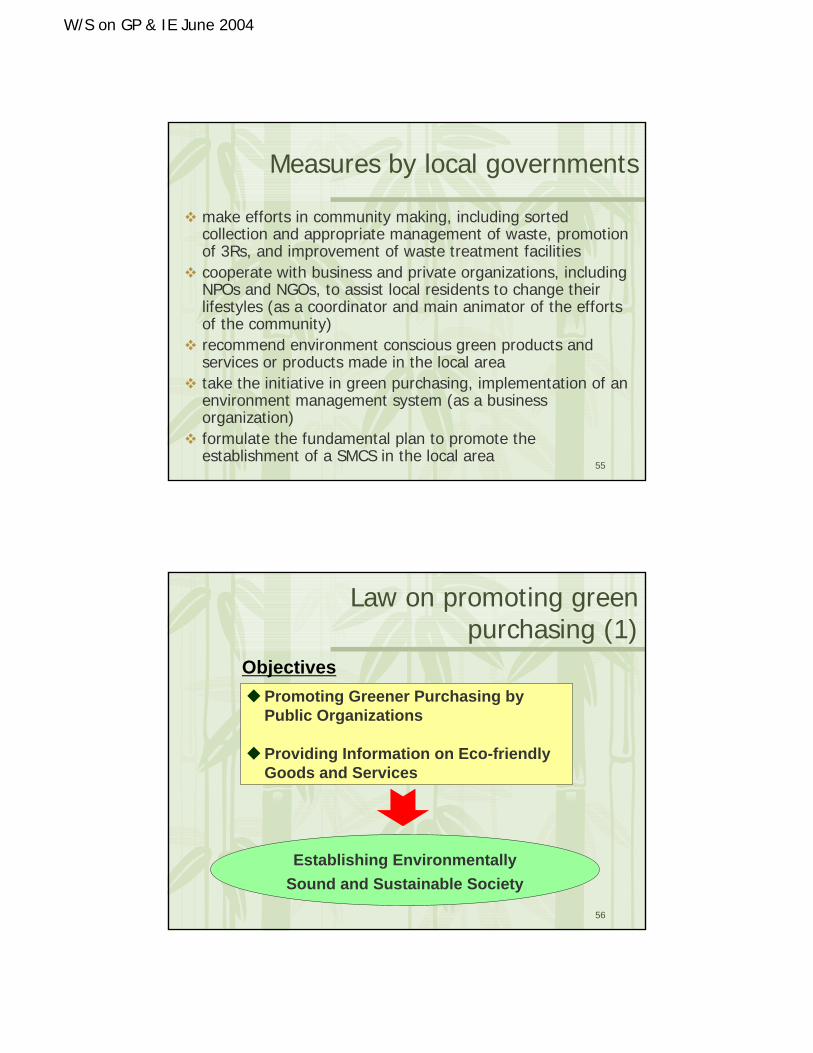
Measures by local governments
make efforts in community making, including sorted collection and appropriate management of waste, promotion of 3Rs, and improvement of waste treatment facilitiescooperate with business and private organizations, includingNPOs and NGOs, to assist local residents to change their lifestyles (as a coordinator and main animator of the efforts of the community)recommend environment conscious green products and services or products made in the local areatake the initiative in green purchasing, implementation of an environment management system (as a business organization)formulate the fundamental plan to promote the establishment of a SMCS in the local area
56
Promoting Greener Purchasing by Public Organizations
Providing Information on Eco-friendly Goods and Services
Objectives
Establishing Environmentally Sound and Sustainable Society
Law on promoting green purchasing (1)
W/S on GP & IE June 2004
57
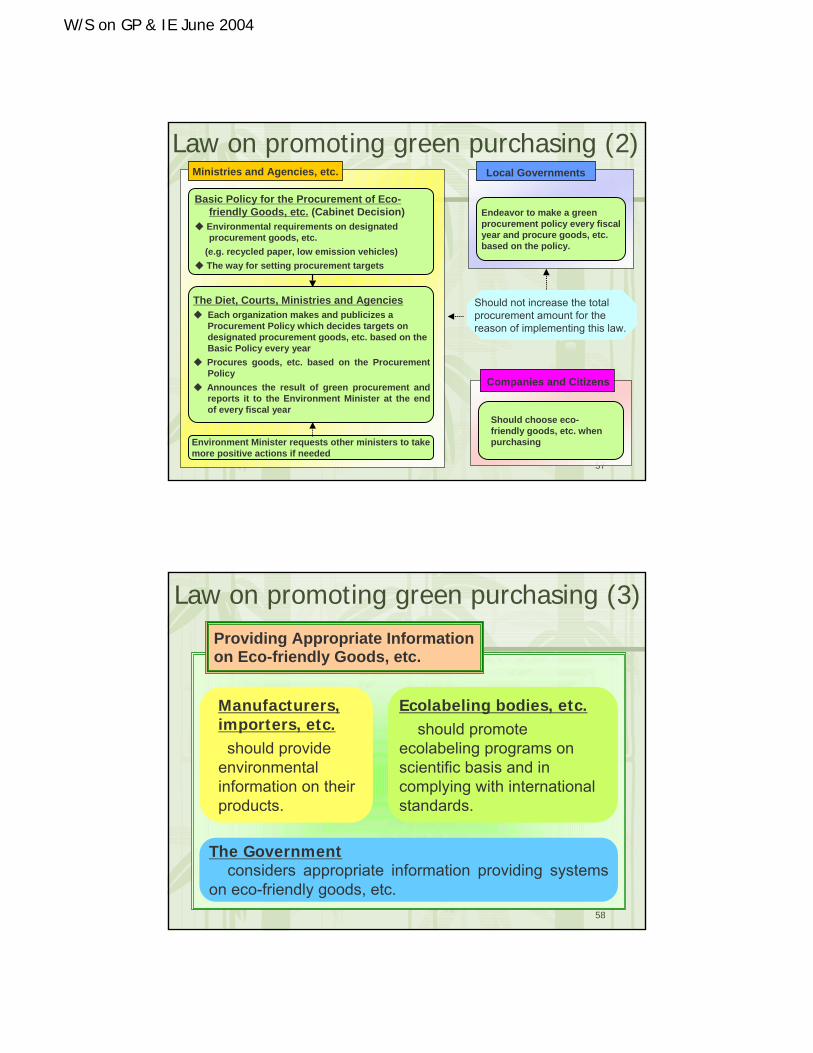
The Diet, Courts, Ministries and Agencies◆ Each organization makes and publicizes a
Procurement Policy which decides targets on designated procurement goods, etc. based on the Basic Policy every year
◆ Procures goods, etc. based on the Procurement Policy
◆ Announces the result of green procurement and reports it to the Environment Minister at the endof every fiscal year
Environment Minister requests other ministers to take more positive actions if needed
Basic Policy for the Procurement of Eco-friendly Goods, etc. (Cabinet Decision)
◆ Environmental requirements on designated procurement goods, etc.
(e.g. recycled paper, low emission vehicles)◆ The way for setting procurement targets
Ministries and Agencies, etc.
Endeavor to make a green procurement policy every fiscal year and procure goods, etc.based on the policy.
Local Governments
Should choose eco-friendly goods, etc. when purchasing
Companies and Citizens
Should not increase the total procurement amount for the reason of implementing this law.
Law on promoting green purchasing (2)
58
Manufacturers, importers, etc.
should provide environmental information on their products.
Ecolabeling bodies, etc.should promote
ecolabeling programs on scientific basis and in complying with international standards.
Providing Appropriate Information on Eco-friendly Goods, etc.
The Governmentconsiders appropriate information providing systems
on eco-friendly goods, etc.
Law on promoting green purchasing (3)
W/S on GP & IE June 2004
59
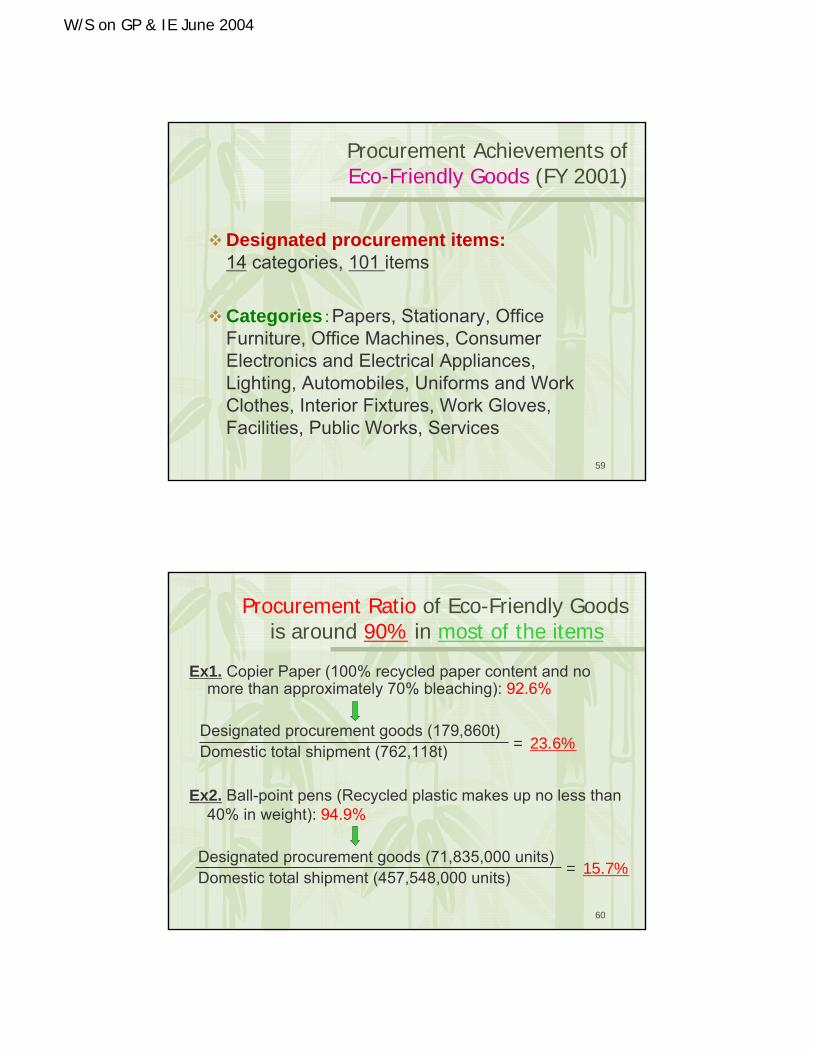
Procurement Achievements of Eco-Friendly Goods (FY 2001)
Designated procurement items:14 categories, 101 items
Categories:Papers, Stationary, Office Furniture, Office Machines, Consumer Electronics and Electrical Appliances, Lighting, Automobiles, Uniforms and Work Clothes, Interior Fixtures, Work Gloves, Facilities, Public Works, Services
60
Ex1. Copier Paper (100% recycled paper content and no more than approximately 70% bleaching): 92.6%
Designated procurement goods (179,860t) Domestic total shipment (762,118t)
Ex2. Ball-point pens (Recycled plastic makes up no less than 40% in weight): 94.9%
Designated procurement goods (71,835,000 units) Domestic total shipment (457,548,000 units)
Procurement Ratio of Eco-Friendly Goods is around 90% in most of the items
= 23.6%
= 15.7%

W/S on GP & IE June 2004
61
Law for the Promotion of Environmentally Sound Management by Providing
Environmental Information
Satisfaction of the unifying the environment with the economy
Announce Japan’s effort to the world
Taking the leadership of the world to save our environment
Evaluation the effort by society or market
Nationalgovernment
Organizations related to the government*
Largecompanies
Providing and publishing the annual report of environment
Obliging
☺Following the entries☺Doing a self-evaluation or evaluation by a third party.
☺Obligation of the national government☺Providing the entries for the report of environment☺Offer the information to declare the situations of medium and small enterprises☺taking measures to set forward uses of environmental information
Provision for effort
ObligingProvision for effort
*Independent corporations of government etc.
Localgovernment
62http://www0.nsc.co.jp/shinnihon_english/kankyou/index.html
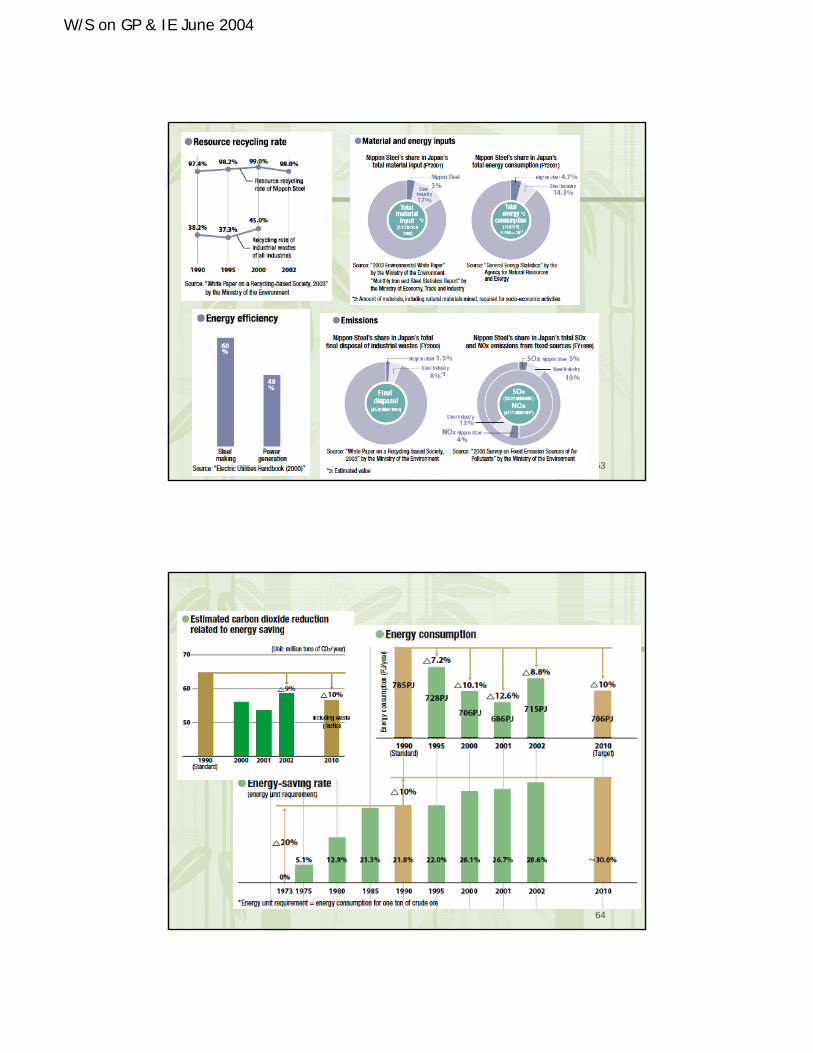
Ex.1) Nippon Steel Environmental Report
W/S on GP & IE June 2004
63
64
W/S on GP & IE June 2004
65
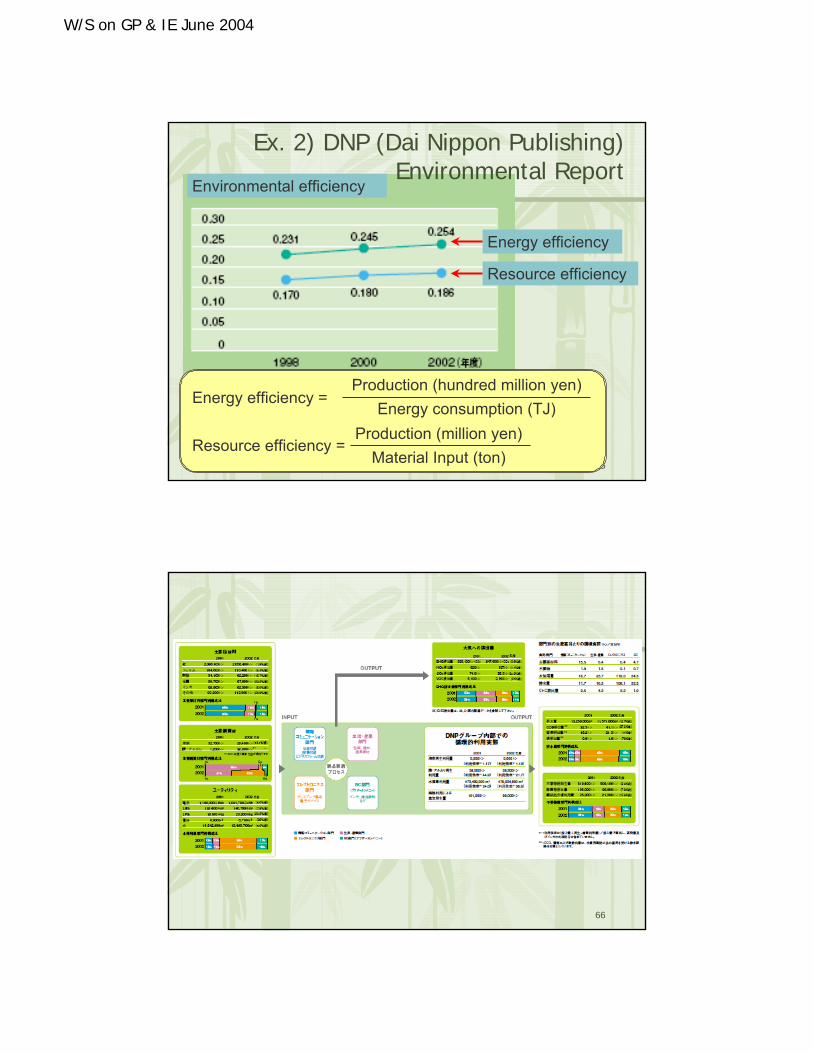
Environmental efficiency
Energy efficiency
Resource efficiency
Energy efficiency =
Resource efficiency =
Production (hundred million yen)Energy consumption (TJ)
Production (million yen)Material Input (ton)
Ex. 2) DNP (Dai Nippon Publishing) Environmental Report
66
W/S on GP & IE June 2004
67
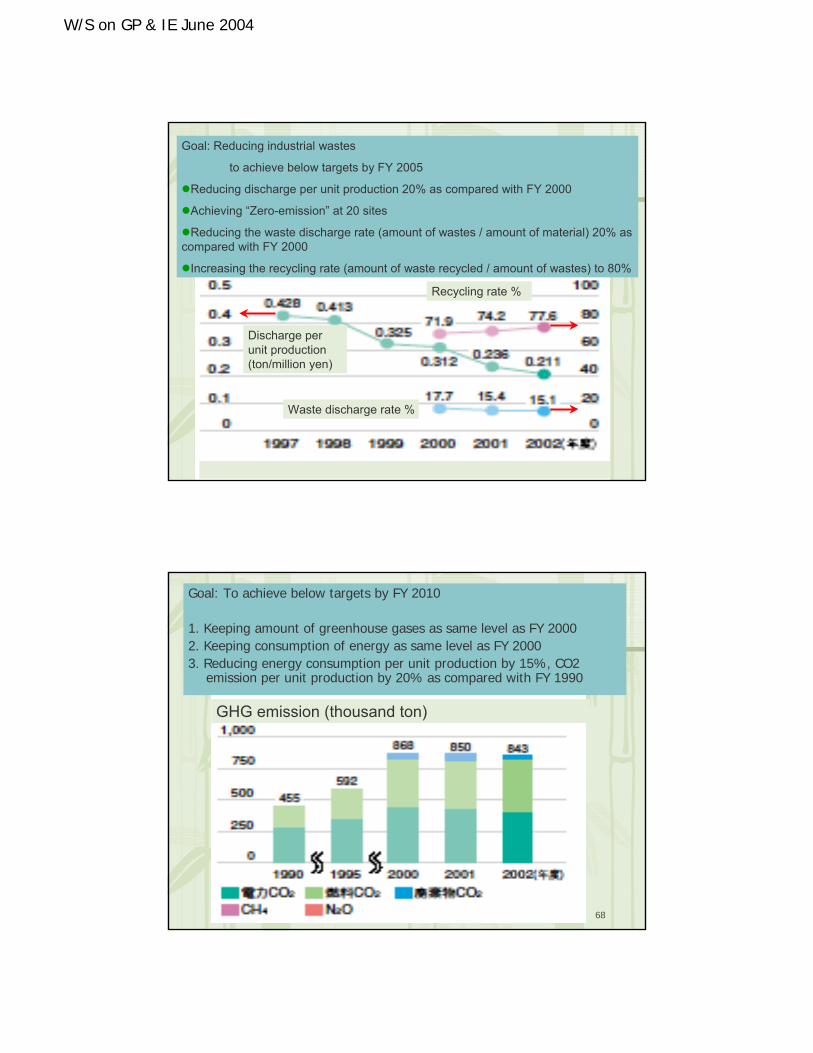
Goal: Reducing industrial wastes
to achieve below targets by FY 2005
Reducing discharge per unit production 20% as compared with FY 2000
Achieving “Zero-emission” at 20 sites
Reducing the waste discharge rate (amount of wastes / amount of material) 20% as compared with FY 2000
Increasing the recycling rate (amount of waste recycled / amount of wastes) to 80%
Recycling rate %
Waste discharge rate %
Discharge per unit production (ton/million yen)
68
Goal: To achieve below targets by FY 2010
1. Keeping amount of greenhouse gases as same level as FY 2000 2. Keeping consumption of energy as same level as FY 20003. Reducing energy consumption per unit production by 15%, CO2
emission per unit production by 20% as compared with FY 1990
GHG emission (thousand ton)

W/S on GP & IE June 2004
69
Ex. 3) Nisshin Foods Environmental Report
70
2002 2001
97% 98%
72% 66%89% 80%
Degree ofZero-emission achievementRecycling rateRecycling rate of food waste
Situation around Zero-emission and recycling
W/S on GP & IE June 2004
71
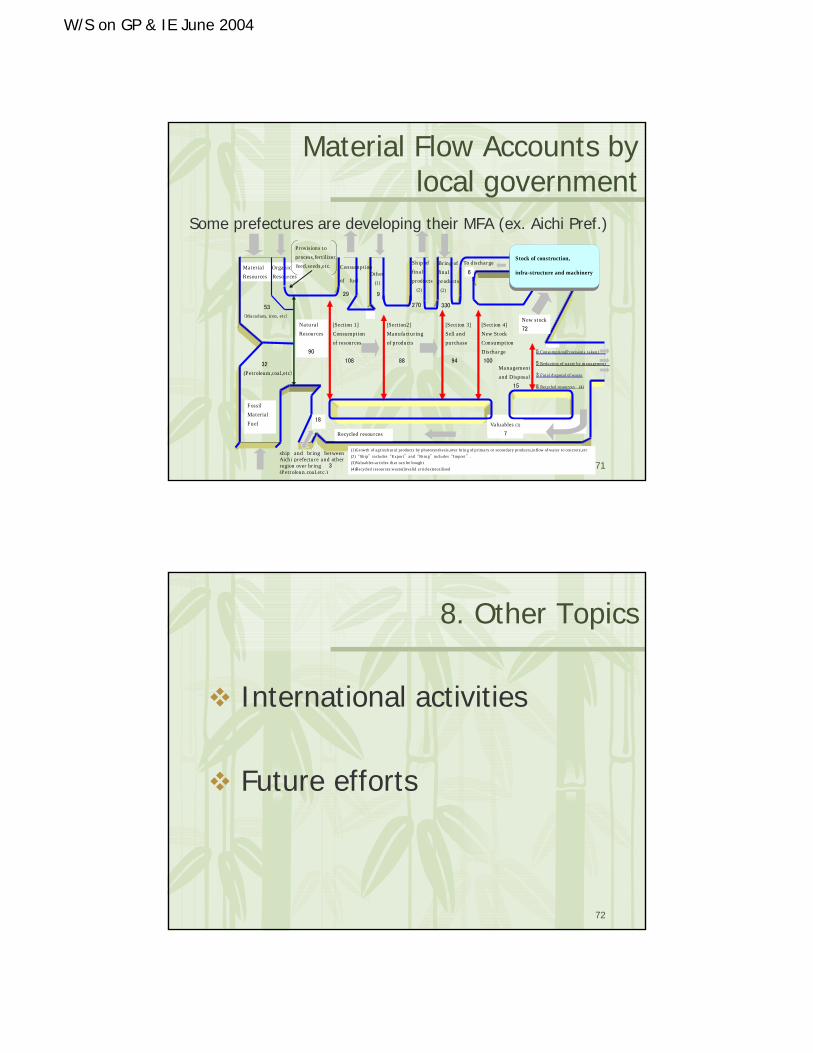
Material Flow Accounts by local government
Materia l Organ ic Resources Resources
Stock of construction,
infra-structure and machinery
Provisions to process,fer t ilizer,
feed,seeds,etc.
53
(Macadam, iron , etc)
32
(Petroleum,coa l,etc)
5 Consumption(Provisions t aken)
5 Reduct ion of waste by management
3 Final disposal of waste
8 Recycled resources (4)
sh ip and br ing between Aich i prefecture and other region over br ing 3 (Petroleun ,coal,etc.)
Consumption
of fuel
29
Other(1)
9
To discharge
6
Recycled resources
18
New stock72
Natu ra l Resources
90
[Sect ion 1] Consumpt ionof resources
108
[Sect ion2] Manufactur ingof products
88
Ship of final products
(2)
270
Bring of final product s(2)
330
[Sect ion 3]Sell and pu rchase
94
[Sect ion 4] New Stock ConsumptionDischarge 100
Managementand Disposa l
15
Fossil Materia l Fuel Valuables (3)
7
(1)Growth of agr icu ltur a l products by photosyn thesis,over br ing of pr imary or secondary product s,in flow of water to concrete,etc (2)“Ship”includes“Expor t”and“Br ing”includes“Impor t”. (3)Valuables:a r t icles tha t can be bought (4)Recycled resources:waste(invalid a r t icles)reu t ilised
Some prefectures are developing their MFA (ex. Aichi Pref.)
72
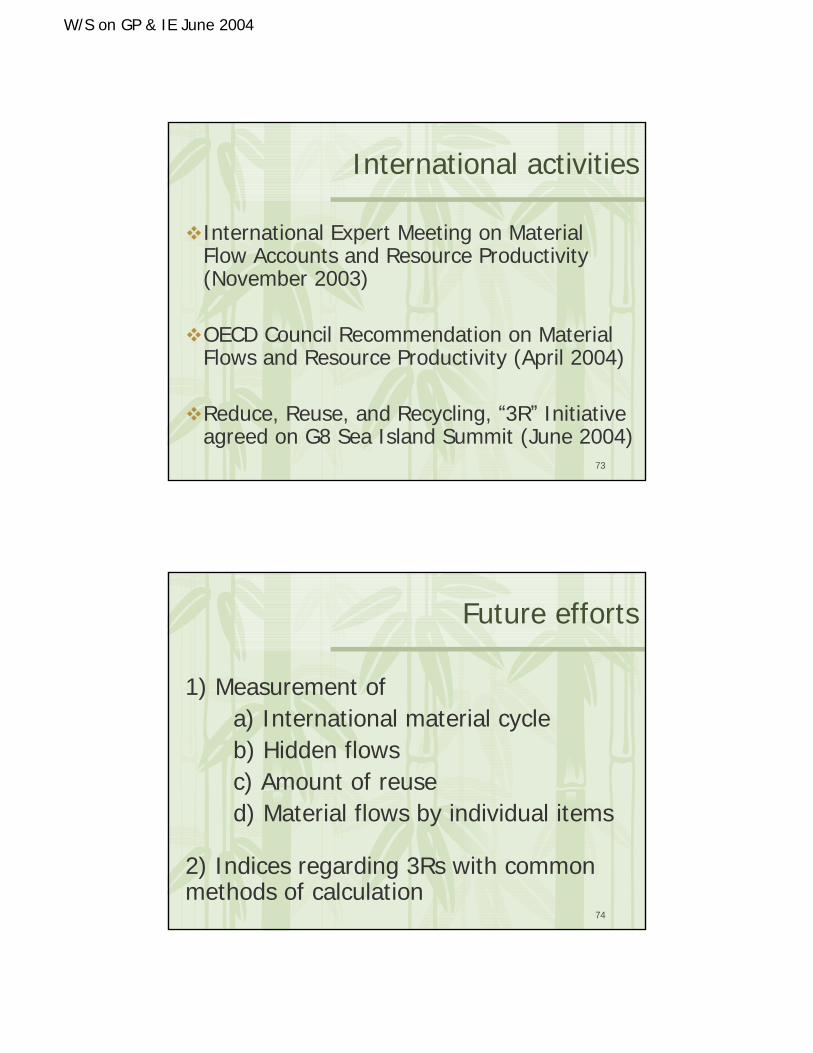
8. Other Topics
International activities
Future efforts
W/S on GP & IE June 2004
73
International activities
International Expert Meeting on Material Flow Accounts and Resource Productivity (November 2003)
OECD Council Recommendation on Material Flows and Resource Productivity (April 2004)
Reduce, Reuse, and Recycling, “3R” Initiative agreed on G8 Sea Island Summit (June 2004)
74
Future efforts
1) Measurement ofa) International material cycleb) Hidden flowsc) Amount of reused) Material flows by individual items
2) Indices regarding 3Rs with common methods of calculation