Embed Size (px)
Citation preview

Railway Fare System
Feature
Japan Railway & Transport Review 37 • January 200416 Copyright © 2004 EJRCF. All rights reserved.
Japanese Urban Railways, Markets, CapitalFormation and Fares—Private Railways
Hideki Moriya
This article describes various factorsaffecting the operation of private railwaysin major Japanese cities and some of thechanges in urban rail transit. I will focuson the urban rail transit market, capitalformation and fares as factors forconsideration when managing a privaterailway. The role of Japanese privaterailways in urban transit is quite unique inthe world and I will examine the terms andconditions of private railway managementthat have made private railways soimportant in Japan’s urban transit.
Why Are Japanese UrbanTrains So Crowded?
Why are Tokyo’s trains so crowded withcommuters and students every weekdaymorning? I imagine everyone visitingTokyo must ask this question when takinga rush-hour train. There are variousanswers and all are valid.Mainly, Tokyo is just too big—there aretoo many people travelling into the cityat the same time every day. Consequently,we need to find ways to prevent morepeople from travelling into Tokyo, suchas policies that encourage off-peak use.Another different solution is to increasecapacity by running trains more frequentlyand at faster speeds. We have had thisproblem of rush-hour overcrowding for along time, but why can’t we solve it?In an attempt to shorten journey times, itis true that trains are now longer andlonger and run more frequently withthrough operations on lines of differentcompanies. However, the most effectiveway to increase the capacity of servicesto the inner city requires a more radicalapproach of double- and quadruple-tracking existing lines, as well asinvestment in new lines.Why has there been so little of this typeof investment? The answer is becausedouble- and quadruple-tracking as wellas new construction requires massivecapital due to the still phenomenally high
price of land in Japan’s cities plus verylong construction terms due to oppositionfrom local residents. (Since privaterailway companies have also been majorproperty developers, inflated land priceshave been a double-edged sword for theirbusiness, meaning real-estate businessesperforming precedence acquisition of landwill yield the windfall profits, whilerailway businesses planning to purchaseland increase the large amount of burdens,causing investment impossible.) For manyprivate railway operators, major capitalinvestment in new track infrastructurecould threaten their survival so they are
naturally very reluctant about makingthese large investments. Their failure todo so has slowed the incentive towardsmaking trains less congested.A partial solution has been to makesmaller investments in longer platformsand improved signalling systems forhandling longer trains at shorter headwaysof 3 minutes or less.
Vital Role of Private Railwaysin Urban Transport
Many urban transit systems in Europe arefinanced through government investment
Keihan Electric Railway’s line between Doi and Takii stations (Railman Photo)
Tobu Railway’s Isezaki Line at Gotanno Station (T. Suga)

Japan Railway & Transport Review 37 • January 2004 17Copyright © 2004 EJRCF. All rights reserved.
and managed by a public authority. Japanis in stark contrast to this idea—Japaneseprivate railway companies are expectedto be self-supporting and receive nosubsidies or other public assistance foroperations. There are subsidies forbuilding new lines and grade separation,but these are to assist with constructioncosts, not to subsidize operations.Japan’s private railways are viewed asprofit-making businesses and are expectedto pay corporate taxes on income and paydividends to shareholders. There are threereasons why they are in a good positionto make profits.First, urban railway companies made keyinvestments in the early days. For example,although Tokyo, Osaka and other largeJapanese cities had good railway networksby the 1920s, the investments were notbased on a master transport plan, but simplyreflected a strong desire by private capitalto make long-term profits from railways.Many railway investments did not produceimmediate returns because of the GreatDepression in the late 1920s. But theincreasing demand created by the high-economic growth period in the 1950s and1960s generated more long-term returnsthan ever expected. The negative side ofincreasing demand is rush-hour congestion,but at least railways could maintain adominant role in urban transport while theroad system remained underdeveloped.Second, rapid economic growthcoincided with migration of populationto the cities as development offered morebetter-paying jobs. Urban migrationcreated a natural increase in commuterrail passengers who willingly enduredlong journeys on overcrowded trains eachmorning. These long-suffering commutersformed the basis of Japan’s strongeconomic growth in this period. Therewas some investment in infrastructureimprovements and most of the survivingprewar tracks were used effectively.Third, most private railways havediversified from railway operations into a
wide range of other business areas andhave formed huge group companies.Development of trackside real estate hasalways been attractive as a non-rail profitcentre and was considered a risk-free assetwhile urban land values spiralled from the1950s to early 1990s. The backgroundto this strategy is that under the corporatetax system, realized net profits are taxablewhile unrealized profi ts are not.Companies skillfully used this to expandtheir capital by converting the fruits ofeconomic growth into internal reserves asunrealized profit (latent profit). Althoughthis strategy was effective when assetvalues were increasing, it is unclearwhether it will be successful in the future.Although, the collapse of land values overthe last 10 years has highlighted the risks,the real-estate sector still remains adominant area where private railwaycompanies might make non-train profits.
Formative Years ofUrban Rail Networks
Some background to the construction ofrailway lines in and around Tokyo, and
the Keihanshin region of Kyoto, Osakaand Kobe is useful in understanding thepresent circumstances.Table 1 shows construction of lines by thegovernment railways peaked between1872 when Japan’s first railway line wasopened and the first decade of the 20thcentury. This was not the case for privaterailways. The length of private lines inG r e a t e r To k y o ( To k y o a n d t h eneighbouring three prefectures) grewconsiderably between 1912 and 1926 andeven more so (by 316.2 km) during thethe first decade of the Showa period(1926–35). Growth then slowed to just256.8 km of new tracks from 1936 to1989. In other words, a large proportionof the private railway network in andaround Tokyo was built between 1926and 1935.In the early days (1870–1926), moreprivate railways (510.1 km) wereconstructed in the Keihanshin than inGreater Tokyo. Clearly, private railwaystook an early lead in Keihanshin and weresuperior to the government railways.Neither can we ignore the efforts of privaterailways to electrify and double-track their
Table 1 Long-term Railway Construction in Major Cities(route-km)
Greater Tokyo Keihanshin
Year opened Railways * Private Subways Railways * Private Subwaysrailways railways
Meiji Period (1870–1912) 487.1 139.1 0 416.0 237.3 0
Taisho Period (1912–1926) 45.3 265.1 0 0 272.8 0
Showa Period1926–1935 119.7 316.2 8.0 46.9 167.4 4.1
1936–1945 49.4 5.0 6.3 0 22.8 4.7
1946–1955 0 36.0 6.4 0 0 3.1
1956–1965 7.5 20.6 55.0 7.4 6.9 20.2
1966–1975 66.9 76.7 92.8 11.0 20.9 45.6
1976–1989 101.4 76.9 72.5 6.2 41.5 53.9
Heisei Period1989–2001 18.2 116.7 48.1 22.9 63.5 33.0
Subtotal(1936–1989) (225.2) (215.2) (233.0) (24.7) (92.1) (127.5)
Source: Compiled from Annual Report on Urban TransitNote: Includes government railways, JNR and relevant JRs

Japan Railway & Transport Review 37 • January 200418
Railway Fare System
Copyright © 2004 EJRCF. All rights reserved.
lines between 1920 and 1930. Electrifiedservices using railcars and electricmultiple units (EMUs) over double trackshave clear advantages compared tosteam-locomotive hauled services oversingle tracks, especially on short urbanlines with many stations where shortheadways and quick turnarounds arenecessary.
Urban Railways andGreat Depression
As we have seen, the basic framework ofthe rail network in Japan’s major urbancentres was already established by the1930s. But these networks were not putto a proper test immediately because ofthe long, worldwide Great Depressionfrom 1929. The depression hit railwayoperators in Japan severely. Althoughconstruction of some new lines managedto boost ridership, the future for privaterailways did not look bright and there was
a battle for survival between rivals in thesame market, as well as against thegovernment railways and some newcompetitors—buses and taxis.Figure 1 shows that although rail ridershipincreased steadily, fare revenues slumpedafter 1929. Private railways were obligedto compete with each other by slashingfares, but this only worsened theirfinances. During the decade after 1925,the fare per km of urban railways declinedin real terms by about 20%. As oneexample, when the private OdawaraKyuko Railway (the forerunner of today’sOdakyu Electric Railway) opened in 1928,its fare per km was 1.8 sen (¥1 = 100 sen).
At the time, the government railways’ fareper km was only 1.56 sen. However, by1935, Odakyu’s fare per km in real termshad dropped to 1.2 sen. In other words,most private railways were forced toparticipate in a market characterized byfare deflation and steep competitionbetween services; one solution was toat t ract more passengers throughdevelopment of real estate along tracks.To summarize the situation, in 1933,representatives of the private railwayindustry complained to the Minister ofRailways saying, ‘At the present time,there are no regulations governing thesetting of fares by government or privateland transport carriers. Each carriercompetes with the others and, as a result,the private railways are now in extremelydifficult financial straits. Railwayoperators are forced to lower fares in orderto safeguard their existence.’In effect, the industry was asking thegovernment to quickly change the farestructure of the government railways andto establish regulations on fare reductionsin order to prevent excess competitionbetween private railways. Such measureswere especially important for a newcompany like Odakyu.Regulations governing private railwayfares were put into effect in 1936 withconsiderable improvement to the profitsof private operators for some years.
Urban Development andTransport: Postwar Years
Japan started rebuilding after WWII andTokyo’s population began recoveringfrom the drop experienced during the
Table 2 Person Trips and Population in 23 Wards of Tokyo
Fiscal year No. of trips Population Average trips per person
1930 1.107 billion 4.99 million 222
1951 2.548 billion 5.82 million 439
Source: I. Watanabe, Transportation in Tokyo, Tokyo Metropolitan Government Transportation Bureau,Tokyo, 1954
Figure 1 Fares and Operating Revenues of Prewar Urban Railways
1920 21 22 23 24 1925 26 27 28 29 1930 31 32 33 34 1935
1.9
1.8
1.7
1.6
1.5
1.4
50
40
30
20
10
80
70
60
50
40
30
20
Fares
Passenger-kmOperating revenues
Fare (sen per passenger-km)
100,000 passenger-km
¥ million
Source: 20-years History of Land Transport

Japan Railway & Transport Review 37 • January 2004 19Copyright © 2004 EJRCF. All rights reserved.
war. Surprisingly, passenger traffic rosemuch fas ter than the populat ionincrease (Table 2).Postwar ridership was high due to thechaotic socioeconomic circumstances.Housing had yet to be rebuilt in thebombed-out central districts, so thenumber of trips on Tokyo’s transit systemincreased dramatically as many peoplewere riding trains into the city from theless damaged suburbs and surroundingprefectures. Moreover, many people weregoing out to the countryside in search offood and there were also many pedlarstravelling with their wares.The extremely low capacity of alltransportation modes added to the railwaynetwork congestion. Explaining why theaverage annual number of trips per personincreased rapidly, Watanabe (Table 2)wrote, ‘The lack of direct express railconnections between inner Tokyo and thesuburbs made it necessary for passengersto change between trains of differentoperators frequently.’But transport demand remained very higheven after these special postwar factorsdisappeared, partly due to the long-termgrowth in Tokyo’s population (Table 3).The postwar population growth boosteddemand for services provided by thegovernment railways and JapaneseNational Railways (JNR) after 1949,private suburban railways, trams, busesand subways, leading to high congestion.High postwar inflation forced operators toraise fares frequently, but the fare increaseswere held below inflation, meaning thatfares were actually getting cheaper in realterms and leading to more demand andmore overcrowding. Fare increases wereheld below the inflation rate for social
policy reasons, but the situation was veryhard for operators, especially thoseinvesting in capacity increases.
Fare Revisions in PostwarInflationary Period
Today, a Japanese corporation cannotoperate a railway without a governmentlicence and all fares must also be pre-approved by the Minister of Land,Infrastructure and Transport. Operatorscannot raise fares unilaterally, althoughthey may make minor adjustmentswithout prior approval. There is a longlapse between applying for a fare increaseand receiving approval. Basically, theoperator must prove it is operating at aloss before it can submit an application.In the past, a similar set of restrictions wasapplied, making profitable operationsdifficult during inflationary periods.Both the fare rate and the minimum fare
rose every year from fiscal 1945 to 1952,primarily because of postwar inflation. Atthe time, fares for the governmentrailways/JNR formed the basis fordetermining fares of private railways. Asa result, the fare rate of both groups wererising, although not from the same initiallevel (Table 4).In 1945, the minimum fare for both thegovernment railways and Tobu Railwaywas 20 sen, but this had risen to ¥10 by1952, despite strong public opposition. Inother words, the minimum fare rose 50times while the tapered fares rose by 30 times.The operators claimed the higher fareswere needed to cover rising costs, suchas the 70% rise in the cost of materialsand the 300% rise in the cost of electricity.Each increase was explained as a finalincrease to cover inflation to that point.The ¥10 minimum fare approved inFY1952 was held for 14 years by JNR andfor 7 years by the private railways. Fareswere increased in an orderly mannerwithout political intervention and the farerevision process was fair and impartial.However, the FY1952 revision did notcover the investments needed for majorconstruction projects, such as new lines,track quadrupling, and through operations
1945 1950 1955 1960 1965 1970 1975 1980 1985 1990 1995
3.5 6.3 8.0 9.7 10.9 11.4 11.7 11.6 11.8 11.9 11.8
Table 3 Postwar Population Growth of Metropolitan Tokyo(million)
Table 4 Fare Revisions in Early Postwar Years (FY1945–52)
Fare revisions JNR Private railways (Tobu Railway)
Period Rate 1) Fare rate 2) Period Fare rate Minimum fare Notes
1st FY1945 Mar 1946 150% ¥0.075 Same ¥0.075 ¥0.20
2nd FY1946 Mar 1947 25% ¥0.095 Same ¥0.095 ¥0.50
3rd FY1947 Jul 1947 250% ¥0.35 Same ¥0.35 ¥1
4th FY1948 Jul 1948 155% ¥0.90 Same ¥1.20 ¥3
5th FY1949 May 1949 60% ¥1.45 Same ¥1.20 ¥5 3) Minimum fare only
6th FY1950 May 1950 -4% 4) ¥1.45 Same ¥1.45 ¥5 Fare rate only
7th FY1951 Nov 1951 26% ¥1.85 Same ¥2.00 ¥10
8th FY1952 Jan 1953 10% ¥2.10 Same ¥2.30 ¥10 Fare rate only
Source: H. Moriya, A Study of Private Railway Fares in Japan1) Rate of increase in real terms. For JNR only (no figures for private railways).2) Fare rate = yen/km. Before the first revision, the fare rate was ¥0.03 and the minimum fare was ¥0.10 (10
sen).3) At the time, fairly large differences in minimum fares were permitted between private railways. The
minumum fare was ¥5 for the seven companies in Greater Tokyo and Meitetsu (Nagoya), ¥6 for Keihan,Hankyu and Hanshin (Kansai region), ¥6 for Nishitetsu (northern Kyushu), and ¥3 for Nankai (Kansai)and Kintetsu (Kansai & Nagoya).
4) This fare decrease was due to the abolition of passenger tax.
Source: Tokyo Metropolitan Government

Japan Railway & Transport Review 37 • January 200420
Railway Fare System
Copyright © 2004 EJRCF. All rights reserved.
on subway lines. In many cases, thebudget only covered investment for short-term construction projects to providemore electric power, improve signallingand raise safety levels—areas that wereall inadequate. Capacity investmentfocused on increasing rolling stock withno long-term plans to increase capacity.
Private Railways during HighEconomic Growth Period
Japan’s high economic growth periodlasted for 15 years from 1956. During thistime, the real average annual growth ratewas about 10% with impressive gains ineconomic and industrial performance,and in living standards. Growth wasdriven by increased capital investmentsand technological innovation. Theincreased productivity permitted the mostimportant result of all—an increase in realwages! Higher levels of income offeredprivate railways excellent businessopportunities as well as difficult challenges.
Around this time, Japanese privaterailways established new business in arange of non-rail sectors. In addition tocontinuing to promote real-estate projectsand development of tourism potential nearstations, they began constructing andmanaging station buildings, departmentstores, hotels, golf courses, and ski resorts.They also launched other service andconstruction businesses, and eithermanaged them directly as new venturesor established affiliates to promote them.When implementing these businessdiversification strategies, the companiesspeculated that the land they werepurchasing or holding would increase invalue and they took great advantage oftheir excellent credit rating to accumulatecapital.On the other hand, making profits fromrailway operations proved more difficultdue to the massive costs both of capitaland labour. Unlike the growth sectors, itwas difficult for railways to raise labourproductivity.
The high economic growth boosted wagesin other industries, forcing the privaterailways to award annual wage increasesto their employees. At the same time, theywere investing in increased capacity.Ironically, their finances were actuallyimproved by the extra revenue caused bythe rush-hour congestion.F igu re 2 shows the inc rease inpassenger-km of private railways aftereach fare hike. Instead of the expecteddrops, passenger levels actually increased.Of course, higher ridership naturallyresults in higher income, so the operatorsbenefited from both higher fares andhigher ridership. This favorable situationcontinued until 1967. However, from the1970s, passenger-km figures tended toshow much lower rates of increase, sorevenues (excluding extra income fromfare increases) only increased slightly.Once again, the private railways foundthemselves in a difficult financial position.
Long-term Plans to IncreaseTransport Capacity
To boost capacity, the private railwayspromoted a wide range of expensivecapital projects aimed at eliminatingnetwork bottlenecks. To increasetransport density, they increased both thelengths of train sets and the operationfrequency. The longer train sets requiredextended platform and larger stations,whi le the inc reased opera t ionsfrequencies required better safetymeasures. In addition, power equipmentwas upgraded and more rolling-stocksheds were built.But the most effective way to increasecapacity is to build new lines, quadrupleexisting tracks, and introduce throughoperations on subway lines. Such hugeimprovement projects require a long-termplan that cannot be done without thecooperation of local governments andbureaucrats who must approve any urbandevelopment plan.
Figure 2 Increases in Passengers after Fare Revisions
7000
6000
5000
4000
3000
2000
1000
0
-1000
Million passenger-km
With season ticketsWithout season tickets
Fare revision
1957/59 61/63 65/67 69/71 73/75 75/76 77/79 80/82 82/84 85/87 87/89 90/92
9th 10th 11th 12th 13th 14th 15th 16th 17th 18th * 19th
Source: H. Moriya, A Study of Private Railway Fares in JapanNote: Two companies raised fares in FY1985. Six raised fares in FY1987 and 1988 separately.

Japan Railway & Transport Review 37 • January 2004 21Copyright © 2004 EJRCF. All rights reserved.
Actually, it is impossible to construct newlines in built-up urban areas, so trackquadrupling is the most practical way toreduce l ine conges t ion . S inceconstruction of a new line can only startafter the land has been purchased and allthe land in central Tokyo is fully used, newlines can only be built through less-developed areas far from the city centre.This type of new line tends to act as afeeder for existing lines and either doesalmost nothing to reduce congestion ormay even increase it.Although through operations from arailway on a subway line eliminate somepassenger transfers and can reducecongestion to some extent, throughoperations have little effect on increasingcapacity.All these solutions require massive capitaland long construction times, explainingwhy private railways have not been keento pursue them. In the 1950s, thegovernment held hearings on opinionsabout investment to increase capacity andthe first 5-year plan to strengthen transportcapacity was implemented in FY1957. Itwas soon obvious that the plan wasachieving nothing and it was abandonedand replaced in 1961 with a 3-year plan.This plan was renewed and revised every3 or 5 years until FY1996.The plan is shrouded in mystery and noone seems to know exactly why it wasdrawn up. For example, it does notinclude a programme of specific capacity-raising investments, and nor does it clearlyidentify when investments should bringresul ts . I t gives no quanti tat ivebenchmarks to evaluate the actualprogress and no explanations. Theamounts invested by each company arelisted in such a way that it is impossiblefor an outsider to know when, where, andhow much the investments were. Theplan appears to be a sham, giving only anexaggerated report of achievement ratesfor each fiscal year.
Full Costing andPolitical Interference
The introduction of a new fare-assessmentmethod in 1961 was a small step towardsencouraging private railways to invest incapacity. Until 1961, the governmentassessed a fare increase application bytotalling the various company costs. Thenew, rate-based method was explained asa mechanism for determining fareincreases by considering new costsincurred by railways making capacity-oriented capital investments.Under the new rate-based method, theamount a company would receivethrough fares was calculated bymultiplying the value of business assetsinvested in the railway by a fair rate ofreturn. The new method determinedamounts to be received through fares,regardless of actual operating costs.Under the previous method, a railwayoperator who had cut costs to improve itsfinancial situation might be refused a fareincrease, while an inefficient operator
who had continually pursued high-costmanagement practices might see itsapplication approved. Changing theapplication assessment was seen as adramatic improvement and it wasanticipated that standard cost estimateswould be made. It was assumed that thenew method would guarantee areasonable consideration of full costs.But for all the rhetoric, the new methoddid not result in any real change. Attemptsto assess full costs were often influencedby politics and the new assessmentprocedure lost most of its significance.This does not mean that the procedurewas flawed; the problem was how it wasapplied. However, the method itself hasnot been abandoned, and even the JRgroup of companies—who vigorouslyopposed i t for a while—recentlyannounced that they would like themethod applied to future fare revisions.Political considerations have oftenresulted in postponed or reduced fareincreases and politicians have ofteninterfered with applications for unpopular
Keisei Line between Aoto and Takasago stations (T. Suga)

Japan Railway & Transport Review 37 • January 200422
Railway Fare System
Copyright © 2004 EJRCF. All rights reserved.
admitting that a fare increase was neededto achieve the objectives of the plans tostrengthen transport capacity.
Reasons for Low-farePolicies and Results
There were two main explanations foropposing fare increases. The first was thatsince private railways were profiting fromtheir diversified non-rail businesses, theyshould use some of those profits to cross-subsidize fares. However, it was obviousthat railway operations had to be treatedas a self-supporting business in order topromote capacity investments and reducecongestion. The second was that wageincreases are natural in industries wherelabour productivity is rising, but it was notin the national interest for wages to rise atcompanies and industries—such as privaterailways—where labour productivity wasstagnant. The railways argued that theyneeded to raise fares to compensate forrising wages, but increasing employees’wages was seen as causing a ripple effectthat would stoke inflation. At that time,the Federation of Private Railway Workers’Unions campaigned every spring for higherwages and called frequent strikes. Thelabour supply and demand conditionsprevailing clearly show that the railwayshad to offer higher wages in order to keeptheir workforce.The government’s policy of holding downprivate railway fares was plainly evidentby the early 1960s. The Cabinet Council,which was established to draw up anti-inflation measures, indicated it wasprepared to cap public utility rates—including private railway fares—as a brakeon rising prices.This policy was maintained for some timeand greatly reduced the profitability ofprivate railways over the long term.Private rail operations piled up hugedeficits, leading to the abnormal situationof non-rail business supporting overallbusiness (Fig. 3). Unfortunately, the real
Figure 3 Operating Profit/Loss Ratios for Rail-based Operations after InterestPayments (14 Major Private Railways)
10
5
0
-5
-10
-15
1956 1960 1965 1970 1975 1980 1985 1990 1993
58 62 65
70 79 81 84 87 88 91
74
75
%
Source: H. Moriya, A Study of Private Railway Fares in Japan
Note: Arrows ( ) indicate fare revisions.
Table 5 Periods to Revise Fares (Application to Implementation)
Application Discussion Verdict Approved Implementation Screening Deliberation Total date date date date date period period period(A) (B) (C) (D) A to B B to C A to D
8th 25 Nov 1952 27 Dec 1952 15 Jan 1953 – – 2 months
9th 2 Jul 1957 6 Jul 1957 16 Dec 1958 26 Dec 1958 4 Jan 1959 0 month 18 months 18 months
10th 5 Aug 1961 15 Aug 1962 19 Oct 1962 19 Oct 1962 1 Nov 1962 0 month 14 months 14 months
11th 11 Jan 1965 18 Aug 1965 10 Jan 1966 11 Jan 1966 20 Jan 1966 7 months 5 months 12 months
12th 12 Dec 1968 13 Jan 1970 25 Sep 1970 25 Sep 1970 5 Oct 1970 13 months 8 months 21 months
13th 1 Jul 1972 2 Oct 1973 11 Jul 1974 12 Jul 1974 20 Jul 1974 15 months 9 months 24 months
14th 29 Aug 1975 25 Sep 1975 2 Dec 1975 5 Dec 1975 13 Dec 1975 1 month 2 months 3 months
15th 12 Aug 1978 7 Sep 1978 7 Dec 1978 15 Dec 1978 8 Jan 1979 1 month 3 months 5 months
Source: H. Moriya, A Study of Private Railway Fares in JapanNote: Data from applications made by Tobu Railway.
fare increase. Table 5 shows that fareincreases were often postponed, startingaround the time of the 1957 increase. Areasonable fare increase that wouldnormally have taken 2 or 3 months to
approve and implement was oftenpostponed or temporarily denied. As anexample, in 1961, the then Minister ofTranspor t re fused to change thegovernment’s capping policy even while
Japan Railway & Transport Review 37 • January 2004 23Copyright © 2004 EJRCF. All rights reserved.
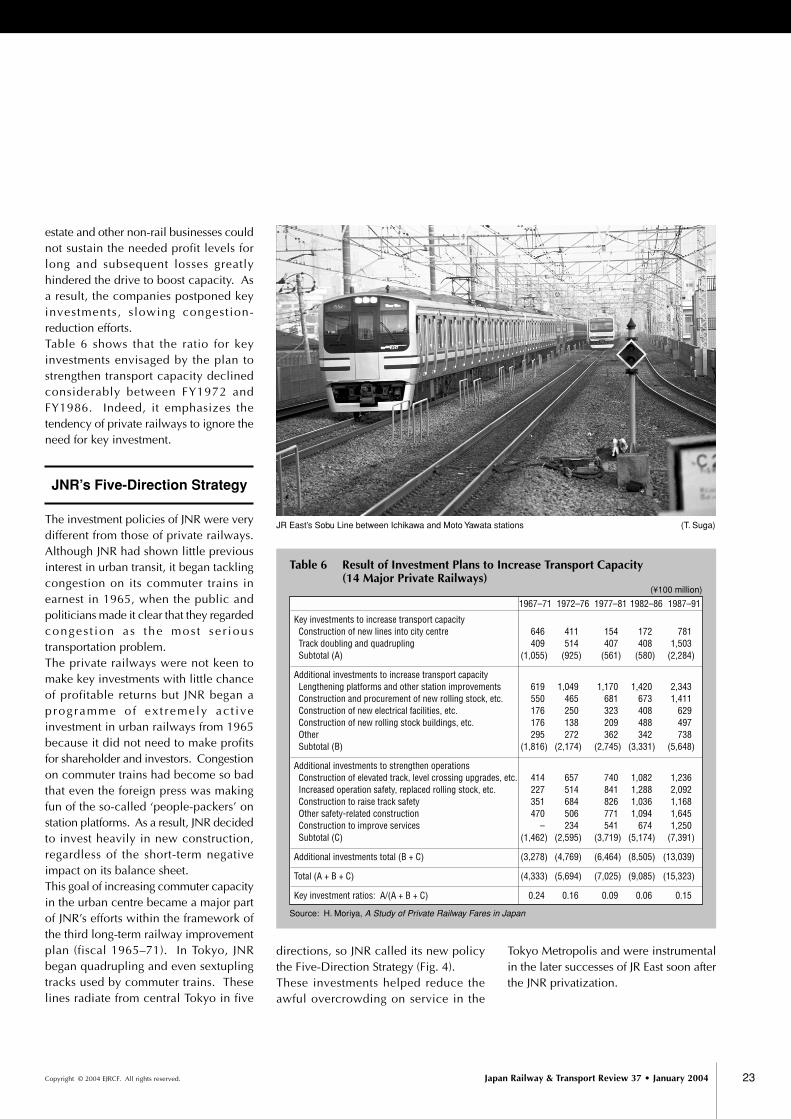
estate and other non-rail businesses couldnot sustain the needed profit levels forlong and subsequent losses greatlyhindered the drive to boost capacity. Asa result, the companies postponed keyinvestments, slowing congestion-reduction efforts.Table 6 shows that the ratio for keyinvestments envisaged by the plan tostrengthen transport capacity declinedconsiderably between FY1972 andFY1986. Indeed, it emphasizes thetendency of private railways to ignore theneed for key investment.
JNR’s Five-Direction Strategy
The investment policies of JNR were verydifferent from those of private railways.Although JNR had shown little previousinterest in urban transit, it began tacklingcongestion on its commuter trains inearnest in 1965, when the public andpoliticians made it clear that they regardedconges t ion as the mos t se r ioustransportation problem.The private railways were not keen tomake key investments with little chanceof profitable returns but JNR began aprogramme o f ex t remely ac t iveinvestment in urban railways from 1965because it did not need to make profitsfor shareholder and investors. Congestionon commuter trains had become so badthat even the foreign press was makingfun of the so-called ‘people-packers’ onstation platforms. As a result, JNR decidedto invest heavily in new construction,regardless of the short-term negativeimpact on its balance sheet.This goal of increasing commuter capacityin the urban centre became a major partof JNR’s efforts within the framework ofthe third long-term railway improvementplan (fiscal 1965–71). In Tokyo, JNRbegan quadrupling and even sextuplingtracks used by commuter trains. Theselines radiate from central Tokyo in five
Table 6 Result of Investment Plans to Increase Transport Capacity(14 Major Private Railways)
(¥100 million)
1967–71 1972–76 1977–81 1982–86 1987–91
Key investments to increase transport capacity Construction of new lines into city centre 646 411 154 172 781 Track doubling and quadrupling 409 514 407 408 1,503 Subtotal (A) (1,055) (925) (561) (580) (2,284)
Additional investments to increase transport capacity Lengthening platforms and other station improvements 619 1,049 1,170 1,420 2,343 Construction and procurement of new rolling stock, etc. 550 465 681 673 1,411 Construction of new electrical facilities, etc. 176 250 323 408 629 Construction of new rolling stock buildings, etc. 176 138 209 488 497 Other 295 272 362 342 738 Subtotal (B) (1,816) (2,174) (2,745) (3,331) (5,648)
Additional investments to strengthen operations Construction of elevated track, level crossing upgrades, etc. 414 657 740 1,082 1,236 Increased operation safety, replaced rolling stock, etc. 227 514 841 1,288 2,092 Construction to raise track safety 351 684 826 1,036 1,168 Other safety-related construction 470 506 771 1,094 1,645 Construction to improve services – 234 541 674 1,250 Subtotal (C) (1,462) (2,595) (3,719) (5,174) (7,391)
Additional investments total (B + C) (3,278) (4,769) (6,464) (8,505) (13,039)
Total (A + B + C) (4,333) (5,694) (7,025) (9,085) (15,323)
Key investment ratios: A/(A + B + C) 0.24 0.16 0.09 0.06 0.15
Source: H. Moriya, A Study of Private Railway Fares in Japan
JR East’s Sobu Line between Ichikawa and Moto Yawata stations (T. Suga)
directions, so JNR called its new policythe Five-Direction Strategy (Fig. 4).These investments helped reduce theawful overcrowding on service in the
Tokyo Metropolis and were instrumentalin the later successes of JR East soon afterthe JNR privatization.

Japan Railway & Transport Review 37 • January 200424
Railway Fare System
Copyright © 2004 EJRCF. All rights reserved.
Special Measures Law forPromotion of Railway
Construction
The government policy of keeping privaterailway fares low was a mistake.Unfortunately, the new rate-based methodused to assess fare increase applications,could not sufficiently promote capacity-raising capital investments by itself. Thisrealization led to development of a newpolicy embodied in the 1986 SpecialMeasures Law for the Promotion ofRailway Construction in DesignatedCities, giving preferential treatment torailways investing in construction projectsto increase capacity. The law permitsprivate rai lways meeting certainconditions to establish non-taxable capitalreserve funds to be used for capitalinvestments to increase transport capacity.The fund capital accumulates from a faresurcharge (3% to 6%) levied withgovernment approval up to a maximumreserve limit of 25% of the estimatedconstruction cost. The fund can be heldfor a maximum of 10 years and the fare
surcharge is to be returned to passengersas a fare decrease for 10 years after theconstruction is completed. The intentionof the system is to allow the company toborrow the capital from passengers beforethe construction so that passengers do nothave to pay for the investment throughhigher fares after completion. This newinvestment sourcing method wascriticized by some, but generally receiveda warm welcome.However, the incentives envisioned by thelaw are not very effective despite a lateramendment raising the maximum fundlimit, because a company would need amuch longer time—close to 30 years—torecover the money invested in projects,such as quadrupled lines. This explainswhy many private railways have notparticipated in the system. Furthermore,the greatly changed economic situationsince the law was introduced hasprompting some companies to changetheir investment plans or to abandon themaltogether.Only five private railways in MetropolitanTokyo are participating in the system. The
other 10 major private carriers are notpromoting any construction that wouldqualify under the system.Although it is difficult to judge the policy,it appears to have been ineffective inpromoting new investment but i tfacilitated existing investment plans toincrease transport capacity and has meriton that account.
Stable, Profitable Timesfor Urban Railways
Strangely, the private urban rail industryhas en joyed a s t ab le f i nanc ia lenvironment since the late 1990s.Although a new trend of decliningridership has reduced congestion on trainsused by commuters and students, it hasnot pushed carriers into the red. In thepast, although operating income rose ascongestion worsened, the growingnumber of passengers pushed costs uptoo, forcing companies to increase faresevery 2 or 3 years to avoid going into thered. However, fares have remained steadyfor the last 6 years despite decliningridership year-on-year. This is a newphenomenon not experienced by railwayoperators in the postwar years.Conversely, the condition of the non-railway business of the 15 major privaterailways has worsened since the late1990sand they are scrambling to recover.Previously, when railway operations werein financial difficulties, income from non-railway businesses supported thecompanies as a whole. Today, the reverseis true. Falling real-estate prices haveadversely impacted the values of manyinves tment proper t ies and somecompanies are taking emergencymeasures, including disposition of capitalreserves to deal with latent losses.In railway operations, three major factorshave combined to ensure a moresatisfactory and stable net income. First,interest rates are low and this has reducedborrowing costs. Second, new labour-
Figure 4 Results of Investments to Increase Transport Capacity of High-speedRailways in Greater Tokyo and Keihanshin Region
1961 1962 1963 1964 1965 1966 1967 Fiscal year
800
700
600
500
400
300
200
100114
317287
107
390337
96
443 455
118
368
514478
420499
698550
715739
668850JNR
Private railways
Subways
(¥100 million)
Source: White Paper on Transportation, Fiscal 1968Notes: (1) Data from Railway Supervision Bureau, Ministry of Transport
(2) JNR includes Japan Railway Construction Public Corporation(3) Private railways means only major private railways

Japan Railway & Transport Review 37 • January 2004 25Copyright © 2004 EJRCF. All rights reserved.
Hideki Moriya
Mr Moriya is a Professor at Keiai University. After graduating in economics from Hitotsubashi University
in 1966, he joined the Development Bank of Japan where he worked until 1996 as a chief economist
of the Research Institute of Capital Formation. He is also an author of A Study of Private Railway
Fares in Japan, which won awards from the Japan Society of Transportation Economics and the
Japan Society of Research and Information on Public and Co-operative Economy.
saving technologies such as ticket vendingmachines, automatic ticket wickets,automatic fare-underpayment calculationmachines, and unmanned safety-relateddevices have cut labour costs. Third, thedeflationary economy has lowered wagepressure throughout industry as a whole,which has alleviated wage pressures onrailways too.Under the Special Measures Law, reserve-fund financed construction is scheduledto be terminated in fiscal 2004 and thenfares are supposed to be reduced by thepreviously levied surcharge. However,the companies’ loans will increase thecapital cost after construction and,additionally, the cost of depreciation willbe so great that we cannot be sure thecompanies will reduce fares by the fullamount.
Future Passenger Demandand Fare Structures
It will be interesting to see what role urbanrailways play in Japan in the future andhow their fare structures will change. Thissection examines these questions from anumber of different viewpoints, lookingfirst at the transit market and ridership, andthen at fares and costs.First, we should note that the privaterailways and the JR group of companieshave two things in common—theirridership is declining over the long term,and their role in the urban transit marketis shrinking. Some people favour trainsover all other transport modes becausethey are environmentally friendly. But willthis advantage hold up af ter theintroduction of smaller, lighter vehiclespowered by fuel cells? Nobody can saydefinitively that trains are by far the bestform of transport for the average personand even most railway employeesprobably own a car!Japanese railway operators must askthemselves some searching questions:Are fares at proper levels? Why is
ridership declining over the long term?What needs to be changed to attract morepassengers?Unfortunately, although operators areeager to increase fare revenues, they rarelythink of doing so by increasing ridershipand journey length. Their first thought isalways to raise fares, which may be a goodway to boost profits, but may also reducethe number of passengers.This lack of foresight was seen when newtrack was built between Ueno and Tokyostations to allow shinkansen from thenorth to terminate at Tokyo Station insteadof Ueno. Did the planners consideranother option—to spend the money ona conventional, narrow-gauge lineinstead? Probably not. Choosing thesecond option would have boostedcapacity on the more heavily usedconventional track to reduce congestionand increase ridership. We need onlycompare the transport density on the twosections—the Ueno–Tokyo shinkansentrack section and the Ueno–Tokyoconventional line—to see they made thewrong choice. If the premise is that urbanrail services are important, conventionaltrack should have been constructed topermit trains on the Tohoku and Takasakilines (which terminate in Ueno) to offerthrough services to Tokyo Station andbeyond onto the Tokaido main line.Unfortunately, the decision makers did notrespect this premise.What about fares? If an urban railwaymakes key investments to improveservices and comfort, its operations willbe saddled with considerable costburdens. The result will be a short-term
increase in transport costs, and fares willprobably be raised. But the higher faresare offset by improved comfort andconvenience, so they cannot beconsidered as a simple fare increase. Mostpassengers will quickly understand thatquadruple track offers more advantagesthan double track, and will tend to useand appreciate it over the long term.When assessing an application for a fareincrease, overall capital investments arenow calculated under the rate-basedmethod. However, three of the JRcompanies have never increased theirfares since 1987. At one time, theybelieved that the price-cap method offeredadvantages and were keen to have itadopted. However, they abandoned thisposition later when it became obvious thatprice caps would not be to their benefitgiven the subsequent price deflation. JREast’s president once claimed that railwayfares should be determined not on thebasis of cost, but according to what thecompetitive market could bear. It wouldbe interesting to know his position today!Given today ’s stagnant economicconditions it is doubtful whether railwayfares are competitive with motor transport.Trains have the competitive advantageonly when transporting commuters andstudents. It can be argued that railwaysare more likely to survive if they increaseridership by reducing fares in marketswhere they are not competitive, and byraising fares in markets where they havea competitive edge.Clearly, the future of urban railways willnot be secure unless new fare structuresare developed. �


![[01]UNCOPUOS SentinelAsia Final · Sep. 1993 Tokyo, Japan Tokyo, Japan Tokyo, Japan Tokyo, Japan Ulanbator, Mongolia Tsukuba, Japan Tokyo, Japan Kuala Lumpur, Malaysia Daejeon, Korea](https://img.pdfslide.net/doc/110x75/600d276b3d3e78250500e5e2/01uncopuos-sentinelasia-final-sep-1993-tokyo-japan-tokyo-japan-tokyo-japan.jpg)


![[Urban transportation] city presentation tokyo(japan)](https://img.pdfslide.net/doc/110x75/55a2debc1a28abb7558b4771/urban-transportation-city-presentation-tokyojapan.jpg)