Embed Size (px)
Citation preview
RESPONSE TO NUTRIENT LOAD REDUCTIONS IN A TEMPERATE
ESTUARY
Jason Krumholz, Candace Oviatt, Leslie SmithNEERS
4/13/2012
TALK LAYOUT
• Introduction and Background• How have inputs to the Bay changed?• How does this impact the standing stocks?• Do we see changes in biology?• What does it mean/Why do we care?
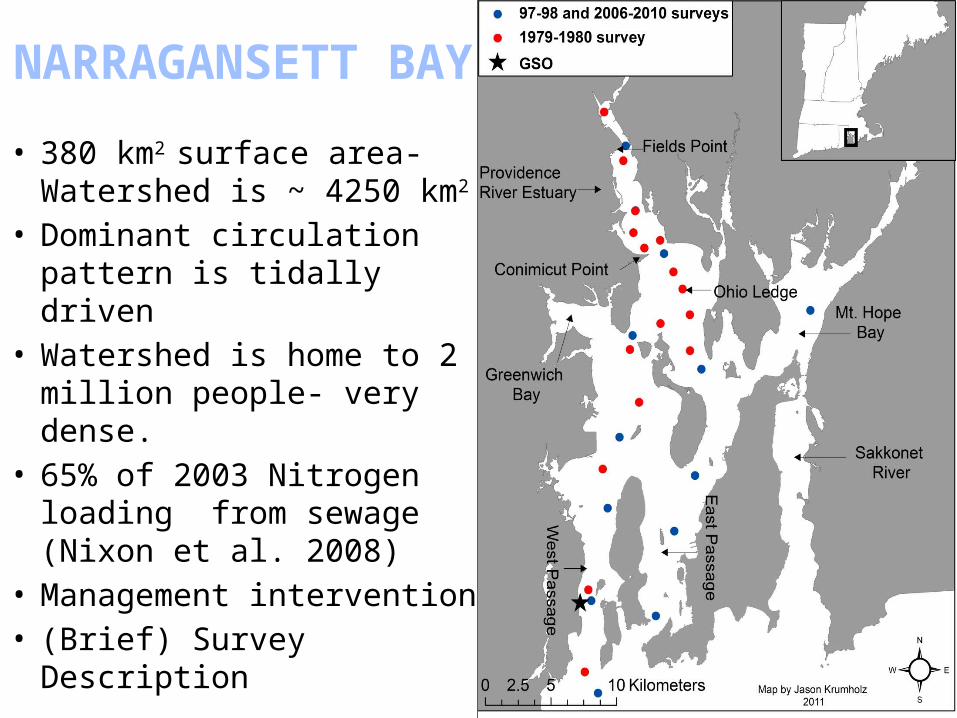
• 380 km2 surface area-Watershed is ~ 4250 km2
• Dominant circulation pattern is tidally driven
• Watershed is home to 2 million people- very dense.
• 65% of 2003 Nitrogen loading from sewage (Nixon et al. 2008)
• Management intervention • (Brief) Survey Description
NARRAGANSETT BAY
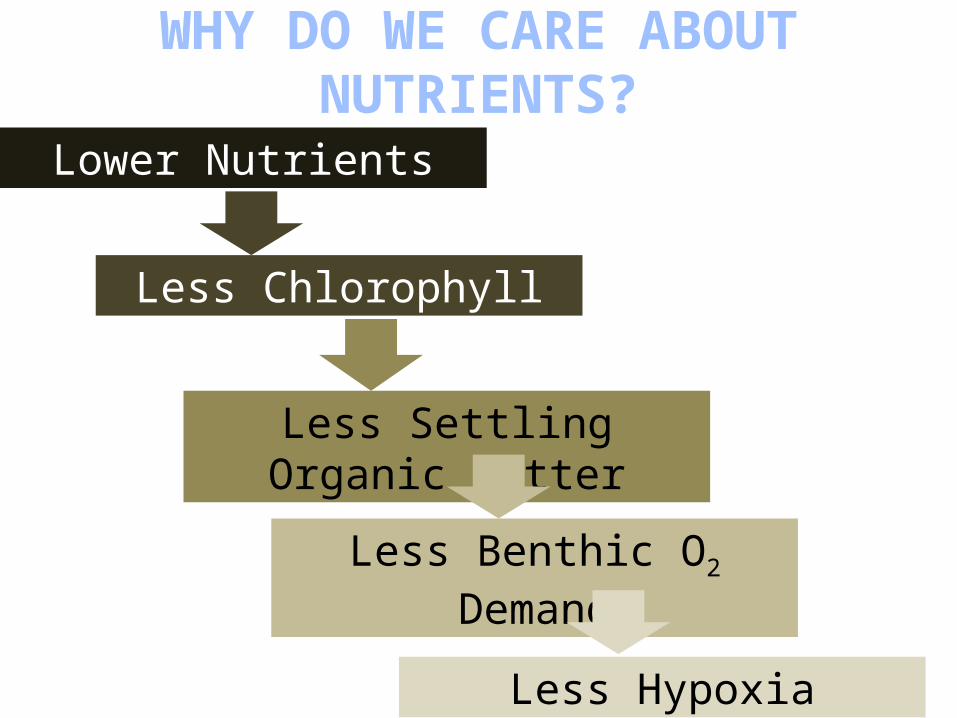
WHY DO WE CARE ABOUT NUTRIENTS?
Lower Nutrients
Less Chlorophyll
Less Settling Organic Matter
Less Benthic O2 Demand
Less Hypoxia
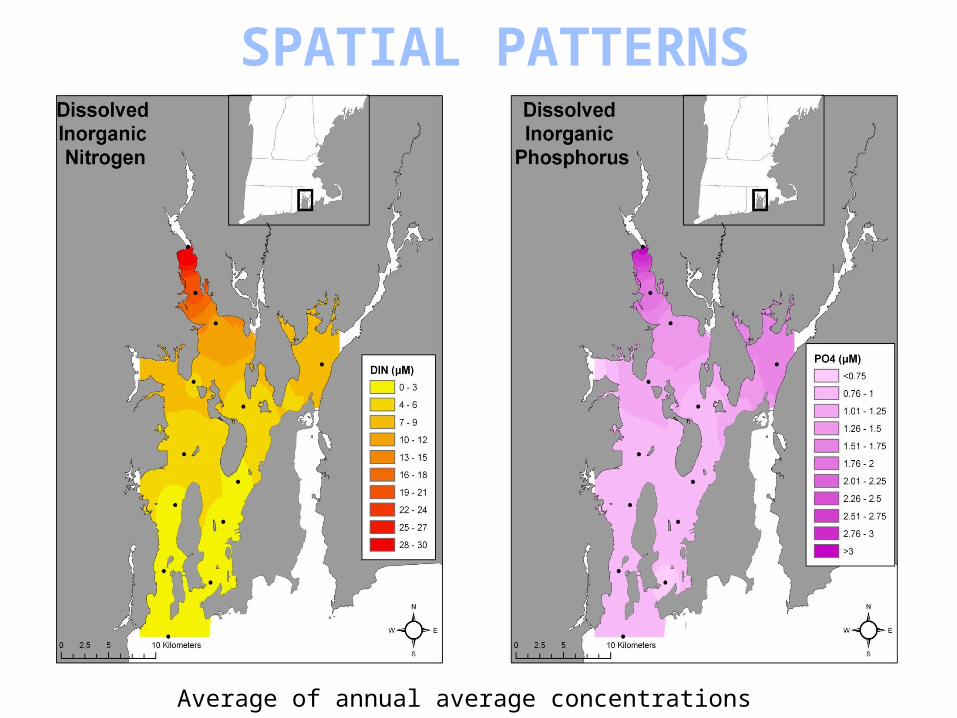
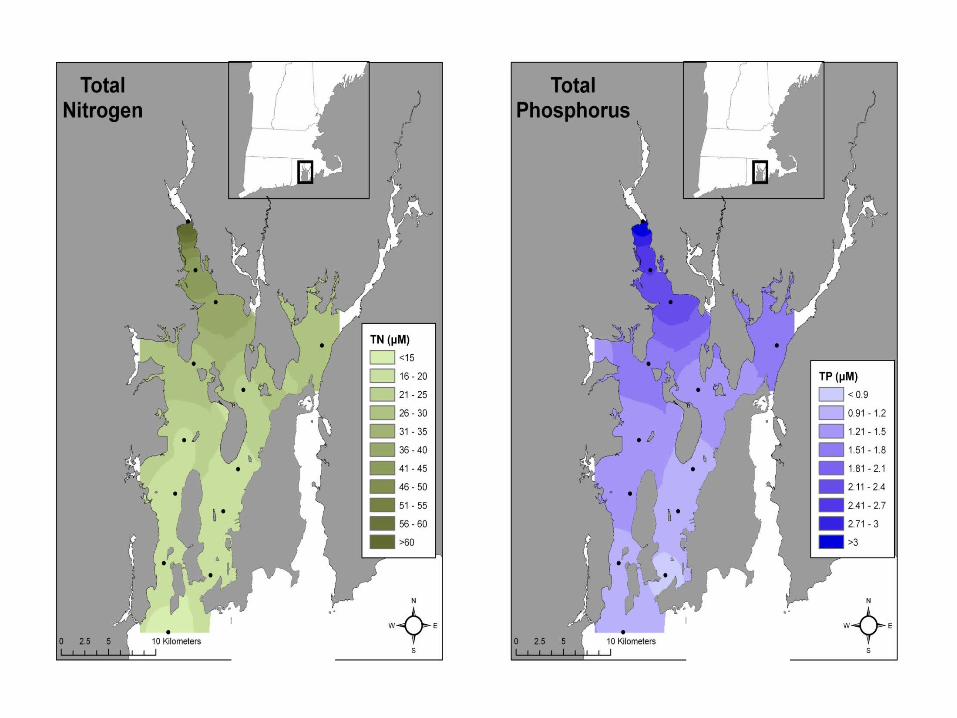
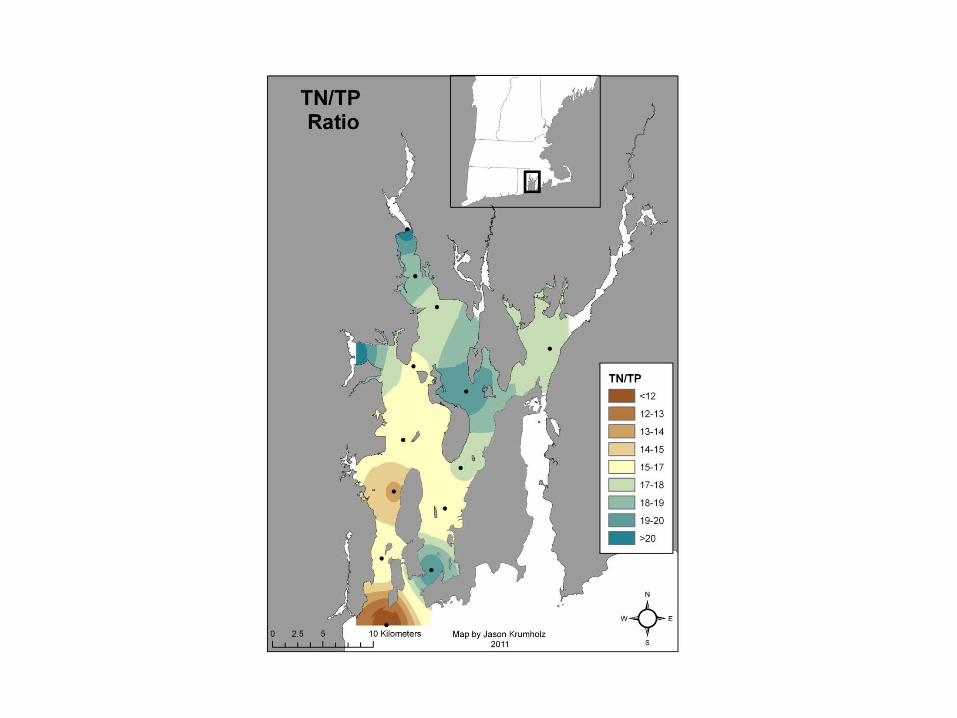
SPATIAL PATTERNS
Average of annual average concentrations (2006-2010)
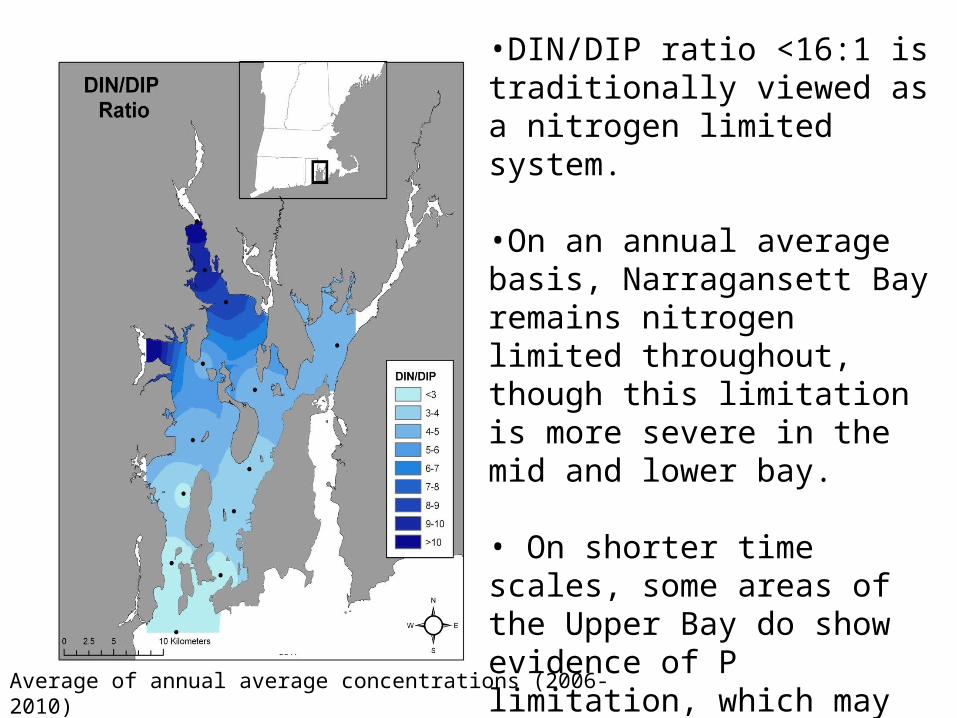
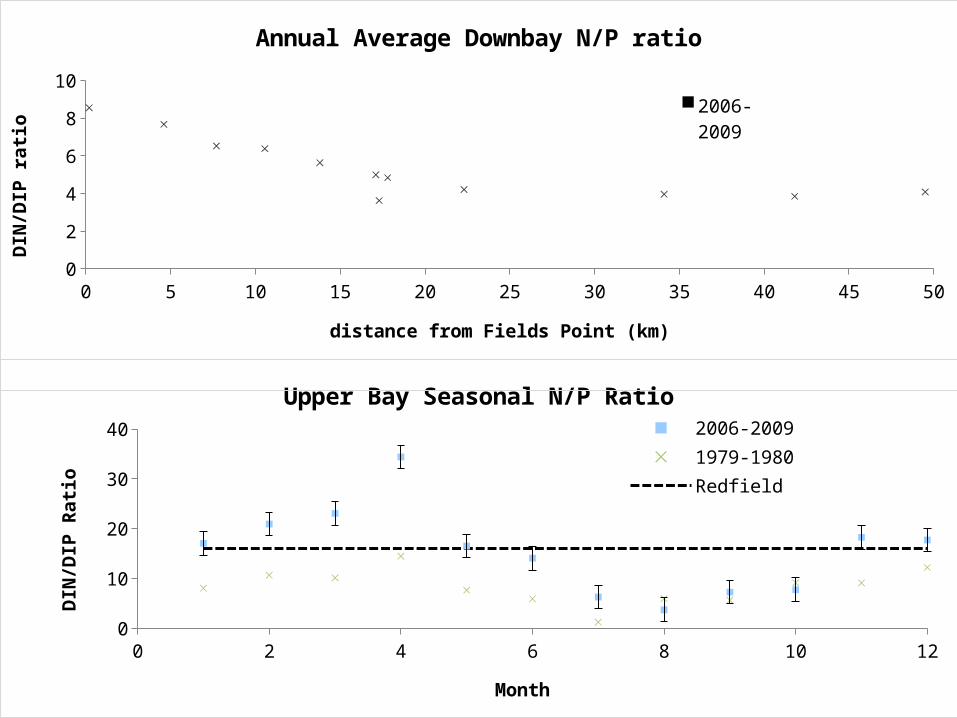
•DIN/DIP ratio <16:1 is traditionally viewed as a nitrogen limited system.
•On an annual average basis, Narragansett Bay remains nitrogen limited throughout, though this limitation is more severe in the mid and lower bay.
• On shorter time scales, some areas of the Upper Bay do show evidence of P limitation, which may become even more important as N inputs continue to drop.
Average of annual average concentrations (2006-2010)
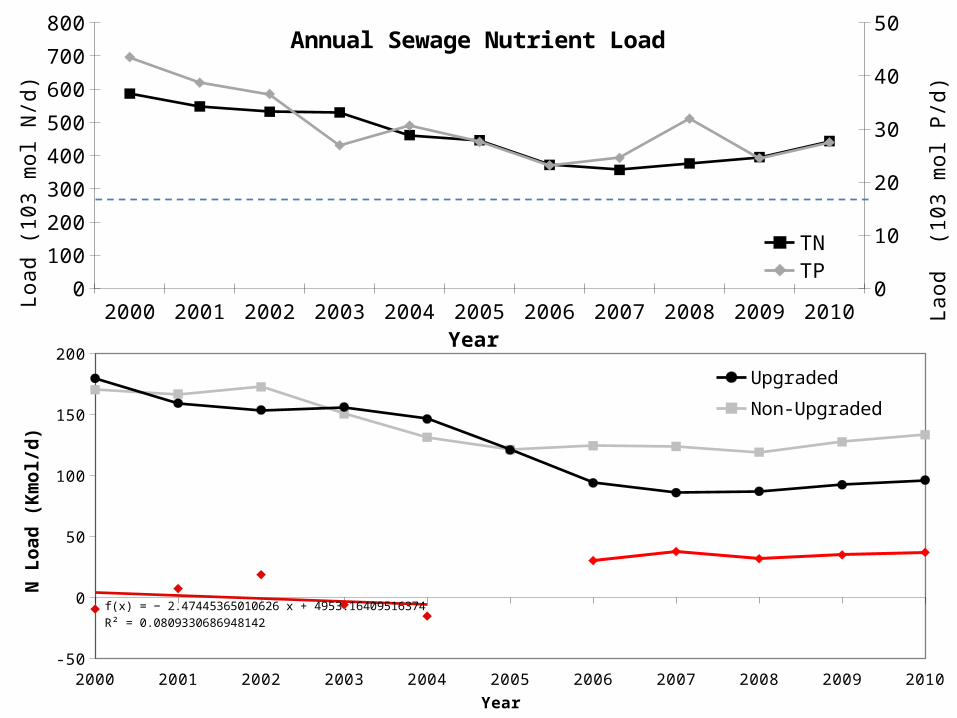
2000 2001 2002 2003 2004 2005 2006 2007 2008 2009 2010-50
0
50
100
150
200
f(x) = − 2.47445365010626 x + 4953.16409516374R² = 0.0809330686948142
Upgraded
Non-Upgraded
Year
N L
oad
(K
mol/
d)
2000 2001 2002 2003 2004 2005 2006 2007 2008 2009 20100
100
200
300
400
500
600
700
800
05101520253035404550
Annual Sewage Nutrient Load
TNTP
Year
Lo
ad
(1
03
mo
l N/d
)
La
od
(1
03
mo
l P/d
)
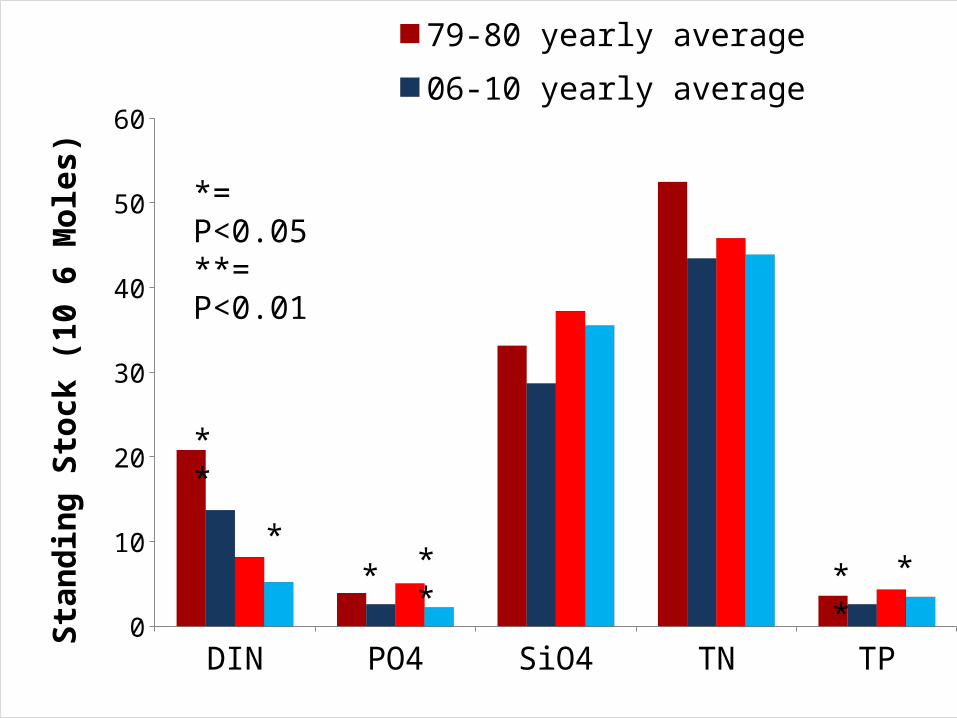
DIN PO4 SiO4 TN TP0
10
20
30
40
50
60
79-80 yearly average 06-10 yearly average
79-80 summer average 06-10 summer averageSt
andi
ng S
tock
(10
6 M
oles
)
**
** ** ** *
*= P<0.05**= P<0.01
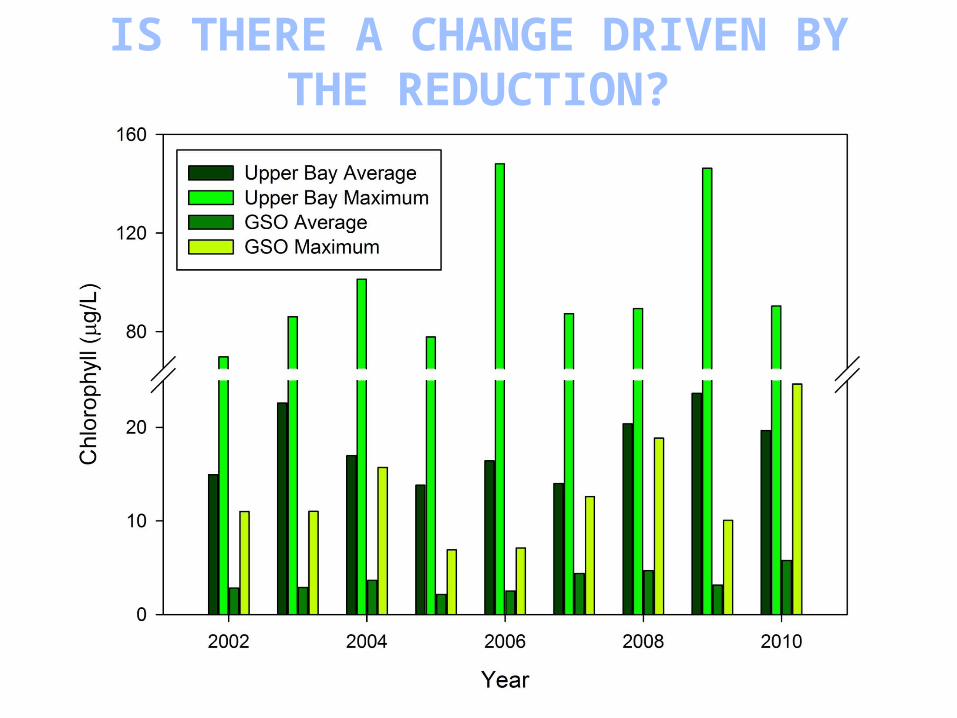
IS THERE A CHANGE DRIVEN BY THE REDUCTION?
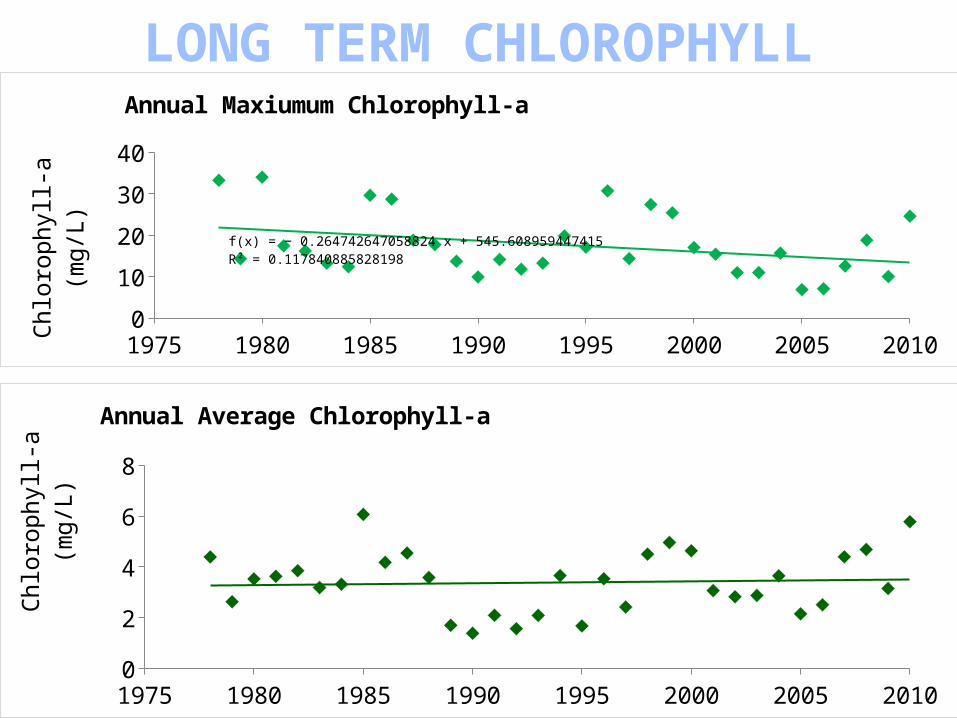
1975 1980 1985 1990 1995 2000 2005 20100
10
20
30
40
f(x) = − 0.264742647058824 x + 545.608959447415R² = 0.117840885828198
Annual Maxiumum Chlorophyll-a
Chlo
roph
yll-a
(mg/
L)
1975 1980 1985 1990 1995 2000 2005 201001234567
Annual Average Chlorophyll-a
Chlo
roph
yll-a
(mg/
L)LONG TERM CHLOROPHYLL
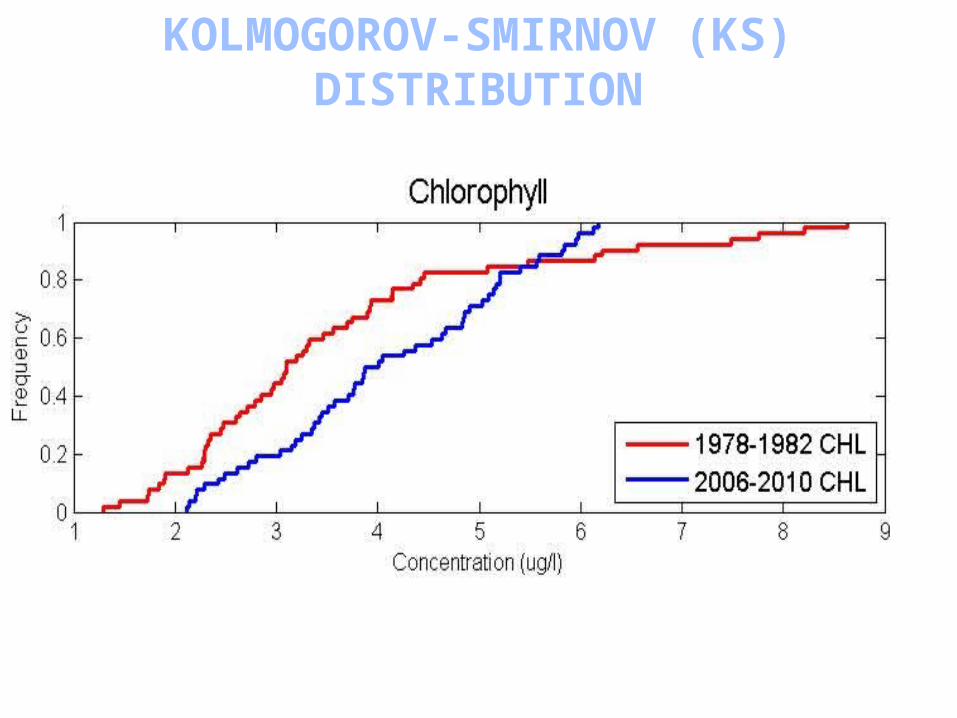
KOLMOGOROV-SMIRNOV (KS) DISTRIBUTION
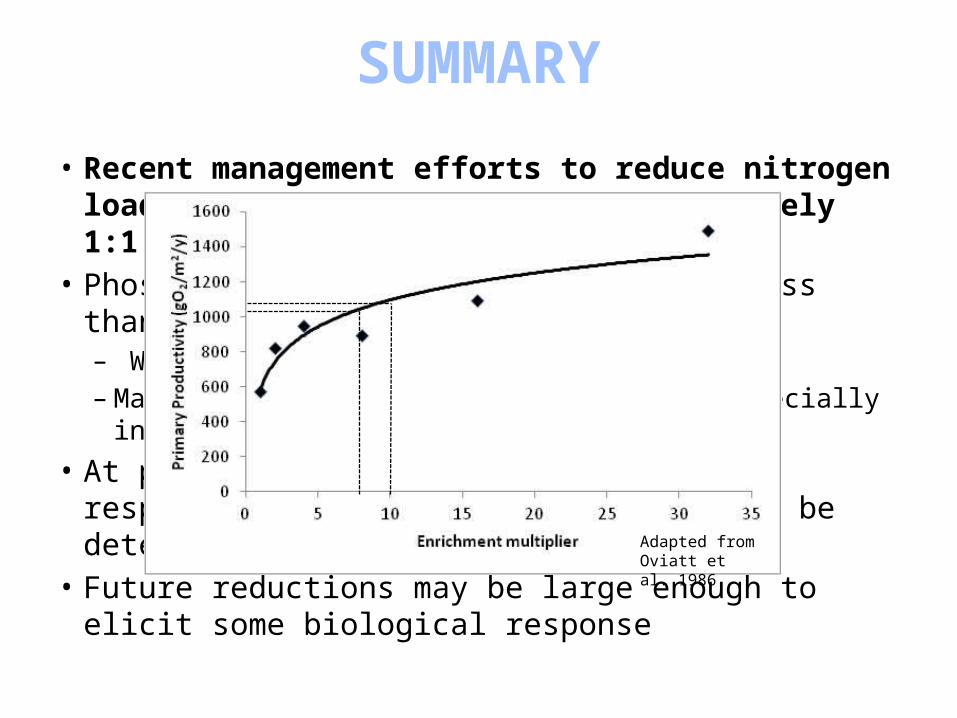
SUMMARY
• Recent management efforts to reduce nitrogen loading have resulted in an approximately 1:1 reduction in standing stock.
• Phosphorus loads are already 30-50% less than peak levels. – WWTF & non-point sources– May become more important to biology, especially in
upper bay. • At present, no or minimal biological response to the
loading reductions can be detected.• Future reductions may be large enough to elicit some
biological response
Adapted from Oviatt et al. 1986

Rossie Ennis Leslie Smith Scott NixonAngelo Liberti Steve Granger Ashley BertrandCatherine Walker Brooke Longval Christine ComeauDanielle Dionne Jamie Vaudrey Conor McManusChris Melrose & NOAA/DEM Shuttle TeamFunding Support: NOAA CHRP - Libby Jewett & Alan Lewitus, Project Officers
NOAA Bay Window – Sarah Pike, Project Officer
ReferencesOviatt, C. (1980). Some aspects of water quality in and pollution sources to the Providence River. In R. Pastore, Report for Region 1 EPA. September 1979-September 1980. Boston, MA: United States Environmental Protection Agency.
Oviatt, C., Keller, A., & Reed, L. (2002) Annual primary production in Narragansett Bay with no bay-wide winter-spring phytoplankton bloom. Estuarine Coastal and Shelf Science, 54, 1013-1026.
Nixon, S.W., Buckley, B.A., Granger, S.L., Harris, L.A., Oczkowski, A.J., Fulweiler, R.W., & Cole, L.W. (2008). Nitrogen and Phosphorus Inputs to Narragansett Bay: Past, Present, and Future. In B. Costa-Pierce, & A. Desbonnet, Science for Ecosystem-based Management (pp. 101-175). New York: Springer.
Kremer, J. N., J. M. P. Vaudrey, D. S. Ullman, D. L. Bergondo, N. LaSota, C. Kincaid, D. L. Codiga, and M. J. Brush. 2010. Simulating property exchange in estuarine ecosystem models at ecologically appropriate scales. Ecological Modelling 221:1080-1088.
ACKNOQWLEDGEMENTS
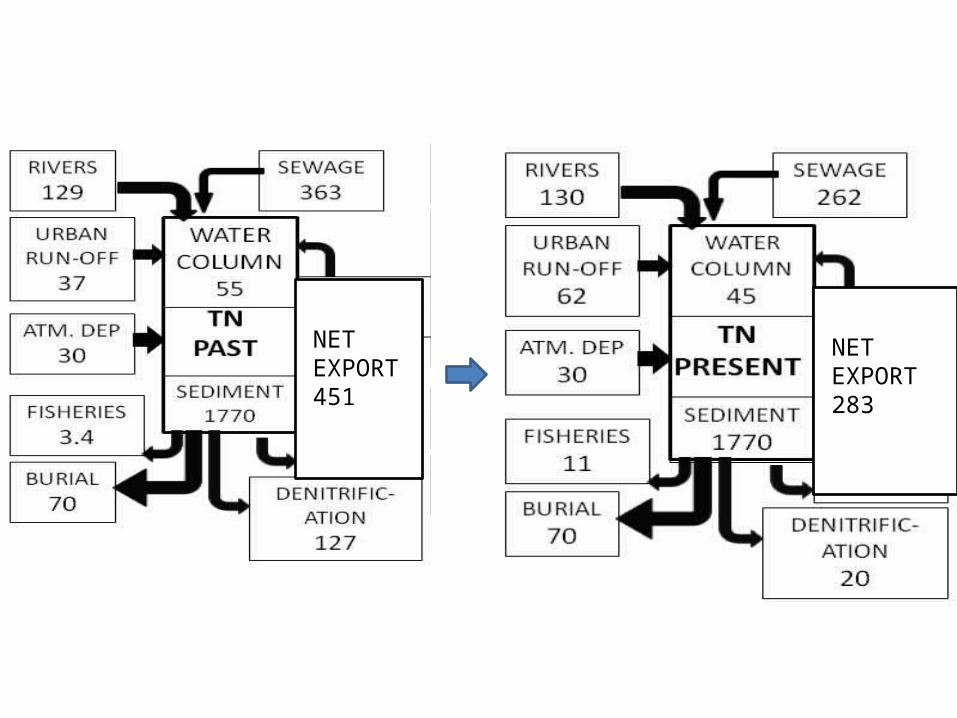
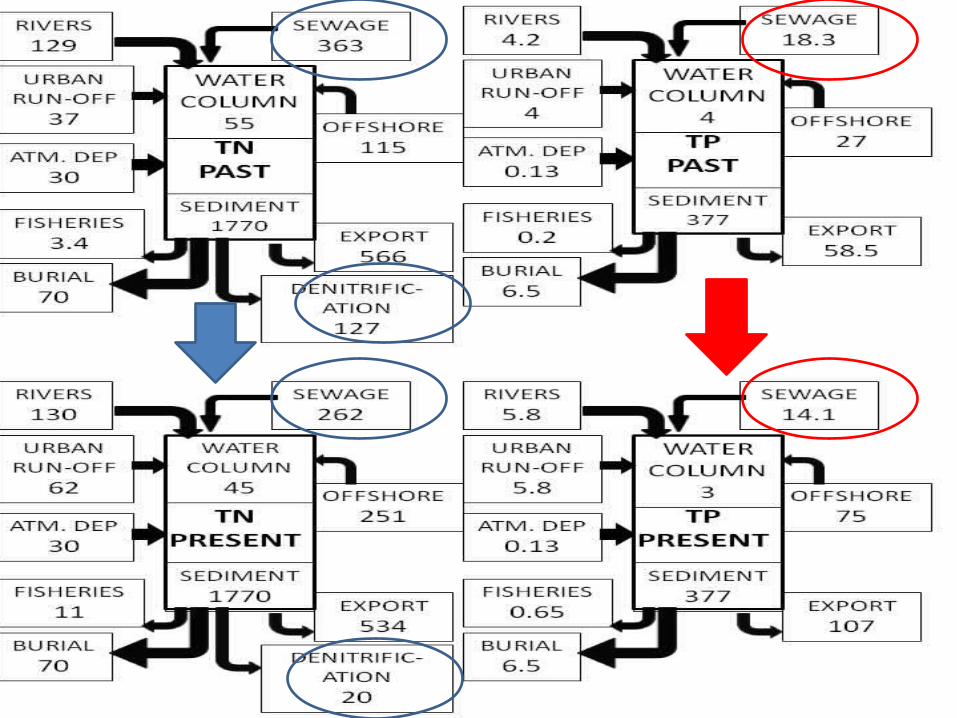
NET EXPORT283
NET EXPORT451
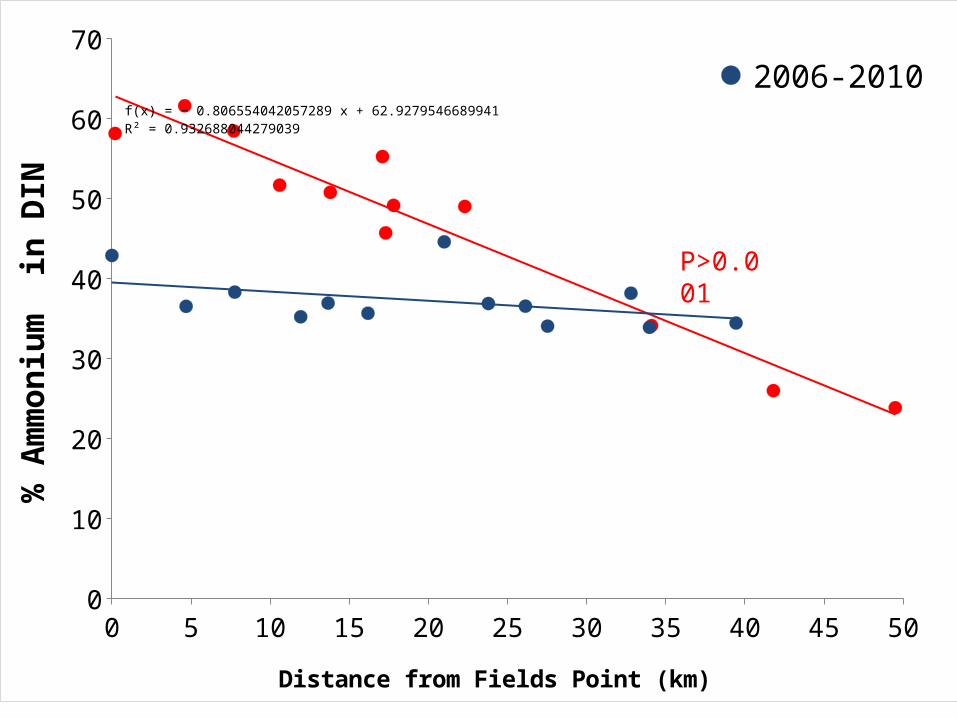
0 5 10 15 20 25 30 35 40 45 500
10
20
30
40
50
60
70
f(x) = − 0.806554042057289 x + 62.9279546689941R² = 0.932688044279039
2006-2010 Linear (2006-2010 )1979-1980
Distance from Fields Point (km)
% A
mm
oniu
m i
n D
IN
P>0.001

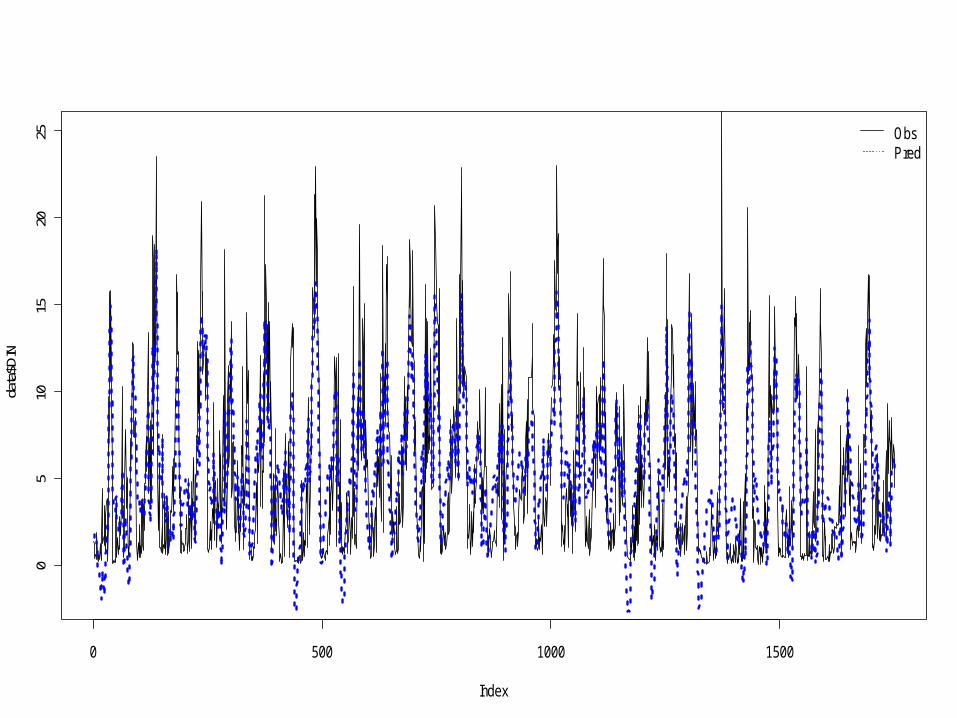
0 500 1000 1500
05
1015
2025
Index
data
$DIN
ObsPred
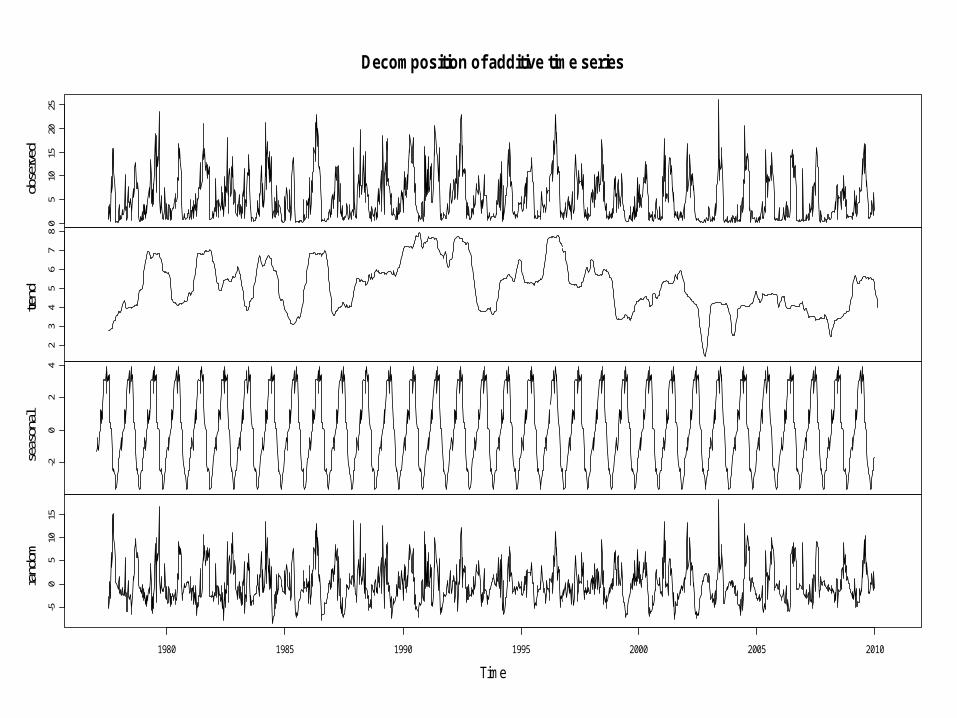
05
1015
2025
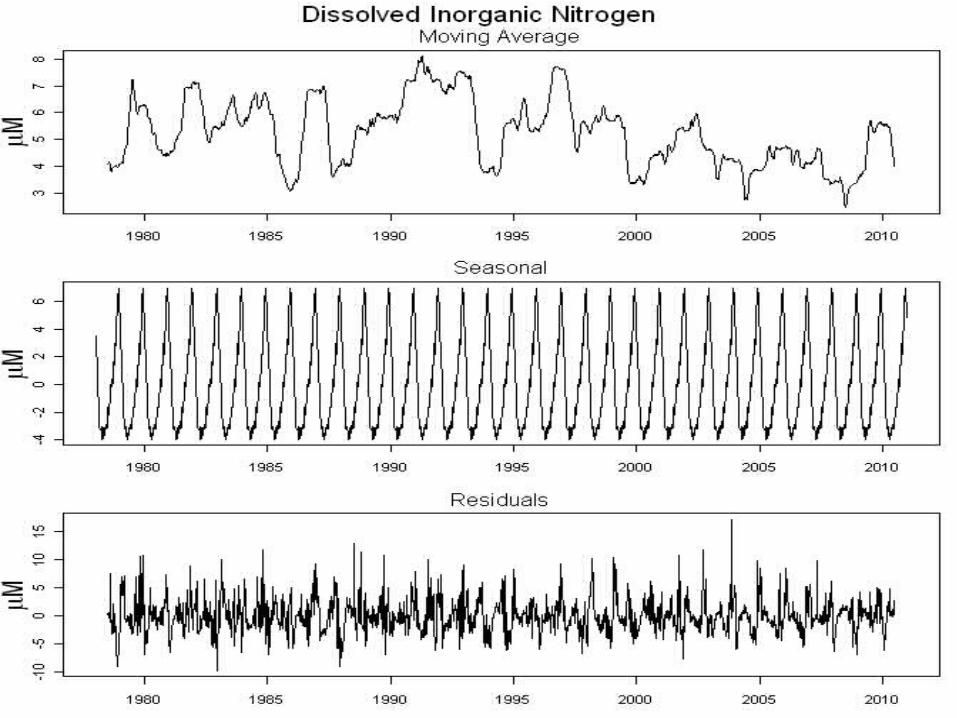
obse
rved
23
45
67
8
trend
-20
24
seas
onal
-50
510
15
1980 1985 1990 1995 2000 2005 2010
rand
om
Time
Decomposition of additive time series
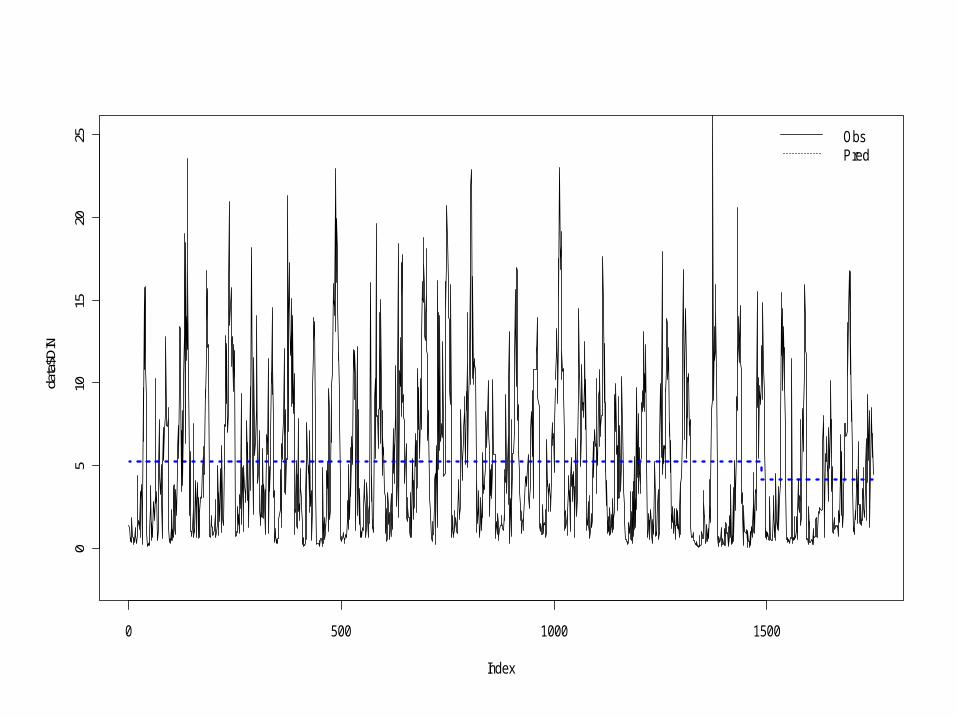
0 500 1000 1500
05
1015
2025
Index
data
$DIN
ObsPred
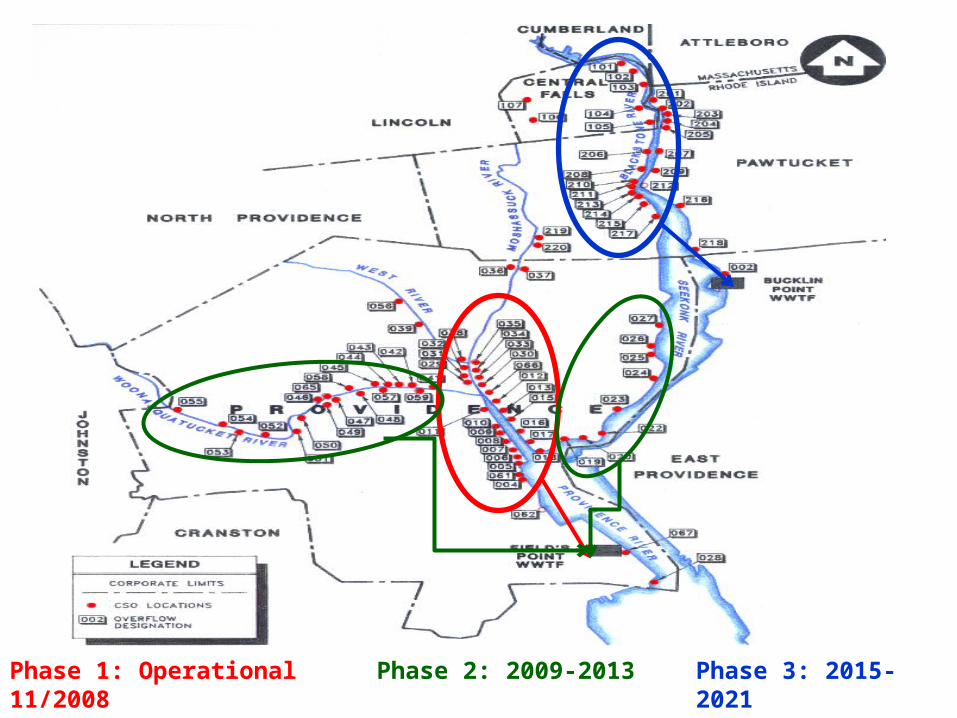
Phase 1: Operational 11/2008 Phase 2: 2009-2013 Phase 3: 2015-2021
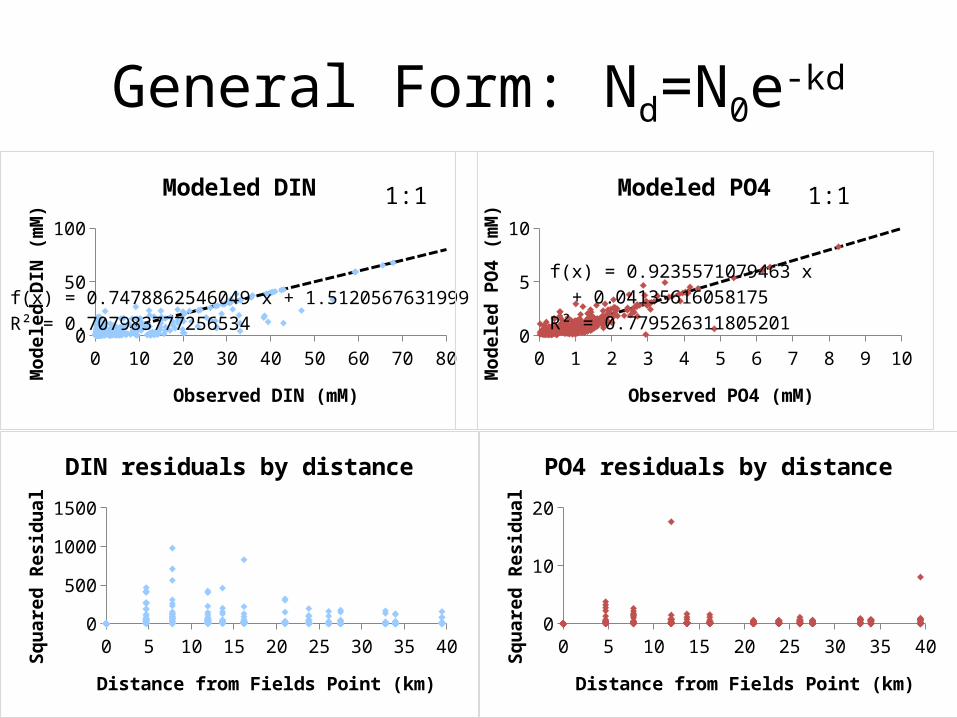
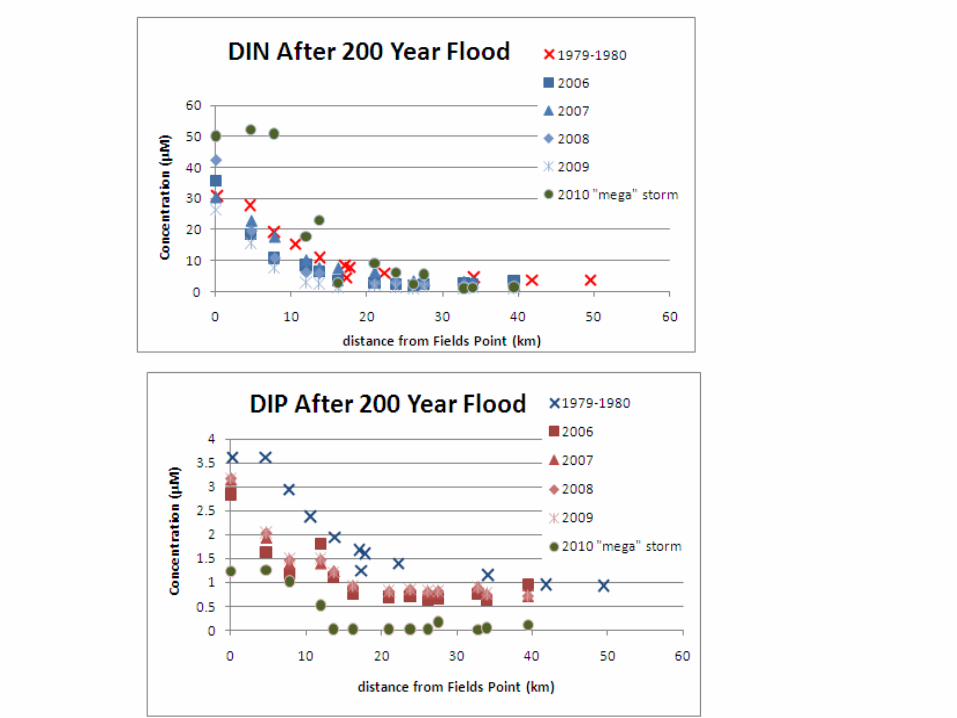
General Form: Nd=N0e-kd
0 10 20 30 40 50 60 70 800
20406080
100
f(x) = 0.747886254604885 x + 1.51205676319991R² = 0.707983777256534
Modeled DIN
Observed DIN (mM)
Mod
eled
DIN
(mM
)
0 1 2 3 4 5 6 7 8 9 1002468
10
f(x) = 0.923557107946304 x + 0.041356160581749R² = 0.779526311805201
Modeled PO4
Observed PO4 (mM)
Mod
eled
PO
4 (m
M)
1:1 1:1
0 5 10 15 20 25 30 35 400
200400600800
10001200
DIN residuals by distance
Distance from Fields Point (km)
Squa
red
Resi
dual
0 5 10 15 20 25 30 35 400
5
10
15
20
PO4 residuals by distance
Distance from Fields Point (km)
Squa
red
Resi
dual
0 2 4 6 8 10 1205
10152025303540
Upper Bay Seasonal N/P Ratio
2006-20091979-1980Redfield
Month
DIN
/DIP
Rati
o
0 5 10 15 20 25 30 35 40 45 500123456789
Annual Average Downbay N/P ratio
2006-2009
1979-1980
distance from Fields Point (km)
DIN
/DIP
ratio
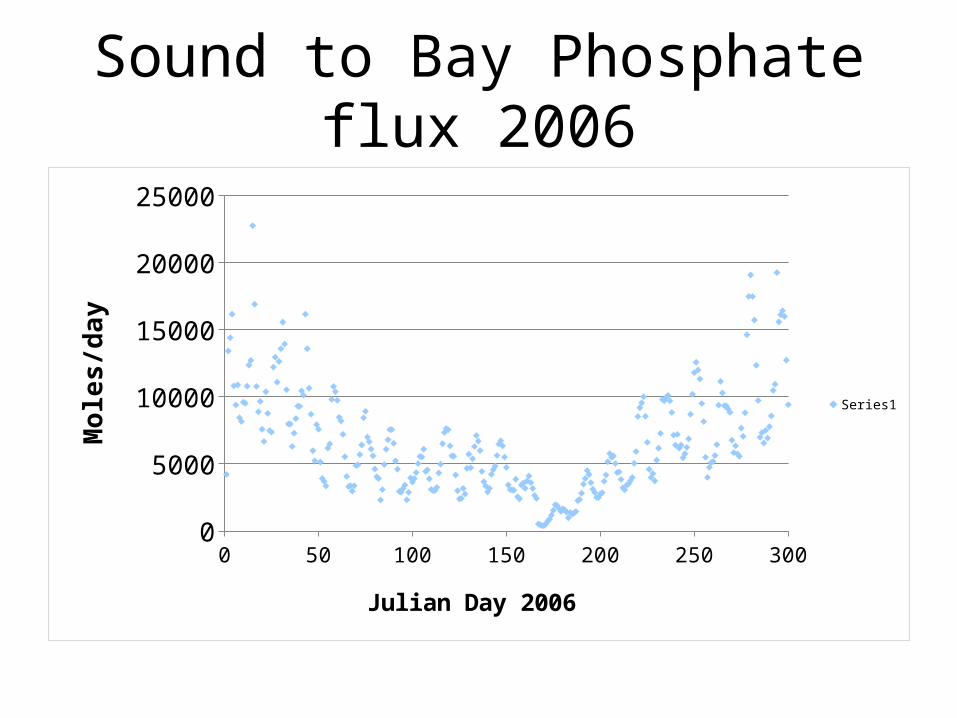
Sound to Bay Phosphate flux 2006
0 50 100 150 200 250 3000
5000
10000
15000
20000
25000
Series1
Julian Day 2006
Mol
es/d
ay
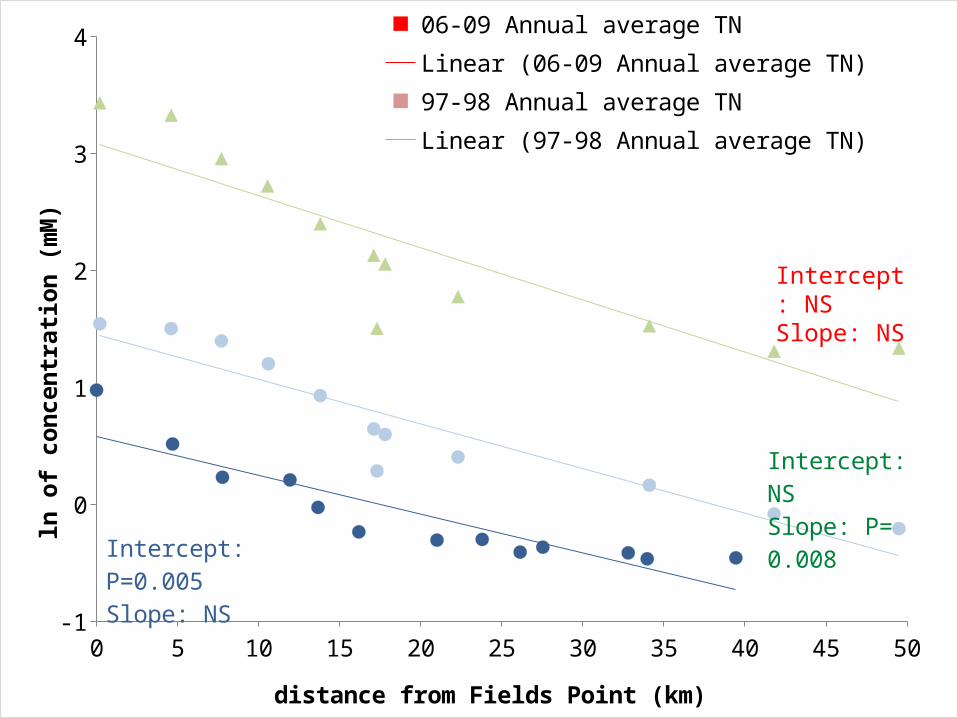
0 5 10 15 20 25 30 35 40 45 50-1
0
1
2
3
406-09 Annual average TNLinear (06-09 Annual average TN)97-98 Annual average TNLinear (97-98 Annual average TN) 06-09 annual average DINLinear ( 06-09 annual average DIN)
distance from Fields Point (km)
ln o
f con
cent
ratio
n (m
M)
Intercept: NSSlope: P= 0.008
Intercept: P=0.005Slope: NS
Intercept: NSSlope: NS

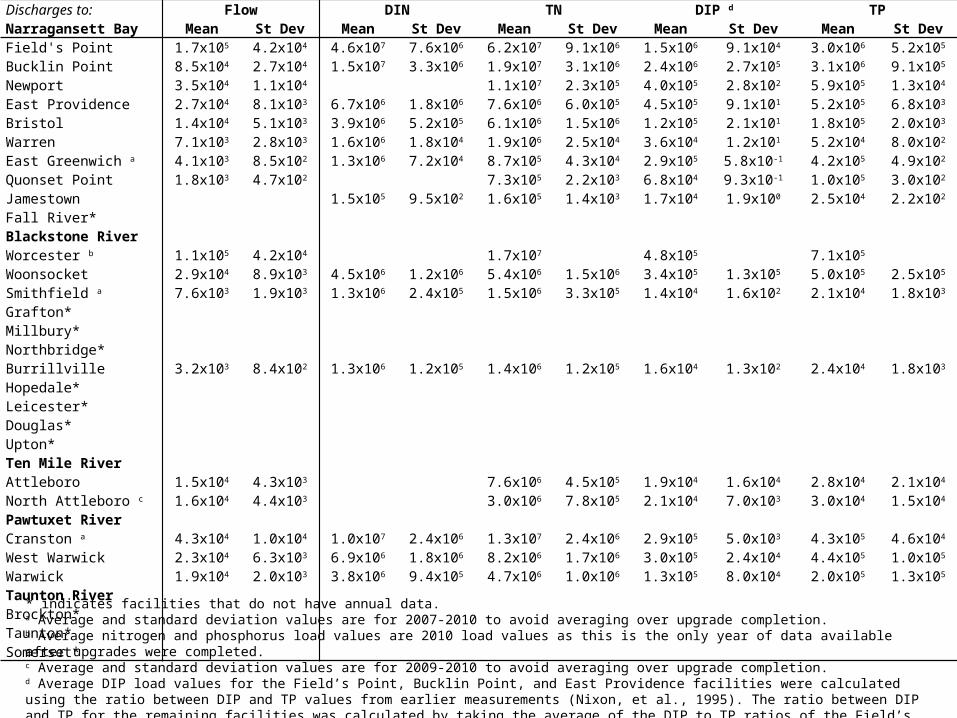
Discharges to: Flow DIN TN DIP d TPNarragansett Bay Mean St Dev Mean St Dev Mean St Dev Mean St Dev Mean St DevField's Point 1.7x10⁵ 4.2x10⁴ 4.6x10⁷ 7.6x10⁶ 6.2x10⁷ 9.1x10⁶ 1.5x10⁶ 9.1x10⁴ 3.0x10⁶ 5.2x10⁵
Bucklin Point 8.5x10⁴ 2.7x10⁴ 1.5x10⁷ 3.3x10⁶ 1.9x10⁷ 3.1x10⁶ 2.4x10⁶ 2.7x10⁵ 3.1x10⁶ 9.1x10⁵
Newport 3.5x10⁴ 1.1x10⁴ 1.1x10⁷ 2.3x10⁵ 4.0x10⁵ 2.8x10² 5.9x10⁵ 1.3x10⁴
East Providence 2.7x10⁴ 8.1x10³ 6.7x10⁶ 1.8x10⁶ 7.6x10⁶ 6.0x10⁵ 4.5x10⁵ 9.1x101 5.2x10⁵ 6.8x10³
Bristol 1.4x10⁴ 5.1x10³ 3.9x10⁶ 5.2x10⁵ 6.1x10⁶ 1.5x10⁶ 1.2x10⁵ 2.1x101 1.8x10⁵ 2.0x10³
Warren 7.1x10³ 2.8x10³ 1.6x10⁶ 1.8x10⁴ 1.9x10⁶ 2.5x10⁴ 3.6x10⁴ 1.2x101 5.2x10⁴ 8.0x10²
East Greenwich a 4.1x10³ 8.5x10² 1.3x10⁶ 7.2x10⁴ 8.7x10⁵ 4.3x10⁴ 2.9x10⁵ 5.8x10⁻¹ 4.2x10⁵ 4.9x10²
Quonset Point 1.8x10³ 4.7x10² 7.3x10⁵ 2.2x10³ 6.8x10⁴ 9.3x10⁻¹ 1.0x10⁵ 3.0x10²
Jamestown 1.5x10⁵ 9.5x10² 1.6x10⁵ 1.4x10³ 1.7x10⁴ 1.9x100 2.5x10⁴ 2.2x10²
Fall River*Blackstone RiverWorcester b 1.1x10⁵ 4.2x10⁴ 1.7x10⁷ 4.8x10⁵ 7.1x10⁵
Woonsocket 2.9x10⁴ 8.9x10³ 4.5x10⁶ 1.2x10⁶ 5.4x10⁶ 1.5x10⁶ 3.4x10⁵ 1.3x10⁵ 5.0x10⁵ 2.5x10⁵
Smithfield a 7.6x10³ 1.9x10³ 1.3x10⁶ 2.4x10⁵ 1.5x10⁶ 3.3x10⁵ 1.4x10⁴ 1.6x10² 2.1x10⁴ 1.8x10³
Grafton*Millbury*Northbridge*Burrillville 3.2x10³ 8.4x10² 1.3x10⁶ 1.2x10⁵ 1.4x10⁶ 1.2x10⁵ 1.6x10⁴ 1.3x10² 2.4x10⁴ 1.8x10³
Hopedale*Leicester*Douglas*Upton*Ten Mile RiverAttleboro 1.5x10⁴ 4.3x10³ 7.6x10⁶ 4.5x10⁵ 1.9x10⁴ 1.6x10⁴ 2.8x10⁴ 2.1x10⁴
North Attleboro c 1.6x10⁴ 4.4x10³ 3.0x10⁶ 7.8x10⁵ 2.1x10⁴ 7.0x10³ 3.0x10⁴ 1.5x10⁴
Pawtuxet RiverCranston a 4.3x10⁴ 1.0x10⁴ 1.0x10⁷ 2.4x10⁶ 1.3x10⁷ 2.4x10⁶ 2.9x10⁵ 5.0x10³ 4.3x10⁵ 4.6x10⁴
West Warwick 2.3x10⁴ 6.3x10³ 6.9x10⁶ 1.8x10⁶ 8.2x10⁶ 1.7x10⁶ 3.0x10⁵ 2.4x10⁴ 4.4x10⁵ 1.0x10⁵
Warwick 1.9x10⁴ 2.0x10³ 3.8x10⁶ 9.4x10⁵ 4.7x10⁶ 1.0x10⁶ 1.3x10⁵ 8.0x10⁴ 2.0x10⁵ 1.3x10⁵
Taunton RiverBrockton*Taunton*Somerset*
* indicates facilities that do not have annual data.a Average and standard deviation values are for 2007-2010 to avoid averaging over upgrade completion.b Average nitrogen and phosphorus load values are 2010 load values as this is the only year of data available after upgrades were completed.c Average and standard deviation values are for 2009-2010 to avoid averaging over upgrade completion.d Average DIP load values for the Field’s Point, Bucklin Point, and East Providence facilities were calculated using the ratio between DIP and TP values from earlier measurements (Nixon, et al., 1995). The ratio between DIP and TP for the remaining facilities was calculated by taking the average of the DIP to TP ratios of the Field’s Point, Bucklin Point, and East Providence facilities. Average DIP load values for the remaining facilities were calculated using this average ratio.
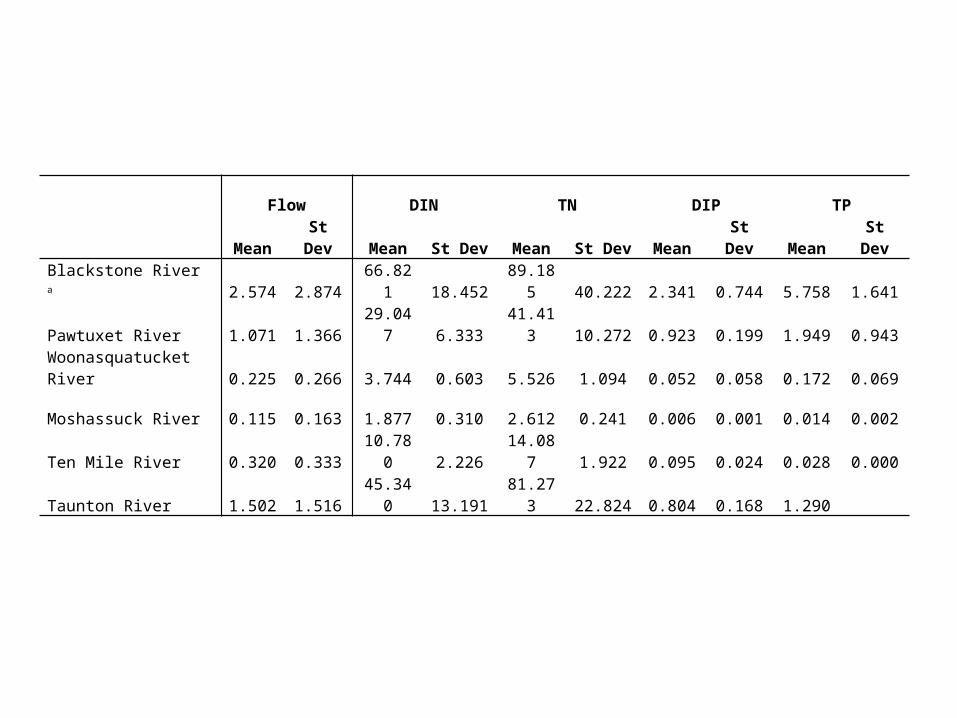
Flow DIN TN DIP TP
Mean St Dev Mean St Dev Mean St Dev Mean St Dev Mean St Dev
Blackstone River a 2.574 2.874 66.821 18.452 89.185 40.222 2.341 0.744 5.758 1.641
Pawtuxet River 1.071 1.366 29.047 6.333 41.413 10.272 0.923 0.199 1.949 0.943
Woonasquatucket River 0.225 0.266 3.744 0.603 5.526 1.094 0.052 0.058 0.172 0.069
Moshassuck River 0.115 0.163 1.877 0.310 2.612 0.241 0.006 0.001 0.014 0.002
Ten Mile River 0.320 0.333 10.780 2.226 14.087 1.922 0.095 0.024 0.028 0.000
Taunton River 1.502 1.516 45.340 13.191 81.273 22.824 0.804 0.168 1.290
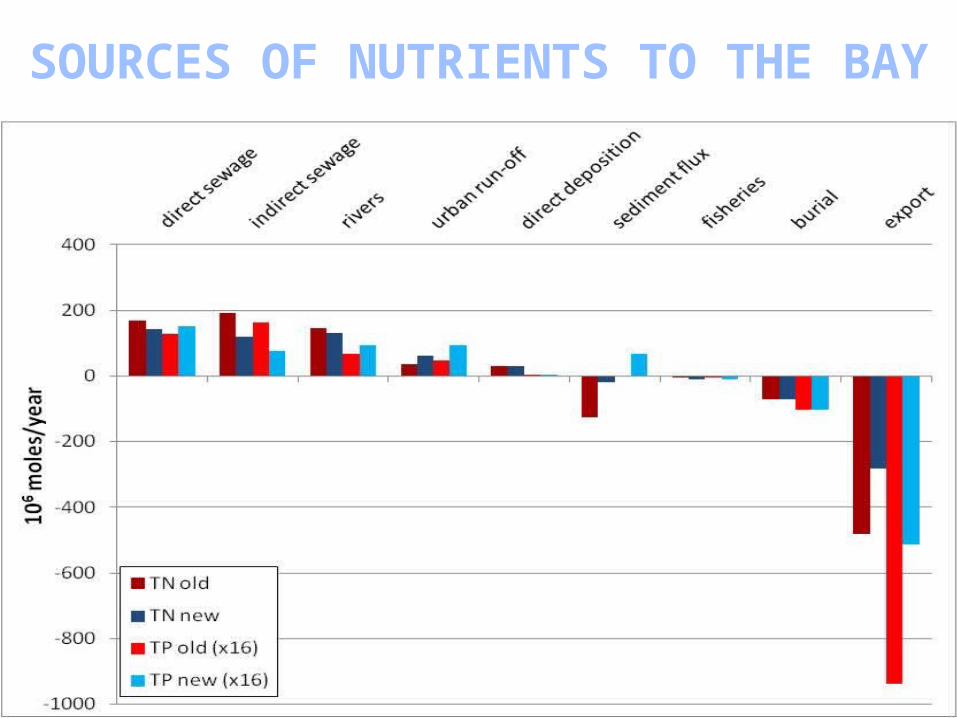
SOURCES OF NUTRIENTS TO THE BAY
Discharges to: Flow DIN TN DIP d TPNarragansett Bay Mean St Dev Mean St Dev Mean St Dev Mean St Dev Mean St DevField's Point 1.7x10⁵ 4.2x10⁴ 4.6x10⁷ 7.6x10⁶ 6.2x10⁷ 9.1x10⁶ 1.5x10⁶ 9.1x10⁴ 3.0x10⁶ 5.2x10⁵
Bucklin Point 8.5x10⁴ 2.7x10⁴ 1.5x10⁷ 3.3x10⁶ 1.9x10⁷ 3.1x10⁶ 2.4x10⁶ 2.7x10⁵ 3.1x10⁶ 9.1x10⁵
Newport 3.5x10⁴ 1.1x10⁴ 1.1x10⁷ 2.3x10⁵ 4.0x10⁵ 2.8x10² 5.9x10⁵ 1.3x10⁴
East Providence 2.7x10⁴ 8.1x10³ 6.7x10⁶ 1.8x10⁶ 7.6x10⁶ 6.0x10⁵ 4.5x10⁵ 9.1x101 5.2x10⁵ 6.8x10³
Bristol 1.4x10⁴ 5.1x10³ 3.9x10⁶ 5.2x10⁵ 6.1x10⁶ 1.5x10⁶ 1.2x10⁵ 2.1x101 1.8x10⁵ 2.0x10³
Warren 7.1x10³ 2.8x10³ 1.6x10⁶ 1.8x10⁴ 1.9x10⁶ 2.5x10⁴ 3.6x10⁴ 1.2x101 5.2x10⁴ 8.0x10²
East Greenwich a 4.1x10³ 8.5x10² 1.3x10⁶ 7.2x10⁴ 8.7x10⁵ 4.3x10⁴ 2.9x10⁵ 5.8x10⁻¹ 4.2x10⁵ 4.9x10²
Quonset Point 1.8x10³ 4.7x10² 7.3x10⁵ 2.2x10³ 6.8x10⁴ 9.3x10⁻¹ 1.0x10⁵ 3.0x10²
Jamestown 1.5x10⁵ 9.5x10² 1.6x10⁵ 1.4x10³ 1.7x10⁴ 1.9x100 2.5x10⁴ 2.2x10²
Fall River*Blackstone RiverWorcester b 1.1x10⁵ 4.2x10⁴ 1.7x10⁷ 4.8x10⁵ 7.1x10⁵
Woonsocket 2.9x10⁴ 8.9x10³ 4.5x10⁶ 1.2x10⁶ 5.4x10⁶ 1.5x10⁶ 3.4x10⁵ 1.3x10⁵ 5.0x10⁵ 2.5x10⁵
Smithfield a 7.6x10³ 1.9x10³ 1.3x10⁶ 2.4x10⁵ 1.5x10⁶ 3.3x10⁵ 1.4x10⁴ 1.6x10² 2.1x10⁴ 1.8x10³
Grafton*Millbury*Northbridge*Burrillville 3.2x10³ 8.4x10² 1.3x10⁶ 1.2x10⁵ 1.4x10⁶ 1.2x10⁵ 1.6x10⁴ 1.3x10² 2.4x10⁴ 1.8x10³
Hopedale*Leicester*Douglas*Upton*Ten Mile RiverAttleboro 1.5x10⁴ 4.3x10³ 7.6x10⁶ 4.5x10⁵ 1.9x10⁴ 1.6x10⁴ 2.8x10⁴ 2.1x10⁴
North Attleboro c 1.6x10⁴ 4.4x10³ 3.0x10⁶ 7.8x10⁵ 2.1x10⁴ 7.0x10³ 3.0x10⁴ 1.5x10⁴
Pawtuxet RiverCranston a 4.3x10⁴ 1.0x10⁴ 1.0x10⁷ 2.4x10⁶ 1.3x10⁷ 2.4x10⁶ 2.9x10⁵ 5.0x10³ 4.3x10⁵ 4.6x10⁴
West Warwick 2.3x10⁴ 6.3x10³ 6.9x10⁶ 1.8x10⁶ 8.2x10⁶ 1.7x10⁶ 3.0x10⁵ 2.4x10⁴ 4.4x10⁵ 1.0x10⁵
Warwick 1.9x10⁴ 2.0x10³ 3.8x10⁶ 9.4x10⁵ 4.7x10⁶ 1.0x10⁶ 1.3x10⁵ 8.0x10⁴ 2.0x10⁵ 1.3x10⁵
Taunton RiverBrockton*Taunton*Somerset*
* indicates facilities that do not have annual data.a Average and standard deviation values are for 2007-2010 to avoid averaging over upgrade completion.b Average nitrogen and phosphorus load values are 2010 load values as this is the only year of data available after upgrades were completed.c Average and standard deviation values are for 2009-2010 to avoid averaging over upgrade completion.d Average DIP load values for the Field’s Point, Bucklin Point, and East Providence facilities were calculated using the ratio between DIP and TP values from earlier measurements (Nixon, et al., 1995). The ratio between DIP and TP for the remaining facilities was calculated by taking the average of the DIP to TP ratios of the Field’s Point, Bucklin Point, and East Providence facilities. Average DIP load values for the remaining facilities were calculated using this average ratio.

Flow DIN TN DIP TP
Mean St Dev Mean St Dev Mean St Dev Mean St Dev Mean St Dev
Blackstone River a 2.574 2.874 66.821 18.452 89.185 40.222 2.341 0.744 5.758 1.641
Pawtuxet River 1.071 1.366 29.047 6.333 41.413 10.272 0.923 0.199 1.949 0.943
Woonasquatucket River 0.225 0.266 3.744 0.603 5.526 1.094 0.052 0.058 0.172 0.069
Moshassuck River 0.115 0.163 1.877 0.310 2.612 0.241 0.006 0.001 0.014 0.002
Ten Mile River 0.320 0.333 10.780 2.226 14.087 1.922 0.095 0.024 0.028 0.000
Taunton River 1.502 1.516 45.340 13.191 81.273 22.824 0.804 0.168 1.290

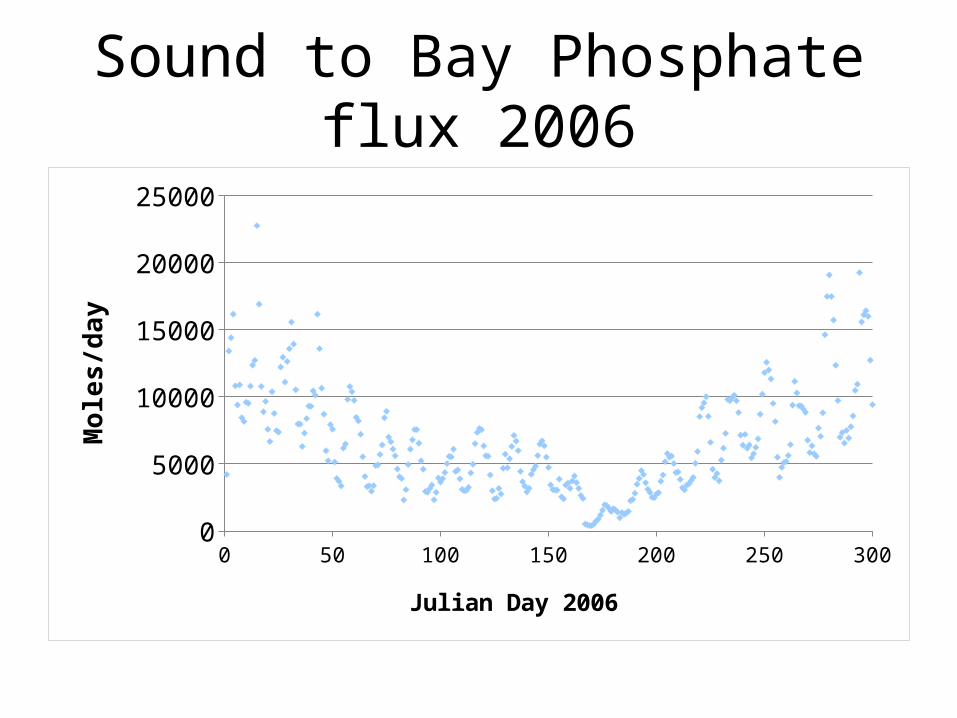
Sound to Bay Phosphate flux 2006
0 50 100 150 200 250 3000
5000
10000
15000
20000
25000
Julian Day 2006
Mol
es/d
ay