Embed Size (px)
Citation preview

1
Clinical Utility of On-Demand Multiplex Respiratory Pathogen Testing among Adult 1 Outpatients 2 3 Daniel A. Greena,b*, Letiana Hitoaliajc, Brian Kotanskyc, Sheldon M. Campbella,b, David 4 R. Peapera,b,# 5 6 Department of Laboratory Medicine, Yale School of Medicine, New Haven, CT, USAa; 7 Pathology and Laboratory Medicine Service, West Haven Veterans Administration 8 Hospital, West Haven, CT, USAb; Pharmacy Service, West Haven Veterans 9 Administration Hospital, West Haven, CT, USAc 10 11 12 Running Head: Utility of multiplex respiratory testing 13 * Current Address: Department of Pathology and Cell Biology, Columbia University 14 College of Physicians and Surgeons, New York, NY, USA. 15 #Address correspondence to David R. Peaper, [email protected] 16 17
JCM Accepted Manuscript Posted Online 21 September 2016J. Clin. Microbiol. doi:10.1128/JCM.01579-16Copyright © 2016, American Society for Microbiology. All Rights Reserved.
on August 30, 2018 by guest
http://jcm.asm
.org/D
ownloaded from

2
Abstract: (247 / 250) 18 19 Multiplex tests for respiratory tract infections include up to 20 targets for common 20 pathogens, predominantly viruses. A specific therapeutic intervention is available 21 for those testing positive for influenza viruses (oseltamivir), and it is potentially 22 beneficial to identify non-influenza viruses to avoid unnecessary antibiotic use. We 23 evaluated antimicrobial prescriptions following respiratory pathogen testing among 24 outpatients at a large Veterans Administration (VA) medical center. Results of the 25 FilmArray Respiratory Panel (Biofire, Salt Lake City, UT) from December 15, 2014 to 26 April 15, 2015 were evaluated among 408 outpatients, and patient medical records 27 were reviewed. Differences in antibiotic and oseltamivir prescription rates were 28 analyzed. Among 408 patients tested in outpatient centers (emergency department, 29 urgent care, and outpatient clinics), 295 (72.3%) were managed as outpatients. 30 Among these 295 outpatients, 105 (35.6%) tested positive for influenza, 109 31 (36.9%) tested positive for a non-influenza pathogen, and 81 (27.5%) had no 32 respiratory pathogen detected. Rates of oseltamivir and antibiotic prescriptions 33 were significantly different among the three test groups (Chi-squared = 167.6, p < 34 0.0001 and Chi-squared = 10.48, p = 0.005, respectively), but there was no 35 significant difference in antibiotic prescription rates between the non-influenza 36 pathogen group and those who tested negative (Chi-square = 0; p = 1.0). Among 37 adult outpatients, testing positive for influenza was associated with receiving fewer 38 antibiotic prescriptions, but no such effect was seen for those who tested positive 39 for a non-influenza virus. These data suggest that testing for influenza viruses alone 40
on August 30, 2018 by guest
http://jcm.asm
.org/D
ownloaded from

3
may be sufficient and more cost-effective than multiplex pathogen testing for 41 outpatients. 42 43 Introduction: 44 Respiratory tract infections are the most frequent cause of acute illness in 45 developed countries, with an estimated incidence of 500 million non-influenza viral 46 respiratory infections occurring annually in the United States (1, 2). The vast 47 majority of respiratory infections are caused by viruses, the most common of which 48 are rhinoviruses, coronaviruses, influenza viruses, respiratory syncytial virus (RSV), 49 parainfluenza virus, human metapneumovirus (hMPV), and adenovirus (3). These 50 infections account for a substantial proportion of outpatient medical visits and are 51 associated with an estimated $17.3 billion in direct annual costs, including more 52 than $1.1 billion spent on an estimated 41 million unnecessary antibiotic 53 prescriptions for viral infections (2). 54 Diagnosis of respiratory infections is largely based on clinical signs and 55 symptoms, since there are myriad viral etiologies that present with similar clinical 56 features. Although influenza infections may be treated with oseltamivir, no targeted 57 therapies are available for other respiratory viruses. The main challenge for health 58 care providers is to distinguish cases of the uncomplicated “common cold” from 59 influenza, bacterial community acquired pneumonia, secondary bacterial sinusitis, 60 otitis media, and streptococcal pharyngitis. Therefore, with the exception of testing 61 for influenza viruses, the value of testing for other viruses is predicated on 62 identifying a viral, non-bacterial etiology, and avoiding unnecessary antibiotic 63
on August 30, 2018 by guest
http://jcm.asm
.org/D
ownloaded from
4
usage. Techniques that have been used to identify specific viruses include viral 64 culture, direct fluorescent antibody (DFA) staining, rapid antigen determination 65 tests (RADT), and pathogen-specific PCR assays. However, each of these 66 methodologies has significant limitations (4): Viral culture and DFA are labor-67 intensive and require highly skilled laboratories, and culture results are not 68 available in time to affect patient management. Although they produce results much 69 faster, RADTs are relatively insensitive and pathogen-specific PCRs can only assess 70 for a single viral etiology. 71 Many of these limitations can be overcome with multiplex respiratory PCR 72 panels, which are increasingly being used in the outpatient setting for patients with 73 URIs. These tests can be simple to perform, provide rapid results, and can assay for 74 multiple organisms from a single sample. While the costs of these tests are 75 significantly greater than previously used methods, the added expense may be 76 justified if the results lead to improved patient outcomes and a reduction in overall 77 expenses, especially a reduction in the overuse of antibiotics. Many sites that have 78 implemented multiplexed respiratory virus testing use algorithms for testing 79 inpatients, the immunosuppressed, and/or those with severe underlying medical 80 problems. However, most antibiotics for respiratory tract infections are prescribed 81 in the outpatient setting. Therefore, the aim of this study is to evaluate if the results 82 provided by multiplex PCR testing affect outcome measures among adult 83 outpatients, especially those related to therapeutic management. 84 85 Methods: 86
on August 30, 2018 by guest
http://jcm.asm
.org/D
ownloaded from
5
87 Testing: 88 All multiplex PCR testing was performed on posterior nasopharyngeal swabs using 89 the FilmArray Respiratory Panel v1.7 (Biofire, Salt Lake City, UT). The testing was 90 performed on-demand by core laboratory personnel at the West Haven Veterans 91 Administration (VA) Hospital (West Haven, CT) on a 24/7 basis. 92 93 Inclusion Criteria: 94 Patients included in the study had specimens obtained by posterior nasopharyngeal 95 swab at a Connecticut VA outpatient location, such as the Emergency Department, 96 outpatient clinics, or urgent care. Patients were excluded from the study if their 97 specimens were not obtained from a posterior nasopharyngeal swab (e.g. broncho-98 alveolar lavage), if they were not seen at a Connecticut VA center (i.e. reference 99 clients), or if testing was performed as an inpatient (hospital floor or ICU). 100 101 Sample Size: 102 Patients who met inclusion criteria were randomly selected to match enrollment in 103 one of three groups: positive for influenza, positive for a non-influenza pathogen, 104 and negative for all pathogens tested. Sample size calculations were performed to 105 select for enrollment of 100 patients per arm, with the primary goal to detect a 20% 106 difference between groups using an 80% power calculation. 107 108 Chart Review and Data Analysis: 109
on August 30, 2018 by guest
http://jcm.asm
.org/D
ownloaded from

6
A retrospective chart review was performed on 408 outpatients who met inclusion 110 criteria and were enrolled in in one of three study groups. Patient demographic 111 information was collected, including age, influenza vaccine status, order location, 112 admission status, presence of underlying lung disease, immunosuppression, clinical 113 syndrome, and other respiratory infectious disease testing. Immunosuppression 114 was determined by criteria published in the IDSA guidelines for vaccination of the 115 immunocompromised host (5). Clinical syndrome was recorded based on ICD-9 116 codes and a careful review of provider notes. Therapeutic outcomes evaluated were 117 oseltamivir prescription and anti-bacterial prescription rates. Clinical TAT was the 118 difference between time of specimen collection and time of final result, and 119 laboratory TAT was the difference between time of specimen receipt in lab and time 120 of final result. All categorical data were analyzed by Chi Squared analysis where 121 indicated, and adjusted standardized residuals were calculated to identify 122 significantly different cells. Clinical and laboratory turn-around-time (TAT) were 123 compared by Mann-Whitney U test or Kruskal-Wallis test. A p < 0.05 was considered 124 significant for primary comparisons. For residual analysis, p < 0.01 was considered 125 significant to correct for bias; this corresponds to a z-score of 2.58. 126 Analysis was focused on the 295 patients that were seen in outpatient settings and 127 were NOT ADMITTED (i.e. continued to be managed as outpatients). 128 129 IRB Approval: 130 This study was approved by the Institutional Review Board of the West Haven 131 Veterans Administration Hospital. 132
on August 30, 2018 by guest
http://jcm.asm
.org/D
ownloaded from

7
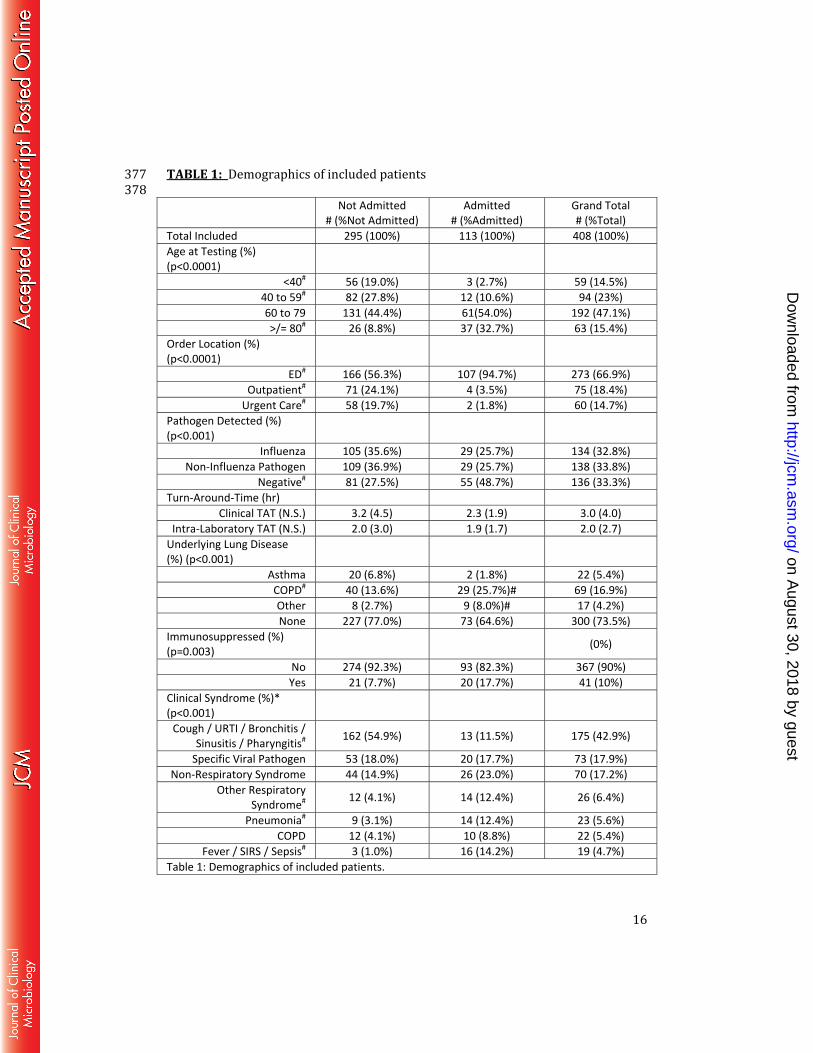
133 Results: 134 Demographics of admitted vs. not admitted patients 135 Of the 408 study patients with testing originating in outpatient settings, 113 136 (27.7%) were admitted to the hospital while 295 (72.3%) were managed as 137 outpatients. There were significant differences between admitted and non-admitted 138 patients with respect to age, order location, pathogen detected, underlying lung 139 disease, and clinical syndrome. There were no significant differences in laboratory 140 and clinical TAT between these two groups. Residual analysis indicated that 141 admitted patients were older, more likely to be seen in the ED, and more likely to 142 have no pathogen detected. Among presenting clinical syndromes, admitted patients 143 were more likely to have pneumonia or sepsis/SIRS as visit ICD9 codes, and less 144 likely to have ICD9 codes associated with URTI, cough, bronchitis, sinusitis, or 145 pharyngitis. No information on gender was extracted, but patients were 146 overwhelmingly male (Table 1). Among the 295 patients who were managed as 147 outpatients, only clinical TAT and ICD9-based clinical syndrome significantly 148 differed between patients seen in the ED versus those seen in other outpatient 149 locations (Supplemental Table 1). When examined in greater detail, the differences 150 in clinical syndrome were due to fewer patients coded with URTI and related 151 syndromes and more patients coded with specific viral diagnoses. When admitted 152 patients were examined in detail, there were higher rates of antibiotic prescriptions 153 for patients with suspected infectious etiologies, and the therapeutic agents used 154 were more likely to be broad spectrum (data not shown). 155
on August 30, 2018 by guest
http://jcm.asm
.org/D
ownloaded from

8
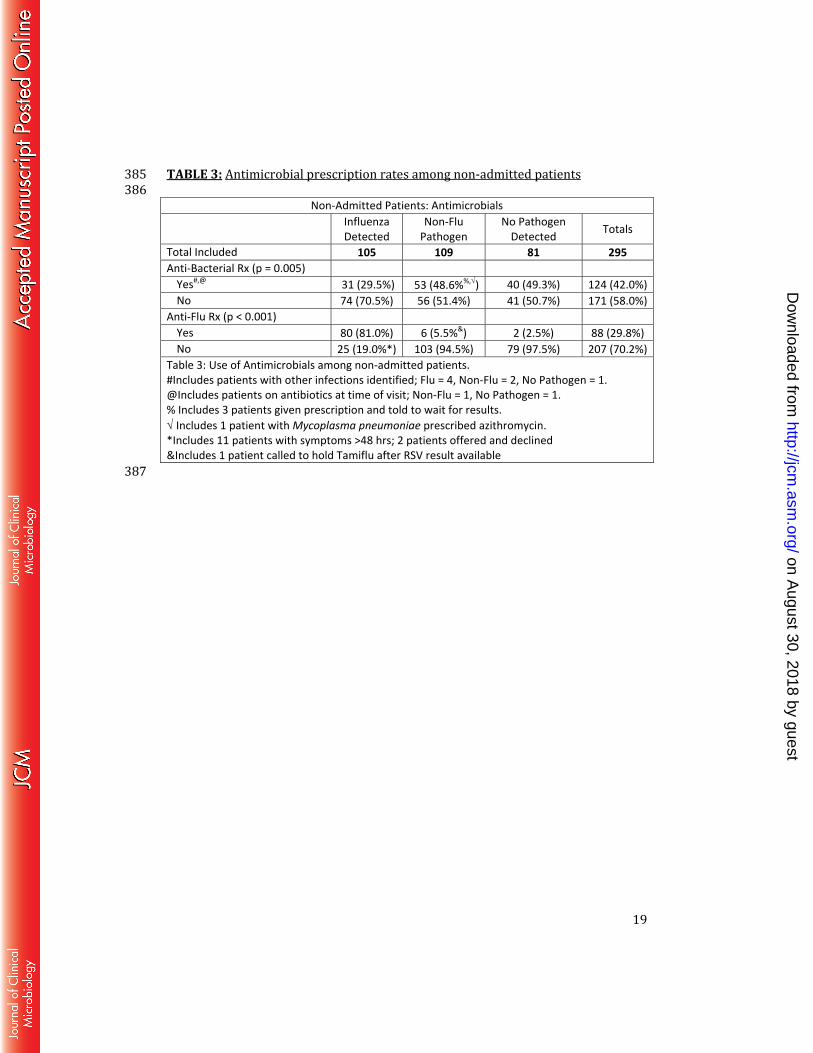
156 Demographics of non-admitted patients, grouped by respiratory pathogen PCR test 157 results 158 Among the 408 included patients, 295 (72.3%) received continued 159 management in the outpatient setting. Among these 295 outpatients, 105 (35.6%) 160 tested positive for influenza A (n = 83; 79.0%) or influenza B (n = 22; 21.0%), 109 161 (36.9%) tested positive for a non-influenza pathogen, and 81 (27.5%) tested 162 negative for all pathogens (Table 2). Non-influenza pathogens that were detected 163 were human rhinovirus/human enterovirus (n = 33; 30.3%), respiratory syncytial 164 virus (n = 25; 22.9%), human coronavirus (n = 23; 21.1%), human 165 metapneumovirus (n = 13; 11.9%), parainfluenza virus (n = 12; 11.0%), adenovirus 166 (n = 2; 1.8%), and Mycoplasma pneumoniae (n =1; 0.9%). There were no significant 167 differences in demographic characteristics among the three result groups. 168 Additionally, TAT did not differ among the three groups (Table 2). 169 170 Antimicrobial prescription rates among non-admitted patients 171 Oseltamivir prescription rates were significantly different among the three 172 groups (Chi-squared = 167.6, p < 0.001), with those testing positive for influenza 173 receiving the highest prescription rate (81.0%) (Table 3). Antibiotic prescription 174 rates were also different among the three groups (Chi-squared= 10.48, p = 0.005), 175 with those testing positive for influenza receiving the fewest prescriptions (29.5%). 176 There was no significant difference in antibiotic prescription rates between those 177 that tested positive for a non-influenza virus and those that tested negative (48.6% 178
on August 30, 2018 by guest
http://jcm.asm
.org/D
ownloaded from

9
and 49.3%, respectively, [Chi-squared = 0, p = 1.0]). The most commonly used 179 antibiotics among outpatients were azithromycin (n=49; 39.5%), moxifloxacin 180 (n=38; 30.6%), and amoxicillin/clavulanic acid (n=20; 16.1%). 181 182 Discussion: 183 In this study, adult outpatients who tested positive for influenza viruses 184 received significantly more oseltamivir prescriptions and significantly fewer 185 antibiotic prescriptions than those who tested positive for a non-influenza pathogen 186 and those who tested negative for all pathogens. However, there was no significant 187 difference in the antibiotic prescription rates for the latter two groups, suggesting 188 that testing results for non-influenza respiratory pathogens did not affect the 189 therapeutic management of these patients. 190 Multiplex PCR testing for respiratory pathogens offers significant advantages 191 over other methods like DFA, viral culture, RADTs, and pathogen-specific PCRs. 192 Commercial PCR panels are highly sensitive, produce rapid results (1-2 hours), and 193 can detect up to 20 pathogens in a single sample. In a variety of hospital settings, 194 these tests can have a significant impact on infection control, hospital epidemiology, 195 and patient management. Through rapid pathogen identification, patients can be 196 quickly isolated or cohorted on admission in accordance with hospital infection 197 control practices, thereby mitigating the risk of nosocomial transmission (6). This 198 practice may be especially important in preventing transmission to infants and 199 immunocompromised patients, who have a higher risk of developing serious 200 sequelae from lower respiratory tract infection (7, 8). In addition, identification of 201
on August 30, 2018 by guest
http://jcm.asm
.org/D
ownloaded from

10
certain viral agents such as RSV may inform clinical decision-making and predict 202 disease course in children with bronchiolitis, as RSV is associated with a longer 203 length of stay and more severe disease, including higher likelihood of ICU care (9, 204 10). Similar findings have also been noted for hMPV infections (11-13). Unlike 205 targeted PCR, multiplex testing can also identify patients co-infected with 2 or more 206 viruses, which is associated with higher mortality in young children (14), although 207 the clinical significance of co-infection is not fully understood. Identification of the 208 underlying virus may also reduce the need for further diagnostic workup (15). 209 However, the value of performing multiplex PCR panels for respiratory 210 viruses in adult outpatients is less clear, given that patients are less ill and isolation 211 precautions are not needed. Among outpatients, the rationale for multiplex 212 respiratory virus testing is two-fold: to identify patients with influenza who will 213 benefit from oseltamivir therapy, and to confirm a viral etiology in patients with URI 214 symptoms so as to avoid unnecessary antibiotic use. However, patients in this study 215 who tested positive for a non-influenza pathogen did not receive fewer antibiotic 216 prescriptions than those who tested negative. The FilmArray is one of the first 217 assays to make testing for HRV/HEV and HCoV widely available, while assays 218 (including DFA, rapid culture, or species-specific PCRs) for hMPV, PIV, RSV, and 219 adenovirus have been available for some time. Interestingly, when rates of antibiotic 220 prescriptions were examined between these groups, fewer antibacterials were 221 prescribed for patients with HRV/HEV or HCoV (Supplemental Table 2), which 222 suggests that providers were less likely to prescribe antibacterials for patients with 223 viruses that typically cause milder symptoms. 224
on August 30, 2018 by guest
http://jcm.asm
.org/D
ownloaded from
11
Previous studies on the effect of respiratory virus testing on antibiotic usage 225 have produced mixed findings. The detection of a known viral pathogen has been 226 reported to decrease antibiotic usage in children with bronchiolitis seen in the ED or 227 hospital (16-18). However, these data are not reproducible across all studies, and 228 the effects of viral testing on antibiotic use are debatable (19-23). Some studies 229 have shown no difference in antibiotic prescription rates but rather a decrease in 230 the duration of antibiotic use or discontinuation of antibiotics after the result was 231 made available (24, 25). Antibiotic duration could not be evaluated in our study, and 232 is an important limitation to consider. The conflicting and divergent nature of the 233 evidence to date, however, indicates that viral testing alone is unlikely to alter 234 antibiotic prescription rates, and that entrenched provider practices likely play a 235 larger role. 236 Another potential justification for outpatient multiplex testing is that the 237 results might influence the decision about whether or not to admit a patient to the 238 hospital. In our study, adults who tested negative for all pathogens had a higher rate 239 of admission to the hospital than those who tested positive for influenza or a non-240 influenza pathogen. However, these patients were older and more likely to have a 241 more severe illness based upon visit ICD9 codes, thus the higher rate of admission is 242 unlikely to be directly attributable to the results of respiratory pathogen testing 243 (Table 1). 244 The average clinical TAT for all patients in the present study was 3.0 hours, 245 with an intra-laboratory TAT of 2.0 hours. Achieving these TAT targets required 246 substantial laboratory resources, but these times may still be longer than some ED 247
on August 30, 2018 by guest
http://jcm.asm
.org/D
ownloaded from
12
or outpatient visits. Review of a random selection of 10% of the total charts revealed 248 that results were available to clinicians in 47.4% of encounters before discharge. 249 Additionally, results were available before 53.4% of anti-influenza or anti-bacterial 250 prescriptions were written. These data present opportunites for laboratory 251 improvement or even revised diagnostic algorithms, especially in outpatient clinics 252 where visits are typically shorter. In settings where TAT will likely exceed office 253 visit time, targeted influenza PCR assays should be considered as less expensive 254 alternatives to multiplex PCR tests. There are multiple FDA-approved Influenza A/B 255 assays, some of which also detect RSV, and many of which are also CLIA-waived. 256 These assays provide equal or better TATs at a significant fraction of the cost. 257 Limitations of this study include the study cohort itself, which was largely 258 comprised of older men, the majority of whom received care in the emergency 259 department; these data may not fully represent the larger population of adult 260 outpatients who seek care for URI’s in the United States. Indeed, clinical TAT was 261 faster for patients seen in the ED, and results were more readily available to ED 262 providers. Also, only a single respiratory virus season was evaluated. We did not 263 compare rates of antibiotic prescriptions pre-FilmArray and post-FilmArray, but 264 such an analysis could be skewed by the timing of assay implementation within a 265 given respiratory virus season and also by test volumes. Additionally, we used ICD9 266 codes to identify clinical syndromes associated with each visit; while there can be 267 substantial variations in how visits are coded among providers and units, these 268 codes still provide more readily extractable and reproducibly categorized 269 information than patient care notes. Finally, only 81 patients were enrolled in the 270
on August 30, 2018 by guest
http://jcm.asm
.org/D
ownloaded from
13
group who tested negative for all pathogens, short of the target enrollment of 100 271 patients based on our power calculations. It is therefore possible that some 272 differences in antibiotic prescription rates might have emerged had the target 273 enrollment been met, but this appears unlikely, as the antibiotic prescription rates 274 between this group and the group who tested positive for non-influenza pathogens 275 were nearly identical (49.3% and 48.6%, respectively), and the inclusion of 19 276 additional patients in the former group would not have led to statistically significant 277 differences, even if they all received antibiotics. 278 While the detection of known respiratory viral pathogens might be predicted 279 to reduce antibiotic prescription rates, our study did not find such an effect unless 280 patients tested positive for influenza. The additional benefit of performing 281 multiplex viral testing instead of targeted influenza testing in outpatients is 282 questionable, especially given the higher costs of commercial multiplex tests. Our 283 data argue that targeted influenza testing alone may be a more cost-effective 284 approach for adult outpatients with uncomplicated upper respiratory infections or 285 that implementation of multiplex testing must be paired with provider education 286 and antimicrobial stewardship to discourage the use of antibiotics for such patients. 287 288 References 289 290 1. Kirkpatrick GL. 1996. The common cold. Prim Care 23:657-675. 291 2. Fendrick AM, Monto AS, Nightengale B, Sarnes M. 2003. The economic 292 burden of non-influenza-related viral respiratory tract infection in the United 293 States. Arch Intern Med 163:487-494. 294 3. Turner R. 2015. Priciples and Practices of Infectious Diseases, 8th ed, vol 1. 295 Elsevier Saunders, Philadelphia, PA. 296
on August 30, 2018 by guest
http://jcm.asm
.org/D
ownloaded from

14
4. Peaper DR, Landry ML. 2014. Rapid diagnosis of influenza: state of the art. 297 Clin Lab Med 34:365-385. 298 5. Rubin LG, Levin MJ, Ljungman P, Davies EG, Avery R, Tomblyn M, 299 Bousvaros A, Dhanireddy S, Sung L, Keyserling H, Kang I, Infectious 300 Diseases Society of A. 2014. 2013 IDSA clinical practice guideline for 301 vaccination of the immunocompromised host. Clin Infect Dis 58:309-318. 302 6. Tablan OC, Anderson LJ, Besser R, Bridges C, Hajjeh R, Cdc, Healthcare 303 Infection Control Practices Advisory C. 2004. Guidelines for preventing 304 health-care--associated pneumonia, 2003: recommendations of CDC and the 305 Healthcare Infection Control Practices Advisory Committee. MMWR Recomm 306 Rep 53:1-36. 307 7. Duncan CB, Walsh EE, Peterson DR, Lee FE, Falsey AR. 2009. Risk factors 308 for respiratory failure associated with respiratory syncytial virus infection in 309 adults. J Infect Dis 200:1242-1246. 310 8. Simoes EA. 2003. Environmental and demographic risk factors for 311 respiratory syncytial virus lower respiratory tract disease. J Pediatr 312 143:S118-126. 313 9. Hervas D, Reina J, Yanez A, del Valle JM, Figuerola J, Hervas JA. 2012. 314 Epidemiology of hospitalization for acute bronchiolitis in children: 315 differences between RSV and non-RSV bronchiolitis. Eur J Clin Microbiol 316 Infect Dis 31:1975-1981. 317 10. Mansbach JM, Piedra PA, Teach SJ, Sullivan AF, Forgey T, Clark S, 318 Espinola JA, Camargo CA, Jr., Investigators M-. 2012. Prospective 319 multicenter study of viral etiology and hospital length of stay in children with 320 severe bronchiolitis. Arch Pediatr Adolesc Med 166:700-706. 321 11. Adams O, Weis J, Jasinska K, Vogel M, Tenenbaum T. 2015. Comparison of 322 human metapneumovirus, respiratory syncytial virus and Rhinovirus 323 respiratory tract infections in young children admitted to hospital. J Med 324 Virol 87:275-280. 325 12. Hahn A, Wang W, Jaggi P, Dvorchik I, Ramilo O, Koranyi K, Mejias A. 326 2013. Human metapneumovirus infections are associated with severe 327 morbidity in hospitalized children of all ages. Epidemiol Infect 141:2213-328 2223. 329 13. Edwards KM, Zhu Y, Griffin MR, Weinberg GA, Hall CB, Szilagyi PG, Staat 330 MA, Iwane M, Prill MM, Williams JV, New Vaccine Surveillance N. 2013. 331 Burden of human metapneumovirus infection in young children. N Engl J 332 Med 368:633-643. 333 14. Asner SA, Science ME, Tran D, Smieja M, Merglen A, Mertz D. 2014. 334 Clinical disease severity of respiratory viral co-infection versus single viral 335 infection: a systematic review and meta-analysis. PLoS One 9:e99392. 336 15. Antonow JA, Byington CL. 1999. Use of respiratory syncytial virus testing 337 could safely eliminate many sepsis evaluations. Arch Pediatr Adolesc Med 338 153:1310-1311. 339 16. McCulloh RJ, Andrea S, Reinert S, Chapin K. 2014. Potential Utility of 340 Multiplex Amplification Respiratory Viral Panel Testing in the Management 341
on August 30, 2018 by guest
http://jcm.asm
.org/D
ownloaded from

15
of Acute Respiratory Infection in Children: A Retrospective Analysis. J 342 Pediatric Infect Dis Soc 3:146-153. 343 17. Smyth RL, Openshaw PJ. 2006. Bronchiolitis. Lancet 368:312-322. 344 18. Vogel AM, Lennon DR, Harding JE, Pinnock RE, Graham DA, Grimwood K, 345 Pattemore PK. 2003. Variations in bronchiolitis management between five 346 New Zealand hospitals: can we do better? J Paediatr Child Health 39:40-45. 347 19. Bordley WC, Viswanathan M, King VJ, Sutton SF, Jackman AM, Sterling L, 348 Lohr KN. 2004. Diagnosis and testing in bronchiolitis: a systematic review. 349 Arch Pediatr Adolesc Med 158:119-126. 350 20. Stollar F, Alcoba G, Gervaix A, Argiroffo CB. 2014. Virologic testing in 351 bronchiolitis: does it change management decisions and predict outcomes? 352 Eur J Pediatr 173:1429-1435. 353 21. Hernes SS, Hagen E, Quarsten H, Bjorvatn B, Bakke PS. 2014. No impact of 354 early real-time PCR screening for respiratory viruses on length of stay and 355 use of antibiotics in elderly patients hospitalized with symptoms of a 356 respiratory tract infection in a single center in Norway. Eur J Clin Microbiol 357 Infect Dis 33:359-364. 358 22. Mulpuru S, Aaron SD, Ronksley PE, Lawrence N, Forster AJ. 2015. 359 Hospital Resource Utilization and Patient Outcomes Associated with 360 Respiratory Viral Testing in Hospitalized Patients. Emerg Infect Dis 21:1366-361 1371. 362 23. Oosterheert JJ, van Loon AM, Schuurman R, Hoepelman AI, Hak E, 363 Thijsen S, Nossent G, Schneider MM, Hustinx WM, Bonten MJ. 2005. 364 Impact of rapid detection of viral and atypical bacterial pathogens by real-365 time polymerase chain reaction for patients with lower respiratory tract 366 infection. Clin Infect Dis 41:1438-1444. 367 24. Rogers BB, Shankar P, Jerris RC, Kotzbauer D, Anderson EJ, Watson JR, 368 O'Brien LA, Uwindatwa F, McNamara K, Bost JE. 2015. Impact of a rapid 369 respiratory panel test on patient outcomes. Arch Pathol Lab Med 139:636-370 641. 371 25. Doan QH, Kissoon N, Dobson S, Whitehouse S, Cochrane D, Schmidt B, 372 Thomas E. 2009. A randomized, controlled trial of the impact of early and 373 rapid diagnosis of viral infections in children brought to an emergency 374 department with febrile respiratory tract illnesses. J Pediatr 154:91-95. 375 376
on August 30, 2018 by guest
http://jcm.asm
.org/D
ownloaded from
16
TABLE 1: Demographics of included patients 377 378 Not Admitted # (%Not Admitted)
Admitted # (%Admitted)
Grand Total # (%Total)
Total Included 295 (100%) 113 (100%) 408 (100%) Age at Testing (%) (p<0.0001)
<40# 56 (19.0%) 3 (2.7%) 59 (14.5%) 40 to 59# 82 (27.8%) 12 (10.6%) 94 (23%) 60 to 79 131 (44.4%) 61(54.0%) 192 (47.1%) >/= 80# 26 (8.8%) 37 (32.7%) 63 (15.4%)
Order Location (%) (p<0.0001)
ED# 166 (56.3%) 107 (94.7%) 273 (66.9%) Outpatient# 71 (24.1%) 4 (3.5%) 75 (18.4%)
Urgent Care# 58 (19.7%) 2 (1.8%) 60 (14.7%) Pathogen Detected (%) (p<0.001)
Influenza 105 (35.6%) 29 (25.7%) 134 (32.8%) Non-Influenza Pathogen 109 (36.9%) 29 (25.7%) 138 (33.8%)
Negative# 81 (27.5%) 55 (48.7%) 136 (33.3%) Turn-Around-Time (hr)
Clinical TAT (N.S.) 3.2 (4.5) 2.3 (1.9) 3.0 (4.0) Intra-Laboratory TAT (N.S.) 2.0 (3.0) 1.9 (1.7) 2.0 (2.7)
Underlying Lung Disease (%) (p<0.001)
Asthma 20 (6.8%) 2 (1.8%) 22 (5.4%) COPD# 40 (13.6%) 29 (25.7%)# 69 (16.9%) Other 8 (2.7%) 9 (8.0%)# 17 (4.2%) None 227 (77.0%) 73 (64.6%) 300 (73.5%)
Immunosuppressed (%) (p=0.003) (0%)
No 274 (92.3%) 93 (82.3%) 367 (90%) Yes 21 (7.7%) 20 (17.7%) 41 (10%)
Clinical Syndrome (%)* (p<0.001)
Cough / URTI / Bronchitis / Sinusitis / Pharyngitis# 162 (54.9%) 13 (11.5%) 175 (42.9%)
Specific Viral Pathogen 53 (18.0%) 20 (17.7%) 73 (17.9%) Non-Respiratory Syndrome 44 (14.9%) 26 (23.0%) 70 (17.2%)
Other Respiratory Syndrome# 12 (4.1%) 14 (12.4%) 26 (6.4%)
Pneumonia# 9 (3.1%) 14 (12.4%) 23 (5.6%) COPD 12 (4.1%) 10 (8.8%) 22 (5.4%)
Fever / SIRS / Sepsis# 3 (1.0%) 16 (14.2%) 19 (4.7%) Table 1: Demographics of included patients.
on August 30, 2018 by guest
http://jcm.asm
.org/D
ownloaded from

17
* If multiple ICD-9 codes were used for a visit, only those most directly related to respiratory virus testing were extracted. Data shown are the # of patients in each group with the % of the column total. For TAT, data is Mean (St. Dev.). All categorical data were compared with Chi Squared. TAT was compared via Mann-Whitney U test. For categories with significant differences, adjusted standardized residuals were calculated. N.S. = Not Significant. # indicates an absolute value of the standardized adjusted residual > 2.58 for each row. 379
on August 30, 2018 by guest
http://jcm.asm
.org/D
ownloaded from

18
TABLE 2: Demographics of non-admitted patients, grouped by respiratory 380 pathogen PCR test results 381 382 383
Non Admitted: Demographics Influenza
Detected Non-Flu
Pathogen No Pathogen
Detected Totals
Total Included 105 (100%) 109 (100%) 81 (100%) 295 (100%) Age at Testing (N.S.)
<40 24 (22.9%) 19 (17.4%) 13 (16%) 56 (19%) 40 to 59 27 (25.7%) 29 (26.6%) 26 (32.1%) 82 (27.8%) 60 to 79 42 (40%) 55 (50.5%) 34 (42%) 131 (44.4%)
>/= 80 12 (11.4%) 6 (5.5%) 8 (9.9%) 26 (8.8%) Order Location (N.S.)
ED 55 (52.4%) 66 (60.6%) 45 (55.6%) 166 (56.3%) Outpatient 29 (27.6%) 22 (20.2%) 20 (24.7%) 71 (24.1%)
Treatment Rm 21 (20%) 21 (19.3%) 16 (19.8%) 58 (19.7%) Turn-Around-Time (hr)
Clinical TAT (N.S.) 3.2 (3.4) 3.4 (5.9) 3.1 (3.6) 3.2 (4.5) Intra-Laboratory TAT (N.S.) 2.1 (2.0) 2.2 (4.5) 1.8 (0.7) 2.0 (3.0)
Influenza Vaccine (N.S.) Not Reported 48 (45.7%) 38 (34.9%) 29 (35.8%) 115 (39%)
Yes 57 (54.3%) 71 (65.1%) 52 (64.2%) 180 (61%) Underlying Lung Disease (N.S.)
COPD 12* (11.4%) 12 (11%) 16 (19.8%) 40 (13.6%) Asthma 8 (7.6%) 9 (8.3%) 4 (4.9%) 21 (7.1%) Other% 1 (1%) 2 (1.8%) 4 (4.9%) 7 (2.4%)
No 84 (80%) 86 (78.9%) 57 (70.4%) 227 (76.9%) Immunosuppressed (N.S.)
Yes 7 (6.7%) 8 (7.3%) 6 (7.4%) 21 (7.1%) No 98 (93.3%) 101 (92.7%) 75 (92.6%) 274 (92.9%)
Table 2: Demographics of all patients included in chart review. Data shown are the # of patients in each group with the % of the column total. For TAT, data are Mean (St. Dev.). All categorical data was compared with Chi Squared. TAT was compared via Kruskal-Wallis Test. * 2 Patients with both COPD and Lung Cancer %Other includes Lung Cancer, Interstitial Lung Disease 384
on August 30, 2018 by guest
http://jcm.asm
.org/D
ownloaded from
19
TABLE 3: Antimicrobial prescription rates among non-admitted patients 385 386 Non-Admitted Patients: Antimicrobials
Influenza Detected
Non-Flu Pathogen
No Pathogen Detected Totals
Total Included 105 109 81 295 Anti-Bacterial Rx (p = 0.005)
Yes#,@ 31 (29.5%) 53 (48.6%%,√) 40 (49.3%) 124 (42.0%)No 74 (70.5%) 56 (51.4%) 41 (50.7%) 171 (58.0%)
Anti-Flu Rx (p < 0.001) Yes 80 (81.0%) 6 (5.5%&) 2 (2.5%) 88 (29.8%) No 25 (19.0%*) 103 (94.5%) 79 (97.5%) 207 (70.2%)
Table 3: Use of Antimicrobials among non-admitted patients. #Includes patients with other infections identified; Flu = 4, Non-Flu = 2, No Pathogen = 1. @Includes patients on antibiotics at time of visit; Non-Flu = 1, No Pathogen = 1. % Includes 3 patients given prescription and told to wait for results. √ Includes 1 patient with Mycoplasma pneumoniae prescribed azithromycin. *Includes 11 patients with symptoms >48 hrs; 2 patients offered and declined &Includes 1 patient called to hold Tamiflu after RSV result available 387
on August 30, 2018 by guest
http://jcm.asm
.org/D
ownloaded from


![Downloaded from //jcm.asm.org/content/jcm/early/2020/07/10/JCM...2020/07/10 · 112 assembled contigs using shiver [22] . Phyloscanner is used to remove contaminant 113 reads and](https://img.pdfslide.net/doc/110x75/6035f17987615853ad03b70a/downloaded-from-jcmasmorgcontentjcmearly20200710jcm-20200710-.jpg)