Embed Size (px)
Citation preview

OSCEOLA COUNTY, FLORIDA AND INCORPORATED AREAS
Community Name Community
Number KISSIMMEE, CITY OF 120190 OSCEOLA COUNTY
(UNINCORPORATED AREAS) 120189
REEDY CREEK IMPROVEMENT DISTRICT
120577
ST. CLOUD, CITY OF 120191
REVISED June 18, 2013
Federal Emergency Management Agency FLOOD INSURANCE STUDY NUMBER
12097CV000A
Osceola County

NOTICE TO FLOOD INSURANCE STUDY USERS
Communities participating in the National Flood Insurance Program have established repositories of flood hazard data for floodplain management and flood insurance purposes. This Flood Insurance Study may not contain all data available within the repository. It is advisable to contact the community repository for any additional data.
Part or all of this Flood Insurance Study may be revised and republished at any time. In addition, part of this Flood Insurance Study may be revised by the Letter of Map Revision process, which does not involve republication or redistribution of the Flood Insurance Study. It is, therefore, the responsibility of the user to consult with community officials and to check the community repository to obtain the most current Flood Insurance Study components.
Initial Countywide FIS Effective Date: May 7, 2001
First Revised Countywide FIS Date: June 18, 2013

i
TABLE OF CONTENTS
Page
1.0 INTRODUCTION ......................................................................................................................... 1
1.1 Purpose of Study ............................................................................................................... 1 1.2 Authority and Acknowledgments ...................................................................................... 1 1.3 Coordination ...................................................................................................................... 3
2.0 AREA STUDIED ........................................................................................................................... 4
2.1 Scope of Study .................................................................................................................. 4 2.2 Community Description .................................................................................................. 11 2.3 Principal Flood Problems ................................................................................................ 12 2.4 Flood Protection Measures .............................................................................................. 12
3.0 ENGINEERING METHODS ..................................................................................................... 15
3.1 Hydrologic Analyses ....................................................................................................... 15 3.1.1 Methods for Flooding Sources with New or Revised Analyses in Current Study .......... 15 3.1.2 Methods for Flooding Sources Incorporated from Previous Studies .............................. 16 3.2 Hydraulic Analyses ......................................................................................................... 27 3.2.1 Methods for Flooding Sources with New or Revised Analyses in Current Study .......... 28 3.2.2 Methods for Flooding Sources Incorporated from Previous Studies .............................. 29 3.3 Vertical Datum ................................................................................................................ 30
4.0 FLOODPLAIN MANAGEMENT APPLICATIONS ............................................................... 31
4.1 Floodplain Boundaries .................................................................................................... 32 4.2 Floodways ....................................................................................................................... 32
5.0 INSURANCE APPLICATIONS ................................................................................................. 54
6.0 FLOOD INSURANCE RATE MAP .......................................................................................... 54
7.0 OTHER STUDIES ....................................................................................................................... 56
8.0 LOCATION OF DATA ............................................................................................................... 56
9.0 BIBLIOGRAPHY AND REFERENCES ................................................................................... 56
10.0 REVISION DESCRIPTIONS ..................................................................................................... 59
10.1 First Revision June 18, 2018 ........................................................................................... 59

ii
FIGURES
Figure 1. Floodway Schematic................................................................................................................... 34
TABLES
Table 1: Historical CCO Meeting Dates ...................................................................................................... 3 Table 2: Flooding Sources Studied by Detailed Methods ............................................................................ 4 Table 3: Flooding Sources Studied by Approximate Methods .................................................................... 8 Table 4: Letters of Map Revision (LOMRs) Incorporated into Current Study ......................................... 11 Table 5: Summary of Discharges ............................................................................................................... 19 Table 6: Summary of Stillwater Elevations ............................................................................................... 26 Table 7: Manning’s “n” Values ................................................................................................................. 27 Table 8: Floodway Data ............................................................................................................................. 35 Table 9: Community Map History ............................................................................................................. 55
EXHIBITS
Exhibit 1 – Flood Profiles
Bass Slough (Lower Reach) Panels 01P-03P Bass Slough (Upper Reach) Panels 04P-05P Bass Slough Tributary Panel 06P Boggy Creek Panel 07P C-33 Canal Panel 08P Canoe Creek (C-34 Canal) Panels 09P-10P Davenport Creek Panels 11P-12P Davenport Creek Tributary No. 1 Panel 13P Davenport Creek Tributary No. 2 Panel 14P East City Canal Panels 15P-16P East City Canal Tributary 1 Panel 17P Mill Slough Panels 18P-20P Peg Horn Slough Panels 21P-22P Reedy Creek Panels 23P-24P Reedy Creek Tributary No. 1 Panel 25P Reedy Creek Tributary No. 2 Panel 26P Reedy Creek Tributary No. 3 Panel 27P
iii
TABLE OF CONTENTS (Continued)
Exhibit 1 – Flood Profiles (continued)
Shingle Creek Panels 28P-29P St. Johns River Panels 30P-31P Tributary No. 1 Panel 32P West Branch Shingle Creek Panels 33P-35P West City Canal Panel 36P WPA Canal Panels 37P-39P WPA Canal Tributary 1 Panels 40P-42P WPA Canal Tributary 1-1 Panel 43P
Exhibit 2 – Flood Insurance Rate Map Index (Published Separately) Flood Insurance Rate Maps (Published Separately)
1
FLOOD INSURANCE STUDY
OSCEOLA COUNTY, FLORIDA, AND INCORPORATED AREAS
1.0 INTRODUCTION
1.1 Purpose of Study
This Flood Insurance Study (FIS) revises and updates information on the existence and severity of flood hazards in the geographic area of Osceola County, including the Cities of Kissimmee and St. Cloud; Reedy Creek Improvement District; and the unincorporated areas of Osceola County (referred to collectively herein as Osceola County), and aids in the administration of the National Flood Insurance Act of 1968 and the Flood Disaster Protection Act of 1973. This study has developed flood-risk data for various areas of the community that will be used to establish actuarial flood insurance rates and to assist the community in its efforts to promote sound floodplain management. Minimum floodplain management requirements for participation in the National Flood Insurance Program (NFIP) are set forth in the Code of Federal Regulations at 44 CFR, 60.3.
The Reedy Creek Improvement District is located in more than one county; the flood hazard information for the portion of this community located in Orange County is included in the FIS report for Orange County, Florida, and Incorporated Areas (Reference 1).
In some states or communities, floodplain management criteria or regulations may exist that are more restrictive or comprehensive than the minimum Federal requirements. In such cases, the more restrictive criteria take precedence, and the State (or other jurisdictional agency) will be able to explain them.
The Flood Insurance Rate Map (FIRM) and FIS report for this countywide study have been produced in digital format. Flood hazard information was converted to meet the Federal Emergency Management Agency (FEMA) FIRM database specifications and geographic information standards and is provided in a digital format so that it can be incorporated into a local Geographic Information System and be accessed more easily by the community.
1.2 Authority and Acknowledgments
The sources of authority for this FIS report are the National Flood Insurance Act of 1968 and the Flood Disaster Protection Act of 1973.
For this revision of the countywide FIS, new hydrologic and hydraulic analyses were prepared by BakerAECOM, LLC, for FEMA, under Contract No. HSFEHQ-09-D-0368, Task R4-TO66. This revised study was completed in March 2011.

2
For the initial countywide FIS, the hydrologic and hydraulic analyses were prepared by Engineering Methods & Applications, Inc., for FEMA, under Inter-Agency Agreement No. EMW-95-C-4705. That work was completed in July 1996.
The initial countywide FIS was prepared to include all jurisdictions within Osceola County in a countywide FIS. Information on the authority and acknowledgements for each jurisdiction with a previously printed FIS report included in the countywide FIS is shown below:
Kissimmee, City of: The hydrologic and hydraulic analyses for the FIS report dated January 2, 1981, were prepared by the U.S. Army Corps of Engineers (USACE), Jacksonville District, for the Federal Insurance Administration (FIA), under Inter-Agency Agreement No. IAA-H-1878, Project Order No. 10. That work was completed in June 1979.
Osceola County The hydraulic analyses for the FIS report dated (Unincorporated areas): August 3, 1981, were prepared by the USACE, Jacksonville District, for FEMA, under Inter-Agency Agreement No. IAA-H-1878, Project Order No. 10, Amendment No. 1. That work was completed in January 1980.
The hydrologic and hydraulic analyses for the FIS report dated March 16, 1989, were prepared by the USACE, Jacksonville District for FEMA, under Inter-Agency Agreement No. IAA-H-1878, Project Order No. 10, Amendment No. 1. That work was completed in January 1980.
The hydrologic and hydraulic analyses for the FIS report dated November 20, 1996, were prepared by Post, Buckley, Schuh & Jernigan, Inc.
St. Cloud, City of: The hydrologic and hydraulic analyses for the FIS report dated March 1980 were prepared by the USACE, Jacksonville District, for the FIA, under Inter-Agency Agreement No. IAA-H-1878, Project Order No. 10. That work was completed in February 1979.
For the FIS report dated April 3, 1996, flooding information was taken from the FIS for the unincorporated areas of Osceola County because of corporate limits changes and flooding mismatches between the City of St. Cloud and the unincorporated areas of Osceola County (Reference 2).
The authority and acknowledgments for Reedy Creek Improvement District are not included because there was no previously printed FIS report for this community.

3
Base map information shown on the FIRM was provided in digital format by Osceola County Planning Office.
The coordinate system used for producing the FIRM is the Florida State Plane FIPS 0901. Corner coordinates shown on the FIRMs are in latitude and longitude referenced to the UTM projection, North American Datum (NAD 83) HARN and the GRS80. Distance units were measured in feet.
1.3 Coordination
An initial Consultation Coordination Officer (CCO) meeting (also occasionally referred to as the Scoping meeting) is held with representatives of the communities, FEMA, and the study contractors to explain the nature and purpose of the FIS and to identify the streams to be studied by detailed methods. A final CCO (often referred to as the Preliminary DFIRM Community Coordination, or PDCC, meeting) is held with representatives of the communities, FEMA, and the study contractors to review the results of the study.
For this revision of the countywide FIS, the initial CCO meeting was held on November 3, 2009, and attended by community officials, representatives of the St. Johns River and South Florida Water Management Districts, the State of Florida, FEMA Region IV, and the study contractor, Baker AECOM, LLC.
The final CCO meeting was held on August 16, 2011 to review and accept the results of this FIS. Those who attended this meeting included representatives of St. Cloud, Kissimmee, Osceola County, AECOM, and FEMA. All problems raised at that meeting have been addressed in this study.
The dates of the historical initial and final CCO meetings held for the communities within the boundaries of Osceola County are shown in Table 1, “Historical CCO Meeting Dates.”
Table 1: Historical CCO Meeting Dates
Community Name Initial CCO Date Final CCO Date
Kissimmee, City of December 13, 1977 March 13, 1980
Osceola County and Incorporated Areas (countywide)
September 22, 1994 September 29, 1998
Osceola County (Unincorporated Areas) February 23, 1978 March 2, 1981
St. Cloud, City of December 13, 1977 July 10, 1979

4
2.0 AREA STUDIED
2.1 Scope of Study
This FIS report covers the geographic area of Osceola County, Florida, including the incorporated communities listed in Section 1.1. The scope and methods of this study were proposed to, and agreed upon, by FEMA and Osceola County.
For this revision, a total of 9.8 additional stream miles were studied using detailed methods. Floodplain boundaries of streams that had been previously studied by detailed methods were redelineated based on more detailed and up-to-date topographic mapping for this FIS report.
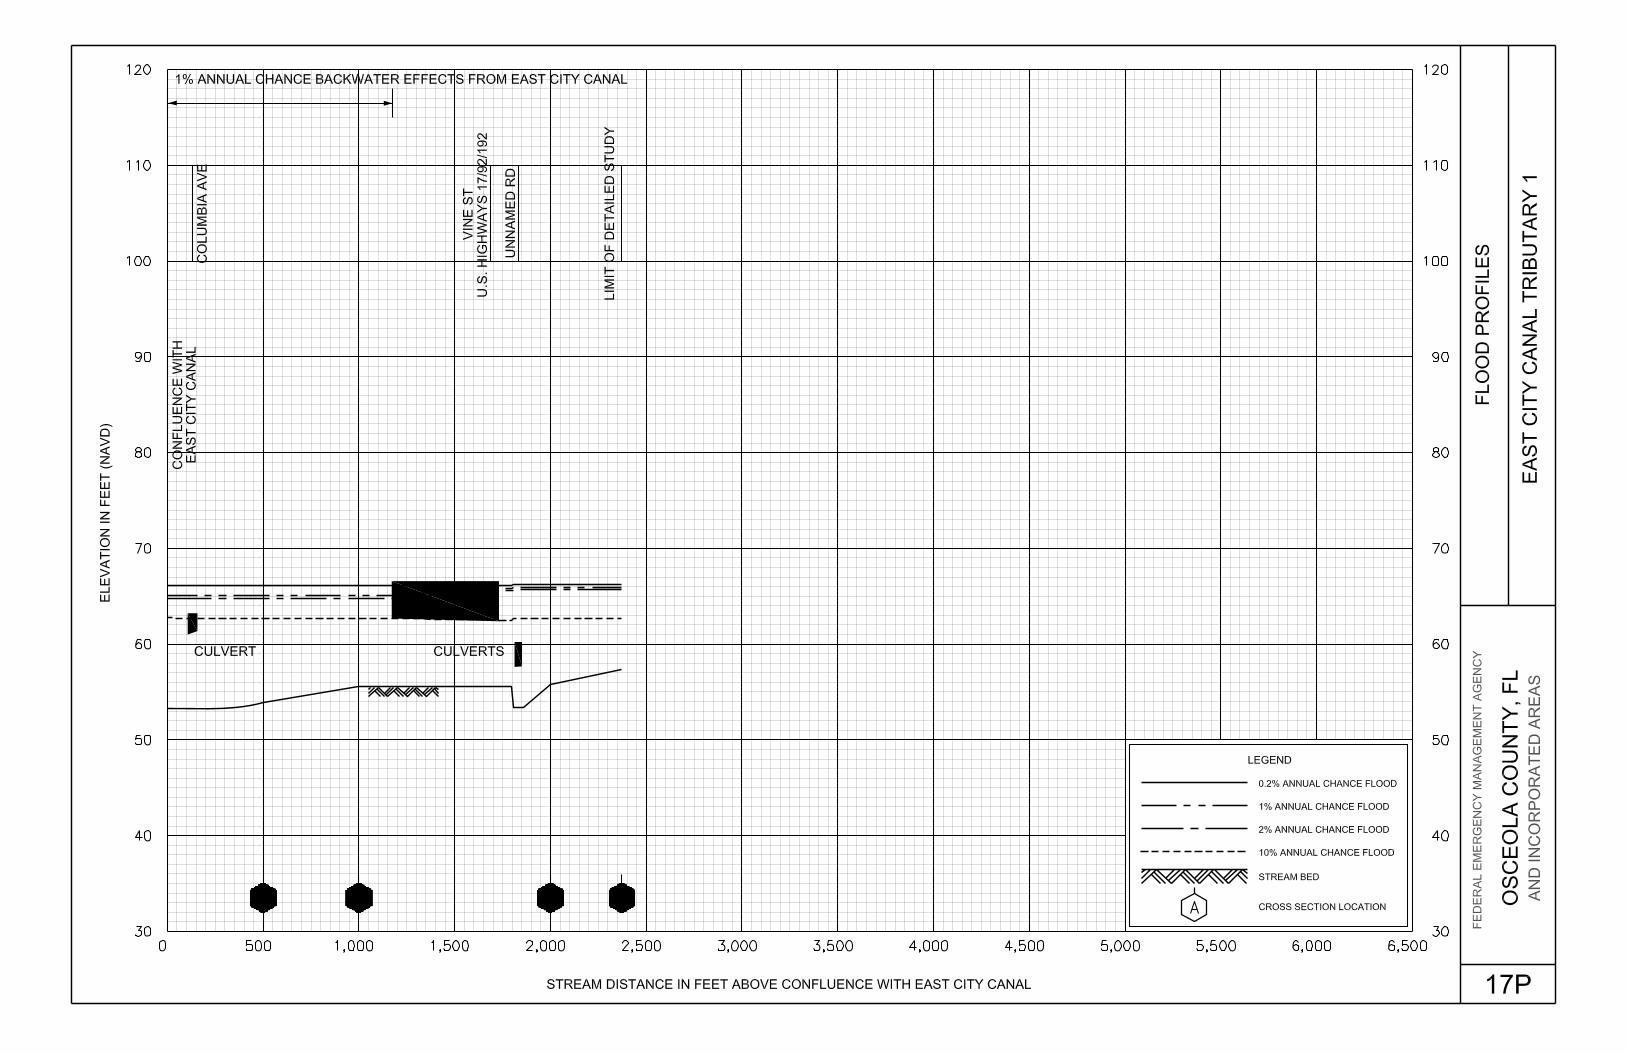
All or portions of the flooding sources in Table 2, “Flooding Sources Studied by Detailed Methods,” were studied by detailed methods. Limits of detailed study are indicated on the Flood Profiles (Exhibit 1) and on the FIRM (Exhibit 2). The areas studied by detailed methods were selected with priority given to all known flood hazards and areas of projected development or proposed construction.
Table 2: Flooding Sources Studied by Detailed Methods
Flooding Source
Reach Length (miles) or
Area (square miles) Limits of Study
Alligator Canal 1.3 2
Alligator Lake 16.4 For its entire shoreline within Osceola County
Bass Slough1 5.5 From mouth to a point approximately 1,260 feet upstream of Birchwood Circle
Bass Slough Tributary1 0.4 From the confluence with Bass Slough to a point approximately 2,040 feet upstream
Boggy Creek 1.6 2
Brick Lake 4.3 For its entire shoreline within Osceola County
Brown Lake 0.1 sq. mi. 2
C-33 Canal 2.4 From its confluence with Alligator Lake to its confluence with Lake Gentry
Canal 32-C 2.0 2
Canoe Creek (C-34 Canal) 3.5 From Canoe Creek Road to Lake Gentry

Table 2: Flooding Sources Studied by Detailed Methods (continued)
5
Flooding Source
Reach Length (miles) or
Area (square miles) Limits of Study
Coon Lake 1.8 For its entire shoreline within Osceola County
Cox Creek 1.7 2
Cypress Lake 0.01 sq. mi. 2
Davenport Creek 7.5 From its confluence with Reedy Creek to Oak Island Drive
Davenport Creek Tributary No. 1 1.0 From its confluence with Davenport
Creek to Oak Island Drive
Davenport Creek Tributary No. 2 1.6
From its confluence with Davenport Creek to a point approximately 0.86 mile upstream of confluence
Dead River 0.5 2
East City Canal 3.2 From its confluence with Lake Tohopekaliga to just downstream of Oak Street
East City Canal Tributary 11 0.4 From the confluence with East City Canal to a point approximately 2,370 feet upstream
East Lake Tohopekaliga 20.1 2
Gator Bay Branch 1.1 2
Heart Lake 0.01 sq. mi. 2
Jackson Canal 1.7 2
Jim Branch 0.6 2
Kissimmee River 3.0 2
Lake Bullock 1.4
Lake Cecil 1.6 2
Lake Center 3.3 For its entire shoreline within Osceola County
Lake Davenport 1.0 For its entire shoreline within Osceola County
Lake Gentry 0.7 For its entire shoreline within Osceola County

Table 2: Flooding Sources Studied by Detailed Methods (continued)
6
Flooding Source
Reach Length (miles) or
Area (square miles) Limits of Study
Lake Hatchineha 21.8 For its entire shoreline within Osceola County
Lake Joel 2.5 For its entire shoreline within Osceola County
Lake Kissimmee 48.2 2
Lake Lizzie 4.9 For its entire shoreline within Osceola County
Lake Marian1 8.3 2
Lake Martha 0.01 sq. mi. 2
Lake Myrtle 4.3 For its entire shoreline within Osceola County
Lake Poinsett 3.1 2
Lake Preston 5.4 For its entire shoreline within Osceola County
Lake Runnymede 3.3 2
Lake Russell 4.6 2
Lake Tohopekaliga 39.2 2
Lake Wilson 1.5 2
Live Oak Lake 3.1 2
Lonesome Camp Swamp 0.7 2
Mill Slough 4.1 2
NP (unnamed streams) 117.6 2
Orange Hammock Slough 1.4 2
Orchid Creek 0.7 2
Paradise Island 0.1 sq. mi. 2
Pearl Lake 1.5 2
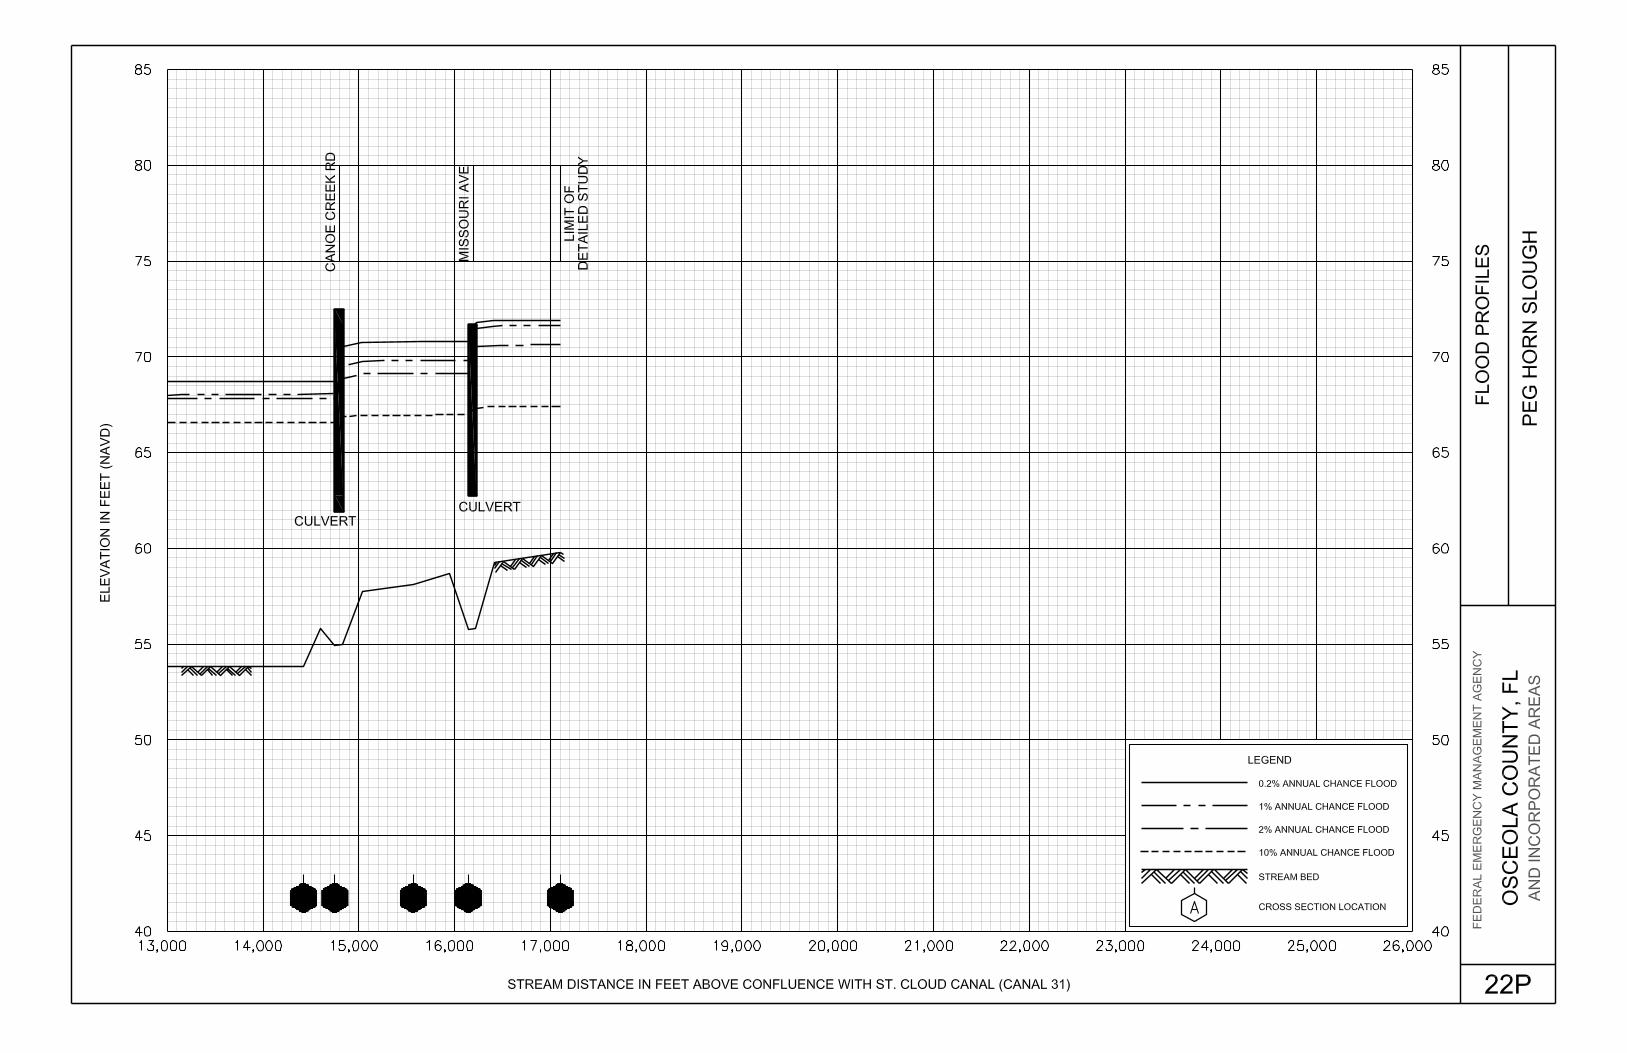
Peg Horn Slough 3.2
From a point approximately 150 feet upstream of its confluence with St. Cloud Canal (Canal 31) to a point approximately 950 feet upstream of Missouri Avenue
Pennywash Creek 0.7 2

Table 2: Flooding Sources Studied by Detailed Methods (continued)
7
Flooding Source
Reach Length (miles) or
Area (square miles) Limits of Study
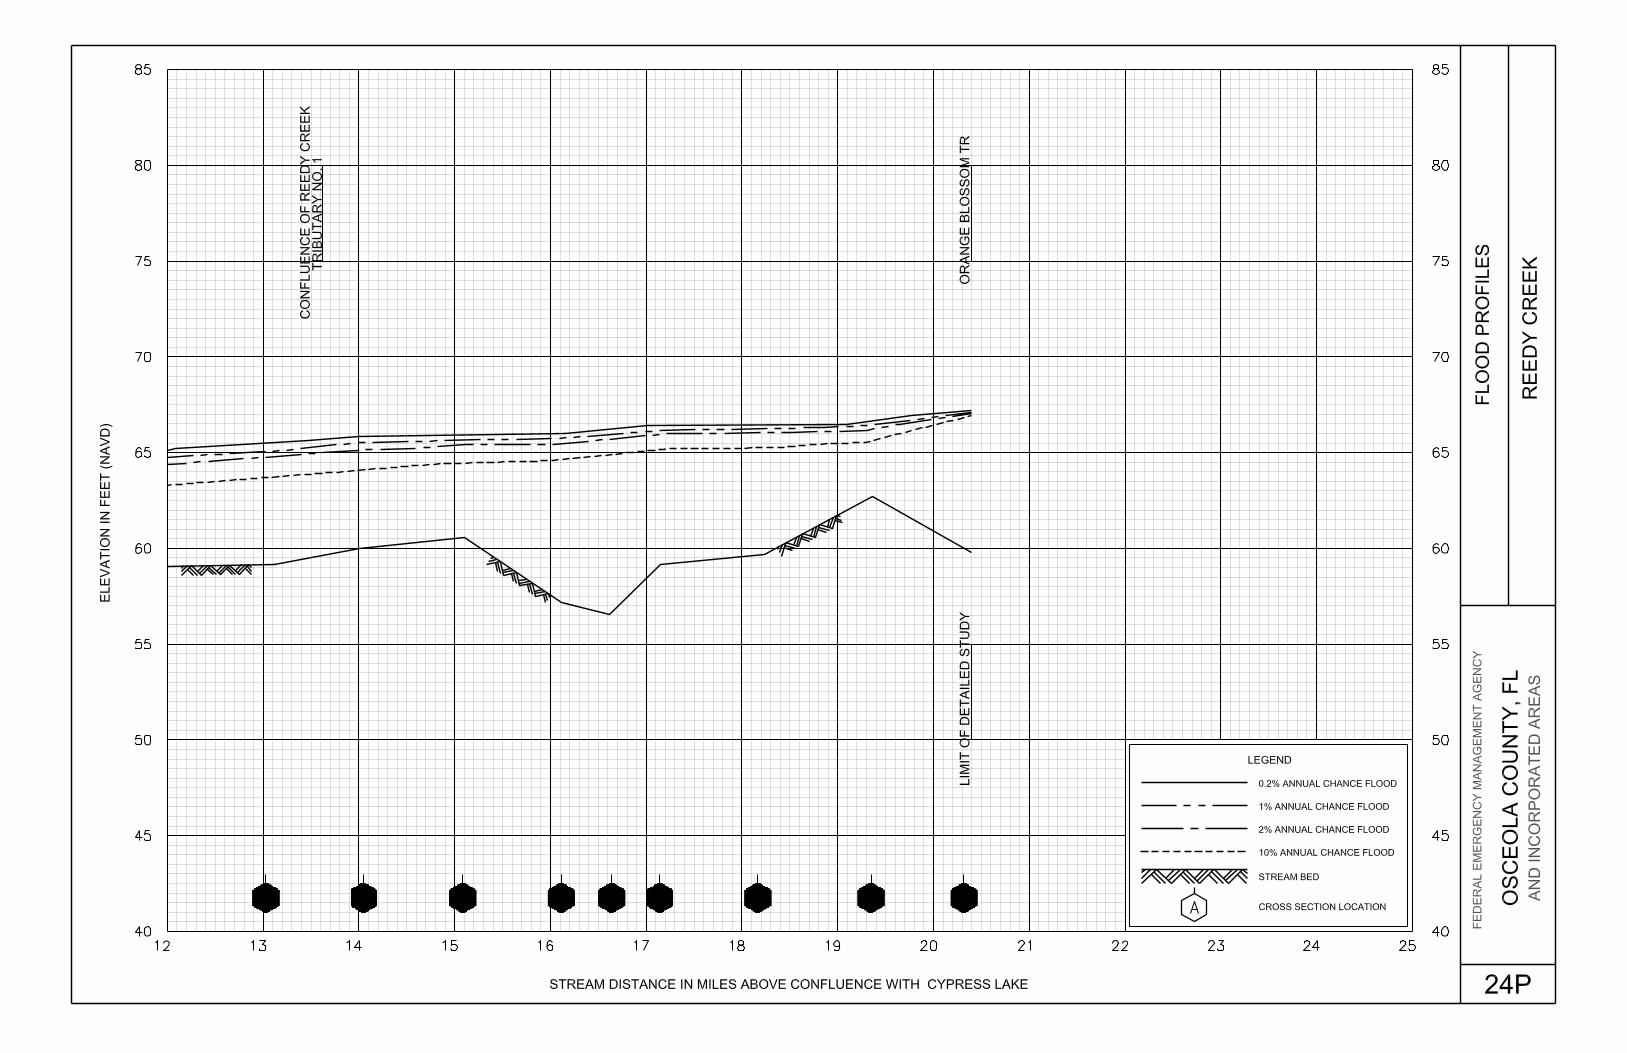
Reedy Creek 18.1 2
Reedy Creek Tributary No. 1 1.9 From its confluence with Reedy Creek to a point approximately 0.47 mile upstream of San Miguel Road
Reedy Creek Tributary No. 2 1.3 From its confluence with Reedy Creek to a point approximately 900 feet upstream of Marigold Avenue
Reedy Creek Tributary No. 3 2.8 From its confluence with Reedy Creek to San Remo Road
Rocky Pond 0.6 sq. mi. 2
Sardine Lake 1.4 2
Scrub Slough 1.6 2
Shingle Creek 9.2 From its confluence with Lake Tohopekaliga to a point approximately 100 feet upstream of Osceola Parkway
Short Canal 2.7 2
South Port Canal 0.4 2
St. Cloud Canal (Canal 31) 1.9 2
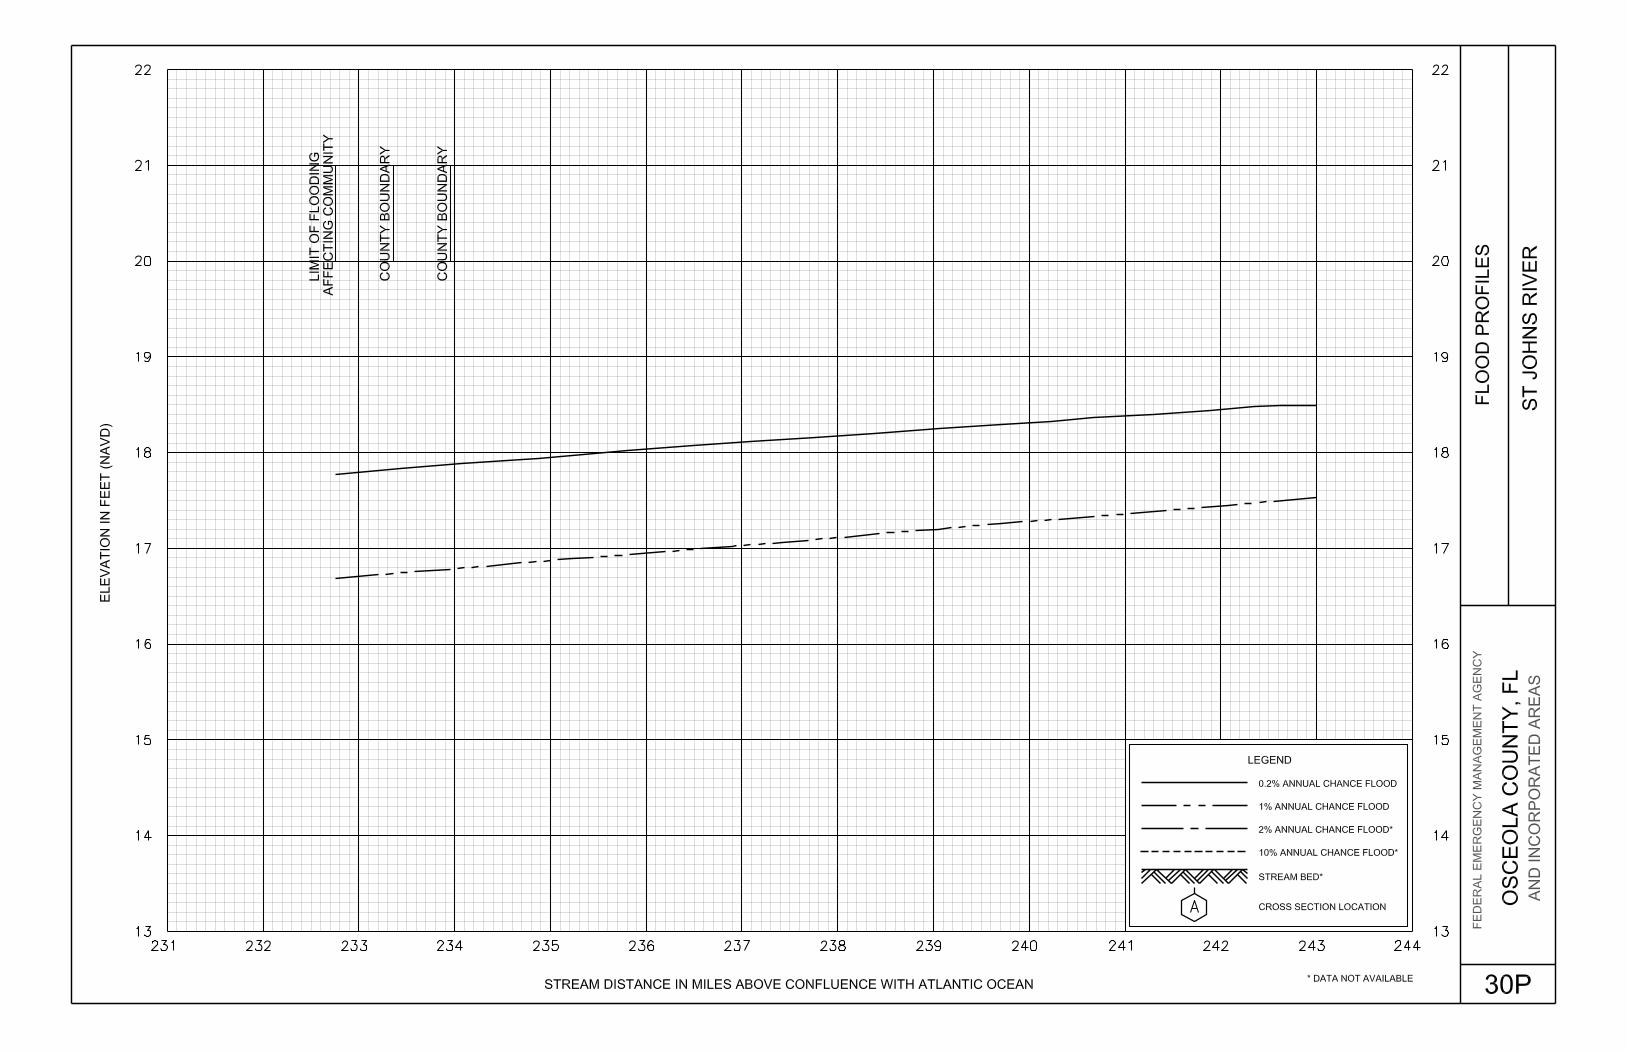
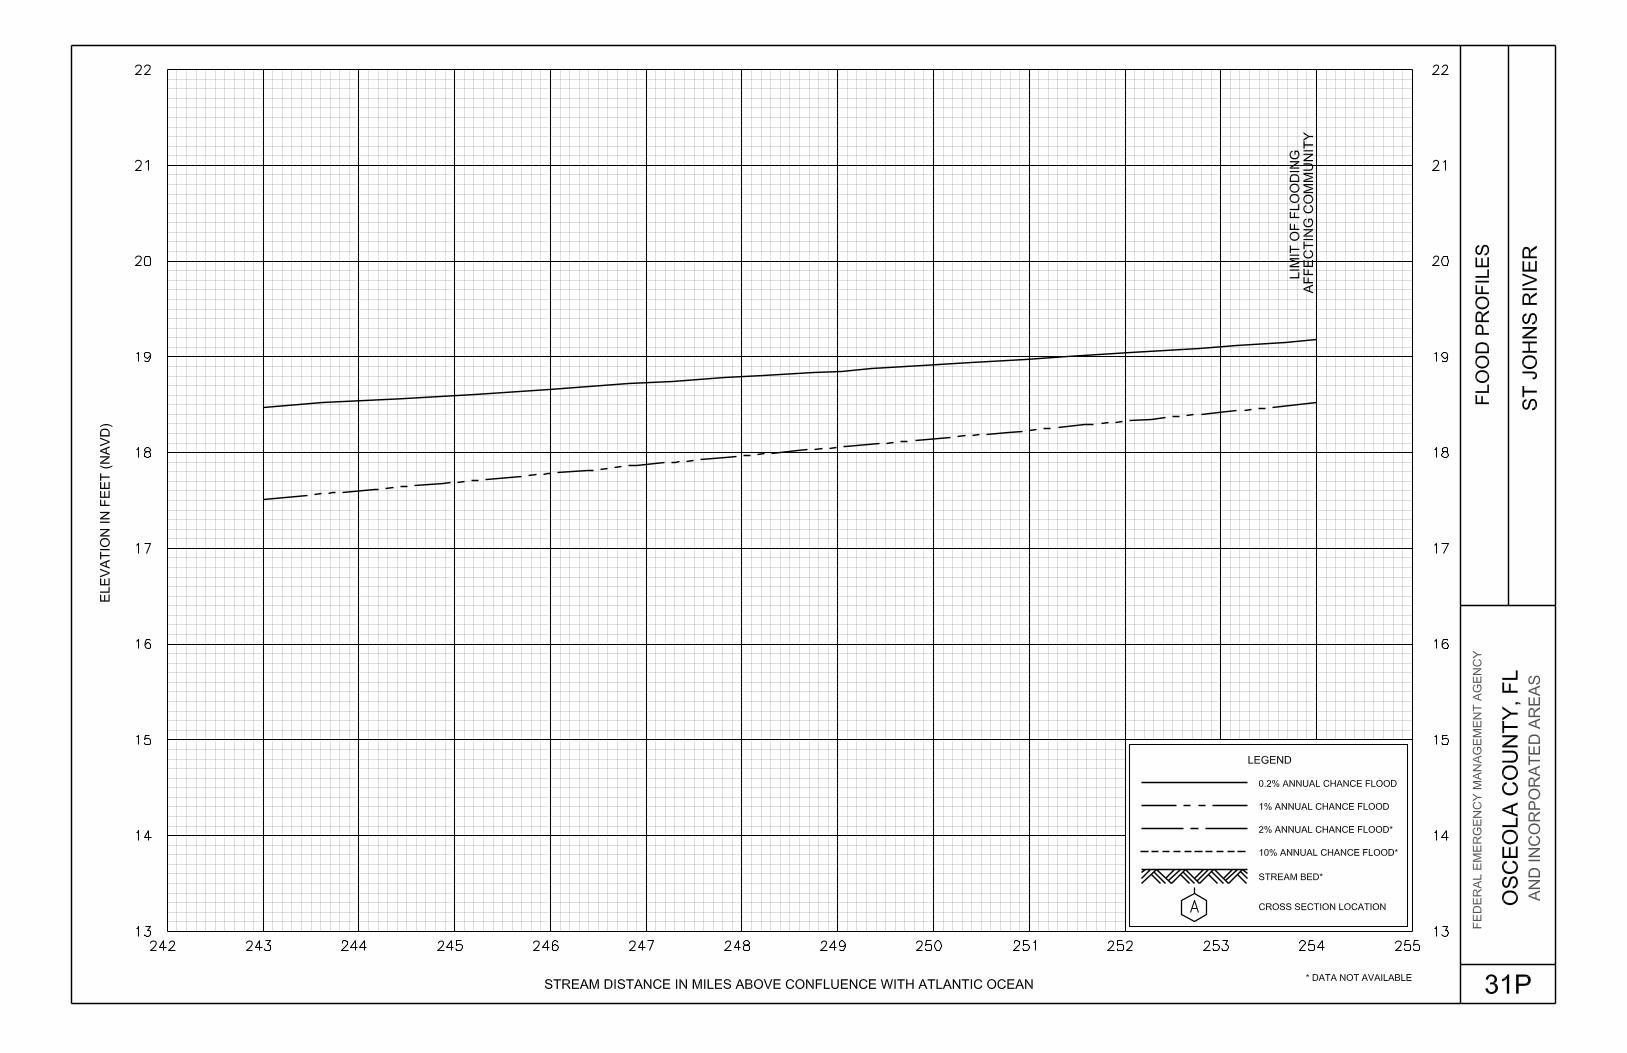
St. Johns River 20.2 2
Tributary No. 1 0.03 2
Trout Lake 3.1 For its entire shoreline within Osceola County
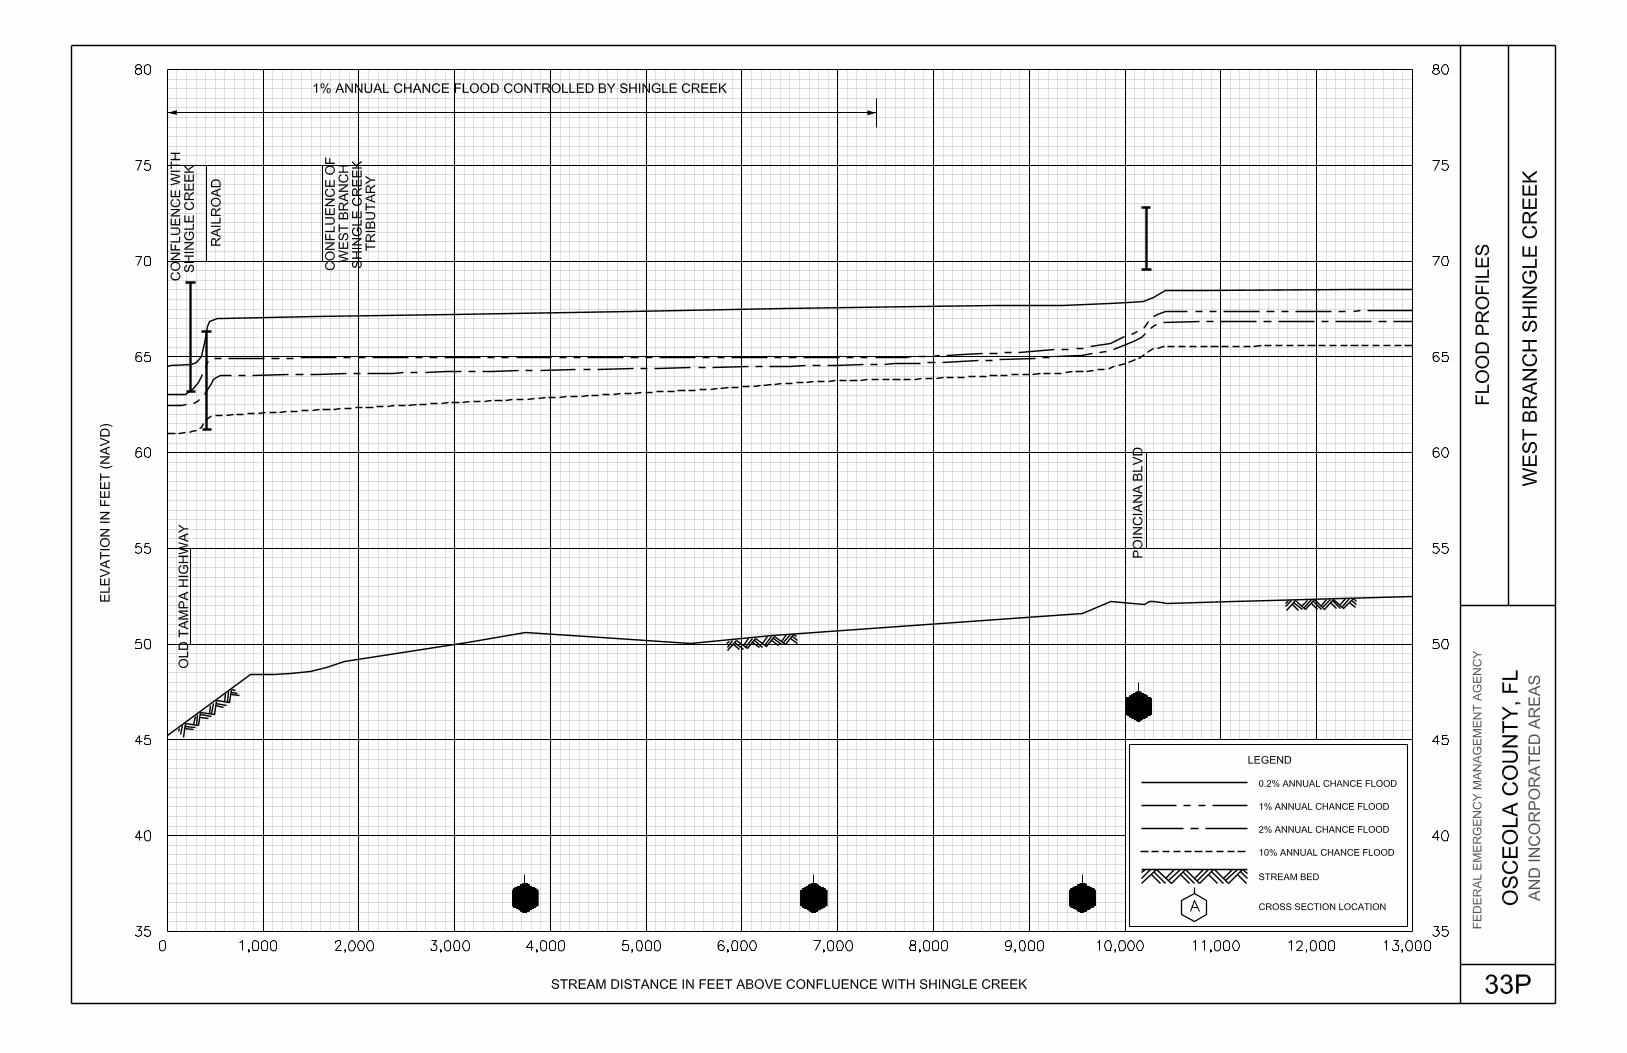
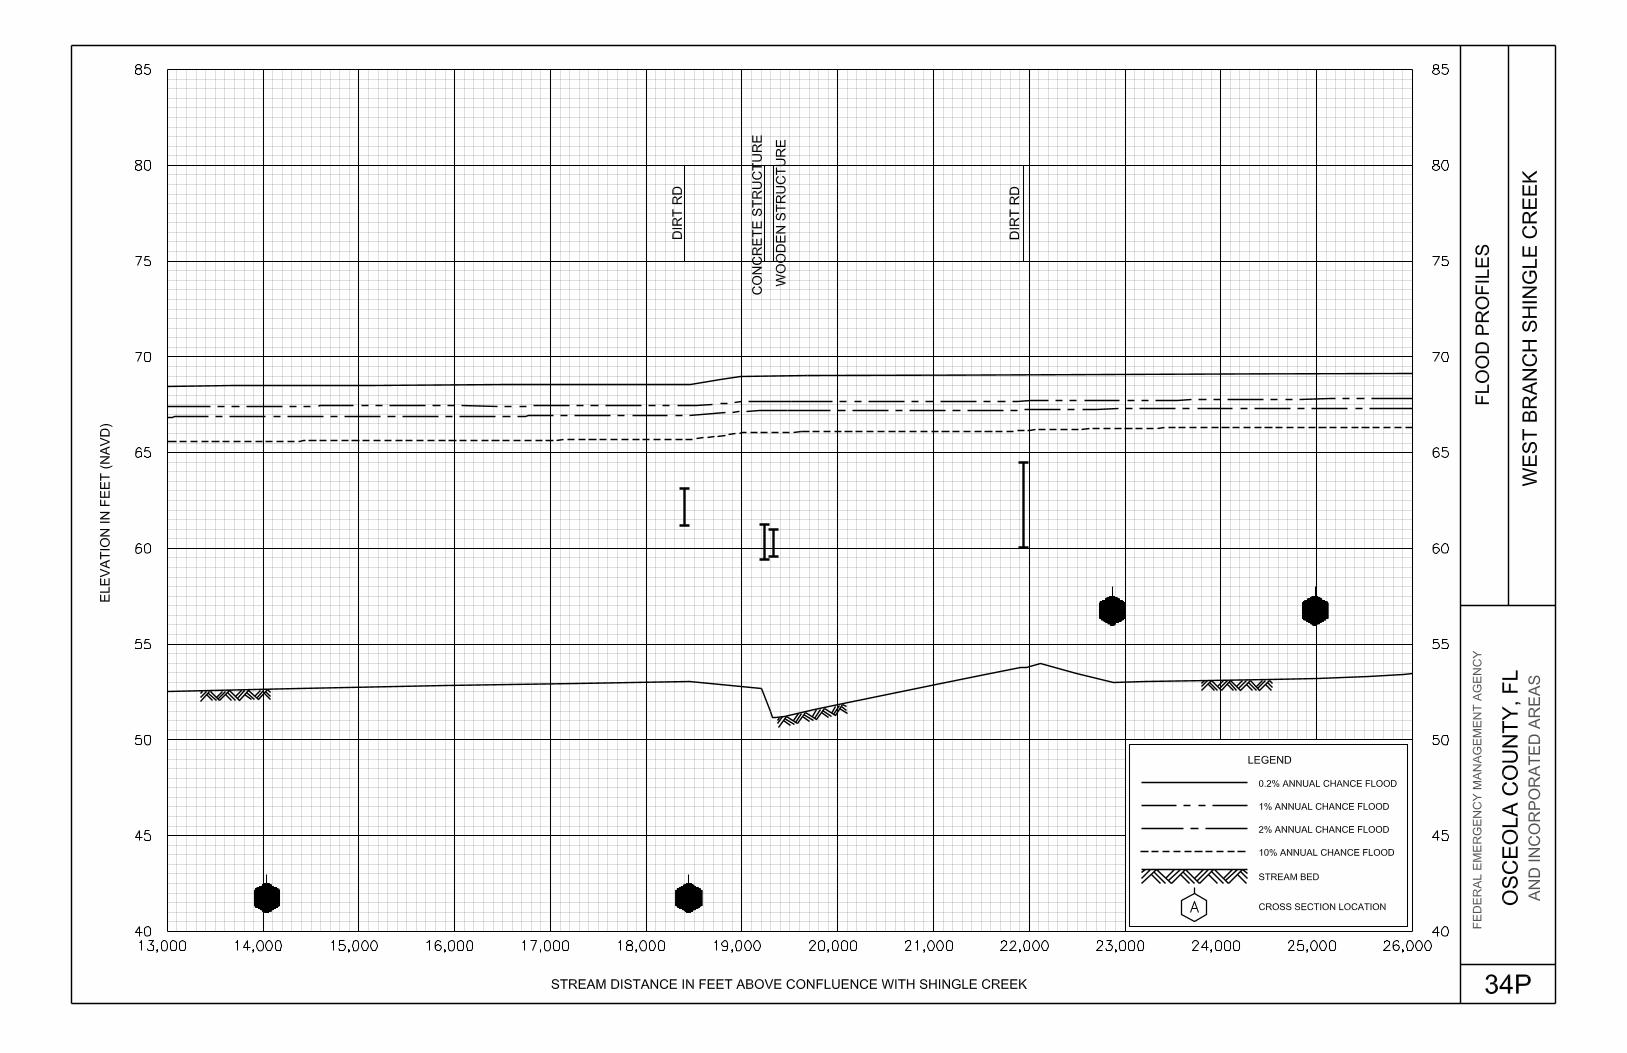
West Branch Shingle Creek4 6.7 From its confluence with Shingle Creek to a point approximately 4,200 feet upstream of Scott Boulevard
West City Canal 2.3 From its confluence with Lake Tohopekaliga to just upstream of Oak Street
WPA Canal 5.2 From just upstream of Old Canoe Creek Road to St. Cloud Airfield
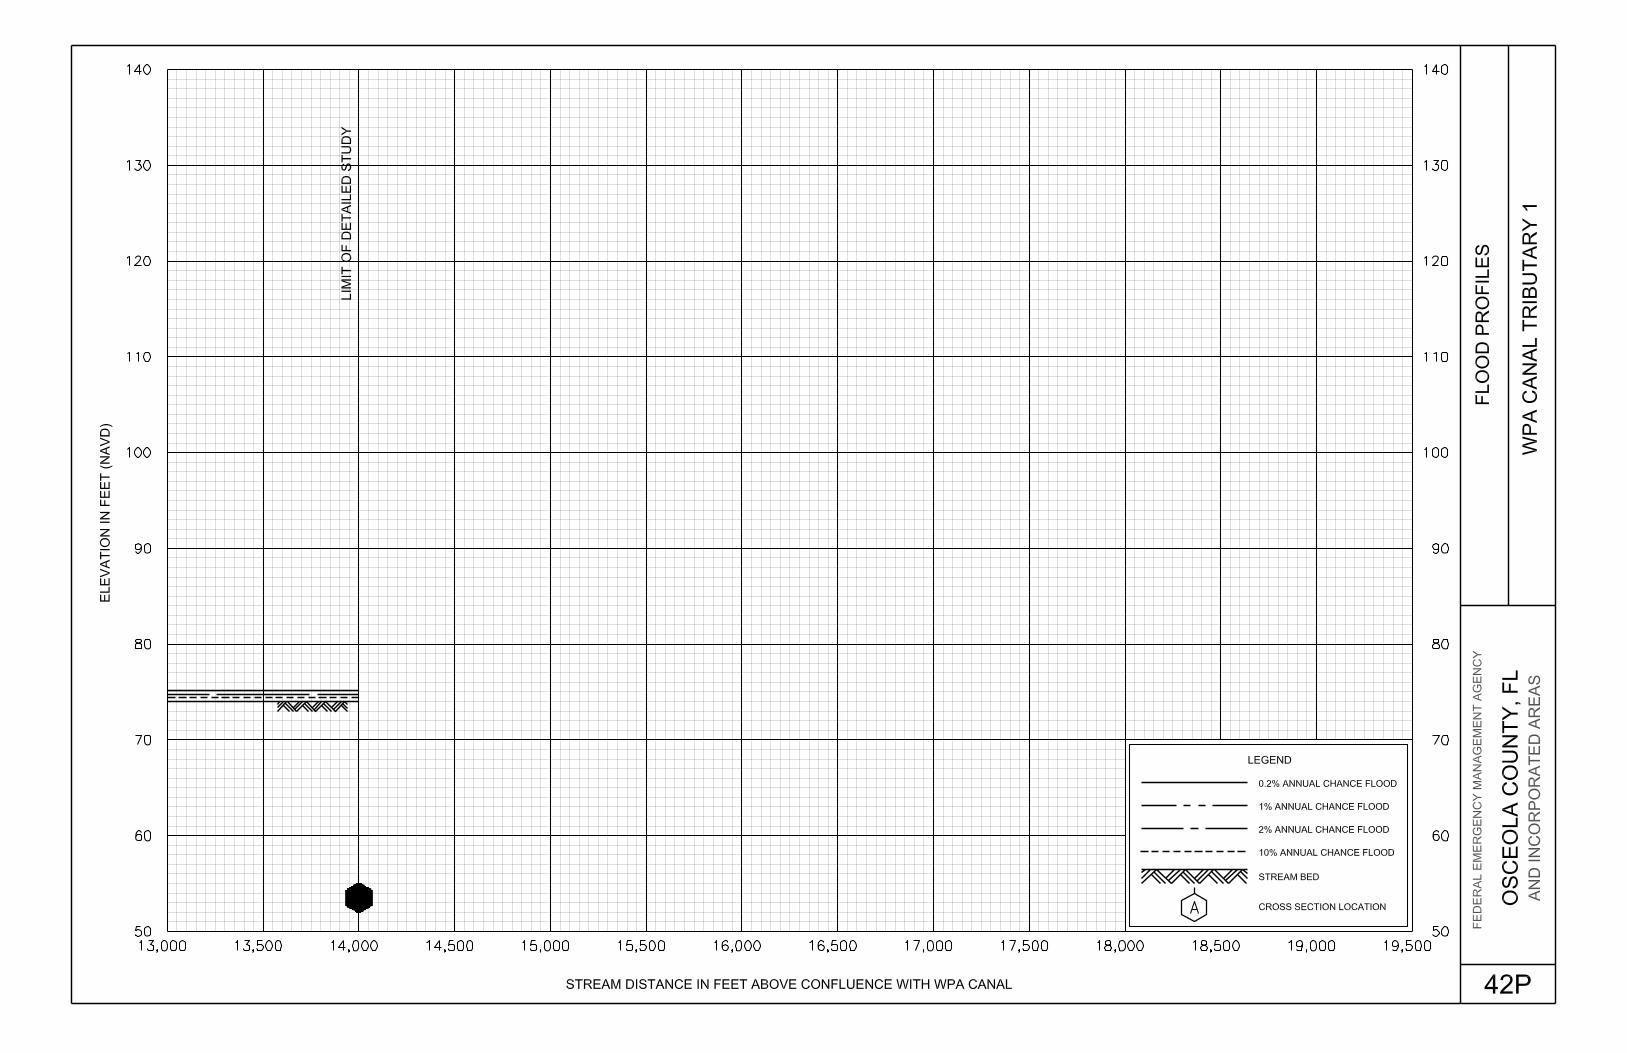
WPA Canal Tributary 11 2.7 From the confluence with WPA Canal to a point approximately 2.7 miles upstream

Table 2: Flooding Sources Studied by Detailed Methods (continued)
8
Flooding Source
Reach Length (miles) or
Area (square miles) Limits of Study
WPA Canal Tributary 1-11 0.8 From the confluence with WPA Canal Tributary 1 to a point approximately 4,000 feet upstream
Other Lakes/Ponds3 151.9 sq. mi. 2 1 Flooding source with new or revised analyses incorporated as part of the current study
update 2 Data not available 3Lakes and ponds were calculated from the Osceola County, Fl, GIS waterbodies datalayer 4In this revision, West Branch Shingle Creek Tributary has been combined with and
described under West Branch Shingle Creek (per LOMR 08-04-1601P)
All or portions of numerous streams were studied by approximate methods in previous studies; most of these studies were refined and Zone A was re-established in this revision. The flooding sources studied by approximate methods are listed in Table 3. Approximate analyses were used to study those areas having a low development potential or minimal flood hazards.
Table 3: Flooding Sources Studied by Approximate Methods
Flooding Source Reach Length (miles) or Area
(square miles)
Bass Slough 0.5
Beef Camp Branch 1.3
Blanket Bay Slough 7.7
Blue Cypress Creek 18.8
Boggy Branch 2.1
Bonnet Creek1 1.1
Bonnet Gully 2.6
Buck Lake 0.8 sq. mi.
Bull Creek 19.2
Cabbage Slough 2.4
Cat Lake 3.2 sq. mi.
Cow Log Branch 6.1
Cox Creek 6.4

Table 3: Flooding Sources Studied by Approximate Methods (continued)
9
Flooding Source Reach Length (miles) or Area
(square miles)
Crabgrass Creek 10.7
Cypress Lake 0.1 sq. mi.
Davenport Creek 0.9
Dead River 3.6
Elbow Branch 3.1
Fish Lake 0.4 sq. mi.
Gap Creek 2.9
Garrett Branch 3.5
Gator Branch 6.6
Hammock Branch 1.9
Hatchineha Canal 2.4
Hog Pen Slough 0.3 sq. mi.
Indian Branch 2.7
Jackson Canal 4.5
Jane Green Creek 3.6
Jim Branch 0.8
Kissimmee River 12.9
Lake Jackson 3.2
Lake Marian 8.0
Little Creek 3.2
Little North Prong 1.9
Major Sloush 0.2 sq. mi.
Mill Slough 0.9
North Branch Crabgrass Creek 2.2
North Fork Taylor Creek 5.2
NP (unnamed streams) 916.0
NP - Priority 1- Poinciana 0.6
NP - Priority 4 – Kennansville 14.7
Orchid Creek 7.5
Padgett Branch 0.8

Table 3: Flooding Sources Studied by Approximate Methods (continued)
10
Flooding Source Reach Length (miles) or Area
(square miles)
Pagett Branch 3.5
Peg Horn Slough 0.4
Pennywash Creek 9.0
Pine Island Slough 13.7
Rauslerson Branch 3.8
Reedy Creek 8.1
Rocky Pond 1.9 sq. mi.
Scrub Slough 2.6
Short Canal 2.5
Sixmile Creek 1.7
South Fork Taylor Creek 6.8
South Port Canal 5.0
South Prong Alafia River 2.1
Taylor Creek 2.1
Tenmile Creek 5.7
Tracy Branch 5.4
Tyson Creek 5.7
West Branch Crabgrass Creek 7.9
Wolf Creek 2.8
WPA Canal1 0.1
Yoke Branch 3.3
Other Lakes/Ponds2 41.6 sq. mi. 1Not restudied; data taken from previous countywide FIS report 2Lakes and ponds were calculated from the Osceola County, Fl, GIS waterbodies datalayer
This revision to the countywide FIS also incorporates the determination of letters issued by FEMA resulting in Letters of Map change as shown in Table 4, “Letters of Map Revision (LOMRs) Incorporated into Current Study.” Note that LOMR Case Number 08-04-1601P combined West Branch Shingle Creek Tributary and West Branch Shingle Creek, so all other tables in this revision to the countywide FIS do not list West Branch Shingle Creek Tributary separately from West Branch Shingle Creek.

11
Table 4: Letters of Map Revision (LOMRs) Incorporated into Current Study
Case Number Flooding Source(s) Communities Affected Effective
Date
01-04-537P Buck Lake Osceola County, Florida (Unincorporated Areas) 12/07/2001
03-04-309P Tributary No. 1 Osceola County, Florida (Unincorporated Areas) 12/22/2003
08-04-1601P West Branch Shingle Creek West Branch Shingle Creek Tributary
Osceola County, Florida (Unincorporated Areas)
City of Kissimmee 8/24/2009
09-04-6066P WPA Canal Osceola County, Florida (Unincorporated Areas) 7/30/2010
11-04-0259P Unnamed Flooding Area Osceola County, Florida (Unincorporated Areas) 3/22/2011
2.2 Community Description
Osceola County is located in central Florida. The county has an approximate total land area of 1,506 square miles. Osceola County is bordered by Orange County to the north, Brevard County to the northeast, Indian River County to the southeast, Okeechobee County to the south, and Polk County to the west. The population of Osceola County was estimated to be 270,618 in 2009 (Reference 3).
The floodplains of Osceola County consist of lowlands adjacent to the streams and lakes. The topography of Osceola County is relatively flat with some gently rolling hills. Ground elevations in Osceola County range from less than 5 feet NAVD 88 to 190 feet NAVD 88.
Osceola County's climate is semitropical, characterized by warm, humid summers, and mild dry winters. Daily maximum temperatures average 90 degrees Fahrenheit (°F) in summer, and average daily minimums are approximately 50°F in the winter. Temperature extremes of over 100°F or under 20°F are rare. The mean annual temperature is 72°F. The average annual precipitation over the study area is approximately 52 inches, and approximately 72 percent occurs from May to October, the rainy season.
Osceola County's soils consist of 11 soil associations. Three of these are either moderately well drained or excessively drained. The rest are soils that vary between poorly drained to very poorly drained (Reference 4).
In 2009 accommodation and food services was the larges economic sector, but agriculture makes up 63% of the land use. Cattle, citrus and commercial sod are the major agricultural products. The State of Florida has purchased 102,500 acres for land preservation; most of this acreage is included in the wildlife management areas Bull Creek, Triple N Ranch, and Three Lakes. The Nature Conservancy also maintains 4,730 acres (Reference 5).

12
2.3 Principal Flood Problems
Floods can occur in Osceola County at any time during the year; however, they are most frequent from June to October. Floods on the lakes can result from prolonged heavy rainfall over the study area combined with high antecedent lake stages. Floods on the streams can result from prolonged heavy rainfall over a large area. The flooding is usually more severe from rainfall associated with hurricanes or tropical storms and when antecedent rainfall has resulted in saturated ground conditions, which causes infiltration to be minimal. Cloudburst storms can occur at any time, but do not constitute a serious flood hazard in the study area.
Because Osceola County was practically undeveloped before the 1900s, flood records are scarce. The flood history, however, has been quite similar to that of the adjacent upper St. John's River basin, where records show that floods much greater than any of recent record occurred in 1871, and 1898, and that the floods of 1910, 1914, 1924, and 1933 were probably comparable with more recent major occurrences. In recent years, floods causing significant damage in Osceola County occurred in 1945, 1947, 1948, 1949, 1953, 1956, 1958, 1960, and 1968. Among these, the 1953 and 1960 floods were the highest of record.
The stages produced by the 1953 flood are generally the most severe of the floods on record. The flood-producing rainfall was one of the heaviest ever recorded in the study area, approximately 47 inches from June through October. Damages were severe throughout the study area and especially large for the cattle and food crop industries.
The flood of 1960 occurred when above normal seasonal rainfall coincided with the heavy rains of Hurricane Donna and Tropical Storm Florence in September. Discharges on the Kissimmee River below Lake Kissimmee peaked at 6,830 cubic feet per second (cfs) on September 30. This was near the maximum recorded discharge of 8,820 cfs which occurred in 1948.
In December 1997, heavy rains following a month of wet weather caused flash flooding of seventeen mobile homes and caused $400,000 in damages in St. Cloud. In October 2005, flooding damages occurred in St. Cloud when Hurricane Wilma resulted in 10 inches of rain across north and northwest Osceola County (Reference 6).
Slow moving thunderstorms over Osceola County on July 11, 2009, produced 4-5 inches of rain in less than 2 hours, resulting in accumulation of deep water northwest of Kissimmee. One hundred and nine homes were flooded, with 16 receiving major damage. Property damage as the result of this flooding was estimated at $4 million (Reference 6).
2.4 Flood Protection Measures
The USACE has constructed numerous flood protection measures in Osceola County. Regulation of the Kissimmee Lakes took place over a six-year period, from 1964 to 1970. It began with East Lake Tohopekaliga and proceeded down the west chain of lakes to Lake Kissimmee. Regulation of the west chain of lakes through Lake Kissimmee was essentially complete by 1965. Work then proceeded up the east chain of lakes reaching Lake Alligator by 1967. The regulation of the portion of the east chain of lakes from
13
Alligator to East Lake Tohopekaliga was accomplished from September 1967 to May 1970. Between 1964 to 1970 interim regulation schedules were adopted as soon as lake outlet works were completed. The plan was to implement permanent schedules upon completion of all works, including works on the Kissimmee River (C-38). However, even though numerous efforts were made, all parties concerned could not reach a unanimous decision, and each effort ended by recommending or awaiting additional studies. In 1975, after a comprehensive hydrologic study of Kissimmee basin, and two public meetings, the Central and Southern Florida Flood Control District prepared a report entitled "Report to the Governing Board on Regulatory Levels for Lakes in the Upper Kissimmee Basin." The schedules were approved by the USACE and adopted on February 9, 1976. Because of the possibility of further revision to Kissimmee Lakes regulation, the 1976 schedules have been adopted as interim schedules.
East Lake Tohopekaliga and a small tributary lake named Ajay are regulated by S-59, located in the St. Cloud Canal (C-31) between East Lake Tohopekaliga and Lake Tohopekaliga. Regulation did not begin until 1964, although construction of S-59 and C-31 was completed in April 1963. This was principally because regulation was contingent upon Lake Tohopekaliga outlet works, which were not completed in April 1963. The original regulation schedule was modified in 1967 and was used until 1976, when the existing schedule was introduced. The levels are regulated between 53.5 to 57.0 feet NAVD 88.
Lake Tohopekaliga is regulated by 5-61, located in Southport Canal (C-35) at the south shore of the lake. Construction of S-61 and C-35 was completed in October 1963 and regulation of Lake Tohopekaliga began in early 1964. In 1971 and again in 1979 the regulation schedules for Lakes Tohopekaliga, East Tohopekaliga, Kissimmee, Cypress, and Hatchineha were modified for implementation of the draw down of water levels in Lake Tohopekaliga. The drawdowns were conducted in cooperation with the Florida Game and Fresh Water Fish Commission for enhancement of fish habitat in the lake. The levels are regulated between 50.5 to 54.0 feet NAVD 88.
Lakes Kissimmee, Hatchineha, and Cypress are regulated by a final structure, S-65, located at the outlet of Lake Kissimmee at the head of C-38. The original General Design Memorandum plan called for Lakes Hatchineha and Bypass to be regulated together, but independently of Lake Kissimmee by a structure in the canal connecting Lakes Hatchineha and Kissimmee. Levels of Hatchineha and Cypress were to be one foot higher than those for Lake Kissimmee. However, it was determined feasible to combine the regulation whereby the Kissimmee schedule would be raised 0.5 foot and Hatchineha and Cypress would be lowered 0.4 foot. Regulation began after the completion of S-65 in August 1964. The levels are regulated between 47.3 to 51.3 feet NAVD 88.
Lake Gentry is regulated by S-63 located in C-34 at the south end of the lake. Water levels in C-34, downstream of S-63, are further stepped down by S-63A before it discharges into Lake Cypress. Regulation began in May 1967 with completion of S-63, S-63A, and C-34. The levels are regulated between 58.0 to 60.5 feet NAVD 88.
Lakes Alligator, Center, Coon, Trout, Lizzie, and Brick are controlled by two structures, S-58 located in C-32 which connects Lakes Trout and Joel, and S-60 located in C-23 between Lakes Alligator and Gentry. The southern outlet S-60 and C-33 were completed

14
in December 1966, thereby providing some regulatory control. However, it was not until the northern outlet (S-58) was completed in October 1969 that full control was possible. The levels are regulated between 60.4 to 62.9 feet NAVD 88.
Lakes Joel, Myrtle, and Preston are regulated by a single structure, S-57 located in C-30 connecting Lakes Myrtle and Mary Jane. Regulation began in September 1969 upon completion of S-57 and C-30. The levels are regulated between 58.4 to 60.9 feet NAVD 88.
Lakes Hart and Mary Jane are regulated by a single structure, S-62 located in C-29 which discharges into Lake Ajay. Regulation began in May 1970 after completion of S-62 and C-29 in October 1969. The levels are regulated between 58.4 to 60.0 NAVD 88.
The South Florida Water Management District has proposed a management plan for the Shingle Creek basin. The plan is the result of the combined efforts of the South Florida Water Management District, the Cities of Orlando and Kissimmee, and the Counties of Range and Osceola. The key elements of the plan are:
1. A floodplain management program through zoning or other appropriate means.
2. A capital improvement program that provides for the following structural improvements to alleviate existing flooding problems:
a. Excavation of the channel north of the turnpike in Orange County to provide greater runoff relief during the 1-percent-annual-chance flood.
b. Improvements to bridges at McLeaod Road, Orlando-Vineland Road, Interstate Route 4, and Americana Boulevard in Orange County and State Routes 600 and 531 in Osceola County.
c. Installation of a 2,700 cfs water control structure south of Oak Ridge Road in Orange County to prevent overdrainage and control erosion.
d. Creation of a floodway bypass of Shingle Creek between Old Tampa Highway and U.S. 17-92, in Osceola County, to reduce flood stages during major storm events and specifically the 1-percent-annual-chance flood in the lower reaches.
FEMA specifies that all levees must have a minimum of 3 foot freeboard against 1-percent-annual-chance flooding to be considered a safe flood protection structure.
Levees exist in the study area that provide the county with some degree of protection against flooding. However, it has been ascertained that these levees do not protect the county from rare events such as the 1-percent-annual-chance flood. The criteria used to evaluate protection against the 1-percent-annual-chance flood are 1) adequate design, including freeboard, 2) structural stability, and 3) proper operation and maintenance. Levees that do not protect against the 1-percent-annual-chance flood are not considered in the hydraulic analysis of the 1-percent-annual-chance floodplain.
15
As of this revised FIS report, there are no certified levees per Reg. 44 CFR 65.10 in Osceola County.
3.0 ENGINEERING METHODS
For the flooding sources studied by detailed methods in the community, standard hydrologic and hydraulic study methods were used to determine the flood-hazard data required for this study. Flood events of a magnitude that is expected to be equaled or exceeded once on the average during any 10-, 50-, 100-, or 500-year period (recurrence interval) have been selected as having special significance for floodplain management and for flood insurance rates. These events, commonly termed the 10-, 50-, 100-, and 500-year floods, have a 10-, 2-, 1-, and 0.2-percent chance, respectively, of being equaled or exceeded during any year. Although the recurrence interval represents the long-term, average period between floods of a specific magnitude, rare floods could occur at short intervals or even within the same year. The risk of experiencing a rare flood increases when periods greater than 1 year are considered. For example, the risk of having a flood that equals or exceeds the 1-percent-annual-chance flood in any 50-year period is approximately 40 percent (4 in 10); for any 90-year period, the risk increases to approximately 60 percent (6 in 10). The analyses reported herein reflect flooding potentials based on conditions existing in the community at the time of completion of this study. Maps and flood elevations will be amended periodically to reflect future changes.
3.1 Hydrologic Analyses
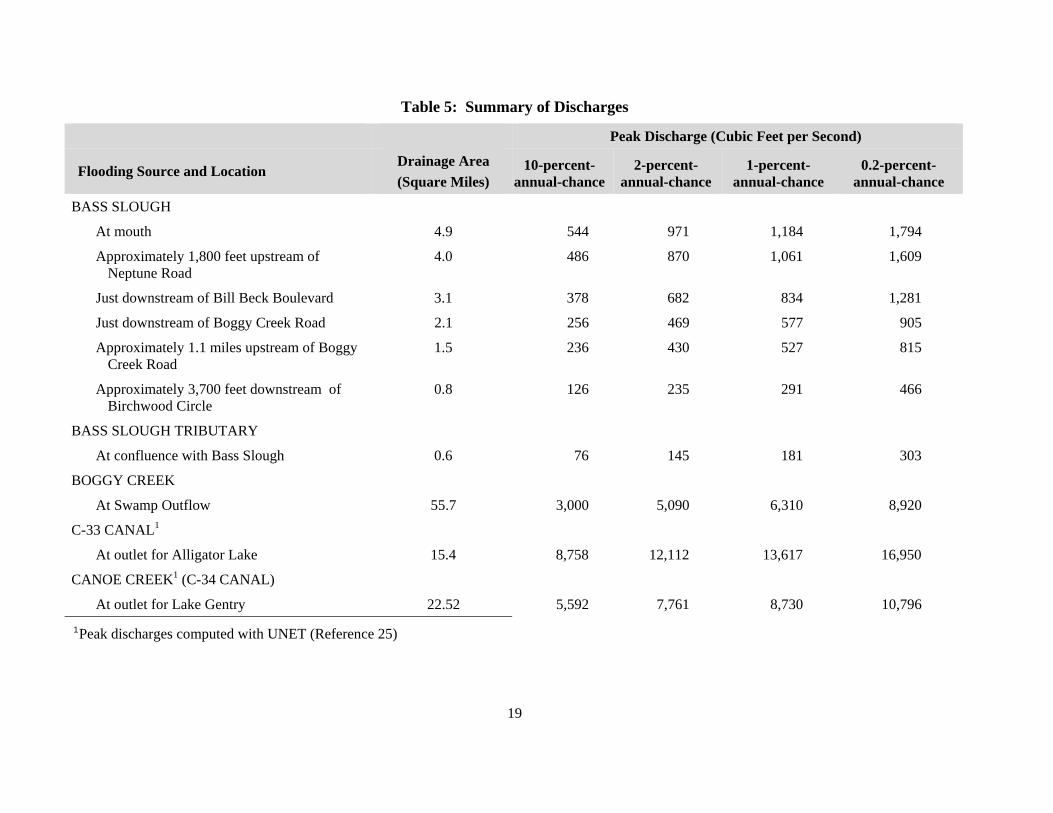
For this countywide study, hydrologic analyses were carried out to establish peak discharge frequency relationships for each flooding source studied by detailed and approximate methods affecting the community. A summary of peak discharge-drainage area relationships for streams studied by detailed methods is shown in Table 5, "Summary of Discharges."
The stillwater elevations for the 10-, 2-, 1-, and 0.2-percent-annual-chance floods for all lacustrine flooding sources have been determined and are summarized in Table 6, "Summary of Stillwater Elevations." All locations are for the entire shoreline within Osceola County.
3.1.1 Methods for Flooding Sources with New or Revised Analyses in Current Study
Peak flood discharges for 10-, 2-, 1-, and 0.2-percent-annual-chance recurrence intervals were developed for all streams studied by detailed methods (Reference 7). Peak discharges were developed for only the 1-percent-annual-chance recurrence interval for streams studied by approximate methods. The USGS regression equations for natural basins in Florida described in USGS Water-Resources Investigations Report (WRIR) 82-4012, Technique for Estimating Magnitude and Frequency of Floods on Natural-Flow Streams in Florida, was used for Bass Slough (Lower Reach), Bass Slough (Upper Reach), Bass Slough Tributary, WPA Canal Tributary 1, WPA Canal Tributary 1-1 and all approximately study streams (Reference 8). The USGS nationwide urban regression equations described in USGS Water-Supply Paper 2207, Flood

16
Characteristics of Urban Watersheds in the United States, were used for East City Canal Tributary 1 (Reference 9).
The basin delineations and drainage areas were determined using a digital terrain model (DTM) based on a 10’ x 10’ grid size digital elevation model (DEM) generated from a 1/3 arc-second National Elevation Dataset DEM, as well as 2006 LiDAR supplied by the City of Kissimmee.
3.1.2 Methods for Flooding Sources Incorporated from Previous Studies
This section describes the methodology used in previous studies of flooding sources incorporated into this FIS that were not revised for this countywide study. Hydrologic analyses were carried out to establish peak discharge-frequency relationships for each flooding source studied by detailed methods affecting the community.
Precountywide Analyses
Osceola County (Unincorporated Areas)
No long-term stream gages are located along Boggy Creek, Reedy Creek, Mill Slough, and the St. Cloud Canal in the unincorporated areas of Osceola County; the hydrologic data for these flooding sources were obtained from other studies (References 10-14).
Rainfall-frequency estimates were obtained by statistical analysis of records from eight long-term rainfall stations in and near Orange and Seminole Counties, Florida (Reference 15). Results of the rainfall study are summarized below.
Rainfall (inches)
Duration 10-percent-
annual-chance 2-percent-
annual-chance 1-percent-
annual-chance 0.2-percent-
annual-chance 24-hours 6.6 9.7 11.3 16.4 2 days 7.1 10.0 11.7 16.8 3 days 7.7 10.6 12.3 17.3 4 days 8.2 11.2 12.9 17.8 5 days 8.7 11.8 13.5 18.3 7 days 9.6 12.9 14.1 19.3 30 days 18.2 23.0 25.1 28.4
The amount of rainfall that will run off (rainfall excess) from a particular basin is less than the rainfall due to soil permeability, vegetation cover, and other characteristics. To estimate the rainfall excess, the Soil Conservation Service (SCS, now the Natural Resources Conservation Service) has developed runoff curve numbers that relate rainfall to direct runoff (Reference 16). The runoff curve numbers were used to calculate the infiltration losses based on the soil type and land use.

17
The volumetric-runoff method was used to analyze Brown and Buck Lakes, and Lakes Cecile, Davenport, Runnymede, and Wilson. This method involved analyzing several storms with respect to various lake basins to determine the percentage of rainfall that can be expected to run off the land and into the lakes, determining the rainfall recess, and determining the infiltration losses (Reference 16). The next step involved applying the 50-day rainfall, calculating the volume of rain falling directly on the lake by multiplying the rainfall depth by the lake areas, and calculating the volume of rainfall runoff from the land area in to the lake by determining the rainfall excess (Reference 15). The sum of the volume of rain falling on the lake and the volume of rain running off the land gives the total volume of rainfall the lake will receive during the particular storm. Area-capacity curves were developed for the lakes. The computed rainfall volumes were applied to the area-capacity curves revealing lake stage and inundated area for each particular storm.
Elevations for floods of the selected recurrence intervals on Lake Russell were determined from the hydrologic analyses for Reedy Creek (Reference 12).
Elevations for floods of the selected recurrence intervals of Lake Tohopekaliga, East Lake Tohopekaliga, and St. Cloud Canal were determined from flood routings conducted by the USACE, Jacksonville District, in conjunction with the flood control project (Reference 14). Elevations in Lake Runnymede are controlled by East Lake Tohopekaliga. Elevations in the St. Cloud Canal are controlled by Lake Tohopekaliga. In addition, there are flooding effects from Lake Mary Jane and West City Canal present in the county.
Cities of Kissimmee and St. Cloud
Rainfall-frequency estimates for Dakota Avenue Canal and Mill Slough in the City of St. Cloud and the City of Kissimmee, respectively, were obtained from the U.S. Weather Bureau Technical Paper No. 40 for the 10-, 2-, and 1-percent-annual-chance frequencies (Reference 17). The rainfall estimate for the 0.2-percent-annual-chance frequency was determined by graphical extrapolation of the rainfall-frequency curve established from Technical Paper No. 40 (Reference 17). The 24-hour rainfall-frequency estimates are as follows:
Rainfall (inches)
Duration 10-percent-
annual-chance 2-percent-
annual-chance 1-percent-
annual-chance 0.2-percent-
annual-chance
24-hours 7.5 9.4 10.4 12.9
The aforementioned SCS runoff curve numbers were used to calculate the infiltration losses based on the soil type and land use (Reference 16).
No stream gages are located on Dakota Avenue Canal and Mill Slough, which are both studied in detail in the City of St. Cloud and the City of Kissimmee,

18
respectively. The hydrology for these streams for the selected recurrence intervals was achieved using the SCS methodology to determine the unit hydrographs (Reference 16). Flood hydrographs were developed by applying the 24-hour rainfall excess to the unit hydrographs using the SCS Type-II storm distribution (Reference 16). The flood hydrographs were then routed and combined using the HEC-1 Flood Hydrograph package (Reference 18). The previously studied length of Dakota Avenue Canal was removed from this revision of the countywide FIS as the canal was replaced with an underground drainage system.
Elevations for floods of the selected recurrence intervals of Lake Tohopekaliga in the City of Kissimmee were determined from flood routings conducted by the USACE, Jacksonville District, in conjunction with the flood control project (Reference 14).
Revised Analyses for Countywide FIS
The hydrologic analyses used to estimate peak discharges for the St. Johns River were obtained from the St. Johns River Water Management District's report, The Mean Annual, 10-Year, 25-Year, and 1-percent-annual-chance Flood Profiles for the Upper St. Johns River Under Existing Conditions (Reference 19).
Hydrologic analyses for the other flooding sources were developed using the HEC-1 computer program (Reference 18). Rainfall values were determined from analysis of rain gage data for locations in and around Osceola County. Data was provided by the South Florida Water Management District and the National Weather Service (References 21 and 22). A 4-day storm was used based on historical patterns.
Times of concentration were determined using either the SCS velocity method or the SCS lag equation (Reference 23). Rainfall infiltration calculations were based on SCS curve number methods. Curve numbers were calculated based on SCS Osceola County soil map land use as determined from 1990 Florida Department of Transportation aerials and site visits (References 24 and 4).
Snyder Unit hydrographs were used to determined basin runoff. Peak rate factors were determined based on slopes of the basin and corresponding SCS peak rate values, and calibration.
19
Table 5: Summary of Discharges
Peak Discharge (Cubic Feet per Second)
Flooding Source and Location Drainage Area (Square Miles)
10-percent-annual-chance
2-percent-annual-chance
1-percent-annual-chance
0.2-percent-annual-chance
BASS SLOUGH
At mouth 4.9 544 971 1,184 1,794
Approximately 1,800 feet upstream of Neptune Road
4.0 486 870 1,061 1,609
Just downstream of Bill Beck Boulevard 3.1 378 682 834 1,281
Just downstream of Boggy Creek Road 2.1 256 469 577 905
Approximately 1.1 miles upstream of Boggy Creek Road
1.5 236 430 527 815
Approximately 3,700 feet downstream of Birchwood Circle
0.8 126 235 291 466
BASS SLOUGH TRIBUTARY
At confluence with Bass Slough 0.6 76 145 181 303
BOGGY CREEK
At Swamp Outflow 55.7 3,000 5,090 6,310 8,920
C-33 CANAL1
At outlet for Alligator Lake 15.4 8,758 12,112 13,617 16,950
CANOE CREEK1 (C-34 CANAL)
At outlet for Lake Gentry 22.52 5,592 7,761 8,730 10,796 1Peak discharges computed with UNET (Reference 25)
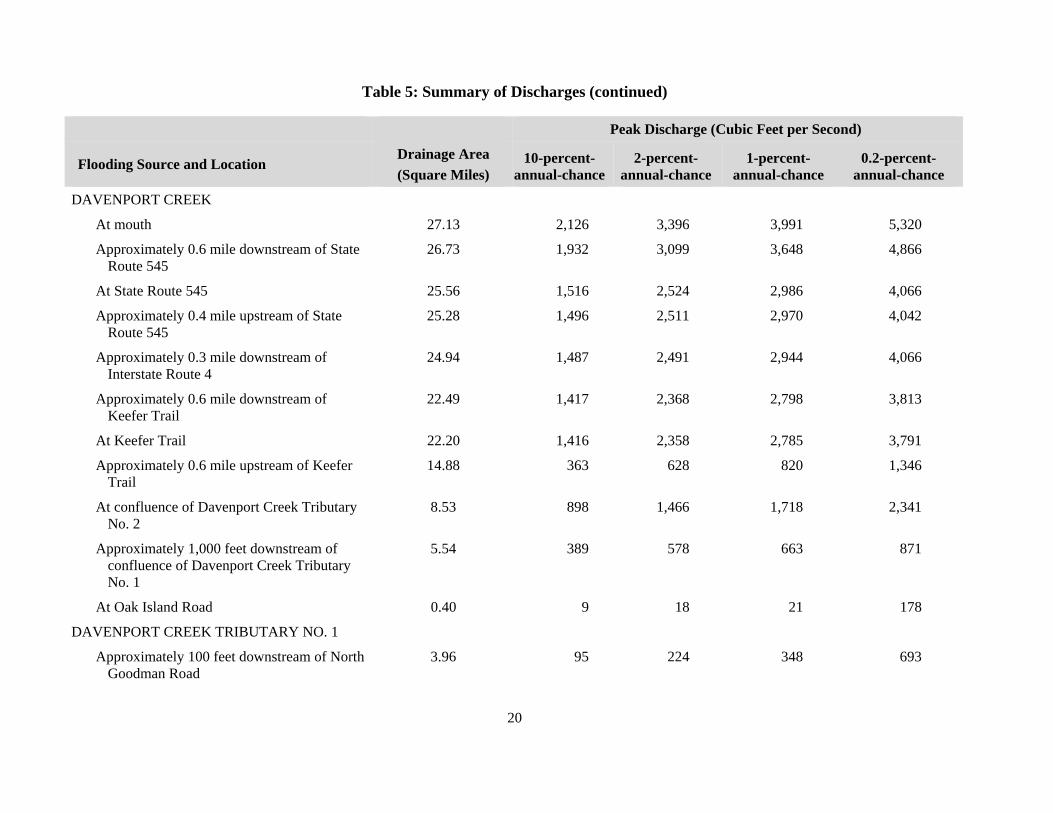
Table 5: Summary of Discharges (continued)
20
Peak Discharge (Cubic Feet per Second)
Flooding Source and Location Drainage Area (Square Miles)
10-percent-annual-chance
2-percent-annual-chance
1-percent-annual-chance
0.2-percent-annual-chance
DAVENPORT CREEK
At mouth 27.13 2,126 3,396 3,991 5,320
Approximately 0.6 mile downstream of State Route 545
26.73 1,932 3,099 3,648 4,866
At State Route 545 25.56 1,516 2,524 2,986 4,066
Approximately 0.4 mile upstream of State Route 545
25.28 1,496 2,511 2,970 4,042
Approximately 0.3 mile downstream of Interstate Route 4
24.94 1,487 2,491 2,944 4,066
Approximately 0.6 mile downstream of Keefer Trail
22.49 1,417 2,368 2,798 3,813
At Keefer Trail 22.20 1,416 2,358 2,785 3,791
Approximately 0.6 mile upstream of Keefer Trail
14.88 363 628 820 1,346
At confluence of Davenport Creek Tributary No. 2
8.53 898 1,466 1,718 2,341
Approximately 1,000 feet downstream of confluence of Davenport Creek Tributary No. 1
5.54 389 578 663 871
At Oak Island Road 0.40 9 18 21 178
DAVENPORT CREEK TRIBUTARY NO. 1
Approximately 100 feet downstream of North Goodman Road
3.96 95 224 348 693

Table 5: Summary of Discharges (continued)
21
Peak Discharge (Cubic Feet per Second)
Flooding Source and Location Drainage Area (Square Miles)
10-percent-annual-chance
2-percent-annual-chance
1-percent-annual-chance
0.2-percent-annual-chance
DAVENPORT CREEK TRIBUTARY NO. 2
Approximately 0.9 mile upstream of mouth 1.56 679 1,066 1,239 1,626
EAST CITY CANAL1
At mouth 6.37 1,128 1,531 1,661 2,018
EAST CITY CANAL TRIBUTARY 1
At confluence with East City Canal 0.9 375 575 687 932
MILL SLOUGH
At U.S. Route 441 11.6 710 1,040 1,360 2,050
At Mill Slough Road 10.7 660 970 1,300 1,900
PEG HORN SLOUGH
At mouth 2.28 714 1,003 1,090 1,258
At Neptune Road 2.01 612 840 896 1,008
At Old Landfill entrance road 1.19 351 416 420 427
At Canoe Creek Road 0.46 209 398 465 508
REEDY CREEK
At Cypress Lake 282.0 3,300 5,000 5,700 6,350
At Lake Russell 264.0 2,700 4,000 4,500 5,100
At U.S. Route 92 bridge 209.0 800 1,100 1,100 1,100 1Peak discharges computed with UNET (Reference 25)

Table 5: Summary of Discharges (continued)
22
Peak Discharge (Cubic Feet per Second)
Flooding Source and Location Drainage Area (Square Miles)
10-percent-annual-chance
2-percent-annual-chance
1-percent-annual-chance
0.2-percent-annual-chance
REEDY CREEK TRIBUTARY NO. 1
At mouth 1.83 458 656 32 893
At Marigold Avenue 1.63 336 445 484 559
At San Miguel Road 1.04 145 179 194 231
REEDY CREEK TRIBUTARY NO. 2
At mouth 0.42 241 357 408 511
At Marigold Avenue 0.19 45 55 5 69
REEDY CREEK TRIBUTARY NO. 3
At mouth 1.02 223 280 299 344
At Doverplum Avenue 0.90 204 253 264 290
At K.O.A. Street 0.09 63 64 64 64
SHINGLE CREEK
Approximately 0.3 mile downstream of U.S. Route 17
100.15 5,029 7,561 9,256 13,787
At U.S. Route 17 99.53 5,026 7,552 9,275 13,775
At State Route 531 98.99 5,014 7,541 9,268 13,756
Approximately 0.2 mile upstream of State Route 531
98.09 4,989 7,520 9,246 13,721
At Old Tampa Highway 97.19 4,967 7,500 9,227 13,688
Approximately 1.2 miles upstream of CSX Transportation 78.18 4,208 7,005 8,296 11,618

Table 5: Summary of Discharges (continued)
23
Peak Discharge (Cubic Feet per Second)
Flooding Source and Location Drainage Area (Square Miles)
10-percent-annual-chance
2-percent-annual-chance
1-percent-annual-chance
0.2-percent-annual-chance
SHINGLE CREEK (continued)
At State Route 530 76.27 4,183 6,966 8,247 11,549
Approximately 1.1 miles upstream of State Route 530 75.14 4,167 6,942 8,218 11,515
Approximately 1.5 miles downstream of Osceola Parkway 71.54 4,121 6,866 8,124 11,353
At Osceola Parkway 64.67 4,079 6,713 7,929 11,041
TRIBUTARY NO. 1
At CSX Transportation 2.2 2 2 602 2
At Old Lake Wilson Road 0.2 2 2 336 2
WEST BRANCH SHINGLE CREEK 3
Approximately 0.7 mile upstream of mouth 16.81 2,616 3,790 4,351 5,640
Approximately 650 feet downstream of Poinciana Boulevard 12.19 2,519 3,673 4,223 5,456
Approximately 0.7 mile downstream of Camelot Country Way 4.52 1,952 2,726 3,033 3,790
Approximately 0.2 mile upstream of Scott Boulevard 1.53 759 1,039 1,153 1,415
2 Data Not Available 3 Includes West Branch Shingle Creek Tributary listed separately in previous FIS reports
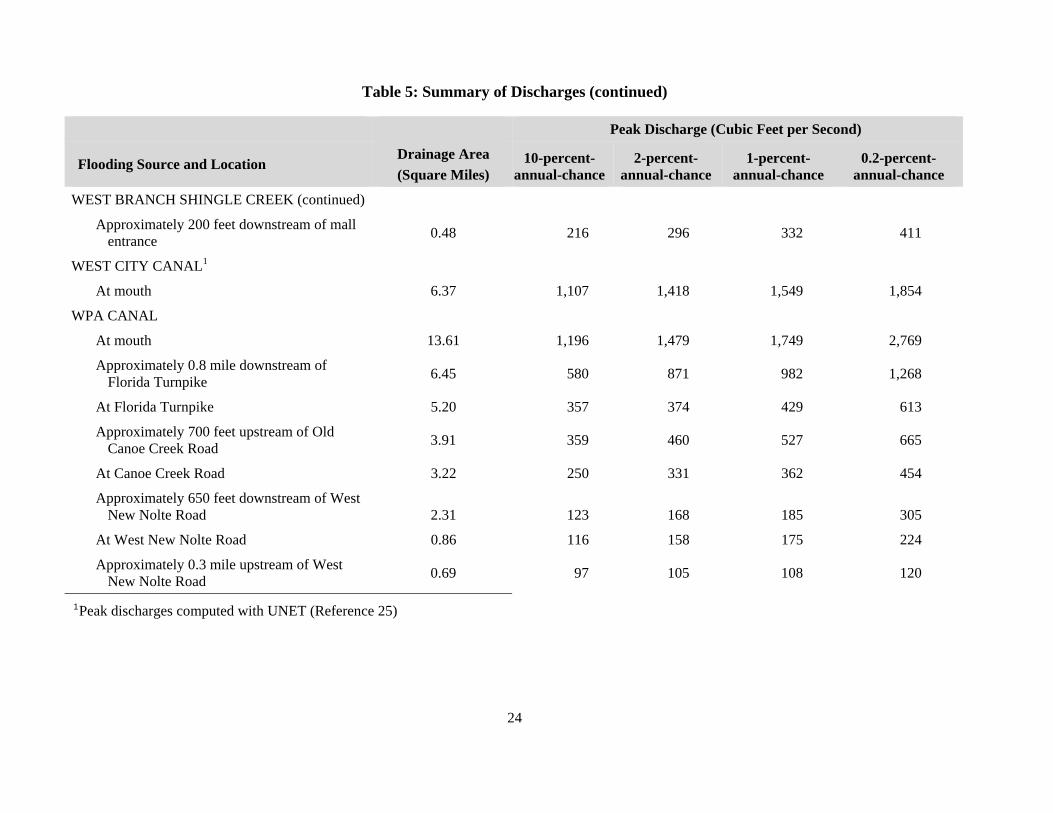
Table 5: Summary of Discharges (continued)
24
Peak Discharge (Cubic Feet per Second)
Flooding Source and Location Drainage Area (Square Miles)
10-percent-annual-chance
2-percent-annual-chance
1-percent-annual-chance
0.2-percent-annual-chance
WEST BRANCH SHINGLE CREEK (continued)
Approximately 200 feet downstream of mall entrance 0.48 216 296 332 411
WEST CITY CANAL1
At mouth 6.37 1,107 1,418 1,549 1,854
WPA CANAL
At mouth 13.61 1,196 1,479 1,749 2,769
Approximately 0.8 mile downstream of Florida Turnpike 6.45 580 871 982 1,268
At Florida Turnpike 5.20 357 374 429 613
Approximately 700 feet upstream of Old Canoe Creek Road 3.91 359 460 527 665
At Canoe Creek Road 3.22 250 331 362 454
Approximately 650 feet downstream of West New Nolte Road 2.31 123 168 185 305
At West New Nolte Road 0.86 116 158 175 224
Approximately 0.3 mile upstream of West New Nolte Road 0.69 97 105 108 120
1Peak discharges computed with UNET (Reference 25)

Table 5: Summary of Discharges (continued)
25
Peak Discharge (Cubic Feet per Second)
Flooding Source and Location Drainage Area (Square Miles)
10-percent-annual-chance
2-percent-annual-chance
1-percent-annual-chance
0.2-percent-annual-chance
WPA CANAL TRIBUTARY 1
At confluence with WPA Canal 4.4 166 317 399 695
Just upstream of confluence of WPA Canal Tributary 1-1
3.4 138 265 334 584
Approximately 1.7 miles upstream of confluence of WPA Canal Tributary 1-1
1.7 84 162 205 363
WPA CANAL TRIBUTARY 1-1
At confluence with WPA Canal Tributary 1 0.7 137 253 312 488 1Peak discharges computed with UNET (Reference 25) 2 Data Not Available 3 Includes West Branch Shingle Creek Tributary listed separately in previous FIS reports

26
Table 6: Summary of Stillwater Elevations
Elevation (feet NAVD88)
Flooding Source and Location
10-percent-annual-chance
2-percent- annual-chance
1-percent- annual-chance
0.2-percent-annual-chance
ALLIGATOR LAKE 64.4 65.2 65.5 66.1
BRICK LAKE 64.5 65.2 65.5 66.2
BROWN LAKE 63.1 63.7 64.0 64.8
BUCK LAKE * * 104.3 107.5
CLAY HOLE POND * * 65.5 *
COON LAKE 64.5 65.3 65.6 66.2
EAGLE POND * * 65.4 *
EAST LAKE TOHOPEKALIGA 57.6 59.5 61.0 63.0
LAKE BULLOCK 64.6 65.4 65.7 66.3
LAKE CECILE 75.4 75.9 76.2 77.0
LAKE CENTER 64.6 65.4 65.7 66.3
LAKE DAVENPORT 111.0 111.6 112.1 112.7
LAKE GENTRY 64.3 65.4 65.8 66.7
LAKE HATCHINEHA * * 55.8 *
LAKE JOEL 62.1 62.9 63.2 64.0
LAKE KISSIMMEE 52.4 * 54.3 *
LAKE LIZZIE 64.4 65.2 65.6 66.1
LAKE MARIAN * * 59.1 *
LAKE MARY JANE 54.9 56.5 57.1 58.6
LAKE MYRTLE 62.1 62.9 63.2 64.0
LAKE PRESTON 62.1 62.9 63.2 64.0
LAKE RUNNYMEDE 57.6 59.5 61.0 63.0
LAKE TOHOPEKALIGA 54.9 56.5 57.1 58.6
LAKE WILSON 105.2 106.2 106.5 107.5
LIVE OAK LAKE 64.4 69.2 65.6 66.1
OTTER POND * * 68.7 *
PEARL LAKE 64.5 65.2 65.5 66.2
*Data not available
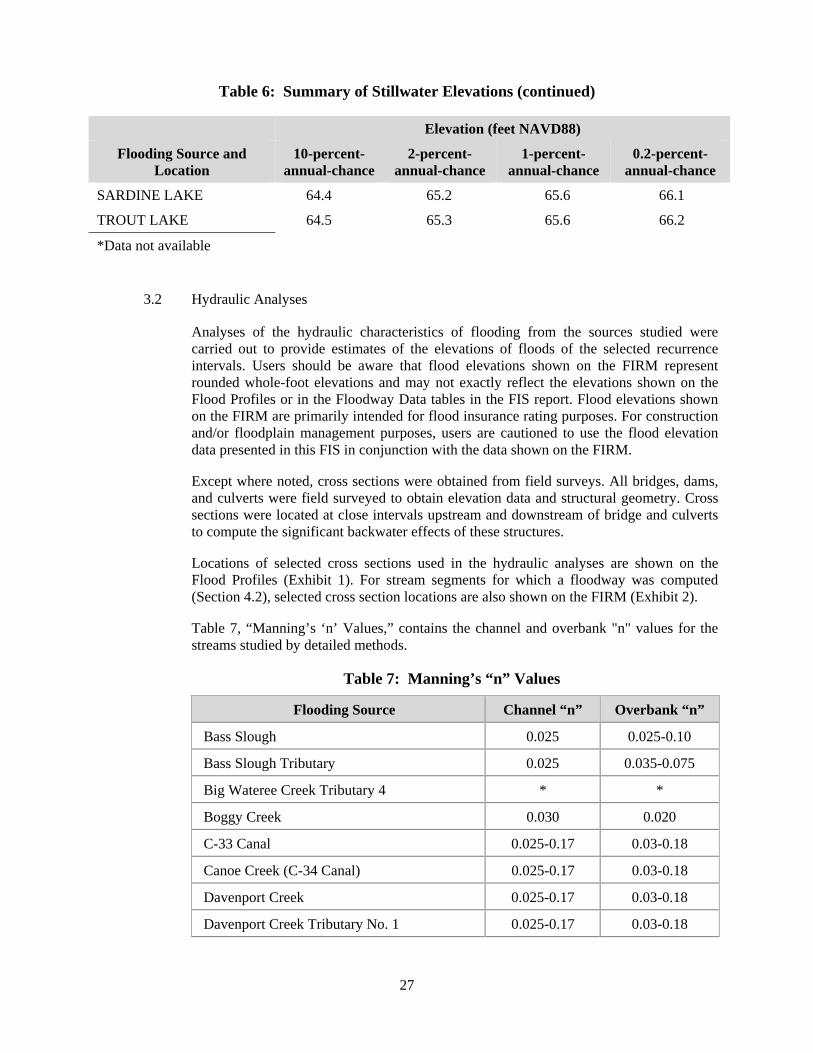
Table 6: Summary of Stillwater Elevations (continued)
27
Elevation (feet NAVD88)
Flooding Source and Location
10-percent-annual-chance
2-percent- annual-chance
1-percent- annual-chance
0.2-percent-annual-chance
SARDINE LAKE 64.4 65.2 65.6 66.1
TROUT LAKE 64.5 65.3 65.6 66.2
*Data not available
3.2 Hydraulic Analyses
Analyses of the hydraulic characteristics of flooding from the sources studied were carried out to provide estimates of the elevations of floods of the selected recurrence intervals. Users should be aware that flood elevations shown on the FIRM represent rounded whole-foot elevations and may not exactly reflect the elevations shown on the Flood Profiles or in the Floodway Data tables in the FIS report. Flood elevations shown on the FIRM are primarily intended for flood insurance rating purposes. For construction and/or floodplain management purposes, users are cautioned to use the flood elevation data presented in this FIS in conjunction with the data shown on the FIRM.
Except where noted, cross sections were obtained from field surveys. All bridges, dams, and culverts were field surveyed to obtain elevation data and structural geometry. Cross sections were located at close intervals upstream and downstream of bridge and culverts to compute the significant backwater effects of these structures.
Locations of selected cross sections used in the hydraulic analyses are shown on the Flood Profiles (Exhibit 1). For stream segments for which a floodway was computed (Section 4.2), selected cross section locations are also shown on the FIRM (Exhibit 2).
Table 7, “Manning’s ‘n’ Values,” contains the channel and overbank "n" values for the streams studied by detailed methods.
Table 7: Manning’s “n” Values
Flooding Source Channel “n” Overbank “n”
Bass Slough 0.025 0.025-0.10
Bass Slough Tributary 0.025 0.035-0.075
Big Wateree Creek Tributary 4 * *
Boggy Creek 0.030 0.020
C-33 Canal 0.025-0.17 0.03-0.18
Canoe Creek (C-34 Canal) 0.025-0.17 0.03-0.18
Davenport Creek 0.025-0.17 0.03-0.18
Davenport Creek Tributary No. 1 0.025-0.17 0.03-0.18

Table 7: Manning’s “n” Values (continued)
28
Flooding Source Channel “n” Overbank “n”
Davenport Creek Tributary No. 2 0.025-0.17 0.03-0.18
East City Canal 0.025-0.17 0.03-0.18
East City Canal Tributary 1 0.025-0.11 0.035-0.11
Mill Slough in City of Kissimmee 0.04 0.50
Mill Slough in Osceola County (Unincorporated Areas) 0.030 0.020
Peg Horn Slough 0.025-0.17 0.03-0.18
Reedy Creek 0.030 0.020
Reedy Creek Tributary No. 1 0.025-0.17 0.03-0.18
Reedy Creek Tributary No. 2 0.025-0.17 0.03-0.18
Reedy Creek Tributary No. 3 0.025-0.17 0.03-0.18
Shingle Creek 0.025-0.17 0.03-0.18
St. Johns River 0.025-0.17 0.03-0.18
West Branch Shingle Creek* 0.025-0.17 0.03-0.18
West City Canal 0.025-0.17 0.03-0.18
WPA Canal 0.025-0.17 0.03-0.18
WPA Canal Tributary 1 0.025-0.095 0.025-0.095
WPA Canal Tributary 1-1 0.025 0.045-0.095
*Includes West Branch Shingle Creek Tributary listed separately in previous FIS reports
Flood profiles were drawn showing the computed water-surface elevations for floods of the selected recurrence intervals.
The hydraulic analyses for this study were based on unobstructed flow. The flood elevations shown on the Flood Profiles (Exhibit 1) are thus considered valid only if hydraulic structures remain unobstructed, operate properly, and do not fail.
3.2.1 Methods for Flooding Sources with New or Revised Analyses in Current Study
Water-surface profiles for the 10-, 2-, 1- and 0.2-percent-annual-chance recurrence intervals were computed for detailed analyses, and the water-surface profile for the 1-percent-annual-chance recurrence interval was computed for approximate analyses. The USACE HEC-RAS step-backwater computer program version 4.0 was utilized for hydraulic analyses of Bass Slough (Lower Reach), Bass Slough (Upper Reach), Bass Slough Tributary, WPA Canal Tributary 1,

29
WPA Canal Tributary 1-1, East City Canal Tributary 1 and all approximately study streams (Reference 26).
Hydraulic cross section geometries were obtained from the Digital Terrain Model (DTM) and supplemented with surveyed hydraulic data at various locations throughout the detailed studied reaches. All hydraulic structures were field surveyed for detailed analyses. The Watershed Information System (WISE) software was used for preprocessing HEC-RAS data (Reference 27). No floodway was calculated for streams studied by approximate methods.
Starting conditions for the hydraulic models were set to normal depth using starting slopes calculated from channel elevation values taken from the DTM, or set based on effective water-surface elevations as appropriate. Manning’s n-values were estimated using high-resolution imagery and field photos for both channel and overbank areas.
The Interconnected Channel and Pond Routing (ICPR) model was used to determine the 1-percent-annual-chance flood elevations for Lake Marian and ponding areas located on its northern and eastern side. The ICPR model was also used to determine the 1-percent-annual-chance flood elevations for ponding areas located west of Reedy Creek and south of Reedy Creek Tributary No. 2. ICPR basins were delineated based on topographic maps with a contour interval of 1 foot. Dimensions of the cross drainage structures at basin boundaries were obtained from field survey. Land use data was obtained from South Florida Water Management District and soil data was obtained from Natural Resources Conservation Service’s Soil Data Mart.
3.2.2 Methods for Flooding Sources Incorporated from Previous Studies
Precountywide Analyses
For each jurisdiction within Osceola County that has a previously printed FIS report, the hydraulic analyses described in those reports has been compiled and is summarized below.
Water-surface elevations of floods of the selected recurrence intervals were computed using the USACE HEC-2 step-backwater computer program (Reference 28). Starting water-surface elevations were based on the computed water-surface elevation for the receiving stream or lake.
For Reedy Creek, C-1 Canal, C-2 Canal, and C-3 Canal, 1-percent-annual-chance water-surface elevations were determined using the UNET hydraulic model.
In the City of Kissimmee, the hydrologic analyses for the area generally bounded to the north by Vine Street, to the east by Robinson Street, to the south by Sumner Street, and to the west by Main Street determined that the flooded area is subject to shallow flooding where average depths of flooding are less than 3 feet.
Roughness factors (Manning's "n") used in the hydraulic computations were chosen by engineering judgment and were based on field inspection of the floodplain areas.

30
Revised Analyses for Countywide FIS
Cross sections were obtained from a variety of sources. The primary source was new field surveys. Other cross sections were obtained from the South Florida Water Management District and from the previous FISs.
Water-surface elevations of floods of the selected recurrence intervals were computed using the USACE UNET one-dimensional, unsteady flow and HEC-2 water-surface profile computer programs; UNET was used for C-33 Canal, Canoe Creek (C-34 Canal), East City Canal, West City Canal, and Lakes Center, Gentry, Joel, Lizzie, Myrtle, and Preston and Alligator, Brick, Coon, and Trout Lakes; HEC-2 was used for Davenport Creek, Davenport Creek Tributary No. 1, Davenport Creek Tributary No. 2, Peg Horn Slough, Reedy Creek Tributary No. 1, Reedy Creek Tributary No. 2, and Reedy Creek Tributary No. 3, Shingle Creek, West Branch Shingle Creek, West Branch Shingle Creek Tributary, and WPA Canal (References 25 and 28). For the St. Johns River, the hydraulic analyses were taken from The Mean Annual, 10-Year, 25-Year, and 100-Year Flood Profiles for the Upper St. Johns River Under Existing Conditions (Reference 19). Starting water-surface elevations for streams were taken to be normal depth; for lakes, the highest operating elevations specified by the South Florida Water Management District were used (Reference 19).
Gage data for historical storm events was used for calibration and verification of the UNET and HEC-2 models. Gage data were obtained from the South Florida Water Management District and the USGS (References 29 and 30). USGS gages were used for the Alligator Chain of Lakes at the S-60 spillway on the C-33 Canal (ID 02260800); at the S-57 culvert on the C-30 Canal (ID 02261500); on the east shore of Cypress Lake near the mouth of Canoe Creek (ID 02266600); on Shingle Creek at the Kissimmee Airport (ID 02263800); on Shingle Creek at Campbell (ID 02264495); and on Davenport Creek near Loughman (ID 02266480). South Florida Water Management District gages were used on the Kissimmee East-West Canal (ID KISSD-H and KISSD-E).
3.3 Vertical Datum
All FIS reports and FIRMs are referenced to a specific vertical datum. The vertical datum provides a starting point against which flood, ground, and structure elevations can be referenced and compared. Until recently, the standard vertical datum used for newly created or revised FIS reports and FIRMs was the National Geodetic Vertical Datum of 1929 (NGVD). With the completion of the North American Vertical Datum of 1988 (NAVD), many FIS reports and FIRMs are now prepared using NAVD as the referenced vertical datum.
All flood elevations shown in this FIS report and on the FIRM are referenced to the NAVD. These flood elevations must be compared to structure and ground elevations referenced to the same vertical datum. It is important to note that adjacent counties may be referenced to NGVD, which may result in differences in base flood elevations across county lines.

31
Ground, structure, and flood elevations may be compared and/or referenced to NGVD29 by applying a standard conversion factor. The conversion factor to NGVD29 is +0.9. This value is an average for the entire county.
The BFEs shown on the FIRM represent whole-foot rounded values. For example, a BFE of 102.4 feet will appear as 102 feet on the FIRM and 102.6 will appear as 103. Therefore, users who wish to convert the elevations in this FIS report to NGVD should apply the stated conversion factor to elevations shown on the Flood Profiles and supporting data tables in the FIS report, which are shown at a minimum to the nearest 0.1 foot.
For more information regarding conversion between the NGVD and NAVD, see the FEMA publication entitled Converting the National Flood Insurance Program to the North American Vertical Datum of 1988 (Reference 31), visit the National Geodetic Survey website at Hwww.ngs.noaa.govH, or contact the National Geodetic Survey at the following address:
NGS Information Services NOAA, N/NGS12 National Geodetic Survey SSMC-3, #9202 1315 East-West Highway Silver Spring, Maryland 20910-3282 (301) 713-3242
Temporary vertical monuments are often established during the preparation of a flood hazard analysis for the purpose of establishing local vertical control. Although these monuments are not shown on the FIRM, they may be found in the Technical Support Data Notebook associated with the FIS report and FIRM for this community. Interested individuals may contact FEMA to access these data.
To obtain current elevation, description, and/or location information for benchmarks shown on this map, please contact the Information Services Branch of the NGS at (301) 713-3242, or visit their website at www.ngs.noaa.gov.
4.0 FLOODPLAIN MANAGEMENT APPLICATIONS
The NFIP encourages State and local governments to adopt sound floodplain management programs. To assist in this endeavor, each FIS report provides 1-percent-annual-chance floodplain data, which may include a combination of the following: 10-, 2-, 1-, and 0.2-percent-annual-chance flood elevations; delineations of the 1- and 0.2-percent-annual-chance floodplains; and a 1-percent-annual-chance floodway. This information is presented on the FIRM and in many components of the FIS report, including Flood Profiles, Floodway Data tables, and Summary of Stillwater Elevation tables. Users should reference the data presented in the FIS report as well as additional information that may be available at the local community map repository before making flood elevation and/or floodplain boundary determinations.

32
4.1 Floodplain Boundaries
To provide a national standard without regional discrimination, the 1-percent-annual-chance flood has been adopted by FEMA as the base flood for floodplain management purposes. The 0.2-percent-annual-chance flood is employed to indicate additional areas of flood risk in the community. For each stream studied by detailed or limited detailed methods, the 1- and 0.2-percent-annual-chance floodplain boundaries have been delineated using the flood elevations determined at each cross section.
Between cross sections, the boundaries were interpolated based on contours developed from the Digital Terrain Model (Reference 32).
The 1- and 0.2-percent-annual-chance floodplain boundaries for streams studied by detailed methods are shown on the FIRM. On this map, the 1-percent-annual-chance floodplain boundary corresponds to the boundary of the areas of special flood hazards (Zones A and AE), and the 0.2-percent-annual-chance floodplain boundary corresponds to the boundary of areas of moderate flood hazards. In cases where the 1- and 0.2-percent-annual-chance floodplain boundaries are close together, only the 1-percent-annual-chance floodplain boundary has been shown. Small areas within the floodplain boundaries may lie above the flood elevations, but cannot be shown due to limitations of the map scale and/or lack of detailed topographic data.
For the flooding sources studied by approximate methods, only the 1-percent-annual-chance floodplain boundary is shown on the FIRM (Exhibit 2).
4.2 Floodways
Encroachment on floodplains, such as structures and fill, reduces flood-carrying capacity, increases flood heights and velocities, and increases flood hazards in areas beyond the encroachment itself. One aspect of floodplain management involves balancing the economic gain from floodplain development against the resulting increase in flood hazard. For purposes of the NFIP, a floodway is used as a tool to assist local communities in this aspect of floodplain management. Under this concept, the area of the 1-percent-annual-chance floodplain is divided into a floodway and a floodway fringe. The floodway is the channel of a stream, plus any adjacent floodplain areas, that must be kept free of encroachment so that the base flood can be carried without substantial increases in flood heights. Minimum Federal standards limit such increases to 1 foot, provided that hazardous velocities are not produced. The floodways in this study are presented to local agencies as minimum standards that can be adopted directly or that can be used as a basis for additional floodway studies.
The floodways presented in this study were computed for certain stream segments on the basis of equal-conveyance reduction from each side of the floodplain. Floodway widths were computed at cross sections. Between cross sections, the floodway boundaries were interpolated. The results of the floodway computations are tabulated for selected cross sections and provided in Table 8, “Floodway Data.” The computed floodway is shown on the FIRM (Exhibit 2). In cases where the floodway and 1-percent-annual-chance floodplain boundaries are either close together or collinear, only the floodway boundary is shown on the FIRM.
33
No floodway was computed Davenport Creek Tributary 1, Davenport Creek Tributary 2, St. Johns River, and Tributary No. 1.
Near the confluence of streams studied in detail, floodway computations were made without regard to flood elevations on the receiving water body. Therefore, “Without Floodway” elevations presented in Table 8, “Floodway Data,” for certain downstream cross sections of Bass Slough Tributary, East City Canal Tributary 1, Reedy Creek Tributary No. 1, Reedy Creek Tributary No. 2, Shingle Creek, West City Canal, WPA Canal Tributary 1, and WPA Canal Tributary 1-1 are lower than the regulatory flood elevations in that area, which must take into account the 1-percent-annual-chance flooding due to backwater from other sources.
Encroachment into areas subject to inundation by floodwaters having hazardous velocities aggravates the risk of flood damage and heightens potential flood hazards by further increasing velocities. A listing of stream velocities at selected cross sections is provided in Table 8. To reduce the risk of property damage in areas where the stream velocities are high, the community may wish to restrict development in areas outside the floodway.
The area between the floodway and 1-percent-annual-chance floodplain boundaries is termed the floodway fringe. The floodway fringe encompasses the portion of the floodplain that could be completely obstructed without increasing the water-surface elevation (WSEL) of the base flood more than 1 foot at any point. Typical relationships between the floodway and the floodway fringe and their significance to floodplain development are shown in Figure 1.

34
Figure 1. Floodway Schematic

FLOODING SOURCE FLOODWAY BASE FLOOD WATER SURFACE ELEVATION
CROSS SECTION DISTANCE1 WIDTH (FEET)
SECTION AREA
(SQUARE FEET)
MEAN VELOCITY (FEET PER SECOND)
REGULATORY (FEET NAVD 88)
WITHOUT FLOODWAY (FEET NAVD 88)
WITH FLOODWAY (FEET NAVD 88)
INCREASE (FEET)
BASS SLOUGH (LOWER REACH)
A 2,000 58 200 5.9 58.5 58.5 59.2 0.7 B 2,999 320 1,501 0.8 60.8 60.8 61.1 0.3 C 4,500 500 1,677 0.6 60.9 60.9 61.3 0.4 D 6,000 235 618 1.7 61.1 61.1 61.7 0.6 E 7,000 143 487 2.2 63.0 63.0 63.8 0.8 F 7,500 62 201 5.3 63.5 63.5 64.1 0.6 G 9,000 450 1,939 0.6 64.3 64.3 64.7 0.4 H 10,500 93 272 3.9 64.4 64.4 64.8 0.4 I 12,655 324 636 1.3 67.3 67.3 67.9 0.6 J 14,008 268 1,432 0.6 68.9 68.9 69.7 0.8 K 15,003 94 128 6.5 70.2 70.2 70.2 0.0 L 16,508 129 223 2.6 74.4 74.4 74.6 0.2 M 18,008 204 374 1.5 74.7 74.7 75.0 0.3 N 19,008 283 203 2.8 75.7 75.7 76.1 0.4
1 Stream distance in feet above mouth
TAB
LE 8
FLOODWAY DATA FEDERAL EMERGENCY MANAGEMENT AGENCY
OSCEOLA COUNTY, FL AND INCORPORATED AREAS BASS SLOUGH (LOWER REACH)

FLOODING SOURCE FLOODWAY BASE FLOOD WATER SURFACE ELEVATION
CROSS SECTION DISTANCE1 WIDTH (FEET)
SECTION AREA
(SQUARE FEET)
MEAN VELOCITY (FEET PER SECOND)
REGULATORY (FEET NAVD 88)
WITHOUT FLOODWAY (FEET NAVD 88)
WITH FLOODWAY (FEET NAVD 88)
INCREASE (FEET)
BASS SLOUGH (UPPER REACH)
A 21,799 70 253 2.1 78.8 78.8 79.1 0.3 B 23,008 182 658 0.8 79.3 79.3 79.8 0.5 C 24,008 283 1,113 0.3 79.4 79.4 79.8 0.4 D 25,508 152 491 0.6 79.4 79.4 79.9 0.5 E 26,508 124 276 1.1 79.4 79.4 79.9 0.5 F 27,008 139 422 0.7 79.5 79.5 79.9 0.4 G 28,008 128 321 0.9 79.5 79.5 80.1 0.6 H 28,791 76 217 1.3 79.5 79.5 80.1 0.6
1 Stream distance in feet above mouth
TAB
LE 8
FLOODWAY DATA FEDERAL EMERGENCY MANAGEMENT AGENCY
OSCEOLA COUNTY, FL AND INCORPORATED AREAS BASS SLOUGH (UPPER REACH)

FLOODING SOURCE FLOODWAY BASE FLOOD WATER SURFACE ELEVATION
CROSS SECTION DISTANCE WIDTH (FEET)
SECTION AREA
(SQUARE FEET)
MEAN VELOCITY (FEET PER SECOND)
REGULATORY (FEET NAVD 88)
WITHOUT FLOODWAY (FEET NAVD 88)
WITH FLOODWAY (FEET NAVD 88)
INCREASE (FEET)
BASS SLOUGH TRIBUTARY
A 2171 50 91 2.0 79.4 75.82 76.8 1.0 B 1,0001 30 90 2.0 79.4 77.42 77.9 0.5 C 2,0401 50 200 0.9 79.4 78.12 79.0 0.9
BOGGY CREEK
A 5,6003 1,020 2,900 1.8 61.0 61.0 62.0 1.0
1 Stream distance in feet above confluence with Bass Slough 2 Elevation computed without consideration of backwater effects from Bass Slough 3 Stream distance in feet above confluence with East Lake Topopekaliga
TAB
LE 8
FLOODWAY DATA FEDERAL EMERGENCY MANAGEMENT AGENCY
OSCEOLA COUNTY, FL AND INCORPORATED AREAS BASS SLOUGH TRIBUTARY & BOGGY CREEK

FLOODING SOURCE FLOODWAY BASE FLOOD WATER SURFACE ELEVATION
CROSS SECTION DISTANCE1 WIDTH (FEET)
SECTION AREA
(SQUARE FEET)
MEAN VELOCITY (FEET PER SECOND)
REGULATORY (FEET NAVD 88)
WITHOUT FLOODWAY (FEET NAVD 88)
WITH FLOODWAY (FEET NAVD 88)
INCREASE (FEET)
C-33 CANAL
A 380 212 545 0.3 65.5 65.5 65.5 0.0 B 2,920 243 459 0.3 65.5 65.5 65.5 0.0 C 3,770 17 222 0.3 65.8 65.8 65.8 0.0 D 6,020 129 784 0.1 65.8 65.8 65.8 0.0 E 8,620 125 964 0.1 65.8 65.8 65.8 0.0 F 11,405 251 1,133 0.1 65.8 65.8 65.8 0.0 G 12,405 245 1,165 0.1 65.8 65.8 65.8 0.0
1 Stream distance in feet above confluence with Alligator Lake
2 At time of peak water-surface elevation
TAB
LE 8
FLOODWAY DATA FEDERAL EMERGENCY MANAGEMENT AGENCY
OSCEOLA COUNTY, FL AND INCORPORATED AREAS C-33 CANAL

FLOODING SOURCE FLOODWAY BASE FLOOD WATER SURFACE ELEVATION
CROSS SECTION DISTANCE1 WIDTH (FEET)
SECTION AREA
(SQUARE FEET)
MEAN VELOCITY (FEET PER SECOND)
REGULATORY (FEET NAVD 88)
WITHOUT FLOODWAY (FEET NAVD 88)
WITH FLOODWAY (FEET NAVD 88)
INCREASE (FEET)
CANOE CREEK (C-34 CANAL)
A 0 123 998 3.4 56.1 56.1 56.1 0.0 B 450 37 988 3.4 64.1 64.1 64.1 0.0 C 5,628 88 1,506 0.3 64.6 64.6 64.6 0.0 D 15,389 20 346 1.4 65.8 65.8 65.8 0.0
1 Stream distance in feet above Canoe Creek Road
2 At time of peak water-surface elevation
TAB
LE 8
FLOODWAY DATA FEDERAL EMERGENCY MANAGEMENT AGENCY
OSCEOLA COUNTY, FL AND INCORPORATED AREAS CANOE CREEK (C-34 CANAL)

FLOODING SOURCE FLOODWAY BASE FLOOD WATER SURFACE ELEVATION
CROSS SECTION DISTANCE1 WIDTH (FEET)
SECTION AREA
(SQUARE FEET)
MEAN VELOCITY (FEET PER SECOND)
REGULATORY (FEET NAVD 88)
WITHOUT FLOODWAY (FEET NAVD 88)
WITH FLOODWAY (FEET NAVD 88)
INCREASE (FEET)
DAVENPORT CREEK
A 4,500 734 3,963 1.0 80.2 80.2 81.2 1.0 B 5,330 4402 2,627 1.5 81.8 81.8 82.4 0.6 C 6,730 359 2,112 1.7 84.4 84.4 84.8 0.4 D 8,130 292 1,723 2.1 86.0 86.0 86.8 0.8 E 9,230 112 794 4.6 88.9 88.9 89.5 0.6 F 10,520 223 2,087 1.4 92.9 92.9 93.6 0.7 G 11,820 231 1,596 1.9 93.5 93.5 94.2 0.7 H 13,385 136 819 3.6 95.1 95.1 95.5 0.4 I 14,045 42 453 6.5 96.2 96.2 96.7 0.5 J 15,745 191 1,782 1.7 98.8 98.8 99.6 0.8 K 16,872 384 3,259 0.9 102.6 102.6 103.2 0.6 L 18,342 228 1,923 1.5 103.2 103.2 103.8 0.6 M 20,392 286 1,627 1.7 104.9 104.9 105.6 0.7
N-R*
FEDERAL EMERGENCY MANAGEMENT AGENCY
DAVENPORT CREEKOSCEOLA COUNTY, FL
AND INCORPORATED AREAS
1 Stream distance in feet above confluence with Reedy Creek
2 Value represents total width; however, floodway is not shown inside Reedy Creek Improvement District * Floodway data not available
TAB
LE 8
FLOODWAY DATA

FLOODING SOURCE FLOODWAY BASE FLOOD WATER SURFACE ELEVATION
CROSS SECTION DISTANCE1 WIDTH (FEET)
SECTION AREA
(SQUARE FEET)
MEAN VELOCITY (FEET PER SECOND)
REGULATORY (FEET NAVD 88)
WITHOUT FLOODWAY (FEET NAVD 88)
WITH FLOODWAY (FEET NAVD 88)
INCREASE (FEET)
EAST CITY CANAL
A 3,374 76 447 3.5 57.8 57.8 57.9 0.1 B 4,124 96 363 4.2 58.5 58.5 58.5 0.0 C 4,932 90 414 3.7 61.1 61.1 61.1 0.0 D 5,433 80 409 3.7 61.5 61.5 61.5 0.0 E 8,232 100 62 2.3 65.1 65.1 65.1 0.0 F 8,733 170 807 1.4 65.3 65.3 65.3 0.0 G 10,127 2503 1,119 1.0 65.9 65.9 65.9 0.0 H 10,629 2653 1,799 0.5 66.0 66.0 66.0 0.0 I 11,278 2503 1,611 0.5 66.0 66.0 66.0 0.0 J 11,980 250 1,292 0.6 66.0 66.0 66.0 0.0 K 13,158 75 381 2.0 66.2 66.2 66.3 0.1 L 14,362 60 291 0.2 66.5 66.5 66.7 0.2 M 15,729 41 108 0.3 66.9 66.9 66.9 0.0 N 16,516 41 96 0.5 67.7 67.7 67.7 0.0
1 Stream distance in feet above confluence with Lake Tohopekaliga
2 At time of peak water-surface elevation 3 Value is inaccurate, as the floodway has been adjusted in this area to match topographic-based floodplain redelineation
TAB
LE 8
FLOODWAY DATA FEDERAL EMERGENCY MANAGEMENT AGENCY
OSCEOLA COUNTY, FL AND INCORPORATED AREAS EAST CITY CANAL

FLOODING SOURCE FLOODWAY BASE FLOOD WATER SURFACE ELEVATION
CROSS SECTION DISTANCE1 WIDTH (FEET)
SECTION AREA
(SQUARE FEET)
MEAN VELOCITY (FEET PER SECOND)
REGULATORY (FEET NAVD 88)
WITHOUT FLOODWAY (FEET NAVD 88)
WITH FLOODWAY (FEET NAVD 88)
INCREASE (FEET)
EAST CITY CANAL
TRIBUTARY 1
A 500 42 274 2.5 65.1 63.72 64.4 0.7 B 1,000 46 233 3.0 65.1 63.82 64.5 0.7 C 2,000 93 763 0.9 66.0 66.0 67.0 1.0 D 2,373 66 577 1.2 66.0 66.0 67.0 1.0
1 Stream distance in feet above confluence with East City Canal 2 Elevation computed without consideration of backwater effects from East City Canal
TAB
LE 8
FLOODWAY DATA FEDERAL EMERGENCY MANAGEMENT AGENCY
OSCEOLA COUNTY, FL AND INCORPORATED AREAS EAST CITY CANAL TRIBUTARY 1

FLOODING SOURCE FLOODWAY BASE FLOOD WATER SURFACE ELEVATION
CROSS SECTION DISTANCE1 WIDTH (FEET)
SECTION AREA
(SQUARE FEET)
MEAN VELOCITY (FEET PER SECOND)
REGULATORY (FEET NAVD 88)
WITHOUT FLOODWAY (FEET NAVD 88)
WITH FLOODWAY (FEET NAVD 88)
INCREASE (FEET)
MILL SLOUGH
A 6,161 90 460 3.0 57.1 57.1 58.1 1.0 B 7,090 140 450 3.0 57.9 57.9 58.6 0.7 C 9,090 230 830 1.6 59.5 59.5 60.3 0.8 D 10,590 50 250 5.5 60.5 60.5 61.5 1.0 E 11,391 40 250 5.2 64.0 64.0 64.5 0.5 F 13,350 202 606 2.1 67.3 67.3 68.2 0.9 G 14,410 45 248 5.2 69.1 69.1 69.8 0.7 H 15,450 59 295 4.4 72.3 72.3 72.5 0.2 I 17,900 81 438 3.0 76.2 76.2 76.7 0.5 J 20,150 181 695 1.9 79.1 79.1 79.9 0.8
1 Stream distance in feet above confluence with Lake Tohopekaliga
TAB
LE 8
FLOODWAY DATA FEDERAL EMERGENCY MANAGEMENT AGENCY
OSCEOLA COUNTY, FL AND INCORPORATED AREAS MILL SLOUGH

FLOODING SOURCE FLOODWAY BASE FLOOD WATER SURFACE ELEVATION
CROSS SECTION DISTANCE1 WIDTH (FEET)
SECTION AREA
(SQUARE FEET)
MEAN VELOCITY (FEET PER SECOND)
REGULATORY (FEET NAVD 88)
WITHOUT FLOODWAY (FEET NAVD 88)
WITH FLOODWAY (FEET NAVD 88)
INCREASE (FEET)
PEG HORN SLOUGH
A 1,300 34 215 5.1 60.7 60.7 61.2 0.5 B 3,022 205 879 1.2 62.4 62.4 62.7 0.3 C 5,432 47 413 2.2 63.0 63.0 63.5 0.5 D 7,200 55 517 1.7 65.4 65.4 66.1 0.7 E 9,491 56 524 0.8 66.1 66.1 67.0 0.9 F 9,831 21 188 2.2 66.1 66.1 67.0 0.9 G 10,346 46 420 1.0 66.7 66.7 67.6 0.9 H 14,436 55 524 0.9 68.0 68.0 68.9 0.9 I 14,751 22 198 2.3 68.0 68.0 68.8 0.8 J 15,575 54 471 1.0 69.8 69.8 70.6 0.8 K 16,150 46 243 1.9 69.8 69.8 70.6 0.8 L 17,117 444 1,587 0.3 71.6 71.6 71.9 0.3
1 Stream distance in feet above confluence with St. Cloud Canal (Canal 31)
TAB
LE 8
FLOODWAY DATA FEDERAL EMERGENCY MANAGEMENT AGENCY
OSCEOLA COUNTY, FL AND INCORPORATED AREAS PEG HORN SLOUGH

FLOODING SOURCE FLOODWAY BASE FLOOD WATER SURFACE ELEVATION
CROSS SECTION DISTANCE1 WIDTH (FEET)
SECTION AREA
(SQUARE FEET)
MEAN VELOCITY (FEET PER SECOND)
REGULATORY (FEET NAVD 88)
WITHOUT FLOODWAY (FEET NAVD 88)
WITH FLOODWAY (FEET NAVD 88)
INCREASE (FEET)
REEDY CREEK
A 3.55 5,568 23,325 0.2 57.7 57.7 58.7 1.0 B 4.73 5,455 12,337 0.4 58.7 58.7 59.6 0.9 C 5.95 2,754 14,138 0.4 60.4 60.4 61.4 1.0 D 6.74 1,513 11,487 0.4 60.7 60.7 61.7 1.0 E 8.81 1,514 10,628 0.4 62.3 62.3 63.3 1.0 F 9.45 1,384 9,590 0.4 63.0 63.0 64.0 1.0 G 9.79 712 5,325 0.7 63.3 63.3 64.3 1.0 H 10.89 1,306 9,011 0.4 64.3 64.3 65.3 1.0 I 11.98 2,471 15,454 0.2 64.7 64.7 65.7 1.0 J 13.05 2,495 14,137 0.2 65.1 65.1 66.1 1.0 K 14.07 3,192 15,140 0.2 65.4 65.4 66.4 1.0 L 15.10 5,081 24,716 0.1 65.6 65.6 66.6 1.0 M 16.12 2,918 15,285 0.2 65.8 65.8 66.8 1.0 N 16.67 2,040 8,894 0.2 66.0 66.0 67.0 1.0 O 17.17 4,644 20,654 0.1 66.1 66.1 67.1 1.0 P 18.18 4,640 19,641 0.1 66.2 66.2 67.2 1.0 Q 19.35 7,514 17,744 0.1 66.4 66.4 67.4 1.0 R 20.33 84 307 3.6 67.0 67.0 67.9 0.9
1 Stream distance in miles above confluence with Cypress Lake
TAB
LE 8
FLOODWAY DATA FEDERAL EMERGENCY MANAGEMENT AGENCY
OSCEOLA COUNTY, FL AND INCORPORATED AREAS REEDY CREEK

FLOODING SOURCE FLOODWAY BASE FLOOD WATER SURFACE ELEVATION
CROSS SECTION DISTANCE1 WIDTH (FEET)
SECTION AREA
(SQUARE FEET)
MEAN VELOCITY (FEET PER SECOND)
REGULATORY (FEET NAVD 88)
WITHOUT FLOODWAY (FEET NAVD 88)
WITH FLOODWAY (FEET NAVD 88)
INCREASE (FEET)
REEDY CREEK TRIBUTARY NO. 1
A 5,650 51 172 4.3 65.3 62.22 63.2 1.0 B 6,620 64 217 2.2 65.3 63.92 64.5 0.6 C 10,678 599 1,462 0.1 67.5 67.5 67.7 0.2 D 12,468 1,200 3,179 0.1 67.6 67.6 67.8 0.2
REEDY CREEK TRIBUTARY NO. 2
A 1,950 69 192 2.1 64.8 62.42 63.4 1.0 B 2,870 46 134 3.0 65.2 65.2 65.4 0.2 C 4,020 33 86 0.7 67.0 67.0 67.0 0.0 D 5,356 533 96 0.1 67.4 67.4 67.4 0.0
1 Steam distance in feet above confluence with Reedy Creek
2 Elevation computed without consideration of backwater effects from Reedy Creek
TAB
LE 8
FLOODWAY DATA FEDERAL EMERGENCY MANAGEMENT AGENCY
OSCEOLA COUNTY, FL AND INCORPORATED AREAS REEDY CREEK TRIBUTARY NO. 1 & NO. 2

FLOODING SOURCE FLOODWAY BASE FLOOD WATER SURFACE ELEVATION
CROSS SECTION DISTANCE1 WIDTH (FEET)
SECTION AREA
(SQUARE FEET)
MEAN VELOCITY (FEET PER SECOND)
REGULATORY (FEET NAVD 88)
WITHOUT FLOODWAY (FEET NAVD 88)
WITH FLOODWAY (FEET NAVD 88)
INCREASE (FEET)
REEDY CREEK TRIBUTARY NO. 3
A 4,377 67 271 1.0 65.6 65.6 66.0 0.4 B 7,197 82 343 0.8 65.9 65.9 66.2 0.3 C 8,497 191 390 0.7 66.0 66.0 66.3 0.3 D 9,787 991 1,885 0.1 66.1 66.1 66.4 0.3 E 10,987 197 422 0.2 66.2 66.2 66.5 0.3 F 12,507 39 82 0.8 67.6 67.6 67.7 0.1 G 12,927 36 56 1.1 67.7 67.7 67.8 0.1
1 Stream distance in feet above confluence with Reedy Creek
TAB
LE 8
FLOODWAY DATA FEDERAL EMERGENCY MANAGEMENT AGENCY
OSCEOLA COUNTY, FL AND INCORPORATED AREAS REEDY CREEK TRIBUTARY NO. 3

FLOODING SOURCE FLOODWAY BASE FLOOD WATER SURFACE ELEVATION
CROSS SECTION DISTANCE1 WIDTH (FEET)
SECTION AREA
(SQUARE FEET)
MEAN VELOCITY (FEET PER SECOND)
REGULATORY (FEET NAVD 88)
WITHOUT FLOODWAY (FEET NAVD 88)
WITH FLOODWAY (FEET NAVD 88)
INCREASE (FEET)
SHINGLE CREEK
A 5,100 1,280 4,584 2.0 57.1 56.32 57.3 1.0 B 9,230 675 3,762 2.5 61.3 61.3 62.2 0.9 C 11,002 734 3,944 1.6 62.7 62.7 63.5 0.8 D 14,726 1,713 12,828 0.7 64.9 64.9 65.6 0.7 E 19,856 717 5,258 1.6 65.7 65.7 66.7 1.0 F 33,578 805 5,479 1.5 73.0 73.0 73.6 0.6 G 35,878 1,600 11,425 0.7 73.4 73.4 74.0 0.6 H 43,128 1,099 7,583 1.1 75.4 75.4 76.2 0.8
1 Stream distance in feet above confluence with Lake Tohopekaliga
2 Elevation computed without consideration of backwater effects from Lake Tohopekaliga
TAB
LE 8
FLOODWAY DATA FEDERAL EMERGENCY MANAGEMENT AGENCY
OSCEOLA COUNTY, FL AND INCORPORATED AREAS SHINGLE CREEK

FLOODING SOURCE FLOODWAY BASE FLOOD WATER SURFACE ELEVATION
CROSS SECTION DISTANCE1 WIDTH (FEET)
SECTION AREA
(SQUARE FEET)
MEAN VELOCITY (FEET PER SECOND)
REGULATORY (FEET NAVD 88)
WITHOUT FLOODWAY (FEET NAVD 88)
WITH FLOODWAY (FEET NAVD 88)
INCREASE (FEET)
WEST BRANCH SHINGLE CREEK
A 3,733 2,092 5,393 0.8 64.9 63.02 63.5 0.5 B 6,750 1,077 4,123 1.0 64.9 64.82 65.3 0.5 C 9,553 746 4,108 1.0 65.5 65.5 66.2 0.7 D 10,139 256 1,608 2.6 66.4 66.4 67.0 0.6 E 14,039 3,529 26,114 0.1 67.4 67.4 68.0 0.6 F 18,449 3,029 17,973 0.2 67.5 67.5 68.0 0.5 G 22,831 2,100 11,888 0.3 67.8 67.8 68.8 1.0 H 24,951 2,509 26,545 0.1 67.8 67.8 68.8 1.0 I 30,072 1,320 6,432 0.4 68.0 68.0 69.0 1.0 J 30,677 465 2,811 1.0 68.0 68.0 69.0 1.0 K 31,607 418 2,000 0.6 68.2 68.2 69.2 1.0 L 32,287 457 2,462 0.5 68.3 68.3 69.3 1.0 M 33,647 204 641 1.8 68.7 68.7 69.5 0.8 N 34,658 8 34 9.7 71.0 71.0 71.5 0.5
1 Stream distance in feet above confluence with Shingle Creek
2 Elevation computed without consideration of backwater effects from Shingle Creek
TAB
LE 8
FLOODWAY DATA FEDERAL EMERGENCY MANAGEMENT AGENCY
OSCEOLA COUNTY, FL AND INCORPORATED AREAS WEST BRANCH SHINGLE CREEK

FLOODING SOURCE FLOODWAY BASE FLOOD WATER SURFACE ELEVATION
CROSS SECTION DISTANCE1 WIDTH (FEET)
SECTION AREA
(SQUARE FEET)
MEAN VELOCITY (FEET PER SECOND)
REGULATORY (FEET NAVD 88)
WITHOUT FLOODWAY (FEET NAVD 88)
WITH FLOODWAY (FEET NAVD 88)
INCREASE (FEET)
WEST CITY CANAL
A 800 73 360 4.3 57.1 57.02 57.1 0.1 B 1,378 72 641 2.5 57.4 57.4 57.5 0.1 C 2,328 107 610 2.6 57.8 57.8 57.8 0.0 D 4,097 61 351 1.7 59.1 59.1 59.2 0.1 E 4,699 49 253 2.3 59.2 59.2 59.3 0.1 F 5,676 56 313 1.9 61.8 61.8 61.8 0.0 G 6,299 80 382 1.6 62.3 62.3 62.3 0.0 H 6,674 200 643 0.9 62.3 62.3 62.4 0.1 I 7,593 300 968 0.5 62.8 62.8 62.8 0.0 J 8,432 150 755 0.7 63.1 63.1 63.2 0.1 K 9,641 70 238 1.7 63.7 63.7 63.8 0.1 L 11,458 54 325 0.7 67.6 67.6 67.6 0.0
1 Stream distance in feet above confluence with Lake Tohopekaliga
2 Elevation computed without consideration of backwater effects from Lake Tohopekaliga
TAB
LE 8
FLOODWAY DATA FEDERAL EMERGENCY MANAGEMENT AGENCY
OSCEOLA COUNTY, FL AND INCORPORATED AREAS WEST CITY CANAL

FLOODING SOURCE FLOODWAY BASE FLOOD WATER SURFACE ELEVATION
CROSS SECTION DISTANCE1 WIDTH (FEET)
SECTION AREA
(SQUARE FEET)
MEAN VELOCITY (FEET PER SECOND)
REGULATORY (FEET NAVD 88)
WITHOUT FLOODWAY (FEET NAVD 88)
WITH FLOODWAY (FEET NAVD 88)
INCREASE (FEET)
WPA CANAL
A 750 250 823 2.1 57.9 57.9 58.3 0.4 B 2,875 1,001 3,697 0.5 58.2 58.2 58.7 0.5 C 6,875 1,033 5,716 0.3 58.4 58.4 58.9 0.5 D 12,285 50 201 4.9 63.8 63.8 63.9 0.1 E 13,350 52 299 1.4 67.7 67.7 68.3 0.6 F 15,608 543 1,324 0.1 67.9 67.9 68.9 1.0 G 17,024 56 269 0.3 68.0 68.0 68.9 0.9 H 20,476 47 192 1.9 69.1 69.1 69.8 0.7 I 21,154 42 143 2.5 69.5 69.5 69.7 0.2 J 21,927 40 173 2.1 70.3 70.3 70.5 0.2 K 22,167 29 126 2.9 70.4 70.4 70.6 0.2 L 22,337 46 236 1.5 70.9 70.9 71.7 0.8 M 24,233 34 109 1.6 71.6 71.6 72.5 0.9 N 24,423 48 170 1.0 72.9 72.9 73.6 0.7 O 28,538 363 397 0.3 73.4 73.4 73.9 0.5
1 Stream distance in feet above confluence with Lake Tohopekaliga
TAB
LE 8
FLOODWAY DATA FEDERAL EMERGENCY MANAGEMENT AGENCY
OSCEOLA COUNTY, FL AND INCORPORATED AREAS WPA CANAL

FLOODING SOURCE FLOODWAY BASE FLOOD WATER SURFACE ELEVATION
CROSS SECTION DISTANCE1 WIDTH (FEET)
SECTION AREA
(SQUARE FEET)
MEAN VELOCITY (FEET PER SECOND)
REGULATORY (FEET NAVD 88)
WITHOUT FLOODWAY (FEET NAVD 88)
WITH FLOODWAY (FEET NAVD 88)
INCREASE (FEET)
WPA CANAL TRIBUTARY 1
A 1,500 171 475 0.8 71.4 70.92 71.9 1.0 B 2,500 330 517 0.8 74.2 74.2 75.1 0.9 C 3,500 485 848 0.5 74.7 74.7 75.6 0.9 D 11,000 1,448 4,403 0.1 74.8 74.8 75.8 1.0 E 12,500 1,140 2,027 0.2 74.8 74.8 75.8 1.0 F 14,000 1,269 2,260 0.1 74.8 74.8 75.8 1.0
1 Stream distance in feet above confluence with WPA Canal 2 Elevation computed without consideration of backwater effects from WPA Canal
TAB
LE 8
FLOODWAY DATA FEDERAL EMERGENCY MANAGEMENT AGENCY
OSCEOLA COUNTY, FL AND INCORPORATED AREAS WPA CANAL TRIBUTARY 1

FLOODING SOURCE FLOODWAY BASE FLOOD WATER SURFACE ELEVATION
CROSS SECTION DISTANCE1 WIDTH (FEET)
SECTION AREA
(SQUARE FEET)
MEAN VELOCITY (FEET PER SECOND)
REGULATORY (FEET NAVD 88)
WITHOUT FLOODWAY (FEET NAVD 88)
WITH FLOODWAY (FEET NAVD 88)
INCREASE (FEET)
WPA CANAL TRIBUTARY 1-1
A 2,000 88 180 1.7 74.8 74.12 74.3 0.2 B 4,000 312 425 0.7 74.8 74.62 75.4 0.8
1 Stream distance in feet above confluence with WPA Canal Tributary 1 2 Elevation computed without consideration of backwater effects from WPA Canal Tributary 1
TAB
LE 8
FLOODWAY DATA FEDERAL EMERGENCY MANAGEMENT AGENCY
OSCEOLA COUNTY, FL AND INCORPORATED AREAS WPA CANAL TRIBUTARY 1-1

54
5.0 INSURANCE APPLICATIONS
For flood insurance rating purposes, flood insurance zone designations are assigned to a community based on the results of the engineering analyses. These zones are as follows:
Zone A
Zone A is the flood insurance rate zone that corresponds to the 1-percent-annual-chance floodplains that are determined in the FIS report by approximate methods. Because detailed hydraulic analyses are not performed for such areas, no base (1-percent-annual-chance) flood elevations (BFEs) or depths are shown within this zone.
Zone AE
Zone AE is the flood insurance rate zone that corresponds to the 1-percent-annual-chance floodplains that are determined in the FIS report by detailed methods. Whole-foot BFEs derived from the detailed hydraulic analyses are shown at selected intervals within this zone.
Zone X
Zone X is the flood insurance rate zone that corresponds to areas outside the 0.2-percent-annual-chance floodplain, areas within the 0.2-percent-annual-chance floodplain, areas of 1-percent-annual-chance flooding where average depths are less than 1 foot, areas of 1-percent-annual-chance flooding where the contributing drainage area is less than 1 square mile (sq. mi.), and areas protected from the base flood by levees. No BFEs or depths are shown within this zone.
6.0 FLOOD INSURANCE RATE MAP
The FIRM is designed for flood insurance and floodplain management applications.
For flood insurance applications, the map designates flood insurance rate zones as described in Section 5.0 and, in the 1-percent-annual-chance floodplains that were studied by detailed methods, shows selected whole-foot BFEs or average depths. Insurance agents use zones and BFEs in conjunction with information on structures and their contents to assign premium rates for flood insurance policies.
For floodplain management applications, the map shows by tints, screens, and symbols, the 1- and 0.2-percent-annual-chance floodplains, floodways, and the locations of selected cross sections used in the hydraulic analyses and floodway computations.
The current FIRM presents flooding information for the entire geographic area of Osceola County. Previously, separate Flood Hazard Boundary Maps and/or FIRMs were prepared for each incorporated community and the unincorporated areas of the County identified as flood-prone. This countywide FIRM also includes flood-hazard information that was presented separately on Flood Boundary and Floodway Maps (FBFMs), where applicable. Historical data relating to the maps prepared for each community are presented in Table 9, “Community Map History.”

COMMUNITY NAME
INITIAL IDENTIFICATION
FLOOD HAZARD BOUNDARY MAP REVISIONS DATE
FIRM EFFECTIVE DATE
FIRM REVISIONS DATE
Kissimmee, City of July 19, 1974 April 30, 1976 July 2, 1981 May 7, 2001
Osceola County (Unincorporated Areas) January 31, 1975 August 12, 1977 February 3, 1982
March 16, 1989 November 20, 1996
May 7, 2001
Reedy Creek Improvement District May 7, 2001 None May 7, 2001 None
St. Cloud, City of June 28, 1974 February 20, 1976 September 17, 1980 October 23, 1981
April 3, 1996 May 7, 2001
TAB
LE 9
FEDERAL EMERGENCY MANAGEMENT AGENCY
OSCEOLA COUNTY, FL AND INCORPORATED AREAS
COMMUNITY MAP HISTORY

56
7.0 OTHER STUDIES
Flood Hazard Studies for St. Cloud, Kissimmee, and the unincorporated areas of Orange County have been prepared by the USACE, Jacksonville District. The flood elevations determined in this FIS do not conflict with the flood elevations determined for those FISs.
The USACE, Jacksonville District prepared an expanded floodplain information report on the Boggy Creek basin, dated April 1979 (Reference 10). The flood stages in that report agree with the flood stages in this FIS.
The USACE, Jacksonville District, prepared a flood hazard information report on Reedy Creek in June 1976 (Reference 12). The flood stages presented in that report agree with those contained in this FIS.
In June 1973, the USACE published a floodplain information report on Mill Slough (Reference 13). That report included 1-percent-annual-chance and standard project flood profiles for Mill Slough, which agree with the 1-percent-annual-chance flood profiles contained in this FIS.
The USACE, Jacksonville District prepared a reconnaissance report on the Kissimmee River basin, which was published in September 1979 (Reference 33). That report describes the procedures to be used in evaluating the feasibility of modifying the existing flood control system for improving water quality and enhancing fish and wildlife resources in the Kissimmee River basin. The study will update the hydrologic analyses conducted previously by the USACE in the Kissimmee River basin.
Reynolds, Smith, and Hills, Architects-Engineers-Planners for Orange County, Osceola County, South Florida Water Management District, and the Florida Division of State Planning prepared a floodplain information report (Reference 11). The flood stages in that report agree with those contained in this FIS.
FIS reports have been prepared for the unincorporated areas of Okeechobee and Polk Counties and countywide FISs have been prepared for Brevard, Indian River, and Orange Counties (References 34, 35, 36, 37, and 1).
This FIS report supersedes or is compatible with all previous studies published on streams studied in this report and should be considered authoritative for the purposes of the NFIP.
8.0 LOCATION OF DATA
Information concerning the pertinent data used in the preparation of this study can be obtained by contacting Federal Insurance and Mitigation Division, FEMA Region IV, Koger-Center — Rutgers Building, 3003 Chamblee Tucker Road, Atlanta, GA 30341.
9.0 BIBLIOGRAPHY AND REFERENCES
1. Federal Emergency Management Agency, Flood Insurance Study, Orange County, Florida and Incorporated Areas, Washington, D.C., September 25, 2009.

57
2. Federal Emergency Management Agency, Flood Insurance Study, Osceola County, Florida (Unincorporated Areas), Washington, D.C., March 16, 1989.
3. U.S. Department of Commerce, Bureau of the Census. “State and County Quickfacts, Florida Quicklinks.” [Online] [Cited: March 9, 2011.] http://quickfacts.census.gov/
4. U.S. Department of Agriculture, Soil Conservation Service, Soil Survey, Osceola County Area, Florida, April 1979.
5. Osceola County Property Appraiser. “Agriculture Department.” [Online] [Cited: March 14, 2011.] http://property-appraiser.org/propertyappraiser/149-1079-1061/agriculture_ department.cfm
6. U.S. Department of Commerce, National Oceanic and Atmospheric Administration, National Climate Data Center. “Storm Events.” [Online] [Cited: March 9, 2011] http://www4.ncdc.noaa.gov
7. Hydrology Subcommittee of the Interagency Advisory Committee on Water Data, Guidelines for Determining Flood Frequency: U.S. Geological Survey Bulletin 17B, Office of Water Data Collection, Reston, VA, 1982.
8. U. S. Department of the Interior, Geological Survey, Water Resources Investigations Report 82-4012, Technique for Estimating Magnitude and Frequency of Floods on Natural-Flow Streams in Florida, Bridges, Wayne C., 1982.
9. U.S. Department of the Interior, Geological Survey, Water-Supply Paper 2207, Flood Characteristics of Urban Watersheds in the United States, V.B. Sauer, W.O. Thomas, Jr., V.A. Stricker, and K.V. Wilson, 1983.
10. U.S. Army Corps of Engineers, Jacksonville District, Expanded Flood Plain Information, Boggy Creek, Orange, and Osceola Counties, Florida, April 1979.
11. Reynolds, Smith, and Hills, Architect-Engineers-Planners, Inventory of Existing Flooding Conditions (Flood Plain Information) Shingle Creek, September 1974.
12. U.S. Army Corps of Engineers, Jacksonville District, Flood Hazard Information, Reedy Creek, Osceola County, Florida, June 1976.
13. U.S. Army Corps of Engineers, Jacksonville District, Flood Plain Information Report, Mill Slough, Osceola and Orange Counties, Florida, June 1973.
14. U.S. Army Corps of Engineers, Jacksonville District, Central and Southern Florida Project for Flood Control and Other Purposes, Part II, Kissimmee River Basin and Related Areas, Supplement 10 - Detail Design Memorandum, Canals 31 and 35 (St. Cloud and South Port Canals) and Control Structures 59 and 61, June 23, 1961.
15. U.S. Army Corps of Engineers, Jacksonville District, Rainfall-Frequency Estimates, Orange and Seminole Counties, Florida, March 1977.
16. U.S. Department of Agriculture, Soil Conservation Service, National Engineering Handbook Section 4, Hydrology, 1964, revised 1969.

58
17. U.S. Department of Commerce, Weather Bureau, Technical Paper No. 40, Rainfall Frequency Atlas of the United States, Washington, D.C., 1961, Revised 1963.
18. U.S. Army Corps of Engineers, Hydrologic Engineering Center, HEC-1 Flood Hydrograph Package, Davis, California, January 1984.
19. St. Johns River Water Management District, Technical Publication SJ 85-3, The Mean Annual, 10-Year, 25-Year, and 100-Year Flood Profiles for the Upper St. Johns River Under Existing Conditions, March 1985.
20. U.S. Army Corps of Engineers, Hydrologic Engineering Center, HEC-1 Flood Hydrograph Package, Davis, California, September 1990.
21. South Florida Water Management District, Rainfall Data for Stations throughout Osceola County, 1995.
22. National Oceanic and Atmospheric Administration, National Weather Service, Digital files of Daily Precipitation Data, NWS, Asheville, North Carolina.
23. U.S. Department of Agriculture, Soil Conservation Service, National Engineering Handbook Section 4, Hydrology, August 1972.
24. Florida Department of Transportation, Stereo Aerial Photographs of Osceola County, May 1990, Scale 1"=2,083 feet.
25. U.S. Army Corps of Engineers, Hydrologic Engineering Center, UNET: One Dimensional Unsteady Flow Through a Full Network of Open Channels, Davis, California, May 1993.
26. U.S. Army Corps of Engineers, Hydrologic Engineering Center, HEC-RAS River Analysis System, Computer Software, v. 4.0, Davis, California, March 2008.
27. Watershed Concepts, a Division of Hayes, Seay, Mattern & Mattern, Watershed Information System (WISE,) Computer Software, v. 4.1.0 beta, 2008.
28. U.S. Army Corps of Engineers, Hydrologic Engineering Center, HEC-2 Water Surface Profiles, Generalized Computer Program, Davis, California, May 1991.
29. South Florida Water Management District, Remote Access to the SFWMD Water Quality and Hvdrometeorologic Databases, March 1995.
30. U.S. Geological Survey, WATSTORE computer hydrologic database.
31. Federal Emergency Management Agency. Converting the National Flood Insurance Program to the North American Vertical Datum of 1988 - Guidelines for Community Officials, Engineers, and Surveyors. 6/1/1992. 3-0170.
32. BakerAECOM, LLC, Digital Terrain Model developed from City of Kissimmee, FL, LiDAR Data (Surdex Corporation, 6/1/2006); 1-foot contours (Aerial Cartographics of America, Inc., 4/16/2004); National Elevation Dataset (United States Geological Survey/EROS, 3/1/2008).

59
33. U.S. Army Corps of Engineers, Jacksonville District, Central and Southern Florida, Kissimmee River, Florida, Reconnaissance Report (Stage I), September 1979.
34. Federal Emergency Management Agency, Federal Insurance Administration, Flood Insurance Study, Okeechobee County, Florida (Unincorporated Areas), Washington, D.C., August 4, 1980 (FIS report), February 4, 1981 (FIRM).
35. Federal Emergency Management Agency, Flood Insurance Study, Polk County. Florida(Unincorporated Areas), Washington, D.C., November 19, 2003 (FIS report), November 19, 2003 (FIRM).
36. Federal Emergency Management Agency, Flood Insurance Study, Brevard County, Florida and Incorporated Areas, Washington, D.C., November 19, 1997.
37. Federal Emergency Management Agency, Flood Insurance Study, Indian River County, Florida and Incorporated Areas, Washington, D.C., May 4, 1989.
10.0 REVISION DESCRIPTIONS
This section has been added to provide information regarding significant revisions made since the original FIS was printed. Future revisions may be made that do not result in the republishing of the FIS report. To assure that the user is aware of all revisions, it is advisable to contact the community repository of flood-hazard data located at:
• City of Kissimmee Engineering Department, Suite 301 101 North Church Street Kissimmee, Florida 34741
• Osceola County (Unincorporated Areas) Stormwater Section, Suite 1400 1 Courthouse Square Kissimmee, Florida 34741
• Reedy Creek Improvement District Administrative Building 1900 Hotel Plaza Boulevard Lake Buena Vista, Florida 32830
• St. Cloud City Hall Public Works Department, Building A, 2nd Floor 1300 9th Street St. Cloud, Florida 34769
10.1 First Revision June 18, 2013
This June 18, 2013 revision was initiated in support of the FEMA Risk MAP Program.
This revision involved countywide remapping of Osceola County, Florida. The revision included new detailed studies, refinement and establishment of approximate zones,

60
redelineation of existing studies, and creation of new FIRMs using new topographic and base map data.