Embed Size (px)
Citation preview

Jemez Springs, NM

Temperature increase in midwinter matches annual increase.

Temperature increase has been nearly twice as rapid during midsummer than winter.


Precipitation has declined since 1914 at a rate of 0.03” per year (simple linear regression).Ann
ual Precipitation
(inche
s)
Year

Ann
ual Precipitation
(inche
s)
Year
Fitting 4th‐order polynomial shows influence of Pacific Decadal Oscillation (PDO)(Note that peaks and troughs are moving lower)

Ann
ual Precipitation
(inche
s)
Year
Fitting 4th‐order polynomial shows influence of Pacific Decadal Oscillation (PDO)(Note that peaks and troughs are moving lower)
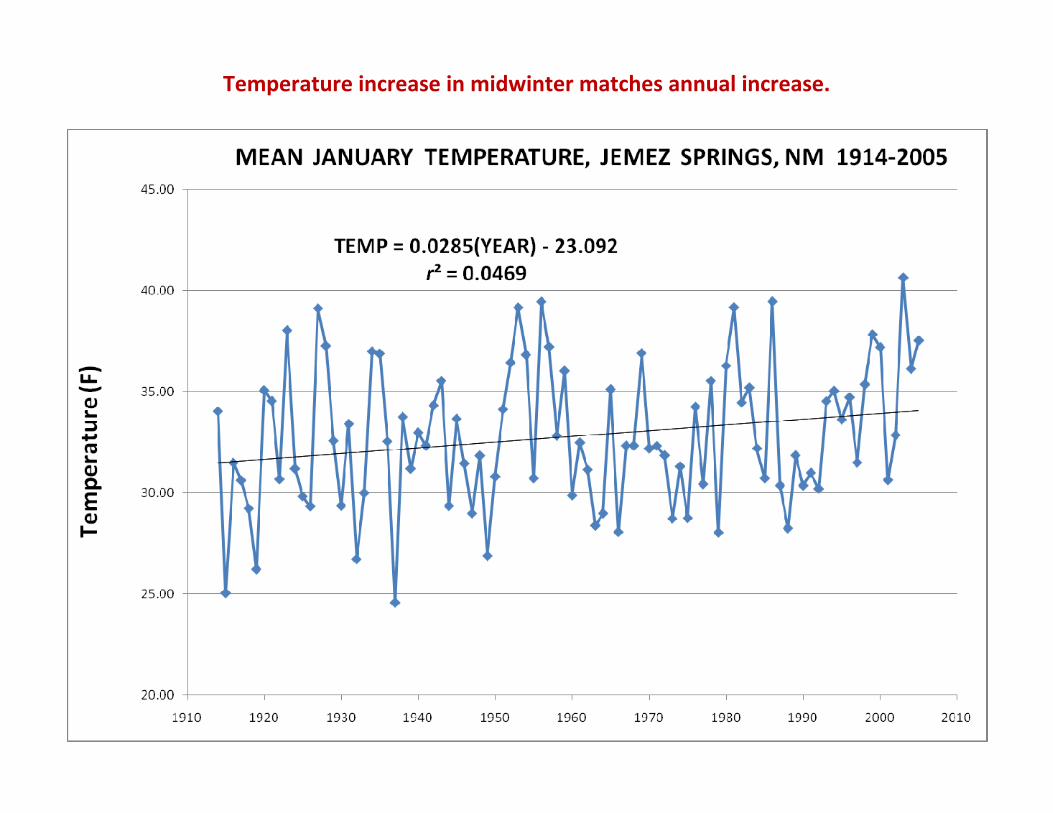
Jemez River below footbridge

(Full scale on y‐axis)

(Y‐axis scale capped at 250 cfs)
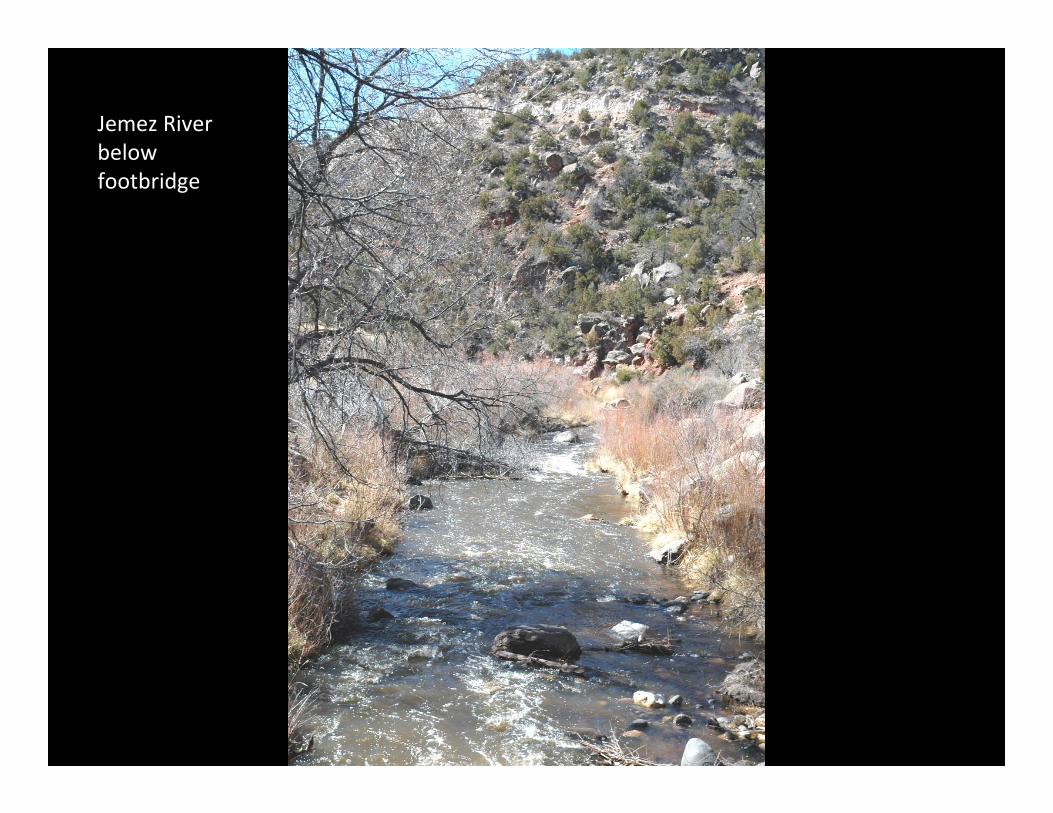
Average monthly precipitation during 1972‐2005 has remained nearly constant.

Precipitation during late 1980s until present has been declining, contributing to Jemez River discharge declines.

Logging operations in the Jemez Mountains during the 1960s through the 1980s converted thousands of hectares of old growth forest to dense second-growth forests.
1963
1975
2005

In the West, whiskey’s for drinkin’, and water’s for fightin’ over! (Mark Twain)

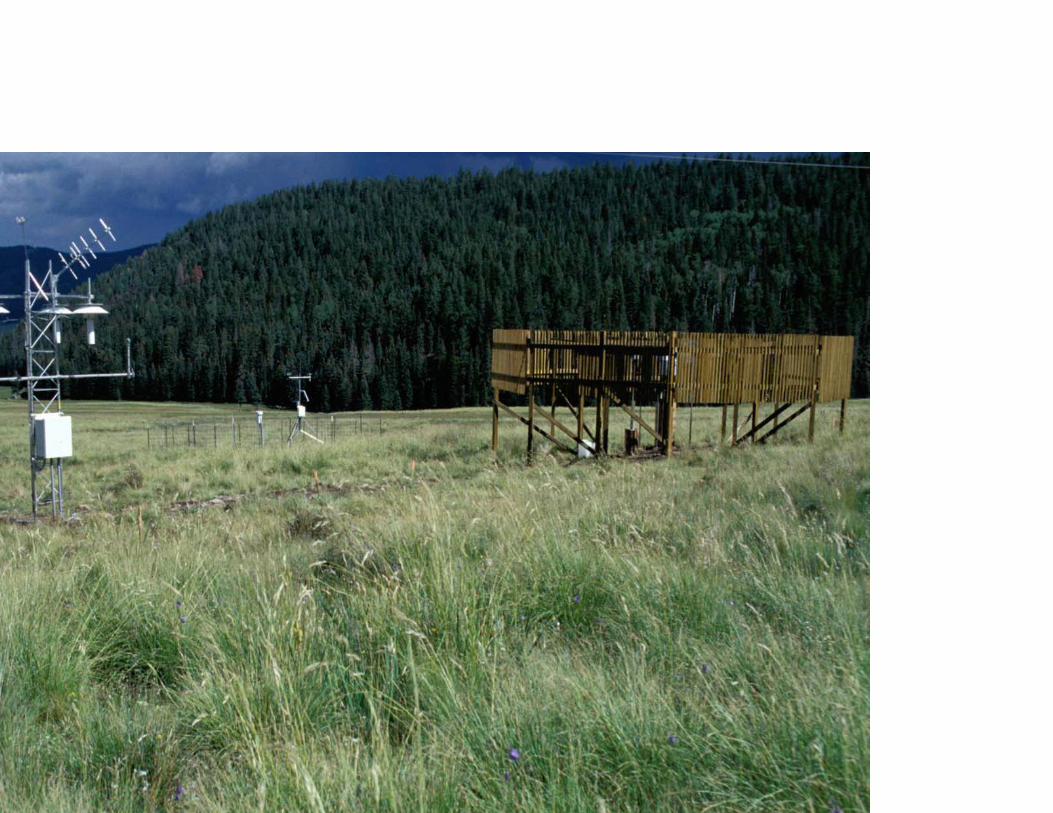
SAHRA Ponderosa pine hydrology site
EC fluxes of carbon, energy, water
Sap flow sensors, chemistry, isotopes
Meteorological data
Soil water balance, chemistry, isotopes
Remote sensing data

05
10152025303540
4 3 2 1 0.5 0 0.5 1 2 3 4
Distance From Tree Bole [m]
SWE
[cm
]
0510152025303540
12-Feb
05
10152025303540
4 3 2 1 0.5 0 0.5 1 2 3 4
Distance From Tree Bole [m]
SWE
[cm
]
0510152025303540
12-Feb14-Mar
05
10152025303540
4 3 2 1 0.5 0 0.5 1 2 3 4
Distance From Tree Bole [m]
SWE
[cm
]
0510152025303540
12-Feb14-Mar16-Apr
0.0
0.2
0.4
0.6
0.8
1.0
1.2
1.4
0.0 0.2 0.4 0.6 0.8 1.0Canopy Cover
Normalized
SWE
16 April 2005
Shading Interception
Snow‐Vegetation Interaction: Plot‐Scale Results
South North
1. Vegetation shading can delay spring melt
Musselman et al. in press
2. Vegetation shading may increase snowpack water storage (up to 22%)

Snow‐Vegetation Interaction: Distributed Results II
05
10152025
0 < 25 25 - 50 50 - 75 > 75
Canopy Density [%]
SWE
[cm
] Field Survey (900 points) to evaluate the effects of forest density on SWE
•Snow depths greatest under moderate canopy densities
•Maximal accumulation under canopy densities between 25% and 45%
•About 20% more water equivalent under moderate canopy than in open areas
•Sublimation rates from open snowfields appear similar to those from deep forest
Conceptual model of Snow‐Vegetation Interactions
Deep Forestn = 110
Unshaded Open
n = 130
Shaded Openn = 65
0
20
40
60
80


Valles Caldera Nat. Pres. “Ecosystem Services”for water production:
Thin forests to optimize SWE and reduce winter snowpack loss via sublimation
CNP water production = ~20,000 acre-feet/yearo Rancho paid $11,000/acre-foot for Jemez Valley water rights in
006apital value of VCNP water rights = $220 millionLease rate” of 10% of capital value per year = $22 million of water roduction annuallyy thinning the second growth forests on VCNP, increase spring noff to Rio Grande Basin
nnual stream discharge amount conservatively estimated at 10% crease above current levelsnnual value of ADDITIONAL water = $2.2 million/year!!!

ing temperatures er the past 50 years ve led to reduced owpacks and rlier runoffs oughout the untain west.
Snowpack
Peak Runoff

k Runoff from Snowmelt


rojected globally-averaged sea level rise by the nd of the 21st century
ers
Source: IPCC Summary for Policy Makers, February 2007
meters
Species at risk…..
Pika
Species at risk from climate change

Pika habitat is open rocky slopes, with grasses around the edges; snowpack important for thermal cover in winter.

Summer heat affects activity periods and thermal-regulatory behavior

mate change, with ompanying nges in fire mes and forest cture, will likely e the Jemez ntains salamander ard in elevation,
her constricting its ribution and etically isolating populations.

Changes in discharge and temperatures in perennial streams will affect fisheries

Implications for restoration efforts of Rio Grande cutthroat trout
Non-native brown trout must be removed to ensure RGCT survival

Bog birch’s southern-most population in Valles Caldera; heavily browsed by elk

MODELING WINTER ELK USEEric Wolf, LANL

MODEL PROCESS
Initial Cell State = snow in cell + DIi + standing cropi
assess DImax
-if snow>21cm, elk excluded from cell (Anderson 1954, Rudd et al. 1983, Fancy and White 1985, Wolf 2001)
-if snow<21cm, elk assigned to cell (up to 20) (Mackie 1970, Franklin and Lieb 1979, Shoesmith 1978, Wolf 2001-
002)
standing crop reduced 5.4kg/elk/day (Lang 1958, Nelson and Leege 1982, Holecheck et al. 1988)
when standing crop reduced to critical threshold (20% of nitial) (Thomas et al. 1988) DI is reduced by 20%
-Cell State is reassessed and elk are reassigned to cells at


All Browsing Transect Locations
(n = 211)
Data from
Doug Kranz 2001


% of individuals browsed
0.0%
0.0%
0.0%
0.0%
0.0%
0.0%0.0%
0.0%
0.0%
0.0%
0.0%
acgl
alte
amut
befe
betula hodu jaa
mph
mopo
frpo
trpo
trt prvi
quga ribes rone
rosa
rubus sal
ixsam
bu shro
syor
species code
Percentage of individuals browsed per species over all transects