Embed Size (px)
Citation preview
http://jer.sagepub.com/International Journal of Engine Research
http://jer.sagepub.com/content/early/2013/07/09/1468087413488767The online version of this article can be found at:
DOI: 10.1177/1468087413488767
published online 24 July 2013International Journal of Engine ResearchJacqueline O'Connor and Mark Musculus
close-coupled post injections for high-efficiency combustion phasingEffects of exhaust gas recirculation and load on soot in a heavy-duty optical diesel engine with
Published by:
http://www.sagepublications.com
On behalf of:
Institution of Mechanical Engineers
can be found at:International Journal of Engine ResearchAdditional services and information for
http://jer.sagepub.com/cgi/alertsEmail Alerts:
http://jer.sagepub.com/subscriptionsSubscriptions:
http://www.sagepub.com/journalsReprints.navReprints:
http://www.sagepub.com/journalsPermissions.navPermissions:
What is This?
- Jul 24, 2013OnlineFirst Version of Record >>
at PENNSYLVANIA STATE UNIV on August 26, 2013jer.sagepub.comDownloaded from
Original Article
International J of Engine Research0(0) 1–23� IMechE 2013Reprints and permissions:sagepub.co.uk/journalsPermissions.navDOI: 10.1177/1468087413488767jer.sagepub.com
Effects of exhaust gas recirculation andload on soot in a heavy-duty opticaldiesel engine with close-coupled postinjections for high-efficiencycombustion phasing
Jacqueline O’Connor and Mark Musculus
AbstractIn-cylinder strategies to reduce soot emissions have demonstrated the potential to lessen the burden on, and likely thesize and cost of, exhaust aftertreatment systems for diesel engines. One in-cylinder strategy for soot abatement is theuse of close-coupled post injections. These short injections closely following the end of the main injection can altersoot-formation and/or oxidation characteristics enough to significantly reduce engine-out soot. Despite the large bodyof literature on post injections for soot reduction, a clear consensus has not yet been achieved regarding either thedetailed mechanisms that affect the soot reduction, or even the sensitivity of the post-injection efficacy to several impor-tant engine operating parameters. We report that post injections reduce soot at a range of close-coupled post-injectiondurations, intake-oxygen levels, and loads in an optical, heavy-duty diesel research engine. Maximum soot reductions bypost injections at the loads and conditions tested range from 40% at 21% intake oxygen (by volume) to 62% at 12.6%intake oxygen. From a more fundamental fluid-mechanical perspective, adding a post injection to a constant main-injection for conditions with low dilution (21% and 18% intake oxygen) decreases soot relative to the original main injec-tion, even though the load is increased by the post injection. High-speed visualization of natural combustion luminosityand laser-induced incandescence of soot suggest that as the post-injection duration increases and the post injectionbecomes more effective at reducing soot, it interacts more strongly with soot remaining from the main injection.
KeywordsClose-coupled post injection, soot reduction, heavy-duty diesel, exhaust gas recirculation, optical engine
Date received: 20 December 2012; accepted: 18 March 2013
Introduction
In this work, we investigate the efficacy of post injec-tions for soot reduction over a range of injection sche-dules and intake-oxygen levels, two engine operationalvariables that can be adjusted to simultaneously miti-gate exhaust soot and NOx while maintaining high effi-ciency in direct-injection (DI) diesel engines. This studyis motivated by a need for improved understanding ofin-cylinder pollutant formation and destruction pro-cesses to meet current and future emission standardsand efficiency targets.
Over the past two decades, heavy-duty engine emis-sion limits in the United States,1 the EuropeanUnion,2–4 and much of Asia,5 for particulate matter(PM) and nitrogen oxides (NOx) have been reduced byone or two orders of magnitude. Although modern
exhaust aftertreatment technologies are efficient andincreasingly robust, they nevertheless impose additionalpackaging constraints and costs on the overall power-train system. Recently, in-cylinder emission reductionstrategies have been investigated that have the potentialto lessen the burden on, and potentially the size andcost of, aftertreatment systems. Concurrent with thereduction in pollutant emission limits, engine efficiencyrequirements have increased in response to market
Engine Combustion Department, Sandia National Laboratories,
Livermore, CA, USA
Corresponding author:
Jacqueline O’Connor, Mechanical and Nuclear Engineering, Pennsylvania
State University, 111 Research East Building, University Park, PA 16802
Email: [email protected].
at PENNSYLVANIA STATE UNIV on August 26, 2013jer.sagepub.comDownloaded from
forces, carbon dioxide legislation,6 and fuel-consumption reduction programs.7
Engine-out (i.e. prior to exhaust aftertreatment)emissions of NOx from diesel engines can be reducedusing exhaust gas recirculation (EGR), which dilutesthe intake stream with combustion products, therebyreducing both the intake-oxygen concentration and theflame temperature.8–10 EGR strategies can be imple-mented without a penalty in efficiency if certain engineoperating parameters like combustion phasing aresimultaneously adjusted with EGR.11
While EGR can significantly reduce engine-outNOx, engine-out soot typically increases as the intake-oxygen concentration decreases for conventional dieseloperation, at least initially.10,12,13 Engine-out soot is acomplicated function of in-cylinder formation and oxi-dation, both of which are affected by intake-oxygenconcentration and temperature.12,13 As the intake-oxygen concentration initially decreases from the atmo-spheric content of about 21% by volume, in-cylindersoot formation becomes increasingly dominant overoxidation, and the engine-out soot increases.14 Afterreaching a peak at an intake-oxygen concentrationbetween 9% and 12%, the engine-out soot plummets,reaching almost immeasurably small quantities below8% intake oxygen as the oxygen content and flame tem-perature continue to decrease.13,14 However, practicalengine operation at intake-oxygen concentrations lowenough to eliminate exhaust soot (e.g. 8% O2) presentsmany problems, including greatly increased unburnedhydrocarbon (UHC) and carbon monoxide (CO) emis-sions due to decreased combustion efficiency,15 andintake-air management issues, especially for operationwith boosted intake at higher loads.16 Hence, currentdiesel technology generally uses exhaust aftertreatmentwith intake-oxygen levels within the range where EGRstill has a detrimental effect on soot emissions.
One in-cylinder strategy for mitigating the increasedsoot emissions with moderate rates of EGR is to add apost injection after the main injection. Here, a post injec-tion is a small fuel injection (up to approximately 20%of the total fuel) that follows the main injection and isphased early enough in the cycle to ignite and combust(i.e. very late non-combusting or only partly-combustingpost injections for aftertreatment management are notconsidered here). One important consideration for post-injection strategies is their impact on fuel economy,which is affected by the combustion phasing of the postinjection. Post injections that can reduce soot whileremaining closely coupled to the main injection are pre-ferable from a fuel-efficiency perspective because of theirfavorable combustion phasing.17–19
Engine operating parameter effects
The efficacy of post injections for soot reduction isdependent on a variety of operational parameters, someof which are addressed in this study: changes in post-
injection dwell and duration, intake-oxygen level, andload. For a more detailed review of previous work inthe literature investigating these effects and others, referto O’Connor and Musculus.20
Post-injection dwell and duration
The majority of post-injection studies have exploredthe effect of post-injection duration and/or dwell afterthe main injection on exhaust soot.11,17–19,21–31 Almostall of the studies showed a reduction in exhaust sootwith the addition of a post injection, although the opti-mal timing of the post injection varied among studies.For the most part, a shorter dwell between the end ofthe main injection and the beginning of the post injec-tion resulted in lower exhaust soot, indicating thatclose-coupled post injections could be an advantageousinjection strategy for both reducing emissions andmaintaining efficiency. For example, experiments byHotta et al.18 analyzed the effect of post-injection dwellon engine-out soot in a single-cylinder, light-duty opti-cal research engine. Experiments at a variety of post-injection timings showed that a post injection with theshortest dwell possible with their injection system, 5crank angle degrees (CAD), led to the maximumdecrease in soot at the same load as a single injection.Later post-injection timings, with post-injection dwellsfrom 7 to 13 CAD after the end of the main injection,had either no effect on exhaust soot or increasedexhaust soot. A few studies,22,30,31 however, showedthat later post-injection timings provided more sub-stantial soot reduction than earlier timings. The reasonsfor differences in the optimal post-injection timing inthese studies have not been established.
Changes in post-injection duration were also investi-gated in a number of studies.25,26,29,32,33 Many of thesestudies investigated ‘‘split’’ injections, where the dura-tion of the second injection is prescribed as a fraction ofthe overall fuel injected each cycle. Here, if the second-injection duration increases, the first-injection durationdecreases. With split injections, the second injection canbe much larger than the ;20% limit that we use here todefine post injections. This method of varying the injec-tion durations is fundamentally different from the con-stant main-injection approach of the present study, aswill be described in section ‘‘Experimental overview.’’Despite that, several studies showed that post-injectionduration could be optimized to minimize exhaust soot.For example, Payri et al.32 measured exhaust soot forvarious post-injection timings and post-injection dura-tions at engine operating conditions from the EuropeanSteady-State Test Cycle (ESC).3 For almost all engineoperating conditions and a wide range of post-injectiontimings, post injections reduced engine-out soot.Generally, engine-out soot was minimized at a post-injection quantity of approximately 10%–20% of thetotal fuel. As will be shown later, this result is similar tothe findings of the current work for certain intake-oxygen levels and loads.
2 International J of Engine Research 0(0)
at PENNSYLVANIA STATE UNIV on August 26, 2013jer.sagepub.comDownloaded from
Intake-oxygen level
Several studies have shown that even with post injec-tions, moderate EGR rates increase the exhaust sootrelative to single injection with no EGR.18,30,31,34–37
Nevertheless, at a given EGR rate, post injections havebeen shown to reduce exhaust soot at intake-oxygenlevels ranging between 12.6% and 21%. Studies differ,however, in their assessments of whether EGR makespost injections proportionally more or less effective atreducing soot from the level of a single injection at thesame load. In this work, we show that post injectionscan be more effective at reducing soot at higher EGRrates. This conclusion is similar to those in the studiesby Shayler et al.30 and Pierpont et al.36 However, this isnot true of all studies,31 the reasons for which are notclear.
Load
A number of studies have investigated the efficacy ofpost injections at various load conditions.32,35,38–43 Inthese studies, test matrices often followed standard testcycles such as the New European Drive Cycle (NEDC)or the European Stationary Cycle.2,3 Load was changedby varying the rail pressure32,35,43 and/or the injectionduration.40,44 Changing load by injection duration canhave very different in-cylinder effects than changingload by rail pressure. Changing the rail pressure can sig-nificantly affect the reacting-jet structure45 and sootformation46 in diesel jets. Likewise, soot formation inthe jet is not necessarily proportional to increases ininjection duration.26 As a result, exhaust soot and post-injection efficacy may not be directly functions of load,but instead may be dependent on how the load is chan-ged. Despite these differences, studies using both load-variation techniques have shown that post injectionscan reduce engine-out soot at a number of loads. Forexample, Yun and Reitz38 changed load by varyinginjection duration, and found that as load increases,post injections become less effective at reducing soot;post injections at 3 bar gross indicated mean effectivepressure (gIMEP) reduced soot by 33%, while postinjections at 4.5 bar gIMEP reduced soot by only 16%.Similar trends are described in this study, where we varyload by changing the duration of the main injection.
Proposed in-cylinder soot-reductionmechanisms
Within the post-injection literature, there are generallythree explanations for how post injections reduceexhaust soot emissions: increased mixing, increasedtemperature, and injection-duration effects.
Increased mixing
Many studies19,21–23,36–40,47 conclude that post injec-tions reduce soot by increasing in-cylinder mixing of
fresh oxygen with the soot from the main injection,thereby enhancing soot oxidation. Although directmeasurements of the mixing effect of post injectionshave not been established, several authors19,35,39 haveidentified a ‘‘sweet spot’’ in the injection schedule,where the post injection was thought to most effectivelymix with the remnants of the main injection. In addi-tion to increasing oxidation of soot, greater mixingcould potentially decrease formation of soot. For exam-ple, KIVA simulations performed by Yun et al.39 pre-dicted that the post injection redistributes the fuel fromthe main injection within the piston bowl, creating amore uniform mixture with less fuel-rich pockets wheresoot can form. The simulations also predicted that themixing mechanism can be particularly important athigh-EGR rates, as available oxygen is limited.38,39
Increased temperature
A smaller number of studies11,18,22,25,32,43 point to theincreased temperature from the post-injection combus-tion as one reason for enhanced oxidation of themain-injection soot. Although direct measurements ofcylinder temperature distribution are quite difficult,some studies have shown evidence of the role ofincreased temperature using alternate methods. Forexample, Bobba et al.22 measured soot temperature inthe squish region, where the post injection interactedwith the main-injection soot. These measurements, takenwith a two-color thermometry method,48 showed highersoot temperatures after the post-injection burn; theauthors indicated that this increased temperature likelyleads to enhanced oxidation of the soot. While tempera-ture effects may contribute to soot oxidation, studiesthat name increased temperature as a soot-reductionmechanism generally acknowledge the importance ofenhanced entrainment and mixing of oxygen as well.
Injection-duration effects
Other studies17,19,26,27 have identified a separate mechan-ism that does not explicitly associate reduced exhaustsoot with increased mixing or increased temperature, butinstead with the effects of splitting the fuel delivery intomultiple parts, thereby decreasing the injection durationof each individual part. According to these studies, thepost injection can be too short to produce any significantnet exhaust soot, and the shorter main injection pro-duces less soot than the original single injection at thesame load. This mechanism has often been cited forinjection schedules with short, close-coupled post injec-tions. Another mechanism related to injection-durationeffects, proposed by Han et al.,26 is the concept of ‘‘jetreplenishment.’’ Based on computer-model simulations,the authors concluded that soot formation is dependenton injection duration, not just total quantity of fueldelivered to the engine per cycle. This is because as theinjection duration increases, the model predicts that thehead of the jet, a fuel-rich region where much of the soot
O’Connor and Musculus 3
at PENNSYLVANIA STATE UNIV on August 26, 2013jer.sagepub.comDownloaded from
is produced,49 is replenished by fresh fuel along the cen-terline of the jet for as long as the injection is sustained.The longer the injection, the more fuel is delivered to thishead region, creating a larger fuel-rich mixture that sup-ports more soot formation. This mechanism also agreeswith the idea that splitting a given amount of fuel intoshorter injections reduces the overall soot formed as aresult of the change in mixture formation due to jetreplenishment.
Overview of current investigation
Despite a large literature on post injections, consensuson in-cylinder soot-reduction mechanisms achievedthrough post injections has yet to be established. Whilethe aforementioned studies provide several plausibleexplanations for soot reduction by post injections, in-cylinder experimental data to support them are limited,so that the merits and ranges of applicability of the var-ious explanations are difficult to judge. In this work,we use a variety of optical techniques to better under-stand how post injections reduce soot over a variety ofengine operating conditions. As is evident from the lit-erature described above, the efficacy of post injectionsand possibly even the mechanisms by which they reduceengine-out soot may be a function of a great number ofengine operating parameters. Hence, we apply the opti-cal diagnostics over ranges of post-injection duration,intake-oxygen level, and load to establish where in theengine operational space close-coupled post injectionsdo or do not reduce exhaust soot in our optical engine.More discussion of remaining research questions andfuture work is provided at the conclusion of this article.
The remainder of this article is organized as follows:First, we give an overview of the experimental facilityand diagnostic techniques. Next, we discuss the effectof post injections on soot emissions at four intake-oxygen levels, three baseline loads, and a range ofpost-injection durations with data from both exhaustmeasurements and optical techniques. Finally, we sum-marize the results by plotting the efficacy of the postinjection as a function of intake oxygen, duration ofthe post injection, and load.
Experimental overview
Optical engine experiment
These experiments were conducted in a single-cylinder,DI, four-stroke heavy-duty diesel engine based on aCummins N-series production engine. Specifications ofthis engine are listed in Table 1, and a diagram of theexperimental setup is provided in Figure 1.
For these experiments, the engine is outfitted with aDelphi DFI-1.5, light-duty common-rail injector. TheDelphi light-duty injector was chosen for its fast-actingresponse to close-coupled injection commands. The fuelis n-heptane, which was selected for its low fluorescenceupon illumination by ultraviolet (UV) laser light.
n-Heptane is commonly used as an approximation fordiesel fuels in optical engine studies that use laser diag-nostics; compared to US diesel fuel, it has a slightlyhigher cetane number50 and a slightly lower density,but a much lower boiling point and zero aromatics.The similarity in cetane numbers means that the auto-ignition characteristics of these two fuels are similar,although there may be differences in the liquid-to-vapor transition in the fuel jet as a result of the differ-ences in boiling points. The vaporization differencesare not expected to significantly impact the generalsoot-formation characteristics. The absence of aro-matics, however, will almost certainly affect the quan-tity of soot, but the general in-cylinder mechanisms ofsoot formation should be similar.51 We view these dif-ferences in the magnitude soot formation to be anacceptable trade-off in the use of n-heptane as the fuelto enable UV laser diagnostics. Although UV laserdiagnostics are not used in this study, such diagnosticsare anticipated for studies to follow, so n-heptane waschosen for consistency with future work. Details of thefuel-injection system are also listed in Table 1.
The engine is designed with a variety of options foroptical access (Figure 1). First, an extended Bowditchpiston and 45� mirror allow visualization of the com-bustion chamber through the piston crown-window.
Table 1. Engine and fuel system specifications.
Engine base type Cummins N-14, DI dieselNumber of cylinders 1Cycle 4-strokeNumber of intake valves 2Number of exhaust valves 1a
Intake valve opening 17� BTDC exhaustb
Intake valve closing 195� ATDC exhaustb
Exhaust valve opening 235� BTDC exhaustb
Exhaust valve closing 27� ATDC exhaustb
Combustion chamber Quiescent, DISwirl ratio 0.5 (approximately)Bore 139.7 mmStroke 152.4 mmBowl width 97.8 mmDisplacement 2.34 LConnecting rod length 304.8 mmPiston pin offset NoneGeometric compression ratio 11.2:1Replicated compression ratio 16:1
Fuel injector Delphi DFI-1.5 (light duty)Fuel injector type Common-rail,
solenoid actuatedCup (tip) type Mini-sacNumber of holes andarrangement
8, equally spaced
Spray pattern included angle 156�Nominal orifice diameter 0.131 mm
DI: direct injection; BTDC: before top dead center; ATDC: after top
dead center.aIn this optically accessible diesel engine, one of the two exhaust valves
of the production cylinder head was replaced by a window and
periscope (see Figure 1).bAll valve timings correspond to the crank angle of the first detectable
movement from fully closed.
4 International J of Engine Research 0(0)
at PENNSYLVANIA STATE UNIV on August 26, 2013jer.sagepub.comDownloaded from
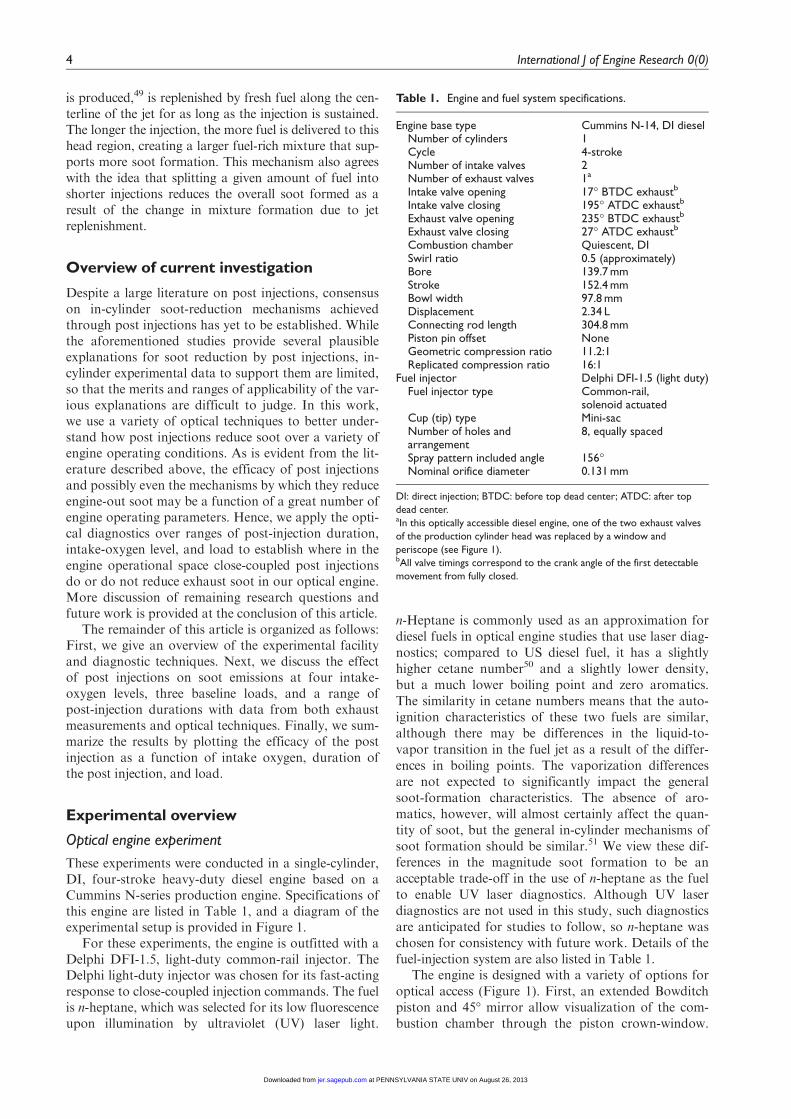
Windows in the cylinder wall and piston bowl-rim pro-vide laser-sheet access to the spray region. In the cur-rent configuration, the laser sheet is oriented parallel tothe nominal axis of one of the sprays (12� from hori-zontal), at an elevation approximately 1 mm below theinjector orifice for one of the fuel sprays. At this eleva-tion, the laser sheet is as close to the nominal symmetryaxis of the jet as possible without striking and poten-tially damaging (e.g. ablating) the injector tip. The sheetpasses through two windows, one in the cylinder walland another in the bowl-rim, before striking the cylin-der head. The bowl-rim window provides a realisticboundary condition for the fuel spray and soot devel-opment during operation. Further description of thisengine and its optical measurement capability can befound in the studies by Dec49 and Musculus et al.52
Optical engine diagnostics
These tests used a variety of optical and other measure-ment techniques. Cylinder pressure was measured withan AVL QC34D pressure transducer with a one-quarter CAD resolution. The apparent heat release rate(AHRR) was calculated from the measured cylinderpressure using standard techniques described inHeywood.53
Engine-out smoke was measured using an AVL 415Ssmoke meter. This device draws a known sample vol-ume of engine exhaust through a filter and measuresthe change in reflectance (blackening) of the white filter
due to accumulated smoke. For conventional dieselconditions with low adsorbed hydrocarbons, the changein reflectance of the white filter is caused mostly by car-bonaceous soot particles in the smoke, which visuallyappear gray to black, depending on soot loading. Forsome low-temperature combustion (LTC) conditionsthat have high adsorbed hydrocarbons, the filter canbecome tinted with color,54–57 which could conceivablybias the reflectivity measurement. Despite the reason-able expectation that adsorbed hydrocarbons couldaffect the reflectivity, experimental data show that thereflectivity is quite insensitive to adsorbed hydrocar-bons and is mostly indicative of carbonaceous soot.Comparisons with other techniques that measure car-bonaceous soot mass show that even with adsorbedhydrocarbons, the reflectivity strongly correlates withthe carbonaceous soot mass under both conventionaldiesel and LTC conditions and with both conventionaldiesel fuel and bio-derived fuels.54,58 Furthermore, nocolor tinting by adsorbed hydrocarbons is discerniblefrom visual inspection of the loaded filter paper fromthe current study. Hence, we expect that the smokemeasurements in the current study are indicative of car-bonaceous soot, and we use the terms interchangeably.
The change in reflectance for a given volume of sam-ple gas can be quantified as a filter smoke number(FSN).59 FSN varies monotonically, although weaklynonlinearly, with soot mass. In each test, sampling com-menced before the first fired cycle and continued wellafter the last fired cycle so that all the exhaust soot foreach run was sampled; this amounted to a sampling timeof 65 s or approximately 12,000mL of exhaust gas.Although the engine is skip fired, all FSN data reportedin this article have been corrected to the value thatwould have been measured for continuously fired opera-tion (as if the engine were not skip fired). Repeatabilityof this measurement was tested at several injection sche-dules; the standard deviation of the FSN measurementsat each of these repeated conditions was approximately0.004 FSN units for continuously fired operation.
Two optical diagnostics were used simultaneouslyfor visualizing in-cylinder soot development. The twotechniques share the same perspective, viewing throughthe piston-crown window as shown in Figure 1. Adichroic beam splitter with a cutoff near 485 nm spec-trally separated light emitted from the combustionchamber, with long-wavelength light directed to thesoot natural luminosity (soot-NL) imaging system,while the short-wavelength light was directed to thesoot planar laser-induced incandescence (soot-PLII)imaging system, both of which are described below.
Soot-NL. A high-speed Phantom 7.1 complementarymetal–oxide–semiconductor (CMOS) camera equippedwith a Nikon 105-mm focal length, f/2.8 glass lensimaged the soot-NL. The lens aperture was set to f/11.Images with a resolution of 256 3 512 pixels wereacquired at half crank-angle intervals (70ms at
Injector
Piston-CrownWindow
ExtendedPiston
High-SpeedCamera
1064 nmLaser Sheet
Filters:BG39 + SWP450
Bowl-RimWindow
Cylinder-WallWindow
ICCD CameraLII of Soot
DichroicBeamsplitter
Camera Field of View
View Through Piston-Crown Window
Piston Bowl-Rim
Figure 1. Experimental setup of the single-cylinder engine,laser configuration, and dual-camera optical system. The camerafield of view is shown in the upper right.ICCD: intensified charge-coupled device.
O’Connor and Musculus 5
at PENNSYLVANIA STATE UNIV on August 26, 2013jer.sagepub.comDownloaded from
1200 r/min). The exposure time was a function of theintake-oxygen level, with exposure times on the orderof 1ms at 21% O2 and 10ms at 12.6% O2. The high-speed imaging allows for high temporal resolution overa long data set; in this study, the entire combustionevent during each fired cycle was imaged using thistechnique. There are three shortcomings for this tech-nique, however. First, the soot-NL signal increasesstrongly with soot particle temperature, which intro-duces a strong bias to hot soot. The bias is importantboth spatially (within an image) and temporally (oneimage to the next, such as in the later portions of thecycle when cylinder temperature decreases). As aresult, lower signal in the images can mean eitherthere is less soot in that location or that the soot iscolder. Second, soot-NL imaging is a line-of-sighttechnique, such that the three-dimensional soot cloudis projected onto two dimensions. This projectionintroduces ambiguity when tracking structures thatmay be at different elevations along the line of sight.This issue is illustrated and discussed in section‘‘Results.’’ Finally, this technique images luminosityof all sources from inside the combustion chamber,including soot luminosity, chemiluminescence, andother possible sources. For these operating conditionsand camera exposure times, the dominant source oflight is soot-NL.60
Soot-PLII. The fundamental output of a Spectra-PhysicsQuanta-Ray single-cavity Nd:YAG laser was attenu-ated to 130mJ/pulse and formed into a 30-mm wide,approximately 1-mm-thick sheet for soot-PLII withinthe engine cylinder. As described in section ‘‘Opticalengine experiment,’’ the sheet was oriented to probesoot along the approximate symmetry plane of one of
the fuel jets. Using the fundamental output at 1064 nmavoids fluorescence of large polycyclic aromatic hydro-carbon (PAH) species, so that only solid soot particlesare targeted.61 As described in previous studies,49 thelaser-heated soot emits much more strongly at shorterwavelengths than the combustion-heated soot, so thesoot-PLII emission was spectrally filtered to shorterwavelengths to improve the signal-to-noise ratio. Soot-PLII emission was collected with an intensifiedPrinceton Instruments PI-MAX 3 camera with a reso-lution of 1024 3 1024, a gate time of 15 ns, and at 50%of maximum gain. Two filters, Schott BG39 andSWP450, rejected longer wavelength emission. Soot-PLII data were limited to one frame per cycle, due torepetition-rate constraints of both the laser and camerasystem.
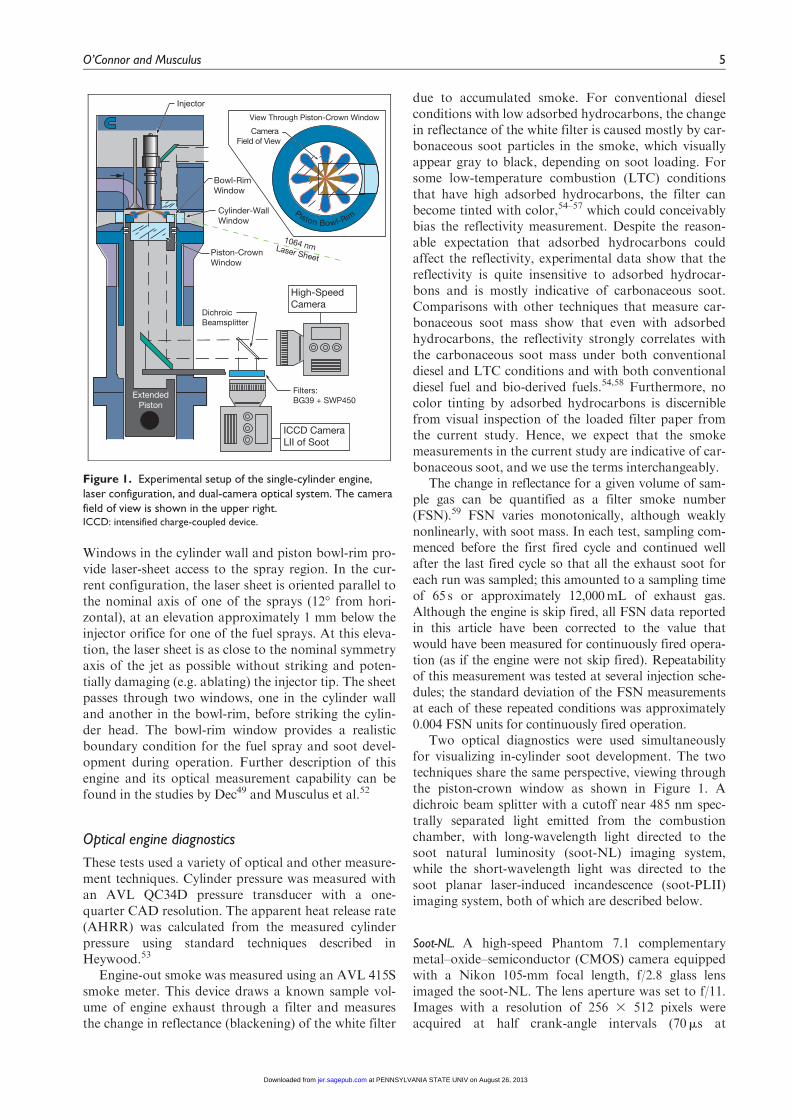
The two optical techniques, examples of which areshown in Figure 2, complement each other. In theseimages, the injector tip is indicated by a green dot, andthe spray of interest (horizontal from the camera per-spective) penetrates from left to right to the bowl wallas indicated by a dashed green line. While these twoimages were taken at the same instant in time in thesame engine cycle and with the same field of view,because of the difference in techniques, there are differ-ences in the images. The soot-NL image Figure 2(a)displays a much broader signal distribution, and signifi-cant small-structure variations in the soot-NL intensityare apparent. In the soot-PLII image (Figure 2(b)),smaller pockets of strong signal appear throughout theimage, mostly within the roughly conical shape of thehorizontal jet. The differences in the signal distributionfor the two techniques are largely due to the fact thatsome soot structures do not intersect the laser sheet,which is aligned along the approximate centerline ofthe jet. The small-scale structures are also less distinct
(a) Soot-NL Imaging (b) Soot-PLII
Experimental Conditions• SOI1C=347 CAD, DOI1C=1950 µs • Intake O2 = 18% (20-32% EGR)
• SOI2C=366 CAD, DOI2C=500 µs • gIMEP: 610 kPa
Figure 2. Comparison of imaging techniques, simultaneous high-speed imaging of (a) soot-NL with (b) soot-PLII. Both images wereacquired at 373 CAD, shortly after ignition of the post jet, with engine operating conditions described above. The green dotindicates the location of the injector, the solid green line indicates the location of the bowl wall, and dashed green lines indicate thejet centerlines of the spray under investigation (horizontal) and the two adjacent to it.soot-NL: soot natural luminosity; soot-PLII: planar laser-induced incandescence of soot.
6 International J of Engine Research 0(0)
at PENNSYLVANIA STATE UNIV on August 26, 2013jer.sagepub.comDownloaded from
in the soot-PLII image, which may be attributed, atleast in part, to a lower spatial resolution for the inten-sified camera.
Although soot-PLII provides a spatially resolvedview of the soot, this technique, like many laser tech-niques, has drawbacks associated with interpreting sig-nal levels. Two issues often arise in this technique: laserattenuation and signal trapping. Visual inspection ofthe collection of soot-PLII images indicates that laserattenuation is not the dominant problem at these oper-ating conditions. In the PLII image (Figure 2 (b)), sev-eral high signal-level regions exist one after the otheralong the path of laser-light propagation (right to left),indicating that the laser light at 1064 nm is not signifi-cantly attenuated by soot clouds of this density.
Signal trapping, however, seems to have an effect onthis data set. Signal trapping occurs when particleswithin the line of sight between the laser sheet and thecamera absorb the broadband light produced by thelaser-excited soot particles.62 In this experiment, wemeasure PLII signal at wavelengths shorter than450nm, which are readily absorbed by soot in the lineof sight to the camera. The soot-PLII signal from thecenter of the jet is sometimes unexpectedly low and dif-fers significantly from the traditional view of soot for-mation in diesel jets;49,62 often, almost no signal fromthe central region will be recorded by the camera. Inmany images, signal trapping in the post jet is oftenbiased toward the bottom of the image (as in Figure2(b)) where, as will be discussed later, a large cloud ofsoot from the main injection often resides. Signaltrapping in sooting jets has been noted in previousstudies,63 but the work by Pickett and Siebers62 showedthat the soot distribution in a sooting jet is very similarto that proposed by Dec49 through both LII and laser-absorption measurements.
Engine operating conditions
Engine operating conditions are in Table 2. While theproduction engine has a compression ratio of approxi-mately 16:1, the compression ratio of the optical enginewith a right-cylindrical piston bowl is only 11.22:1. Tocompensate for the lower compression ratio, the engineis operated to replicate the thermodynamic state at topdead center (TDC) of the piston stroke for a 16:1compression-ratio engine using a preheated, boostedintake stream.64 Additionally, this engine is run in skip-fired mode; for every 10 cycles, 9 are motored using adynamometer and 1 is fired. This is done to reducethermal loads on the optical components.
The intake stream is pressurized and heated by acompressor and electrical air heater, respectively. EGRis simulated by adding nitrogen (N2) to the intake airstream. Diluting the intake stream with nitrogen alone,without water and carbon dioxide, yields a lower heatcapacity than real EGR, such that the flame tempera-tures are somewhat higher than with true EGR for agiven intake-oxygen level.65 At all EGR conditions, the
intake charge density, and hence the charge density atTDC, is intentionally held constant to maintain similarspray penetration as EGR is varied. As a result, the glo-bal equivalence ratio increases as EGR is increased; theglobal equivalence ratio is calculated for the replicated16:1 compression ratio cycle, and ranges are reported inTable 3. For example, the global equivalence ratio of a1950ms injection at 21% intake oxygen is 0.28, and at12.6% intake oxygen, it is 0.47. As will be discussedlater, in addition to EGR and other effects, this changein the global equivalence ratio can significantly impactengine-out soot levels. Although the thermodynamicconditions in the 11.22:1 compression-ratio opticalengine match those of a 16:1 compression-ratio metalengine, the global equivalence ratio for the opticalengine will be lower at all EGR levels. The reduced glo-bal equivalence ratio in the optical engine is the resultof approximately 50% greater trapped mass.66
The choice of intake-oxygen levels was guided byindustry practice with regard to EGR levels commonlyused to meet emissions regulations. 18% O2 was chosenas a baseline point because this range of EGR (20%–32%) is commonly used to meet 2010 particulate andNOx regulations61 with the use of both urea-basedselective catalytic reduction (SCR) and diesel particu-late filter (DPF) aftertreatment systems.67 The 12.6%intake oxygen is approximately the level that would berequired to meet the 2010 particulate and NOx regula-tions without the use of aftertreatment systems.67 The15% O2 is a common intake-oxygen level for LTC con-ditions.68,69 Finally, 21% O2 was used as a referencefor undiluted operation.
This study’s test matrix covers a range of operatingconditions, with variations in intake-oxygen content(simulated EGR), load, and post-injection duration.Table 3 shows the range of conditions considered.The test matrix contains two types of injectionschedules—a single-injection schedule and a main- pluspost-injection schedule. In order to establish consistentterminology, we will refer to injection schedules withonly one injection as ‘‘single-injection’’ schedules.
Table 2. Engine operating conditions.
Engine speed 1200 RPMa
Engine load range 300–800 kPa gIMEPb
Intake O2 12.6%, 15%, 18%, 21%Fuel pressure 1200 barTDC motored density 16.6 kg/m3
TDC motored temperature 900 KIntake pressure 161 kPaIntake temperature 108 �C16:1 Compression ratiointake pressure
99 kPa (abs)
16:1 Compression ratiointake temperature
41 �C
TDC: top dead center; CAD: crank angle degree; gIMEP: gross indicated
mean effective pressure.aAt this speed, each CAD is 139 ms in duration.bgIMEP is calculated using indicated work done during compression and
expansion strokes only.
O’Connor and Musculus 7
at PENNSYLVANIA STATE UNIV on August 26, 2013jer.sagepub.comDownloaded from
Additionally, we will refer to injection schedules withtwo injections, a main injection and a post injection, as‘‘main- plus post-injection’’ schedules. At equivalentloads, a single-injection condition has a longer injectionduration than the main injection of a main- plus post-injection condition.
The first set of tests for each EGR condition estab-lishes a baseline soot-versus-load curve for single injec-tions using a sweep in commanded duration of maininjection (DOI1C, inms) from 1350 to as long as 3350ms,depending on the intake-oxygen concentration tested. Forselected main-injection durations, sweeps in the post-injection duration provide data for comparison to thebaseline, with the main-injection duration held constantthroughout the post-injection duration sweep. For example,at 18% O2, three selected single-injection conditions haveinjection durations of 1550, 1950, and 2350ms. For eachselected main-injection duration, the post-injection dura-tion is swept from 300 to 600ms in 50-ms incrementswhile holding the duration of the main-injection constant.
Results
In this section, we describe the effect of post-injectionduration and EGR on the engine-out soot of this opti-cal engine at a variety of conditions. We begin with anoverview of the engine operational data, includinginjection system characterization and a discussion ofthe AHRR profiles at all four intake-oxygen condi-tions. Soot data for the high intake-oxygen conditions(21% and 18% O2) are presented next, followed by thelow intake-oxygen conditions (15% and 12% O2). Ineach case, optical data are provided to gain insight intothe differences in engine-out soot measurements for dif-ferent intake-oxygen levels.
Injection system characterization
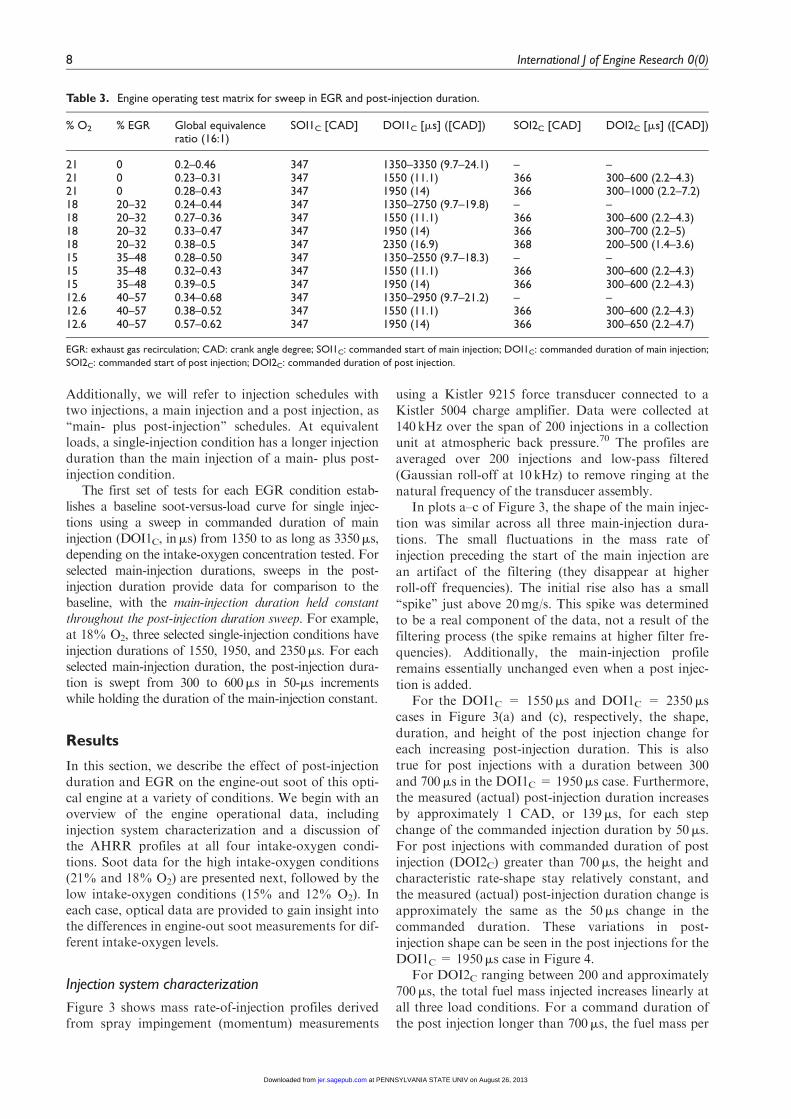
Figure 3 shows mass rate-of-injection profiles derivedfrom spray impingement (momentum) measurements
using a Kistler 9215 force transducer connected to aKistler 5004 charge amplifier. Data were collected at140kHz over the span of 200 injections in a collectionunit at atmospheric back pressure.70 The profiles areaveraged over 200 injections and low-pass filtered(Gaussian roll-off at 10 kHz) to remove ringing at thenatural frequency of the transducer assembly.
In plots a–c of Figure 3, the shape of the main injec-tion was similar across all three main-injection dura-tions. The small fluctuations in the mass rate ofinjection preceding the start of the main injection arean artifact of the filtering (they disappear at higherroll-off frequencies). The initial rise also has a small‘‘spike’’ just above 20mg/s. This spike was determinedto be a real component of the data, not a result of thefiltering process (the spike remains at higher filter fre-quencies). Additionally, the main-injection profileremains essentially unchanged even when a post injec-tion is added.
For the DOI1C = 1550ms and DOI1C = 2350mscases in Figure 3(a) and (c), respectively, the shape,duration, and height of the post injection change foreach increasing post-injection duration. This is alsotrue for post injections with a duration between 300and 700ms in the DOI1C = 1950ms case. Furthermore,the measured (actual) post-injection duration increasesby approximately 1 CAD, or 139ms, for each stepchange of the commanded injection duration by 50ms.For post injections with commanded duration of postinjection (DOI2C) greater than 700ms, the height andcharacteristic rate-shape stay relatively constant, andthe measured (actual) post-injection duration change isapproximately the same as the 50ms change in thecommanded duration. These variations in post-injection shape can be seen in the post injections for theDOI1C = 1950ms case in Figure 4.
For DOI2C ranging between 200 and approximately700ms, the total fuel mass injected increases linearly atall three load conditions. For a command duration ofthe post injection longer than 700ms, the fuel mass per
Table 3. Engine operating test matrix for sweep in EGR and post-injection duration.
% O2 % EGR Global equivalenceratio (16:1)
SOI1C [CAD] DOI1C [ms] ([CAD]) SOI2C [CAD] DOI2C [ms] ([CAD])
21 0 0.2–0.46 347 1350–3350 (9.7–24.1) – –21 0 0.23–0.31 347 1550 (11.1) 366 300–600 (2.2–4.3)21 0 0.28–0.43 347 1950 (14) 366 300–1000 (2.2–7.2)18 20–32 0.24–0.44 347 1350–2750 (9.7–19.8) – –18 20–32 0.27–0.36 347 1550 (11.1) 366 300–600 (2.2–4.3)18 20–32 0.33–0.47 347 1950 (14) 366 300–700 (2.2–5)18 20–32 0.38–0.5 347 2350 (16.9) 368 200–500 (1.4–3.6)15 35–48 0.28–0.50 347 1350–2550 (9.7–18.3) – –15 35–48 0.32–0.43 347 1550 (11.1) 366 300–600 (2.2–4.3)15 35–48 0.39–0.5 347 1950 (14) 366 300–600 (2.2–4.3)12.6 40–57 0.34–0.68 347 1350–2950 (9.7–21.2) – –12.6 40–57 0.38–0.52 347 1550 (11.1) 366 300–600 (2.2–4.3)12.6 40–57 0.57–0.62 347 1950 (14) 366 300–650 (2.2–4.7)
EGR: exhaust gas recirculation; CAD: crank angle degree; SOI1C: commanded start of main injection; DOI1C: commanded duration of main injection;
SOI2C: commanded start of post injection; DOI2C: commanded duration of post injection.
8 International J of Engine Research 0(0)
at PENNSYLVANIA STATE UNIV on August 26, 2013jer.sagepub.comDownloaded from
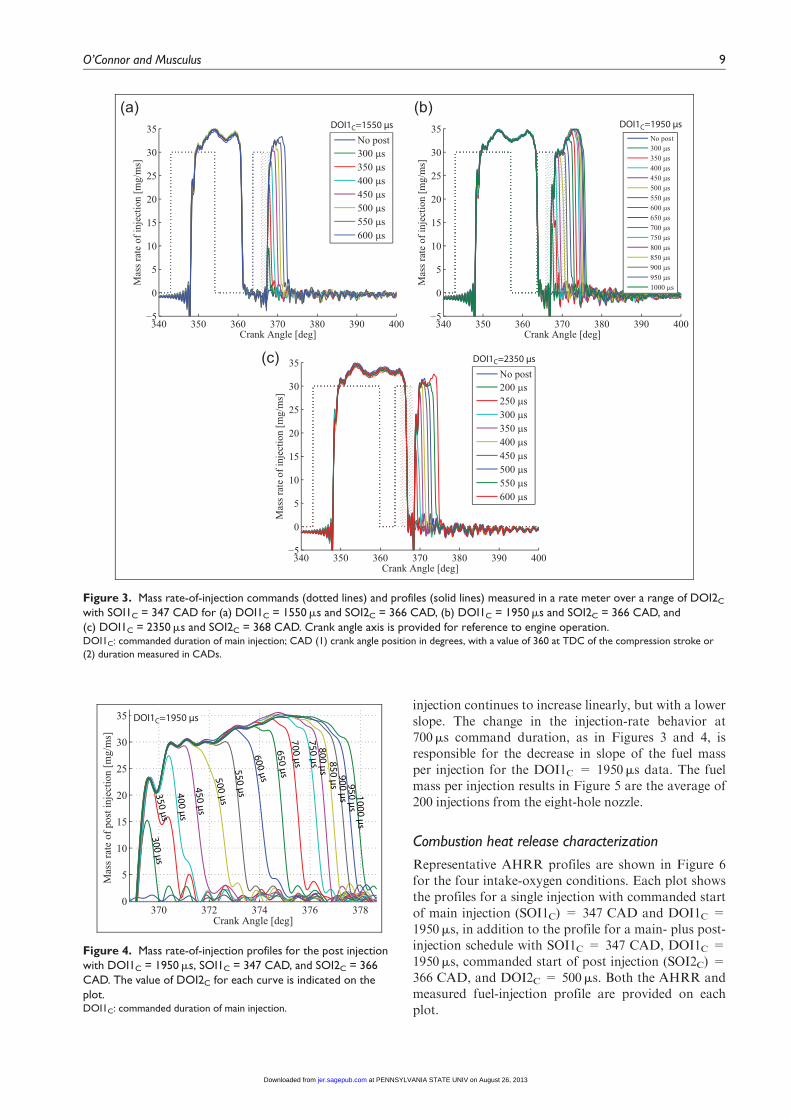
injection continues to increase linearly, but with a lowerslope. The change in the injection-rate behavior at700ms command duration, as in Figures 3 and 4, isresponsible for the decrease in slope of the fuel massper injection for the DOI1C = 1950ms data. The fuelmass per injection results in Figure 5 are the average of200 injections from the eight-hole nozzle.
Combustion heat release characterization
Representative AHRR profiles are shown in Figure 6for the four intake-oxygen conditions. Each plot showsthe profiles for a single injection with commanded startof main injection (SOI1C) = 347 CAD and DOI1C =1950ms, in addition to the profile for a main- plus post-injection schedule with SOI1C = 347 CAD, DOI1C =1950ms, commanded start of post injection (SOI2C) =366 CAD, and DOI2C = 500ms. Both the AHRR andmeasured fuel-injection profile are provided on eachplot.
340 350 360 370 380 390 400−5
0
5
10
15
20
25
30
35
Crank Angle [deg]
Mas
s rat
e of
inje
ctio
n [m
g/m
s]No post300 µs350 µs400 µs450 µs500 µs550 µs600 µs
DOI1C=1550 μs
340 350 360 370 380 390 400−5
0
5
10
15
20
25
30
35
Crank Angle [deg]
Mas
s rat
e of
inje
ctio
n [m
g/m
s]
No post300 µs350 µs400 µs450 µs500 µs550 µs600 µs650 µs700 µs750 µs800 µs850 µs900 µs950 µs1000 µs
DOI1C=1950 μs
340 350 360 370 380 390 400−5
0
5
10
15
20
25
30
35
Crank Angle [deg]
Mas
s rat
e of
inje
ctio
n [m
g/m
s]
No post200 µs250 µs300 µs350 µs400 µs450 µs500 µs550 µs600 µs
DOI1C=2350 μs
(a) (b)
(c)
Figure 3. Mass rate-of-injection commands (dotted lines) and profiles (solid lines) measured in a rate meter over a range of DOI2C
with SOI1C = 347 CAD for (a) DOI1C = 1550 ms and SOI2C = 366 CAD, (b) DOI1C = 1950 ms and SOI2C = 366 CAD, and(c) DOI1C = 2350 ms and SOI2C = 368 CAD. Crank angle axis is provided for reference to engine operation.DOI1C: commanded duration of main injection; CAD (1) crank angle position in degrees, with a value of 360 at TDC of the compression stroke or
(2) duration measured in CADs.
370 372 374 376 3780
5
10
15
20
25
30
35
Crank Angle [deg]
Mas
s rat
e of
pos
t inj
ectio
n [m
g/m
s] 750 μs800 μs
850 μs900 μs
950 μs1000 μs
700 μs
650 μs
600 μs
550 μs
500 μs
450 μs
400 μs
350 μs300 μs
DOI1C=1950 μs
Figure 4. Mass rate-of-injection profiles for the post injectionwith DOI1C = 1950 ms, SOI1C = 347 CAD, and SOI2C = 366CAD. The value of DOI2C for each curve is indicated on theplot.DOI1C: commanded duration of main injection.
O’Connor and Musculus 9
at PENNSYLVANIA STATE UNIV on August 26, 2013jer.sagepub.comDownloaded from
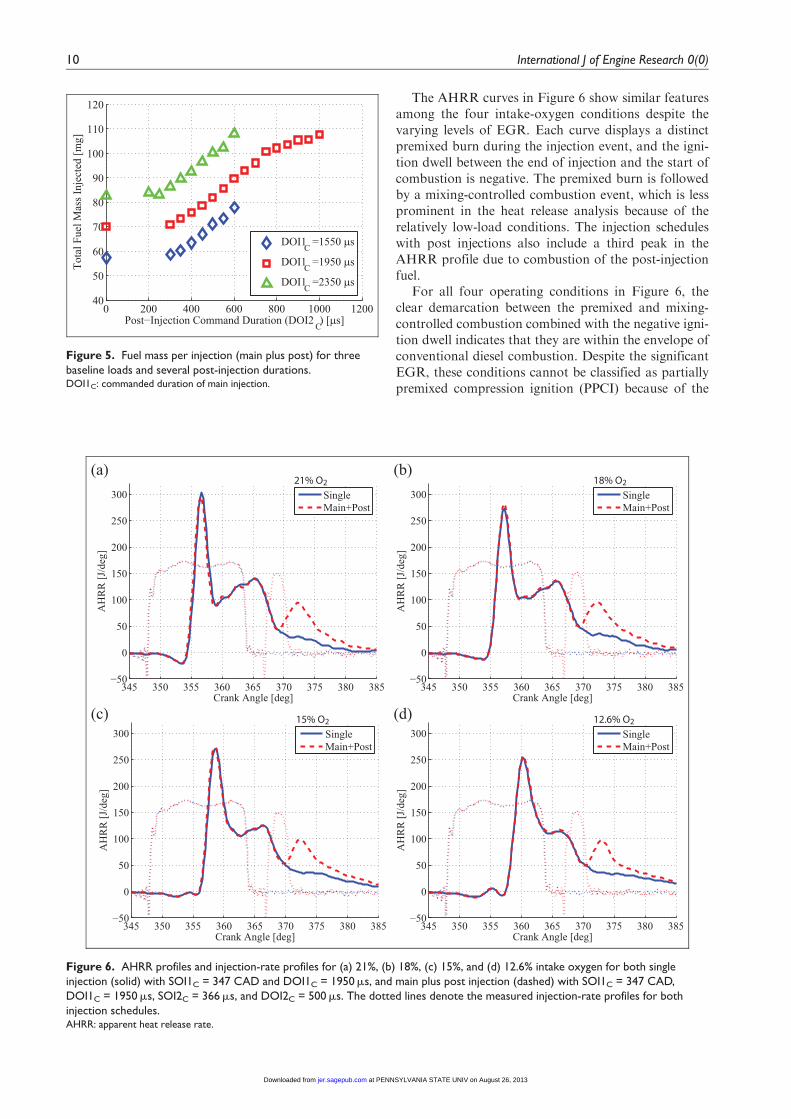
The AHRR curves in Figure 6 show similar featuresamong the four intake-oxygen conditions despite thevarying levels of EGR. Each curve displays a distinctpremixed burn during the injection event, and the igni-tion dwell between the end of injection and the start ofcombustion is negative. The premixed burn is followedby a mixing-controlled combustion event, which is lessprominent in the heat release analysis because of therelatively low-load conditions. The injection scheduleswith post injections also include a third peak in theAHRR profile due to combustion of the post-injectionfuel.
For all four operating conditions in Figure 6, theclear demarcation between the premixed and mixing-controlled combustion combined with the negative igni-tion dwell indicates that they are within the envelope ofconventional diesel combustion. Despite the significantEGR, these conditions cannot be classified as partiallypremixed compression ignition (PPCI) because of the
0 200 400 600 800 1000 120040
50
60
70
80
90
100
110
120
Post−Injection Command Duration (DOI2 C) [µs]
Tota
l Fue
l Mas
s Inj
ecte
d [m
g]
DOI1C =1550 µs
DOI1C =1950 µs
DOI1C =2350 µs
Figure 5. Fuel mass per injection (main plus post) for threebaseline loads and several post-injection durations.DOI1C: commanded duration of main injection.
345 350 355 360 365 370 375 380 385−50
0
50
100
150
200
250
300
Crank Angle [deg]
AH
RR
[J/d
eg]
SingleMain+Post
21% O2
345 350 355 360 365 370 375 380 385−50
0
50
100
150
200
250
300
Crank Angle [deg]
AH
RR
[J/d
eg]
SingleMain+Post
18% O2
345 350 355 360 365 370 375 380 385−50
0
50
100
150
200
250
300
Crank Angle [deg]
AH
RR
[J/d
eg]
SingleMain+Post
15% O2
345 350 355 360 365 370 375 380 385−50
0
50
100
150
200
250
300
Crank Angle [deg]
AH
RR
[J/d
eg]
SingleMain+Post
12.6% O2
(a) (b)
(c) (d)
Figure 6. AHRR profiles and injection-rate profiles for (a) 21%, (b) 18%, (c) 15%, and (d) 12.6% intake oxygen for both singleinjection (solid) with SOI1C = 347 CAD and DOI1C = 1950 ms, and main plus post injection (dashed) with SOI1C = 347 CAD,DOI1C = 1950 ms, SOI2C = 366 ms, and DOI2C = 500 ms. The dotted lines denote the measured injection-rate profiles for bothinjection schedules.AHRR: apparent heat release rate.
10 International J of Engine Research 0(0)
at PENNSYLVANIA STATE UNIV on August 26, 2013jer.sagepub.comDownloaded from
limited mixing that happens before the start of combus-tion. This is an important differentiation to makebecause the conditions considered in this study producesignificant engine-out soot due to the presence ofmixing-controlled combustion, unlike PPCI conditionswhere engine-out soot is very low. This also means thatengine-out UHCs and CO, while not specifically mea-sured in this study, are probably not excessive. As such,the focus of this work is soot reduction for more con-ventional diesel operation without consideration ofissues associated with PPCI operation.
21% and 18% intake O2
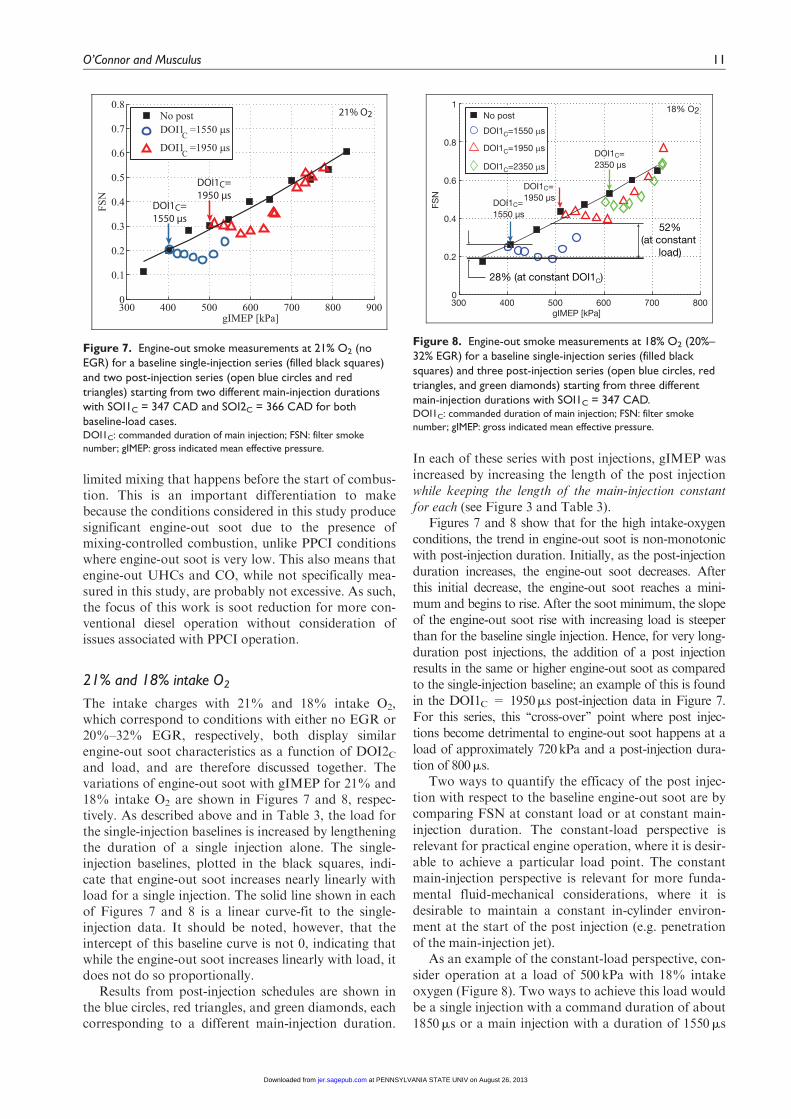
The intake charges with 21% and 18% intake O2,which correspond to conditions with either no EGR or20%–32% EGR, respectively, both display similarengine-out soot characteristics as a function of DOI2Cand load, and are therefore discussed together. Thevariations of engine-out soot with gIMEP for 21% and18% intake O2 are shown in Figures 7 and 8, respec-tively. As described above and in Table 3, the load forthe single-injection baselines is increased by lengtheningthe duration of a single injection alone. The single-injection baselines, plotted in the black squares, indi-cate that engine-out soot increases nearly linearly withload for a single injection. The solid line shown in eachof Figures 7 and 8 is a linear curve-fit to the single-injection data. It should be noted, however, that theintercept of this baseline curve is not 0, indicating thatwhile the engine-out soot increases linearly with load, itdoes not do so proportionally.
Results from post-injection schedules are shown inthe blue circles, red triangles, and green diamonds, eachcorresponding to a different main-injection duration.
In each of these series with post injections, gIMEP wasincreased by increasing the length of the post injectionwhile keeping the length of the main-injection constantfor each (see Figure 3 and Table 3).
Figures 7 and 8 show that for the high intake-oxygenconditions, the trend in engine-out soot is non-monotonicwith post-injection duration. Initially, as the post-injectionduration increases, the engine-out soot decreases. Afterthis initial decrease, the engine-out soot reaches a mini-mum and begins to rise. After the soot minimum, the slopeof the engine-out soot rise with increasing load is steeperthan for the baseline single injection. Hence, for very long-duration post injections, the addition of a post injectionresults in the same or higher engine-out soot as comparedto the single-injection baseline; an example of this is foundin the DOI1C = 1950ms post-injection data in Figure 7.For this series, this ‘‘cross-over’’ point where post injec-tions become detrimental to engine-out soot happens at aload of approximately 720kPa and a post-injection dura-tion of 800ms.
Two ways to quantify the efficacy of the post injec-tion with respect to the baseline engine-out soot are bycomparing FSN at constant load or at constant main-injection duration. The constant-load perspective isrelevant for practical engine operation, where it is desir-able to achieve a particular load point. The constantmain-injection perspective is relevant for more funda-mental fluid-mechanical considerations, where it isdesirable to maintain a constant in-cylinder environ-ment at the start of the post injection (e.g. penetrationof the main-injection jet).
As an example of the constant-load perspective, con-sider operation at a load of 500 kPa with 18% intakeoxygen (Figure 8). Two ways to achieve this load wouldbe a single injection with a command duration of about1850ms or a main injection with a duration of 1550ms
300 400 500 600 700 800 9000
0.1
0.2
0.3
0.4
0.5
0.6
0.7
0.8
gIMEP [kPa]
FSN
No postDOI1C =1550 µs
DOI1C =1950 µs
21% O2
DOI1C=1550 μs
DOI1C=1950 μs
Figure 7. Engine-out smoke measurements at 21% O2 (noEGR) for a baseline single-injection series (filled black squares)and two post-injection series (open blue circles and redtriangles) starting from two different main-injection durationswith SOI1C = 347 CAD and SOI2C = 366 CAD for bothbaseline-load cases.DOI1C: commanded duration of main injection; FSN: filter smoke
number; gIMEP: gross indicated mean effective pressure.
300 400 500 600 700 8000
0.2
0.4
0.6
0.8
1
gIMEP [kPa]
FSN
No post
DOI1C=1550 µs
DOI1C=1950 µs
DOI1C=2350 µs
52%(at constant
load)
28% (at constant DOI1C)
18% O2
DOI1C=1550 μs
DOI1C=1950 μs
DOI1C=2350 μs
Figure 8. Engine-out smoke measurements at 18% O2 (20%–32% EGR) for a baseline single-injection series (filled blacksquares) and three post-injection series (open blue circles, redtriangles, and green diamonds) starting from three differentmain-injection durations with SOI1C = 347 CAD.DOI1C: commanded duration of main injection; FSN: filter smoke
number; gIMEP: gross indicated mean effective pressure.
O’Connor and Musculus 11
at PENNSYLVANIA STATE UNIV on August 26, 2013jer.sagepub.comDownloaded from
plus a post injection with a duration of 500ms. Fromthis perspective, as shown in Figure 8, the engine-outFSN for the main- plus post-injection operation is 52%lower than that of the single-injection operation.Corresponding differentials occur for all three main-injection durations in Figure 8, where the minimum-soot condition with a main-injection duration of1950ms and post-injection duration of 500ms gives a26% reduction from the single injection, and theminimum-soot condition with a main-injection dura-tion of 2350ms and a post-injection duration of 300msgives a 20% reduction from the single injection at thesame load.
The alternative perspective is to compare the engine-out soot for a main- plus post-injection schedule to thatwith only the single injection, but with the same main-injection duration (at a lower load). For example, inFigure 8 (18% O2), the FSN for a single injection witha command duration of 1550ms is 0.26, while theminimum-soot condition for a main injection of thesame duration with the ‘‘optimal’’ post injection(DOI1C = 1550ms and DOI2C = 500ms) has FSN of0.19, a reduction of approximately 28%, as annotatedin Figure 8. From this perspective, the engine-out sootalso initially decreases from an unchanged main injec-tion as the post-injection duration is increased. Thistrend is important because it clearly shows that the postinjection must be interacting in some way with themain-injection soot to reduce the engine-out soot—there is no ambiguity in that respect. This indicates thatin this case, the reason for engine-out soot reduction athigh intake-oxygen conditions cannot be the injection-duration effect; the reduction in soot must stem from afluid-mechanical or thermal interaction between thepost injection and the main-injection mixture.
The difference between these two perspectives oncomparing post injections to single injection is impor-tant and merits some discussion. The constant main-injection duration approach differs from those in manypost-injection studies that, while able to show that postinjections can reduce engine-out soot, performed thetests with a fundamentally different injection schedulethan the method used in this study. Studies like thosefrom Payri et al.,32 Benajes et al.,42 and Mendez andThirouard23 varied post-injection duration while keep-ing the total quantity of fuel injected constant by short-ening the main injection as the post injection waslengthened. This operational mode is very similar tothat of split-injection studies, including those byPierpont et al.,36 Tow et al.,40 and Bower and Foster.33
In this study, we can confidently conclude that thereduction of soot with post-injection operation belowthe engine-out soot level of the main injection indicatesthat the post injection must interact with the residualsoot from the main injection because nothing about themain injection itself has changed (see injection-rate pro-files in Figure 3 and AHRR profiles in Figure 6 forconfirmation). However, when soot reduction is mea-sured for post injections where the main-injection
duration has been altered, it is unclear if this sootreduction is truly derived from an interaction betweenthe post jet and the main-injection soot or fromchanges to the main injection as the duration wasaltered. This is an important distinction among themany studies within the literature; for studies that haveexplored both modes of operation, see Bobba et al.,22
Desantes et al.,17 and Hotta et al.18
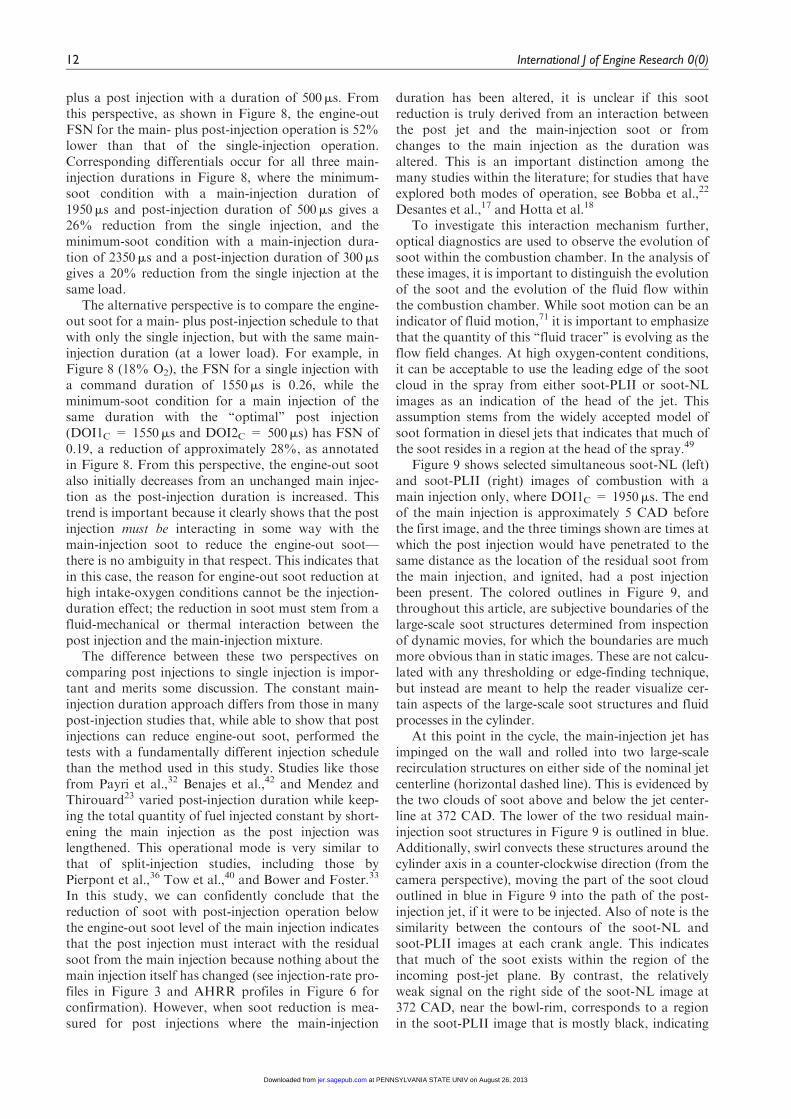
To investigate this interaction mechanism further,optical diagnostics are used to observe the evolution ofsoot within the combustion chamber. In the analysis ofthese images, it is important to distinguish the evolutionof the soot and the evolution of the fluid flow withinthe combustion chamber. While soot motion can be anindicator of fluid motion,71 it is important to emphasizethat the quantity of this ‘‘fluid tracer’’ is evolving as theflow field changes. At high oxygen-content conditions,it can be acceptable to use the leading edge of the sootcloud in the spray from either soot-PLII or soot-NLimages as an indication of the head of the jet. Thisassumption stems from the widely accepted model ofsoot formation in diesel jets that indicates that much ofthe soot resides in a region at the head of the spray.49
Figure 9 shows selected simultaneous soot-NL (left)and soot-PLII (right) images of combustion with amain injection only, where DOI1C = 1950ms. The endof the main injection is approximately 5 CAD beforethe first image, and the three timings shown are times atwhich the post injection would have penetrated to thesame distance as the location of the residual soot fromthe main injection, and ignited, had a post injectionbeen present. The colored outlines in Figure 9, andthroughout this article, are subjective boundaries of thelarge-scale soot structures determined from inspectionof dynamic movies, for which the boundaries are muchmore obvious than in static images. These are not calcu-lated with any thresholding or edge-finding technique,but instead are meant to help the reader visualize cer-tain aspects of the large-scale soot structures and fluidprocesses in the cylinder.
At this point in the cycle, the main-injection jet hasimpinged on the wall and rolled into two large-scalerecirculation structures on either side of the nominal jetcenterline (horizontal dashed line). This is evidenced bythe two clouds of soot above and below the jet center-line at 372 CAD. The lower of the two residual main-injection soot structures in Figure 9 is outlined in blue.Additionally, swirl convects these structures around thecylinder axis in a counter-clockwise direction (from thecamera perspective), moving the part of the soot cloudoutlined in blue in Figure 9 into the path of the post-injection jet, if it were to be injected. Also of note is thesimilarity between the contours of the soot-NL andsoot-PLII images at each crank angle. This indicatesthat much of the soot exists within the region of theincoming post-jet plane. By contrast, the relativelyweak signal on the right side of the soot-NL image at372 CAD, near the bowl-rim, corresponds to a regionin the soot-PLII image that is mostly black, indicating
12 International J of Engine Research 0(0)
at PENNSYLVANIA STATE UNIV on August 26, 2013jer.sagepub.comDownloaded from
that the soot-NL in that region is from soot above orbelow the nominal plane of the jet axis (i.e. the lasersheet).
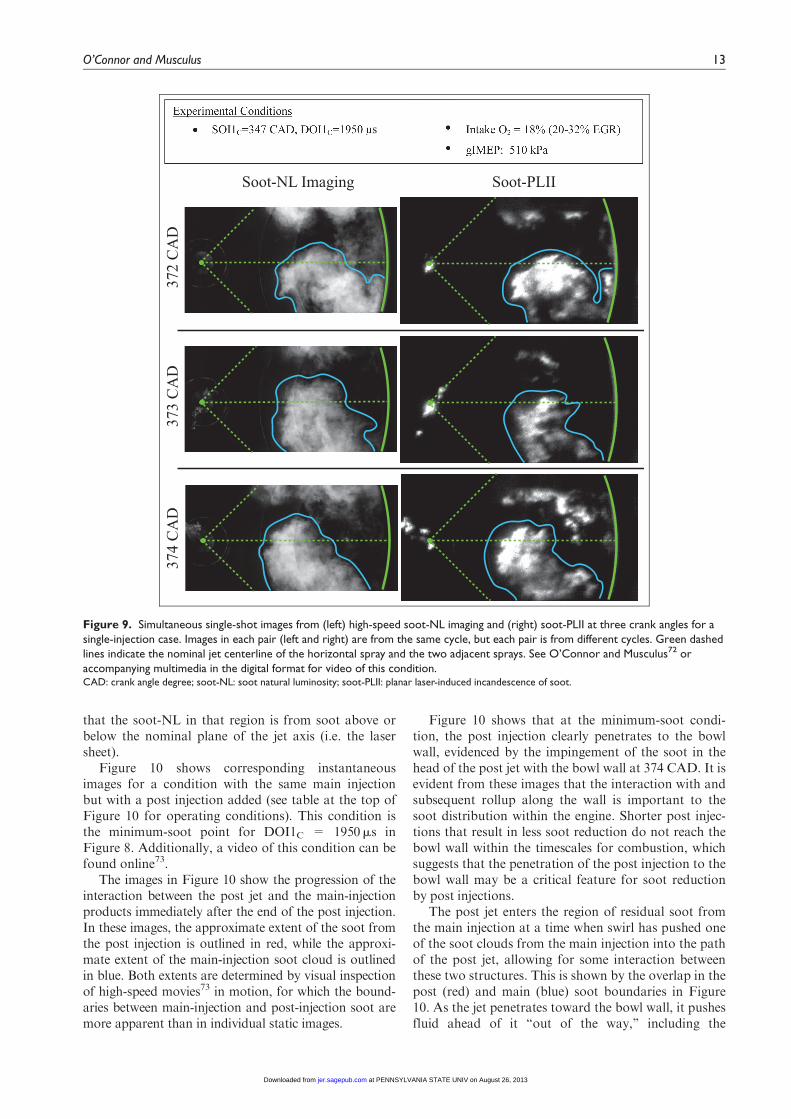
Figure 10 shows corresponding instantaneousimages for a condition with the same main injectionbut with a post injection added (see table at the top ofFigure 10 for operating conditions). This condition isthe minimum-soot point for DOI1C = 1950ms inFigure 8. Additionally, a video of this condition can befound online73.
The images in Figure 10 show the progression of theinteraction between the post jet and the main-injectionproducts immediately after the end of the post injection.In these images, the approximate extent of the soot fromthe post injection is outlined in red, while the approxi-mate extent of the main-injection soot cloud is outlinedin blue. Both extents are determined by visual inspectionof high-speed movies73 in motion, for which the bound-aries between main-injection and post-injection soot aremore apparent than in individual static images.
Figure 10 shows that at the minimum-soot condi-tion, the post injection clearly penetrates to the bowlwall, evidenced by the impingement of the soot in thehead of the post jet with the bowl wall at 374 CAD. It isevident from these images that the interaction with andsubsequent rollup along the wall is important to thesoot distribution within the engine. Shorter post injec-tions that result in less soot reduction do not reach thebowl wall within the timescales for combustion, whichsuggests that the penetration of the post injection to thebowl wall may be a critical feature for soot reductionby post injections.
The post jet enters the region of residual soot fromthe main injection at a time when swirl has pushed oneof the soot clouds from the main injection into the pathof the post jet, allowing for some interaction betweenthese two structures. This is shown by the overlap in thepost (red) and main (blue) soot boundaries in Figure10. As the jet penetrates toward the bowl wall, it pushesfluid ahead of it ‘‘out of the way,’’ including the
372
CA
D37
3 C
AD
374
CA
DSoot-NL Imaging Soot-PLII
s
Figure 9. Simultaneous single-shot images from (left) high-speed soot-NL imaging and (right) soot-PLII at three crank angles for asingle-injection case. Images in each pair (left and right) are from the same cycle, but each pair is from different cycles. Green dashedlines indicate the nominal jet centerline of the horizontal spray and the two adjacent sprays. See O’Connor and Musculus72 oraccompanying multimedia in the digital format for video of this condition.CAD: crank angle degree; soot-NL: soot natural luminosity; soot-PLII: planar laser-induced incandescence of soot.
O’Connor and Musculus 13
at PENNSYLVANIA STATE UNIV on August 26, 2013jer.sagepub.comDownloaded from
372
CA
D37
3 C
AD
374
CA
DSoot-NL Imaging Soot-PLII
375
CA
D37
6 C
AD
377
CA
D
s
s
Figure 10. Simultaneous single-shot images from (left) high-speed soot-NL imaging and (right) soot-PLII at six crank angles for theminimum-soot condition. Images in each pair (left and right) are from the same cycle, but each pair is from different cycles. Theannotated outlines show the approximate boundaries of (red) post-injection soot and (blue) main-injection soot. Green dashed linesindicate the jet centerline from the main spray and the two adjacent sprays. A video of this condition can be found online73 oraccompanying multimedia in the digital format.CAD: crank angle degree; soot-NL: soot natural luminosity; soot-PLII: planar laser-induced incandescence of soot.
14 International J of Engine Research 0(0)
at PENNSYLVANIA STATE UNIV on August 26, 2013jer.sagepub.comDownloaded from
constituents of the main-injection products. This displa-cement mechanism is most apparent in the soot-PLIIimages from 372 to 374 CAD, wherein soot from themain injection is initially ahead of the post jet, and isprogressively pushed forward (right) and to the sides(up and down) of the post jet.
Additionally, as the jet passes through the main-injection products region, it entrains fluid from this regioninto the jet. This can be seen in many soot-NL videos,where pockets of soot are entrained to the trailing edge ofthe post jet as it passes the edge of the residual main-injection soot cloud, as can be seen in Cycle 3 in the sup-plementary video.73 Finally, in the later images when thepost jet impinges on the bowl wall, the jet rolls up toeither side, similar to that noted earlier for the main injec-tion. This process is shown in the 376 and 377 CADimages in Figure 10. In both the soot-NL and soot-PLIIimages, impingement and rollup of the post-injection sootcloud are evident at 376 CAD. At the next crank angle,the post and main soot clouds have evolved to the pointwhere it is difficult to differentiate their structures.
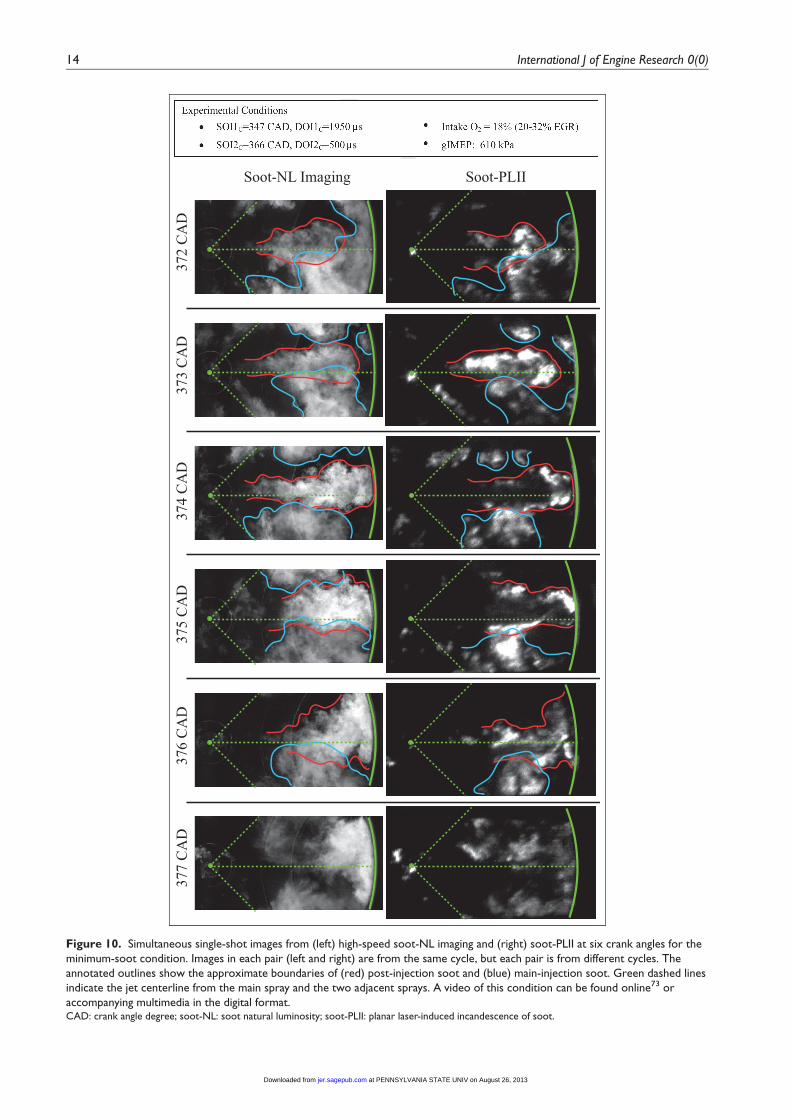
The post-jet interaction with the main-injection sootis even more substantial in cases where the post-injection duration is longer. Figure 11 shows soot-NLimages for a condition with DOI1C = 1950ms and
DOI2C = 600ms, which has a gIMEP of 665kPa. Atthis condition, the engine-out soot is still less than asingle injection at the same load (a reduction of 13%),but with FSN at 0.52, its engine-out soot is greater thanboth the minimum-soot condition (DOI1C = 1950ms,DOI2C = 500ms, FSN of 0.4) and the main-injection-only condition (DOI1C = 1950ms, FSN of 0.42).
Figure 11 shows high-speed soot-NL images at arange of 371–376 CAD. Note that liquid fuel is stillbeing injected during 371–373 CAD due to the longerpost-injection duration at this condition. As a result ofthe increased fuel quantity of the post injection, moresoot is produced in the post jet. This is evidenced bythe increased natural-emission signal in these images ascompared to the shorter post injection in Figure 10.Although the soot-NL signal is affected by both soottemperature and soot concentration, the soot tempera-tures should not be significantly greater with longerpost injections because the adiabatic flame tempera-tures are similar for the two combustion phasings.Hence, the increase in soot-NL is likely due to anincrease in soot concentration rather than an increasein soot temperature.
More significant interaction between the post jet andthe main-injection soot is evident in the videos.74 For
371
CA
D37
2 C
AD
373
CA
D 376 CA
D375 C
AD
374 CA
D
Soot-NL Imaging
s
s
Figure 11. Instantaneous soot-NL images at six crank angles for a long post-injection condition. The annotated outlines (red) showthe approximate boundaries of post-injection soot. A video of this condition can be found online74 or accompanying multimedia inthe digital format.CAD: crank angle degree; soot-NL: soot natural luminosity.
O’Connor and Musculus 15
at PENNSYLVANIA STATE UNIV on August 26, 2013jer.sagepub.comDownloaded from
example, significant entrainment of the main-injectionsoot into the tail of the post jet is present during Cycles1–4 of the video. Furthermore, the post jet penetratesto the bowl wall and a significant amount of soot rollsup on either side, becoming indistinguishable from themain-injection soot. Despite the fact that the engine-outsoot level at this post-injection duration is greater thanthat of the main injection only, the optical data showthat there is still significant interaction between the postjet and the main-injection soot and products. Given theevidence of interaction between the post jet and mainsoot at shorter injection durations, it is only logical thata longer post injection would also have a similar or evengreater amount of interaction. However, we posit thatthe increased engine-out soot at this condition, as com-pared to the minimum-soot condition, is a result of theincrease in soot formed in the longer post jet.
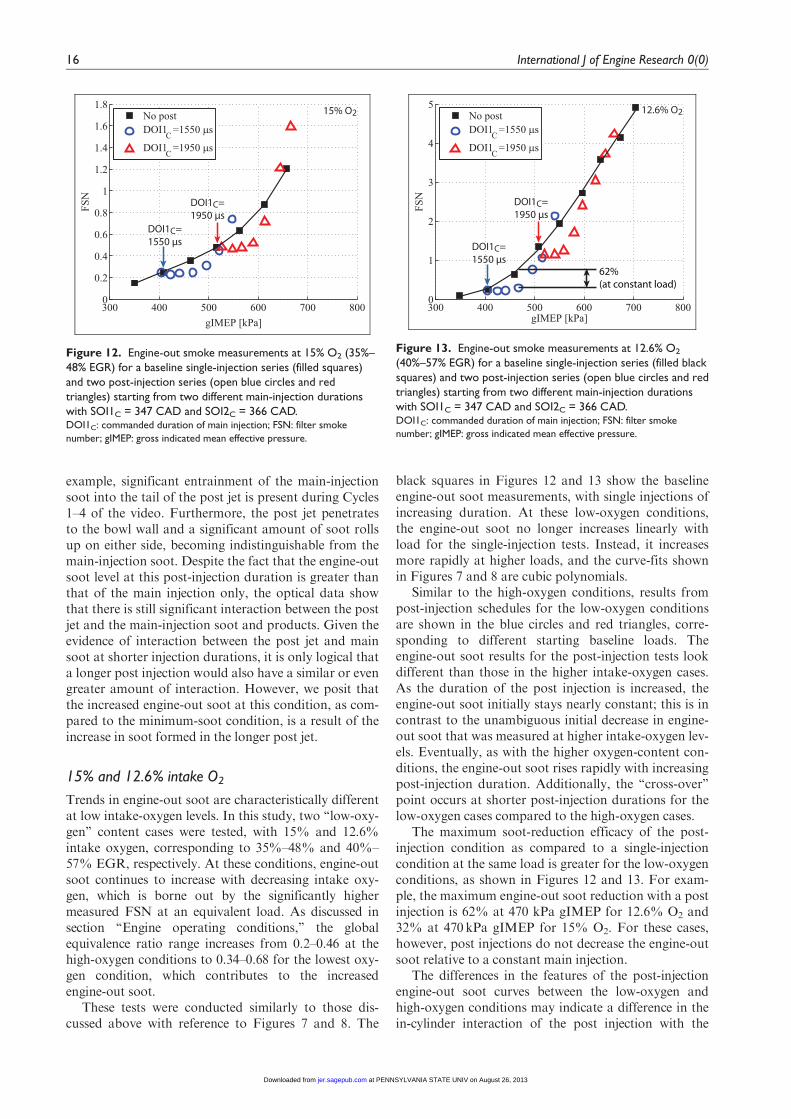
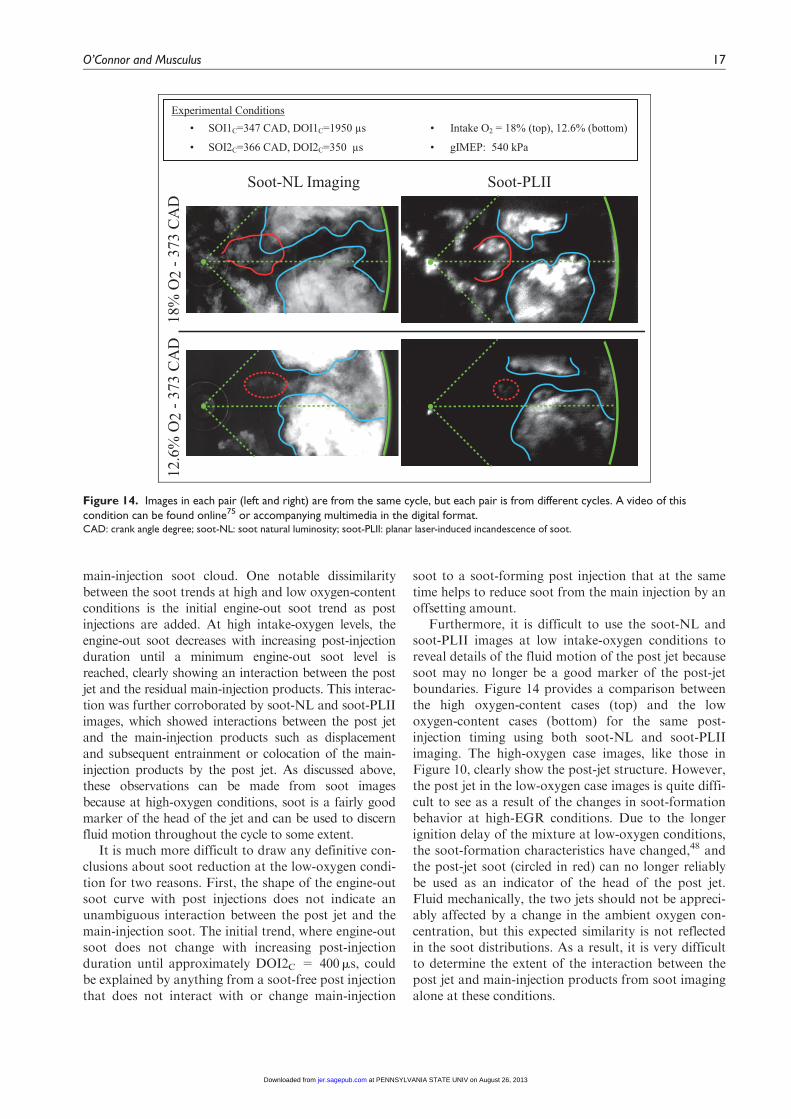
15% and 12.6% intake O2
Trends in engine-out soot are characteristically differentat low intake-oxygen levels. In this study, two ‘‘low-oxy-gen’’ content cases were tested, with 15% and 12.6%intake oxygen, corresponding to 35%–48% and 40%–57% EGR, respectively. At these conditions, engine-outsoot continues to increase with decreasing intake oxy-gen, which is borne out by the significantly highermeasured FSN at an equivalent load. As discussed insection ‘‘Engine operating conditions,’’ the globalequivalence ratio range increases from 0.2–0.46 at thehigh-oxygen conditions to 0.34–0.68 for the lowest oxy-gen condition, which contributes to the increasedengine-out soot.
These tests were conducted similarly to those dis-cussed above with reference to Figures 7 and 8. The
black squares in Figures 12 and 13 show the baselineengine-out soot measurements, with single injections ofincreasing duration. At these low-oxygen conditions,the engine-out soot no longer increases linearly withload for the single-injection tests. Instead, it increasesmore rapidly at higher loads, and the curve-fits shownin Figures 7 and 8 are cubic polynomials.
Similar to the high-oxygen conditions, results frompost-injection schedules for the low-oxygen conditionsare shown in the blue circles and red triangles, corre-sponding to different starting baseline loads. Theengine-out soot results for the post-injection tests lookdifferent than those in the higher intake-oxygen cases.As the duration of the post injection is increased, theengine-out soot initially stays nearly constant; this is incontrast to the unambiguous initial decrease in engine-out soot that was measured at higher intake-oxygen lev-els. Eventually, as with the higher oxygen-content con-ditions, the engine-out soot rises rapidly with increasingpost-injection duration. Additionally, the ‘‘cross-over’’point occurs at shorter post-injection durations for thelow-oxygen cases compared to the high-oxygen cases.
The maximum soot-reduction efficacy of the post-injection condition as compared to a single-injectioncondition at the same load is greater for the low-oxygenconditions, as shown in Figures 12 and 13. For exam-ple, the maximum engine-out soot reduction with a postinjection is 62% at 470 kPa gIMEP for 12.6% O2 and32% at 470 kPa gIMEP for 15% O2. For these cases,however, post injections do not decrease the engine-outsoot relative to a constant main injection.
The differences in the features of the post-injectionengine-out soot curves between the low-oxygen andhigh-oxygen conditions may indicate a difference in thein-cylinder interaction of the post injection with the
300 400 500 600 700 8000
0.2
0.4
0.6
0.8
1
1.2
1.4
1.6
1.8
gIMEP [kPa]
FSN
No postDOI1C =1550 µs
DOI1C =1950 µs
15% O2
DOI1C=1550 μs
DOI1C=1950 μs
Figure 12. Engine-out smoke measurements at 15% O2 (35%–48% EGR) for a baseline single-injection series (filled squares)and two post-injection series (open blue circles and redtriangles) starting from two different main-injection durationswith SOI1C = 347 CAD and SOI2C = 366 CAD.DOI1C: commanded duration of main injection; FSN: filter smoke
number; gIMEP: gross indicated mean effective pressure.
300 400 500 600 700 8000
1
2
3
4
5
gIMEP [kPa]
FSN
No postDOI1C =1550 µs
DOI1C =1950 µs
12.6% O2
DOI1C=1550 μs
DOI1C=1950 μs
62%(at constant load)
Figure 13. Engine-out smoke measurements at 12.6% O2
(40%–57% EGR) for a baseline single-injection series (filled blacksquares) and two post-injection series (open blue circles and redtriangles) starting from two different main-injection durationswith SOI1C = 347 CAD and SOI2C = 366 CAD.DOI1C: commanded duration of main injection; FSN: filter smoke
number; gIMEP: gross indicated mean effective pressure.
16 International J of Engine Research 0(0)
at PENNSYLVANIA STATE UNIV on August 26, 2013jer.sagepub.comDownloaded from
main-injection soot cloud. One notable dissimilaritybetween the soot trends at high and low oxygen-contentconditions is the initial engine-out soot trend as postinjections are added. At high intake-oxygen levels, theengine-out soot decreases with increasing post-injectionduration until a minimum engine-out soot level isreached, clearly showing an interaction between the postjet and the residual main-injection products. This interac-tion was further corroborated by soot-NL and soot-PLIIimages, which showed interactions between the post jetand the main-injection products such as displacementand subsequent entrainment or colocation of the main-injection products by the post jet. As discussed above,these observations can be made from soot imagesbecause at high-oxygen conditions, soot is a fairly goodmarker of the head of the jet and can be used to discernfluid motion throughout the cycle to some extent.
It is much more difficult to draw any definitive con-clusions about soot reduction at the low-oxygen condi-tion for two reasons. First, the shape of the engine-outsoot curve with post injections does not indicate anunambiguous interaction between the post jet and themain-injection soot. The initial trend, where engine-outsoot does not change with increasing post-injectionduration until approximately DOI2C = 400ms, couldbe explained by anything from a soot-free post injectionthat does not interact with or change main-injection
soot to a soot-forming post injection that at the sametime helps to reduce soot from the main injection by anoffsetting amount.
Furthermore, it is difficult to use the soot-NL andsoot-PLII images at low intake-oxygen conditions toreveal details of the fluid motion of the post jet becausesoot may no longer be a good marker of the post-jetboundaries. Figure 14 provides a comparison betweenthe high oxygen-content cases (top) and the lowoxygen-content cases (bottom) for the same post-injection timing using both soot-NL and soot-PLIIimaging. The high-oxygen case images, like those inFigure 10, clearly show the post-jet structure. However,the post jet in the low-oxygen case images is quite diffi-cult to see as a result of the changes in soot-formationbehavior at high-EGR conditions. Due to the longerignition delay of the mixture at low-oxygen conditions,the soot-formation characteristics have changed,48 andthe post-jet soot (circled in red) can no longer reliablybe used as an indicator of the head of the post jet.Fluid mechanically, the two jets should not be appreci-ably affected by a change in the ambient oxygen con-centration, but this expected similarity is not reflectedin the soot distributions. As a result, it is very difficultto determine the extent of the interaction between thepost jet and main-injection products from soot imagingalone at these conditions.
18%
O2
- 373
CA
D12
.6%
O2
- 373
CA
DSoot-NL Imaging Soot-PLII
Experimental Conditions• SOI1C=347 CAD, DOI1C=1950 µs • Intake O2 = 18% (top), 12.6% (bottom)
• SOI2C=366 CAD, DOI2C=350 µs • gIMEP: 540 kPa
Figure 14. Images in each pair (left and right) are from the same cycle, but each pair is from different cycles. A video of thiscondition can be found online75 or accompanying multimedia in the digital format.CAD: crank angle degree; soot-NL: soot natural luminosity; soot-PLII: planar laser-induced incandescence of soot.
O’Connor and Musculus 17
at PENNSYLVANIA STATE UNIV on August 26, 2013jer.sagepub.comDownloaded from
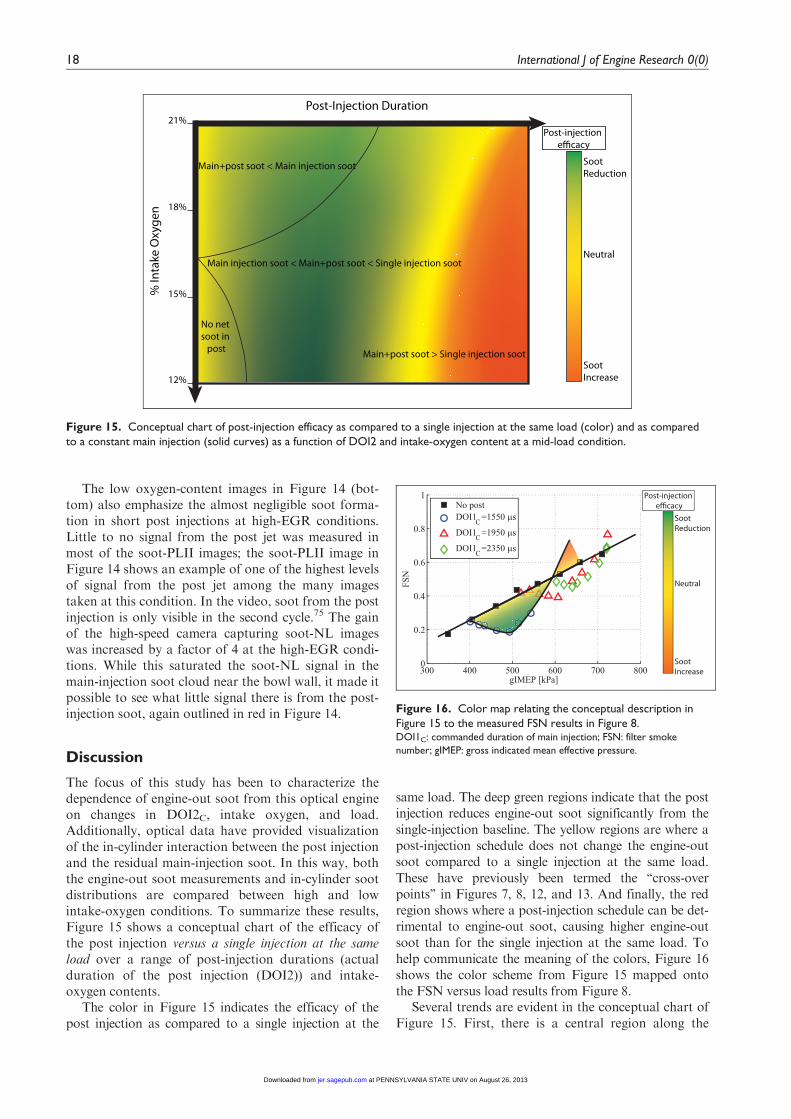
The low oxygen-content images in Figure 14 (bot-tom) also emphasize the almost negligible soot forma-tion in short post injections at high-EGR conditions.Little to no signal from the post jet was measured inmost of the soot-PLII images; the soot-PLII image inFigure 14 shows an example of one of the highest levelsof signal from the post jet among the many imagestaken at this condition. In the video, soot from the postinjection is only visible in the second cycle.75 The gainof the high-speed camera capturing soot-NL imageswas increased by a factor of 4 at the high-EGR condi-tions. While this saturated the soot-NL signal in themain-injection soot cloud near the bowl wall, it made itpossible to see what little signal there is from the post-injection soot, again outlined in red in Figure 14.
Discussion
The focus of this study has been to characterize thedependence of engine-out soot from this optical engineon changes in DOI2C, intake oxygen, and load.Additionally, optical data have provided visualizationof the in-cylinder interaction between the post injectionand the residual main-injection soot. In this way, boththe engine-out soot measurements and in-cylinder sootdistributions are compared between high and lowintake-oxygen conditions. To summarize these results,Figure 15 shows a conceptual chart of the efficacy ofthe post injection versus a single injection at the sameload over a range of post-injection durations (actualduration of the post injection (DOI2)) and intake-oxygen contents.
The color in Figure 15 indicates the efficacy of thepost injection as compared to a single injection at the
same load. The deep green regions indicate that the postinjection reduces engine-out soot significantly from thesingle-injection baseline. The yellow regions are where apost-injection schedule does not change the engine-outsoot compared to a single injection at the same load.These have previously been termed the ‘‘cross-overpoints’’ in Figures 7, 8, 12, and 13. And finally, the redregion shows where a post-injection schedule can be det-rimental to engine-out soot, causing higher engine-outsoot than for the single injection at the same load. Tohelp communicate the meaning of the colors, Figure 16shows the color scheme from Figure 15 mapped ontothe FSN versus load results from Figure 8.
Several trends are evident in the conceptual chart ofFigure 15. First, there is a central region along the
21%
18%
15%
12%
% In
take
Oxy
gen
Post-Injection Duration
Post-injection efficacy
SootReduction
SootIncrease
Neutral
No net soot in
post
Main+post soot < Main injection soot
Main+post soot > Single injection soot
Main injection soot < Main+post soot < Single injection soot
Figure 15. Conceptual chart of post-injection efficacy as compared to a single injection at the same load (color) and as comparedto a constant main injection (solid curves) as a function of DOI2 and intake-oxygen content at a mid-load condition.
300 400 500 600 700 8000
0.2
0.4
0.6
0.8
1
gIMEP [kPa]
FSN
No postDOI1C =1550 µs
DOI1C =1950 µs
DOI1C =2350 µs
Post-injection efficacy
SootReduction
SootIncrease
Neutral
Figure 16. Color map relating the conceptual description inFigure 15 to the measured FSN results in Figure 8.DOI1C: commanded duration of main injection; FSN: filter smoke
number; gIMEP: gross indicated mean effective pressure.
18 International J of Engine Research 0(0)
at PENNSYLVANIA STATE UNIV on August 26, 2013jer.sagepub.comDownloaded from
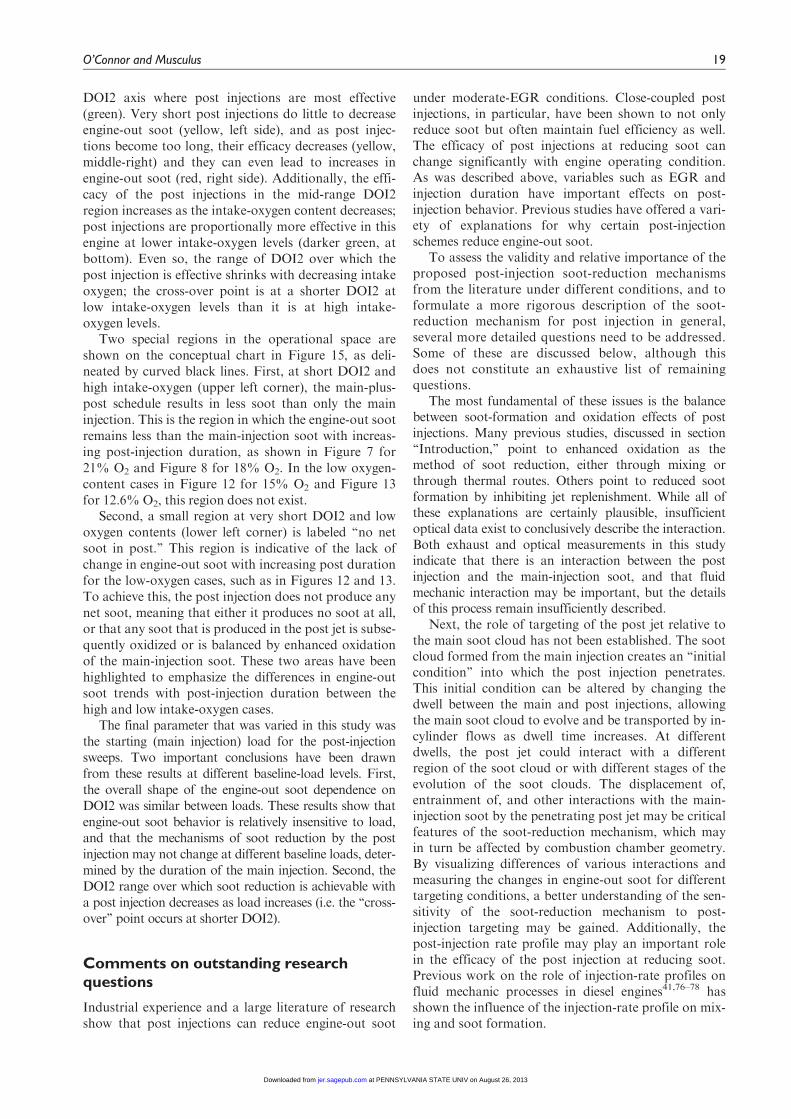
DOI2 axis where post injections are most effective(green). Very short post injections do little to decreaseengine-out soot (yellow, left side), and as post injec-tions become too long, their efficacy decreases (yellow,middle-right) and they can even lead to increases inengine-out soot (red, right side). Additionally, the effi-cacy of the post injections in the mid-range DOI2region increases as the intake-oxygen content decreases;post injections are proportionally more effective in thisengine at lower intake-oxygen levels (darker green, atbottom). Even so, the range of DOI2 over which thepost injection is effective shrinks with decreasing intakeoxygen; the cross-over point is at a shorter DOI2 atlow intake-oxygen levels than it is at high intake-oxygen levels.
Two special regions in the operational space areshown on the conceptual chart in Figure 15, as deli-neated by curved black lines. First, at short DOI2 andhigh intake-oxygen (upper left corner), the main-plus-post schedule results in less soot than only the maininjection. This is the region in which the engine-out sootremains less than the main-injection soot with increas-ing post-injection duration, as shown in Figure 7 for21% O2 and Figure 8 for 18% O2. In the low oxygen-content cases in Figure 12 for 15% O2 and Figure 13for 12.6% O2, this region does not exist.
Second, a small region at very short DOI2 and lowoxygen contents (lower left corner) is labeled ‘‘no netsoot in post.’’ This region is indicative of the lack ofchange in engine-out soot with increasing post durationfor the low-oxygen cases, such as in Figures 12 and 13.To achieve this, the post injection does not produce anynet soot, meaning that either it produces no soot at all,or that any soot that is produced in the post jet is subse-quently oxidized or is balanced by enhanced oxidationof the main-injection soot. These two areas have beenhighlighted to emphasize the differences in engine-outsoot trends with post-injection duration between thehigh and low intake-oxygen cases.
The final parameter that was varied in this study wasthe starting (main injection) load for the post-injectionsweeps. Two important conclusions have been drawnfrom these results at different baseline-load levels. First,the overall shape of the engine-out soot dependence onDOI2 was similar between loads. These results show thatengine-out soot behavior is relatively insensitive to load,and that the mechanisms of soot reduction by the postinjection may not change at different baseline loads, deter-mined by the duration of the main injection. Second, theDOI2 range over which soot reduction is achievable witha post injection decreases as load increases (i.e. the ‘‘cross-over’’ point occurs at shorter DOI2).
Comments on outstanding researchquestions
Industrial experience and a large literature of researchshow that post injections can reduce engine-out soot
under moderate-EGR conditions. Close-coupled postinjections, in particular, have been shown to not onlyreduce soot but often maintain fuel efficiency as well.The efficacy of post injections at reducing soot canchange significantly with engine operating condition.As was described above, variables such as EGR andinjection duration have important effects on post-injection behavior. Previous studies have offered a vari-ety of explanations for why certain post-injectionschemes reduce engine-out soot.
To assess the validity and relative importance of theproposed post-injection soot-reduction mechanismsfrom the literature under different conditions, and toformulate a more rigorous description of the soot-reduction mechanism for post injection in general,several more detailed questions need to be addressed.Some of these are discussed below, although thisdoes not constitute an exhaustive list of remainingquestions.
The most fundamental of these issues is the balancebetween soot-formation and oxidation effects of postinjections. Many previous studies, discussed in section‘‘Introduction,’’ point to enhanced oxidation as themethod of soot reduction, either through mixing orthrough thermal routes. Others point to reduced sootformation by inhibiting jet replenishment. While all ofthese explanations are certainly plausible, insufficientoptical data exist to conclusively describe the interaction.Both exhaust and optical measurements in this studyindicate that there is an interaction between the postinjection and the main-injection soot, and that fluidmechanic interaction may be important, but the detailsof this process remain insufficiently described.
Next, the role of targeting of the post jet relative tothe main soot cloud has not been established. The sootcloud formed from the main injection creates an ‘‘initialcondition’’ into which the post injection penetrates.This initial condition can be altered by changing thedwell between the main and post injections, allowingthe main soot cloud to evolve and be transported by in-cylinder flows as dwell time increases. At differentdwells, the post jet could interact with a differentregion of the soot cloud or with different stages of theevolution of the soot clouds. The displacement of,entrainment of, and other interactions with the main-injection soot by the penetrating post jet may be criticalfeatures of the soot-reduction mechanism, which mayin turn be affected by combustion chamber geometry.By visualizing differences of various interactions andmeasuring the changes in engine-out soot for differenttargeting conditions, a better understanding of the sen-sitivity of the soot-reduction mechanism to post-injection targeting may be gained. Additionally, thepost-injection rate profile may play an important rolein the efficacy of the post injection at reducing soot.Previous work on the role of injection-rate profiles onfluid mechanic processes in diesel engines41,76–78 hasshown the influence of the injection-rate profile on mix-ing and soot formation.
O’Connor and Musculus 19
at PENNSYLVANIA STATE UNIV on August 26, 2013jer.sagepub.comDownloaded from
While fluid mechanic processes associated with thepost injection may likely play a role in soot reduction,several authors have also pointed to the importance ofthe thermal effects of the post injection. Both soot for-mation and oxidation are highly dependent on tempera-ture,12 and the addition of fuel through a post injectionchanges the heat release profile and temperature distri-bution throughout the cycle.29 While the sensitivity ofthe engine-out soot to bulk-cylinder thermal conditionscan certainly be measured, optical data of a thermalmechanism are much harder to measure.
Finally, measurements by Barro et al.19 have addedadditional support to the idea that soot formation mayhave a nonlinear dependence on injection durationthrough the ‘‘jet replenishment’’ mechanism. The role ofthis mechanism relative to the other two discussed herewill be difficult to measure directly, but knowledge ofthis effect will help us further understand the dependenceof post-injection efficacy on post-injection duration.
Conclusion
In the present study, we have taken initial steps towardcharacterizing the behavior of close-coupled post injec-tions at a variety of intake-oxygen levels, loads, andinjection timings. Our salient findings are as follows:
� At high intake-oxygen levels (18% and 21%), close-coupled post injections can reduce engine-out sootover a range of post-injection durations and loads.At these conditions, the engine-out soot level ini-tially decreases with increasing post-injection dura-tion and then subsequently increases, all while themain-injection duration is held constant. This initialdecrease in soot clearly indicates an interactionbetween the post injection and the soot remainingfrom the main injection.
� At low intake-oxygen levels (12.6% and 15%),close-coupled post injections can also reduceengine-out soot over a range of post-injection dura-tions and loads as compared to a single injection atthe same load. Here, the engine-out soot initiallystays nearly constant with increasing post-injectionduration and then increases sharply, all while themain-injection duration is held constant. Thisengine-out soot dependency is different from thehigh oxygen-content cases, and the nature of theinteraction between the post jet and the main sootcloud is not clear from the current optical data.
� The characteristic engine-out soot emission trendsdo not change significantly with ‘‘baseline’’ load(main-injection duration) for a given intake-oxygencondition. However, the range of post-injectiondurations over which the post injection is effectiveat reducing engine-out soot is smaller as the load isincreased.
� Several types of interactions between the post jetand the main soot were identified from the opticaldata, mainly fluid mechanic in nature. First, the
post jet displaces the main soot as the post jet entersthe region occupied by the residual main soot cloud.Next, products of the main injection are entrainedinto the post jet as the jet passes through the mainsoot cloud. Finally, in cases where the post jetimpinges on the bowl wall, the post jet rolls up onthe bowl wall and becomes indistinguishable fromthe soot remaining from the main injection. In allthese interactions, the contents of the post jet canmix with those of the main-injection products; thismixing can change the formation and/or oxidationrates of soot in both the main and post injection.
� Finally, we offer a ‘‘conceptual chart’’ that graphi-cally summarizes the post-injection duration andintake oxygen (EGR) influences on engine-out soot.The chart illustrates the regions by color where postinjections reduce engine-out soot at the same loadas single-injection operation and also identifiesregions where the post injection creates no soot ofits own or unambiguously reduces the net soot yieldof the main injection.
Acknowledgements
The optical engine experiments were performed at theCombustion Research Facility, Sandia NationalLaboratories, Livermore, California. The authorsgratefully acknowledge the contributions of KeithPenney and Dave Cicone for their assistance in main-taining the lasers and research engine used in thisstudy. Additional thanks to Daniel Strong for graphicssupport.
Declaration of conflicting interests
The authors declare that there is no conflict of interest.
Funding
Support for this research was provided by the USDepartment of Energy, Office of Vehicle Technologies.Sandia is a multiprogram laboratory operated bySandia Corporation, a Lockheed Martin Company, forthe United State Department of Energy’s NationalNuclear Security Administration under contract DE-AC04-94AL85000.
References
1. United States Environmental Protection Agency. Fact
sheet: diesel exhaust in the United States. EPA420-F-03-
022, June 2003. Washington, DC: United States Environ-mental Protection Agency.
2. Directive 1999/96/EC. Official Journal of the European
Communities, 1999.3. EEC Directive 90/C81/01. Official Journal of the Eur-
opean Communities, 1990.4. European Parliament. Regulation (EC) No 595/2009 of
18 June 2009, 2009.5. DieselNet, 2009.6. United States Federal Register 76(179), 2011.
20 International J of Engine Research 0(0)
at PENNSYLVANIA STATE UNIV on August 26, 2013jer.sagepub.comDownloaded from
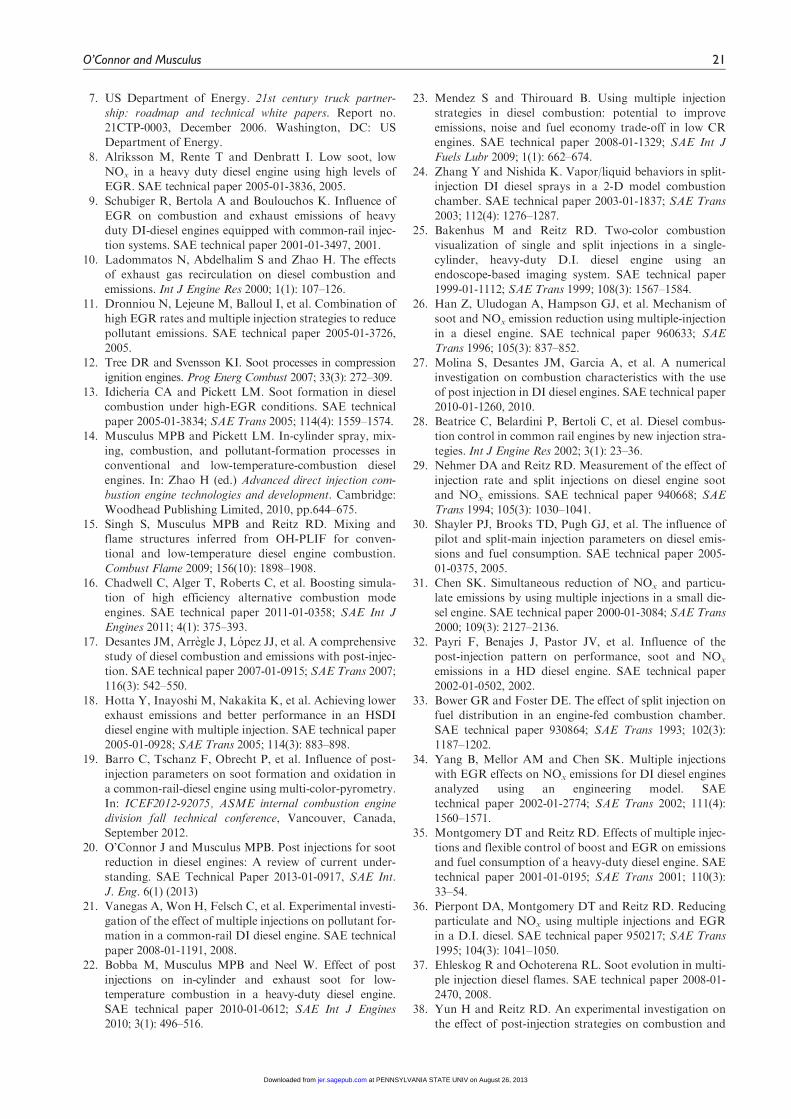
7. US Department of Energy. 21st century truck partner-
ship: roadmap and technical white papers. Report no.
21CTP-0003, December 2006. Washington, DC: US
Department of Energy.8. Alriksson M, Rente T and Denbratt I. Low soot, low
NOx in a heavy duty diesel engine using high levels of
EGR. SAE technical paper 2005-01-3836, 2005.9. Schubiger R, Bertola A and Boulouchos K. Influence of
EGR on combustion and exhaust emissions of heavy
duty DI-diesel engines equipped with common-rail injec-
tion systems. SAE technical paper 2001-01-3497, 2001.10. Ladommatos N, Abdelhalim S and Zhao H. The effects
of exhaust gas recirculation on diesel combustion and
emissions. Int J Engine Res 2000; 1(1): 107–126.11. Dronniou N, Lejeune M, Balloul I, et al. Combination of
high EGR rates and multiple injection strategies to reduce
pollutant emissions. SAE technical paper 2005-01-3726,
2005.12. Tree DR and Svensson KI. Soot processes in compression
ignition engines. Prog Energ Combust 2007; 33(3): 272–309.13. Idicheria CA and Pickett LM. Soot formation in diesel
combustion under high-EGR conditions. SAE technical
paper 2005-01-3834; SAE Trans 2005; 114(4): 1559–1574.14. Musculus MPB and Pickett LM. In-cylinder spray, mix-
ing, combustion, and pollutant-formation processes in
conventional and low-temperature-combustion diesel
engines. In: Zhao H (ed.) Advanced direct injection com-
bustion engine technologies and development. Cambridge:
Woodhead Publishing Limited, 2010, pp.644–675.15. Singh S, Musculus MPB and Reitz RD. Mixing and
flame structures inferred from OH-PLIF for conven-
tional and low-temperature diesel engine combustion.
Combust Flame 2009; 156(10): 1898–1908.16. Chadwell C, Alger T, Roberts C, et al. Boosting simula-
tion of high efficiency alternative combustion mode
engines. SAE technical paper 2011-01-0358; SAE Int J
Engines 2011; 4(1): 375–393.17. Desantes JM, Arregle J, Lopez JJ, et al. A comprehensive
study of diesel combustion and emissions with post-injec-
tion. SAE technical paper 2007-01-0915; SAE Trans 2007;
116(3): 542–550.18. Hotta Y, Inayoshi M, Nakakita K, et al. Achieving lower
exhaust emissions and better performance in an HSDI
diesel engine with multiple injection. SAE technical paper
2005-01-0928; SAE Trans 2005; 114(3): 883–898.19. Barro C, Tschanz F, Obrecht P, et al. Influence of post-
injection parameters on soot formation and oxidation in
a common-rail-diesel engine using multi-color-pyrometry.
In: ICEF2012-92075, ASME internal combustion engine
division fall technical conference, Vancouver, Canada,
September 2012.20. O’Connor J and Musculus MPB. Post injections for soot
reduction in diesel engines: A review of current under-
standing. SAE Technical Paper 2013-01-0917, SAE Int.
J. Eng. 6(1) (2013)21. Vanegas A, Won H, Felsch C, et al. Experimental investi-
gation of the effect of multiple injections on pollutant for-
mation in a common-rail DI diesel engine. SAE technical
paper 2008-01-1191, 2008.22. Bobba M, Musculus MPB and Neel W. Effect of post
injections on in-cylinder and exhaust soot for low-
temperature combustion in a heavy-duty diesel engine.
SAE technical paper 2010-01-0612; SAE Int J Engines
2010; 3(1): 496–516.
23. Mendez S and Thirouard B. Using multiple injection
strategies in diesel combustion: potential to improve
emissions, noise and fuel economy trade-off in low CR
engines. SAE technical paper 2008-01-1329; SAE Int J
Fuels Lubr 2009; 1(1): 662–674.
24. Zhang Y and Nishida K. Vapor/liquid behaviors in split-
injection DI diesel sprays in a 2-D model combustion
chamber. SAE technical paper 2003-01-1837; SAE Trans
2003; 112(4): 1276–1287.25. Bakenhus M and Reitz RD. Two-color combustion
visualization of single and split injections in a single-
cylinder, heavy-duty D.I. diesel engine using an
endoscope-based imaging system. SAE technical paper
1999-01-1112; SAE Trans 1999; 108(3): 1567–1584.26. Han Z, Uludogan A, Hampson GJ, et al. Mechanism of
soot and NOx emission reduction using multiple-injection
in a diesel engine. SAE technical paper 960633; SAE
Trans 1996; 105(3): 837–852.27. Molina S, Desantes JM, Garcia A, et al. A numerical
investigation on combustion characteristics with the use
of post injection in DI diesel engines. SAE technical paper
2010-01-1260, 2010.28. Beatrice C, Belardini P, Bertoli C, et al. Diesel combus-
tion control in common rail engines by new injection stra-
tegies. Int J Engine Res 2002; 3(1): 23–36.29. Nehmer DA and Reitz RD. Measurement of the effect of
injection rate and split injections on diesel engine soot
and NOx emissions. SAE technical paper 940668; SAE
Trans 1994; 105(3): 1030–1041.30. Shayler PJ, Brooks TD, Pugh GJ, et al. The influence of
pilot and split-main injection parameters on diesel emis-
sions and fuel consumption. SAE technical paper 2005-
01-0375, 2005.31. Chen SK. Simultaneous reduction of NOx and particu-
late emissions by using multiple injections in a small die-
sel engine. SAE technical paper 2000-01-3084; SAE Trans
2000; 109(3): 2127–2136.32. Payri F, Benajes J, Pastor JV, et al. Influence of the
post-injection pattern on performance, soot and NOx
emissions in a HD diesel engine. SAE technical paper
2002-01-0502, 2002.33. Bower GR and Foster DE. The effect of split injection on
fuel distribution in an engine-fed combustion chamber.
SAE technical paper 930864; SAE Trans 1993; 102(3):
1187–1202.34. Yang B, Mellor AM and Chen SK. Multiple injections
with EGR effects on NOx emissions for DI diesel engines
analyzed using an engineering model. SAE
technical paper 2002-01-2774; SAE Trans 2002; 111(4):
1560–1571.35. Montgomery DT and Reitz RD. Effects of multiple injec-
tions and flexible control of boost and EGR on emissions
and fuel consumption of a heavy-duty diesel engine. SAE
technical paper 2001-01-0195; SAE Trans 2001; 110(3):
33–54.36. Pierpont DA, Montgomery DT and Reitz RD. Reducing
particulate and NOx using multiple injections and EGR
in a D.I. diesel. SAE technical paper 950217; SAE Trans
1995; 104(3): 1041–1050.37. Ehleskog R and Ochoterena RL. Soot evolution in multi-
ple injection diesel flames. SAE technical paper 2008-01-
2470, 2008.38. Yun H and Reitz RD. An experimental investigation on
the effect of post-injection strategies on combustion and
O’Connor and Musculus 21
at PENNSYLVANIA STATE UNIV on August 26, 2013jer.sagepub.comDownloaded from
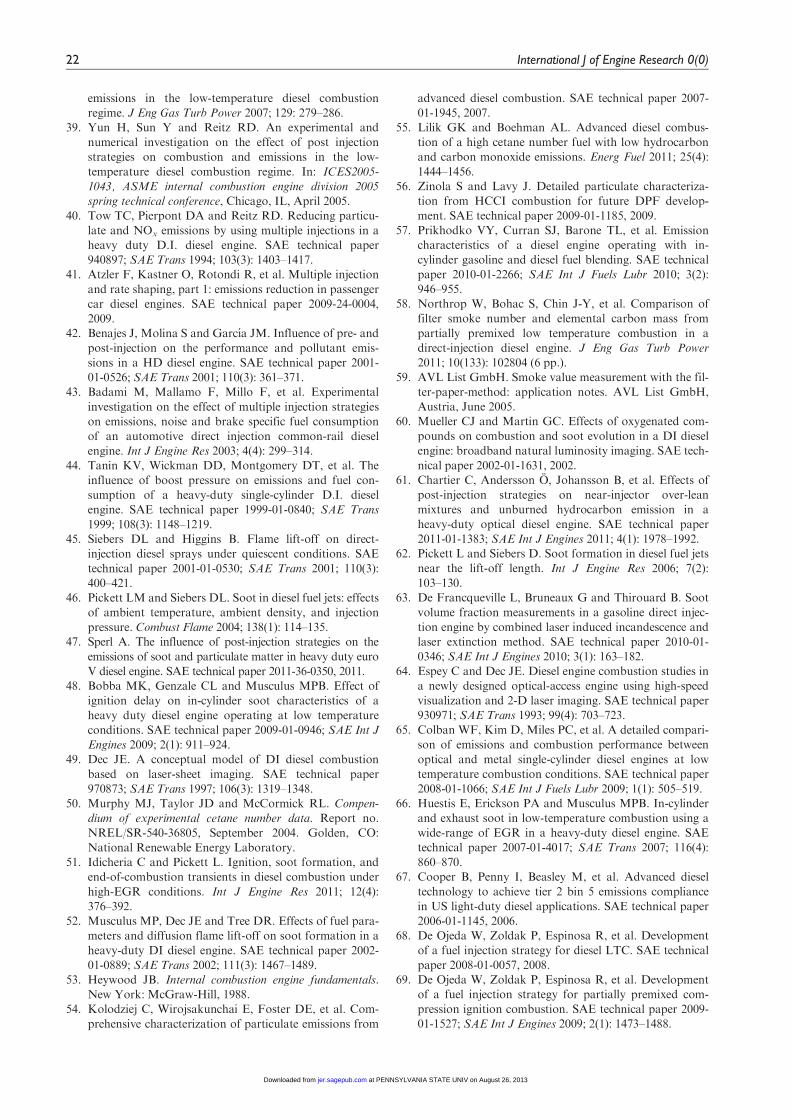
emissions in the low-temperature diesel combustion
regime. J Eng Gas Turb Power 2007; 129: 279–286.39. Yun H, Sun Y and Reitz RD. An experimental and
numerical investigation on the effect of post injection
strategies on combustion and emissions in the low-
temperature diesel combustion regime. In: ICES2005-
1043, ASME internal combustion engine division 2005
spring technical conference, Chicago, IL, April 2005.40. Tow TC, Pierpont DA and Reitz RD. Reducing particu-
late and NOx emissions by using multiple injections in a
heavy duty D.I. diesel engine. SAE technical paper
940897; SAE Trans 1994; 103(3): 1403–1417.41. Atzler F, Kastner O, Rotondi R, et al. Multiple injection
and rate shaping, part 1: emissions reduction in passenger
car diesel engines. SAE technical paper 2009-24-0004,
2009.42. Benajes J, Molina S and Garcıa JM. Influence of pre- and
post-injection on the performance and pollutant emis-
sions in a HD diesel engine. SAE technical paper 2001-
01-0526; SAE Trans 2001; 110(3): 361–371.43. Badami M, Mallamo F, Millo F, et al. Experimental
investigation on the effect of multiple injection strategies
on emissions, noise and brake specific fuel consumption
of an automotive direct injection common-rail diesel
engine. Int J Engine Res 2003; 4(4): 299–314.44. Tanin KV, Wickman DD, Montgomery DT, et al. The
influence of boost pressure on emissions and fuel con-
sumption of a heavy-duty single-cylinder D.I. diesel
engine. SAE technical paper 1999-01-0840; SAE Trans
1999; 108(3): 1148–1219.45. Siebers DL and Higgins B. Flame lift-off on direct-
injection diesel sprays under quiescent conditions. SAE
technical paper 2001-01-0530; SAE Trans 2001; 110(3):
400–421.46. Pickett LM and Siebers DL. Soot in diesel fuel jets: effects
of ambient temperature, ambient density, and injection
pressure. Combust Flame 2004; 138(1): 114–135.47. Sperl A. The influence of post-injection strategies on the
emissions of soot and particulate matter in heavy duty euro
V diesel engine. SAE technical paper 2011-36-0350, 2011.48. Bobba MK, Genzale CL and Musculus MPB. Effect of
ignition delay on in-cylinder soot characteristics of a
heavy duty diesel engine operating at low temperature
conditions. SAE technical paper 2009-01-0946; SAE Int J
Engines 2009; 2(1): 911–924.49. Dec JE. A conceptual model of DI diesel combustion
based on laser-sheet imaging. SAE technical paper
970873; SAE Trans 1997; 106(3): 1319–1348.50. Murphy MJ, Taylor JD and McCormick RL. Compen-
dium of experimental cetane number data. Report no.
NREL/SR-540-36805, September 2004. Golden, CO:
National Renewable Energy Laboratory.51. Idicheria C and Pickett L. Ignition, soot formation, and
end-of-combustion transients in diesel combustion under
high-EGR conditions. Int J Engine Res 2011; 12(4):
376–392.52. Musculus MP, Dec JE and Tree DR. Effects of fuel para-
meters and diffusion flame lift-off on soot formation in a
heavy-duty DI diesel engine. SAE technical paper 2002-
01-0889; SAE Trans 2002; 111(3): 1467–1489.53. Heywood JB. Internal combustion engine fundamentals.
New York: McGraw-Hill, 1988.54. Kolodziej C, Wirojsakunchai E, Foster DE, et al. Com-
prehensive characterization of particulate emissions from
advanced diesel combustion. SAE technical paper 2007-
01-1945, 2007.55. Lilik GK and Boehman AL. Advanced diesel combus-
tion of a high cetane number fuel with low hydrocarbon
and carbon monoxide emissions. Energ Fuel 2011; 25(4):
1444–1456.56. Zinola S and Lavy J. Detailed particulate characteriza-
tion from HCCI combustion for future DPF develop-
ment. SAE technical paper 2009-01-1185, 2009.57. Prikhodko VY, Curran SJ, Barone TL, et al. Emission
characteristics of a diesel engine operating with in-
cylinder gasoline and diesel fuel blending. SAE technical
paper 2010-01-2266; SAE Int J Fuels Lubr 2010; 3(2):
946–955.58. Northrop W, Bohac S, Chin J-Y, et al. Comparison of
filter smoke number and elemental carbon mass from
partially premixed low temperature combustion in a
direct-injection diesel engine. J Eng Gas Turb Power
2011; 10(133): 102804 (6 pp.).59. AVL List GmbH. Smoke value measurement with the fil-
ter-paper-method: application notes. AVL List GmbH,
Austria, June 2005.60. Mueller CJ and Martin GC. Effects of oxygenated com-
pounds on combustion and soot evolution in a DI diesel
engine: broadband natural luminosity imaging. SAE tech-
nical paper 2002-01-1631, 2002.61. Chartier C, Andersson O, Johansson B, et al. Effects of
post-injection strategies on near-injector over-lean
mixtures and unburned hydrocarbon emission in a
heavy-duty optical diesel engine. SAE technical paper
2011-01-1383; SAE Int J Engines 2011; 4(1): 1978–1992.62. Pickett L and Siebers D. Soot formation in diesel fuel jets
near the lift-off length. Int J Engine Res 2006; 7(2):
103–130.63. De Francqueville L, Bruneaux G and Thirouard B. Soot
volume fraction measurements in a gasoline direct injec-
tion engine by combined laser induced incandescence and
laser extinction method. SAE technical paper 2010-01-
0346; SAE Int J Engines 2010; 3(1): 163–182.64. Espey C and Dec JE. Diesel engine combustion studies in
a newly designed optical-access engine using high-speed
visualization and 2-D laser imaging. SAE technical paper
930971; SAE Trans 1993; 99(4): 703–723.65. Colban WF, Kim D, Miles PC, et al. A detailed compari-
son of emissions and combustion performance between
optical and metal single-cylinder diesel engines at low
temperature combustion conditions. SAE technical paper
2008-01-1066; SAE Int J Fuels Lubr 2009; 1(1): 505–519.66. Huestis E, Erickson PA and Musculus MPB. In-cylinder
and exhaust soot in low-temperature combustion using a
wide-range of EGR in a heavy-duty diesel engine. SAE
technical paper 2007-01-4017; SAE Trans 2007; 116(4):
860–870.67. Cooper B, Penny I, Beasley M, et al. Advanced diesel
technology to achieve tier 2 bin 5 emissions compliance
in US light-duty diesel applications. SAE technical paper
2006-01-1145, 2006.68. De Ojeda W, Zoldak P, Espinosa R, et al. Development
of a fuel injection strategy for diesel LTC. SAE technical
paper 2008-01-0057, 2008.69. De Ojeda W, Zoldak P, Espinosa R, et al. Development
of a fuel injection strategy for partially premixed com-
pression ignition combustion. SAE technical paper 2009-
01-1527; SAE Int J Engines 2009; 2(1): 1473–1488.
22 International J of Engine Research 0(0)
at PENNSYLVANIA STATE UNIV on August 26, 2013jer.sagepub.comDownloaded from
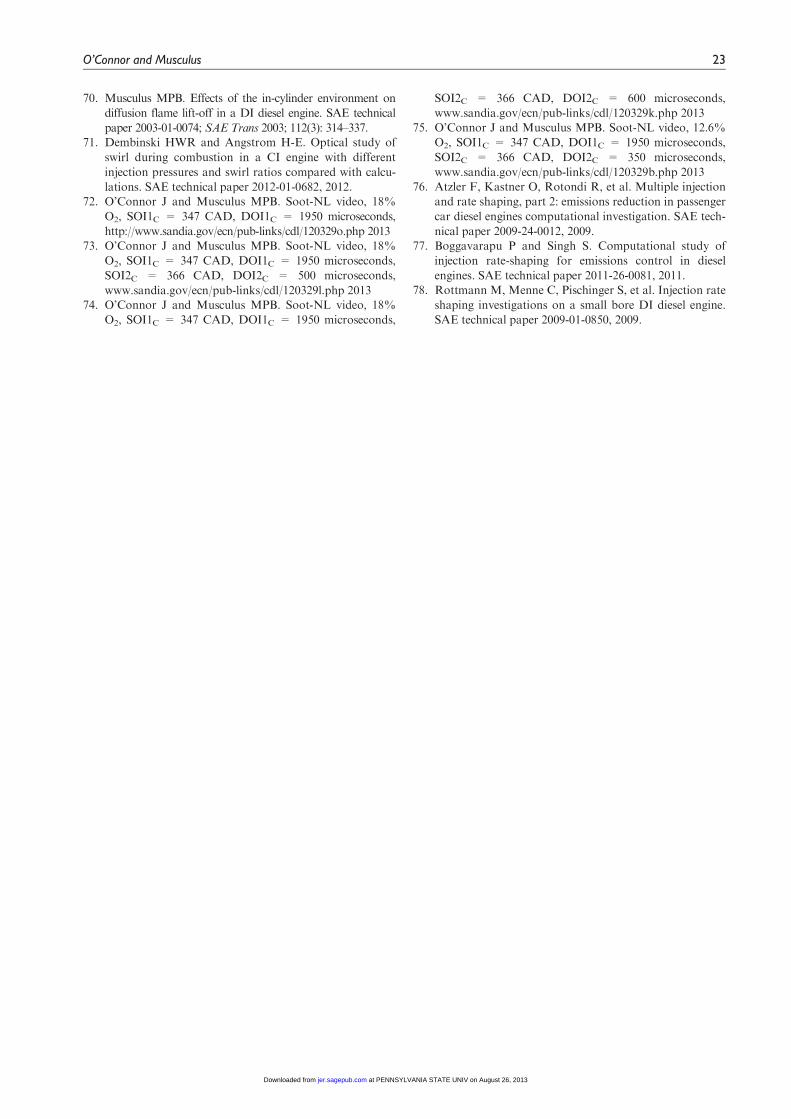
70. Musculus MPB. Effects of the in-cylinder environment on
diffusion flame lift-off in a DI diesel engine. SAE technical
paper 2003-01-0074; SAE Trans 2003; 112(3): 314–337.71. Dembinski HWR and Angstrom H-E. Optical study of
swirl during combustion in a CI engine with different
injection pressures and swirl ratios compared with calcu-
lations. SAE technical paper 2012-01-0682, 2012.72. O’Connor J and Musculus MPB. Soot-NL video, 18%
O2, SOI1C = 347 CAD, DOI1C = 1950 microseconds,
http://www.sandia.gov/ecn/pub-links/cdl/120329o.php 201373. O’Connor J and Musculus MPB. Soot-NL video, 18%
O2, SOI1C = 347 CAD, DOI1C = 1950 microseconds,
SOI2C = 366 CAD, DOI2C = 500 microseconds,
www.sandia.gov/ecn/pub-links/cdl/120329l.php 201374. O’Connor J and Musculus MPB. Soot-NL video, 18%
O2, SOI1C = 347 CAD, DOI1C = 1950 microseconds,
SOI2C = 366 CAD, DOI2C = 600 microseconds,
www.sandia.gov/ecn/pub-links/cdl/120329k.php 201375. O’Connor J and Musculus MPB. Soot-NL video, 12.6%
O2, SOI1C = 347 CAD, DOI1C = 1950 microseconds,
SOI2C = 366 CAD, DOI2C = 350 microseconds,
www.sandia.gov/ecn/pub-links/cdl/120329b.php 201376. Atzler F, Kastner O, Rotondi R, et al. Multiple injection
and rate shaping, part 2: emissions reduction in passenger
car diesel engines computational investigation. SAE tech-
nical paper 2009-24-0012, 2009.77. Boggavarapu P and Singh S. Computational study of
injection rate-shaping for emissions control in diesel
engines. SAE technical paper 2011-26-0081, 2011.78. Rottmann M, Menne C, Pischinger S, et al. Injection rate
shaping investigations on a small bore DI diesel engine.
SAE technical paper 2009-01-0850, 2009.
O’Connor and Musculus 23
at PENNSYLVANIA STATE UNIV on August 26, 2013jer.sagepub.comDownloaded from


![Compact ink recirculation system CC1 - Toshiba Tec Top Page...Compact ink recirculation system Example: Mounting of ink recirculation system [CC1] with ink recirculation head Up to](https://img.pdfslide.net/doc/110x75/5f0f72527e708231d4443441/compact-ink-recirculation-system-cc1-toshiba-tec-top-page-compact-ink-recirculation.jpg)