Embed Size (px)
DESCRIPTION
Point and Figure Charts. Jeremy du Plessis CMT, FSTA Head of Technical Analysis, Updata plc www.updata.co.uk. Why you should be using them. European Conference 2007 London, 7 th February. Reasons to use P&F Charts. ‘Voice of the Market’ Only move when market moves Unambiguous signals - PowerPoint PPT Presentation
Citation preview
Jeremy du Plessis CMT, FSTAJeremy du Plessis CMT, FSTAHead of Technical Analysis, Updata plcHead of Technical Analysis, Updata plc www.updata.co.ukwww.updata.co.uk
Point and Figure Point and Figure ChartsCharts
Why you should be using themWhy you should be using them
European Conference 2007European Conference 2007
London, 7London, 7thth February February
Reasons to use P&F ChartsReasons to use P&F Charts Reasons to use P&F ChartsReasons to use P&F Charts
• ‘‘Voice of the Market’Voice of the Market’– Only move when market movesOnly move when market moves
• Unambiguous signals Unambiguous signals
• Objective trend definitionObjective trend definition
• Multiple time horizons from same dataMultiple time horizons from same data
• Objective price targets & risk-reward ratiosObjective price targets & risk-reward ratios
• Better for Relative Strength analysisBetter for Relative Strength analysis
• Ideal for scanning of stock universesIdeal for scanning of stock universes
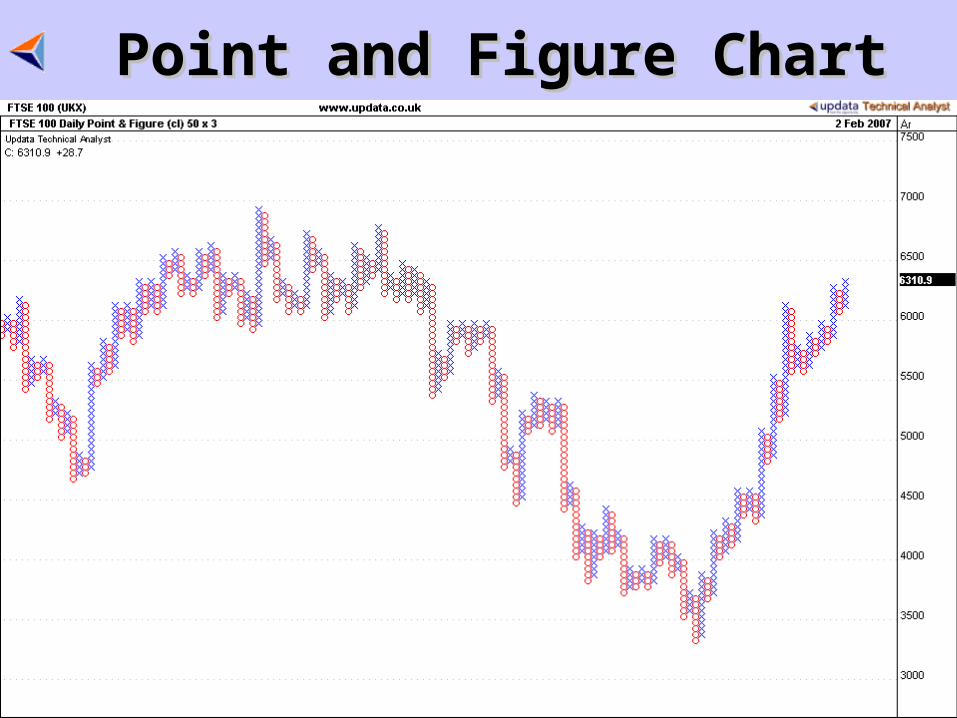
Point and Figure ChartPoint and Figure Chart
What is a Point & Figure chart? What is a Point & Figure chart?
• Typically (not always) constructed with Xs and Os Typically (not always) constructed with Xs and Os – Xs represent up movementsXs represent up movements– Os represent down movementsOs represent down movements
• Price is scaled on the vertical Y-axisPrice is scaled on the vertical Y-axis• No time scaleNo time scale along the horizontal X-axis along the horizontal X-axis
– Time not part of construction or analysisTime not part of construction or analysis
• X and O represents a price interval - Box SizeX and O represents a price interval - Box Size– Price changes below the box size are ignoredPrice changes below the box size are ignored
• Column changes determined by Reversal Size Column changes determined by Reversal Size
Where did they come from?Where did they come from?
Started off as a price recording mechanismStarted off as a price recording mechanism
and became a charting methodand became a charting method
How?How?
Started off as a price recording mechanismStarted off as a price recording mechanism
and became a charting methodand became a charting method
How?How?
Where did they come from?Where did they come from?
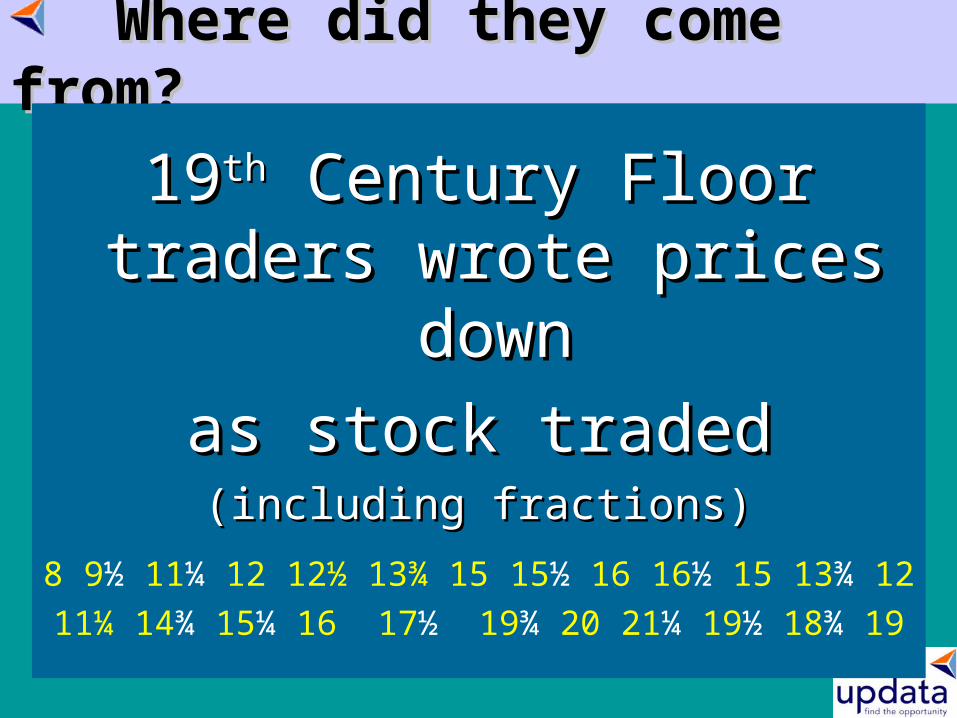
1919thth Century Floor traders Century Floor traders wrote prices downwrote prices down
as stock tradedas stock traded(including fractions)(including fractions)
8 9½ 11¼ 12 12½ 13¾ 15 15½ 16 16½ 15 13¾ 12
11¼ 14¾ 15¼ 16 17½ 19¾ 20 21¼ 19½ 18¾ 19
Where did they come from?Where did they come from?
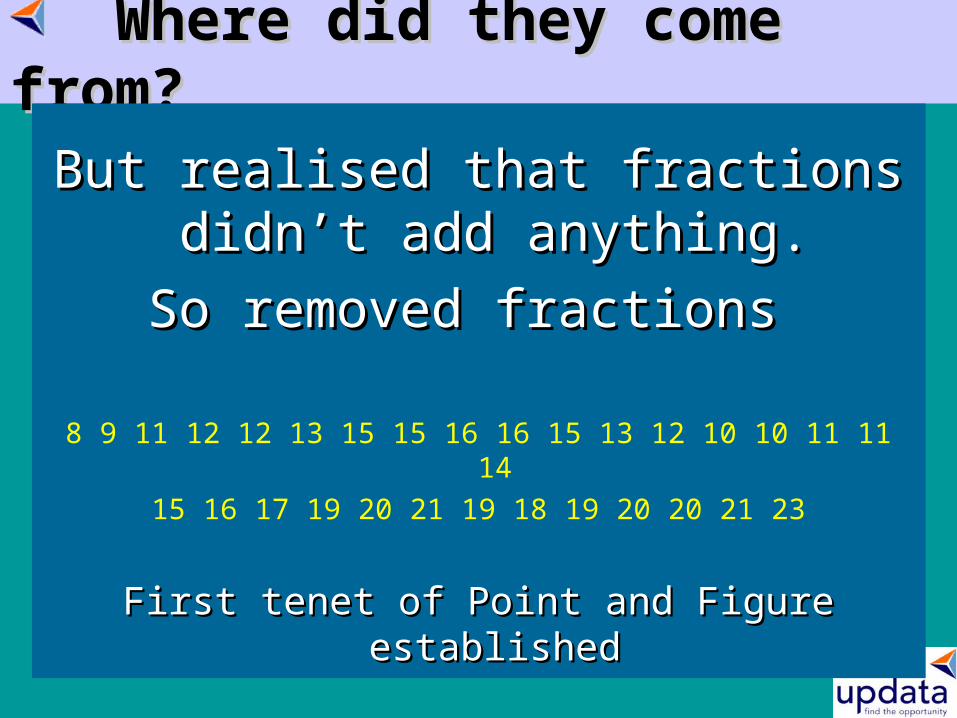
But realised that fractions didn’t But realised that fractions didn’t add anything.add anything.
So removed fractions So removed fractions
8 9 11 12 12 13 15 15 16 16 15 13 12 10 10 11 11 1415 16 17 19 20 21 19 18 19 20 20 21 23
First tenet of Point and Figure establishedFirst tenet of Point and Figure established
Where did they come from?Where did they come from?
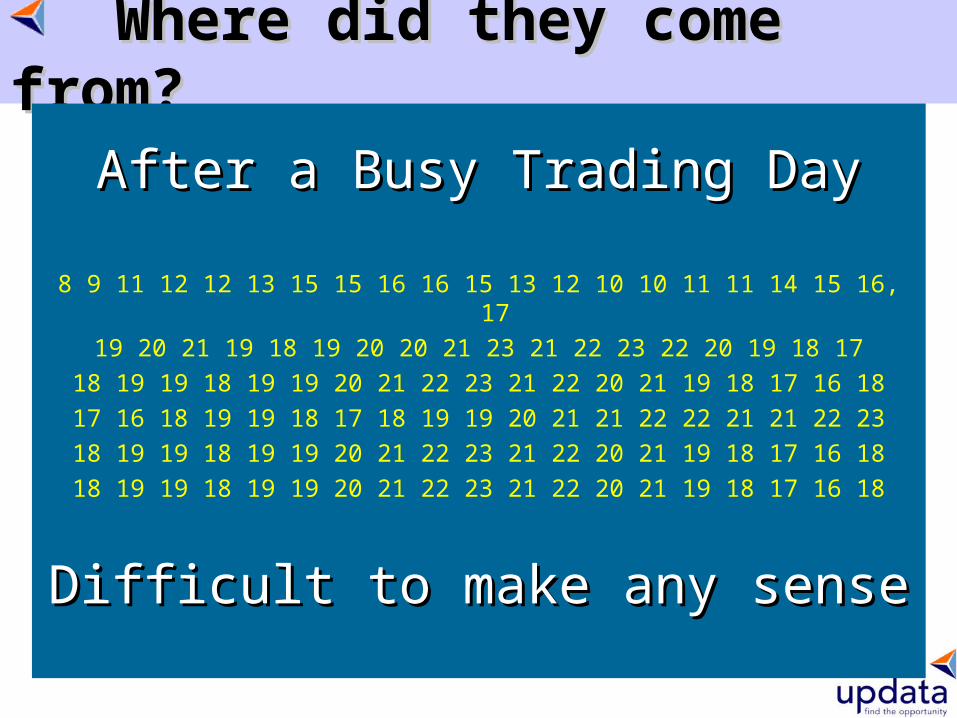
After a Busy Trading DayAfter a Busy Trading Day
8 9 11 12 12 13 15 15 16 16 15 13 12 10 10 11 11 14 15 16, 1719 20 21 19 18 19 20 20 21 23 21 22 23 22 20 19 18 17
18 19 19 18 19 19 20 21 22 23 21 22 20 21 19 18 17 16 1817 16 18 19 19 18 17 18 19 19 20 21 21 22 22 21 21 22 2318 19 19 18 19 19 20 21 22 23 21 22 20 21 19 18 17 16 1818 19 19 18 19 19 20 21 22 23 21 22 20 21 19 18 17 16 18
Difficult to make any senseDifficult to make any sense
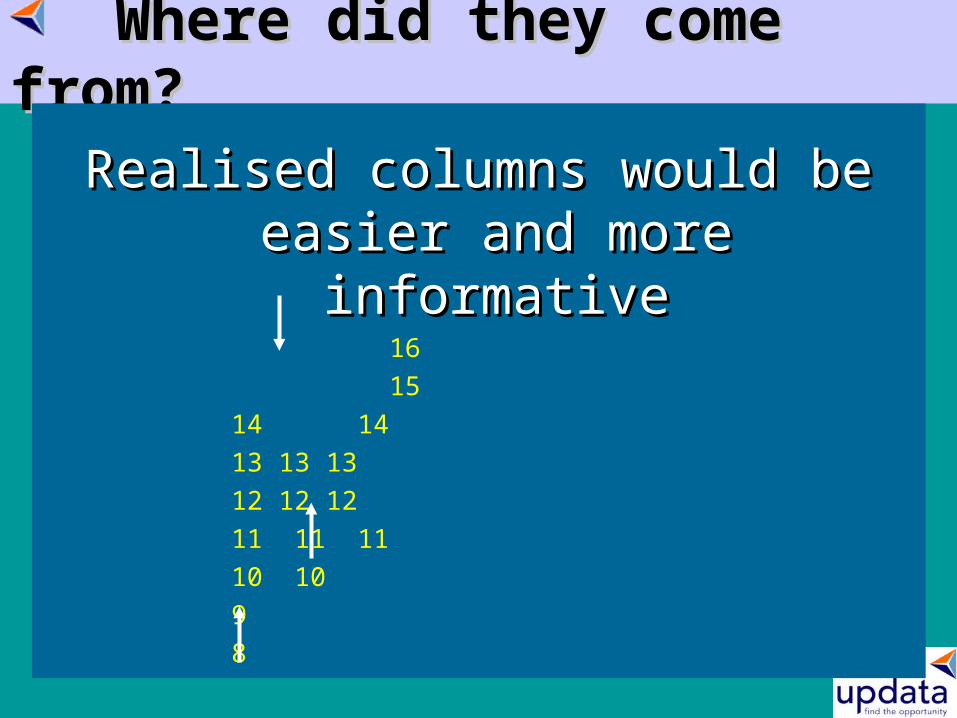
Where did they come from?Where did they come from?
Realised columns would be easier Realised columns would be easier and more informativeand more informative
16 1514 1413 13 1312 12 1211 11 1110 1098
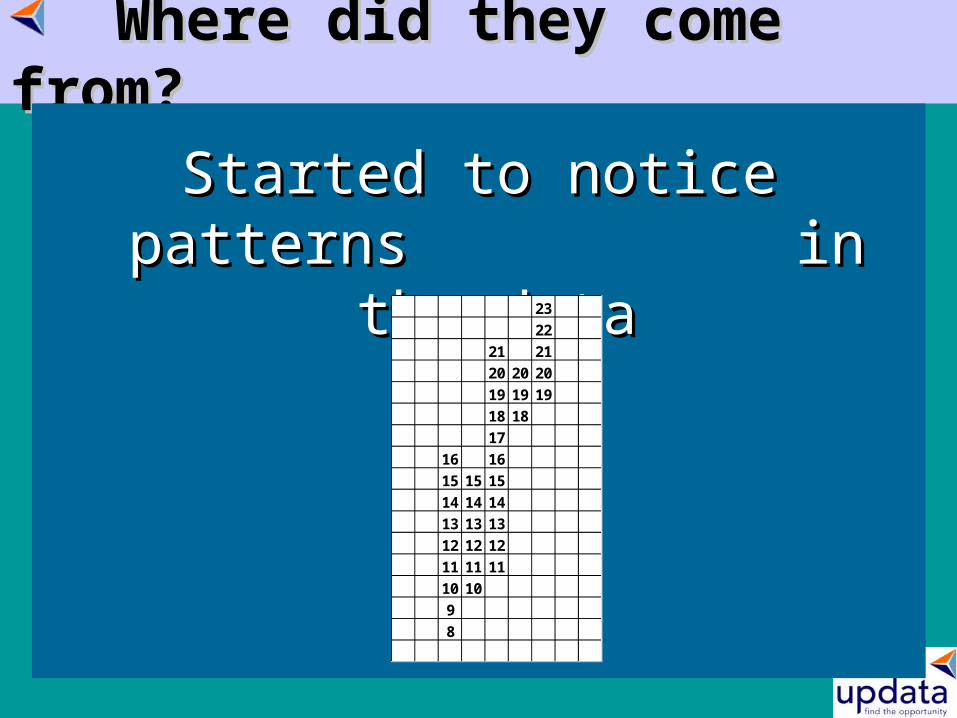
Where did they come from?Where did they come from?
Started to notice patterns Started to notice patterns in the datain the data
23
22
21 21
20 20 20
19 19 19
18 18
17
16 16
15 15 15
14 14 14
13 13 13
12 12 12
11 11 11
10 10
9
8
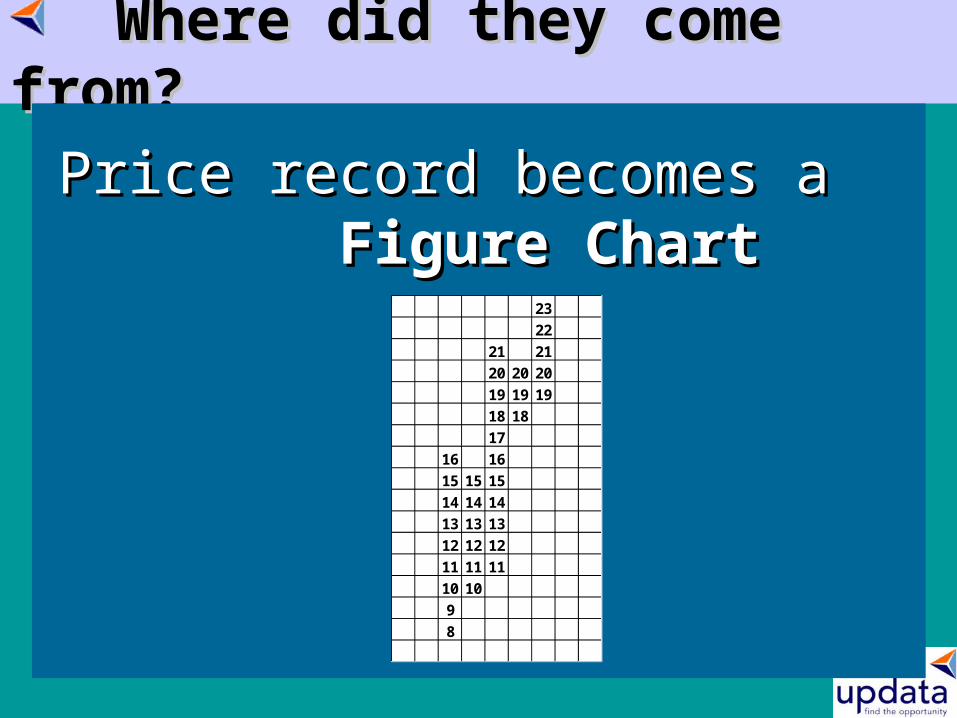
Where did they come from?Where did they come from?
Price record becomes a Price record becomes a Figure ChartFigure Chart
23
22
21 21
20 20 20
19 19 19
18 18
17
16 16
15 15 15
14 14 14
13 13 13
12 12 12
11 11 11
10 10
9
8
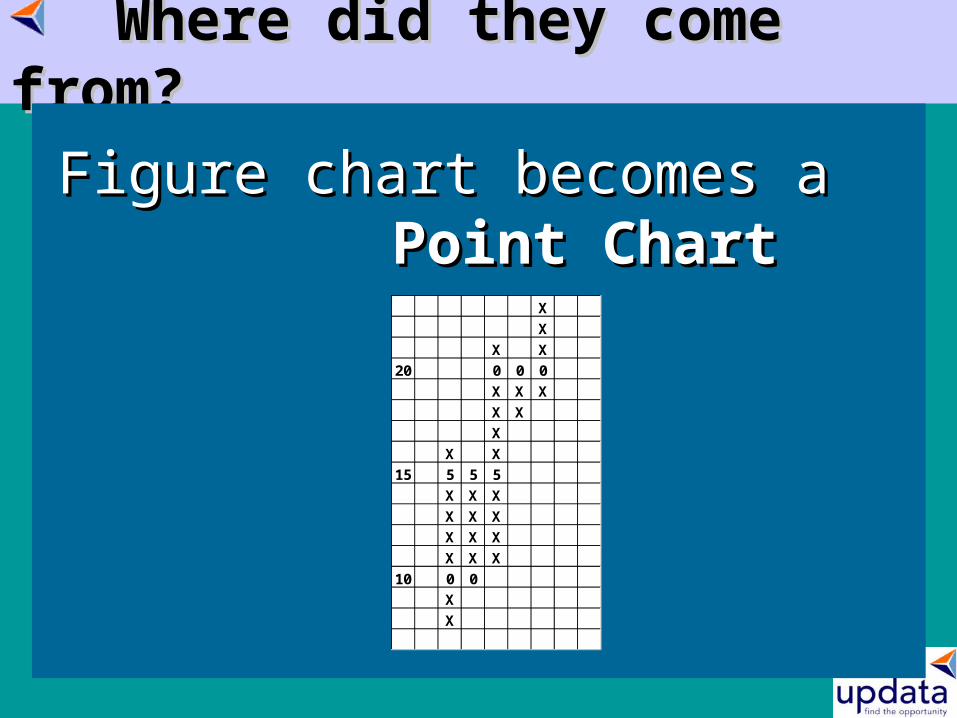
Where did they come from?Where did they come from?
Figure chart becomes a Figure chart becomes a Point ChartPoint Chart
X
X
X X
20 0 0 0
X X X
X X
X
X X
15 5 5 5
X X X
X X X
X X X
X X X
10 0 0
X
X
Where did they come from?Where did they come from?
Traders referred to theirTraders referred to theirpoint chartspoint charts and their and their figure chartsfigure charts
as their….as their….
Point and Figure charts!Point and Figure charts!
And so Point and Figure was bornAnd so Point and Figure was born
Where did they come from?Where did they come from?
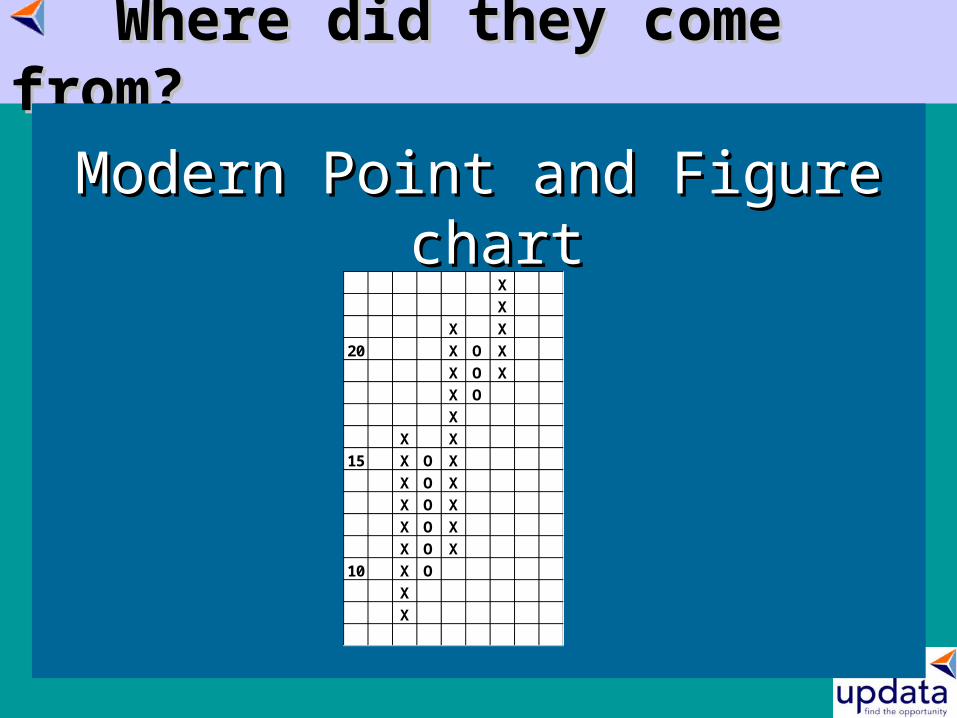
Modern Point and Figure chartModern Point and Figure chart
X
X
X X
20 X O X
X O X
X O
X
X X
15 X O X
X O X
X O X
X O X
X O X
10 X O
X
X
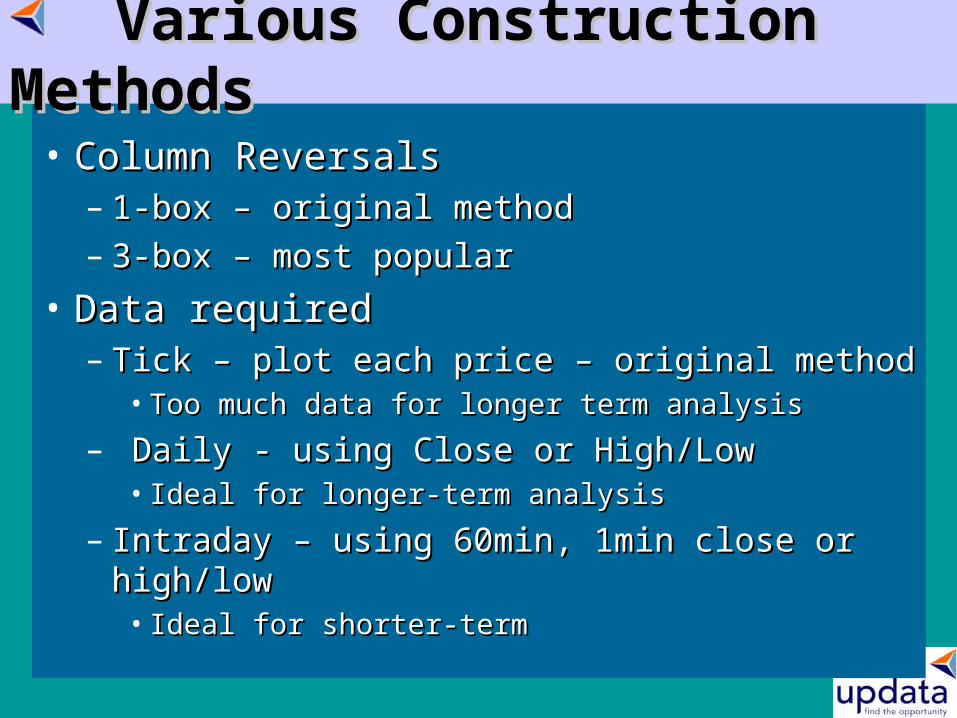
• Column ReversalsColumn Reversals– 1-box – original method1-box – original method– 3-box – most popular3-box – most popular
• Data requiredData required– Tick – plot each price – original methodTick – plot each price – original method
• Too much data for longer term analysis Too much data for longer term analysis
– Daily - using Close or High/LowDaily - using Close or High/Low• Ideal for longer-term analysis Ideal for longer-term analysis
– Intraday – using 60min, 1min close or high/lowIntraday – using 60min, 1min close or high/low• Ideal for shorter-termIdeal for shorter-term
Various Construction MethodsVarious Construction Methods
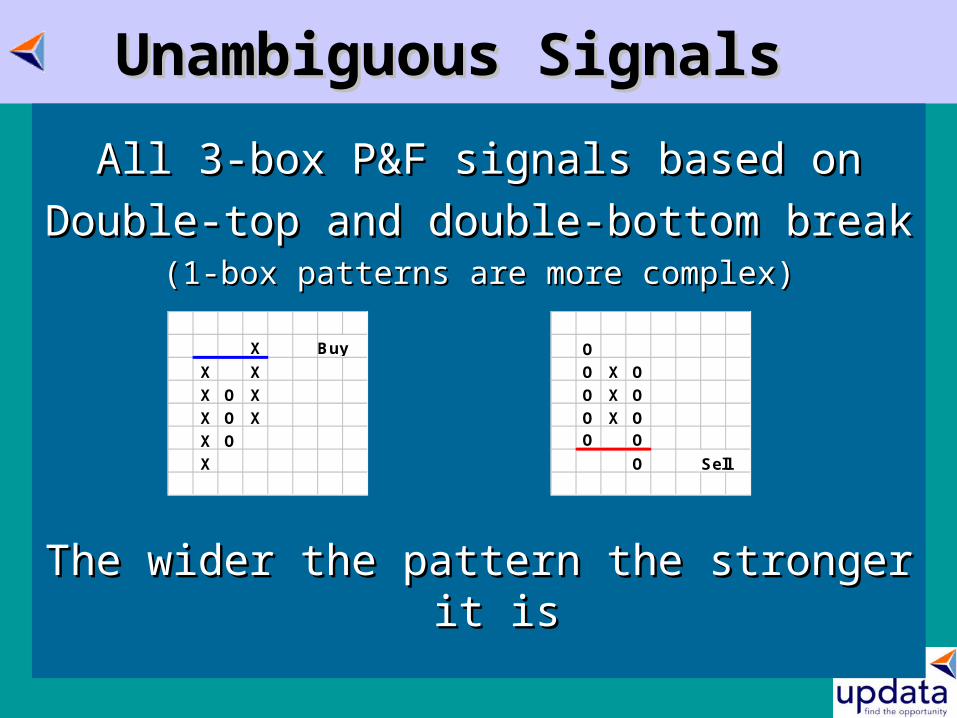
Unambiguous SignalsUnambiguous Signals
All 3-box P&F signals based onAll 3-box P&F signals based on
Double-top and double-bottom breakDouble-top and double-bottom break(1-box patterns are more complex)(1-box patterns are more complex)
The wider the pattern the stronger it isThe wider the pattern the stronger it is
X Buy
X X
X O X
X O X
X O
X
O
O X O
O X O
O X OO O
O Sell
Unambiguous SignalsUnambiguous Signals
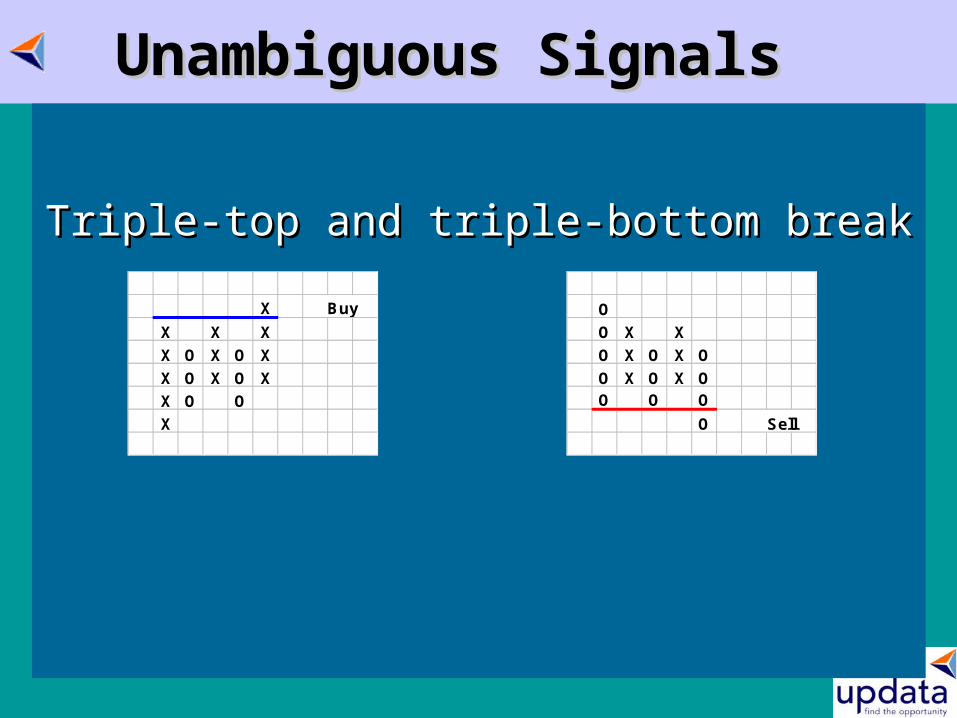
Triple-top and triple-bottom breakTriple-top and triple-bottom break
O
O X X
O X O X O
O X O X OO O O
O Sell
X Buy
X X X
X O X O X
X O X O X
X O O
X
Unambiguous SignalsUnambiguous Signals
• Signals are unambiguous….Signals are unambiguous….– BUT not every signal should be takenBUT not every signal should be taken
• Signals put you in the right frame of mind Signals put you in the right frame of mind
• Point and Figure analystsPoint and Figure analysts– Look left for Support or ResistanceLook left for Support or Resistance– Look left to see if it is part of a bigger patternLook left to see if it is part of a bigger pattern– Look for common Point and Figure patternsLook for common Point and Figure patterns
• Use the Trend lines to confirm or reject Use the Trend lines to confirm or reject signalssignals
Point and Figure Trend linesPoint and Figure Trend lines
Trend lines vital for Point and Figure analysisTrend lines vital for Point and Figure analysis
Two ways to draw Trendlines:Two ways to draw Trendlines:
• SubjectiveSubjective• Lines can placed subjectively to show trendLines can placed subjectively to show trend
• Objective Objective – advantage of Point and Figure charts– advantage of Point and Figure charts • Lines drawn at 45° from tops and bottomsLines drawn at 45° from tops and bottoms
– 45° = one box up/down, one column across45° = one box up/down, one column across– Defines bull and bear trendsDefines bull and bear trends
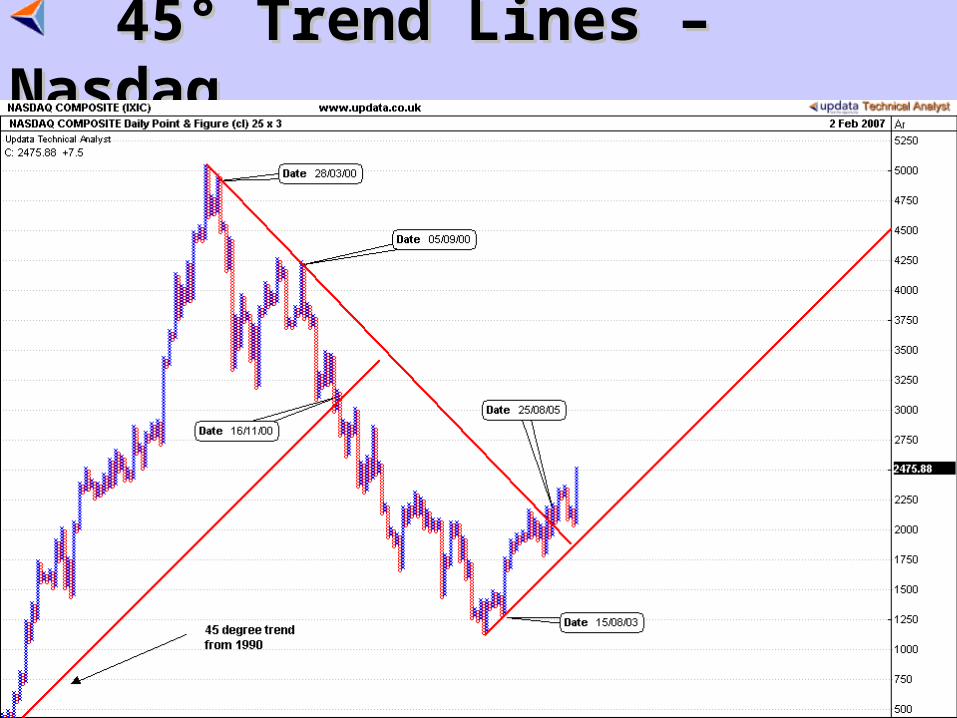
45° Trend Lines – Nasdaq45° Trend Lines – Nasdaq
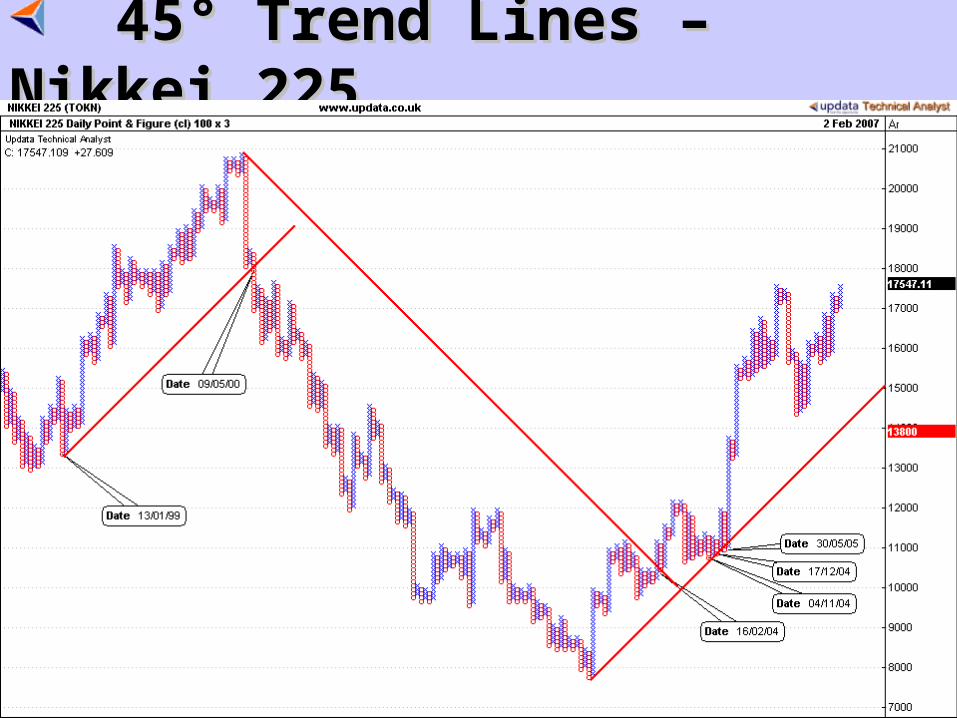
45° Trend Lines – Nikkei 22545° Trend Lines – Nikkei 225
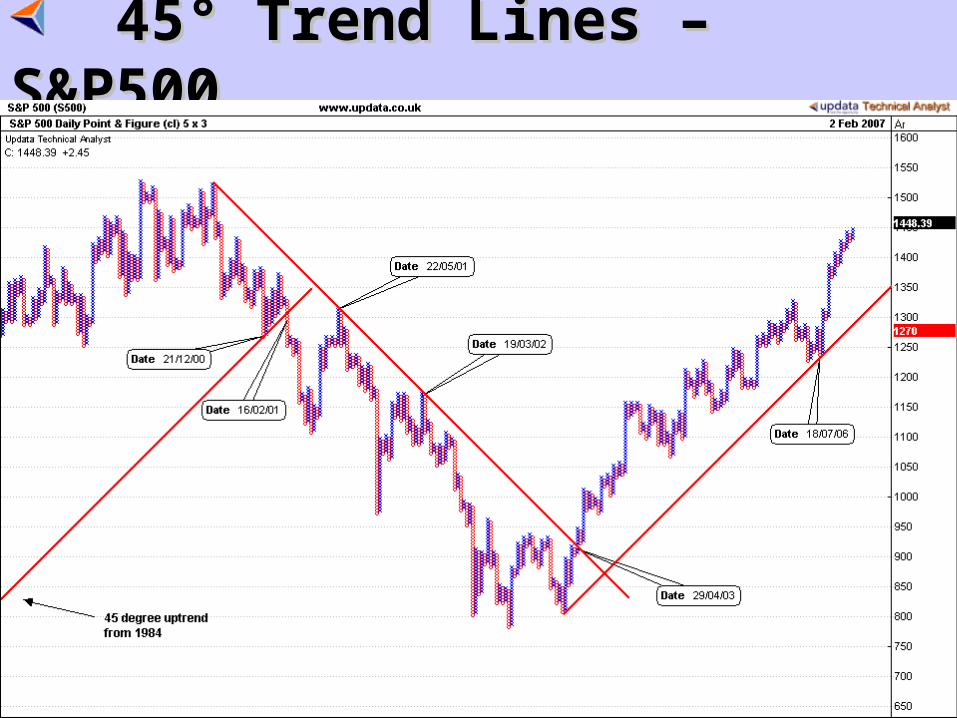
45° Trend Lines – S&P50045° Trend Lines – S&P500

45° Trend Lines – FTSE 10045° Trend Lines – FTSE 100
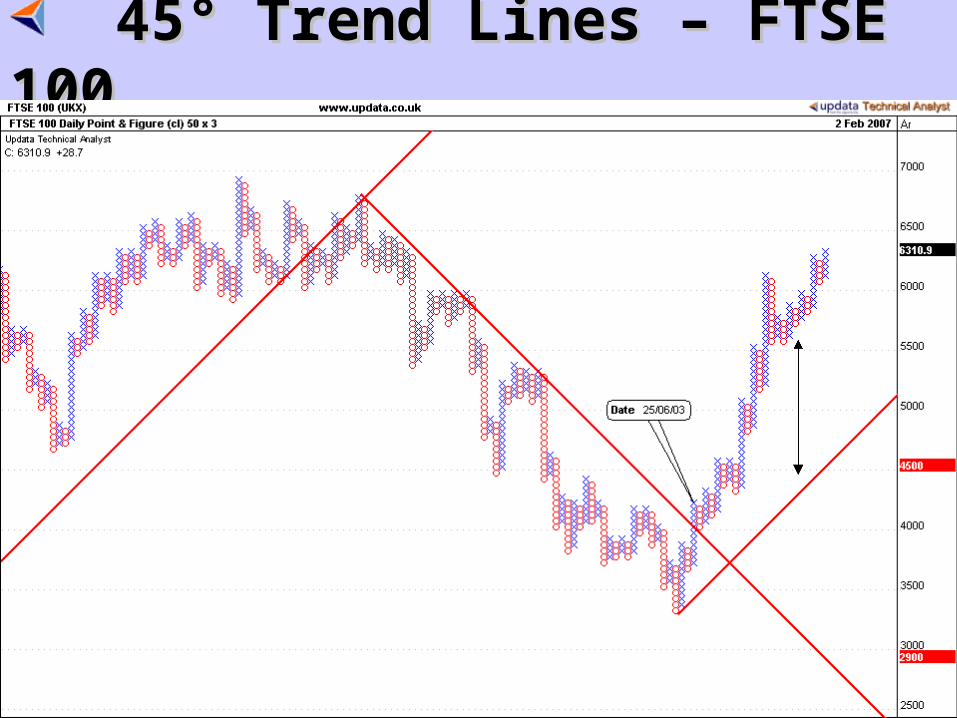
45° Trend Lines – FTSE 10045° Trend Lines – FTSE 100
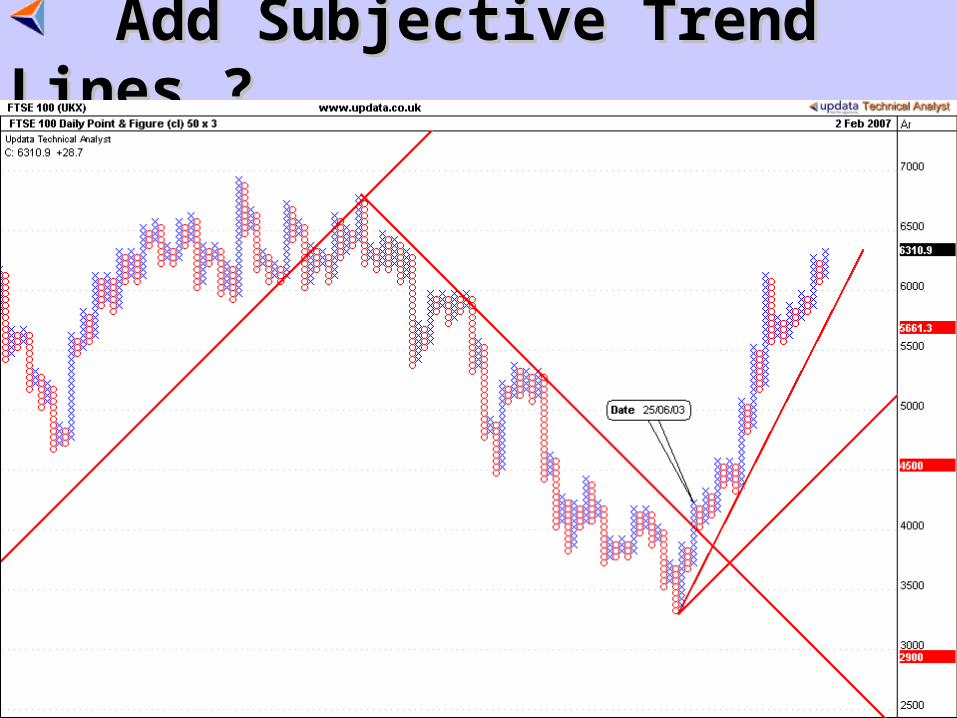
Add Subjective Trend Lines ?Add Subjective Trend Lines ?
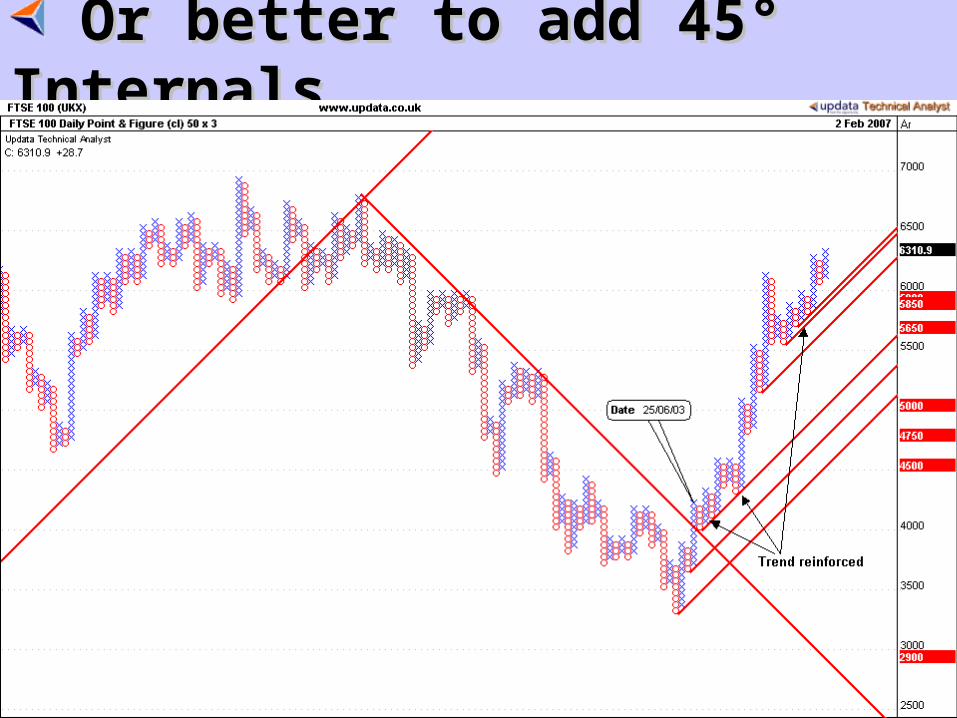
Or better to add 45° InternalsOr better to add 45° Internals
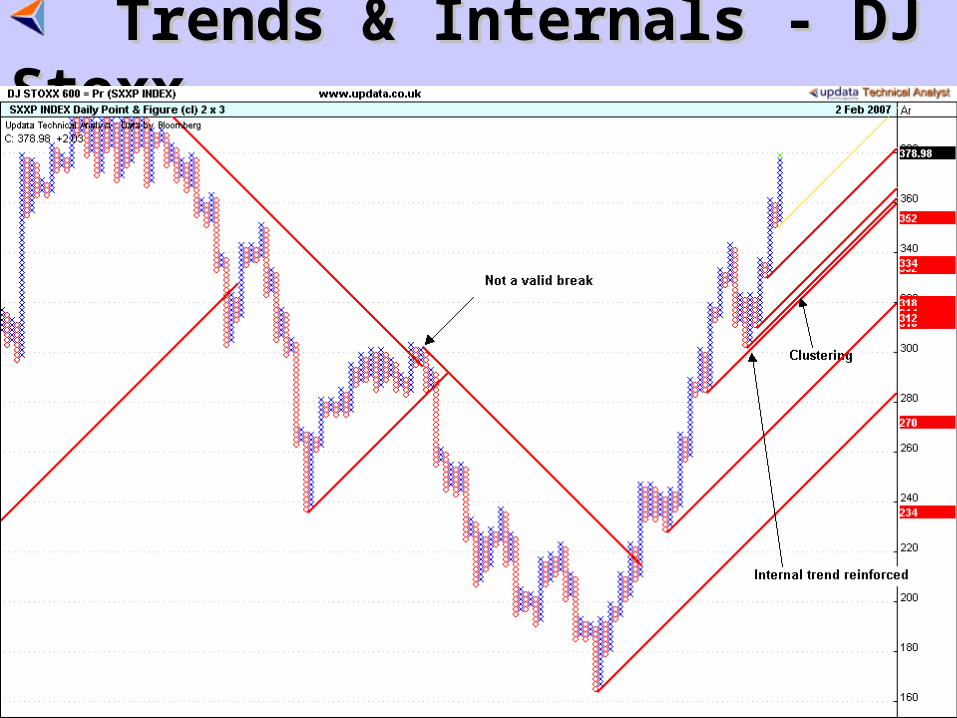
Trends & Internals - DJ StoxxTrends & Internals - DJ Stoxx
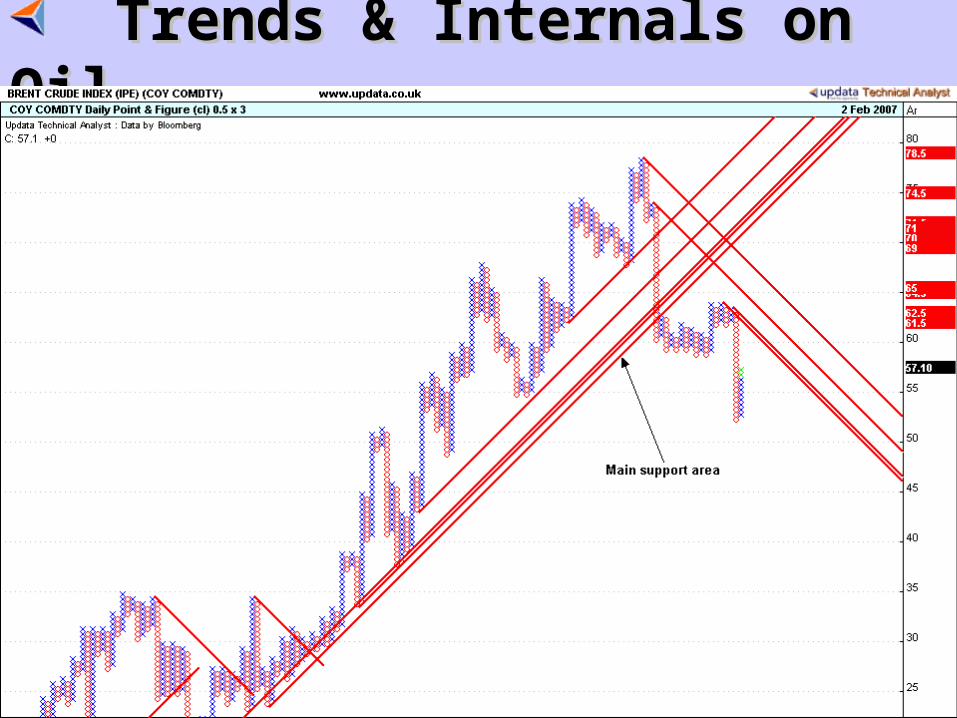
Trends & Internals on OilTrends & Internals on Oil
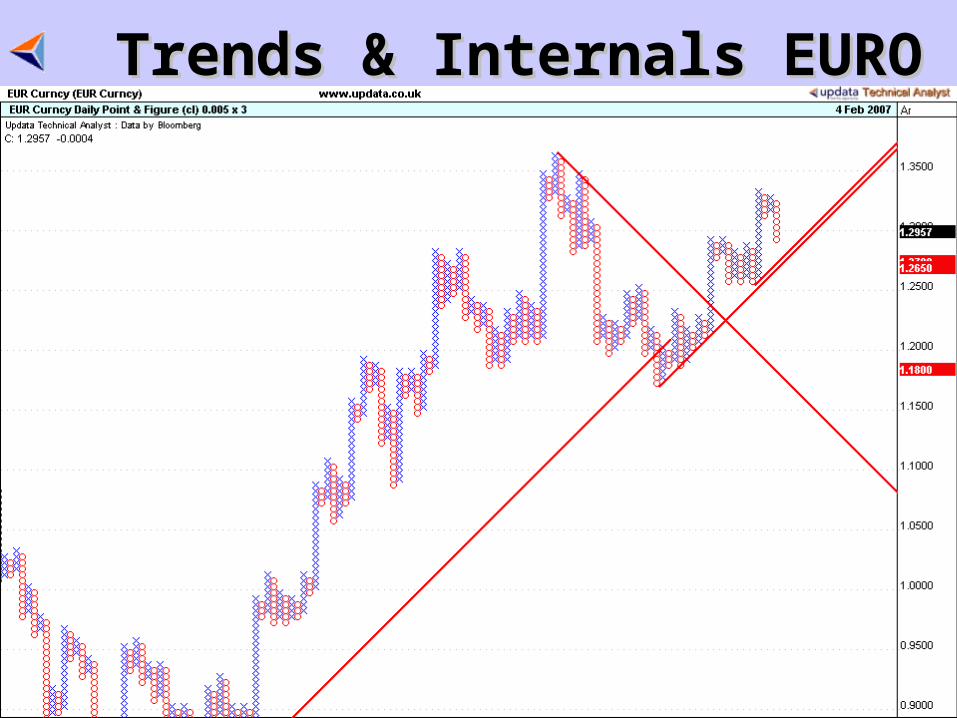
Trends & Internals EUROTrends & Internals EURO
Advantages of 45° Trend LinesAdvantages of 45° Trend Lines
• Can be drawn immediately after top/bottomCan be drawn immediately after top/bottom
• Objective - can’t argue with themObjective - can’t argue with them
• They alternate and carve up the chartThey alternate and carve up the chart
• Easy to see bullish and bearish sectionsEasy to see bullish and bearish sections
• Add dimension to the chartAdd dimension to the chart
• Help accept or reject Point & Figure signalsHelp accept or reject Point & Figure signals
• Can see the trend easily Can see the trend easily
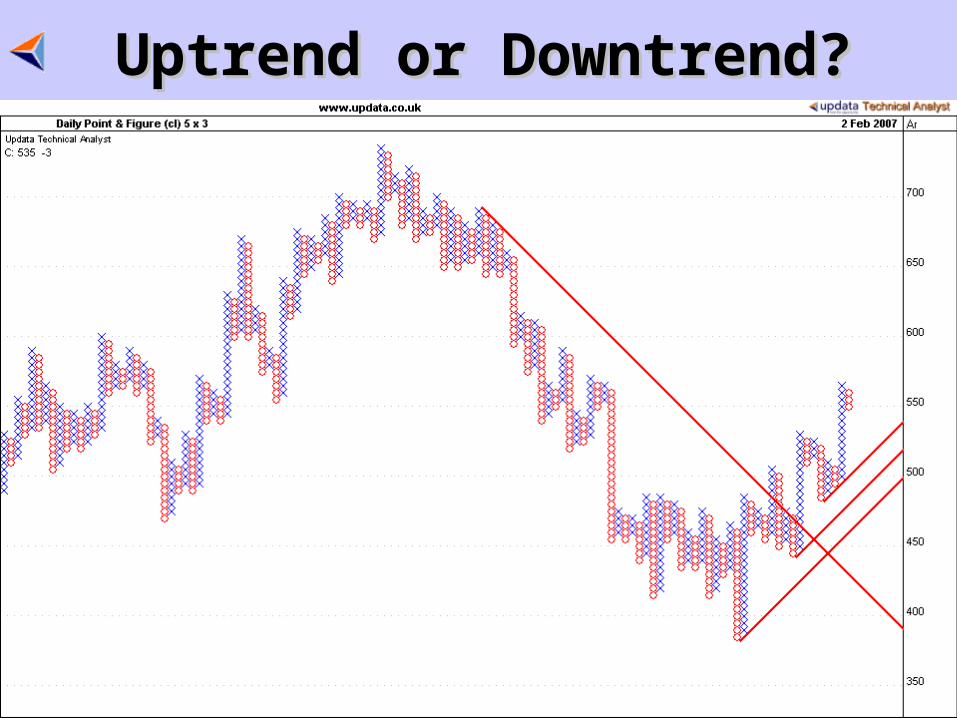
Uptrend or Downtrend?Uptrend or Downtrend?
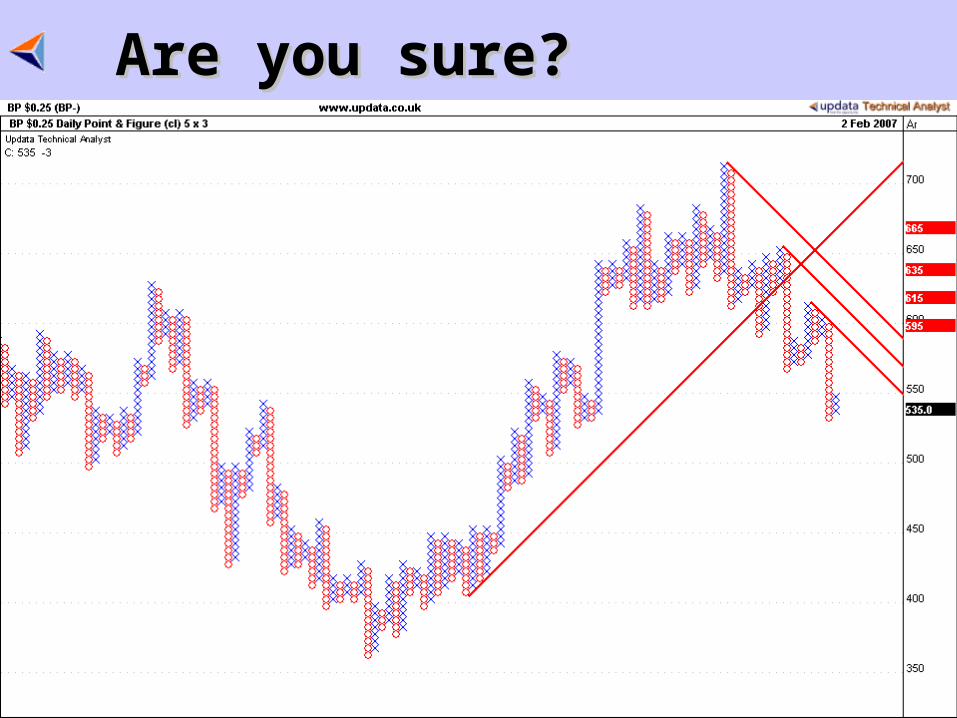
Are you sure?Are you sure?
Point and Figure ScalingPoint and Figure Scaling
In Point and Figure terms:In Point and Figure terms:
• ArithmeticArithmetic:: Fixed points box sizeFixed points box size
• LogLog: : Percentage Box SizePercentage Box Size
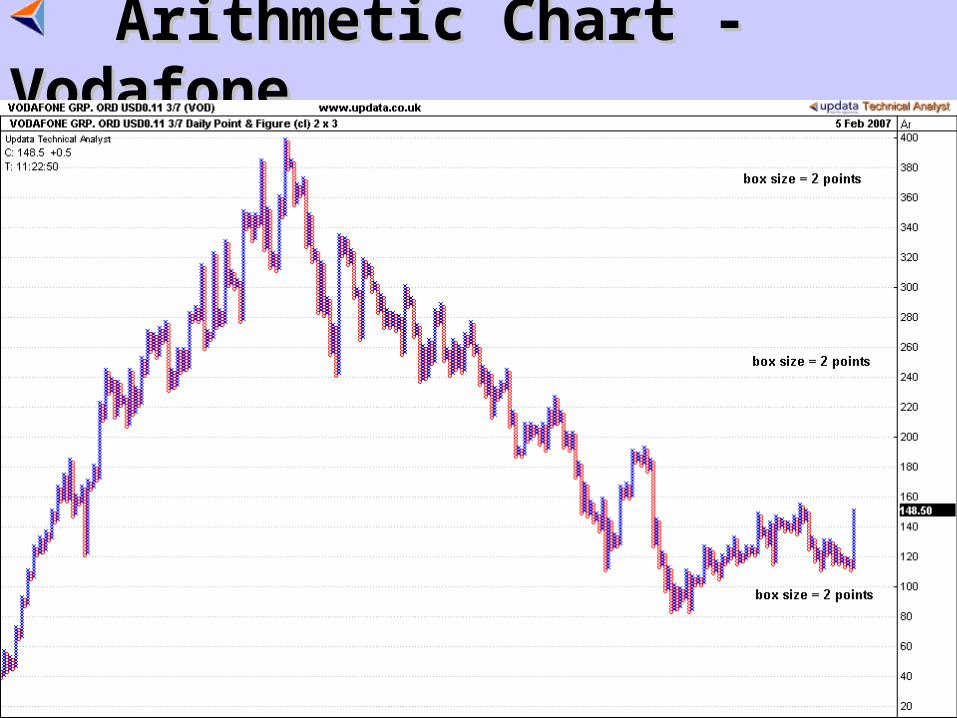
Arithmetic Chart - VodafoneArithmetic Chart - Vodafone
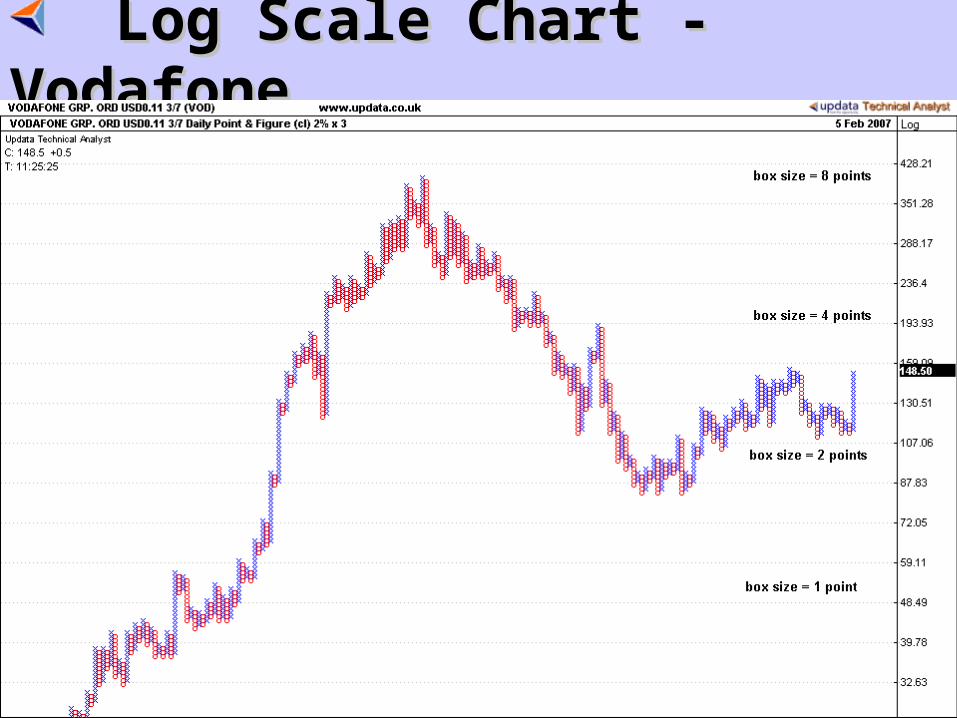
Log Scale Chart - VodafoneLog Scale Chart - Vodafone
Log or Arithmetic?Log or Arithmetic?
• Log better:-Log better:-– For medium and long-term analysisFor medium and long-term analysis– Where large rise and fallWhere large rise and fall– Where rise has been exponentialWhere rise has been exponential
• Arithmetic better:-Arithmetic better:-– For linear price risesFor linear price rises– For charts in a price range (e.g. Bonds)For charts in a price range (e.g. Bonds)– Essential for intraday charts especially tick chartsEssential for intraday charts especially tick charts– Essential for ForexEssential for Forex
Multiple Time HorizonsMultiple Time Horizons
• Changing the Box Size changes the SensitivityChanging the Box Size changes the Sensitivity• Changing Sensitivity changes the Time HorizonChanging Sensitivity changes the Time Horizon
• Obtain Short, Medium and Long-term view Obtain Short, Medium and Long-term view from from same datasame data
• Log scale % boxes ideal for this Log scale % boxes ideal for this
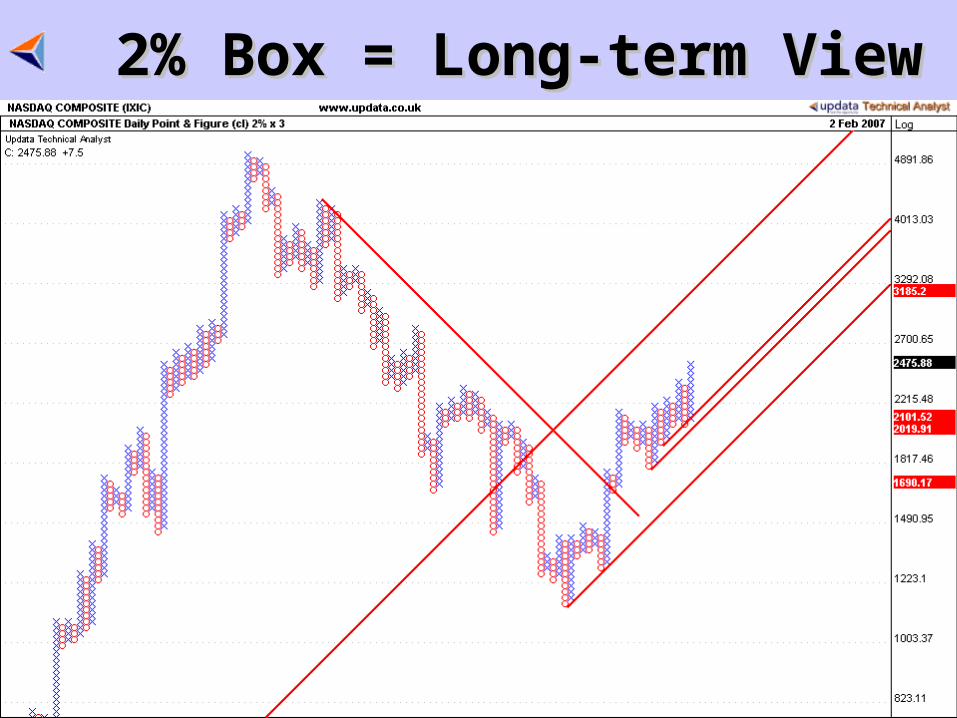
2% Box = Long-term View2% Box = Long-term View
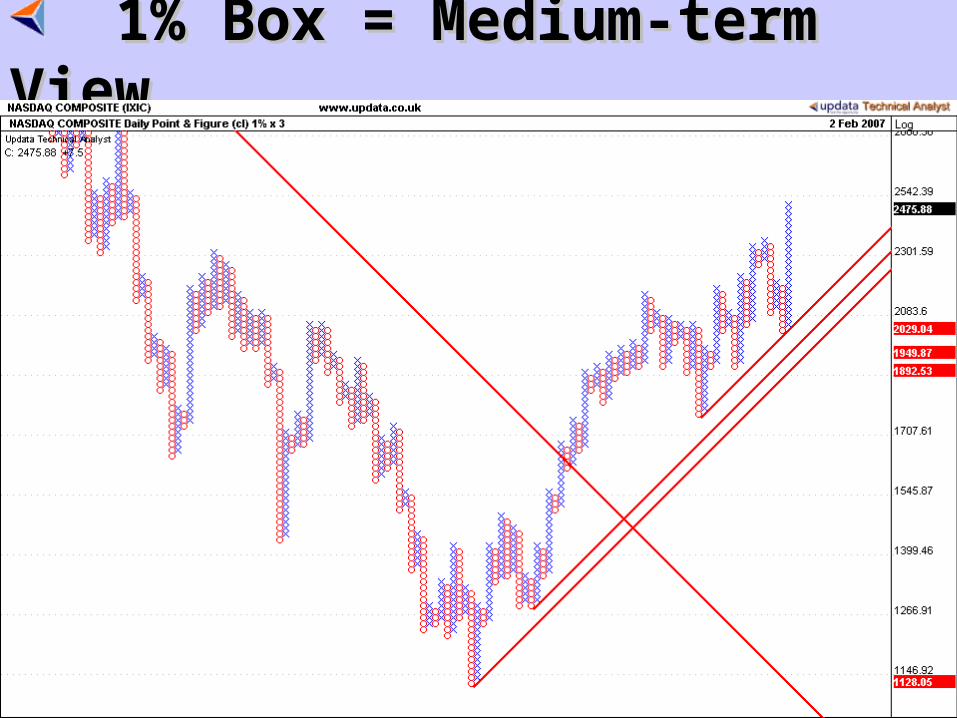
1% Box = Medium-term View1% Box = Medium-term View
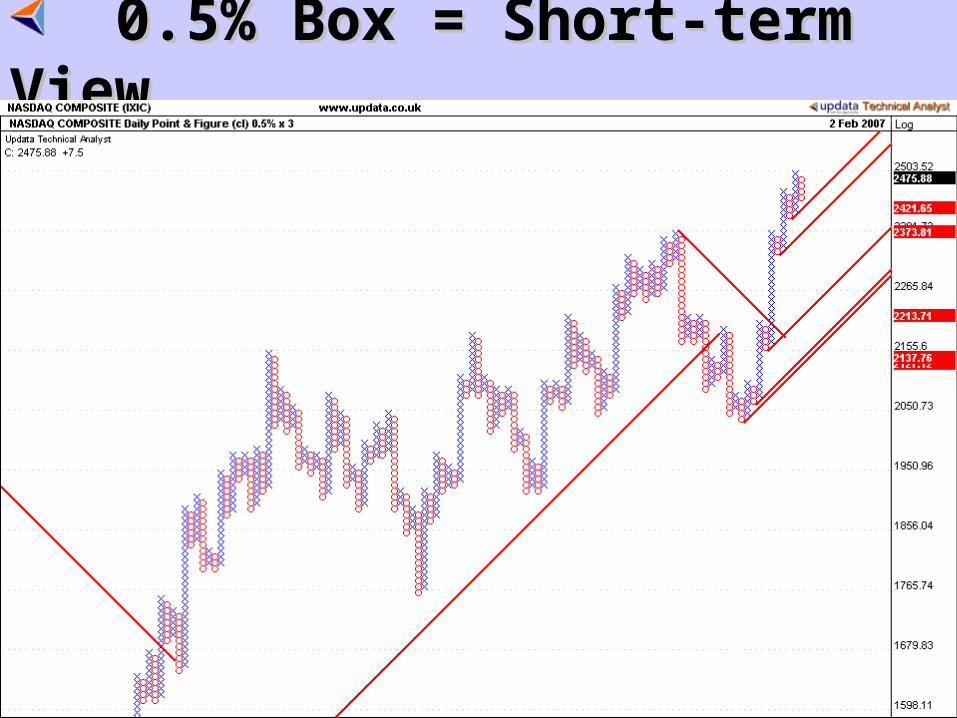
0.5% Box = Short-term View0.5% Box = Short-term View
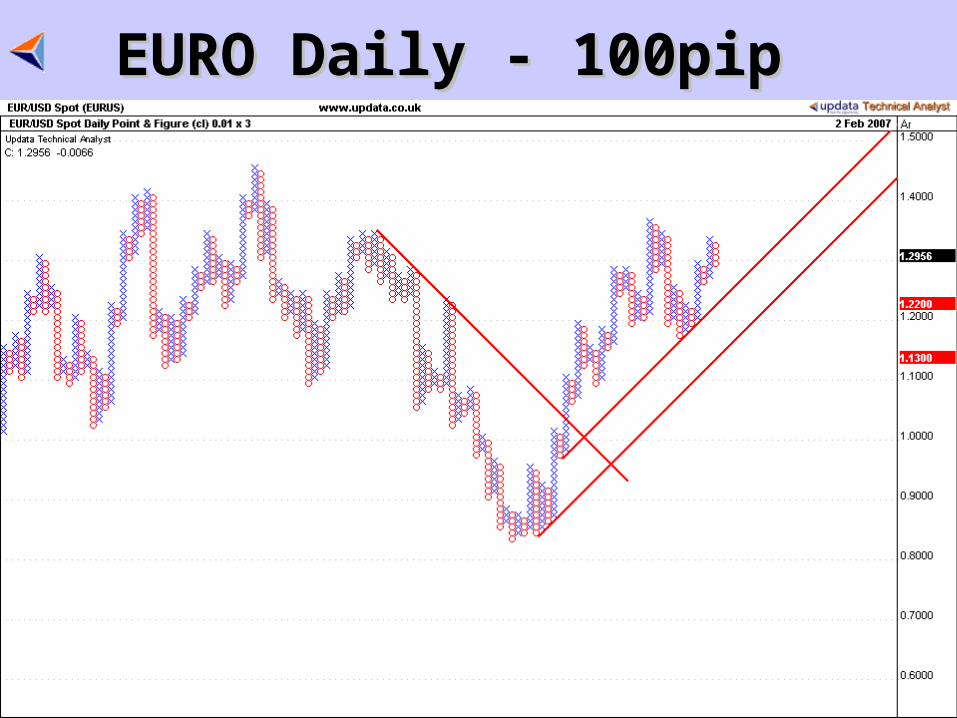
EURO Daily - 100pipEURO Daily - 100pip
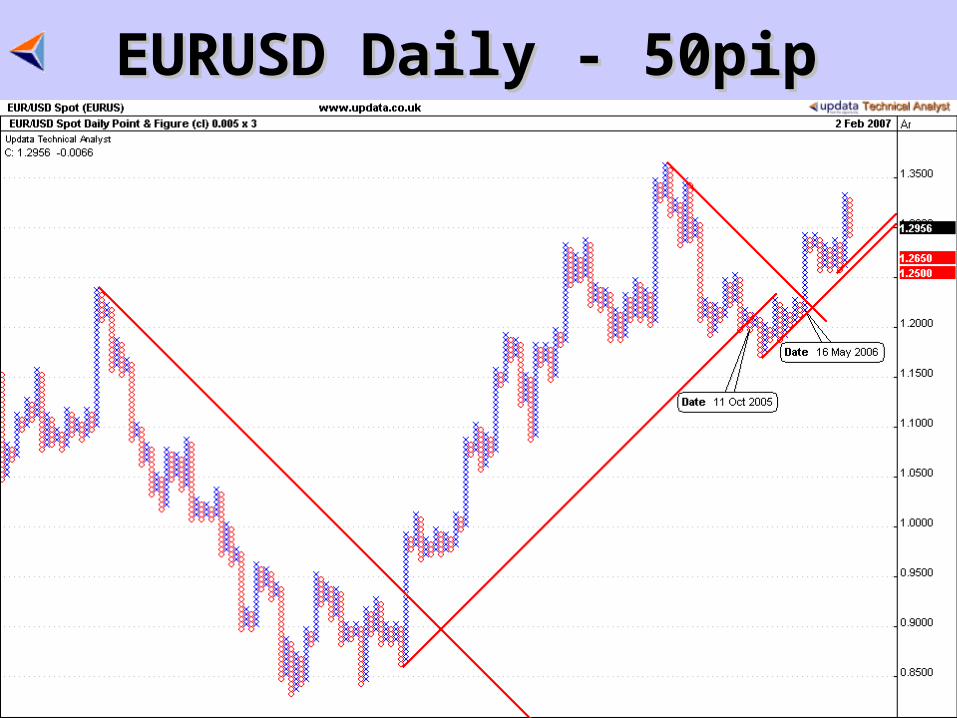
EURUSD Daily - 50pipEURUSD Daily - 50pip
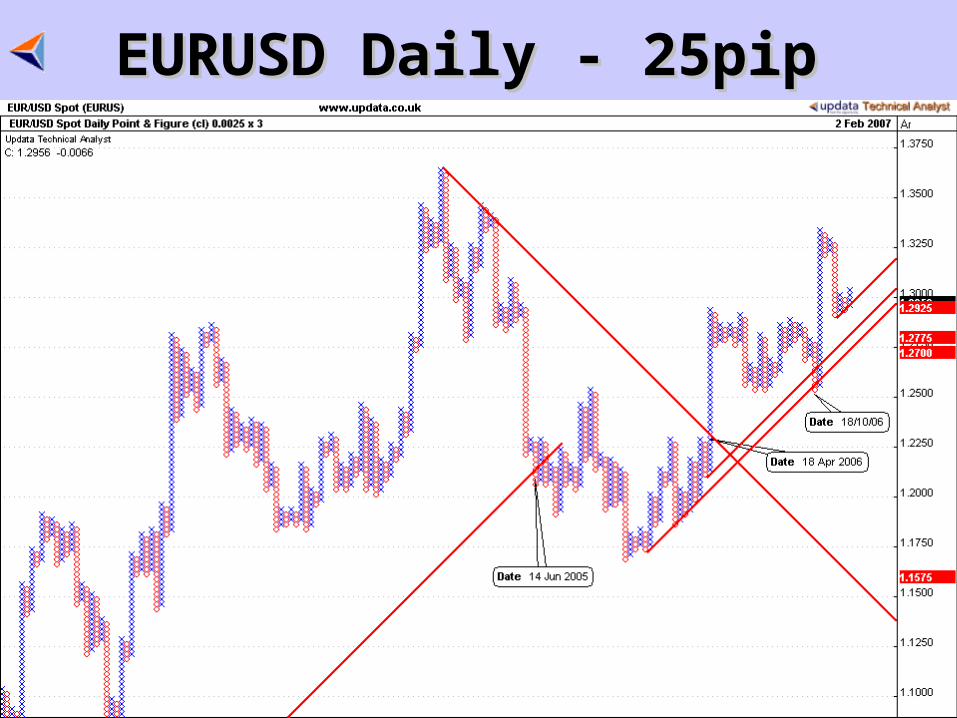
EURUSD Daily - 25pipEURUSD Daily - 25pip
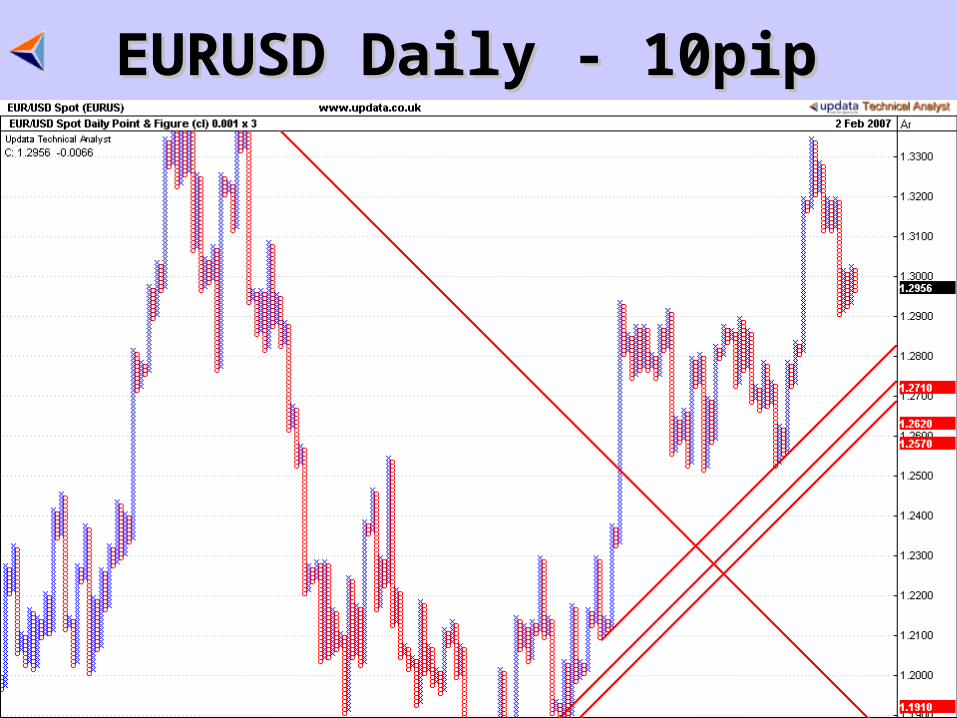
EURUSD Daily - 10pipEURUSD Daily - 10pip
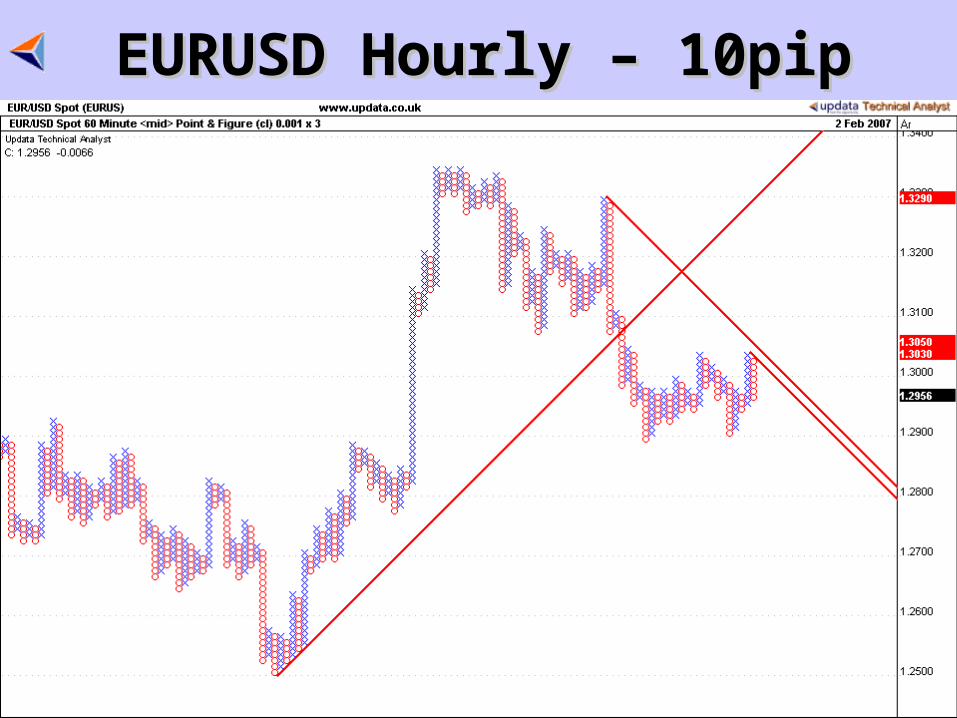
EURUSD Hourly – 10pipEURUSD Hourly – 10pip
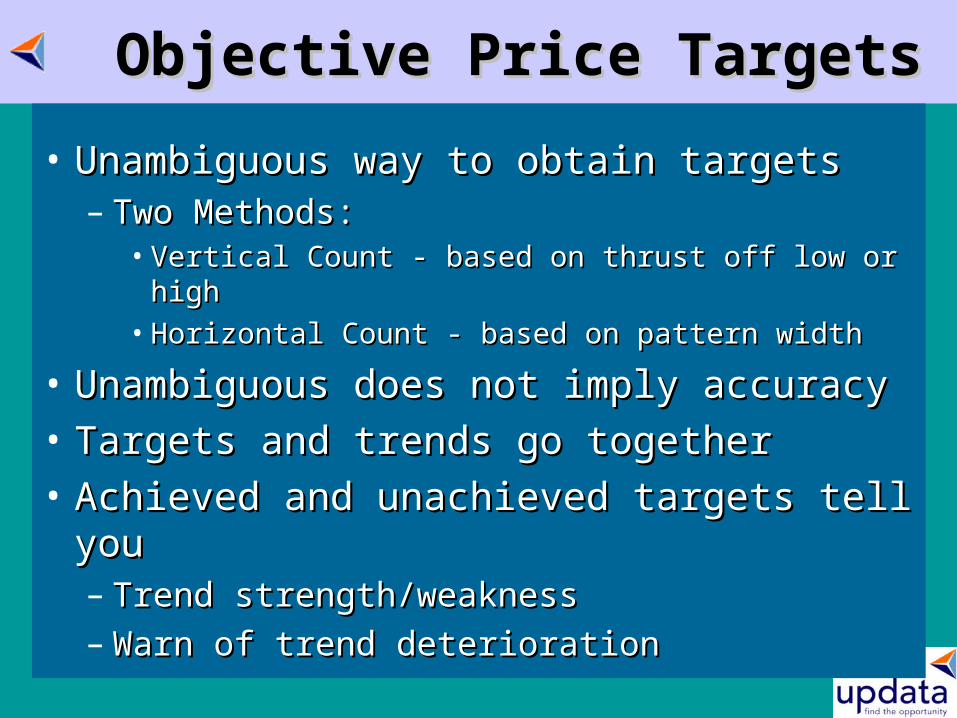
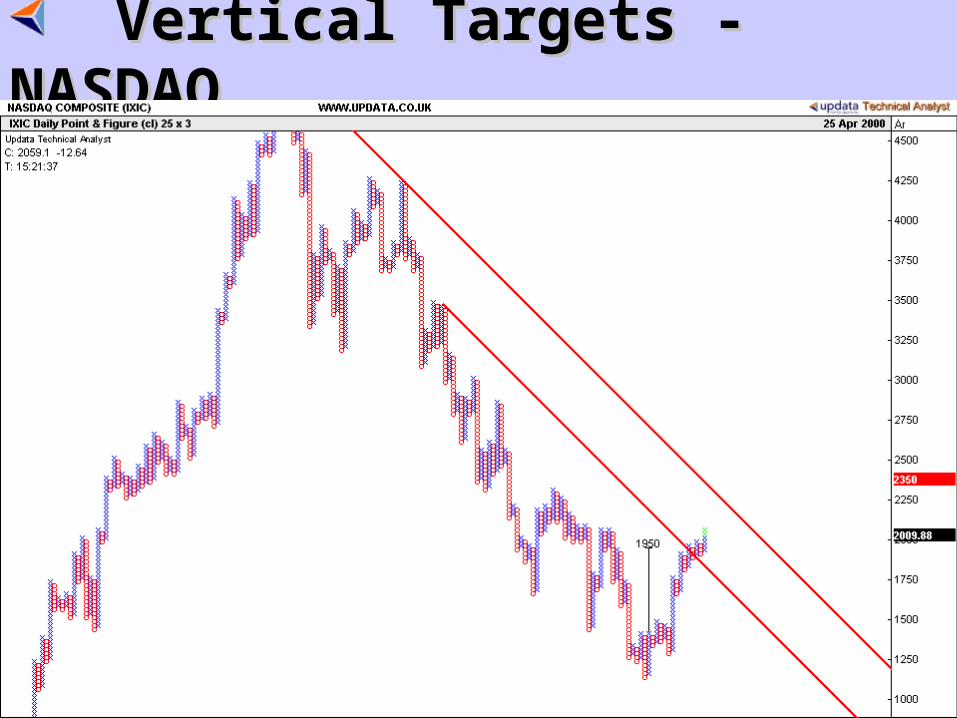
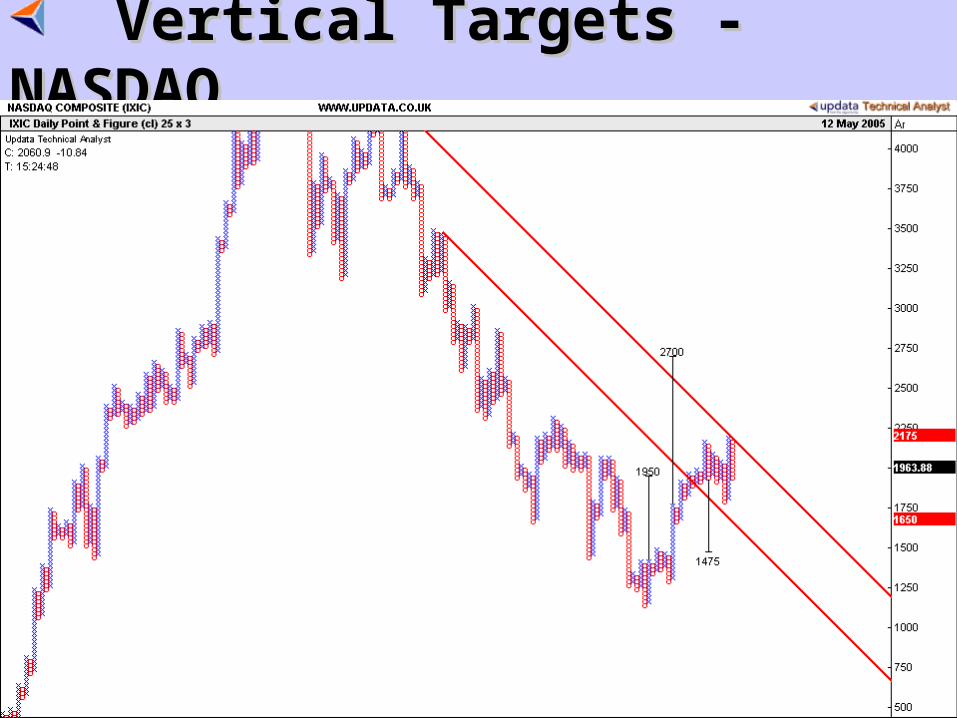
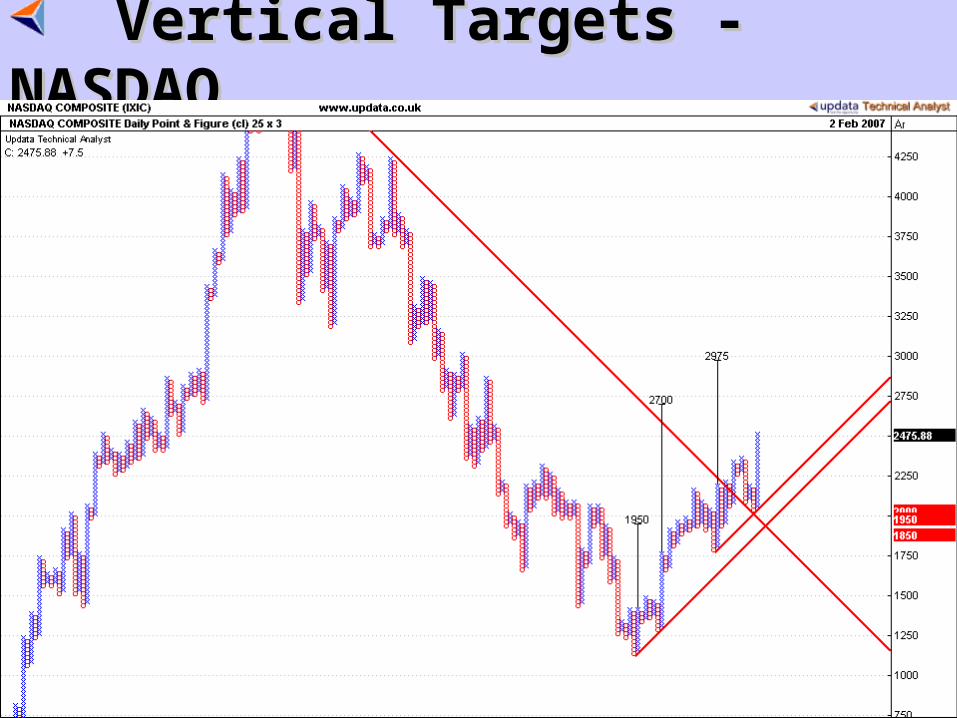
Objective Price TargetsObjective Price Targets
• Unambiguous way to obtain targetsUnambiguous way to obtain targets– Two Methods:Two Methods:
• Vertical Count - based on thrust off low or highVertical Count - based on thrust off low or high• Horizontal Count - based on pattern widthHorizontal Count - based on pattern width
• Unambiguous does not imply accuracyUnambiguous does not imply accuracy
• Targets and trends go togetherTargets and trends go together
• Achieved and unachieved targets tell youAchieved and unachieved targets tell you– Trend strength/weaknessTrend strength/weakness– Warn of trend deteriorationWarn of trend deterioration
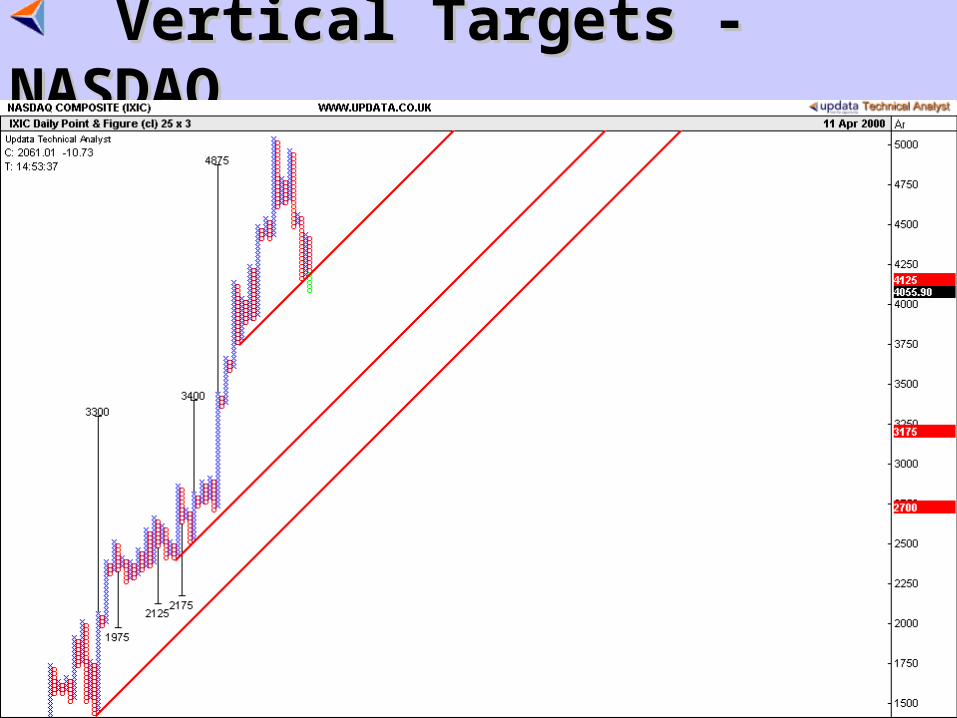
Vertical Targets - NASDAQVertical Targets - NASDAQ
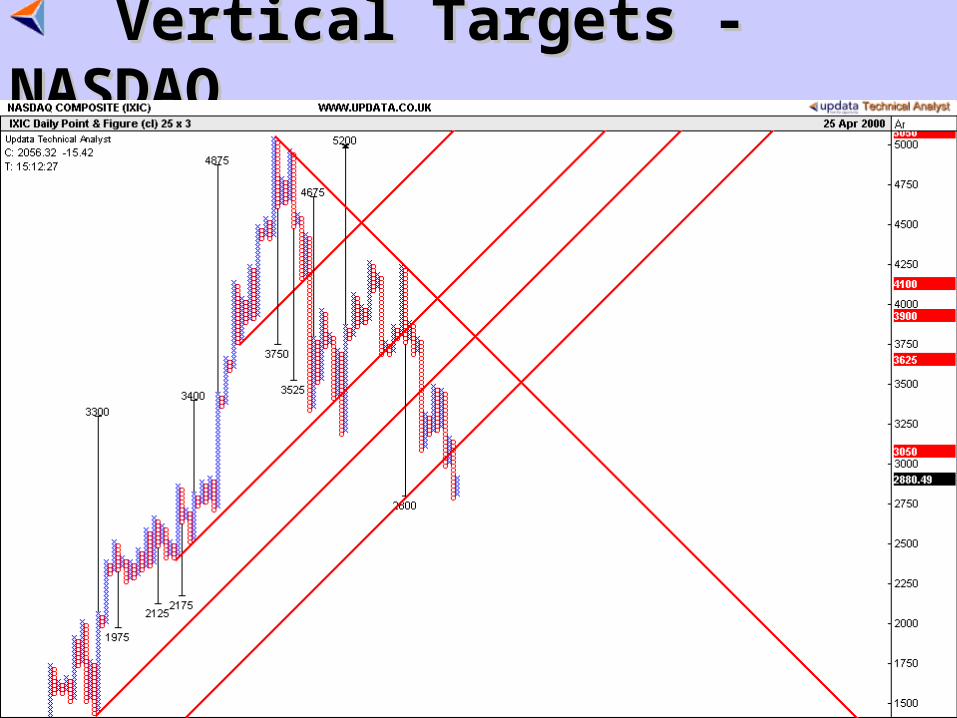
Vertical Targets - NASDAQVertical Targets - NASDAQ
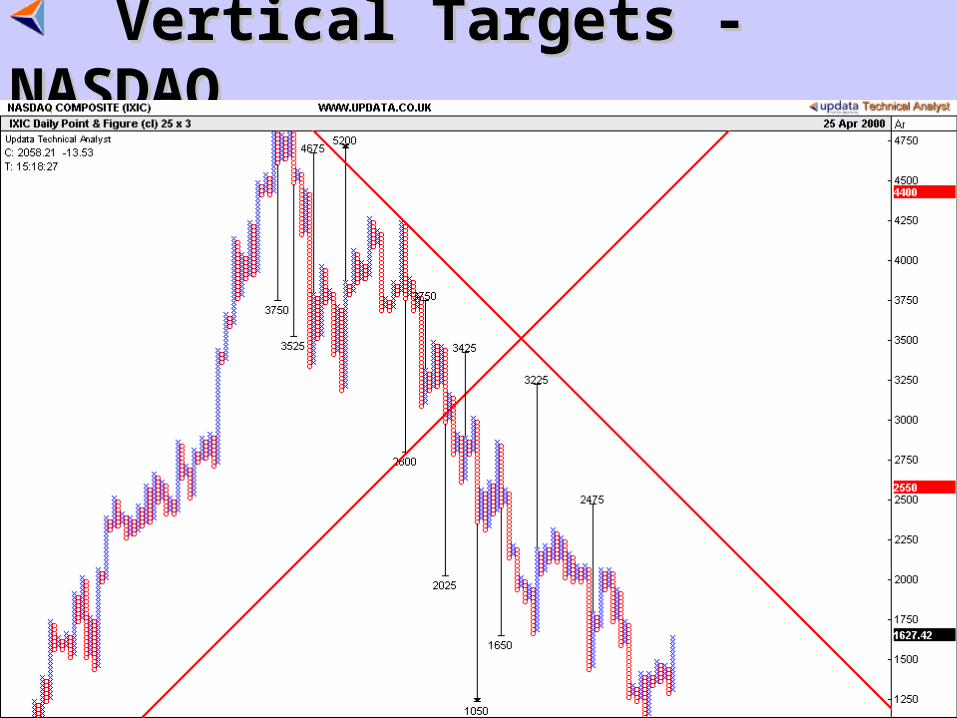
Vertical Targets - NASDAQVertical Targets - NASDAQ
Vertical Targets - NASDAQVertical Targets - NASDAQ
Vertical Targets - NASDAQVertical Targets - NASDAQ
Vertical Targets - NASDAQVertical Targets - NASDAQ
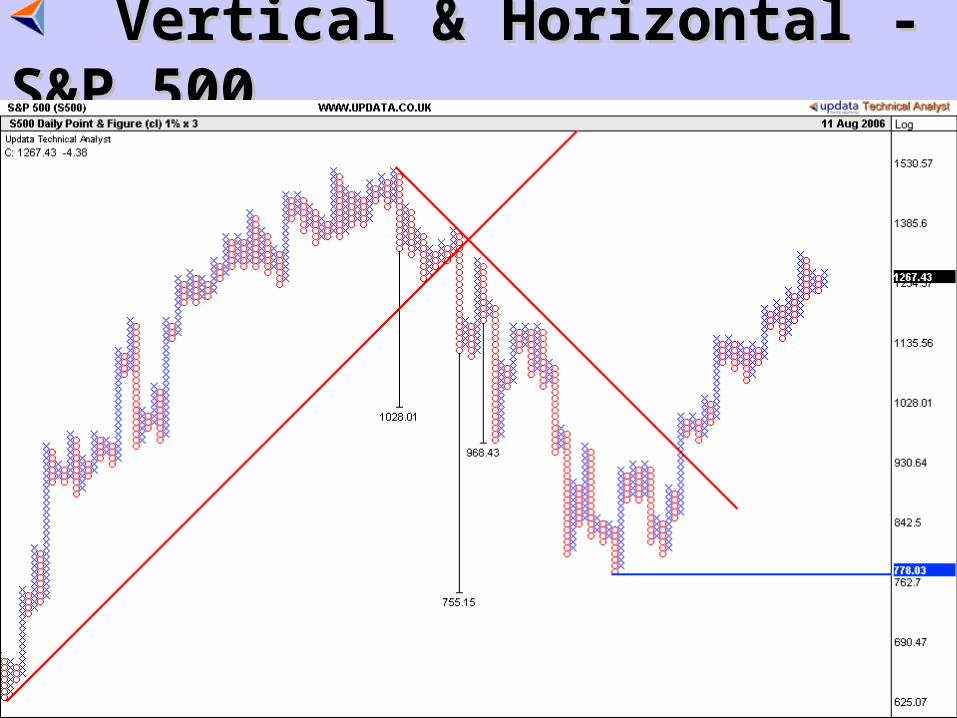
Vertical & Horizontal - S&P 500Vertical & Horizontal - S&P 500
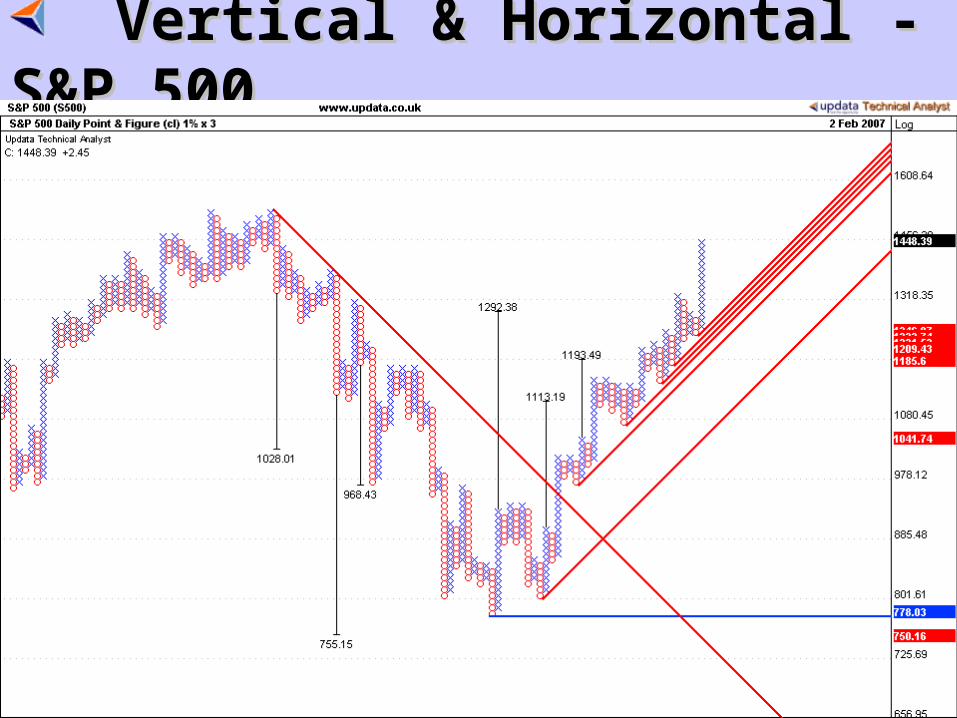
Vertical & Horizontal - S&P 500Vertical & Horizontal - S&P 500
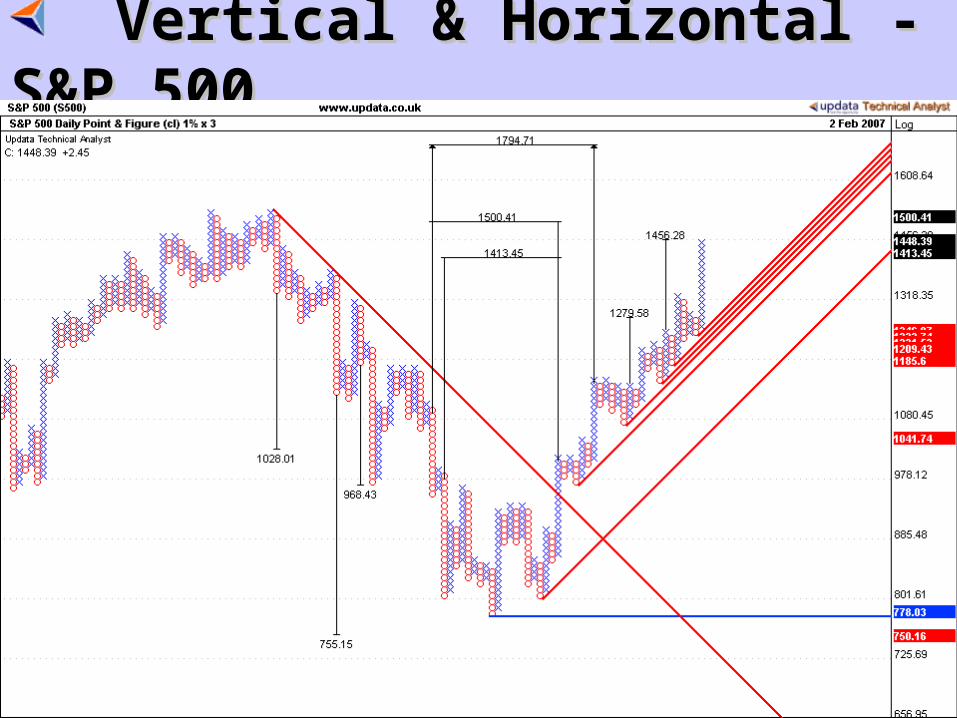
Vertical & Horizontal - S&P 500Vertical & Horizontal - S&P 500
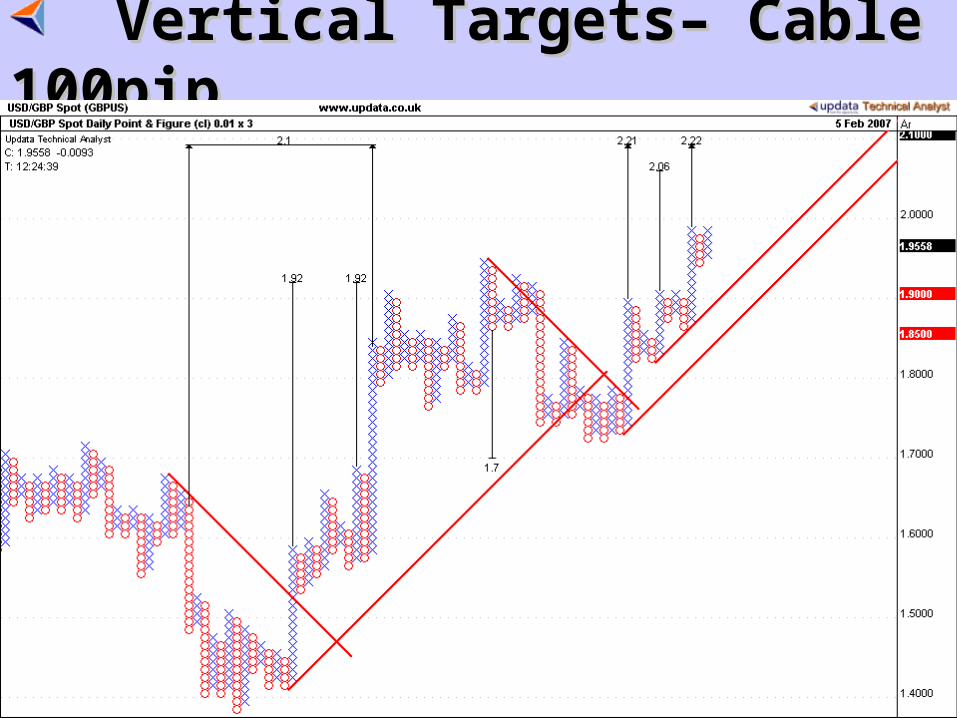
Vertical Targets– Cable 100pipVertical Targets– Cable 100pip
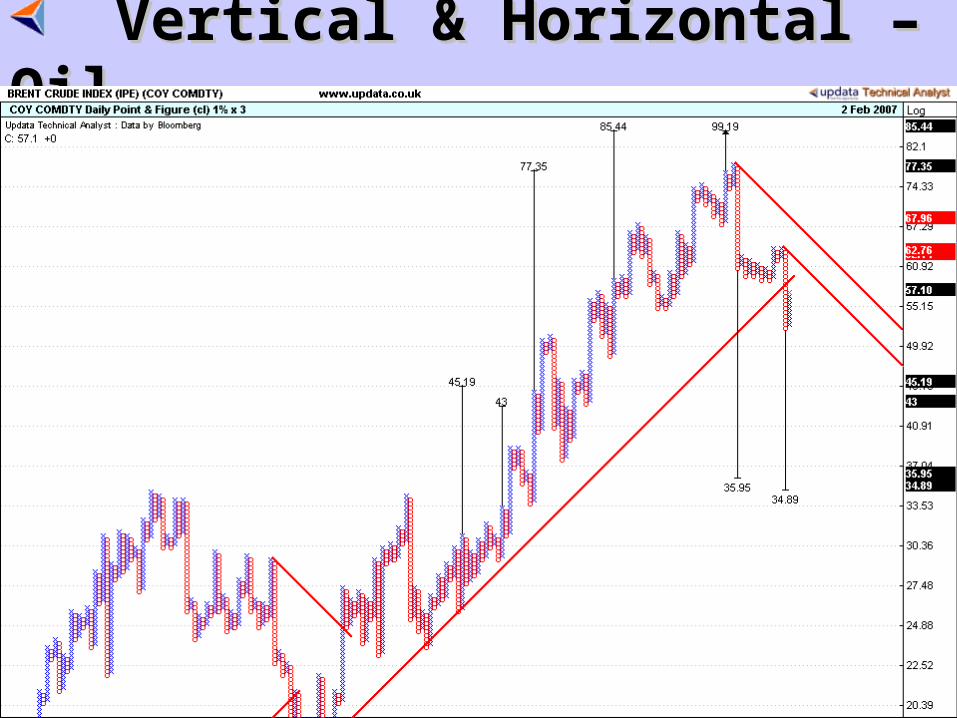
Vertical & Horizontal – OilVertical & Horizontal – Oil
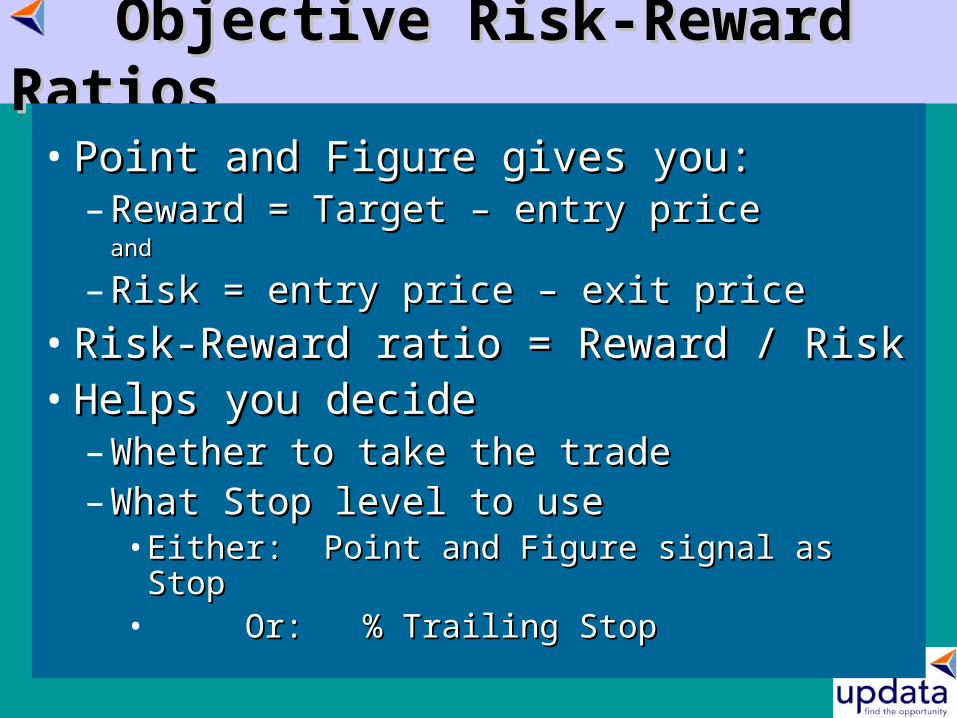
Objective Risk-Reward RatiosObjective Risk-Reward Ratios
• Point and Figure gives you:Point and Figure gives you:– Reward = Target – entry priceReward = Target – entry price
andand
– Risk = entry price – exit priceRisk = entry price – exit price
• Risk-Reward ratio = Reward / RiskRisk-Reward ratio = Reward / Risk• Helps you decideHelps you decide
– Whether to take the tradeWhether to take the trade– What Stop level to useWhat Stop level to use
• Either: Point and Figure signal as StopEither: Point and Figure signal as Stop• Or: % Trailing StopOr: % Trailing Stop
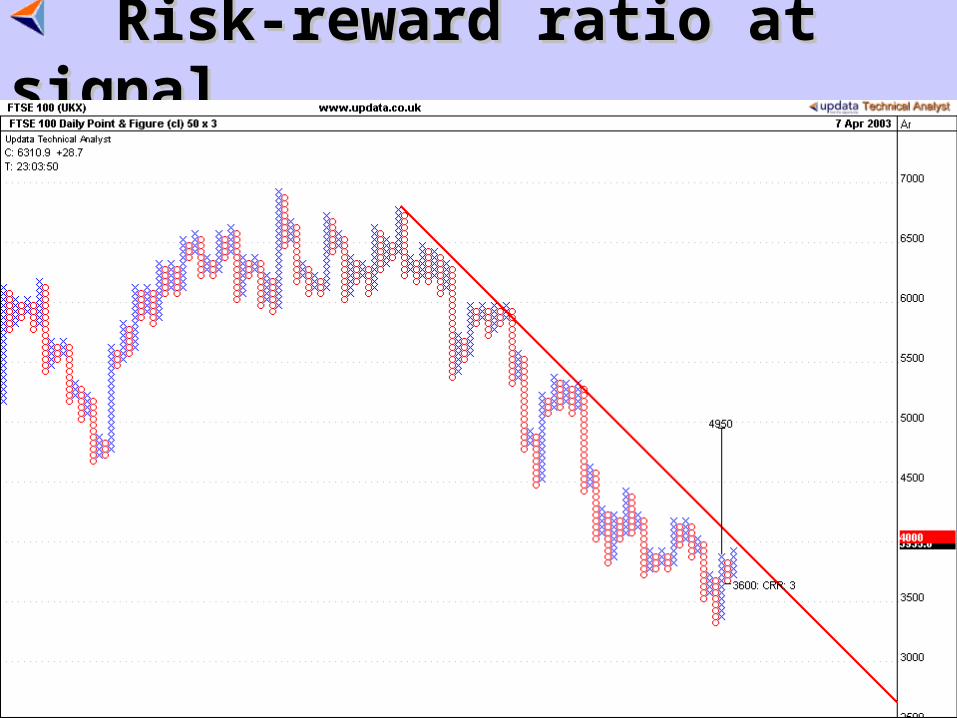
Risk-reward ratio at signalRisk-reward ratio at signal
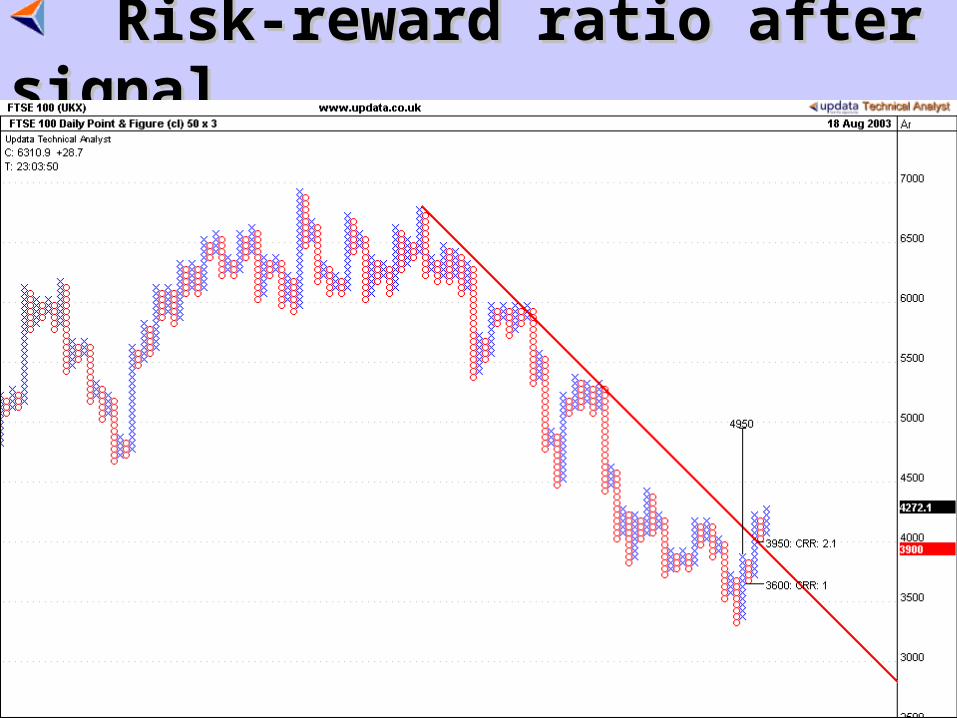
Risk-reward ratio after signalRisk-reward ratio after signal
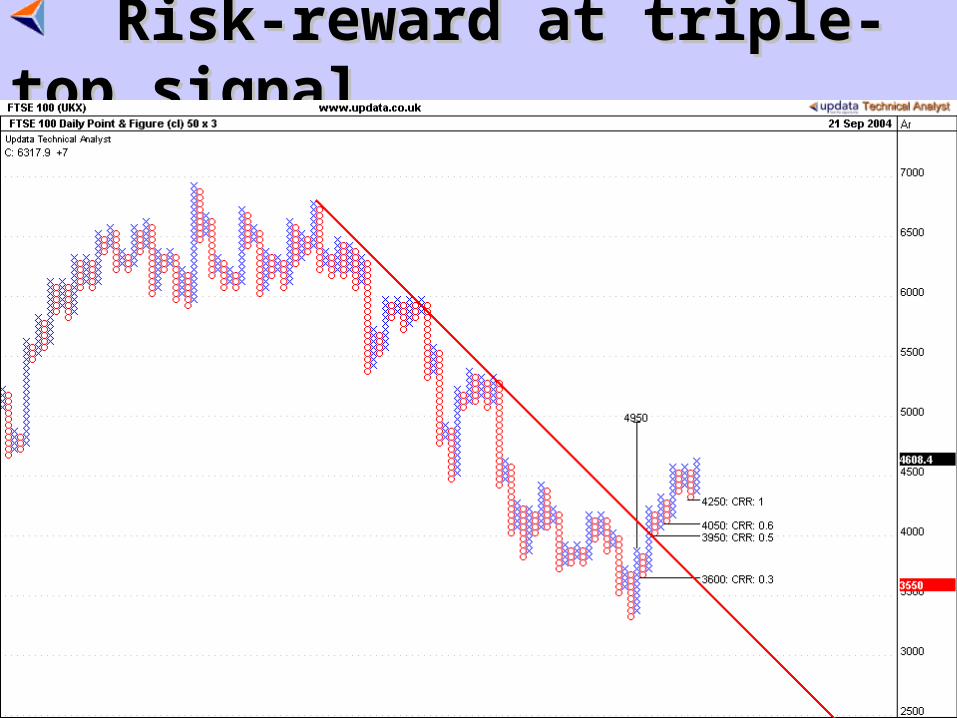
Risk-reward at triple-top signalRisk-reward at triple-top signal
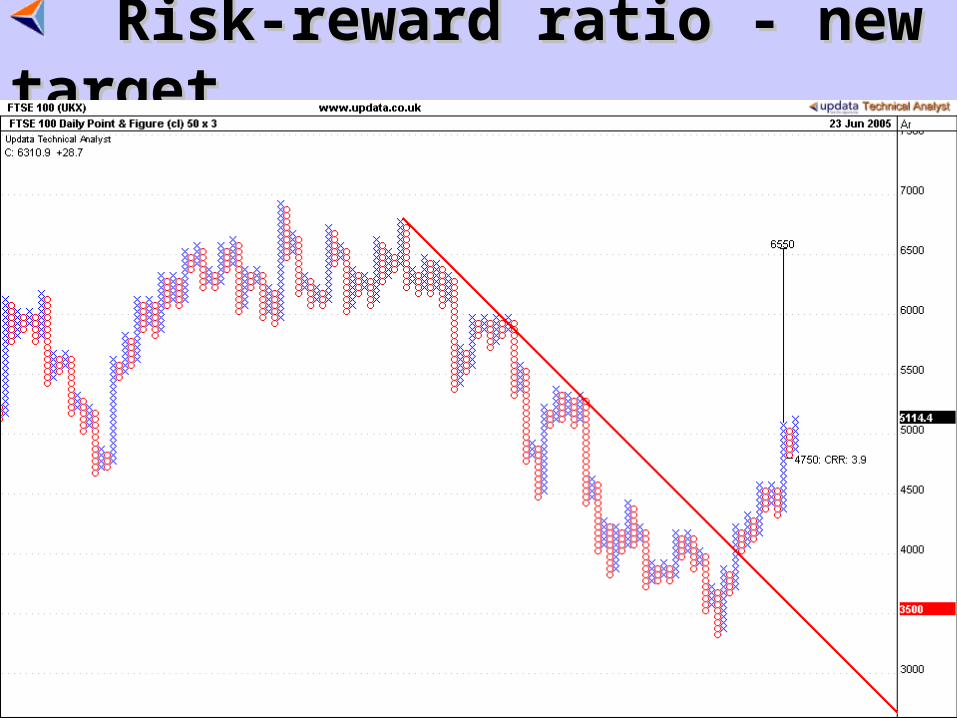
Risk-reward ratio - new targetRisk-reward ratio - new target
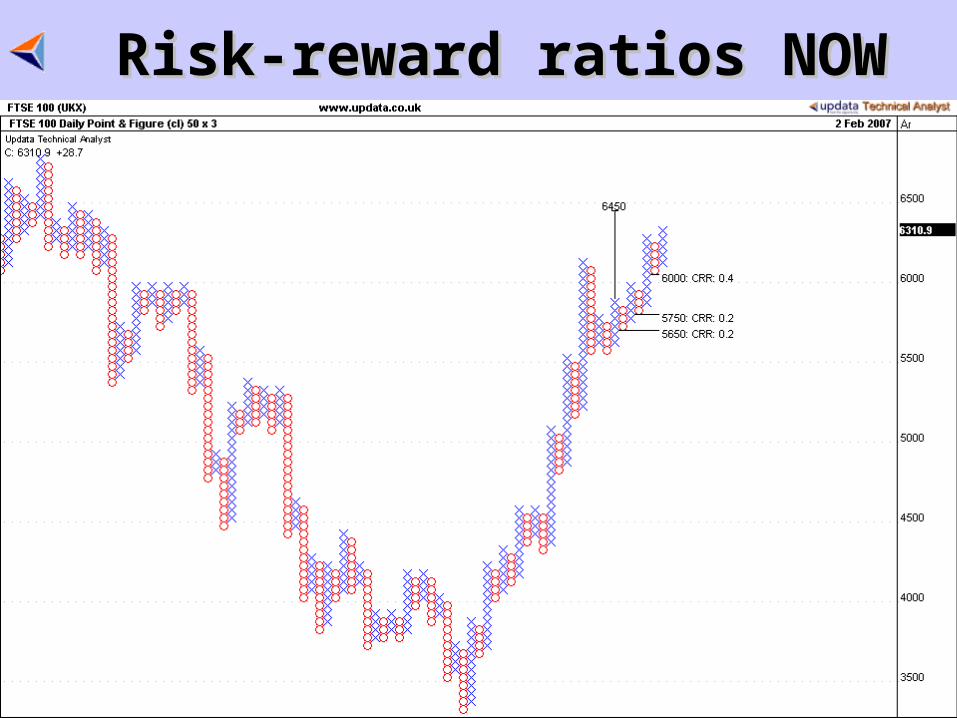
Risk-reward ratios NOWRisk-reward ratios NOW
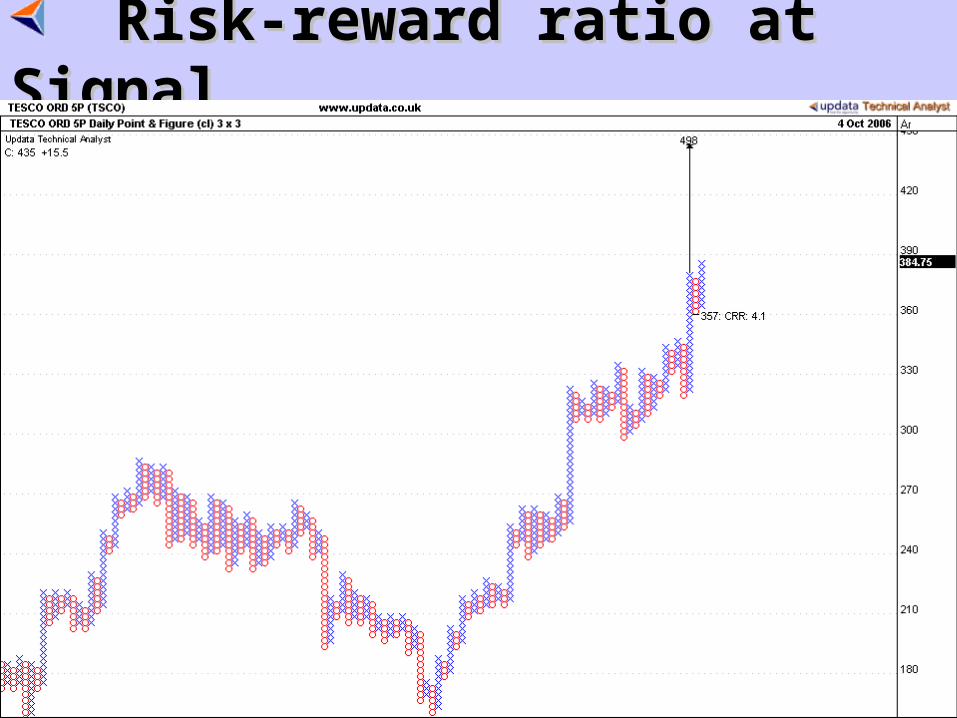
Risk-reward ratio at SignalRisk-reward ratio at Signal
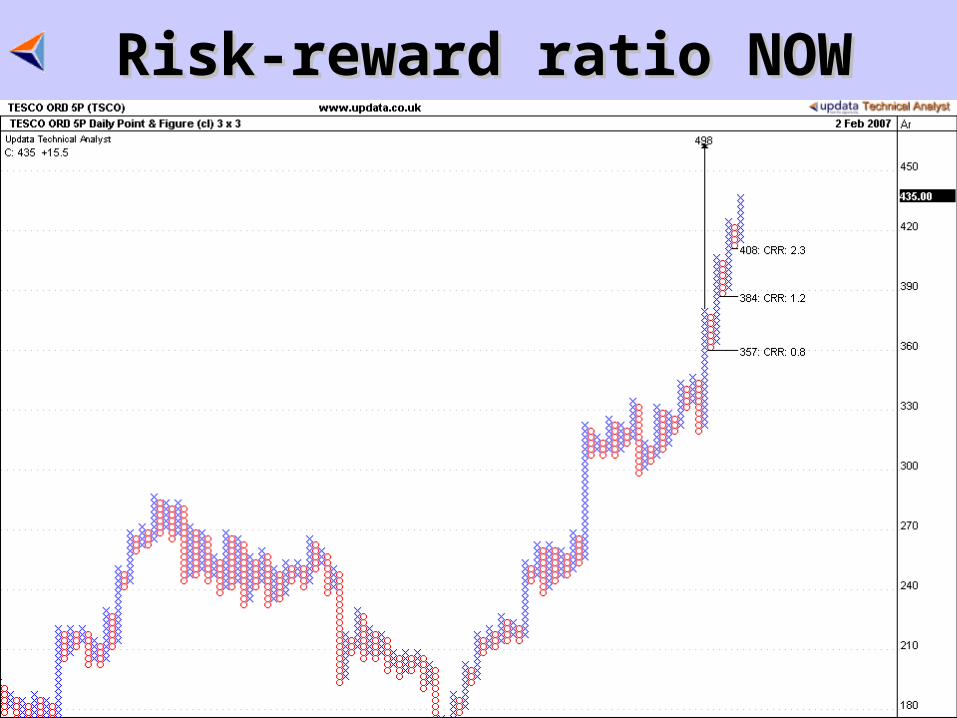
Risk-reward ratio NOWRisk-reward ratio NOW
Better Relative Strength charts Better Relative Strength charts
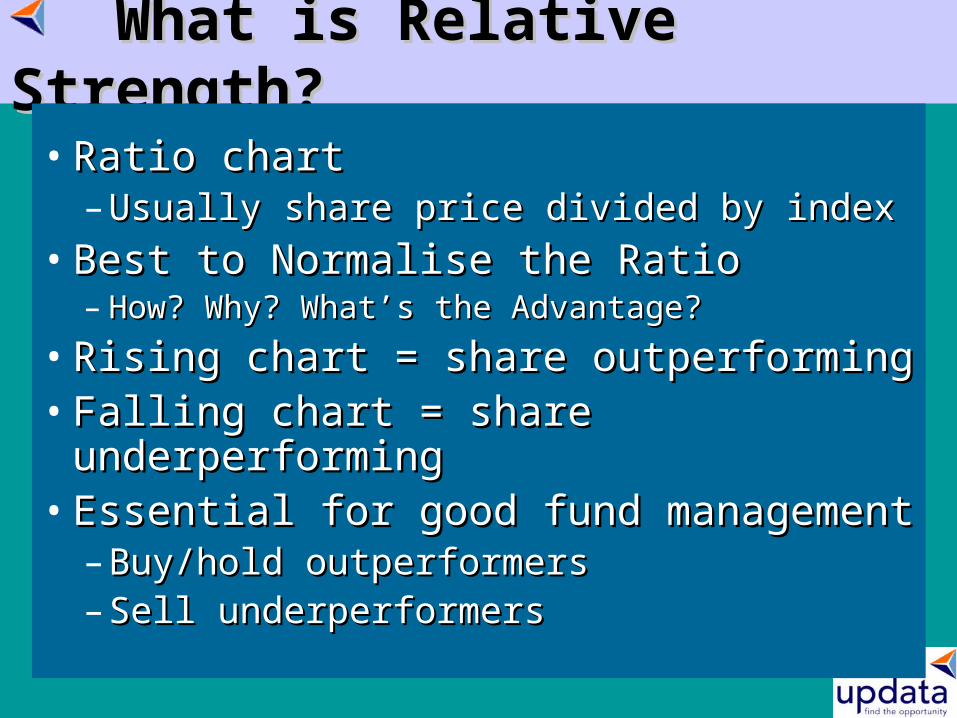
What is Relative Strength?What is Relative Strength?
• Ratio chartRatio chart– Usually share price divided by indexUsually share price divided by index
• Best to Normalise the RatioBest to Normalise the Ratio– How? Why? What’s the Advantage?How? Why? What’s the Advantage?
• Rising chart = share outperformingRising chart = share outperforming• Falling chart = share underperformingFalling chart = share underperforming• Essential for good fund managementEssential for good fund management
– Buy/hold outperformersBuy/hold outperformers– Sell underperformersSell underperformers
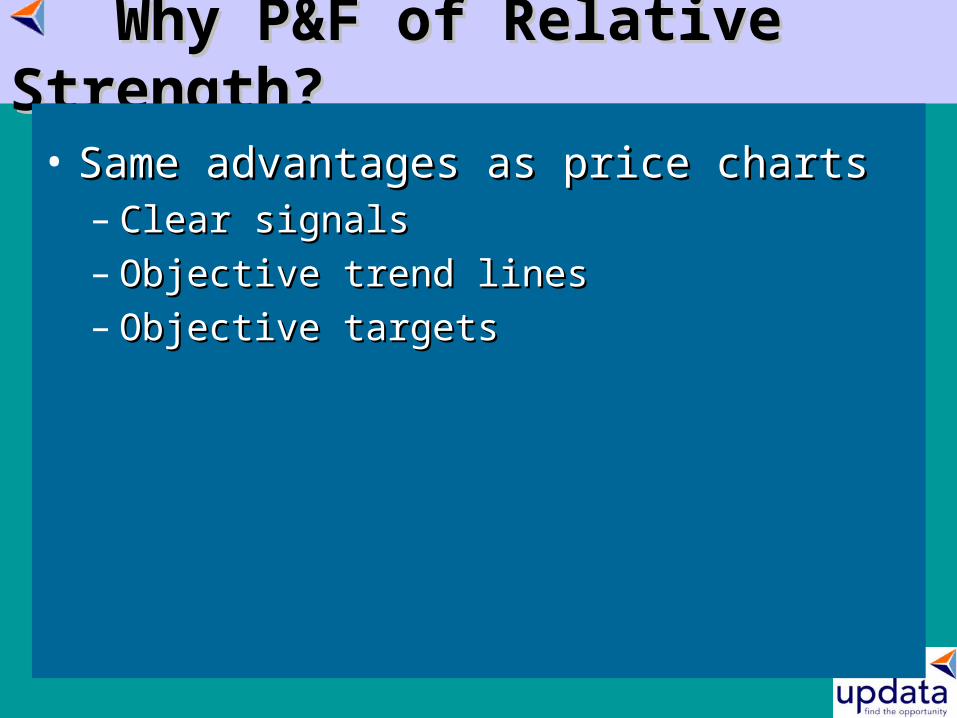
Why P&F of Relative Strength? Why P&F of Relative Strength?
• Same advantages as price chartsSame advantages as price charts– Clear signalsClear signals– Objective trend linesObjective trend lines– Objective targetsObjective targets
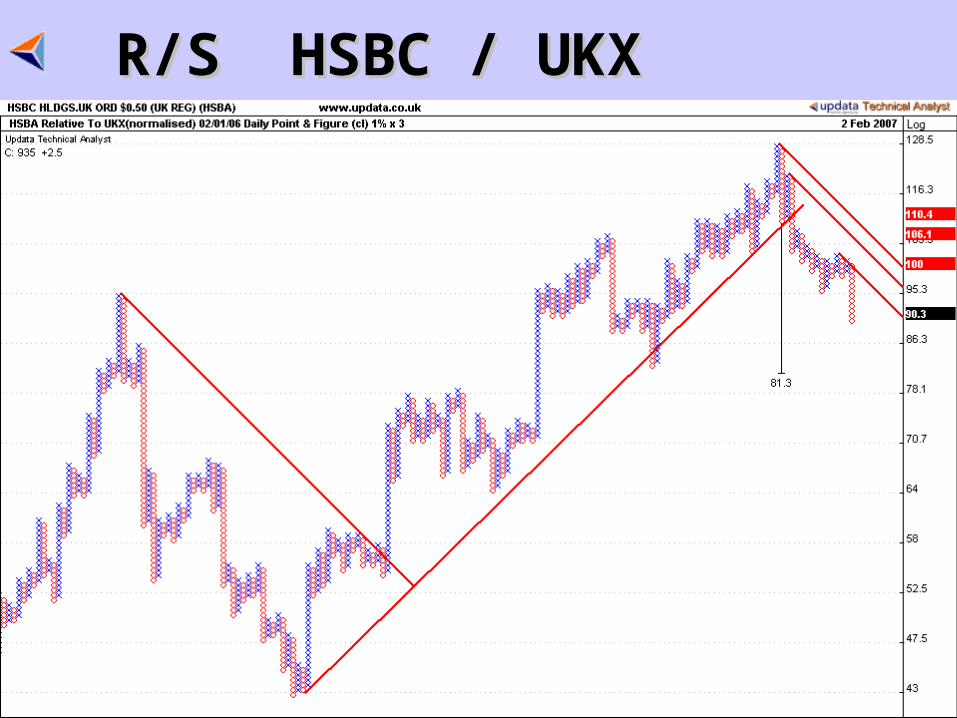
R/S HSBC / UKXR/S HSBC / UKX
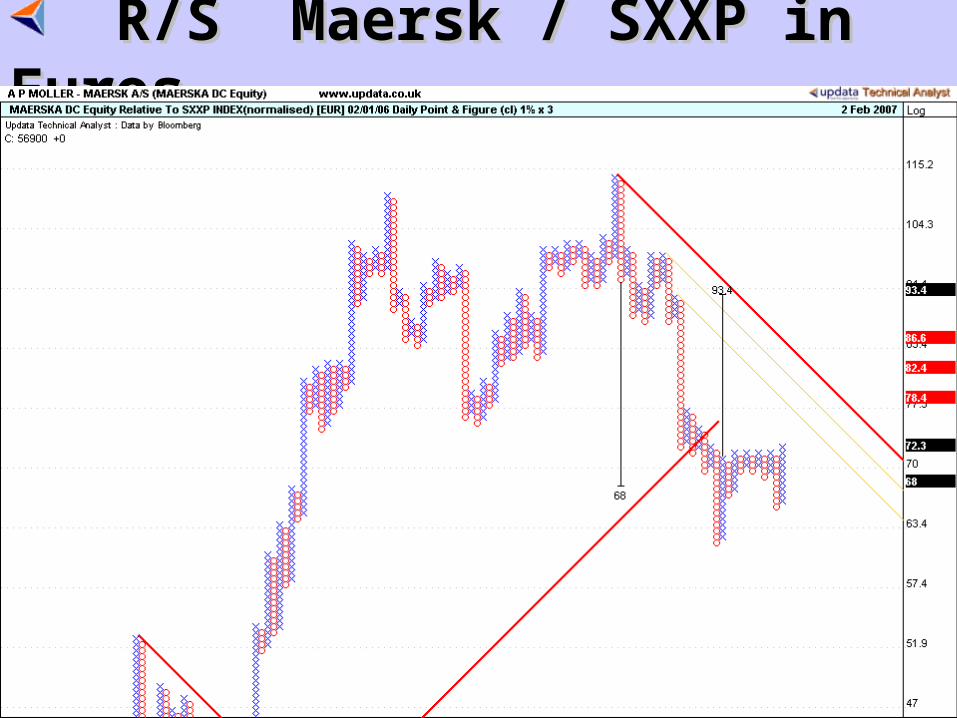
R/S Maersk / SXXP in EurosR/S Maersk / SXXP in Euros
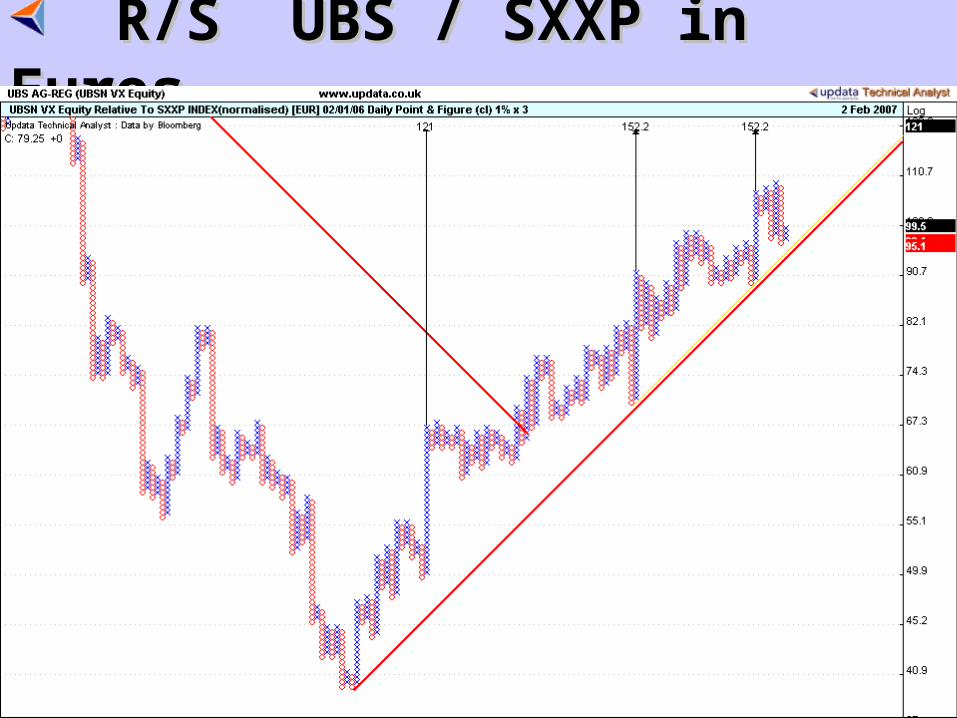
R/S UBS / SXXP in EurosR/S UBS / SXXP in Euros
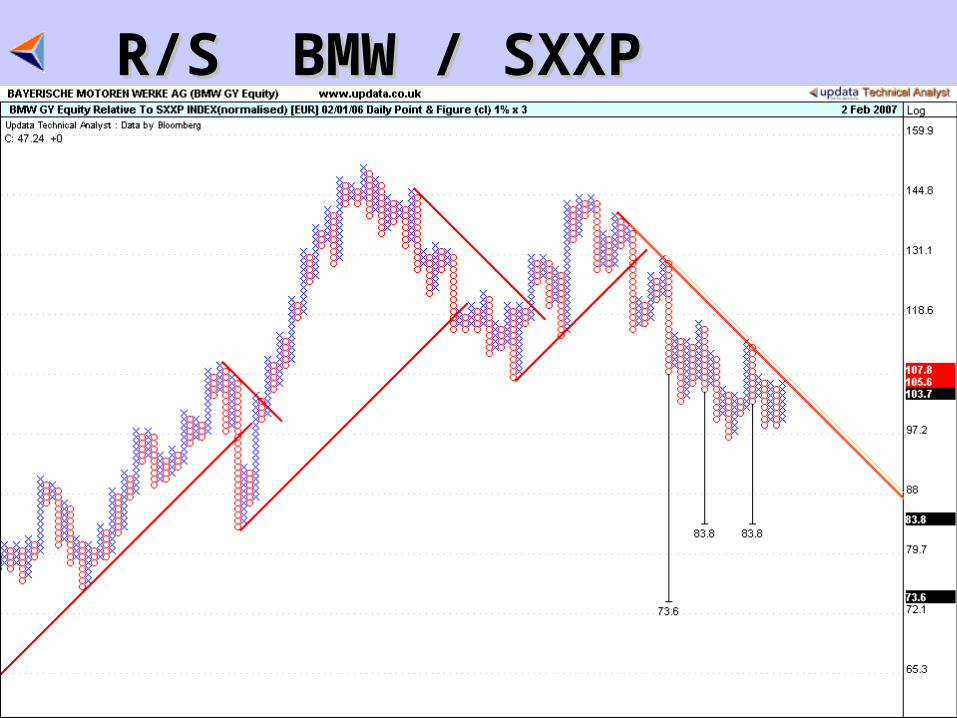
R/S BMW / SXXP R/S BMW / SXXP
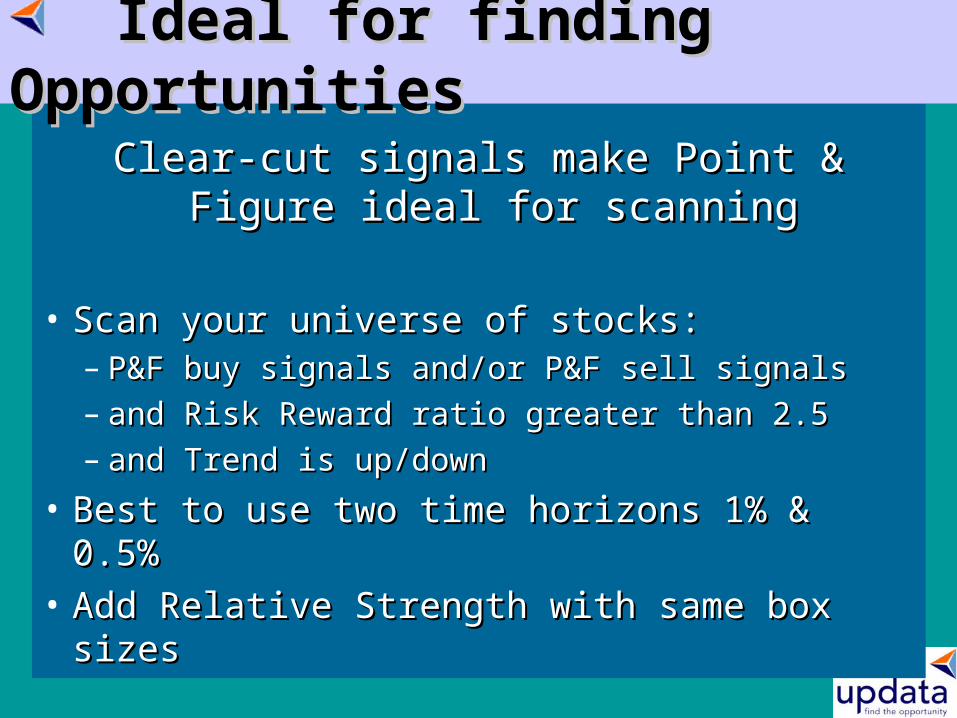
Clear-cut signals make Point & Figure Clear-cut signals make Point & Figure ideal for scanningideal for scanning
• Scan your universe of stocks:Scan your universe of stocks:– P&F buy signals and/or P&F sell signalsP&F buy signals and/or P&F sell signals– and Risk Reward ratio greater than 2.5and Risk Reward ratio greater than 2.5– and Trend is up/downand Trend is up/down
• Best to use two time horizons 1% & 0.5%Best to use two time horizons 1% & 0.5%
• Add Relative Strength with same box sizesAdd Relative Strength with same box sizes
Ideal for finding OpportunitiesIdeal for finding Opportunities

So what should you do now?So what should you do now?
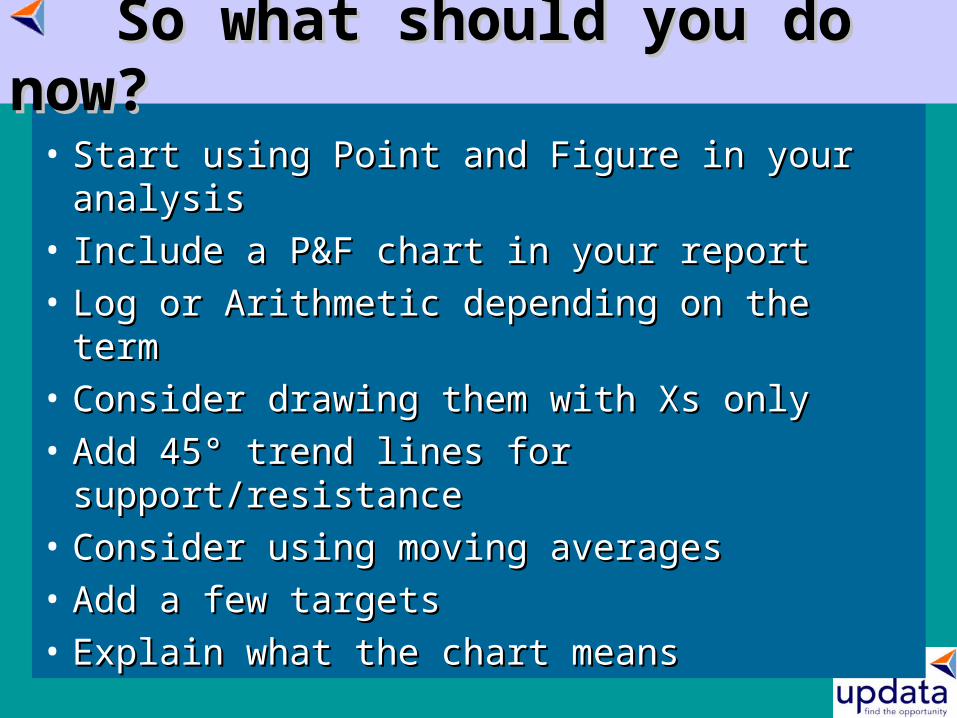
• Start using Point and Figure in your analysisStart using Point and Figure in your analysis
• Include a P&F chart in your reportInclude a P&F chart in your report
• Log or Arithmetic depending on the termLog or Arithmetic depending on the term
• Consider drawing them with Xs onlyConsider drawing them with Xs only
• Add 45° trend lines for support/resistanceAdd 45° trend lines for support/resistance
• Consider using moving averagesConsider using moving averages
• Add a few targetsAdd a few targets
• Explain what the chart meansExplain what the chart means
So what should you do now?So what should you do now?
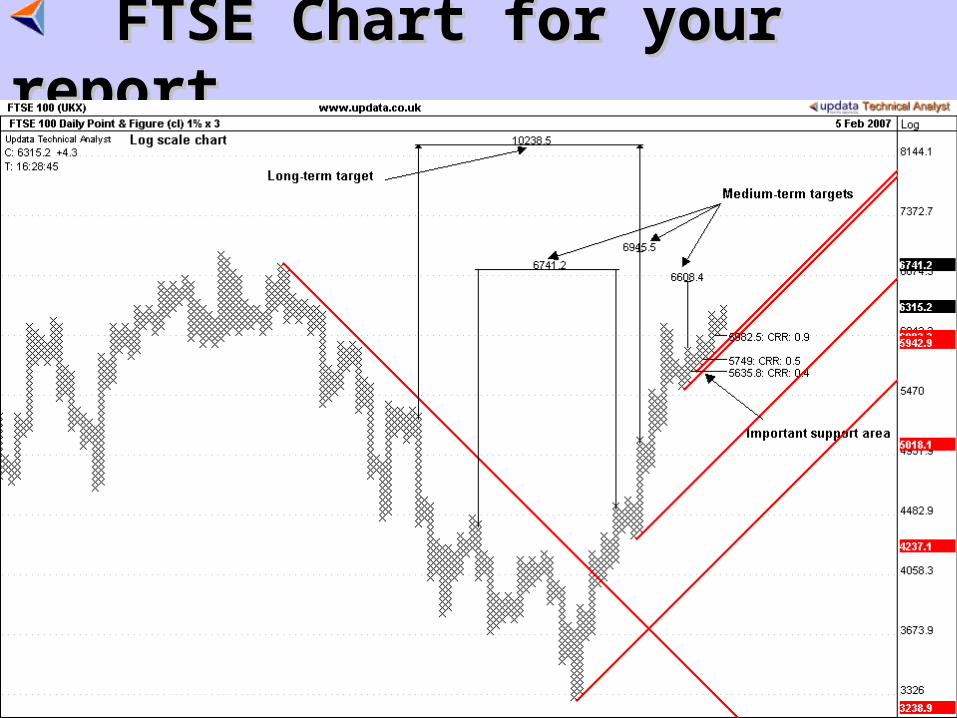
FTSE Chart for your reportFTSE Chart for your report
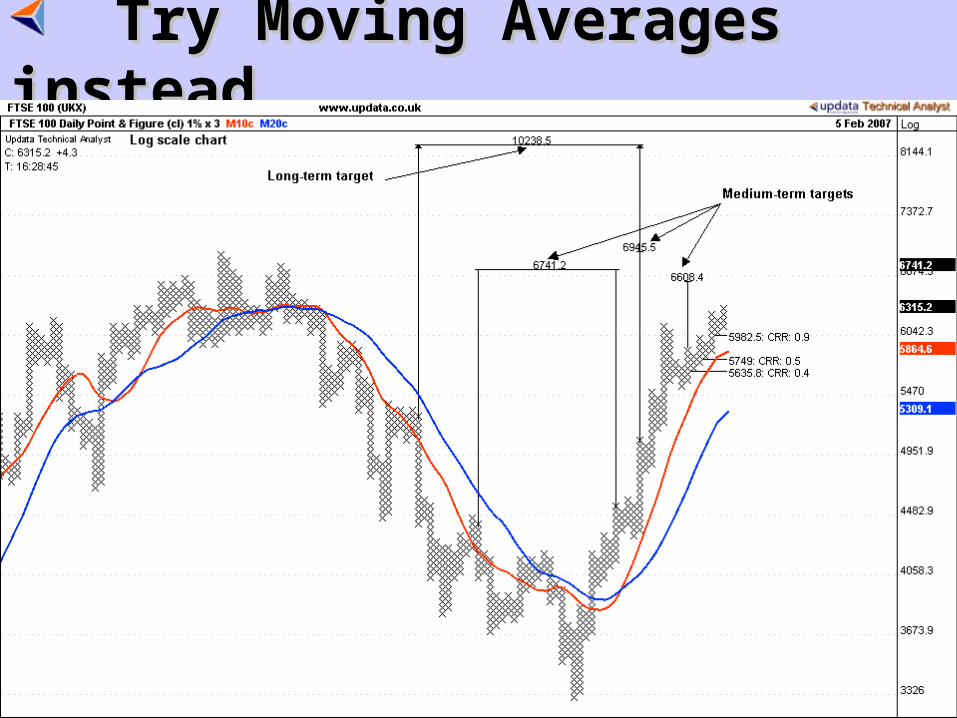
Try Moving Averages insteadTry Moving Averages instead
Include some FibonacciInclude some Fibonacci
Extensions or RetracmentsExtensions or Retracments
And if you really want to ....And if you really want to ....
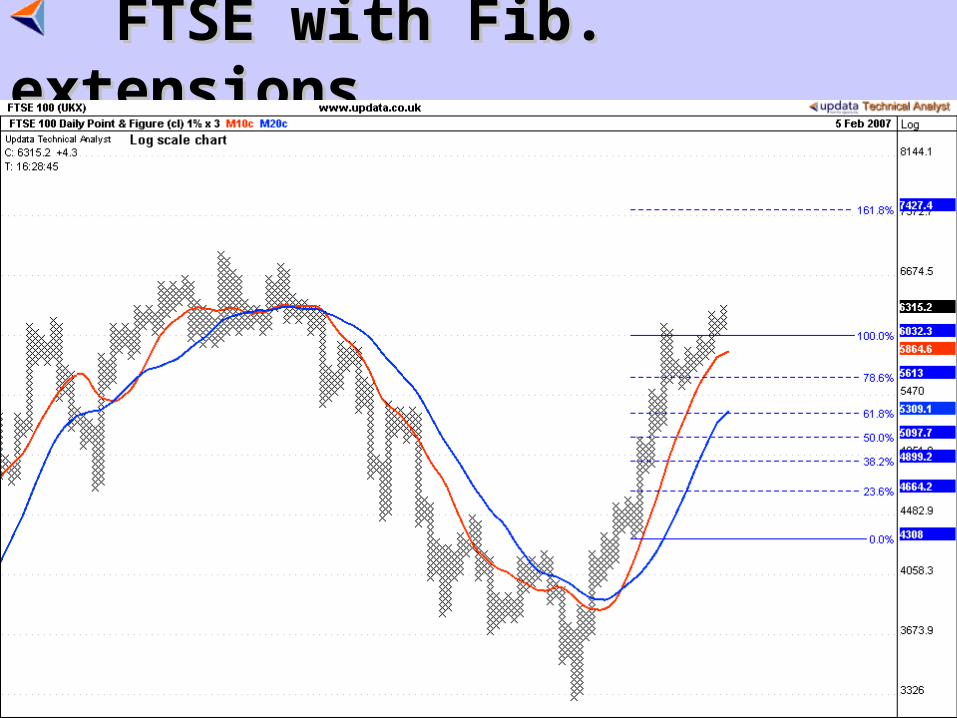
FTSE with Fib. extensionsFTSE with Fib. extensions
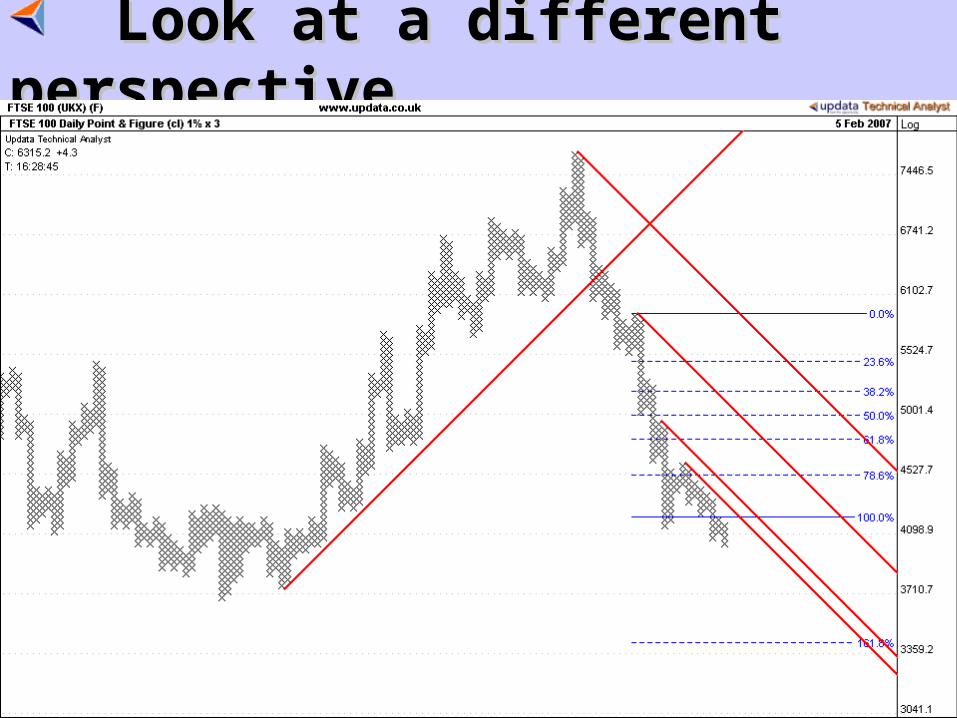
Look at a different perspectiveLook at a different perspective
Your analysis willYour analysis will
stand out from the crowd !stand out from the crowd !
Email: [email protected]: [email protected]
The result is…..The result is…..