Embed Size (px)
Citation preview
D 858
Energy efficient Recycling of in-plant fines in rotary
Hearth Furnace
Amanda Persson, Swerea MEFOS Hesham Ahmed, LTU
Slutrapport JK 21068, utgiven 2014-11-25

Foto: Stig-Göran Nilsson och Mats Hillert
Slutrapport JK 21068 2014-11-25 (ISSN 0280-249X)
Abstract At full production in the SSAB EMEA steel plants in Sweden, around 97 ktonne sludge and dust generated during cleaning of process gases in iron-and steelmaking processes are annually put on landfill or intermediate storage. These by-products contain high levels of iron (Fe) and carbon (C) that potentially could be recovered to replace some of the virgin materials in the blast furnace process. Energy efficient recycling of in-plant fines in rotary hearth furnace JK21068 was started in spring 2012 as a research collaboration between Swerea MEFOS and Luleå University of Technology together with the industry partners LKAB, SSAB EMEA and SSAB Merox. The main objective of this study was to investigate the possibilities to recover energy and valuable components as Fe and C in these by-products and thereby reduce the need for landfill at the steel plants. Although some of the generated BF-dust can be recycled via cold-bonded briquettes in blast furnace, the majority of these by-products cannot be recycled directly in the iron- or steelmaking processes due to the presence of impurity compounds that are harmful for the processes as well as unsuitable physical properties that makes handling difficult. In this project, the method of producing agglomerates suitable for self-reduction during heat treatment and possible recycling via the desulphurization plant and/or blast furnace was investigated. To enable design of suitable recipes, fundamental characterization studies on reduction behavior of by-products in blends and separately was conducted in the initial part of the project as well as studies on the reaction mechanisms of blends with iron oxides and different carbon-containing materials. Based on these results, self-reducing agglomerates were produced and their reduction behavior studied to establish the technology to produce agglomerates with chemical- and physical properties suitable for DRI (Direct Reduced Iron) production. The reduction properties of agglomerates have been investigated with respect to impurity content and mechanical strength after thermal treatment as well as the possibilities of reaching 70-90% reduction degree in the produced DRI. Moreover, the process impact when charging reduced agglomerates in hot metal ladle before desulphurization as well as the reduction behavior of charged self-reducing agglomerates and DRI/LRI during descent in the blast furnace was investigated within this study. Conducted studies have shown that the reduction progress of studied recipes of both blend- and agglomerates were found to proceed in accordance with seen behavior of mixtures with carbonaceous materials and iron oxide, namely through three consecutive reduction steps; hematite to magnetite, magnetite to wustite and wustite to metallic iron. At low temperatures, the reduction was shown to be controlled by mainly reaction rate of carbon gasification whereas mass gas diffusion becomes more important at higher temperatures. Furthermore, carbonaceous materials characterization as well as reduction behavior studies of simple mixtures with hematite and by-product blends have indicated that utilization of BF-dust as reductant in self-reducing mixtures with iron- and steelmaking dust and sludge bring comparable results relative to charcoal, coke and graphite. Agglomeration trials have shown that agglomerates with sufficient mechanical properties for further processing can be produced by using appropriate recipes for pellet and briquette production. The agglomerates could be reduced to 50-80% reduction degree at operating temperatures of 1100-1200°C with simultaneous reduced contents of Zn to ~3% of input values. However, the material handling and briquette production can be further improved to avoid inhomogeneities and voids in the briquettes. It was also noted that briquettes discharged from the reduction furnace at 500-
Slutrapport JK 21068 2014-11-25 (ISSN 0280-249X)
600°C was oxidized and the cooling process should be conducted in reducing or inert atmosphere down to temperatures of approximately 200-300°C. Moreover, reduction results from laboratory studies have also indicated that heating rate, inert gas flow rate and atmosphere are important parameters for the reduction process that need to be considered when choosing reduction conditions. Recycling of produced DRI was tested by charging 200-400 kg pre-reduced agglomerates in ladle before charging hot metal from the torpedo car. For test- and reference heats, no deslagging was done when the ladle arrived at the desulphurization plant and the desulphurization of hot metal was run with target for 0.001% sulphur by injection of both Mg and CaC2. Based on the results from test- and reference heats, no negative effects on iron losses or iron quality could be correlated to the addition of DRI and the tested method was shown to work well. This was shown despite that it was indicated that un-melted briquettes were floating on the slag when the ladle arrived at the desulphurization plant when adding 400 kg agglomerates. This amount is equivalent to an addition of ~0.31% in each ladle and an annual recycling potential of around 12 ktonne, which is corresponding to 35 GWh/year. This can be compared with 70-72 ktonne that annually can be produced from materials available for recycling at SSAB EMEA integrated steel plants. Thus, the results are showing that 17% of the total amount can be recycled but to further investigate the possible recycling via this method, additional studies are suggested involving charging of larger amounts/ladle for a larger number of heats. Alternatively, in case of a stated upper limit, charging of pellets instead of briquettes could be studied to see if the melting progress could be improved and thereby enabling greater amounts to be charged in each ladle. Studies on reduction behavior of pellet in the blast furnace process have shown that pre-reduction of cold bonded waste material agglomerates is not necessary with respect to reduction. Tendencies of re-oxidation have been indicated in samples with high pre-reduction degree. Pre-reduction is desirable if low contents of impurities such as Zn are preferable, or alternatively, the pellet recipes can be adjusted to only include by-products with low Zn-contents. Despite the indicated tendencies of re-oxidation during descent in the blast furnace, charging of metallic scrap or DRI in blast furnace will still contribute to reduced energy consumption in terms of lower consumption of coke and coal according to experience from industrial processes. Thus, the results are indicating that charging either pre-reduced or green pellets will in both cases contribute to improved material- or energy efficiency by reducing the need of raw materials. Results from these studies indicates that the possibilities of recovering valuable components and energy in currently landfilled iron- and steelmaking dust and sludge via studied recycling routes are promising. The results from this study show that at least 17% of the recoverable amounts can be recycled via the desulphurization route. It is expected that further investigations on selective agglomeration and charging to the most appropriate processes will enable recycling of the remaining 83%. For getting new knowledge, it is required to;
• Study if recipes for the desulphurization ladle can be designed to contain S-containing materials and if by-products with lower S can be recycled at the BOF.
• Study if agglomerates recycled via the blast furnace process could be designed to contain by-products with low Zn-contents and thereby reduce the need of a pre-reduction step.

Slutrapport JK 21068 2014-11-25 (ISSN 0280-249X)
• Study if the melting process can be improved when charging pellets instead of briquettes in the hot metal ladle before desulphurization and thus, increase the allowable amount that can be recycled via this route.
Keywords: : Iron rich waste materials, Carbon composite mixtures, Self-reducing mixtures, Thermogravimetery, BF dust and sludge, BOF dust and sludge, Heating microscope, Mass spectroscopy, Iron oxide reduction, Zinc and lead removal

Slutrapport JK 21068 2014-11-25 (ISSN 0280-249X)
Sammanfattning Vid full råjärnsproduktion i SSAB EMEAs stålverk i Sverige genereras omkring 97 kton stoft och slam som årligen deponeras eller sätts på mellanlagring. Dessa restprodukter innehåller höga halter av järn (Fe) och kol (C) som via återvinning skulle kunna ersätta en del av jungfruligt material i masugnsprocessen.
Energieffektiv återvinning av stoft och slam via direkt reduktion i roterande ugn (RHF) JK21068 startades våren 2012 som ett gemensamt forskningsprojekt mellan Swerea MEFOS och Luleå Tekniska Universitet samt industriparterna LKAB, SSAB EMEA och SSAB Merox. Huvudsyftet med denna studie var att undersöka möjligheterna att återvinna värdefullt Fe och C i dessa restprodukter och därmed minska behovet av deponier vid stålverken. Trots att en del av genererat hyttsot kan återvinnas via kallbundna briketter i masugn så kan huvuddelen av dessa restprodukter inte återvinnas direkt i järn- eller stålframställningsprocesser på grund av innehåll av föroreningar som har negativ inverkan på järn- och stålframställningen såväl som fysikaliska egenskaper som gör hanteringen svår. I detta projekt har en metod för att kunna producera agglomerat lämpliga för självreduktion under värmebehandling och eventuell återanvändning via svavelrening av råjärn och/eller masugn undersökts.
För val av lämpliga recept på restproduktblandningar inleddes projektet med karaktärisering av restprodukters reaktionsbeteende separat och i blandning samtidigt som reaktionsmekanismer i blandningar mellan järnoxid och olika kolinnehållande material undersöktes. Baserat på resultaten har agglomerat av stoft och slam producerats och deras själreducerande egenskaper undersökts både i laboratorie- och pilotskala. Reduktionsegenskaperna hos agglomerat har undersökts med avseende på innehåll av föroreningar och mekanisk hållfasthet efter värmebehandling, reaktionsmekanismer samt möjligheterna att uppnå reduktionsgrader motsvarande 70-90%. Vidare, har två möjliga processvägar för återföring undersökts. En metod för att möjliggöra återföring av reducerade agglomerat utan signifikanta processtörningar avseende chargering av DRI i skänk före svavelrening har studerats. Inom detta projekt har även reduceringsförhållanden för självreducerande- samt förreducerade agglomerat studerats genom tillsats i LKABs experimentmasugn.
Resultaten från inledande studier i laboratorieskala visar att reduktionsförloppet av studerade recept för både blandningar och agglomerat är jämförbara med motsvarande andel järnoxid och kolinnehållande material. Reduktionen har indikerats att ske i följande steg; hematit till magnetit, magnetit till wustit samt wustit till metalliskt järn. Studierna har även indikerat att egenskaperna hos hyttsot som reduktionsmaterial i självreducerande blandningar resulterar i jämförbara resultat motsvarande blandningar med träkol, koks och grafit. Agglomereringsförsök har visat att agglomerat med tillräckliga mekaniska egenskaper för materialhantering och återföring kan produceras utifrån utvalda restprodukter. Värmebehandling av agglomerat vid 1100-1200°C resulterade i reduktionsgrader motsvarande 50-80% samt ett minskat innehåll av Zn till ≈3% av ingångsvärdet. Studierna har även visat att materialhantering i samband med brikettering samt själva metoden för briketteringen kan förbättras ytterligare för att undvika inhomogeniteter och håligheter i briketterna. Resultat från reduktionsförsök har även indikerat att briketter återoxiderades i samband med uttag från ugn vid temperaturer omkring 500-600°C. Av den anledningen bör kylning ske under inert eller reducerande atmosfär ner till 200-300°C. Vidare har fördjupande studier i laboratorieskala indikerat att uppvärmningstakt, inert gasflöde samt ugnsatmosfär har
Slutrapport JK 21068 2014-11-25 (ISSN 0280-249X)
betydelse på reduktionsförloppet och måste därför tas hänsyn till i samband med val och optimering av reduktionsförhållanden.
Återföring av DRI prövades genom att tillsätta 200-400 kg förreducerade agglomerat i råjärnsskänk innan omhällning av råjärn från torpedo. För försöks- och referenscharger gjordes ingen förslaggning innan injektion och råjärnet svavelrenades genom injektion av Mg och CaC2 med avsikt att få ner svavelhalten till 0.001%. Baserat på resultaten bedöms metoden ha fungerat bra och ingen negativ effekt på råjärnsförluster eller råjärnskvalitet kunde korreleras till tillsatsen. Detta trots att det indikerades osmälta briketter flytandes på slaggen då skänken anlände till svavelreningsstationen vid tillsats av 400 kg agglomerat. Denna mängd är jämförbar med ≈0,31% tillsats i skänk och motsvarar en årlig återföringspotential av producerad DRI på omkring 12 kton motsvarande 35 GWh/år. Det kan jämföras med 70-72 kton DRI som årligen kan tillverkas av fallande restprodukter vid SSAB EMEAs stålverk vilket innebär att för den studerade metoden har det visats att 17% av den totala mängden kan återföras. För att få bättre kännedom om vilken mängd som begränsar återvinningskapaciteten av den studerade metoden föreslås ytterligare studier med chargering av större mängder och för fler charger. Alternativt skulle chargering av pellets istället för briketter kunna studeras för att undersöka om insmältningsförloppet kan förbättras och på så vis göra det möjligt att chargera större mängder i varje skänk.
Studerade reduktionsegenskaper på pellets i masugnsprocessen visar att förereducering av kallbundna restproduktpellets inte krävs med avseende på reduktion. En viss återreduktion av väl förreducerade agglomerat kunde noteras. Dock är förreduktion är att föredra om låga ingående halter på Zn eftersträvas, alternativt kan recepten justeras för att endast inkludera restprodukter i pellets med lågt Zn-innehåll. Trots indikerad tendens till återreduktion av förreducerade pellets bidrar tillsats av metalliskt skrot eller DRI i masugn ändå till minskad förbrukning av koks och kolpulver enligt erfarenhet från industriell drift. Det innebär att tillsats av antingen oreducerade- eller förreducerade pellets har potential att öka material- och energieffektiviteten genom minskat behov av råmaterial och fossilt kol.
Via de studerade återföreningsmetoderna visar resultaten på lovande möjligheter att nyttiggöra kol- och järnresurser samt energi ur stoft och slam som för nuvarande deponeras vid svenska integrerade stålverk. De mängder DRI som har tillsatts i skänk före svavelrening inom dessa försök motsvarar en återvinning omkring 17% av den totala mängden stoft och slam som deponeras. Det bedöms att fortsatta studier skulle kunna möjliggöra ytterligare återvinning. Genom selektiv agglomerering och återföring av respektive material eller materialblandningar till de mest lämpliga processerna samt genom modifierad återföringsmetod vid svavelreningen bedöms att återvinning av de återstående 83% av restprodukterna och energieffektiviseringen kan nås. Ny kunskap som krävs skulle kunna nås genom att;
• Studera om recept avsedda för återföring via råjärnsskänk kan utformas med restprodukter innehållande höga svavelhalter och om restprodukter med låga svavelhalter kan återvinnas genom tillsatts i LD-processen
• Studera om agglomerat med innehåll av låga Zn-halter kan utformas för återvinning via masugnsprocessen och därmed minska behovet av förbehandling.
• Studera om insmältningsförloppet kan förbättras genom att chargera pellets istället för briketter i råjärnsskänk före svavelrening och på så vis öka den tillåtna mängden som kan reduceras via den metoden

Slutrapport JK 21068 2014-11-25 (ISSN 0280-249X)
Sökord: Järnrika avfall, kol-kompositblandningar, självreducerande blandningar, termogravimetri, Damm, Slam, Masugn, Konverter, värme mikroskop, masspektroskopi, Järnoxidreduktion, Zink, Bly

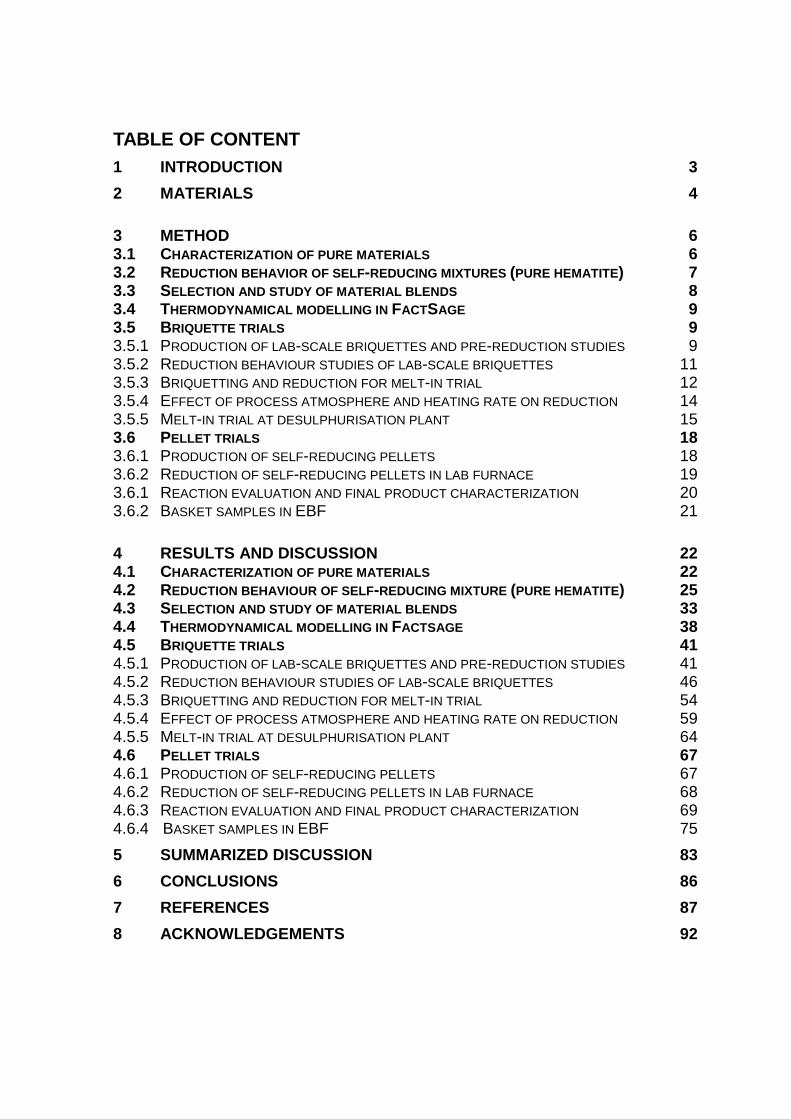
TABLE OF CONTENT 1 INTRODUCTION 3 2 MATERIALS 4
3 METHOD 6 3.1 CHARACTERIZATION OF PURE MATERIALS 6 3.2 REDUCTION BEHAVIOR OF SELF-REDUCING MIXTURES (PURE HEMATITE) 7 3.3 SELECTION AND STUDY OF MATERIAL BLENDS 8 3.4 THERMODYNAMICAL MODELLING IN FACTSAGE 9 3.5 BRIQUETTE TRIALS 9 3.5.1 PRODUCTION OF LAB-SCALE BRIQUETTES AND PRE-REDUCTION STUDIES 9 3.5.2 REDUCTION BEHAVIOUR STUDIES OF LAB-SCALE BRIQUETTES 11 3.5.3 BRIQUETTING AND REDUCTION FOR MELT-IN TRIAL 12 3.5.4 EFFECT OF PROCESS ATMOSPHERE AND HEATING RATE ON REDUCTION 14 3.5.5 MELT-IN TRIAL AT DESULPHURISATION PLANT 15 3.6 PELLET TRIALS 18 3.6.1 PRODUCTION OF SELF-REDUCING PELLETS 18 3.6.2 REDUCTION OF SELF-REDUCING PELLETS IN LAB FURNACE 19 3.6.1 REACTION EVALUATION AND FINAL PRODUCT CHARACTERIZATION 20 3.6.2 BASKET SAMPLES IN EBF 21
4 RESULTS AND DISCUSSION 22 4.1 CHARACTERIZATION OF PURE MATERIALS 22 4.2 REDUCTION BEHAVIOUR OF SELF-REDUCING MIXTURE (PURE HEMATITE) 25 4.3 SELECTION AND STUDY OF MATERIAL BLENDS 33 4.4 THERMODYNAMICAL MODELLING IN FACTSAGE 38 4.5 BRIQUETTE TRIALS 41 4.5.1 PRODUCTION OF LAB-SCALE BRIQUETTES AND PRE-REDUCTION STUDIES 41 4.5.2 REDUCTION BEHAVIOUR STUDIES OF LAB-SCALE BRIQUETTES 46 4.5.3 BRIQUETTING AND REDUCTION FOR MELT-IN TRIAL 54 4.5.4 EFFECT OF PROCESS ATMOSPHERE AND HEATING RATE ON REDUCTION 59 4.5.5 MELT-IN TRIAL AT DESULPHURISATION PLANT 64 4.6 PELLET TRIALS 67 4.6.1 PRODUCTION OF SELF-REDUCING PELLETS 67 4.6.2 REDUCTION OF SELF-REDUCING PELLETS IN LAB FURNACE 68 4.6.3 REACTION EVALUATION AND FINAL PRODUCT CHARACTERIZATION 69 4.6.4 BASKET SAMPLES IN EBF 75 5 SUMMARIZED DISCUSSION 83 6 CONCLUSIONS 86 7 REFERENCES 87 8 ACKNOWLEDGEMENTS 92

3
1 INTRODUCTION Efficient utilization of virgin materials such as iron ore, coal and coke is important to enable energy efficient iron- and steelmaking and to decrease the costs of raw materials and for landfilling at Swedish steel plants. In addition, the available sites for landfills are decreasing which limits the amount of by-products than can be landfilled. At full production, SSAB EMEA AB integrated steel plants in Sweden generates around 97 ktonne dust and sludge from cleaning of process gases that annually are put to landfill or intermediate storage. These by-products contain significant amounts of iron and carbon that could be used as replacement for virgin materials by recycling in existing iron-and steelmaking processes. The annual landfilled amount of carbon within these by-products corresponds to a calculated energy value of 253 GWh and thus, internal recycling could therefore benefit the material- and energy efficiencies as well as reduce the costs of landfilling and need of available landfill sites at Swedish integrated steel plants. However, due to high levels of impurity elements such as Zn, Pb and alkalis as well as unsuitable physical properties that makes handling difficult, direct recycling by charging briquettes in the blast furnace is not possible.
Different recycling alternatives and characterization of these by-products have been investigated previously. For instance, a part of the blast furnace dust produced in Sweden is recycled via cold-bonded briquettes or injection in the blast furnace as a result from internal studies performed by SSAB EMEA and SSAB MEROX. Characterization and formation studies of different steel- and iron making sludge and dust have previously been conducted by LTU and within the research centre MiMeR (Minerals and Metals Research centre). Properties of different cold-bonded briquettes and pellets have also been studied. Within JK21064, BOF-sludge and BF-sludge was treated in a tornado-process to investigate if impurities could be eliminated. Despite the possibility to dry materials effectively with low energy consumption, the content of Zn in BF-sludge could not be sufficiently decreased. Furthermore, SSAB EMEA have in collaboration with MiMeR produced pellets made of by-products to test in blast furnace and BOF-converter. However, due to already quite high Zn load in the BF, both BOF and BF-sludge has to be recycled via another route. Alternatively, to enable internal recycling in the blast furnace for these by-products, a method must be identified where the Zn-content can be significantly reduced.
Producing agglomerates with self-reducing properties for production of DRI (Direct Reduced Iron) followed by charging in existing iron- or steelmaking processes has previously been suggested as a possible recycling method for dust and sludge that currently are landfilled. This method has the potential to utilize carbon and iron oxides within dust and sludge to produce DRI that can be used as replacement for scrap and thus reduce the need of virgin materials. In addition, production of DRI by heat treatment might also contribute to significant reduction of Zn, which enables introduction of by-products with high Zn-contents in the blast furnace. In fact, BOF-sludge and BF-sludge in combination with carbon-containing materials in agglomerates have not been investigated previously. The energy saving potential by charging produced DRI in hot metal ladle before desulphurisation have been calculated to 209 GWh/year.
4
To establish if iron - and carbon bound in generated dust and sludge can be utilized in an energy efficient way by this suggested method, the possibilities to produce agglomerates with chemical- and physical properties suitable for self-reduction must be studied. Other essential aspects to investigate are the reduction properties and extent of impurity elimination that can be achieved during thermal treatment of these agglomerates. Moreover, possible process impacts when charging produced DRI in the hot metal ladle must also be considered as well as the reduction conditions of DRI/LRI in the blast furnace process. In this study, reduction behaviour studies on different by-product mixtures and blends with pure chemicals will be conducted in laboratory scale to support the choice of suitable recipes for DRI production and to investigate the reaction mechanisms of self-reducing mixtures. The effect of carbon source within self-reducing mixtures will be established by means of studies on reaction mechanisms for different carbon bearing materials. Based on these results, agglomerates with self-reducing properties will be produced to study the possibilities to reduce iron and eliminate impurities as well as the reduction behaviour under different reducing conditions. The mechanical strength for handling before and after reduction will also be considered. The recycling route by charging DRI in hot metal ladle before desulphurisation will be studied by means of agglomeration in industrial scale followed by reduction in pilot scale. A method for charging the reduced briquettes in the hot metal ladle will be developed and evaluated with main focus to study if the chosen method will cause any significant process impacts. Furthermore, self-reducing pellets will be produced from selected by-products and studied with respect to reduction behaviour under inert atmosphere and under blast furnace conditions. The latter will include both green- and pre-reduced by charging basket samples containing in LKABs EBF (Experimental Blast Furnace). 2 MATERIALS The following materials have been considered within this project;
- Blast furnace sludge and dust (BF-sludge, BF-dust) - BOF fine sludge - A mixture consisting of BOF- and desulphurisation dust - Chemical grade graphite, charcoal and industrial coke - Chemical grade hematite
Carbon-containing materials including BF-dust have been used for carbonaceous material characterization as well as in reduction studies together with chemical grade hematite. Industrial coke and by-products were provided by SSAB MEROX while cchemical grade graphite (Crystalline, 99%, -300 mesh powder) and Activated charcoal Guaranteed Reagent (GR) were purchased from Alfa (a Johnson Matthey company, GmbH) and Merck, respectively. The aim of using pure materials is to be able to explain reaction phenomena occurring in the complex blends of waste material.
5
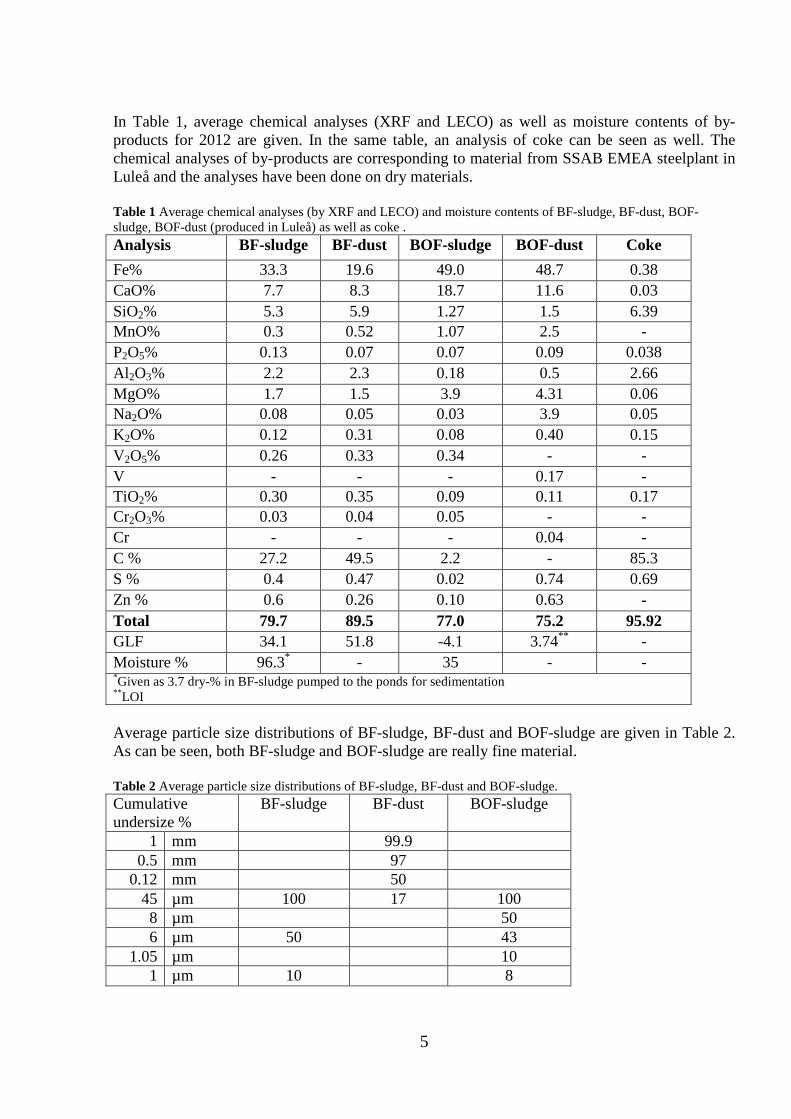
In Table 1, average chemical analyses (XRF and LECO) as well as moisture contents of by-products for 2012 are given. In the same table, an analysis of coke can be seen as well. The chemical analyses of by-products are corresponding to material from SSAB EMEA steelplant in Luleå and the analyses have been done on dry materials. Table 1 Average chemical analyses (by XRF and LECO) and moisture contents of BF-sludge, BF-dust, BOF-sludge, BOF-dust (produced in Luleå) as well as coke . Analysis BF-sludge BF-dust BOF-sludge BOF-dust Coke Fe% 33.3 19.6 49.0 48.7 0.38 CaO% 7.7 8.3 18.7 11.6 0.03 SiO2% 5.3 5.9 1.27 1.5 6.39 MnO% 0.3 0.52 1.07 2.5 - P2O5% 0.13 0.07 0.07 0.09 0.038 Al2O3% 2.2 2.3 0.18 0.5 2.66 MgO% 1.7 1.5 3.9 4.31 0.06 Na2O% 0.08 0.05 0.03 3.9 0.05 K2O% 0.12 0.31 0.08 0.40 0.15 V2O5% 0.26 0.33 0.34 - - V - - - 0.17 - TiO2% 0.30 0.35 0.09 0.11 0.17 Cr2O3% 0.03 0.04 0.05 - - Cr - - - 0.04 - C % 27.2 49.5 2.2 - 85.3 S % 0.4 0.47 0.02 0.74 0.69 Zn % 0.6 0.26 0.10 0.63 - Total 79.7 89.5 77.0 75.2 95.92 GLF 34.1 51.8 -4.1 3.74** - Moisture % 96.3* - 35 - - *Given as 3.7 dry-% in BF-sludge pumped to the ponds for sedimentation **LOI Average particle size distributions of BF-sludge, BF-dust and BOF-sludge are given in Table 2. As can be seen, both BF-sludge and BOF-sludge are really fine material. Table 2 Average particle size distributions of BF-sludge, BF-dust and BOF-sludge. Cumulative undersize %
BF-sludge BF-dust BOF-sludge
1 mm 99.9 0.5 mm 97
0.12 mm 50 45 µm 100 17 100 8 µm 50 6 µm 50 43
1.05 µm 10 1 µm 10 8
6
3 METHOD 3.1 Characterization of pure materials
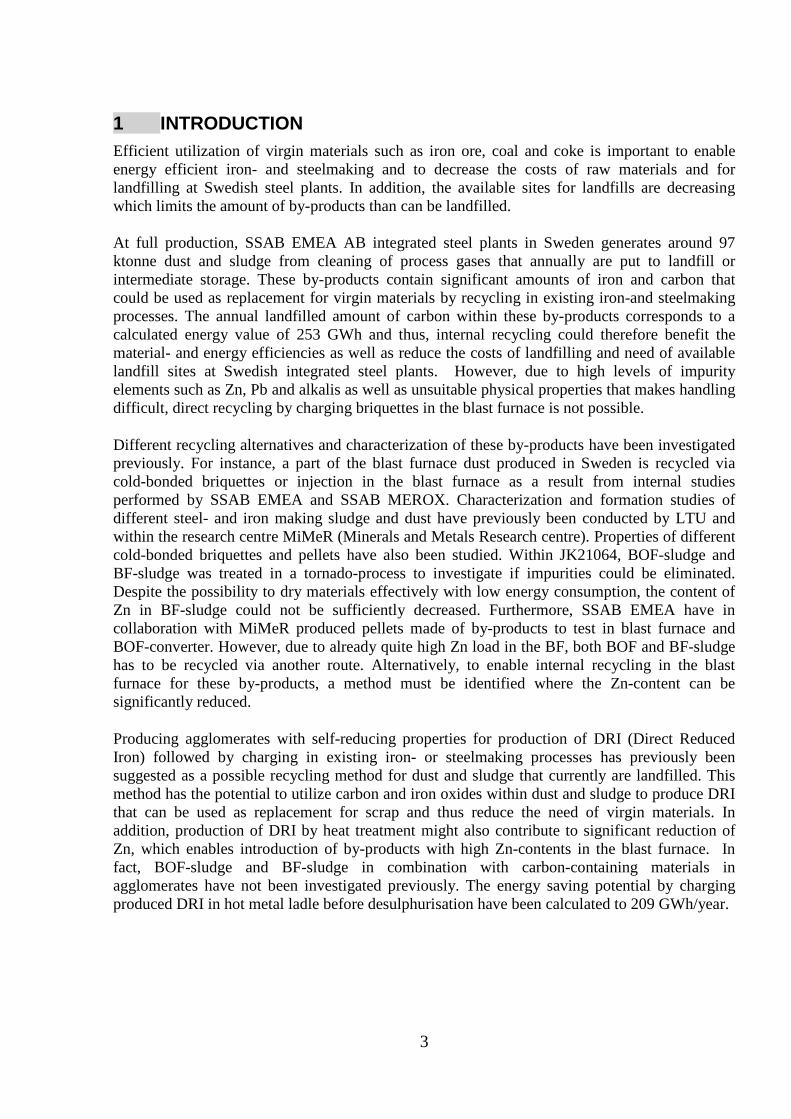
Carbon bearing materials were used as received except for coke. Representative sample of provided coke was prepared using manual sampler, 3 kg in total were first subjected to crushing using jaw crusher, then pulverized in a pulverizer and sieved into several fractions ranging from -53 to +150 µm (see Figure 1).
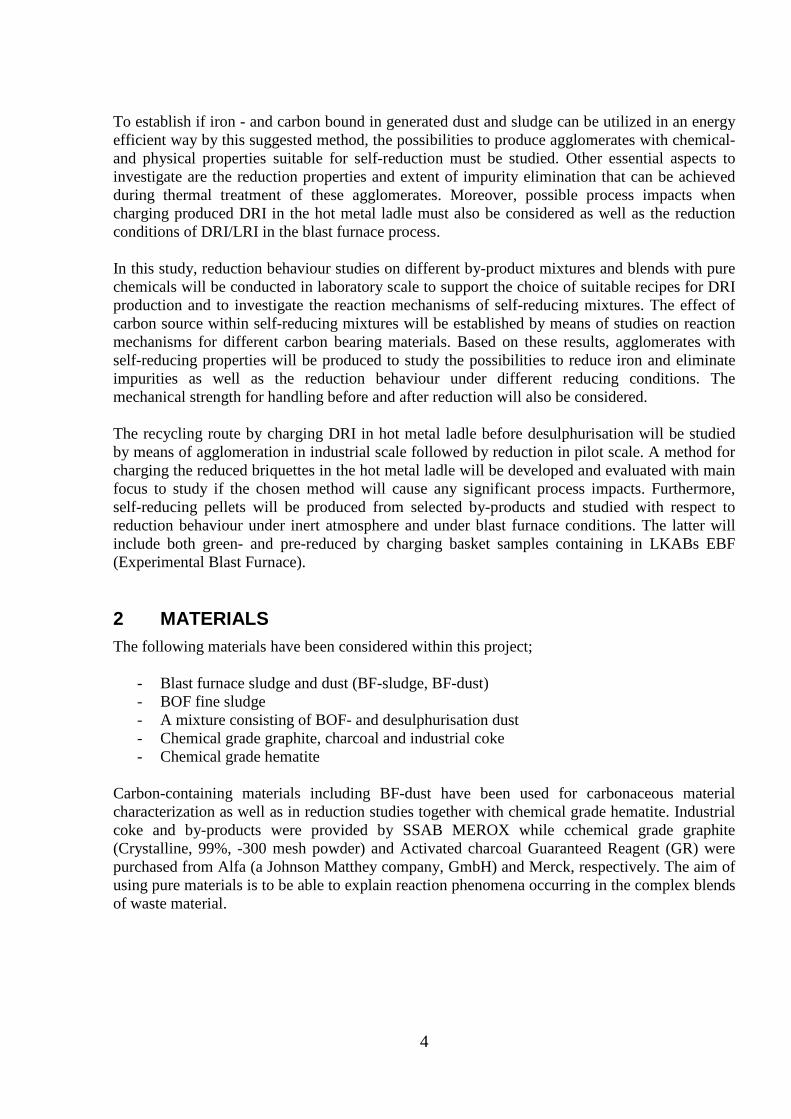
Particle sizes of used materials were determined by CILAS laser based particle size analyzer, with measuring of particles less than 300 µm (CILAS, Micromeritics Instrument Corporation, USA), see Figure 2.
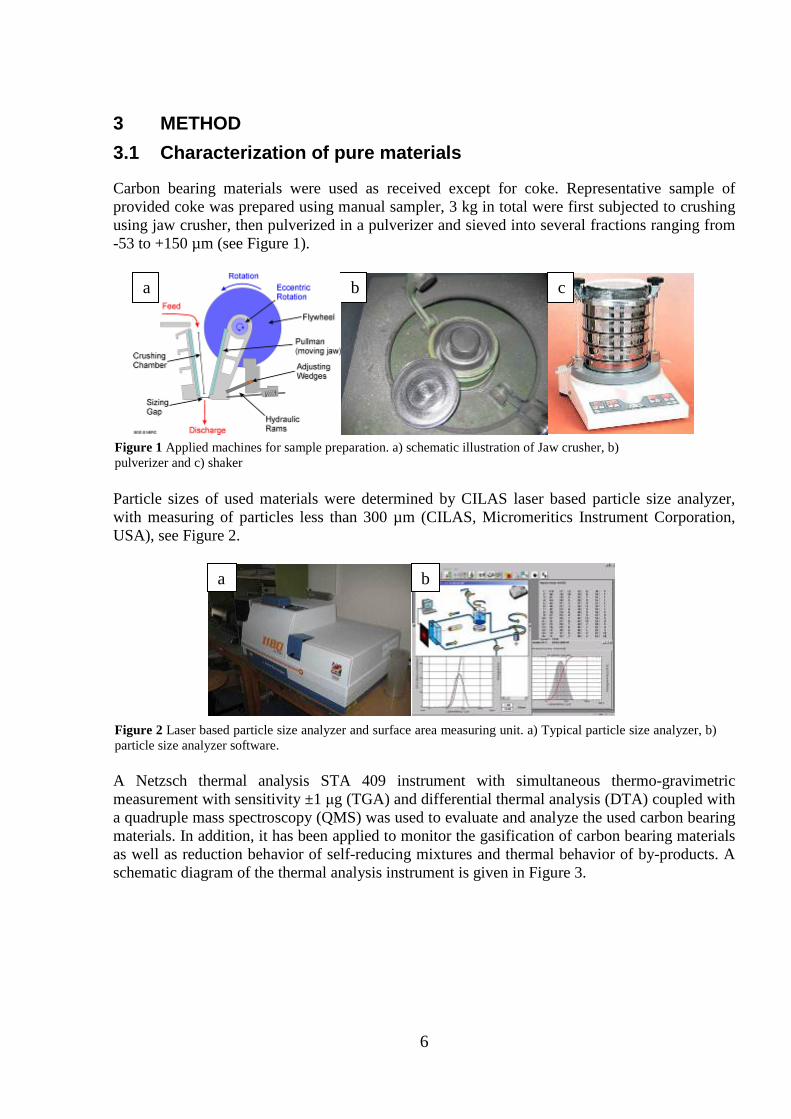
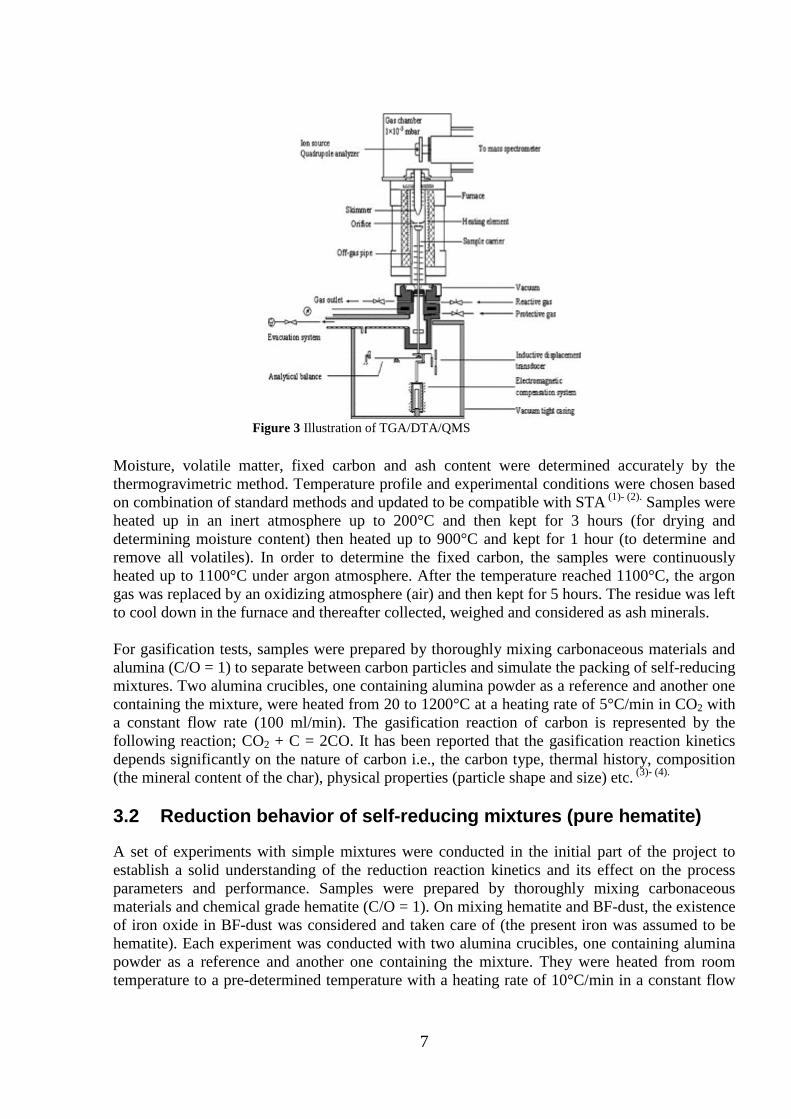
A Netzsch thermal analysis STA 409 instrument with simultaneous thermo-gravimetric measurement with sensitivity ±1 μg (TGA) and differential thermal analysis (DTA) coupled with a quadruple mass spectroscopy (QMS) was used to evaluate and analyze the used carbon bearing materials. In addition, it has been applied to monitor the gasification of carbon bearing materials as well as reduction behavior of self-reducing mixtures and thermal behavior of by-products. A schematic diagram of the thermal analysis instrument is given in Figure 3.
b c a
a b
Figure 1 Applied machines for sample preparation. a) schematic illustration of Jaw crusher, b) pulverizer and c) shaker
Figure 2 Laser based particle size analyzer and surface area measuring unit. a) Typical particle size analyzer, b) particle size analyzer software.
7
Moisture, volatile matter, fixed carbon and ash content were determined accurately by the thermogravimetric method. Temperature profile and experimental conditions were chosen based on combination of standard methods and updated to be compatible with STA (1)- (2). Samples were heated up in an inert atmosphere up to 200°C and then kept for 3 hours (for drying and determining moisture content) then heated up to 900°C and kept for 1 hour (to determine and remove all volatiles). In order to determine the fixed carbon, the samples were continuously heated up to 1100°C under argon atmosphere. After the temperature reached 1100°C, the argon gas was replaced by an oxidizing atmosphere (air) and then kept for 5 hours. The residue was left to cool down in the furnace and thereafter collected, weighed and considered as ash minerals. For gasification tests, samples were prepared by thoroughly mixing carbonaceous materials and alumina (C/O = 1) to separate between carbon particles and simulate the packing of self-reducing mixtures. Two alumina crucibles, one containing alumina powder as a reference and another one containing the mixture, were heated from 20 to 1200°C at a heating rate of 5°C/min in CO2 with a constant flow rate (100 ml/min). The gasification reaction of carbon is represented by the following reaction; CO2 + C = 2CO. It has been reported that the gasification reaction kinetics depends significantly on the nature of carbon i.e., the carbon type, thermal history, composition (the mineral content of the char), physical properties (particle shape and size) etc. (3)- (4). 3.2 Reduction behavior of self-reducing mixtures (pure hematite)
A set of experiments with simple mixtures were conducted in the initial part of the project to establish a solid understanding of the reduction reaction kinetics and its effect on the process parameters and performance. Samples were prepared by thoroughly mixing carbonaceous materials and chemical grade hematite (C/O = 1). On mixing hematite and BF-dust, the existence of iron oxide in BF-dust was considered and taken care of (the present iron was assumed to be hematite). Each experiment was conducted with two alumina crucibles, one containing alumina powder as a reference and another one containing the mixture. They were heated from room temperature to a pre-determined temperature with a heating rate of 10°C/min in a constant flow
Figure 3 Illustration of TGA/DTA/QMS
8
rate of Ar (100 ml/min). The samples were thereafter heated up to a pre-set temperature (750-1100°C with 50°C interval) and kept at that temperature for two hours for reduction completion. 3.3 Selection and study of material blends
In order to obtain agglomerates with self-reducing properties that after heat treatment can be recycled back to existing iron- or steelmaking processes, optimal blends has been sought. Recipe design has been based on chemical analyses given in Table 1. To have 100% release of reducible oxygen atoms in iron oxides and thus achieve 100% reduction degrees, the amount of free carbon in the blend must exceed the number of reducible oxygen atoms. For that reason, each by-product blend studied in this project has been designed to meet up this condition. As landfilling is a growing economical- and environmental issue for the steel plant, recipes was designed to account for the proportions of generated amounts. The idea was to study if a significant part of each generated by-product can be consumed in a blend suitable for recycling. Moreover, in a study by Su et al. (5), the BOF-sludge was indicated to have a positive effect on cold strength but the interaction between BF flue dust and BOF- sludge was shown to have a negative effect on reduction degree. This has also been accounted for during the recipe design of by-product blends. To summarize, the design of blends has mainly been based on the following conditions;
• Fixed relation between BOF-sludge, BOF-dust and BF-sludge • Content of BF-dust varied • Molar ratio of carbon to reducible oxygen should be larger than 1 (C/O>1) and Fe(tot) as
high as possible • Simulate available proportions of generated by-products
In Table A1 in Appendix, the annual landfilled amounts of BF-dust, BF-sludge, BOF-dust and BOF-sludge at SSAB EMEA steelplants in Luleå and Oxelösund during 2007/2008 and 2012 are given. At nearly full production in 2007-2008, the approximate proportions of these by-products that were produced and available for recycling were 34.2% BOF-sludge, 4.3% BOF-dust, 46.5% BF-sludge and 15.0% BF-dust. This was calculated by assuming 35% moisture in BOF-sludge and BF-sludge produced in Luleå and Oxelösund respectively. The proportions of dust and sludge in the designed recipes are found in Table 3. Table 3 Distribution of by-products in designed recipes B1-B4. Blend BF-dust (%) BF-sludge (%) BOF-sludge (%) BOF-dust1 (%) B1 0 40 58 2 B2 5 38 55.1 1.9 B3 10 36 52.2 1.8 B4 20 32 46.4 1.6 1Mixture of BOF-dust and desulphurisation dust. Designed by-product blends have been studied by means of thermal analysis by TG (see Figure 3) as well as in XRD for both green- and reduced blends. TG-runs were conducted under argon atmosphere with flow rate of 100 ml/min argon gas and with a heating rate of 10ºC/min. In addition, BOF-sludge, BOF-dust and BF-sludge have aslo been studied separately by XRD and TG/DTA within CAMM (Centre of Advanced Mining and Metallurgy).
9
3.4 Thermodynamical modelling in FactSage
The thermodynamical calculation tool FactSage 6.1 have been used to compare expected and actual weight losses achieved by thermal analysis to further study the reduction behaviour of the different blends. All calculations have been conducted in the equilibrium mode for the temperature range 25-1200ºC and at atmospheric pressure. Only gas and solid phases have been considered for the calculations. 3.5 Briquette trials
3.5.1 Production of lab-scale briquettes and pre-reduction studies
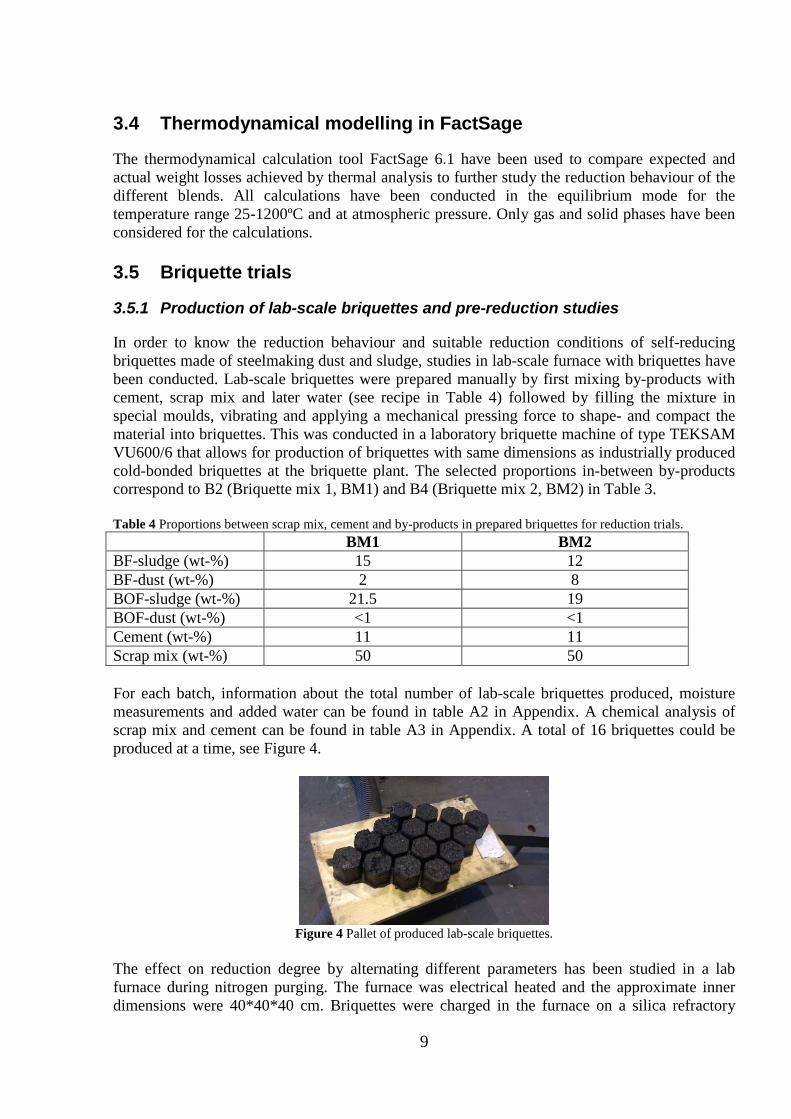
In order to know the reduction behaviour and suitable reduction conditions of self-reducing briquettes made of steelmaking dust and sludge, studies in lab-scale furnace with briquettes have been conducted. Lab-scale briquettes were prepared manually by first mixing by-products with cement, scrap mix and later water (see recipe in Table 4) followed by filling the mixture in special moulds, vibrating and applying a mechanical pressing force to shape- and compact the material into briquettes. This was conducted in a laboratory briquette machine of type TEKSAM VU600/6 that allows for production of briquettes with same dimensions as industrially produced cold-bonded briquettes at the briquette plant. The selected proportions in-between by-products correspond to B2 (Briquette mix 1, BM1) and B4 (Briquette mix 2, BM2) in Table 3. Table 4 Proportions between scrap mix, cement and by-products in prepared briquettes for reduction trials. BM1 BM2 BF-sludge (wt-%) 15 12 BF-dust (wt-%) 2 8 BOF-sludge (wt-%) 21.5 19 BOF-dust (wt-%) <1 <1 Cement (wt-%) 11 11 Scrap mix (wt-%) 50 50 For each batch, information about the total number of lab-scale briquettes produced, moisture measurements and added water can be found in table A2 in Appendix. A chemical analysis of scrap mix and cement can be found in table A3 in Appendix. A total of 16 briquettes could be produced at a time, see Figure 4.
Figure 4 Pallet of produced lab-scale briquettes.
The effect on reduction degree by alternating different parameters has been studied in a lab furnace during nitrogen purging. The furnace was electrical heated and the approximate inner dimensions were 40*40*40 cm. Briquettes were charged in the furnace on a silica refractory
10
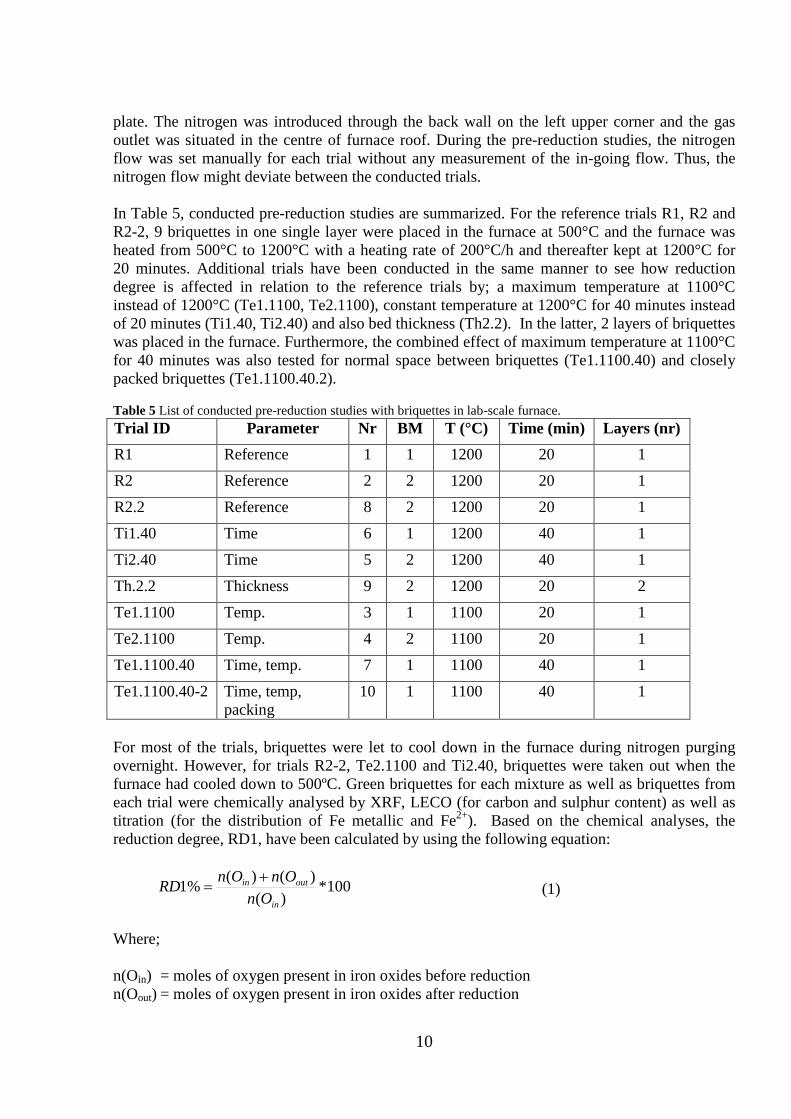
plate. The nitrogen was introduced through the back wall on the left upper corner and the gas outlet was situated in the centre of furnace roof. During the pre-reduction studies, the nitrogen flow was set manually for each trial without any measurement of the in-going flow. Thus, the nitrogen flow might deviate between the conducted trials. In Table 5, conducted pre-reduction studies are summarized. For the reference trials R1, R2 and R2-2, 9 briquettes in one single layer were placed in the furnace at 500°C and the furnace was heated from 500°C to 1200°C with a heating rate of 200°C/h and thereafter kept at 1200°C for 20 minutes. Additional trials have been conducted in the same manner to see how reduction degree is affected in relation to the reference trials by; a maximum temperature at 1100°C instead of 1200°C (Te1.1100, Te2.1100), constant temperature at 1200°C for 40 minutes instead of 20 minutes (Ti1.40, Ti2.40) and also bed thickness (Th2.2). In the latter, 2 layers of briquettes was placed in the furnace. Furthermore, the combined effect of maximum temperature at 1100°C for 40 minutes was also tested for normal space between briquettes (Te1.1100.40) and closely packed briquettes (Te1.1100.40.2). Table 5 List of conducted pre-reduction studies with briquettes in lab-scale furnace. Trial ID Parameter Nr BM T (°C) Time (min) Layers (nr) R1 Reference 1 1 1200 20 1
R2 Reference 2 2 1200 20 1
R2.2 Reference 8 2 1200 20 1
Ti1.40 Time 6 1 1200 40 1
Ti2.40 Time 5 2 1200 40 1
Th.2.2 Thickness 9 2 1200 20 2
Te1.1100 Temp. 3 1 1100 20 1
Te2.1100 Temp. 4 2 1100 20 1
Te1.1100.40 Time, temp. 7 1 1100 40 1
Te1.1100.40-2 Time, temp, packing
10 1 1100 40 1
For most of the trials, briquettes were let to cool down in the furnace during nitrogen purging overnight. However, for trials R2-2, Te2.1100 and Ti2.40, briquettes were taken out when the furnace had cooled down to 500ºC. Green briquettes for each mixture as well as briquettes from each trial were chemically analysed by XRF, LECO (for carbon and sulphur content) as well as titration (for the distribution of Fe metallic and Fe2+). Based on the chemical analyses, the reduction degree, RD1, have been calculated by using the following equation:
100*)(
)()(%1in
outin
OnOnOnRD +
= (1)
Where; n(Oin) = moles of oxygen present in iron oxides before reduction n(Oout) = moles of oxygen present in iron oxides after reduction
11
The results from the pre-reduction studies with lab-scale briquettes have been used as basis for choice of briquette recipe and suitable reduction conditions during preparations of briquettes for the industrial trial at SSAB in Luleå. 3.5.2 Reduction behaviour studies of lab-scale briquettes
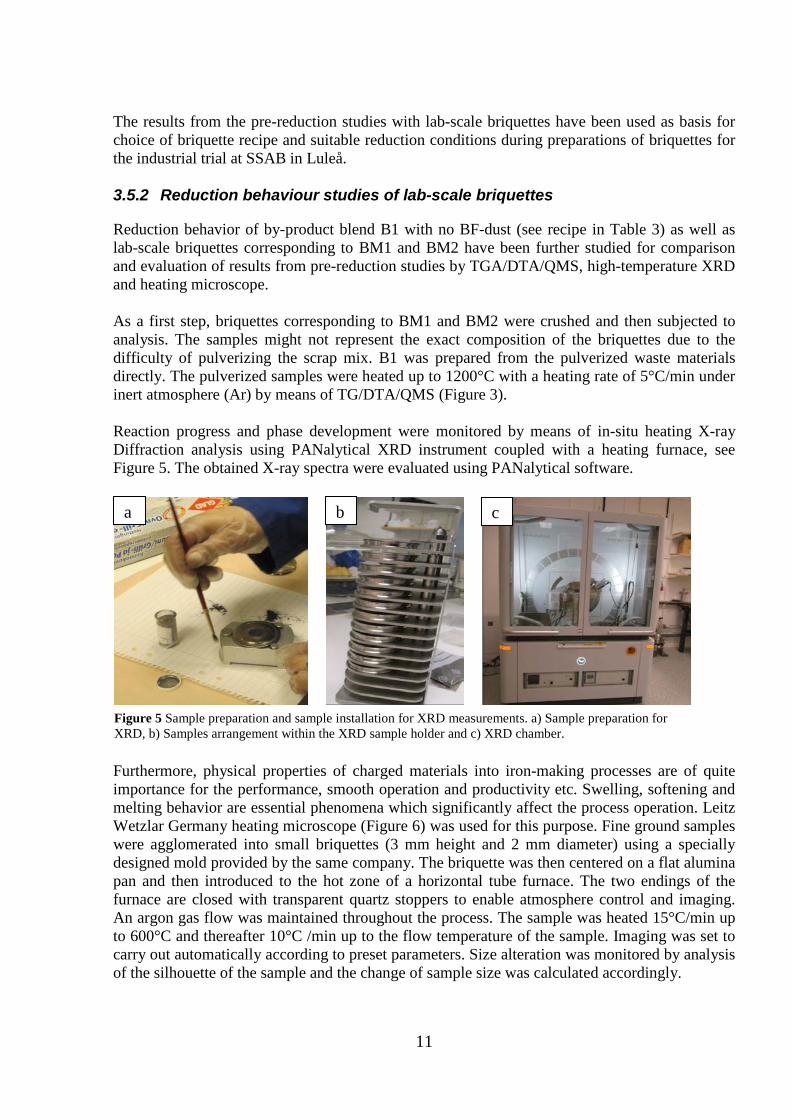
Reduction behavior of by-product blend B1 with no BF-dust (see recipe in Table 3) as well as lab-scale briquettes corresponding to BM1 and BM2 have been further studied for comparison and evaluation of results from pre-reduction studies by TGA/DTA/QMS, high-temperature XRD and heating microscope. As a first step, briquettes corresponding to BM1 and BM2 were crushed and then subjected to analysis. The samples might not represent the exact composition of the briquettes due to the difficulty of pulverizing the scrap mix. B1 was prepared from the pulverized waste materials directly. The pulverized samples were heated up to 1200°C with a heating rate of 5°C/min under inert atmosphere (Ar) by means of TG/DTA/QMS (Figure 3). Reaction progress and phase development were monitored by means of in-situ heating X-ray Diffraction analysis using PANalytical XRD instrument coupled with a heating furnace, see Figure 5. The obtained X-ray spectra were evaluated using PANalytical software.
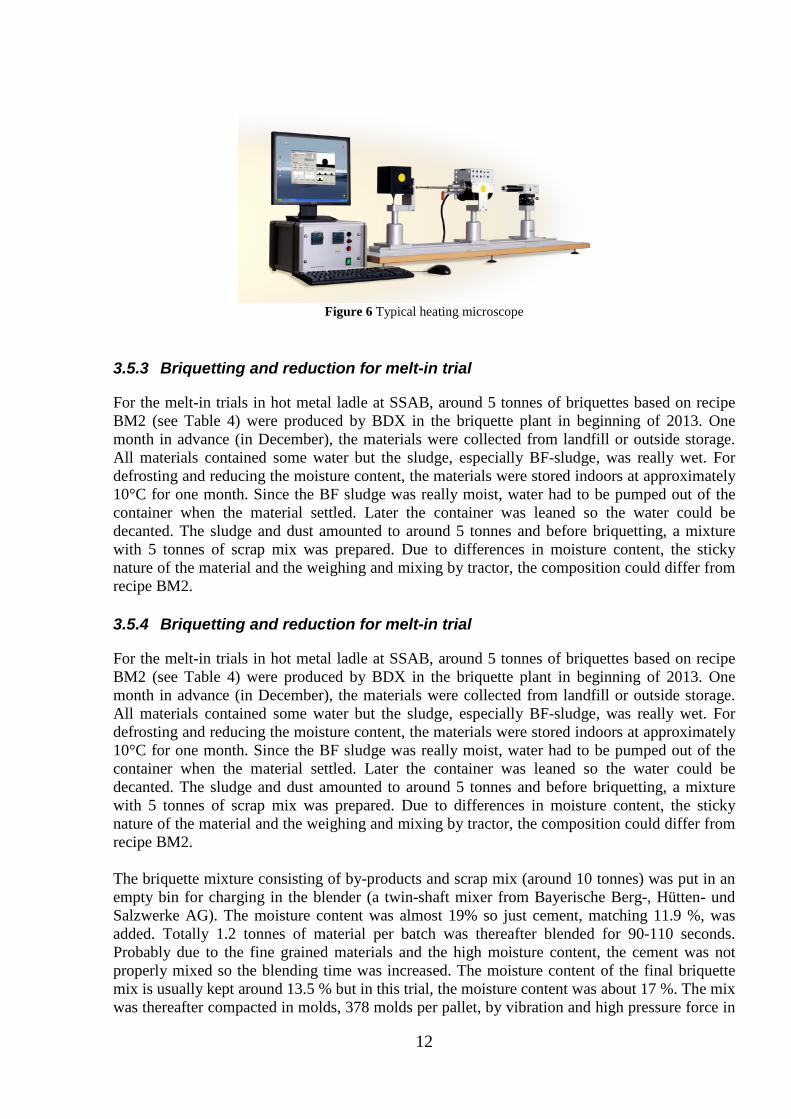
Furthermore, physical properties of charged materials into iron-making processes are of quite importance for the performance, smooth operation and productivity etc. Swelling, softening and melting behavior are essential phenomena which significantly affect the process operation. Leitz Wetzlar Germany heating microscope (Figure 6) was used for this purpose. Fine ground samples were agglomerated into small briquettes (3 mm height and 2 mm diameter) using a specially designed mold provided by the same company. The briquette was then centered on a flat alumina pan and then introduced to the hot zone of a horizontal tube furnace. The two endings of the furnace are closed with transparent quartz stoppers to enable atmosphere control and imaging. An argon gas flow was maintained throughout the process. The sample was heated 15°C/min up to 600°C and thereafter 10°C /min up to the flow temperature of the sample. Imaging was set to carry out automatically according to preset parameters. Size alteration was monitored by analysis of the silhouette of the sample and the change of sample size was calculated accordingly.
a b c
Figure 5 Sample preparation and sample installation for XRD measurements. a) Sample preparation for XRD, b) Samples arrangement within the XRD sample holder and c) XRD chamber.
12
Figure 6 Typical heating microscope
3.5.3 Briquetting and reduction for melt-in trial
For the melt-in trials in hot metal ladle at SSAB, around 5 tonnes of briquettes based on recipe BM2 (see Table 4) were produced by BDX in the briquette plant in beginning of 2013. One month in advance (in December), the materials were collected from landfill or outside storage. All materials contained some water but the sludge, especially BF-sludge, was really wet. For defrosting and reducing the moisture content, the materials were stored indoors at approximately 10°C for one month. Since the BF sludge was really moist, water had to be pumped out of the container when the material settled. Later the container was leaned so the water could be decanted. The sludge and dust amounted to around 5 tonnes and before briquetting, a mixture with 5 tonnes of scrap mix was prepared. Due to differences in moisture content, the sticky nature of the material and the weighing and mixing by tractor, the composition could differ from recipe BM2. 3.5.4 Briquetting and reduction for melt-in trial
For the melt-in trials in hot metal ladle at SSAB, around 5 tonnes of briquettes based on recipe BM2 (see Table 4) were produced by BDX in the briquette plant in beginning of 2013. One month in advance (in December), the materials were collected from landfill or outside storage. All materials contained some water but the sludge, especially BF-sludge, was really wet. For defrosting and reducing the moisture content, the materials were stored indoors at approximately 10°C for one month. Since the BF sludge was really moist, water had to be pumped out of the container when the material settled. Later the container was leaned so the water could be decanted. The sludge and dust amounted to around 5 tonnes and before briquetting, a mixture with 5 tonnes of scrap mix was prepared. Due to differences in moisture content, the sticky nature of the material and the weighing and mixing by tractor, the composition could differ from recipe BM2. The briquette mixture consisting of by-products and scrap mix (around 10 tonnes) was put in an empty bin for charging in the blender (a twin-shaft mixer from Bayerische Berg-, Hütten- und Salzwerke AG). The moisture content was almost 19% so just cement, matching 11.9 %, was added. Totally 1.2 tonnes of material per batch was thereafter blended for 90-110 seconds. Probably due to the fine grained materials and the high moisture content, the cement was not properly mixed so the blending time was increased. The moisture content of the final briquette mix is usually kept around 13.5 % but in this trial, the moisture content was about 17 %. The mix was thereafter compacted in molds, 378 molds per pallet, by vibration and high pressure force in
13
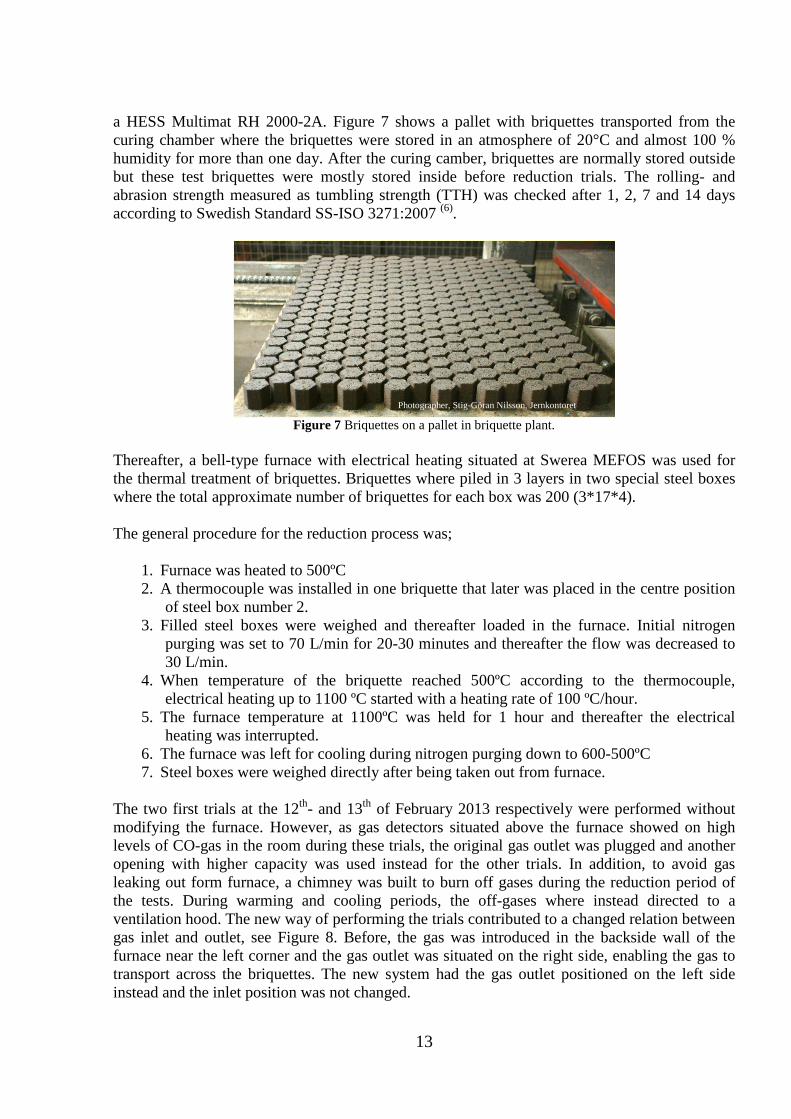
a HESS Multimat RH 2000-2A. Figure 7 shows a pallet with briquettes transported from the curing chamber where the briquettes were stored in an atmosphere of 20°C and almost 100 % humidity for more than one day. After the curing camber, briquettes are normally stored outside but these test briquettes were mostly stored inside before reduction trials. The rolling- and abrasion strength measured as tumbling strength (TTH) was checked after 1, 2, 7 and 14 days according to Swedish Standard SS-ISO 3271:2007 (6).
Figure 7 Briquettes on a pallet in briquette plant.
Thereafter, a bell-type furnace with electrical heating situated at Swerea MEFOS was used for the thermal treatment of briquettes. Briquettes where piled in 3 layers in two special steel boxes where the total approximate number of briquettes for each box was 200 (3*17*4). The general procedure for the reduction process was;
1. Furnace was heated to 500ºC 2. A thermocouple was installed in one briquette that later was placed in the centre position
of steel box number 2. 3. Filled steel boxes were weighed and thereafter loaded in the furnace. Initial nitrogen
purging was set to 70 L/min for 20-30 minutes and thereafter the flow was decreased to 30 L/min.
4. When temperature of the briquette reached 500ºC according to the thermocouple, electrical heating up to 1100 ºC started with a heating rate of 100 ºC/hour.
5. The furnace temperature at 1100ºC was held for 1 hour and thereafter the electrical heating was interrupted.
6. The furnace was left for cooling during nitrogen purging down to 600-500ºC 7. Steel boxes were weighed directly after being taken out from furnace.
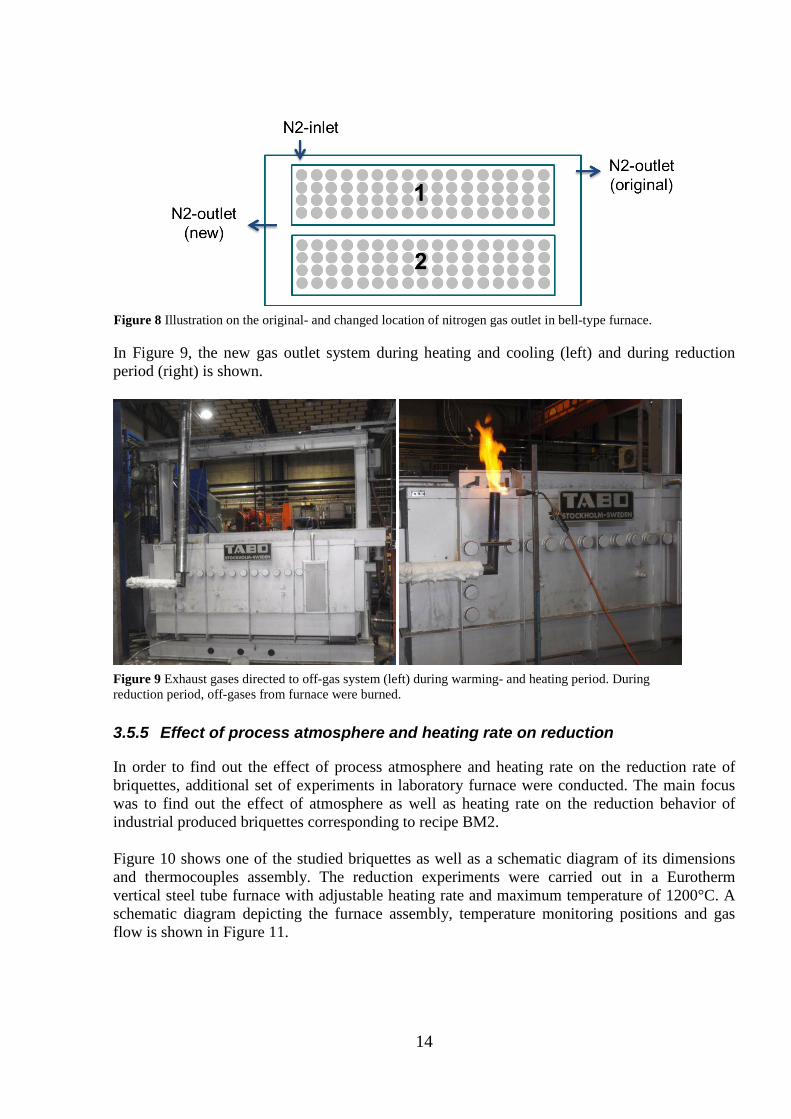
The two first trials at the 12th- and 13th of February 2013 respectively were performed without modifying the furnace. However, as gas detectors situated above the furnace showed on high levels of CO-gas in the room during these trials, the original gas outlet was plugged and another opening with higher capacity was used instead for the other trials. In addition, to avoid gas leaking out form furnace, a chimney was built to burn off gases during the reduction period of the tests. During warming and cooling periods, the off-gases where instead directed to a ventilation hood. The new way of performing the trials contributed to a changed relation between gas inlet and outlet, see Figure 8. Before, the gas was introduced in the backside wall of the furnace near the left corner and the gas outlet was situated on the right side, enabling the gas to transport across the briquettes. The new system had the gas outlet positioned on the left side instead and the inlet position was not changed.
Photographer, Stig-Göran Nilsson, Jernkontoret
14
In Figure 9, the new gas outlet system during heating and cooling (left) and during reduction period (right) is shown.
3.5.5 Effect of process atmosphere and heating rate on reduction
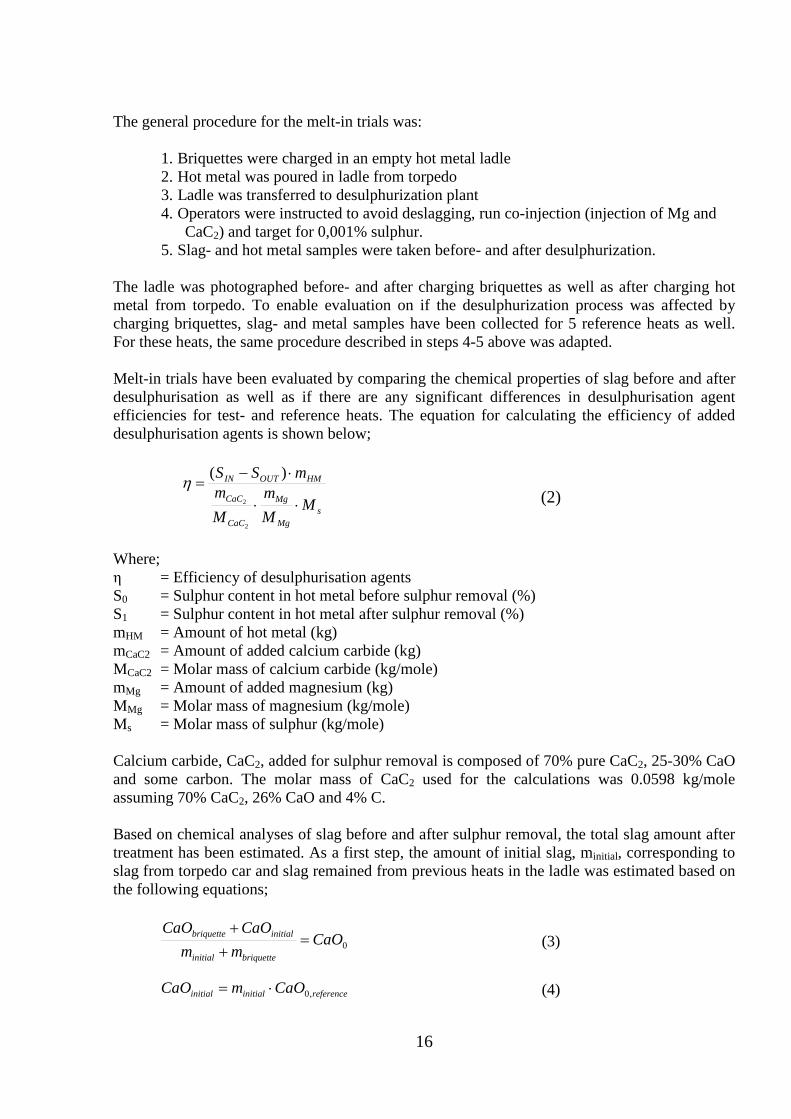
In order to find out the effect of process atmosphere and heating rate on the reduction rate of briquettes, additional set of experiments in laboratory furnace were conducted. The main focus was to find out the effect of atmosphere as well as heating rate on the reduction behavior of industrial produced briquettes corresponding to recipe BM2. Figure 10 shows one of the studied briquettes as well as a schematic diagram of its dimensions and thermocouples assembly. The reduction experiments were carried out in a Eurotherm vertical steel tube furnace with adjustable heating rate and maximum temperature of 1200°C. A schematic diagram depicting the furnace assembly, temperature monitoring positions and gas flow is shown in Figure 11.
Figure 9 Exhaust gases directed to off-gas system (left) during warming- and heating period. During reduction period, off-gases from furnace were burned.
Figure 8 Illustration on the original- and changed location of nitrogen gas outlet in bell-type furnace.
15
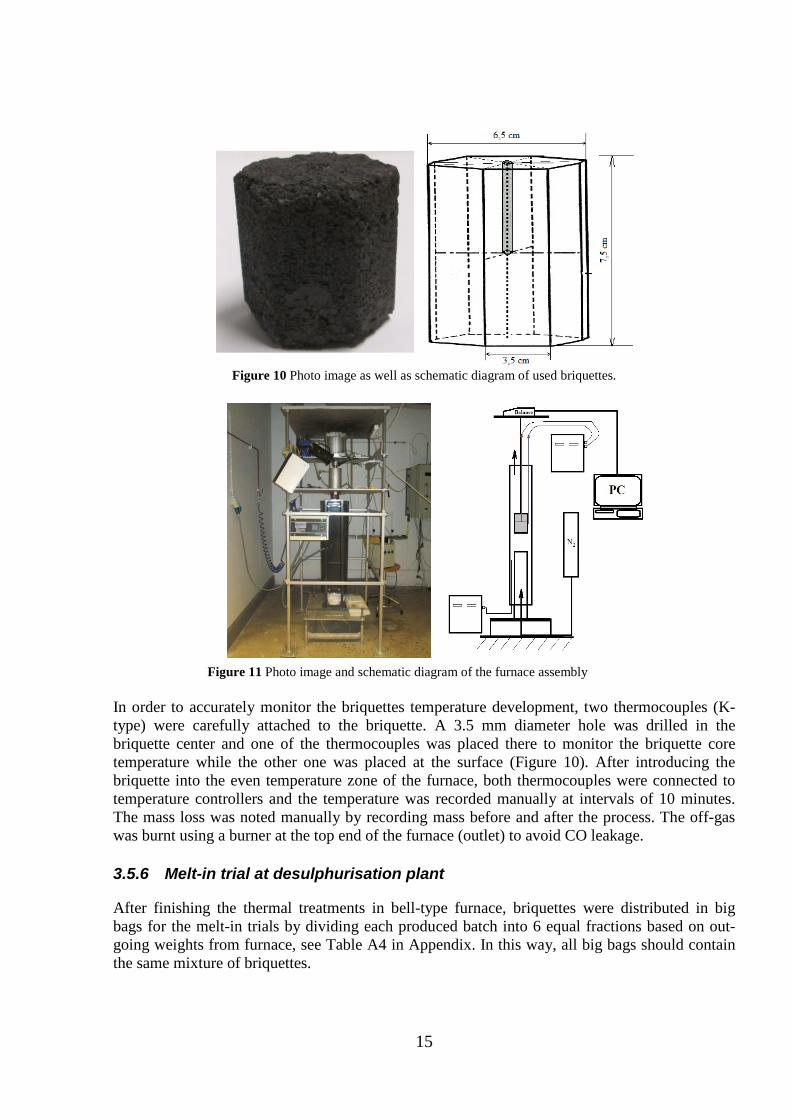
Figure 10 Photo image as well as schematic diagram of used briquettes.
In order to accurately monitor the briquettes temperature development, two thermocouples (K-type) were carefully attached to the briquette. A 3.5 mm diameter hole was drilled in the briquette center and one of the thermocouples was placed there to monitor the briquette core temperature while the other one was placed at the surface (Figure 10). After introducing the briquette into the even temperature zone of the furnace, both thermocouples were connected to temperature controllers and the temperature was recorded manually at intervals of 10 minutes. The mass loss was noted manually by recording mass before and after the process. The off-gas was burnt using a burner at the top end of the furnace (outlet) to avoid CO leakage. 3.5.6 Melt-in trial at desulphurisation plant
After finishing the thermal treatments in bell-type furnace, briquettes were distributed in big bags for the melt-in trials by dividing each produced batch into 6 equal fractions based on out-going weights from furnace, see Table A4 in Appendix. In this way, all big bags should contain the same mixture of briquettes.
Figure 11 Photo image and schematic diagram of the furnace assembly
16
The general procedure for the melt-in trials was:
1. Briquettes were charged in an empty hot metal ladle 2. Hot metal was poured in ladle from torpedo 3. Ladle was transferred to desulphurization plant 4. Operators were instructed to avoid deslagging, run co-injection (injection of Mg and
CaC2) and target for 0,001% sulphur. 5. Slag- and hot metal samples were taken before- and after desulphurization.
The ladle was photographed before- and after charging briquettes as well as after charging hot metal from torpedo. To enable evaluation on if the desulphurization process was affected by charging briquettes, slag- and metal samples have been collected for 5 reference heats as well. For these heats, the same procedure described in steps 4-5 above was adapted. Melt-in trials have been evaluated by comparing the chemical properties of slag before and after desulphurisation as well as if there are any significant differences in desulphurisation agent efficiencies for test- and reference heats. The equation for calculating the efficiency of added desulphurisation agents is shown below;
sMg
Mg
CaC
CaC
HMOUTIN
MMm
Mm
mSS
⋅⋅
⋅−=
2
2
)(η (2)
Where; η = Efficiency of desulphurisation agents S0 = Sulphur content in hot metal before sulphur removal (%) S1 = Sulphur content in hot metal after sulphur removal (%) mHM = Amount of hot metal (kg) mCaC2 = Amount of added calcium carbide (kg) MCaC2 = Molar mass of calcium carbide (kg/mole) mMg = Amount of added magnesium (kg) MMg = Molar mass of magnesium (kg/mole) Ms = Molar mass of sulphur (kg/mole) Calcium carbide, CaC2, added for sulphur removal is composed of 70% pure CaC2, 25-30% CaO and some carbon. The molar mass of CaC2 used for the calculations was 0.0598 kg/mole assuming 70% CaC2, 26% CaO and 4% C. Based on chemical analyses of slag before and after sulphur removal, the total slag amount after treatment has been estimated. As a first step, the amount of initial slag, minitial, corresponding to slag from torpedo car and slag remained from previous heats in the ladle was estimated based on the following equations;
0CaOmm
CaOCaO
briquetteinitial
initialbriquette =++
(3)
referenceinitialinitial CaOmCaO ,0⋅= (4)
17
Where; CaObriquette = Average content of CaO in briquettes (%) CaOinitial = Content of CaO in initial slag (%) CaO0 = Content of CaO in slag for test heats before slag removal (%) minitial = Amount of initial slag (kg) mbriquette = Amount of added briquettes in the hot metal ladle (kg) CaO0,reference =Average content of CaO in initial slag based on reference heats (%) The equations above are based on the assumptions that all CaO end up in the slag phase. According to the same assumption, the total slag in ladle after sulphur removal has been calculated. Furthermore, the sulphur content in slag after treatment was assumed to be present in the form of CaS and MgS in the molar ratio 5:1. The content of CaO in the slag given by the chemical analyses was adjusted to meet this condition by the following equation;
CaS
CaOadjusted M
MCaSCaOCaO 11,1 −= (5)
Where; CaO1,adjusted = Adjusted content of CaO in slag after treatment (%) CaO1 = Content of CaO in slag after treatment given by analysis (%) CaS1 = Estimated content of CaS in slag after treatment (%) MCaO = Molar mass CaO (g/mole) MCaS = Molar mass CaS (g/mole) Calcium carbide injected in the hot metal was converted to amount of CaO by the following relationship;
)7.025.0(2
2,CaC
CaOCaCaddedCaO M
Mmm ⋅+⋅= (6)
Thereafter, the total CaO added to the slag, mCaO,total, was estimated;
addedCaOinitialbriquettebriquettestotalCaO minitialCaOmCaOmm ,, +⋅⋅+⋅= (7) The amount of CaS in the final slag was calculated based on the following equation;
CaO
CaSadjustedtotalCaOCaS M
MCaOCaOmm ⋅−⋅= )( ,11, (8)
The actual amount of CaO in the final slag, mCaO,actual was thereafter estimated by;
CaS
CaOCaStotalCaOactualCaO M
Mmmm ⋅−= ,, (9)
18
Finally, the amount of slag in the ladle after sulphur removal was calculated by;
adjusted
actualCaOslag CaO
mm
,1
,1, = (10)
3.6 Pellet trials
3.6.1 Production of self-reducing pellets
Pellets corresponding to by-product blends 2 and 4 in Table 3 were produced in April 2013 by mixing dust and sludge with 5% cement and water. For each blend (PM1 and PM2), two 20-kg batches (dry weight basis) of cement and by-products were mixed, see Table 6. The moisture content in BOF-sludge was estimated to 30% whereas earlier dried BF-sludge was assumed to be dry. Table 6 Distribution of sludge, dust, cement and water in PM1 and PM2 based on 40 kg produced pellets.
BF-sludge BOF-sludge BF-dust BOF-dust Cement Dry (kg) Dry (kg) Dry (kg) Dry (kg) Dry (kg)
PM1 14.44 20.94 1.90 0.72 2.00 PM2 12.16 17.63 7.60 0.61 2.00 Tot. (dry) Kg 26.6 39 9.5 1.3 4.0
The general procedure for the pellet production was the following;
1. Dust and sludge were pre-mixed in a mixer. 2. Addition of cement. Larger lumps in the mix were crushed manually. 3. Emptying the mixer. A sieve was used to separate larger lumps from the material. 4. Material mix was fed to the rotating pellet plate while simultaneously spraying water on
the material. 5. Pellet overflow was sieved at around 8 mm, see Figure 12.
Pellets of both blends were sieved in fractions >16 mm, 16-12.5 mm, 12.5-10 mm, 10-9 mm, 9-6.3 mm, <6.3 mm and thereafter, pellets in size distribution range 12.5-9 mm of each blend where dried at 105ºC for 24 hours. Equal amounts of pellets in each size fraction (12.5-9 mm) and for each blend have been used for further studies. Green pellets of PM1 and PM2 were analysed for chemical composition by XRF, LECO, trace elements and distribution of Fe metallic and Fe2+ in relation to total iron content.
19
3.6.2 Reduction of self-reducing pellets in lab furnace
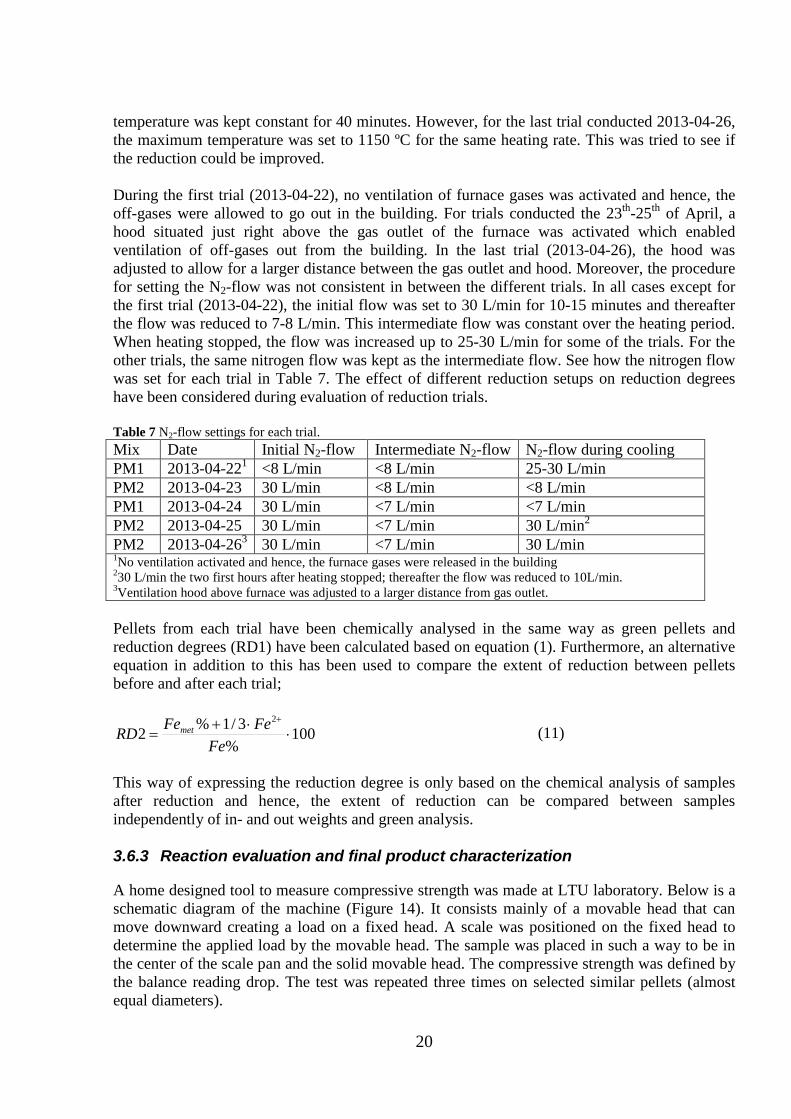
Thermal treatment of pellets was conducted in the same laboratory furnace as pre-reduction studies of briquettes. A special construction made in perforated stainless steel sheet was designed to enable sufficient gas permeability through the pellet bed and also allow for larger quantities to be reduced in one batch, see construction in Figure 13. Unlike previous trials with briquettes, control of nitrogen flow was also possible since the furnace was equipped with a rotameter.
For each trial, the furnace was heated up to 500ºC at a heating rate of 200ºC/hour. The amount of pellets in each level 1-3 was weighed separately and when the furnace temperature reached 500ºC, the pellets were charged in the furnace during nitrogen purging. The maximum temperature was set to 1100ºC due to the limited working temperature of stainless steel used in the construction. This temperature was reached by a heating rate of 200ºC/hour and thereafter the
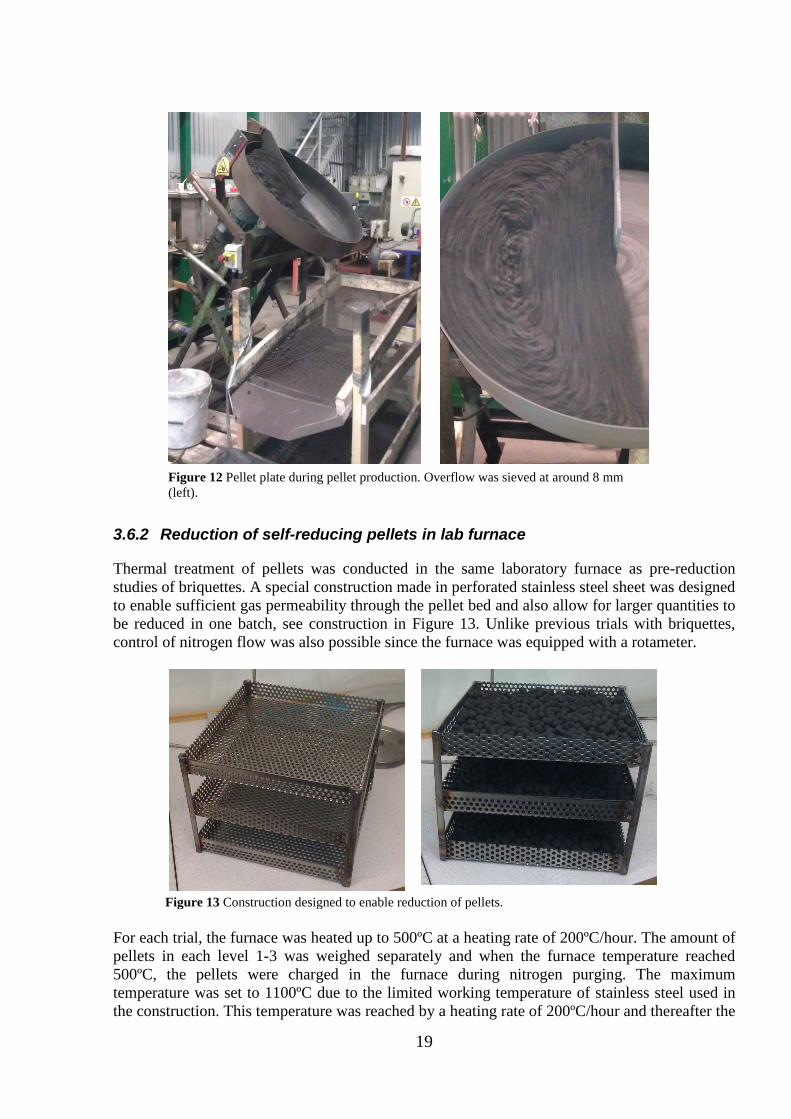
Figure 12 Pellet plate during pellet production. Overflow was sieved at around 8 mm (left).
Figure 13 Construction designed to enable reduction of pellets.
20
temperature was kept constant for 40 minutes. However, for the last trial conducted 2013-04-26, the maximum temperature was set to 1150 ºC for the same heating rate. This was tried to see if the reduction could be improved. During the first trial (2013-04-22), no ventilation of furnace gases was activated and hence, the off-gases were allowed to go out in the building. For trials conducted the 23th-25th of April, a hood situated just right above the gas outlet of the furnace was activated which enabled ventilation of off-gases out from the building. In the last trial (2013-04-26), the hood was adjusted to allow for a larger distance between the gas outlet and hood. Moreover, the procedure for setting the N2-flow was not consistent in between the different trials. In all cases except for the first trial (2013-04-22), the initial flow was set to 30 L/min for 10-15 minutes and thereafter the flow was reduced to 7-8 L/min. This intermediate flow was constant over the heating period. When heating stopped, the flow was increased up to 25-30 L/min for some of the trials. For the other trials, the same nitrogen flow was kept as the intermediate flow. See how the nitrogen flow was set for each trial in Table 7. The effect of different reduction setups on reduction degrees have been considered during evaluation of reduction trials. Table 7 N2-flow settings for each trial. Mix Date Initial N2-flow Intermediate N2-flow N2-flow during cooling PM1 2013-04-221 <8 L/min <8 L/min 25-30 L/min PM2 2013-04-23 30 L/min <8 L/min <8 L/min PM1 2013-04-24 30 L/min <7 L/min <7 L/min PM2 2013-04-25 30 L/min <7 L/min 30 L/min2
PM2 2013-04-263 30 L/min <7 L/min 30 L/min 1No ventilation activated and hence, the furnace gases were released in the building 230 L/min the two first hours after heating stopped; thereafter the flow was reduced to 10L/min. 3Ventilation hood above furnace was adjusted to a larger distance from gas outlet. Pellets from each trial have been chemically analysed in the same way as green pellets and reduction degrees (RD1) have been calculated based on equation (1). Furthermore, an alternative equation in addition to this has been used to compare the extent of reduction between pellets before and after each trial;
100%
3/1%22
⋅⋅+
=+
FeFeFeRD met (11)
This way of expressing the reduction degree is only based on the chemical analysis of samples after reduction and hence, the extent of reduction can be compared between samples independently of in- and out weights and green analysis. 3.6.3 Reaction evaluation and final product characterization
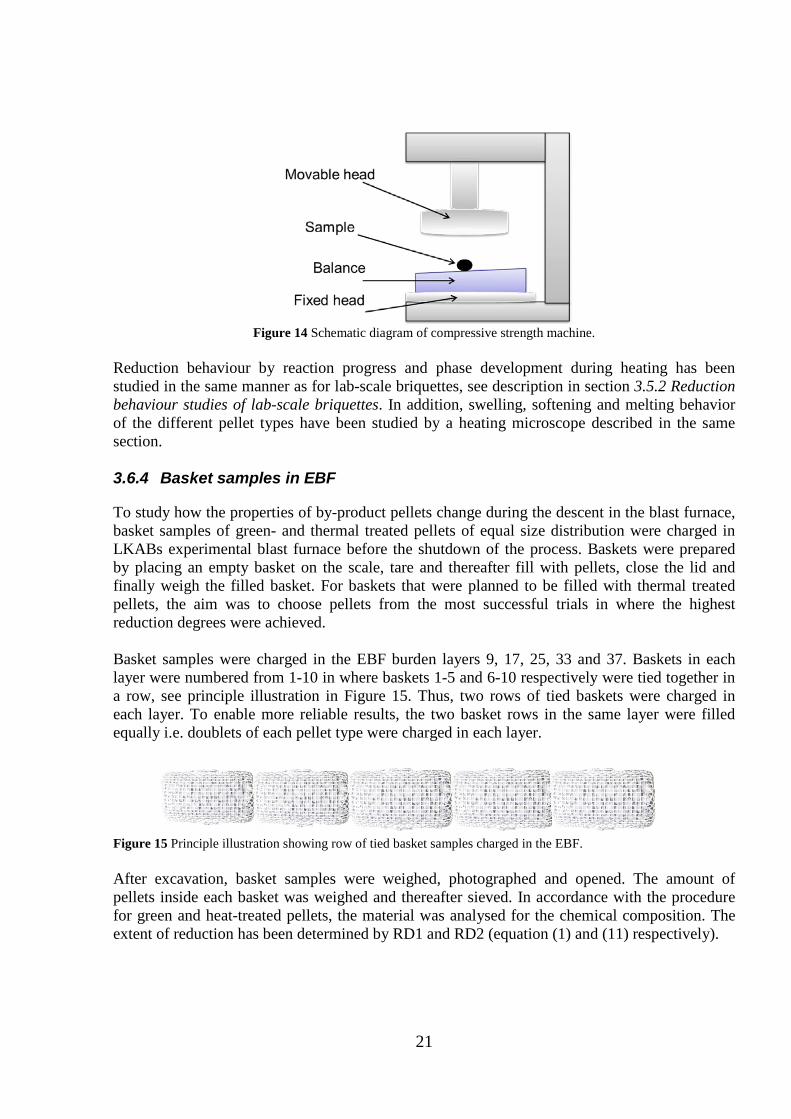
A home designed tool to measure compressive strength was made at LTU laboratory. Below is a schematic diagram of the machine (Figure 14). It consists mainly of a movable head that can move downward creating a load on a fixed head. A scale was positioned on the fixed head to determine the applied load by the movable head. The sample was placed in such a way to be in the center of the scale pan and the solid movable head. The compressive strength was defined by the balance reading drop. The test was repeated three times on selected similar pellets (almost equal diameters).
21
Figure 14 Schematic diagram of compressive strength machine.
Reduction behaviour by reaction progress and phase development during heating has been studied in the same manner as for lab-scale briquettes, see description in section 3.5.2 Reduction behaviour studies of lab-scale briquettes. In addition, swelling, softening and melting behavior of the different pellet types have been studied by a heating microscope described in the same section. 3.6.4 Basket samples in EBF
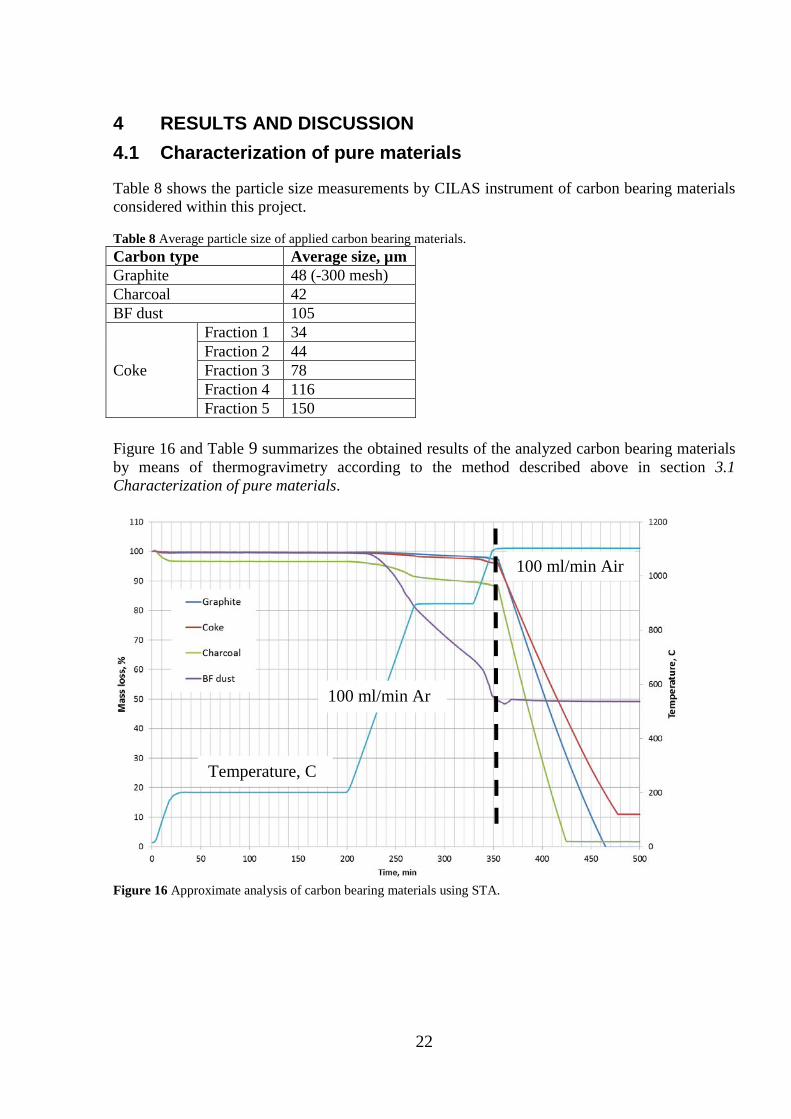
To study how the properties of by-product pellets change during the descent in the blast furnace, basket samples of green- and thermal treated pellets of equal size distribution were charged in LKABs experimental blast furnace before the shutdown of the process. Baskets were prepared by placing an empty basket on the scale, tare and thereafter fill with pellets, close the lid and finally weigh the filled basket. For baskets that were planned to be filled with thermal treated pellets, the aim was to choose pellets from the most successful trials in where the highest reduction degrees were achieved. Basket samples were charged in the EBF burden layers 9, 17, 25, 33 and 37. Baskets in each layer were numbered from 1-10 in where baskets 1-5 and 6-10 respectively were tied together in a row, see principle illustration in Figure 15. Thus, two rows of tied baskets were charged in each layer. To enable more reliable results, the two basket rows in the same layer were filled equally i.e. doublets of each pellet type were charged in each layer.
Figure 15 Principle illustration showing row of tied basket samples charged in the EBF. After excavation, basket samples were weighed, photographed and opened. The amount of pellets inside each basket was weighed and thereafter sieved. In accordance with the procedure for green and heat-treated pellets, the material was analysed for the chemical composition. The extent of reduction has been determined by RD1 and RD2 (equation (1) and (11) respectively).
22
4 RESULTS AND DISCUSSION 4.1 Characterization of pure materials
Table 8 shows the particle size measurements by CILAS instrument of carbon bearing materials considered within this project. Table 8 Average particle size of applied carbon bearing materials. Carbon type Average size, µm Graphite 48 (-300 mesh) Charcoal 42 BF dust 105
Coke
Fraction 1 34 Fraction 2 44 Fraction 3 78 Fraction 4 116 Fraction 5 150
Figure 16 and Table 9 summarizes the obtained results of the analyzed carbon bearing materials by means of thermogravimetry according to the method described above in section 3.1 Characterization of pure materials.
Figure 16 Approximate analysis of carbon bearing materials using STA.
100 ml/min Air
100 ml/min Ar
Temperature, C
23
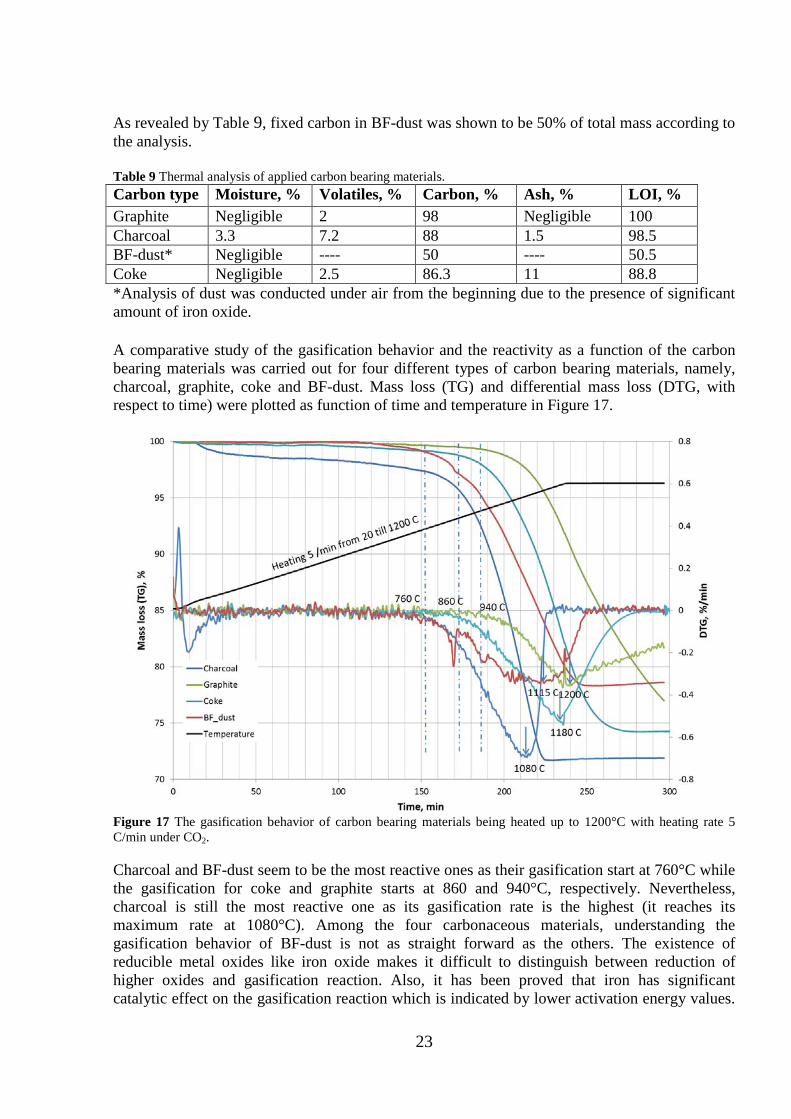
As revealed by Table 9, fixed carbon in BF-dust was shown to be 50% of total mass according to the analysis. Table 9 Thermal analysis of applied carbon bearing materials. Carbon type Moisture, % Volatiles, % Carbon, % Ash, % LOI, % Graphite Negligible 2 98 Negligible 100 Charcoal 3.3 7.2 88 1.5 98.5 BF-dust* Negligible ---- 50 ---- 50.5 Coke Negligible 2.5 86.3 11 88.8 *Analysis of dust was conducted under air from the beginning due to the presence of significant amount of iron oxide. A comparative study of the gasification behavior and the reactivity as a function of the carbon bearing materials was carried out for four different types of carbon bearing materials, namely, charcoal, graphite, coke and BF-dust. Mass loss (TG) and differential mass loss (DTG, with respect to time) were plotted as function of time and temperature in Figure 17.
Figure 17 The gasification behavior of carbon bearing materials being heated up to 1200°C with heating rate 5 C/min under CO2.
Charcoal and BF-dust seem to be the most reactive ones as their gasification start at 760°C while the gasification for coke and graphite starts at 860 and 940°C, respectively. Nevertheless, charcoal is still the most reactive one as its gasification rate is the highest (it reaches its maximum rate at 1080°C). Among the four carbonaceous materials, understanding the gasification behavior of BF-dust is not as straight forward as the others. The existence of reducible metal oxides like iron oxide makes it difficult to distinguish between reduction of higher oxides and gasification reaction. Also, it has been proved that iron has significant catalytic effect on the gasification reaction which is indicated by lower activation energy values.
24
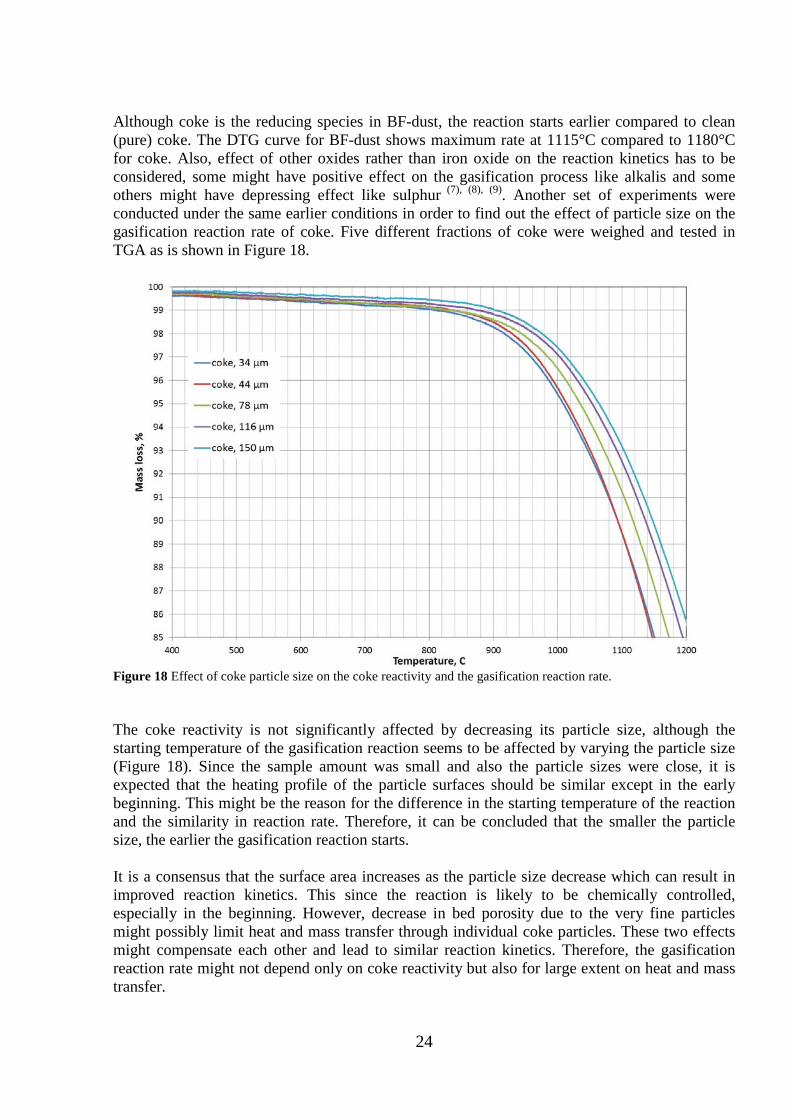
Although coke is the reducing species in BF-dust, the reaction starts earlier compared to clean (pure) coke. The DTG curve for BF-dust shows maximum rate at 1115°C compared to 1180°C for coke. Also, effect of other oxides rather than iron oxide on the reaction kinetics has to be considered, some might have positive effect on the gasification process like alkalis and some others might have depressing effect like sulphur (7), (8), (9). Another set of experiments were conducted under the same earlier conditions in order to find out the effect of particle size on the gasification reaction rate of coke. Five different fractions of coke were weighed and tested in TGA as is shown in Figure 18.
Figure 18 Effect of coke particle size on the coke reactivity and the gasification reaction rate. The coke reactivity is not significantly affected by decreasing its particle size, although the starting temperature of the gasification reaction seems to be affected by varying the particle size (Figure 18). Since the sample amount was small and also the particle sizes were close, it is expected that the heating profile of the particle surfaces should be similar except in the early beginning. This might be the reason for the difference in the starting temperature of the reaction and the similarity in reaction rate. Therefore, it can be concluded that the smaller the particle size, the earlier the gasification reaction starts. It is a consensus that the surface area increases as the particle size decrease which can result in improved reaction kinetics. This since the reaction is likely to be chemically controlled, especially in the beginning. However, decrease in bed porosity due to the very fine particles might possibly limit heat and mass transfer through individual coke particles. These two effects might compensate each other and lead to similar reaction kinetics. Therefore, the gasification reaction rate might not depend only on coke reactivity but also for large extent on heat and mass transfer.
25
4.2 Reduction behaviour of self-reducing mixture (pure hematite)
In most of the conducted experiments in TGA with self-reducing mixtures, especially at higher temperatures, the reduction started before the temperature reached the pre-set value. Only the isothermal reduction is going to be considered in the present part. TGA curves for different composite mixtures show interesting behavior. Before we get into details of it, let us look at the minimum and maximum weight reduction possible for different stages of hematite reduction, namely; hematite to magnetite, magnetite to wustite and wustite to iron. For the same reduction extent, the minimum weight loss would correspond to emission of CO2 from the composite mixture and the maximum weight loss would correspond to emission of CO from the composite mixture. The process starts by evolution of volatile matter. Based on the approximate analysis for applied carbon bearing materials in Figure 16, the maximum mass loss as a result of devolatilization is calculated as follows; volatiles = volatile matter * carbon bearing material content/100 The reduction is believed to proceed through one of the following reactions, groups or mixtures of them by assuming that the reaction gas product will be only CO2 (Maximum utilization and minimum carbon consumption and mass loss); Fe2O3 → Fe3O4 Step; For this reduction step, 2.2*10-3 moles of oxygen will be lost which will require 1.1*10-3 moles of carbon. So, 4.7% would be the mass loss for this step. Adding this value to the volatiles will result in the accumulated value that should be lost at this step, see Table 10. Fe3O4→FeO step; in magnetite-wustite reduction step, 4.1*10-3 moles of oxygen will be lost which will require 2.1*10-3 moles of carbon. Therefore, 9.2% mass will be lost during the present step. FeO→Fe step; Here, 1.4*10-2 moles of oxygen will be lost and 6.9*10-3 moles of carbon will get consumed. On the other hand, assuming that the reaction gas product will be only CO (Minimum utilization and maximum carbon consumption and mass loss), the calculation will be similar to the calculations above except that each mole of oxygen that is lost will require one mole carbon to produce CO instead of half mole in case of CO2.
26
Based on the volatile- and carbon content of different mixtures, the minimum and maximum weight loss percentages have been calculated and are shown in Table 10. Table 10 Accumulated minimum and maximum mass loss of self-reducing mixture upon heating (minimum value calculated based on 100% CO2 gas product while maximum values based on 100% CO gas product).
ID Composite Mixture Weight Loss, %
Volatiles Fe2O3-Fe3O4 Fe3O4-FeO FeO-Fe
Min. Max. Min. Max. Min. Max.
I Hematite-Graphite 0.37 4.1 5.1 11.6 14.6 34.0 43.2
II Hematite-Charcoal 2.1 5.8 6.9 13.0 16.4 35.8 45.0
III Hematite-Coke 0.5 4.2 5.3 11.7 14.8 34.2 43.4
IV Hematite-BF dust --- 3.7 4.8 11.2 14.3 33.7 42.9
In all the TGA experiments with self-reducing mixtures, the furnace was heated at 10°C/min and hence, each mixture shows identical trend during the heating stage as expected. For experiments conducted at lower temperatures, the sample reached the isothermal condition earlier and it was therefore possible to capture the higher oxide reduction under isothermal condition. However, for high temperatures before the sample reached the isothermal condition, higher oxide reductions would be completed and hence, isothermal behavior for these reactions at higher temperature could not be captured For hematite to magnetite reduction (graphite-hematite mixture), the theoretical maximum weight loss for this stage of reduction was 5.1% according to the calculations, see Table 10. Before reaching the isothermal temperatures at 750oC and 800oC respectively, 2% and 3% weight loss had already occurred, see Figure 19. As expected, the rate of weight loss increases with increasing temperature. One can also notice that the rate of weight loss continuously decreases with increasing time. In the temperature range 750-800°C, the rate of weight loss beyond 5% which falls into magnetite to wustite reduction is quite sluggish. This can be explained by sluggish kinetics coupled with a relatively less thermodynamic driving force. An equilibrium calculation would show that magnetite to wustite reduction would not happen below approximately 700°C.
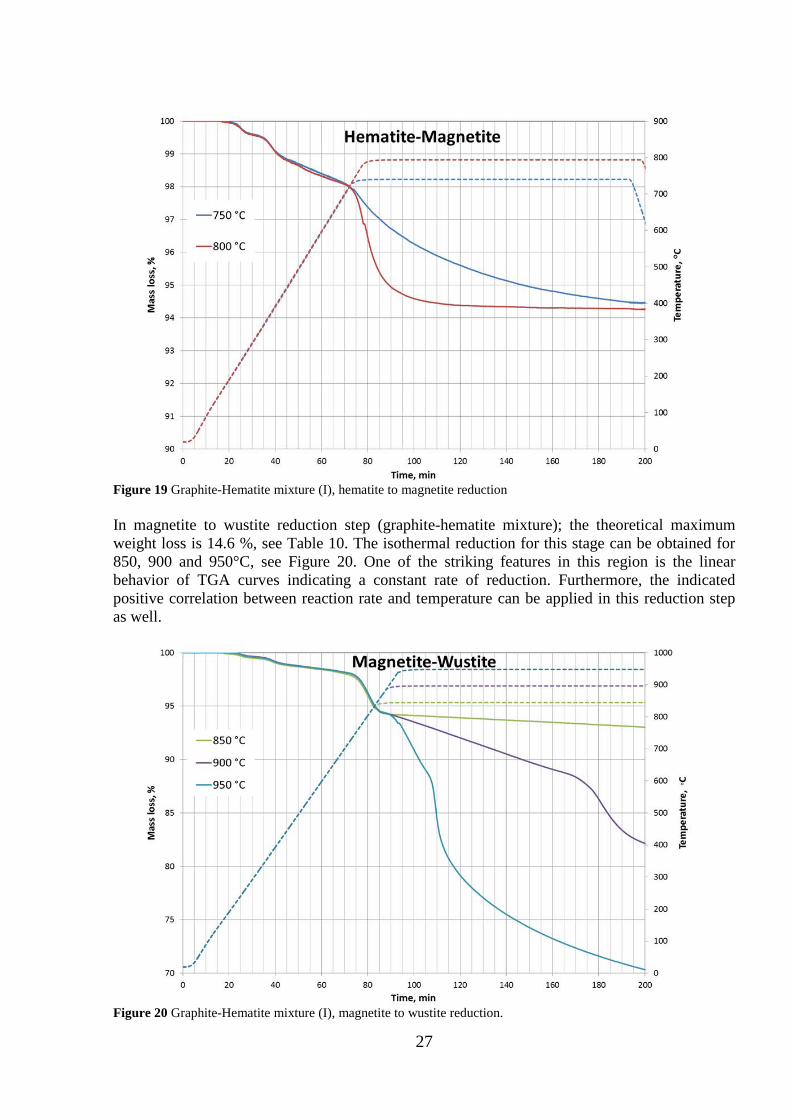
27
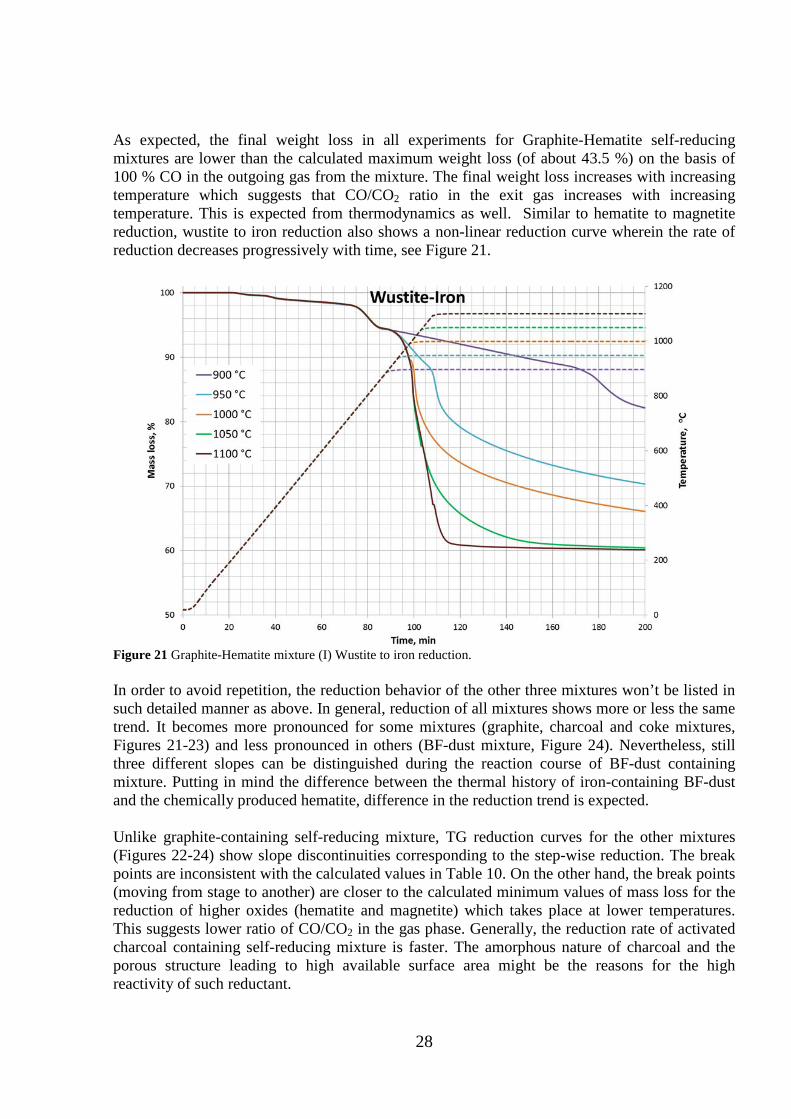
Figure 19 Graphite-Hematite mixture (I), hematite to magnetite reduction In magnetite to wustite reduction step (graphite-hematite mixture); the theoretical maximum weight loss is 14.6 %, see Table 10. The isothermal reduction for this stage can be obtained for 850, 900 and 950°C, see Figure 20. One of the striking features in this region is the linear behavior of TGA curves indicating a constant rate of reduction. Furthermore, the indicated positive correlation between reaction rate and temperature can be applied in this reduction step as well.
Figure 20 Graphite-Hematite mixture (I), magnetite to wustite reduction.
28
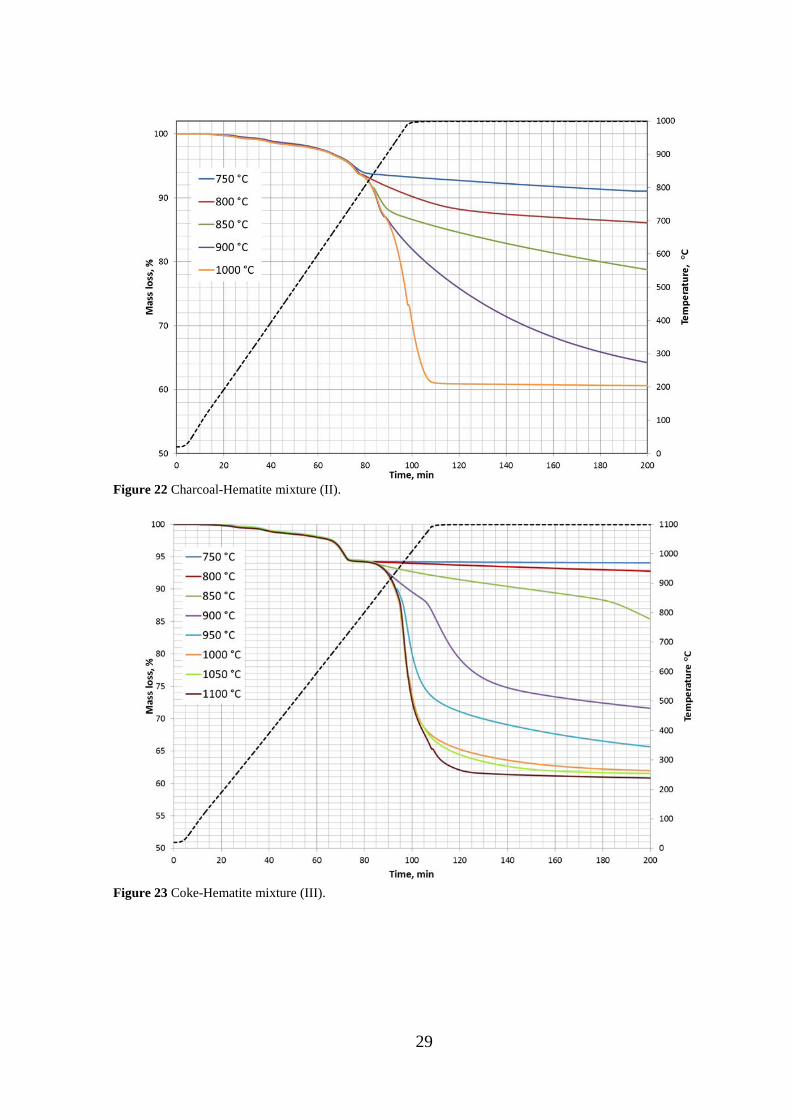
As expected, the final weight loss in all experiments for Graphite-Hematite self-reducing mixtures are lower than the calculated maximum weight loss (of about 43.5 %) on the basis of 100 % CO in the outgoing gas from the mixture. The final weight loss increases with increasing temperature which suggests that CO/CO2 ratio in the exit gas increases with increasing temperature. This is expected from thermodynamics as well. Similar to hematite to magnetite reduction, wustite to iron reduction also shows a non-linear reduction curve wherein the rate of reduction decreases progressively with time, see Figure 21.
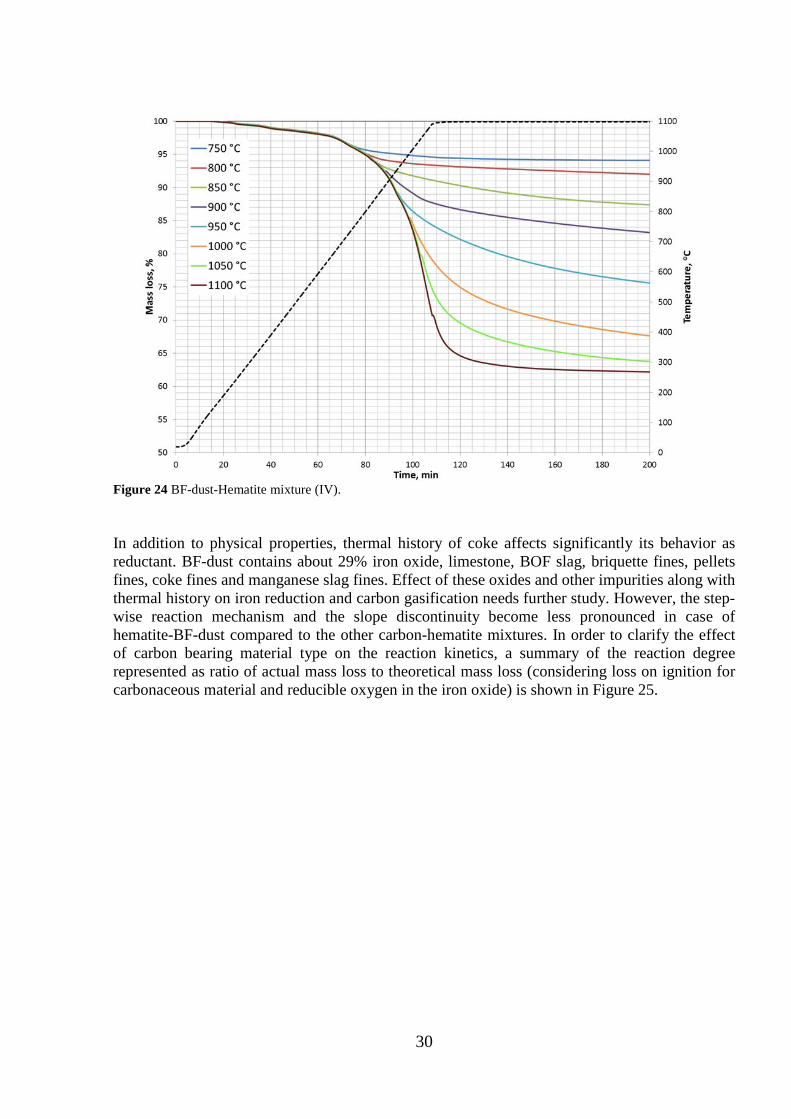
Figure 21 Graphite-Hematite mixture (I) Wustite to iron reduction. In order to avoid repetition, the reduction behavior of the other three mixtures won’t be listed in such detailed manner as above. In general, reduction of all mixtures shows more or less the same trend. It becomes more pronounced for some mixtures (graphite, charcoal and coke mixtures, Figures 21-23) and less pronounced in others (BF-dust mixture, Figure 24). Nevertheless, still three different slopes can be distinguished during the reaction course of BF-dust containing mixture. Putting in mind the difference between the thermal history of iron-containing BF-dust and the chemically produced hematite, difference in the reduction trend is expected. Unlike graphite-containing self-reducing mixture, TG reduction curves for the other mixtures (Figures 22-24) show slope discontinuities corresponding to the step-wise reduction. The break points are inconsistent with the calculated values in Table 10. On the other hand, the break points (moving from stage to another) are closer to the calculated minimum values of mass loss for the reduction of higher oxides (hematite and magnetite) which takes place at lower temperatures. This suggests lower ratio of CO/CO2 in the gas phase. Generally, the reduction rate of activated charcoal containing self-reducing mixture is faster. The amorphous nature of charcoal and the porous structure leading to high available surface area might be the reasons for the high reactivity of such reductant.
29
Figure 22 Charcoal-Hematite mixture (II).
Figure 23 Coke-Hematite mixture (III).
30
Figure 24 BF-dust-Hematite mixture (IV). In addition to physical properties, thermal history of coke affects significantly its behavior as reductant. BF-dust contains about 29% iron oxide, limestone, BOF slag, briquette fines, pellets fines, coke fines and manganese slag fines. Effect of these oxides and other impurities along with thermal history on iron reduction and carbon gasification needs further study. However, the step-wise reaction mechanism and the slope discontinuity become less pronounced in case of hematite-BF-dust compared to the other carbon-hematite mixtures. In order to clarify the effect of carbon bearing material type on the reaction kinetics, a summary of the reaction degree represented as ratio of actual mass loss to theoretical mass loss (considering loss on ignition for carbonaceous material and reducible oxygen in the iron oxide) is shown in Figure 25.
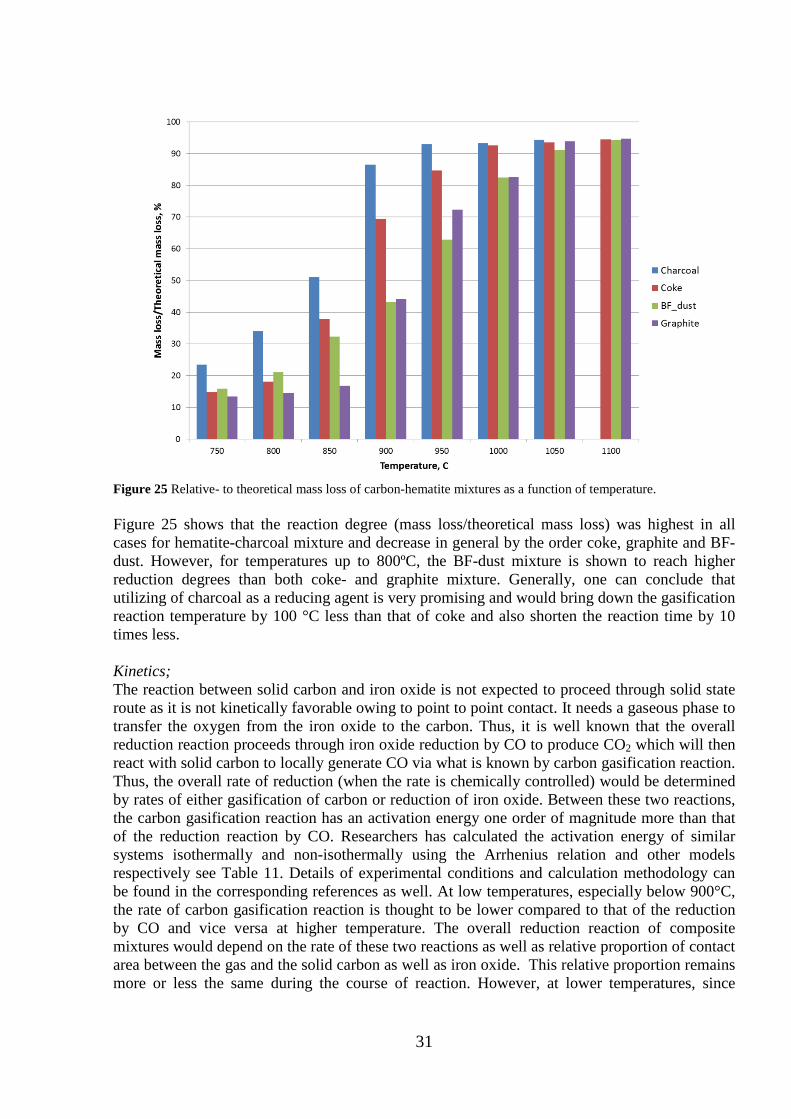
31
Figure 25 Relative- to theoretical mass loss of carbon-hematite mixtures as a function of temperature. Figure 25 shows that the reaction degree (mass loss/theoretical mass loss) was highest in all cases for hematite-charcoal mixture and decrease in general by the order coke, graphite and BF-dust. However, for temperatures up to 800ºC, the BF-dust mixture is shown to reach higher reduction degrees than both coke- and graphite mixture. Generally, one can conclude that utilizing of charcoal as a reducing agent is very promising and would bring down the gasification reaction temperature by 100 °C less than that of coke and also shorten the reaction time by 10 times less. Kinetics; The reaction between solid carbon and iron oxide is not expected to proceed through solid state route as it is not kinetically favorable owing to point to point contact. It needs a gaseous phase to transfer the oxygen from the iron oxide to the carbon. Thus, it is well known that the overall reduction reaction proceeds through iron oxide reduction by CO to produce CO2 which will then react with solid carbon to locally generate CO via what is known by carbon gasification reaction. Thus, the overall rate of reduction (when the rate is chemically controlled) would be determined by rates of either gasification of carbon or reduction of iron oxide. Between these two reactions, the carbon gasification reaction has an activation energy one order of magnitude more than that of the reduction reaction by CO. Researchers has calculated the activation energy of similar systems isothermally and non-isothermally using the Arrhenius relation and other models respectively see Table 11. Details of experimental conditions and calculation methodology can be found in the corresponding references as well. At low temperatures, especially below 900°C, the rate of carbon gasification reaction is thought to be lower compared to that of the reduction by CO and vice versa at higher temperature. The overall reduction reaction of composite mixtures would depend on the rate of these two reactions as well as relative proportion of contact area between the gas and the solid carbon as well as iron oxide. This relative proportion remains more or less the same during the course of reaction. However, at lower temperatures, since
32
carbon gasification reaction determines the overall rate, the contact area for this reaction matters much more than that for the reduction reaction and vice versa at higher temperature. As the reduction reactions is believed to occur through gaseous intermediate and TG results proved the step wise reduction, the reaction can be represented by reactions 1-4. The corresponding activation energy values reported earlier are given in Table 11; 3Fe2O3 + CO = 2Fe3O4 + CO2 Hematite reduction (1) Fe3O4 + CO = 3FeO + CO2 Magnetite reduction (2) FeO + CO = Fe + CO2 Wustite reduction (3) CO2 + C = 2CO Gasification reaction (4) Table 11 Calculated activation energies and corresponding rate controlling steps. Rate controlling step Conditions Activation energy, kJ/mol Carbon gasification Hematite-graphite mixture 285-418 (10)
Gasification of graphite 444 (11) Gasification of wood charcoal 368 (12) Gasification of coconut charcoal 339-351 (13)- (14) Different types of carbon 213-310 (15)
Wustite reduction Reduction of FeO by CO 117-151 (16) Reduction of FeO below 1050 °C
167 (17)
Hematite-graphite mixture 56 (10) Diffusion Magnetite to wustite by CO 121 (15)
Reduction by carbon monoxide – this rate depends on Area (Aore) of the unreacted ore particles, chemical reaction rate constant for the reduction reaction (k1) and gas composition. Carbon gasification reaction – this rate depends on area of the carbon particles (Acarbon), gasification reaction rate constant (k2) and also on gas composition. In addition, the diffusion of gases between the carbon- and ore reaction site can also play an important role at a sufficiently high temperature where chemical reaction constants are high. As the mixture is in Ar atmosphere, diffusion of Ar may also play an important role. The activation energy of different reaction steps were calculated by Arrhenius plot (𝐾 = 𝐴 +𝑒𝑒𝑒−𝐸/𝑅) for isothermal reduction rate at different temperatures. Reduction rate constant for each step was obtained from the slopes of reduction curves at initial parts of each step (𝐾 =𝑑𝑒/𝑑𝑑) by plotting logarithm of the reaction rate constant versus the reciprocal of absolute temperature. The intercept is pre-exponential factor (A) and the slope (E/R) is the apparent activation energy (E) divided by universal gas constant Observations; Hematite reduction, the first observed feature is the non-linear reaction rate. Also, the activation energies could be calculated for this reduction only for graphite, as for coke and charcoal there were not enough isothermal data points. An activation energy of 209 kJ/mol was calculated which is lower than the corresponding value for carbon gasification reaction. It is also an interesting note that for graphite, the hematite reduction step was reached at temperatures below 800°C, for coke this happened at 750°C. Thermodynamically at these temperatures, there is
33
sufficient CO to reduce Fe3O4 to FeO. Possibly, the rates of carbon gasification are comparable to the diffusion rates of Ar into the powder mixture and thus, CO potential is not sufficient to reduce Fe3O4 to FeO. The area of the ore (Fe2O3 area) decreases with the progress of the reaction. There is also limited supply of CO from carbon gasification reaction. Further, the reaction rate of reduction by CO is also expected to be small because of lower temperatures. Hence, the overall reaction rate is not linear. Magnetite reduction, for coke and charcoal, the reduction from Fe3O4 to FeO exists below 800°C while it last till 950°C in case of graphite containing self-reducing mixtures. This is an indication that the reaction is dependent on reactivity of carbon which in turn is carbon type dependent. The activation energies also clearly indicate this. The activation energy values were calculated for graphite, coke and charcoal and were found to be 414, 293 and 305 kJ/mol respectively. At these temperatures, the reduction rate constants are expected to be much higher compared to gasification rate constants. Hence, the overall rate is controlled by gasification rate. Further, the reduction rates are fast enough to reach CO/CO2 equilibrium. In other words, the area of unreacted Fe3O4 is not important and the area of coke does not change significantly as the amount of carbon is consumed during this stage. In fact it is relatively small compared to the overall amount of the carbon present. Hence, the rate is linear. Wustite reduction, generally one can see the sudden increase in rates, this may be due to the catalytic effect of Fe on carbon gasification reaction. At these temperatures, both carbon gasification reactions as well as reduction rate constants are expected to be significantly high. However, both area of coke as well as the area of unreacted FeO is decreasing as the reduction proceeds. Hence, the reaction rates decreases with increasing time. Activation energy values of wustite reduction were calculated and found to be 330, 247 and 280 kJmol for graphite, coke and charcoal containing mixtures respectively. On the other hand, at relatively high temperatures and at the last stages of the reaction, the mass gas diffusion seems to play role in the reduction kinetics. Estimated activation energy for the last stages of wustite reduction was in the range of 8.4 kJ/mol. However, deep understanding of the reaction kinetics would require detailed modeling efforts involving gasification reaction at the carbon interface, reduction reactions at the ore interface and diffusion of gases between these reaction sites. It is to be noted that this is an intuitive explanation. More convincing reasons may be obtained through modeling of the reaction kinetics of the mixture from first principles. Table 12 summarizes the calculated activation values for different stages and different carbonaceous materials. Table 12 Calculated apparent activation energy values. Activation Energy, kJ/mol Hematite-
graphite Hematite-Charcoal
Hematite-coke
Hematite-BF dust
Hematite reduction 211 ---- 230 Magnetite reduction 414 305 293 180
Wustite reduction 330 280 251 310 8.4
4.3 Selection and study of material blends
To have an idea about the reduction behaviour and also confirm the chemical composition of different by-products, studies by TG/DTA and XRD on BOF-sludge, BF-slugde and BOF-dust was conducted within CAMM. In Figure 26, XRD patterns of unreduced BF-sludge, BOF-sludge
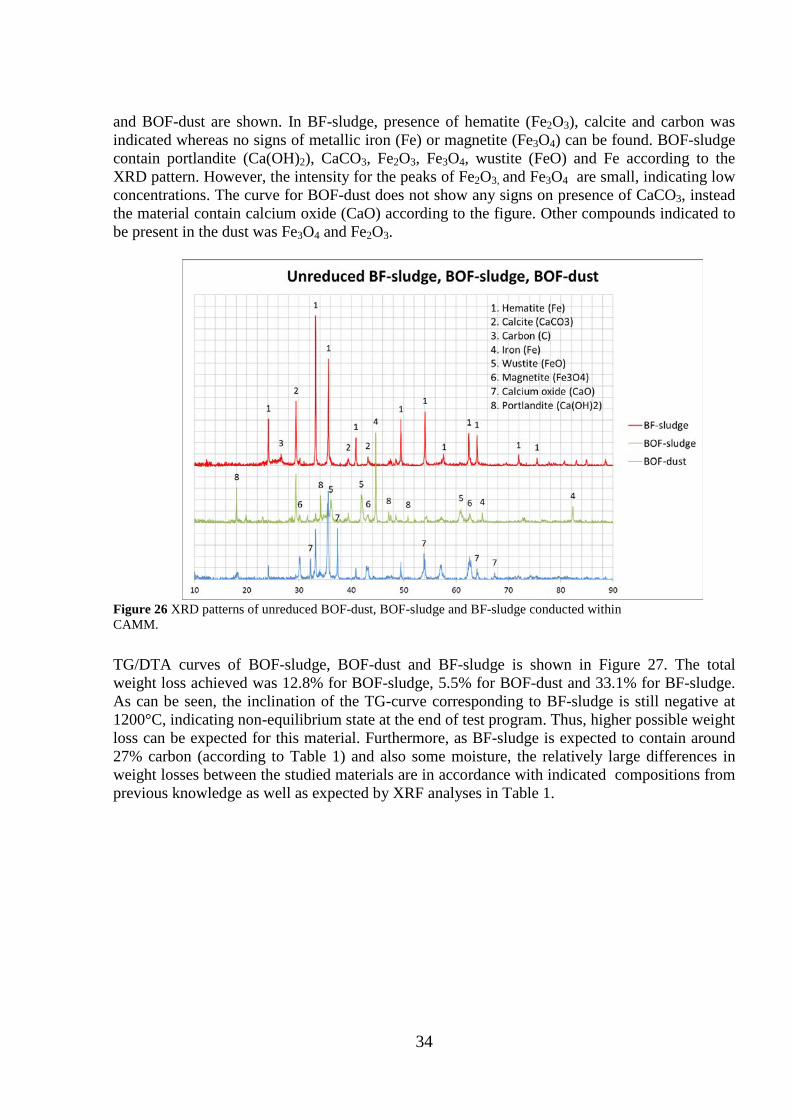
34
and BOF-dust are shown. In BF-sludge, presence of hematite (Fe2O3), calcite and carbon was indicated whereas no signs of metallic iron (Fe) or magnetite (Fe3O4) can be found. BOF-sludge contain portlandite (Ca(OH)2), CaCO3, Fe2O3, Fe3O4, wustite (FeO) and Fe according to the XRD pattern. However, the intensity for the peaks of Fe2O3, and Fe3O4 are small, indicating low concentrations. The curve for BOF-dust does not show any signs on presence of CaCO3, instead the material contain calcium oxide (CaO) according to the figure. Other compounds indicated to be present in the dust was Fe3O4 and Fe2O3.
TG/DTA curves of BOF-sludge, BOF-dust and BF-sludge is shown in Figure 27. The total weight loss achieved was 12.8% for BOF-sludge, 5.5% for BOF-dust and 33.1% for BF-sludge. As can be seen, the inclination of the TG-curve corresponding to BF-sludge is still negative at 1200°C, indicating non-equilibrium state at the end of test program. Thus, higher possible weight loss can be expected for this material. Furthermore, as BF-sludge is expected to contain around 27% carbon (according to Table 1) and also some moisture, the relatively large differences in weight losses between the studied materials are in accordance with indicated compositions from previous knowledge as well as expected by XRF analyses in Table 1.
Figure 26 XRD patterns of unreduced BOF-dust, BOF-sludge and BF-sludge conducted within CAMM.
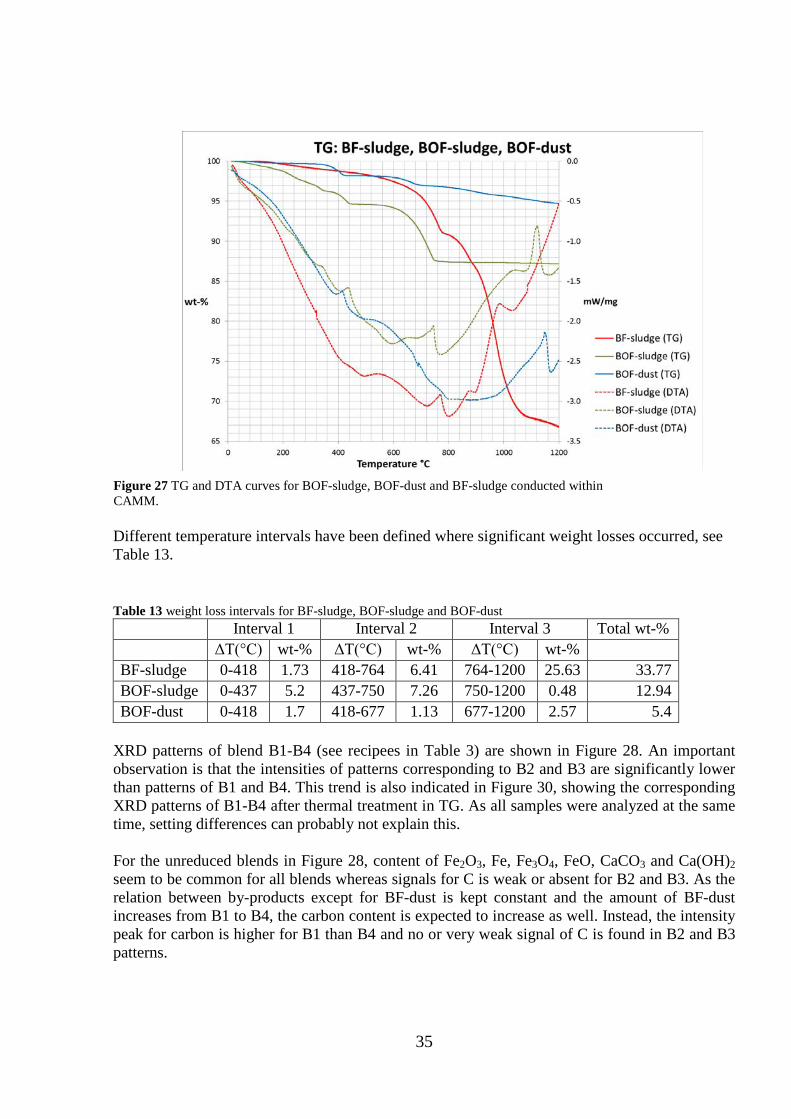
35
Different temperature intervals have been defined where significant weight losses occurred, see Table 13. Table 13 weight loss intervals for BF-sludge, BOF-sludge and BOF-dust Interval 1 Interval 2 Interval 3 Total wt-% ΔT(°C) wt-% ΔT(°C) wt-% ΔT(°C) wt-% BF-sludge 0-418 1.73 418-764 6.41 764-1200 25.63 33.77 BOF-sludge 0-437 5.2 437-750 7.26 750-1200 0.48 12.94 BOF-dust 0-418 1.7 418-677 1.13 677-1200 2.57 5.4
XRD patterns of blend B1-B4 (see recipees in Table 3) are shown in Figure 28. An important observation is that the intensities of patterns corresponding to B2 and B3 are significantly lower than patterns of B1 and B4. This trend is also indicated in Figure 30, showing the corresponding XRD patterns of B1-B4 after thermal treatment in TG. As all samples were analyzed at the same time, setting differences can probably not explain this. For the unreduced blends in Figure 28, content of Fe2O3, Fe, Fe3O4, FeO, CaCO3 and Ca(OH)2 seem to be common for all blends whereas signals for C is weak or absent for B2 and B3. As the relation between by-products except for BF-dust is kept constant and the amount of BF-dust increases from B1 to B4, the carbon content is expected to increase as well. Instead, the intensity peak for carbon is higher for B1 than B4 and no or very weak signal of C is found in B2 and B3 patterns.
Figure 27 TG and DTA curves for BOF-sludge, BOF-dust and BF-sludge conducted within CAMM.
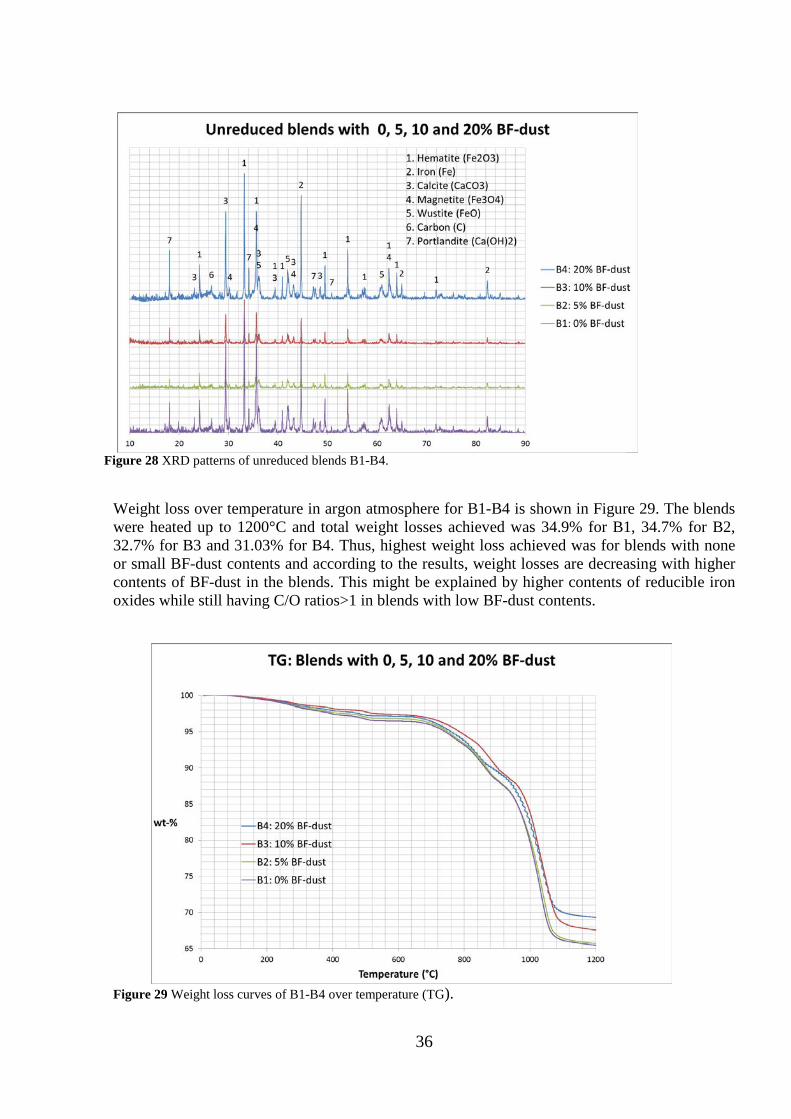
36
Weight loss over temperature in argon atmosphere for B1-B4 is shown in Figure 29. The blends were heated up to 1200°C and total weight losses achieved was 34.9% for B1, 34.7% for B2, 32.7% for B3 and 31.03% for B4. Thus, highest weight loss achieved was for blends with none or small BF-dust contents and according to the results, weight losses are decreasing with higher contents of BF-dust in the blends. This might be explained by higher contents of reducible iron oxides while still having C/O ratios>1 in blends with low BF-dust contents.
Figure 29 Weight loss curves of B1-B4 over temperature (TG).
Figure 28 XRD patterns of unreduced blends B1-B4.
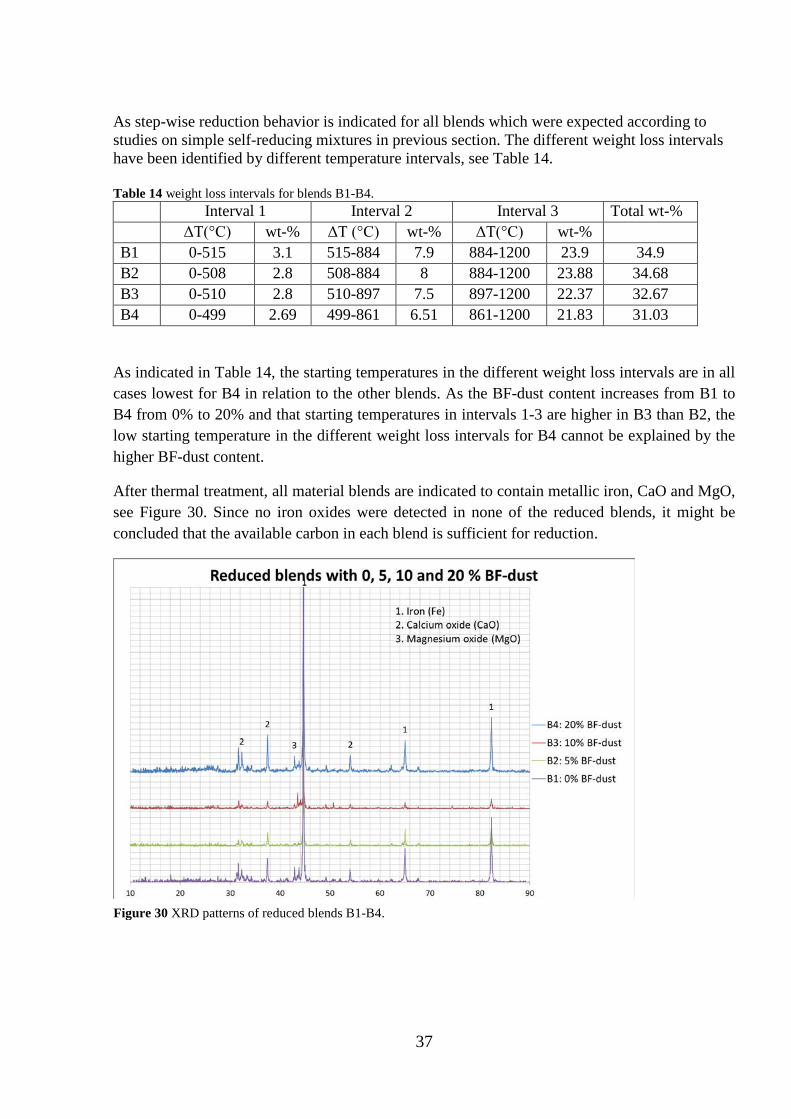
37
As step-wise reduction behavior is indicated for all blends which were expected according to studies on simple self-reducing mixtures in previous section. The different weight loss intervals have been identified by different temperature intervals, see Table 14. Table 14 weight loss intervals for blends B1-B4. Interval 1 Interval 2 Interval 3 Total wt-% ΔT(°C) wt-% ΔT (°C) wt-% ΔT(°C) wt-% B1 0-515 3.1 515-884 7.9 884-1200 23.9 34.9 B2 0-508 2.8 508-884 8 884-1200 23.88 34.68 B3 0-510 2.8 510-897 7.5 897-1200 22.37 32.67 B4 0-499 2.69 499-861 6.51 861-1200 21.83 31.03
As indicated in Table 14, the starting temperatures in the different weight loss intervals are in all cases lowest for B4 in relation to the other blends. As the BF-dust content increases from B1 to B4 from 0% to 20% and that starting temperatures in intervals 1-3 are higher in B3 than B2, the low starting temperature in the different weight loss intervals for B4 cannot be explained by the higher BF-dust content.
After thermal treatment, all material blends are indicated to contain metallic iron, CaO and MgO, see Figure 30. Since no iron oxides were detected in none of the reduced blends, it might be concluded that the available carbon in each blend is sufficient for reduction.
Figure 30 XRD patterns of reduced blends B1-B4.
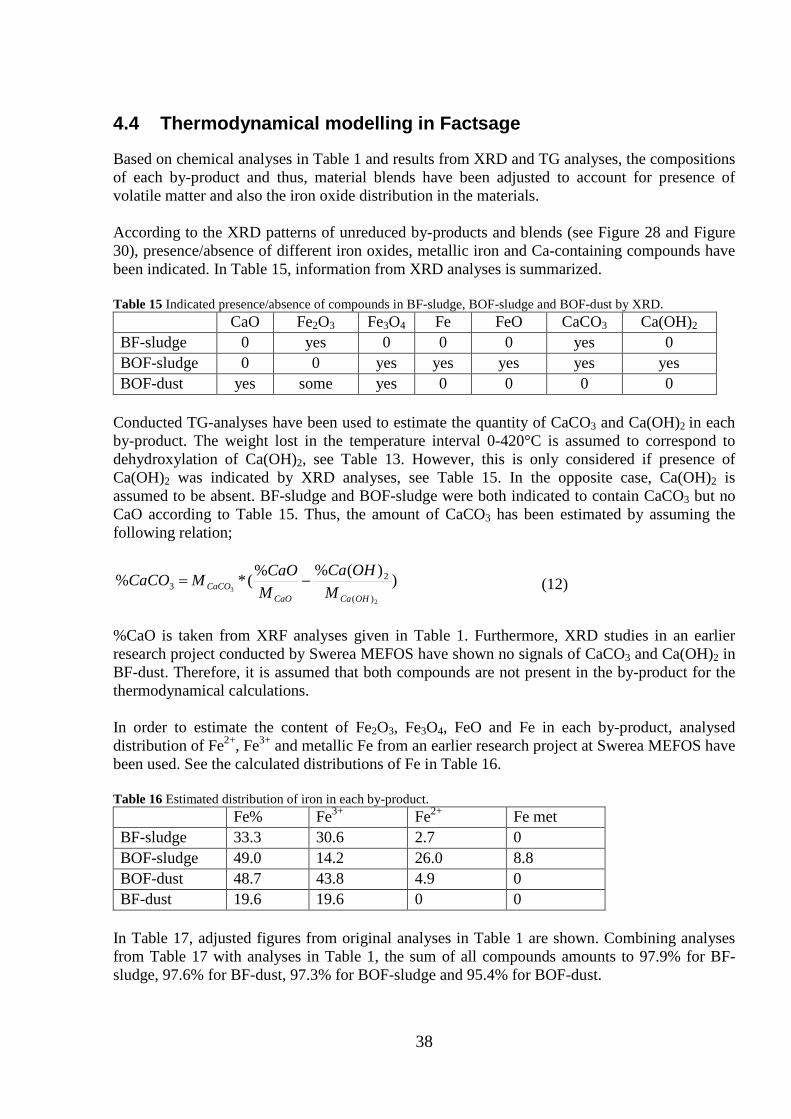
38
4.4 Thermodynamical modelling in Factsage
Based on chemical analyses in Table 1 and results from XRD and TG analyses, the compositions of each by-product and thus, material blends have been adjusted to account for presence of volatile matter and also the iron oxide distribution in the materials. According to the XRD patterns of unreduced by-products and blends (see Figure 28 and Figure 30), presence/absence of different iron oxides, metallic iron and Ca-containing compounds have been indicated. In Table 15, information from XRD analyses is summarized. Table 15 Indicated presence/absence of compounds in BF-sludge, BOF-sludge and BOF-dust by XRD. CaO Fe2O3 Fe3O4 Fe FeO CaCO3 Ca(OH)2 BF-sludge 0 yes 0 0 0 yes 0 BOF-sludge 0 0 yes yes yes yes yes BOF-dust yes some yes 0 0 0 0
Conducted TG-analyses have been used to estimate the quantity of CaCO3 and Ca(OH)2 in each by-product. The weight lost in the temperature interval 0-420°C is assumed to correspond to dehydroxylation of Ca(OH)2, see Table 13. However, this is only considered if presence of Ca(OH)2 was indicated by XRD analyses, see Table 15. In the opposite case, Ca(OH)2 is assumed to be absent. BF-sludge and BOF-sludge were both indicated to contain CaCO3 but no CaO according to Table 15. Thus, the amount of CaCO3 has been estimated by assuming the following relation;
))(%%(*%2
3)(
23
OHCaCaOCaCO M
OHCaM
CaOMCaCO −= (12)
%CaO is taken from XRF analyses given in Table 1. Furthermore, XRD studies in an earlier research project conducted by Swerea MEFOS have shown no signals of CaCO3 and Ca(OH)2 in BF-dust. Therefore, it is assumed that both compounds are not present in the by-product for the thermodynamical calculations. In order to estimate the content of Fe2O3, Fe3O4, FeO and Fe in each by-product, analysed distribution of Fe2+, Fe3+ and metallic Fe from an earlier research project at Swerea MEFOS have been used. See the calculated distributions of Fe in Table 16. Table 16 Estimated distribution of iron in each by-product. Fe% Fe3+ Fe2+ Fe met BF-sludge 33.3 30.6 2.7 0 BOF-sludge 49.0 14.2 26.0 8.8 BOF-dust 48.7 43.8 4.9 0 BF-dust 19.6 19.6 0 0
In Table 17, adjusted figures from original analyses in Table 1 are shown. Combining analyses from Table 17 with analyses in Table 1, the sum of all compounds amounts to 97.9% for BF-sludge, 97.6% for BF-dust, 97.3% for BOF-sludge and 95.4% for BOF-dust.
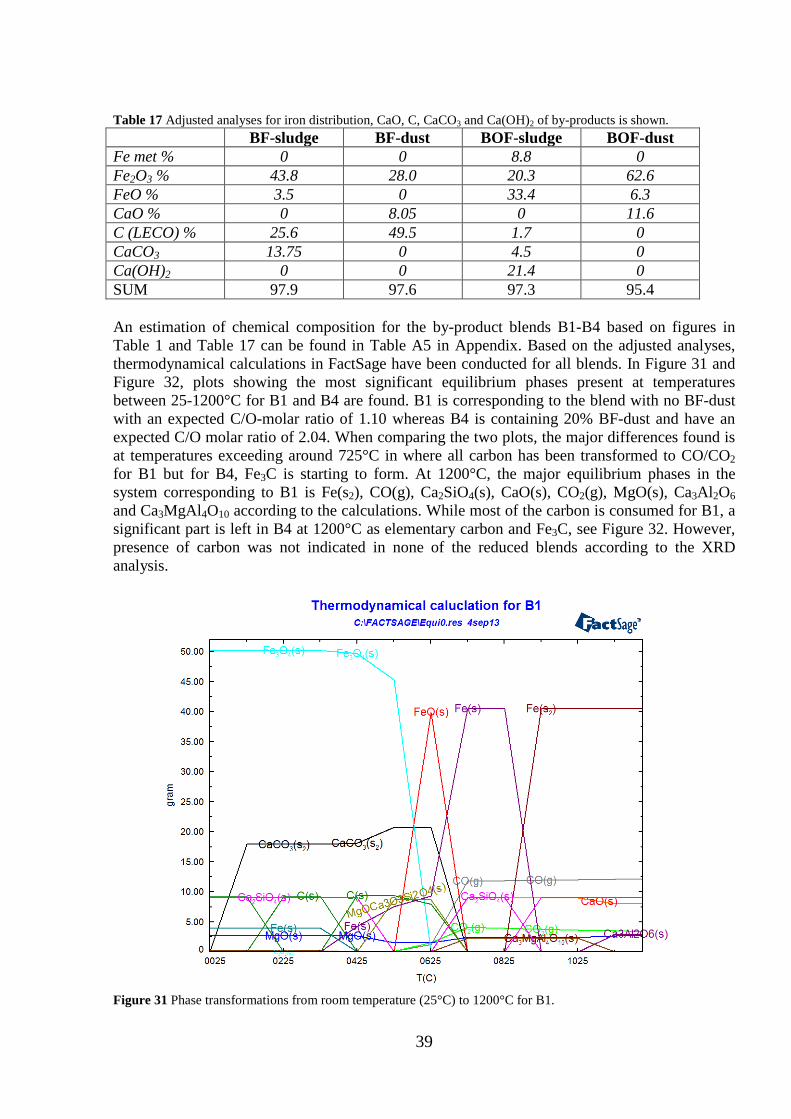
39
Table 17 Adjusted analyses for iron distribution, CaO, C, CaCO3 and Ca(OH)2 of by-products is shown. BF-sludge BF-dust BOF-sludge BOF-dust Fe met % 0 0 8.8 0 Fe2O3 % 43.8 28.0 20.3 62.6 FeO % 3.5 0 33.4 6.3 CaO % 0 8.05 0 11.6 C (LECO) % 25.6 49.5 1.7 0 CaCO3 13.75 0 4.5 0 Ca(OH)2 0 0 21.4 0 SUM 97.9 97.6 97.3 95.4 An estimation of chemical composition for the by-product blends B1-B4 based on figures in Table 1 and Table 17 can be found in Table A5 in Appendix. Based on the adjusted analyses, thermodynamical calculations in FactSage have been conducted for all blends. In Figure 31 and Figure 32, plots showing the most significant equilibrium phases present at temperatures between 25-1200°C for B1 and B4 are found. B1 is corresponding to the blend with no BF-dust with an expected C/O-molar ratio of 1.10 whereas B4 is containing 20% BF-dust and have an expected C/O molar ratio of 2.04. When comparing the two plots, the major differences found is at temperatures exceeding around 725°C in where all carbon has been transformed to CO/CO2 for B1 but for B4, Fe3C is starting to form. At 1200°C, the major equilibrium phases in the system corresponding to B1 is Fe(s2), CO(g), Ca2SiO4(s), CaO(s), CO2(g), MgO(s), Ca3Al2O6 and Ca3MgAl4O10 according to the calculations. While most of the carbon is consumed for B1, a significant part is left in B4 at 1200°C as elementary carbon and Fe3C, see Figure 32. However, presence of carbon was not indicated in none of the reduced blends according to the XRD analysis.
Figure 31 Phase transformations from room temperature (25°C) to 1200°C for B1.
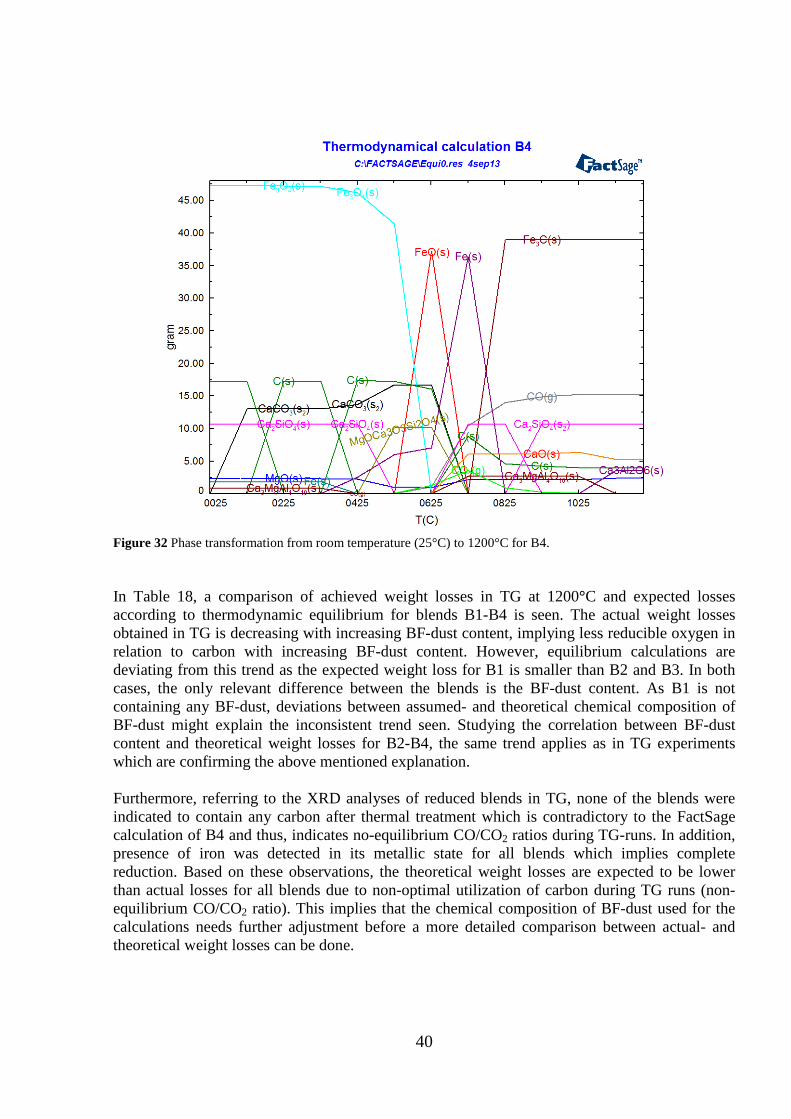
40
Figure 32 Phase transformation from room temperature (25°C) to 1200°C for B4. In Table 18, a comparison of achieved weight losses in TG at 1200°C and expected losses according to thermodynamic equilibrium for blends B1-B4 is seen. The actual weight losses obtained in TG is decreasing with increasing BF-dust content, implying less reducible oxygen in relation to carbon with increasing BF-dust content. However, equilibrium calculations are deviating from this trend as the expected weight loss for B1 is smaller than B2 and B3. In both cases, the only relevant difference between the blends is the BF-dust content. As B1 is not containing any BF-dust, deviations between assumed- and theoretical chemical composition of BF-dust might explain the inconsistent trend seen. Studying the correlation between BF-dust content and theoretical weight losses for B2-B4, the same trend applies as in TG experiments which are confirming the above mentioned explanation. Furthermore, referring to the XRD analyses of reduced blends in TG, none of the blends were indicated to contain any carbon after thermal treatment which is contradictory to the FactSage calculation of B4 and thus, indicates no-equilibrium CO/CO2 ratios during TG-runs. In addition, presence of iron was detected in its metallic state for all blends which implies complete reduction. Based on these observations, the theoretical weight losses are expected to be lower than actual losses for all blends due to non-optimal utilization of carbon during TG runs (non-equilibrium CO/CO2 ratio). This implies that the chemical composition of BF-dust used for the calculations needs further adjustment before a more detailed comparison between actual- and theoretical weight losses can be done.
41
Table 18 Weight losses achieved in TG at 1200°C compared to expected losses by FactSage for B1-B4.
4.5 Briquette trials
4.5.1 Production of lab-scale briquettes and pre-reduction studies
In Table 19, chemical analyses of green lab-scale briquettes corresponding to BM1 and BM2 are shown (se recipes in Table 4). Fe% is the total iron content in each blend including Fe3+, Fe2+ and metallic iron. Additional analyses have been conducted on Fe2+ and metallic Fe to know how the different states are distributed. Fe3+ have been estimated by subtracting Fe2+ and Fe metallic from Fe% in the XRF analysis, see Table 20. Table 19 XRF analysis of green lab-scale briquettes BM1 and BM2.
Table 20 Analysis of Fe2+ and metallic Fe by titration
Analysis BM1 BM2 Fe% 41.88 40.3 CaO% 18.56 17.85 SiO2% 6.03 6.53 MnO% 0.95 0.94 P2O5% 0.117 0.119 Al2O3% 1.75 1.96 MgO% 2.93 2.87 Na2O% <0.070 <0.070 K2O% 0.08 0.089 V2O5% 0.72 0.7 TiO2% 0.6 0.54 C % 9.2 11.3 S % 0.55 0.52 Zn (ppm) 840 740 Ni (ppm) 149 95 Total 83.5 83.8 GLF% -8.41 -10.78
% BM1 BM2 Fe2+ 5.17 5.52 Fe met 20.94 17.1 Fe3+ 15.77 17.68 Fe2O3 22.55 25.28 FeO 6.65 7.10 Total 91.76 92.98
In the original XRF analysis, the sum of all compounds was <84% for both blends. After calculating the distribution between metallic iron and iron oxides the total reached 91.76% for BM1 and 92.98% for BM2, see Table 20. The other 7-8% not explained by the analysis might be an indication on presence of calcite or other volatile matter as seen for sludge and dust in the previous chapter. Furthermore, compared to the estimated analyses of by-product blends without cement and scrap mix, the metallic iron content is higher and might be explained by a high metallic iron content in scrap mix. However, some scrap pieces might have been removed to enable grinding and hence, chemical analyses of each briquette type might not be fully representative. This possible condition has been considered when evaluating the reduction results. In Figure 33, an XRD analysis of BM1 and BM2 respectively is shown. Unlike the blends studied previously, the intensity peaks for CaCO3 is high in both BM1 and BM2
Wt-loss at 1200°C B1 B2 B3 B4 Equilibrium 33.1% 34.5% 33.9% 31.7% In TG 34.9 34.68 32.67 31.03
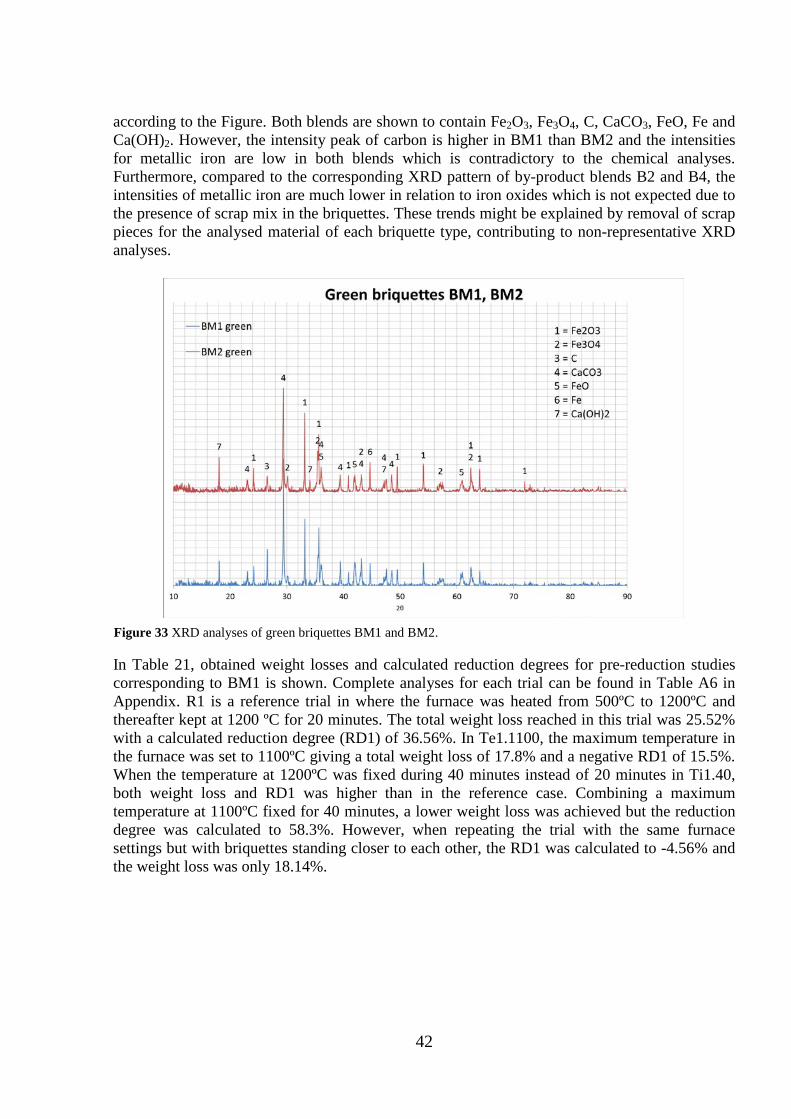
42
according to the Figure. Both blends are shown to contain Fe2O3, Fe3O4, C, CaCO3, FeO, Fe and Ca(OH)2. However, the intensity peak of carbon is higher in BM1 than BM2 and the intensities for metallic iron are low in both blends which is contradictory to the chemical analyses. Furthermore, compared to the corresponding XRD pattern of by-product blends B2 and B4, the intensities of metallic iron are much lower in relation to iron oxides which is not expected due to the presence of scrap mix in the briquettes. These trends might be explained by removal of scrap pieces for the analysed material of each briquette type, contributing to non-representative XRD analyses.
In Table 21, obtained weight losses and calculated reduction degrees for pre-reduction studies corresponding to BM1 is shown. Complete analyses for each trial can be found in Table A6 in Appendix. R1 is a reference trial in where the furnace was heated from 500ºC to 1200ºC and thereafter kept at 1200 ºC for 20 minutes. The total weight loss reached in this trial was 25.52% with a calculated reduction degree (RD1) of 36.56%. In Te1.1100, the maximum temperature in the furnace was set to 1100ºC giving a total weight loss of 17.8% and a negative RD1 of 15.5%. When the temperature at 1200ºC was fixed during 40 minutes instead of 20 minutes in Ti1.40, both weight loss and RD1 was higher than in the reference case. Combining a maximum temperature at 1100ºC fixed for 40 minutes, a lower weight loss was achieved but the reduction degree was calculated to 58.3%. However, when repeating the trial with the same furnace settings but with briquettes standing closer to each other, the RD1 was calculated to -4.56% and the weight loss was only 18.14%.
Figure 33 XRD analyses of green briquettes BM1 and BM2.
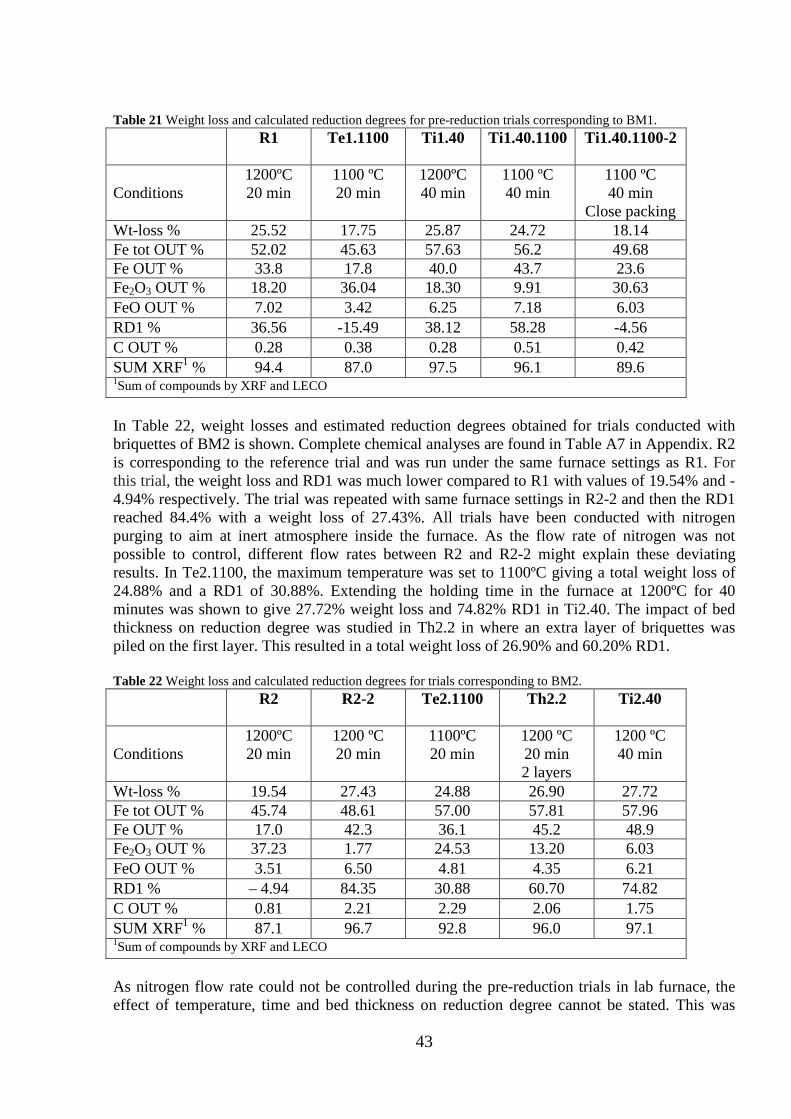
43
Table 21 Weight loss and calculated reduction degrees for pre-reduction trials corresponding to BM1. R1 Te1.1100 Ti1.40 Ti1.40.1100 Ti1.40.1100-2
Conditions 1200ºC 20 min
1100 ºC 20 min
1200ºC 40 min
1100 ºC 40 min
1100 ºC 40 min
Close packing Wt-loss % 25.52 17.75 25.87 24.72 18.14 Fe tot OUT % 52.02 45.63 57.63 56.2 49.68 Fe OUT % 33.8 17.8 40.0 43.7 23.6 Fe2O3 OUT % 18.20 36.04 18.30 9.91 30.63 FeO OUT % 7.02 3.42 6.25 7.18 6.03 RD1 % 36.56 -15.49 38.12 58.28 -4.56 C OUT % 0.28 0.38 0.28 0.51 0.42 SUM XRF1 % 94.4 87.0 97.5 96.1 89.6 1Sum of compounds by XRF and LECO
In Table 22, weight losses and estimated reduction degrees obtained for trials conducted with briquettes of BM2 is shown. Complete chemical analyses are found in Table A7 in Appendix. R2 is corresponding to the reference trial and was run under the same furnace settings as R1. For this trial, the weight loss and RD1 was much lower compared to R1 with values of 19.54% and -4.94% respectively. The trial was repeated with same furnace settings in R2-2 and then the RD1 reached 84.4% with a weight loss of 27.43%. All trials have been conducted with nitrogen purging to aim at inert atmosphere inside the furnace. As the flow rate of nitrogen was not possible to control, different flow rates between R2 and R2-2 might explain these deviating results. In Te2.1100, the maximum temperature was set to 1100ºC giving a total weight loss of 24.88% and a RD1 of 30.88%. Extending the holding time in the furnace at 1200ºC for 40 minutes was shown to give 27.72% weight loss and 74.82% RD1 in Ti2.40. The impact of bed thickness on reduction degree was studied in Th2.2 in where an extra layer of briquettes was piled on the first layer. This resulted in a total weight loss of 26.90% and 60.20% RD1. Table 22 Weight loss and calculated reduction degrees for trials corresponding to BM2. R2 R2-2 Te2.1100 Th2.2 Ti2.40
Conditions 1200ºC 20 min
1200 ºC 20 min
1100ºC 20 min
1200 ºC 20 min 2 layers
1200 ºC 40 min
Wt-loss % 19.54 27.43 24.88 26.90 27.72 Fe tot OUT % 45.74 48.61 57.00 57.81 57.96 Fe OUT % 17.0 42.3 36.1 45.2 48.9 Fe2O3 OUT % 37.23 1.77 24.53 13.20 6.03 FeO OUT % 3.51 6.50 4.81 4.35 6.21 RD1 % – 4.94 84.35 30.88 60.70 74.82 C OUT % 0.81 2.21 2.29 2.06 1.75 SUM XRF1 % 87.1 96.7 92.8 96.0 97.1 1Sum of compounds by XRF and LECO As nitrogen flow rate could not be controlled during the pre-reduction trials in lab furnace, the effect of temperature, time and bed thickness on reduction degree cannot be stated. This was
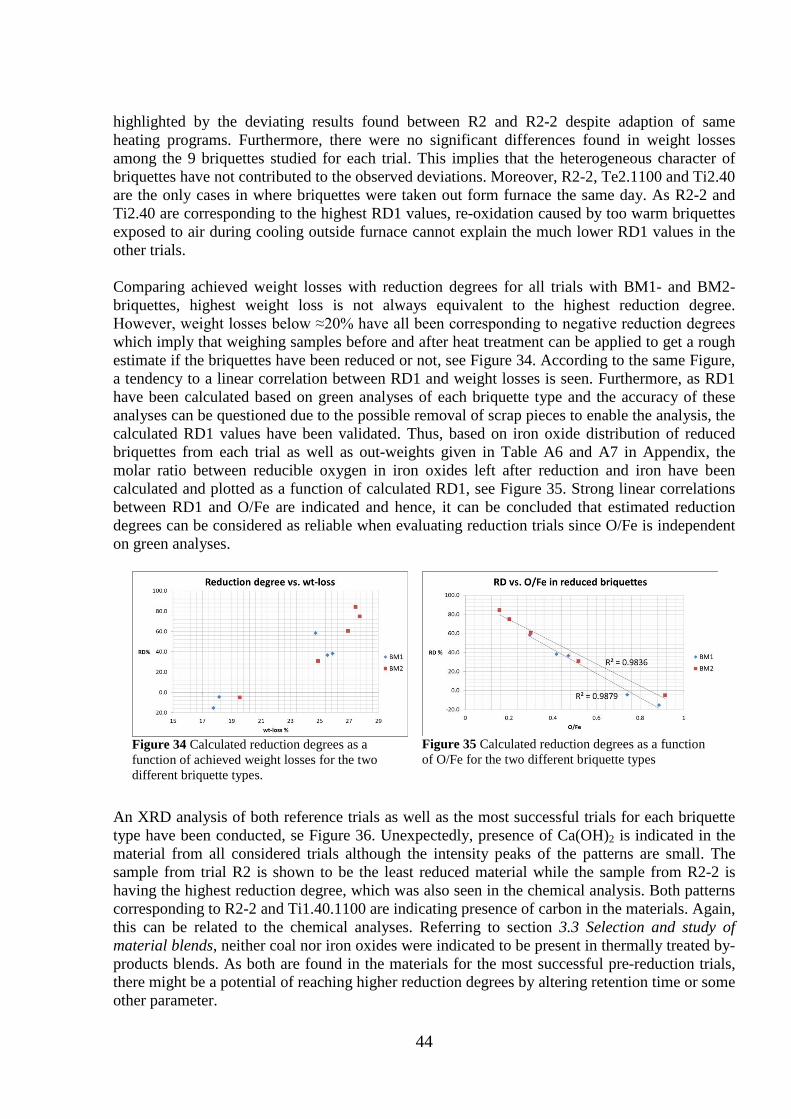
44
highlighted by the deviating results found between R2 and R2-2 despite adaption of same heating programs. Furthermore, there were no significant differences found in weight losses among the 9 briquettes studied for each trial. This implies that the heterogeneous character of briquettes have not contributed to the observed deviations. Moreover, R2-2, Te2.1100 and Ti2.40 are the only cases in where briquettes were taken out form furnace the same day. As R2-2 and Ti2.40 are corresponding to the highest RD1 values, re-oxidation caused by too warm briquettes exposed to air during cooling outside furnace cannot explain the much lower RD1 values in the other trials. Comparing achieved weight losses with reduction degrees for all trials with BM1- and BM2-briquettes, highest weight loss is not always equivalent to the highest reduction degree. However, weight losses below ≈20% have all been corresponding to negative reduction degrees which imply that weighing samples before and after heat treatment can be applied to get a rough estimate if the briquettes have been reduced or not, see Figure 34. According to the same Figure, a tendency to a linear correlation between RD1 and weight losses is seen. Furthermore, as RD1 have been calculated based on green analyses of each briquette type and the accuracy of these analyses can be questioned due to the possible removal of scrap pieces to enable the analysis, the calculated RD1 values have been validated. Thus, based on iron oxide distribution of reduced briquettes from each trial as well as out-weights given in Table A6 and A7 in Appendix, the molar ratio between reducible oxygen in iron oxides left after reduction and iron have been calculated and plotted as a function of calculated RD1, see Figure 35. Strong linear correlations between RD1 and O/Fe are indicated and hence, it can be concluded that estimated reduction degrees can be considered as reliable when evaluating reduction trials since O/Fe is independent on green analyses.
Figure 34 Calculated reduction degrees as a function of achieved weight losses for the two different briquette types.
An XRD analysis of both reference trials as well as the most successful trials for each briquette type have been conducted, se Figure 36. Unexpectedly, presence of Ca(OH)2 is indicated in the material from all considered trials although the intensity peaks of the patterns are small. The sample from trial R2 is shown to be the least reduced material while the sample from R2-2 is having the highest reduction degree, which was also seen in the chemical analysis. Both patterns corresponding to R2-2 and Ti1.40.1100 are indicating presence of carbon in the materials. Again, this can be related to the chemical analyses. Referring to section 3.3 Selection and study of material blends, neither coal nor iron oxides were indicated to be present in thermally treated by-products blends. As both are found in the materials for the most successful pre-reduction trials, there might be a potential of reaching higher reduction degrees by altering retention time or some other parameter.
Figure 35 Calculated reduction degrees as a function of O/Fe for the two different briquette types
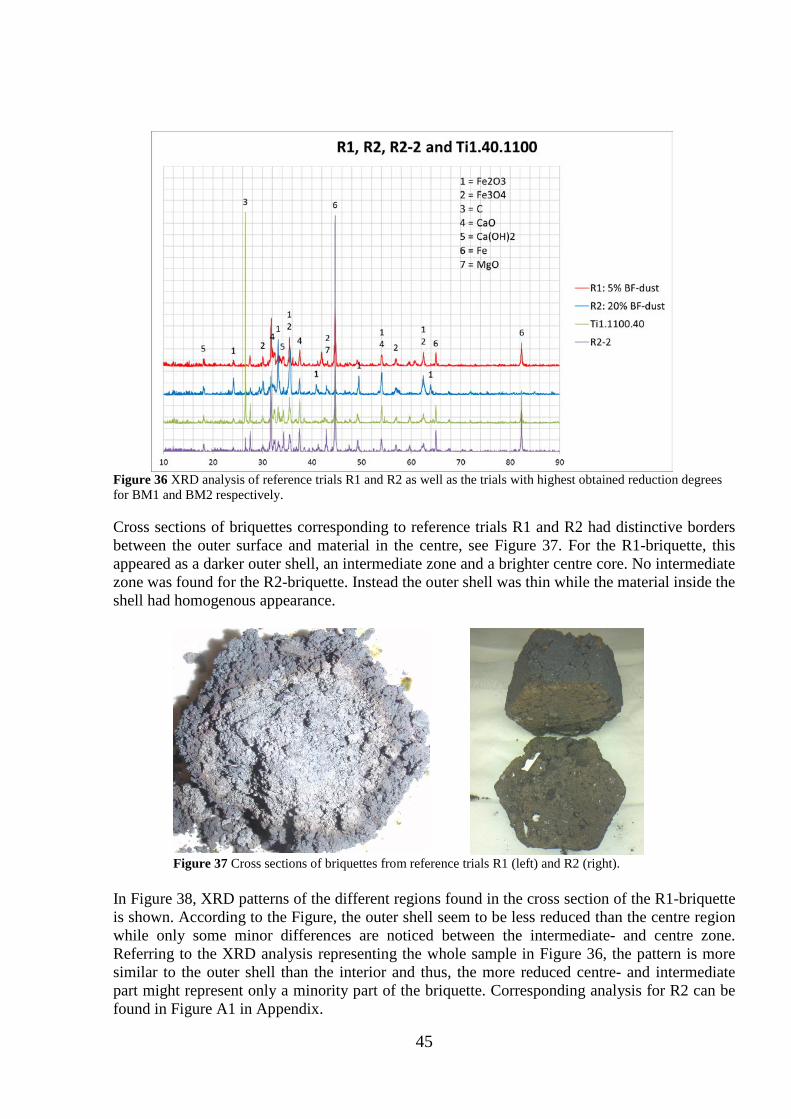
45
Figure 36 XRD analysis of reference trials R1 and R2 as well as the trials with highest obtained reduction degrees for BM1 and BM2 respectively. Cross sections of briquettes corresponding to reference trials R1 and R2 had distinctive borders between the outer surface and material in the centre, see Figure 37. For the R1-briquette, this appeared as a darker outer shell, an intermediate zone and a brighter centre core. No intermediate zone was found for the R2-briquette. Instead the outer shell was thin while the material inside the shell had homogenous appearance.
Figure 37 Cross sections of briquettes from reference trials R1 (left) and R2 (right).
In Figure 38, XRD patterns of the different regions found in the cross section of the R1-briquette is shown. According to the Figure, the outer shell seem to be less reduced than the centre region while only some minor differences are noticed between the intermediate- and centre zone. Referring to the XRD analysis representing the whole sample in Figure 36, the pattern is more similar to the outer shell than the interior and thus, the more reduced centre- and intermediate part might represent only a minority part of the briquette. Corresponding analysis for R2 can be found in Figure A1 in Appendix.
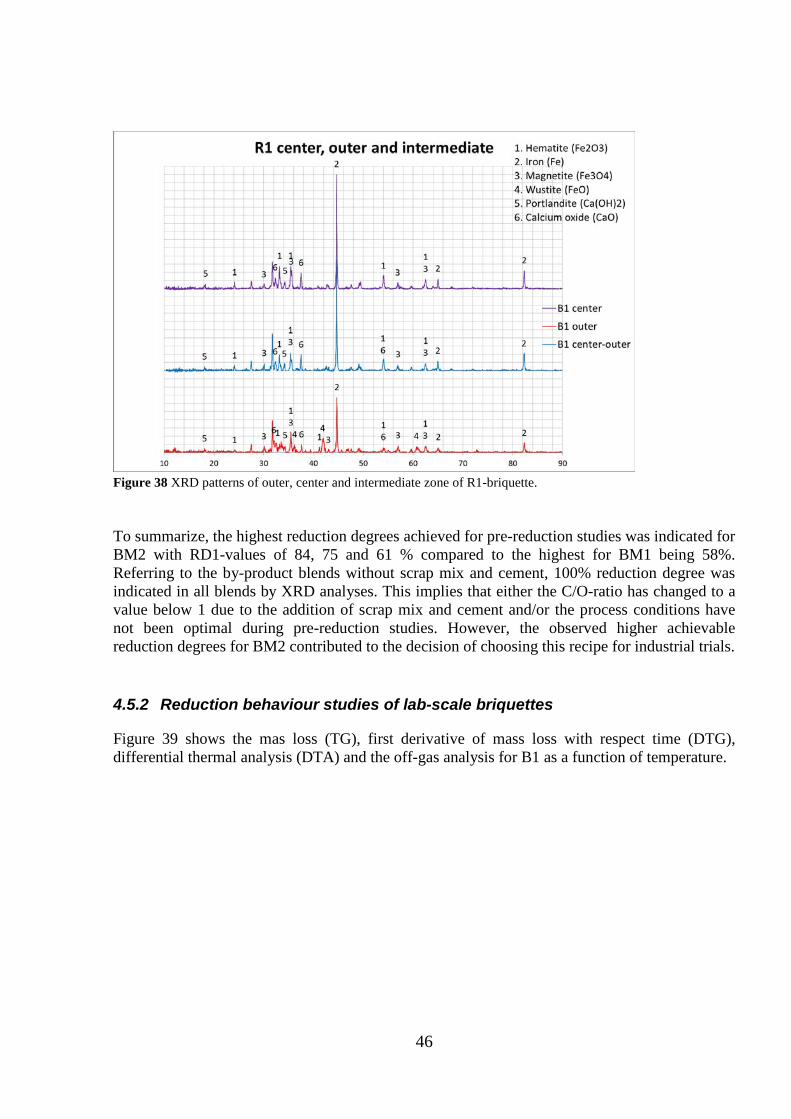
46
To summarize, the highest reduction degrees achieved for pre-reduction studies was indicated for BM2 with RD1-values of 84, 75 and 61 % compared to the highest for BM1 being 58%. Referring to the by-product blends without scrap mix and cement, 100% reduction degree was indicated in all blends by XRD analyses. This implies that either the C/O-ratio has changed to a value below 1 due to the addition of scrap mix and cement and/or the process conditions have not been optimal during pre-reduction studies. However, the observed higher achievable reduction degrees for BM2 contributed to the decision of choosing this recipe for industrial trials. 4.5.2 Reduction behaviour studies of lab-scale briquettes
Figure 39 shows the mas loss (TG), first derivative of mass loss with respect time (DTG), differential thermal analysis (DTA) and the off-gas analysis for B1 as a function of temperature.
Figure 38 XRD patterns of outer, center and intermediate zone of R1-briquette.
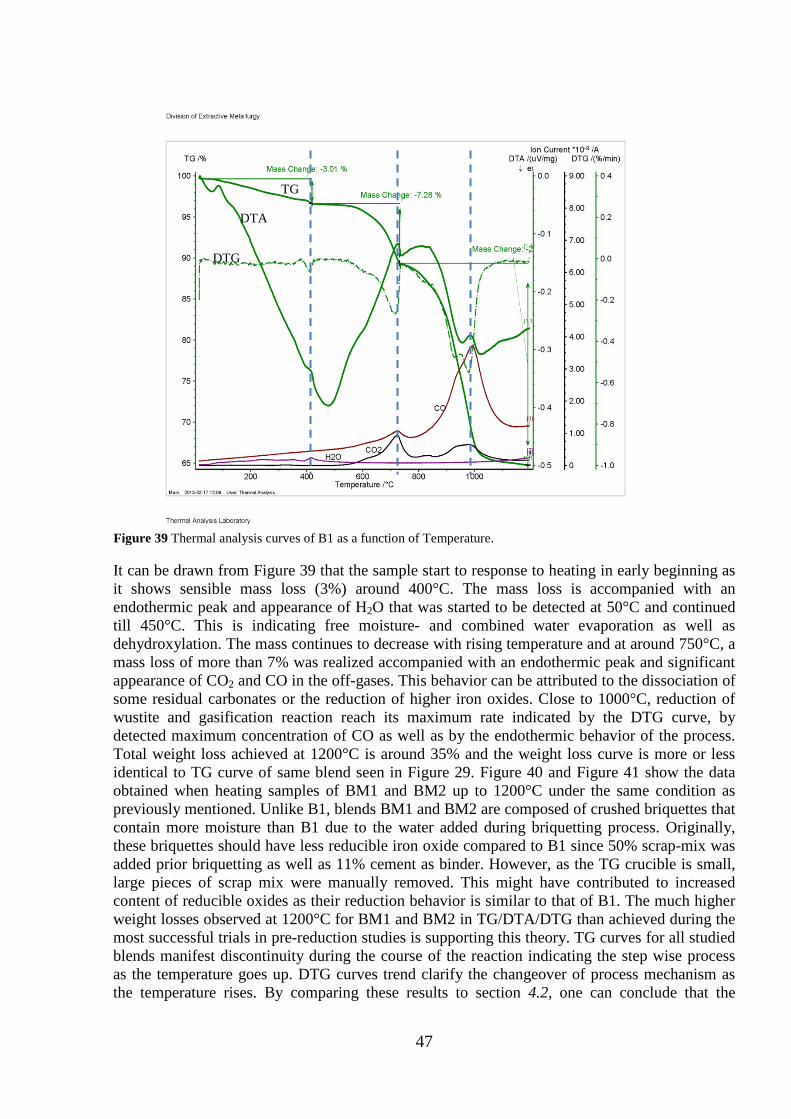
47
It can be drawn from Figure 39 that the sample start to response to heating in early beginning as it shows sensible mass loss (3%) around 400°C. The mass loss is accompanied with an endothermic peak and appearance of H2O that was started to be detected at 50°C and continued till 450°C. This is indicating free moisture- and combined water evaporation as well as dehydroxylation. The mass continues to decrease with rising temperature and at around 750°C, a mass loss of more than 7% was realized accompanied with an endothermic peak and significant appearance of CO2 and CO in the off-gases. This behavior can be attributed to the dissociation of some residual carbonates or the reduction of higher iron oxides. Close to 1000°C, reduction of wustite and gasification reaction reach its maximum rate indicated by the DTG curve, by detected maximum concentration of CO as well as by the endothermic behavior of the process. Total weight loss achieved at 1200°C is around 35% and the weight loss curve is more or less identical to TG curve of same blend seen in Figure 29. Figure 40 and Figure 41 show the data obtained when heating samples of BM1 and BM2 up to 1200°C under the same condition as previously mentioned. Unlike B1, blends BM1 and BM2 are composed of crushed briquettes that contain more moisture than B1 due to the water added during briquetting process. Originally, these briquettes should have less reducible iron oxide compared to B1 since 50% scrap-mix was added prior briquetting as well as 11% cement as binder. However, as the TG crucible is small, large pieces of scrap mix were manually removed. This might have contributed to increased content of reducible oxides as their reduction behavior is similar to that of B1. The much higher weight losses observed at 1200°C for BM1 and BM2 in TG/DTA/DTG than achieved during the most successful trials in pre-reduction studies is supporting this theory. TG curves for all studied blends manifest discontinuity during the course of the reaction indicating the step wise process as the temperature goes up. DTG curves trend clarify the changeover of process mechanism as the temperature rises. By comparing these results to section 4.2, one can conclude that the
DTG
DTA
TG
Figure 39 Thermal analysis curves of B1 as a function of Temperature.
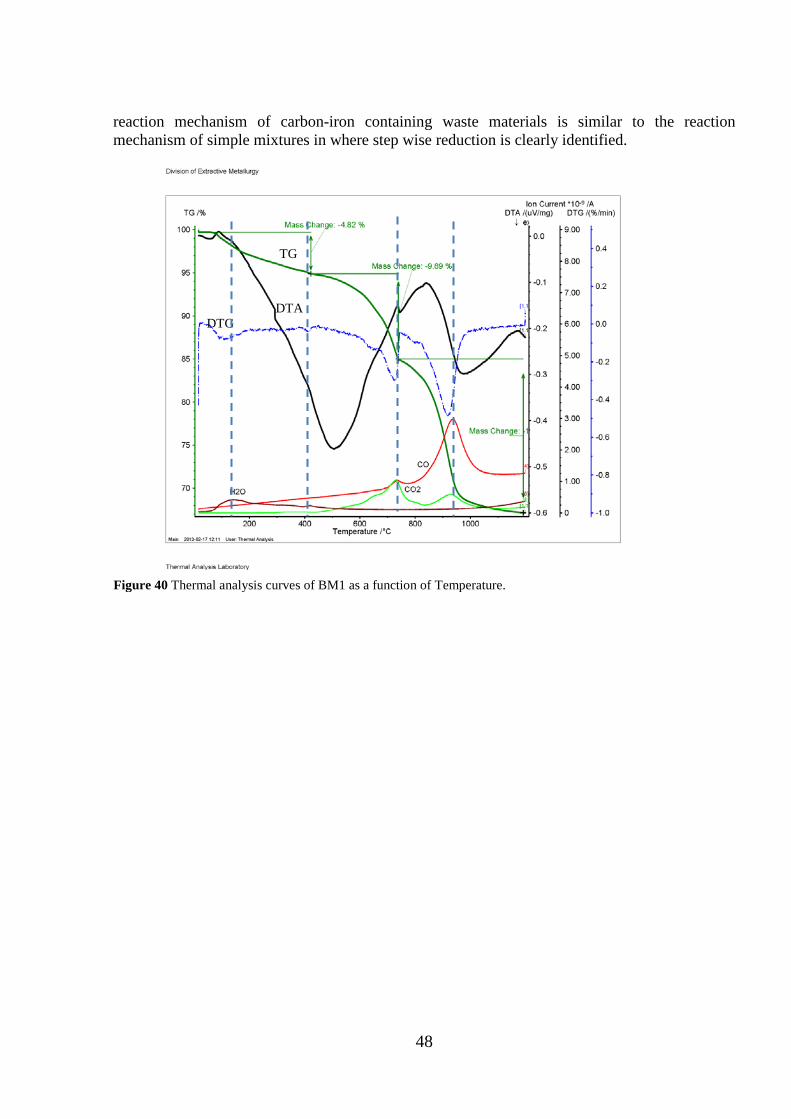
48
reaction mechanism of carbon-iron containing waste materials is similar to the reaction mechanism of simple mixtures in where step wise reduction is clearly identified.
DTG DTA
TG
Figure 40 Thermal analysis curves of BM1 as a function of Temperature.
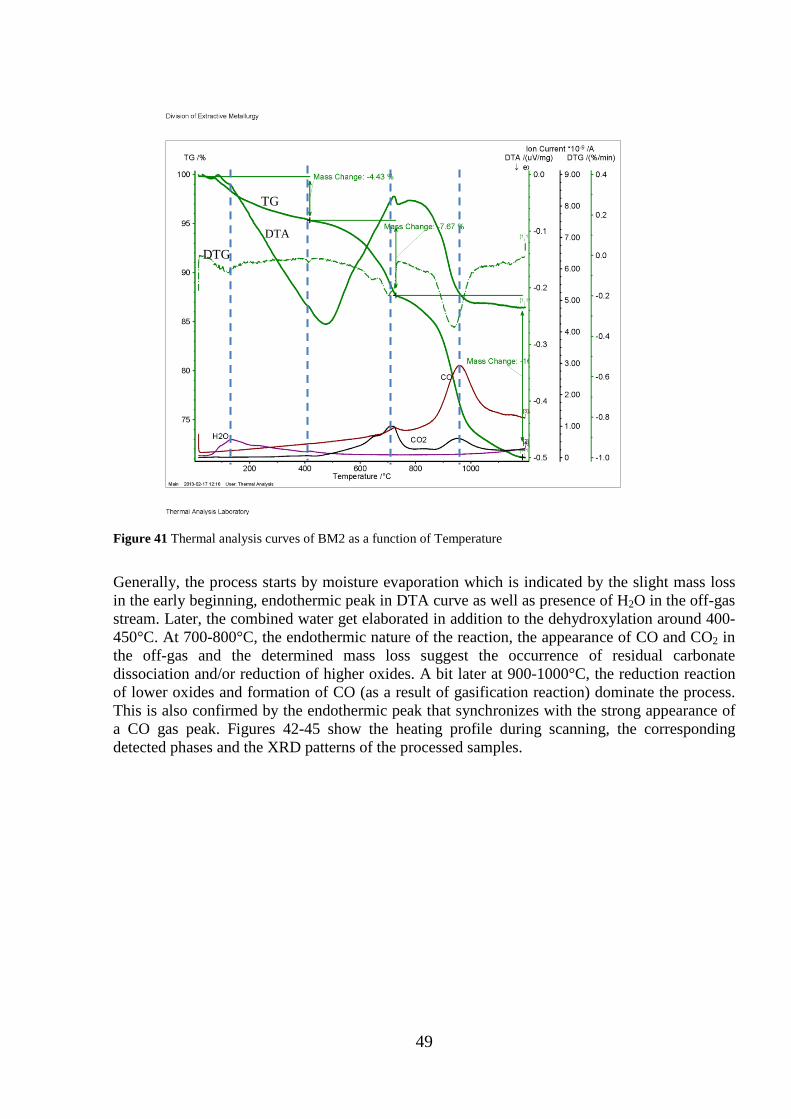
49
Generally, the process starts by moisture evaporation which is indicated by the slight mass loss in the early beginning, endothermic peak in DTA curve as well as presence of H2O in the off-gas stream. Later, the combined water get elaborated in addition to the dehydroxylation around 400-450°C. At 700-800°C, the endothermic nature of the reaction, the appearance of CO and CO2 in the off-gas and the determined mass loss suggest the occurrence of residual carbonate dissociation and/or reduction of higher oxides. A bit later at 900-1000°C, the reduction reaction of lower oxides and formation of CO (as a result of gasification reaction) dominate the process. This is also confirmed by the endothermic peak that synchronizes with the strong appearance of a CO gas peak. Figures 42-45 show the heating profile during scanning, the corresponding detected phases and the XRD patterns of the processed samples.
DTG DTA
TG
Figure 41 Thermal analysis curves of BM2 as a function of Temperature
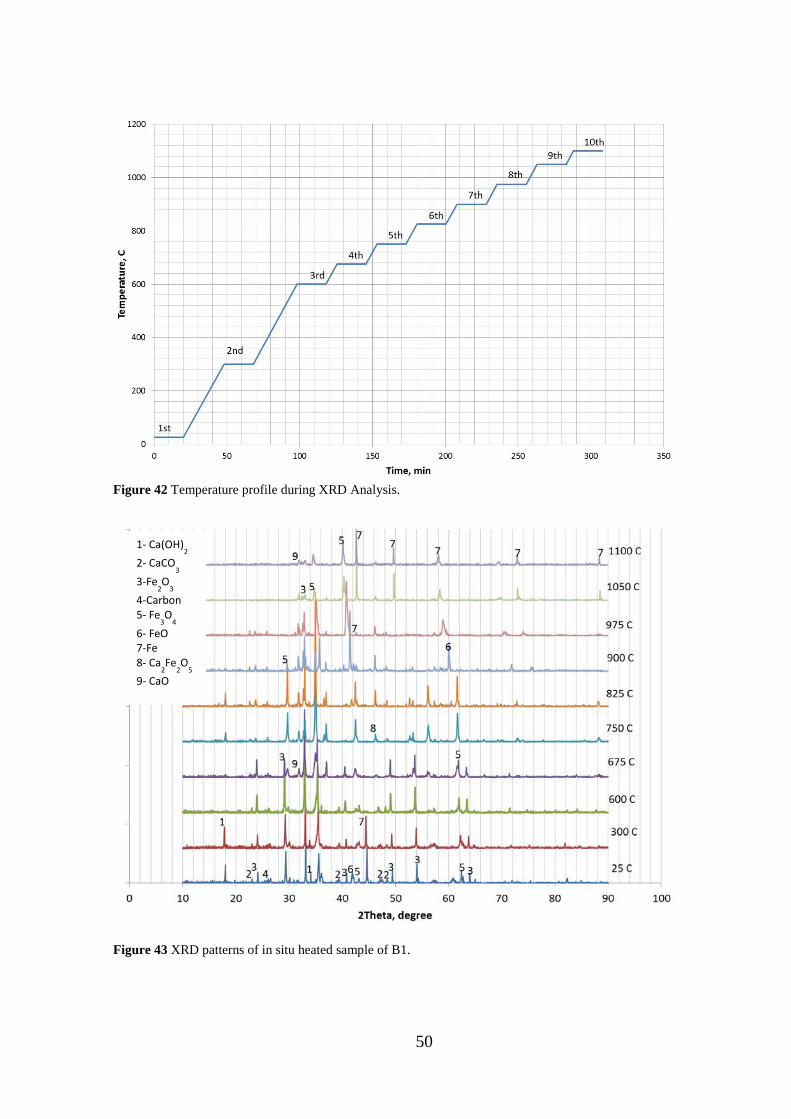
50
Figure 42 Temperature profile during XRD Analysis.
Figure 43 XRD patterns of in situ heated sample of B1.
1- Ca(OH)2
2- CaCO3
3-Fe2O
3 4-Carbon 5- Fe
3O
4
6- FeO 7-Fe 8- Ca
2Fe
2O
5 9- CaO
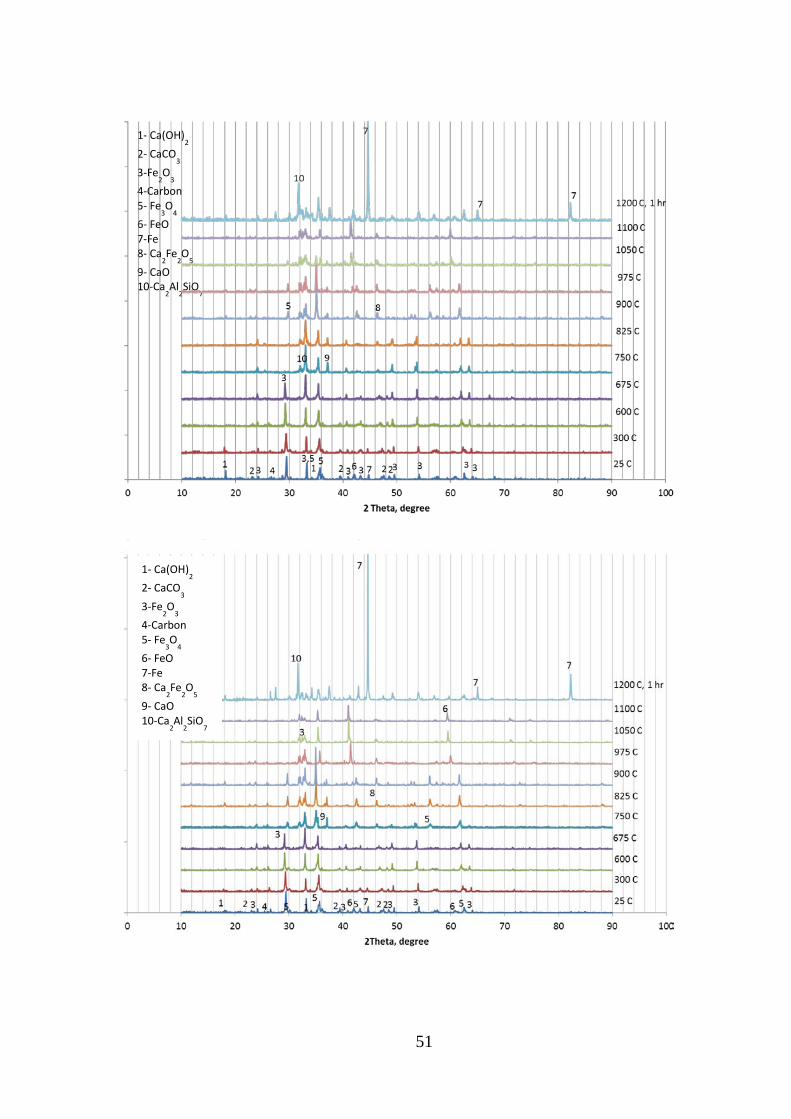
51
Figure 44 XRD patterns of in situ heated sample of BM1.
Figure 45 XRD patterns of in situ heated sample of BM2.
1- Ca(OH)2
2- CaCO3
3-Fe2O
3 4-Carbon 5- Fe
3O
4 6- FeO 7-Fe 8- Ca
2Fe
2O
5 9- CaO 10-Ca
2Al
2SiO
7
1- Ca(OH)2
2- CaCO3
3-Fe2O
3 4-Carbon 5- Fe
3O
4 6- FeO 7-Fe 8- Ca
2Fe
2O
5 9- CaO 10-Ca
2Al
2SiO
7
52
The samples were introduced into the even temperature zone of a small furnace (the furnace is assembled in such a way to enable the X-ray scanning in-situ) and a flow of Ar-gas was maintained during the course of process. As shown in Figure 42, the samples were subjected to the first scan at ambient temperature. The second scan was carried out at 300°C while the third was run at 600°C with 10°C/min fixed heating rate. The sample was then scanned every 75°C until the temperature reached 1100°C. Samples of externally heated briquettes at 1200°C for 1 hour were also subjected to XRD analysis and the results are included in the above drawn figures (for BM1 and BM2). It should be emphasized that these samples originates from briquette mixtures including scrap mix and cement whereas scrap pieces was removed for the in-situ scanned samples and hence, the different XRD patterns are therefore not directly comparable. It can be observed for the above XRD patterns that the dominating phases of the prepared blends prior the reduction are Ca(OH)2, CaCO3, Fe2O3, Fe3O4, FeO and Fe. Referring to the chemical analyses of green briquettes BM1 and BM2 (Table 19 and Table 20), the intensity peaks of metallic iron are lower in relation to the other iron oxides than expected which might confirm non-representative samples due to scrap removal. On heating, the existing wustite and metallic iron get oxidized by the trapped oxygen in the sample or by oxygen transfer (solid diffusion) from higher oxides to lower ones and in addition, the hydroxide phase disappear. Later at 750°C as a result of carbonate decomposition and primary slag formation, new phases appear like CaO, Ca2Fe2O5 and Ca2Al2SiO7. Reduction of hematite into magnetite was almost completed at 850°C and wustite phase start to be dominating. For free BF-dust blend (B1), metallic iron was the main phase detected at temperatures higher than 975°C. Metallic iron peaks were hardly detected in in-situ heated samples of BM1 and BM2. This is can be explained by either defect atmosphere control during heating and scanning or by short residence time of locally produced reducing gases. The latter might be due to small sample thickness or high flow rate of inert gas (the inert gas flow rate in XRD test could not be controlled, the operator could just ensure the presence of continuous flow of inert gas). However, the step wise-reduction of waste material containing briquettes is approved from XRD observations and the reactions seem to be very sensitive to the experimental conditions. This latter trend was also indicated during pre-reduction studies as deviating reduction degrees was achieved for same heating program but with uncontrolled nitrogen flow, see previous section. Furthermore, the XRD patterns of samples heated externally at 1200°C indicated reduction degrees of 100% as no iron oxides was detected. Hence, C/O ratio in BM1 and BM2 are sufficient which confirms that the process conditions during the pre-reduction studies contributed to briquettes not being fully reduced.
On the right hand side of Figure 46, three images are showing the sample size change as the temperature goes up during heating microscope tests, the first one at ambient condition, the second is for deformed briquette and the third is for completely melted sample. All the samples show thermal stability (no size alteration) up to around 700°C (Figure 46). After that, they showed gradual swelling which is significantly composition dependent. B1 shows minimum swelling (5%) while BM2 shows the maximum one (20%). The difference in the swelling behavior for the studied blends might be attributed to BF-dust content, the higher the BF-dust content the higher the swelling percentage. On the other hand, a consistent relation between the BF-dust content and flow temperature was not clear and a solid conclusion could not be drawn. All samples show a narrow range of melting temperature independent of the composition (Figure 46).
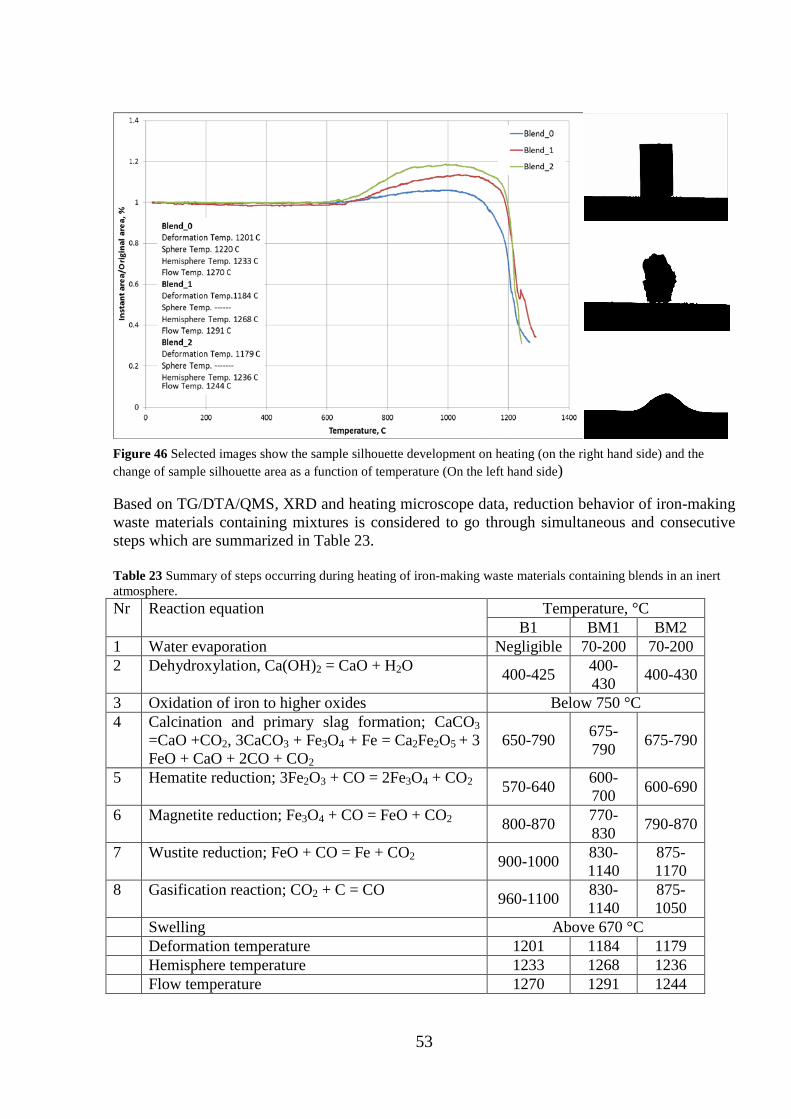
53
Based on TG/DTA/QMS, XRD and heating microscope data, reduction behavior of iron-making waste materials containing mixtures is considered to go through simultaneous and consecutive steps which are summarized in Table 23. Table 23 Summary of steps occurring during heating of iron-making waste materials containing blends in an inert atmosphere. Nr Reaction equation Temperature, °C
B1 BM1 BM2 1 Water evaporation Negligible 70-200 70-200 2 Dehydroxylation, Ca(OH)2 = CaO + H2O 400-425 400-
430 400-430
3 Oxidation of iron to higher oxides Below 750 °C 4 Calcination and primary slag formation; CaCO3
=CaO +CO2, 3CaCO3 + Fe3O4 + Fe = Ca2Fe2O5 + 3 FeO + CaO + 2CO + CO2
650-790 675-790 675-790
5 Hematite reduction; 3Fe2O3 + CO = 2Fe3O4 + CO2 570-640 600-700 600-690
6 Magnetite reduction; Fe3O4 + CO = FeO + CO2 800-870 770-830 790-870
7 Wustite reduction; FeO + CO = Fe + CO2 900-1000 830-1140
875-1170
8 Gasification reaction; CO2 + C = CO 960-1100 830-1140
875-1050
Swelling Above 670 °C Deformation temperature 1201 1184 1179 Hemisphere temperature 1233 1268 1236 Flow temperature 1270 1291 1244
Figure 46 Selected images show the sample silhouette development on heating (on the right hand side) and the change of sample silhouette area as a function of temperature (On the left hand side)
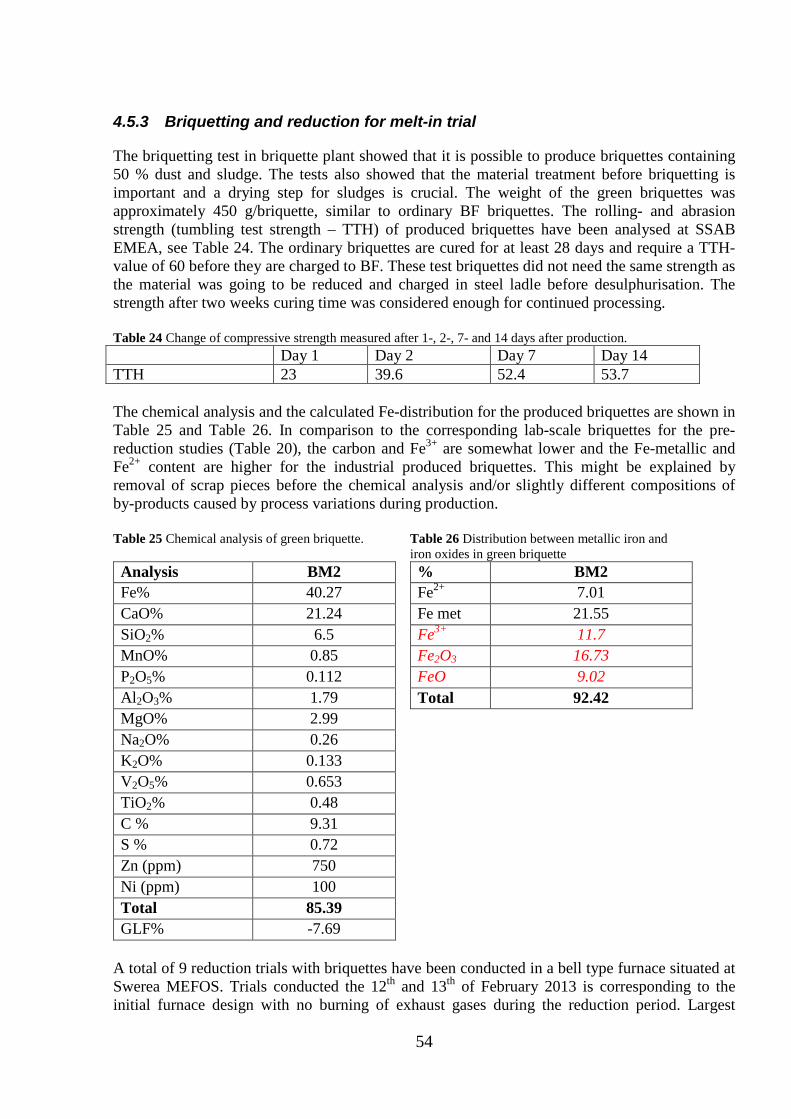
54
4.5.3 Briquetting and reduction for melt-in trial
The briquetting test in briquette plant showed that it is possible to produce briquettes containing 50 % dust and sludge. The tests also showed that the material treatment before briquetting is important and a drying step for sludges is crucial. The weight of the green briquettes was approximately 450 g/briquette, similar to ordinary BF briquettes. The rolling- and abrasion strength (tumbling test strength – TTH) of produced briquettes have been analysed at SSAB EMEA, see Table 24. The ordinary briquettes are cured for at least 28 days and require a TTH-value of 60 before they are charged to BF. These test briquettes did not need the same strength as the material was going to be reduced and charged in steel ladle before desulphurisation. The strength after two weeks curing time was considered enough for continued processing. Table 24 Change of compressive strength measured after 1-, 2-, 7- and 14 days after production. Day 1 Day 2 Day 7 Day 14 TTH 23 39.6 52.4 53.7 The chemical analysis and the calculated Fe-distribution for the produced briquettes are shown in Table 25 and Table 26. In comparison to the corresponding lab-scale briquettes for the pre-reduction studies (Table 20), the carbon and Fe3+ are somewhat lower and the Fe-metallic and Fe2+ content are higher for the industrial produced briquettes. This might be explained by removal of scrap pieces before the chemical analysis and/or slightly different compositions of by-products caused by process variations during production. Table 25 Chemical analysis of green briquette. Table 26 Distribution between metallic iron and
iron oxides in green briquette Analysis BM2 Fe% 40.27 CaO% 21.24 SiO2% 6.5 MnO% 0.85 P2O5% 0.112 Al2O3% 1.79 MgO% 2.99 Na2O% 0.26 K2O% 0.133 V2O5% 0.653 TiO2% 0.48 C % 9.31 S % 0.72 Zn (ppm) 750 Ni (ppm) 100 Total 85.39 GLF% -7.69
% BM2 Fe2+ 7.01 Fe met 21.55 Fe3+ 11.7 Fe2O3 16.73 FeO 9.02 Total 92.42
A total of 9 reduction trials with briquettes have been conducted in a bell type furnace situated at Swerea MEFOS. Trials conducted the 12th and 13th of February 2013 is corresponding to the initial furnace design with no burning of exhaust gases during the reduction period. Largest
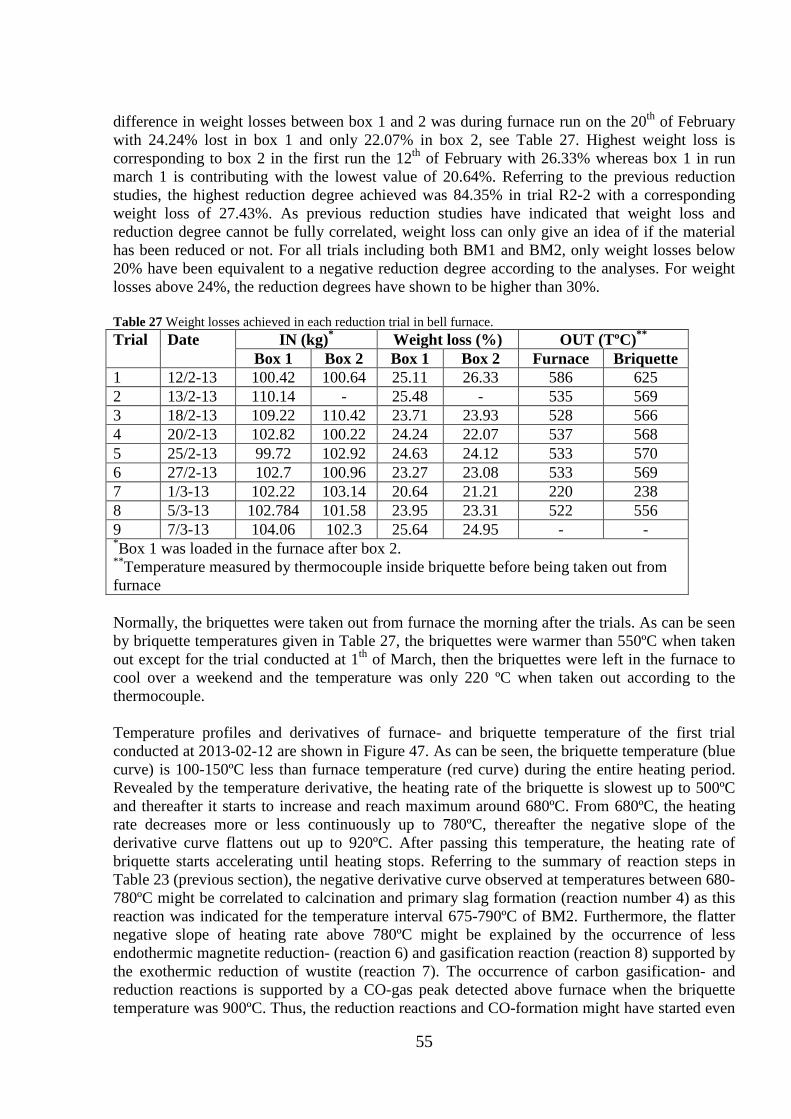
55
difference in weight losses between box 1 and 2 was during furnace run on the 20th of February with 24.24% lost in box 1 and only 22.07% in box 2, see Table 27. Highest weight loss is corresponding to box 2 in the first run the 12th of February with 26.33% whereas box 1 in run march 1 is contributing with the lowest value of 20.64%. Referring to the previous reduction studies, the highest reduction degree achieved was 84.35% in trial R2-2 with a corresponding weight loss of 27.43%. As previous reduction studies have indicated that weight loss and reduction degree cannot be fully correlated, weight loss can only give an idea of if the material has been reduced or not. For all trials including both BM1 and BM2, only weight losses below 20% have been equivalent to a negative reduction degree according to the analyses. For weight losses above 24%, the reduction degrees have shown to be higher than 30%. Table 27 Weight losses achieved in each reduction trial in bell furnace. Trial Date IN (kg)* Weight loss (%) OUT (TºC)**
Box 1 Box 2 Box 1 Box 2 Furnace Briquette 1 12/2-13 100.42 100.64 25.11 26.33 586 625 2 13/2-13 110.14 - 25.48 - 535 569 3 18/2-13 109.22 110.42 23.71 23.93 528 566 4 20/2-13 102.82 100.22 24.24 22.07 537 568 5 25/2-13 99.72 102.92 24.63 24.12 533 570 6 27/2-13 102.7 100.96 23.27 23.08 533 569 7 1/3-13 102.22 103.14 20.64 21.21 220 238 8 5/3-13 102.784 101.58 23.95 23.31 522 556 9 7/3-13 104.06 102.3 25.64 24.95 - - *Box 1 was loaded in the furnace after box 2. **Temperature measured by thermocouple inside briquette before being taken out from furnace
Normally, the briquettes were taken out from furnace the morning after the trials. As can be seen by briquette temperatures given in Table 27, the briquettes were warmer than 550ºC when taken out except for the trial conducted at 1th of March, then the briquettes were left in the furnace to cool over a weekend and the temperature was only 220 ºC when taken out according to the thermocouple. Temperature profiles and derivatives of furnace- and briquette temperature of the first trial conducted at 2013-02-12 are shown in Figure 47. As can be seen, the briquette temperature (blue curve) is 100-150ºC less than furnace temperature (red curve) during the entire heating period. Revealed by the temperature derivative, the heating rate of the briquette is slowest up to 500ºC and thereafter it starts to increase and reach maximum around 680ºC. From 680ºC, the heating rate decreases more or less continuously up to 780ºC, thereafter the negative slope of the derivative curve flattens out up to 920ºC. After passing this temperature, the heating rate of briquette starts accelerating until heating stops. Referring to the summary of reaction steps in Table 23 (previous section), the negative derivative curve observed at temperatures between 680-780ºC might be correlated to calcination and primary slag formation (reaction number 4) as this reaction was indicated for the temperature interval 675-790ºC of BM2. Furthermore, the flatter negative slope of heating rate above 780ºC might be explained by the occurrence of less endothermic magnetite reduction- (reaction 6) and gasification reaction (reaction 8) supported by the exothermic reduction of wustite (reaction 7). The occurrence of carbon gasification- and reduction reactions is supported by a CO-gas peak detected above furnace when the briquette temperature was 900ºC. Thus, the reduction reactions and CO-formation might have started even
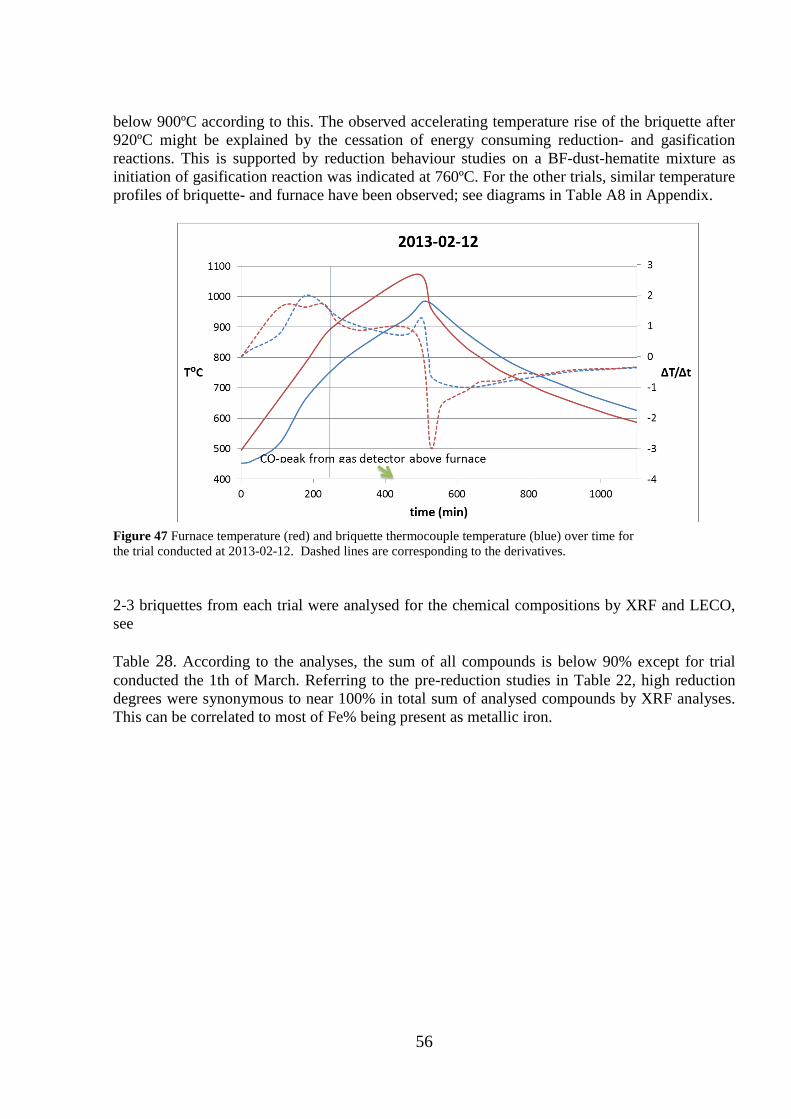
56
below 900ºC according to this. The observed accelerating temperature rise of the briquette after 920ºC might be explained by the cessation of energy consuming reduction- and gasification reactions. This is supported by reduction behaviour studies on a BF-dust-hematite mixture as initiation of gasification reaction was indicated at 760ºC. For the other trials, similar temperature profiles of briquette- and furnace have been observed; see diagrams in Table A8 in Appendix.
2-3 briquettes from each trial were analysed for the chemical compositions by XRF and LECO, see Table 28. According to the analyses, the sum of all compounds is below 90% except for trial conducted the 1th of March. Referring to the pre-reduction studies in Table 22, high reduction degrees were synonymous to near 100% in total sum of analysed compounds by XRF analyses. This can be correlated to most of Fe% being present as metallic iron.
Figure 47 Furnace temperature (red) and briquette thermocouple temperature (blue) over time for the trial conducted at 2013-02-12. Dashed lines are corresponding to the derivatives.
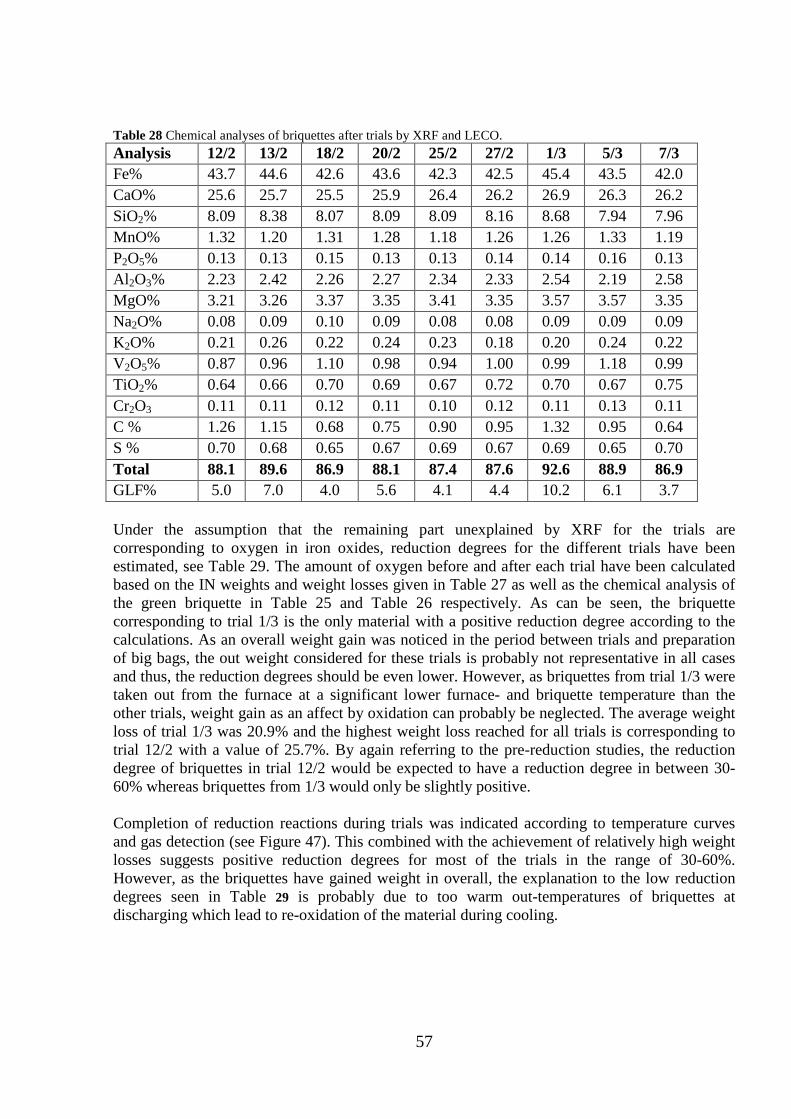
57
Table 28 Chemical analyses of briquettes after trials by XRF and LECO. Analysis 12/2 13/2 18/2 20/2 25/2 27/2 1/3 5/3 7/3 Fe% 43.7 44.6 42.6 43.6 42.3 42.5 45.4 43.5 42.0 CaO% 25.6 25.7 25.5 25.9 26.4 26.2 26.9 26.3 26.2 SiO2% 8.09 8.38 8.07 8.09 8.09 8.16 8.68 7.94 7.96 MnO% 1.32 1.20 1.31 1.28 1.18 1.26 1.26 1.33 1.19 P2O5% 0.13 0.13 0.15 0.13 0.13 0.14 0.14 0.16 0.13 Al2O3% 2.23 2.42 2.26 2.27 2.34 2.33 2.54 2.19 2.58 MgO% 3.21 3.26 3.37 3.35 3.41 3.35 3.57 3.57 3.35 Na2O% 0.08 0.09 0.10 0.09 0.08 0.08 0.09 0.09 0.09 K2O% 0.21 0.26 0.22 0.24 0.23 0.18 0.20 0.24 0.22 V2O5% 0.87 0.96 1.10 0.98 0.94 1.00 0.99 1.18 0.99 TiO2% 0.64 0.66 0.70 0.69 0.67 0.72 0.70 0.67 0.75 Cr2O3 0.11 0.11 0.12 0.11 0.10 0.12 0.11 0.13 0.11 C % 1.26 1.15 0.68 0.75 0.90 0.95 1.32 0.95 0.64 S % 0.70 0.68 0.65 0.67 0.69 0.67 0.69 0.65 0.70 Total 88.1 89.6 86.9 88.1 87.4 87.6 92.6 88.9 86.9 GLF% 5.0 7.0 4.0 5.6 4.1 4.4 10.2 6.1 3.7 Under the assumption that the remaining part unexplained by XRF for the trials are corresponding to oxygen in iron oxides, reduction degrees for the different trials have been estimated, see Table 29. The amount of oxygen before and after each trial have been calculated based on the IN weights and weight losses given in Table 27 as well as the chemical analysis of the green briquette in Table 25 and Table 26 respectively. As can be seen, the briquette corresponding to trial 1/3 is the only material with a positive reduction degree according to the calculations. As an overall weight gain was noticed in the period between trials and preparation of big bags, the out weight considered for these trials is probably not representative in all cases and thus, the reduction degrees should be even lower. However, as briquettes from trial 1/3 were taken out from the furnace at a significant lower furnace- and briquette temperature than the other trials, weight gain as an affect by oxidation can probably be neglected. The average weight loss of trial 1/3 was 20.9% and the highest weight loss reached for all trials is corresponding to trial 12/2 with a value of 25.7%. By again referring to the pre-reduction studies, the reduction degree of briquettes in trial 12/2 would be expected to have a reduction degree in between 30-60% whereas briquettes from 1/3 would only be slightly positive. Completion of reduction reactions during trials was indicated according to temperature curves and gas detection (see Figure 47). This combined with the achievement of relatively high weight losses suggests positive reduction degrees for most of the trials in the range of 30-60%. However, as the briquettes have gained weight in overall, the explanation to the low reduction degrees seen in Table 29 is probably due to too warm out-temperatures of briquettes at discharging which lead to re-oxidation of the material during cooling.
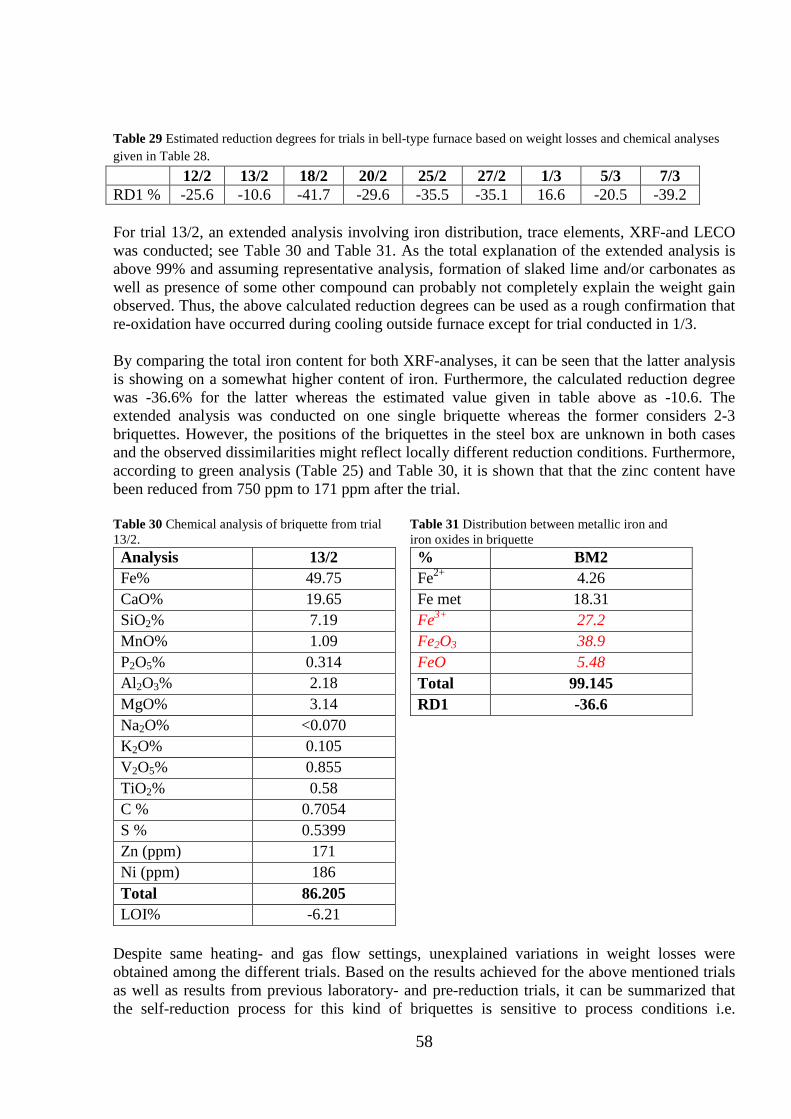
58
Table 29 Estimated reduction degrees for trials in bell-type furnace based on weight losses and chemical analyses given in Table 28. 12/2 13/2 18/2 20/2 25/2 27/2 1/3 5/3 7/3 RD1 % -25.6 -10.6 -41.7 -29.6 -35.5 -35.1 16.6 -20.5 -39.2 For trial 13/2, an extended analysis involving iron distribution, trace elements, XRF-and LECO was conducted; see Table 30 and Table 31. As the total explanation of the extended analysis is above 99% and assuming representative analysis, formation of slaked lime and/or carbonates as well as presence of some other compound can probably not completely explain the weight gain observed. Thus, the above calculated reduction degrees can be used as a rough confirmation that re-oxidation have occurred during cooling outside furnace except for trial conducted in 1/3. By comparing the total iron content for both XRF-analyses, it can be seen that the latter analysis is showing on a somewhat higher content of iron. Furthermore, the calculated reduction degree was -36.6% for the latter whereas the estimated value given in table above as -10.6. The extended analysis was conducted on one single briquette whereas the former considers 2-3 briquettes. However, the positions of the briquettes in the steel box are unknown in both cases and the observed dissimilarities might reflect locally different reduction conditions. Furthermore, according to green analysis (Table 25) and Table 30, it is shown that that the zinc content have been reduced from 750 ppm to 171 ppm after the trial. Table 30 Chemical analysis of briquette from trial 13/2. Analysis 13/2 Fe% 49.75 CaO% 19.65 SiO2% 7.19 MnO% 1.09 P2O5% 0.314 Al2O3% 2.18 MgO% 3.14 Na2O% <0.070 K2O% 0.105 V2O5% 0.855 TiO2% 0.58 C % 0.7054 S % 0.5399 Zn (ppm) 171 Ni (ppm) 186 Total 86.205 LOI% -6.21
Table 31 Distribution between metallic iron and iron oxides in briquette % BM2 Fe2+ 4.26 Fe met 18.31 Fe3+ 27.2 Fe2O3 38.9 FeO 5.48 Total 99.145 RD1 -36.6
Despite same heating- and gas flow settings, unexplained variations in weight losses were obtained among the different trials. Based on the results achieved for the above mentioned trials as well as results from previous laboratory- and pre-reduction trials, it can be summarized that the self-reduction process for this kind of briquettes is sensitive to process conditions i.e.
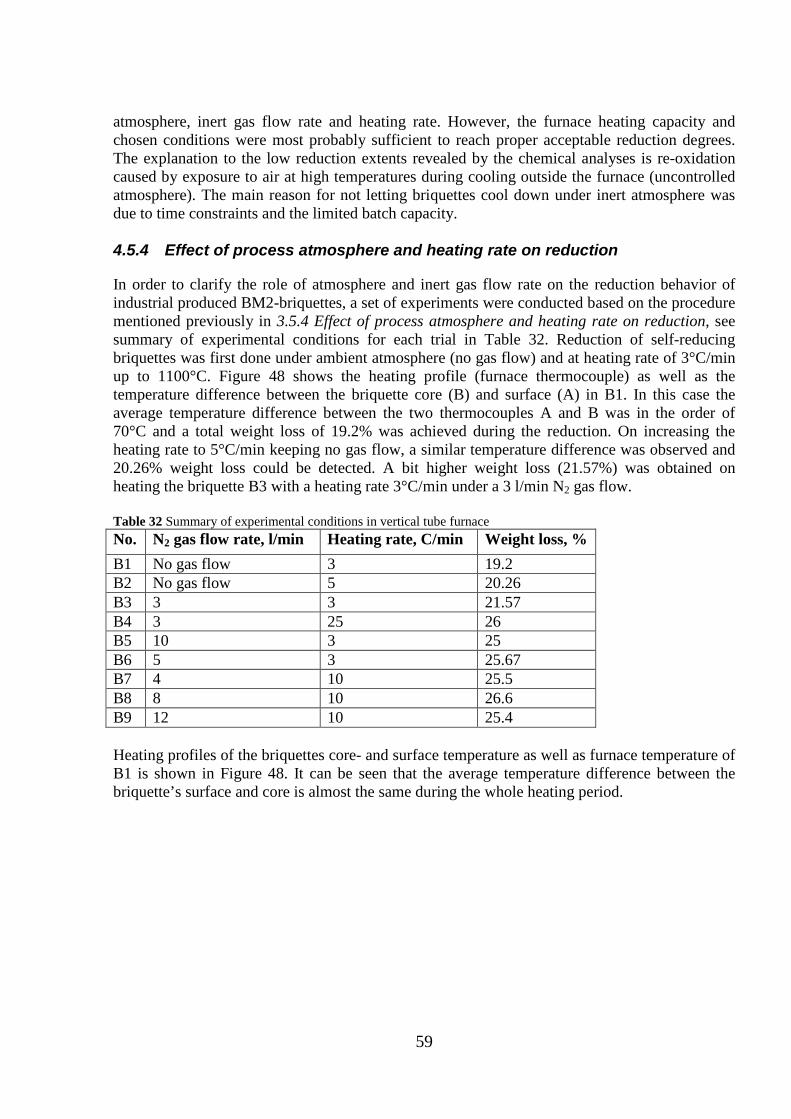
59
atmosphere, inert gas flow rate and heating rate. However, the furnace heating capacity and chosen conditions were most probably sufficient to reach proper acceptable reduction degrees. The explanation to the low reduction extents revealed by the chemical analyses is re-oxidation caused by exposure to air at high temperatures during cooling outside the furnace (uncontrolled atmosphere). The main reason for not letting briquettes cool down under inert atmosphere was due to time constraints and the limited batch capacity. 4.5.4 Effect of process atmosphere and heating rate on reduction
In order to clarify the role of atmosphere and inert gas flow rate on the reduction behavior of industrial produced BM2-briquettes, a set of experiments were conducted based on the procedure mentioned previously in 3.5.4 Effect of process atmosphere and heating rate on reduction, see summary of experimental conditions for each trial in Table 32. Reduction of self-reducing briquettes was first done under ambient atmosphere (no gas flow) and at heating rate of 3°C/min up to 1100°C. Figure 48 shows the heating profile (furnace thermocouple) as well as the temperature difference between the briquette core (B) and surface (A) in B1. In this case the average temperature difference between the two thermocouples A and B was in the order of 70°C and a total weight loss of 19.2% was achieved during the reduction. On increasing the heating rate to 5°C/min keeping no gas flow, a similar temperature difference was observed and 20.26% weight loss could be detected. A bit higher weight loss (21.57%) was obtained on heating the briquette B3 with a heating rate 3°C/min under a 3 l/min N2 gas flow. Table 32 Summary of experimental conditions in vertical tube furnace No. N2 gas flow rate, l/min Heating rate, C/min Weight loss, % B1 No gas flow 3 19.2 B2 No gas flow 5 20.26 B3 3 3 21.57 B4 3 25 26 B5 10 3 25 B6 5 3 25.67 B7 4 10 25.5 B8 8 10 26.6 B9 12 10 25.4 Heating profiles of the briquettes core- and surface temperature as well as furnace temperature of B1 is shown in Figure 48. It can be seen that the average temperature difference between the briquette’s surface and core is almost the same during the whole heating period.
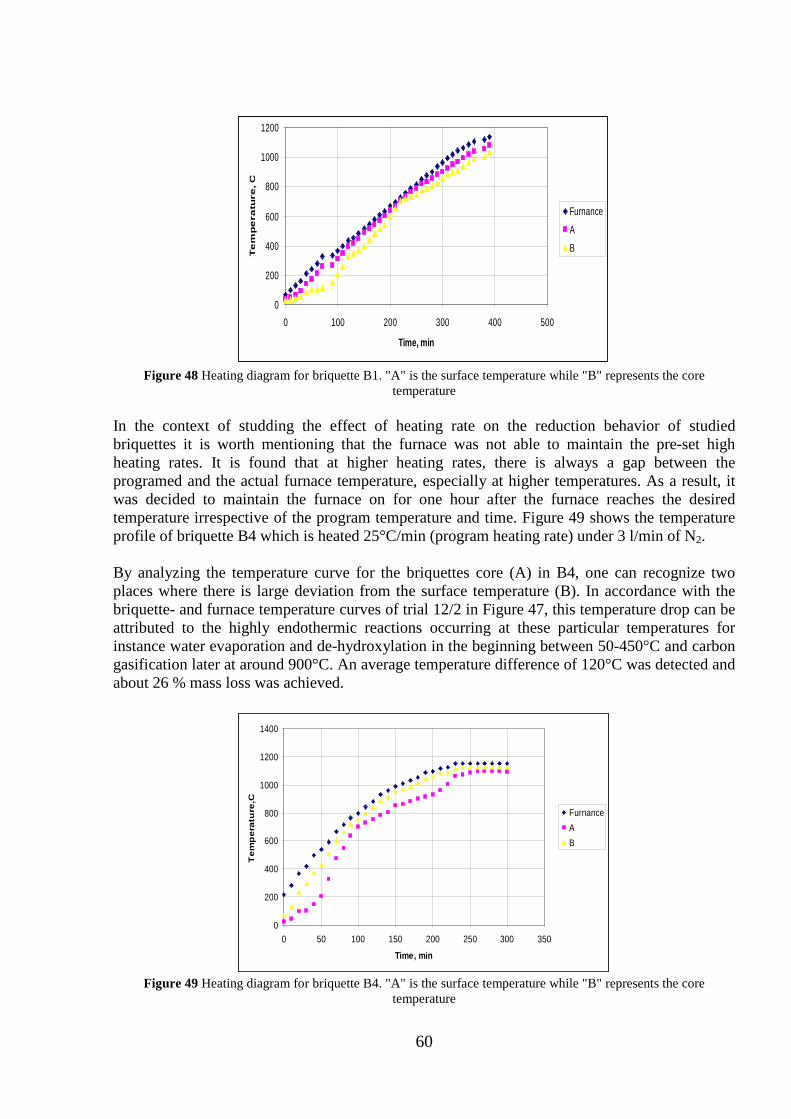
60
Figure 48 Heating diagram for briquette B1. "A" is the surface temperature while "B" represents the core
temperature In the context of studding the effect of heating rate on the reduction behavior of studied briquettes it is worth mentioning that the furnace was not able to maintain the pre-set high heating rates. It is found that at higher heating rates, there is always a gap between the programed and the actual furnace temperature, especially at higher temperatures. As a result, it was decided to maintain the furnace on for one hour after the furnace reaches the desired temperature irrespective of the program temperature and time. Figure 49 shows the temperature profile of briquette B4 which is heated 25°C/min (program heating rate) under 3 l/min of N2. By analyzing the temperature curve for the briquettes core (A) in B4, one can recognize two places where there is large deviation from the surface temperature (B). In accordance with the briquette- and furnace temperature curves of trial 12/2 in Figure 47, this temperature drop can be attributed to the highly endothermic reactions occurring at these particular temperatures for instance water evaporation and de-hydroxylation in the beginning between 50-450°C and carbon gasification later at around 900°C. An average temperature difference of 120°C was detected and about 26 % mass loss was achieved.
Figure 49 Heating diagram for briquette B4. "A" is the surface temperature while "B" represents the core
temperature
0
200
400
600
800
1000
1200
0 100 200 300 400 500
Time, min
Te
mp
era
ture
, C
Furnance
A
B
0
200
400
600
800
1000
1200
1400
0 50 100 150 200 250 300 350
Time, min
Tem
per
atu
re,C
FurnanceAB
61
By comparing B1 and B3 having the same heating rate but with no gas flow in one case and 3 L/min nitrogen flow in the other, the weight loss achieved during inert atmosphere was 21.57% and around 2.4% higher than in the other trial, see Table 32. Relating to previous pre-reduction studies, weight losses below 20% was shown to correspond to negative RD1-values which mean that B1 might be more oxidized after the trial than before whereas B3 instead should have been slightly reduced. Furthermore, for the same heating rate but with nitrogen flow rate of 5 L/min in B6, a weight loss of 25.67% was achieved. By again relating to pre-reduction studies, a reduction degree in-between 30-60% can be assumed. However, increasing the flow rate even higher to 10 L/min seemed to contribute with a slightly less weight loss of 25%. B2 was conducted without no gas flow similar to B1 but with a higher heating rate being 5ºC/min instead of 3ºC/min. In this case, reduction was improved in comparison to B1 with a weight loss of 20.26% instead of 19.2%. Furthermore, B3 and B4 were conducted under the same nitrogen flow rates but with different heating rates of 3- and 25 ºC/min respectively. Also in this case, a higher weight loss of 26% was achieved by increasing the heating rate for the same nitrogen flow. Additional trials B7-B9 were conducted under the same heating rate at 10ºC/min for the nitrogen flow rates 4, 8 and 12 L/min respectively giving weight losses of 25.5%, 26.6% and 25.4%. Although the introduced N2 was preheated, external thermocouple was attached to the briquette facing the gas flow to measure the actual briquette surface temperature. As also seen for trials B3 and B4, highest nitrogen flow rate is not corresponding to the highest weight loss. In Table 33, reduction degrees of briquettes from trials B7-B9 are found. These have been calculated based on chemical analyses in Table A9 in Appendix. According to the table, lowest reduction degree is corresponding B9 which also had the lowest weight loss and was conducted under highest nitrogen flow. Table 33 Calculated reduction degrees of trials B7-B9. B7 (4 L/min N2) B8 (8 L/min N2) B9 (12 L/min N2) RD1 % 81.54 81.05 69.15 It can be concluded that both heating rate and atmosphere affected the reduction process for the conducted trials. At high heating rates, nitrogen flow rate seem to have less negative effect on the reduction process whereas for lower heating rates, the atmosphere becomes more crucial. It is known from the literature that the pressure inside self-reducing briquettes or pellets will be higher than the pressure outside as long as the reduction is carrying on due to locally generation of CO from the gasification reaction. By this, any gas will be prevented to get into the pellet or briquette during the reduction period. Later, when the reduction tends to end i.e. CO production rate becomes low comparable to oxygen diffusion into the briquettes, the reduced iron as well as residual carbon may get oxidized by the diffused oxygen. The latter might come as a result of impurity in the inert gas or through leakage. At slow heating rates under low nitrogen flow rates, the briquette might easier get exposed to air before- and after the reduction reaction occurs. By increasing the nitrogen flow rate, an inert atmosphere surrounding the briquette can be maintained during the whole trial. At high heating rates and low nitrogen flow rates, the exposure time of air will be shorter since temperatures at which reduction reactions starts will be reached faster than for slow heating rates. Based on the above mentioned results, higher nitrogen flow rates are preferable if the furnace heating capacity is limited. However, higher reduction degrees were achieved in B7 and B8 than
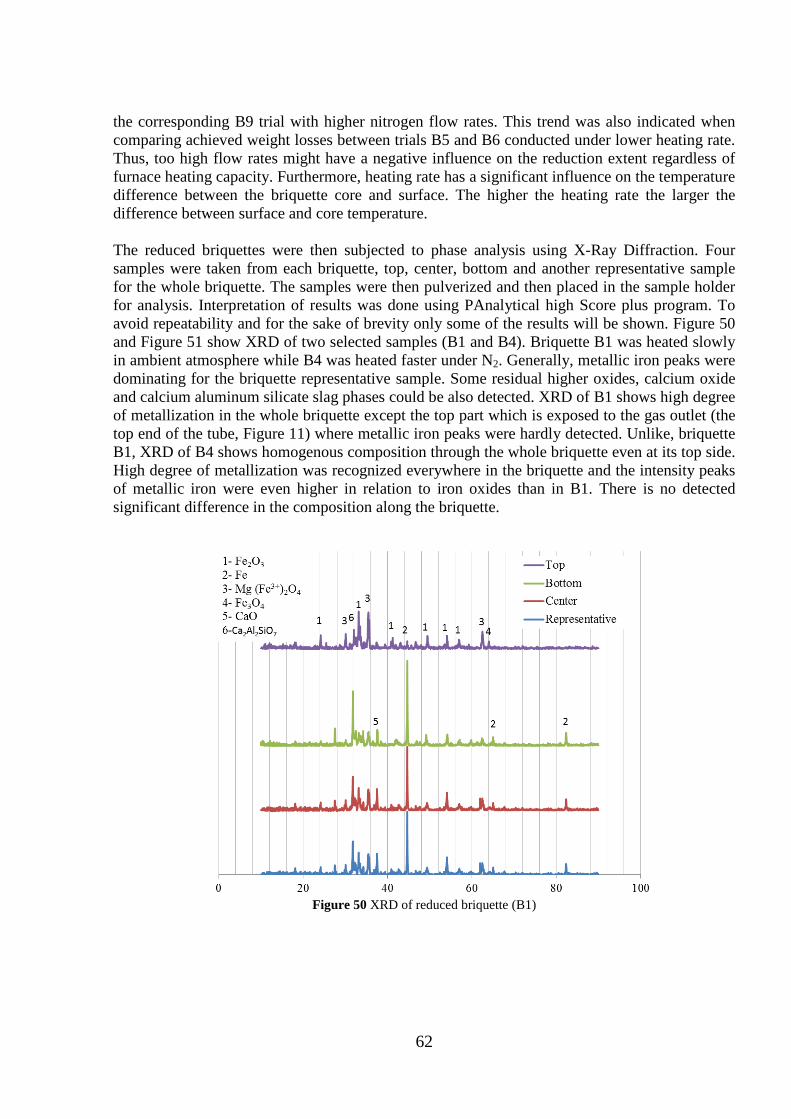
62
the corresponding B9 trial with higher nitrogen flow rates. This trend was also indicated when comparing achieved weight losses between trials B5 and B6 conducted under lower heating rate. Thus, too high flow rates might have a negative influence on the reduction extent regardless of furnace heating capacity. Furthermore, heating rate has a significant influence on the temperature difference between the briquette core and surface. The higher the heating rate the larger the difference between surface and core temperature. The reduced briquettes were then subjected to phase analysis using X-Ray Diffraction. Four samples were taken from each briquette, top, center, bottom and another representative sample for the whole briquette. The samples were then pulverized and then placed in the sample holder for analysis. Interpretation of results was done using PAnalytical high Score plus program. To avoid repeatability and for the sake of brevity only some of the results will be shown. Figure 50 and Figure 51 show XRD of two selected samples (B1 and B4). Briquette B1 was heated slowly in ambient atmosphere while B4 was heated faster under N2. Generally, metallic iron peaks were dominating for the briquette representative sample. Some residual higher oxides, calcium oxide and calcium aluminum silicate slag phases could be also detected. XRD of B1 shows high degree of metallization in the whole briquette except the top part which is exposed to the gas outlet (the top end of the tube, Figure 11) where metallic iron peaks were hardly detected. Unlike, briquette B1, XRD of B4 shows homogenous composition through the whole briquette even at its top side. High degree of metallization was recognized everywhere in the briquette and the intensity peaks of metallic iron were even higher in relation to iron oxides than in B1. There is no detected significant difference in the composition along the briquette.
Figure 50 XRD of reduced briquette (B1)
63
Figure 51 XRD of reduced briquette (B4)
Although high intensity peaks of metallic iron are indicated in both cases, the XRD patterns must be compared with corresponding analysis of the green briquette in order to validate the reduction extent. This since it is known that the initial content of metallic iron was almost 22% according to the chemical analysis of green briquettes (Table 26) and that the XRD patterns are not quantitative. However, as scrap pieces had to be removed before XRD, representative analysis of green briquettes has not been achieved. Therefore, the XRD analyses can only be used as a comparison between the different trials. By comparing B1 and B4, the indicated significance of heating rate and inert atmosphere on reduction extent is again confirmed as B1 is indicated to be more oxidized than B4. To summarize the above mentioned results, retention time of briquettes under inert atmosphere is the most important parameter that affects the reduction extent and metallization degree. At high heating rates, nitrogen flow rates become less significant whereas the opposite correlation was seen for limited heating capacities. However, a careful attention has to be paid to the inert gas flow rate, heating rate and retention time to maximize the metallization degree and maintain homogenous reduction along the whole briquette as well as avoid re-oxidation of produced metallic iron and residual carbon left in the briquettes.
64
4.5.5 Melt-in trial at desulphurisation plant
A total of 6 big bags were prepared for the melt-in trials. The melt-in trials and sampling of reference trials were conducted 2013-03-12. The calculated amount of briquettes/bag based on out-weights from reduction trials in bell furnace was around 10 kg lighter than later shown during preparation of big bags. This implies that the material have gained in average 6.2 kg/trial during that time period, which previously have been mentioned in section 4.5.3 Briquetting and reduction for melt-in trial. Actual gross weights of bags are shown in Table 34. Table 34 Gross weights of big bags.
Bag nr Gross weight* (kg) 1 238,7 2 235,6 3 231,7 4 231,7 5 231,9 6 231,8
*Bag weight was approximately 1,56 kg. A summary of charged briquettes in the different heats and reference heats can be seen in Table 35. To be noticed, big bag numbers given in the table cannot be related to gross weights of big bags given in Table 34 since these numbers are just serial numbers. Table 35 Summary of test- and reference heats for melt-in trials. Big bag Heat nr Reference Heat nr 1 X1188 R1 X1192 2 X1189 R2 X1193 3 M9766 R3 M9772 4 M9768 R4 M9773 5+6 X1190 R5 M9774 Briquettes in test heats were charged in ladle before charging of hot metal. In Figure 52 and Figure 53, photos on ladle before and after charging hot metal from the torpedo car are shown. In heat X1190, un-melted briquettes were indicated in the slag after charging hot metal, se right hand photo in Figure 53. In this test heat, two big bags were charged in the ladle.
Figure 52 Heat X1188 before charging (left), after charging bag 1 (middle) and after charging pig iron (right).
65
The efficiency, η, of injected CaC2 and Mg on sulphur removal was calculated based on equation 2 for test- and reference heats, see Table 36. In the same table, retention time of briquettes in the ladle for the time period between charging of hot metal and starting injection is given as Δt and the initial and final sulphur content in hot metal is defined as S0 and S1 respectively. Table 36 Process data and calculated efficiencies for desulphurisation agents in test- and reference heats. ID Heat S0 (%) S1 (%) CaC2 (kg) Mg (kg) η (%) Δt (hh:mm:ss) HM (kg) BB 1 X1188 0.0316 0.0010 594 46 10 00:18:53 129 800 BB 2 X1189 0.0268 0.0017 1005 0 6 01:03:00 120 400 BB 3 M9766 0.0250 0.0014 562 40 8 00:20:15 117 800 BB 4 M9768 0.0369 0.0017 615 49 10 01:12:00 122 600 BB 5+6 X1190 0.0360 0.0034 971 46 7 01:34:00 118 300 R1 X1192 0.0353 0.0016 616 48 10 00:28:26 125 200 R2 X1193 0.0274 0.0018 566 41 8 00:38:42 117 600 R3 M9772 0.0317 0.0012 597 46 9 00:23:30 118 700 R4 M9773 0.0259 0.0017 565 41 8 00:24:55 120 100 R5 M9774 0.0223 0.0011 546 37 7 00:42:14 115 900 By plotting the calculated efficiencies with initial sulphur content in hot metal and added desulphurisation agents respectively, strong linear relationships are indicated in both cases, see Figure 54 and Figure 55. At high initial sulphur contents in hot metal and for increased amount of injectants, the efficiency increases according to the Figures. However, heats X1189 and X1190 corresponding to big bag 2 and big bags 5+6 does not show the same correlation as the other heats and are seen as outliers to the trendlines. Based on the initial sulphur content in hot metal, X1189 and X1190 would be expected to reach higher desulphurisation agent efficiencies than indicated by the calculations. The reason why these heats are deviating from the linear correlation might be explained by the longer retention time between charging of hot metal and injection as well as the larger amount of agents injected in relation to the initial sulphur contents.
Figure 53 Heat X1190 after charging bag 5 and 6 (left) and after charging pig iron (right).
66
Figure 54 Efficiency as a function of initial sulphur, S0.
Figure 55 Efficiency as a function of injected agents.
Complete analyses of slag compositions before- and after sulphur removal are found in Table A10 and Table A11 in Appendix for test- and reference heats respectively. The sum of compounds explained by XRF in analyses for the slag after desulphurisation was above 100% in all test heats which is an indication of iron being present in its metallic state. Assuming representative analyses for the slag, all iron with possible origin from briquettes will be present as metallic iron and thus, potential iron oxides have been reduced. The extent of iron losses to the slag have been estimated for all heats based on the calculated- and weighed slag amount (Figure 56) in hot metal ladle after desulphurisation, chemical analyses of slag after treatment (Table A10 and Table A11 in Appendix) as well as the amount of HM in ladle, see Figure 57. Weighed slag amounts are based on in- and out weights of HM ladle at the desulphurisation plant weighed by different cranes. As the scales equipped on these cranes are not equally calibrated, the amount of slag based on the difference between in- and out weight of HM ladle is therefore not a fully reliable method. However, comparing iron losses between the different heats based on both calculation methods, there is no clear trend that charging briquettes would contribute to higher iron losses to the slag.
Figure 1 Figure 56 Caluclated and weighed slag amounts in ladle after desulphurization.
Figure 57 iron losses based on calculated- and weighed slag after desulphurization.
67
4.6 Pellet trials
4.6.1 Production of self-reducing pellets
Pellets were produced according to the method described in section 3.6.1 Production of self-reducing pellets. The weight losses after drying at 105ºC for size ranges 9-12.5 mm was 16% for PM1 and 14.2% for PM2. Green pellets were thereafter analysed for the chemical composition by XRF, Fe-titration and trace elements, see Table 37 and Table 38. The size distribution in each pellet type was adjusted to have 79 wt-% in the size range 10-12.5 mm and 21 wt-% in the range 9-10 mm before analysing. Original pellet size distribution of each blend in comparison to LKAB pellet type (18) is found in Figure A2 in Appendix.
As can be seen by the analyses, both pellet types contain relatively high levels of Zn and carbon. The latter being high in relation to oxygen bound in iron oxides with a C/O ratio of 1.33 and 1.91 in PM1 and PM2 respectively. The XRF analysis of each blend has a total explanation around 92-93% which is indicating presence of volatile matter that is not revealed by the analyses. Furthermore, reduction degrees (based on equation 11) of 24.8% and 24.1% for PM1 and PM2 respectively is shown for each blend in Table 38.
Table 37 Chemical analysis of green pellets. Table 38 Calculated iron distribution in pellets. Analysis PM1 PM2 Fe% 37.96 35.66 CaO% 17.85 16.98 SiO2% 4.04 4.48 MnO% 0.59 0.55 P2O5% 0.087 0.085 Al2O3% 1.15 1.31 MgO% 3.36 3.17 Na2O% 1.27 1.41 K2O% 0.12 0.13 V2O5% 0.29 0.29 TiO2% 0.20 0.22 C % 12.33 16.69 S % 0.29 0.33 Zn (ppm) 2770 3060 Ni (ppm) 125 107 Total 79.8 81.6 GLF% 18.05 21.81
% PM1 PM2 Fe2+ 18.61 17.4 Fe met 3.2 2.8 Fe3+ 16.2 15.5 Fe2O3 23.16 22.16 FeO 23.94 22.39 Total 92.14 93.29 RD2 24.8 24.1
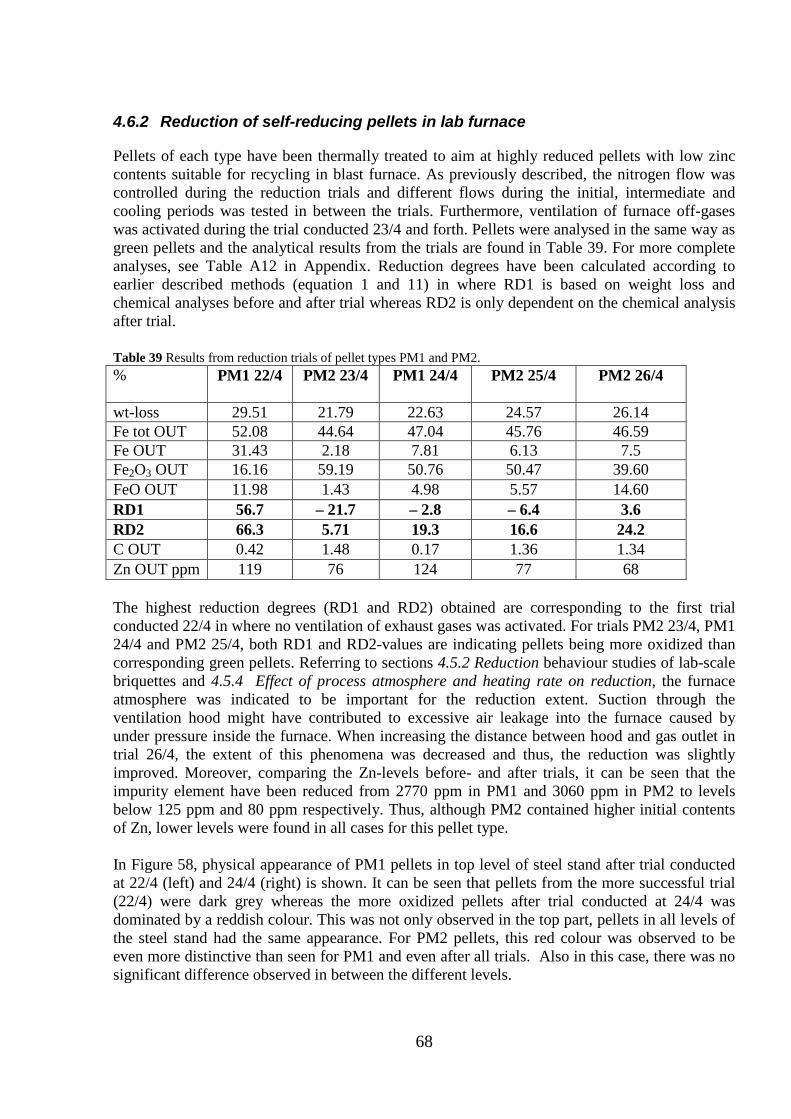
68
4.6.2 Reduction of self-reducing pellets in lab furnace
Pellets of each type have been thermally treated to aim at highly reduced pellets with low zinc contents suitable for recycling in blast furnace. As previously described, the nitrogen flow was controlled during the reduction trials and different flows during the initial, intermediate and cooling periods was tested in between the trials. Furthermore, ventilation of furnace off-gases was activated during the trial conducted 23/4 and forth. Pellets were analysed in the same way as green pellets and the analytical results from the trials are found in Table 39. For more complete analyses, see Table A12 in Appendix. Reduction degrees have been calculated according to earlier described methods (equation 1 and 11) in where RD1 is based on weight loss and chemical analyses before and after trial whereas RD2 is only dependent on the chemical analysis after trial. Table 39 Results from reduction trials of pellet types PM1 and PM2. % PM1 22/4 PM2 23/4 PM1 24/4 PM2 25/4 PM2 26/4
wt-loss 29.51 21.79 22.63 24.57 26.14 Fe tot OUT 52.08 44.64 47.04 45.76 46.59 Fe OUT 31.43 2.18 7.81 6.13 7.5 Fe2O3 OUT 16.16 59.19 50.76 50.47 39.60 FeO OUT 11.98 1.43 4.98 5.57 14.60 RD1 56.7 – 21.7 – 2.8 – 6.4 3.6 RD2 66.3 5.71 19.3 16.6 24.2 C OUT 0.42 1.48 0.17 1.36 1.34 Zn OUT ppm 119 76 124 77 68 The highest reduction degrees (RD1 and RD2) obtained are corresponding to the first trial conducted 22/4 in where no ventilation of exhaust gases was activated. For trials PM2 23/4, PM1 24/4 and PM2 25/4, both RD1 and RD2-values are indicating pellets being more oxidized than corresponding green pellets. Referring to sections 4.5.2 Reduction behaviour studies of lab-scale briquettes and 4.5.4 Effect of process atmosphere and heating rate on reduction, the furnace atmosphere was indicated to be important for the reduction extent. Suction through the ventilation hood might have contributed to excessive air leakage into the furnace caused by under pressure inside the furnace. When increasing the distance between hood and gas outlet in trial 26/4, the extent of this phenomena was decreased and thus, the reduction was slightly improved. Moreover, comparing the Zn-levels before- and after trials, it can be seen that the impurity element have been reduced from 2770 ppm in PM1 and 3060 ppm in PM2 to levels below 125 ppm and 80 ppm respectively. Thus, although PM2 contained higher initial contents of Zn, lower levels were found in all cases for this pellet type. In Figure 58, physical appearance of PM1 pellets in top level of steel stand after trial conducted at 22/4 (left) and 24/4 (right) is shown. It can be seen that pellets from the more successful trial (22/4) were dark grey whereas the more oxidized pellets after trial conducted at 24/4 was dominated by a reddish colour. This was not only observed in the top part, pellets in all levels of the steel stand had the same appearance. For PM2 pellets, this red colour was observed to be even more distinctive than seen for PM1 and even after all trials. Also in this case, there was no significant difference observed in between the different levels.
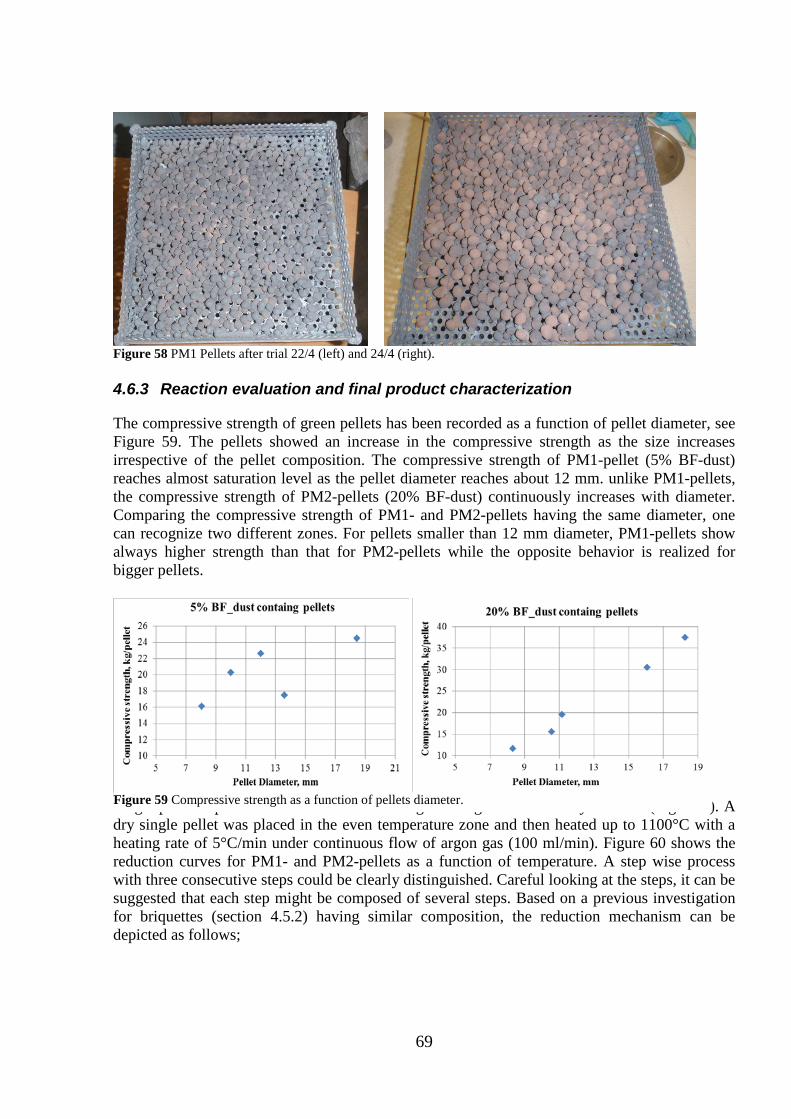
69
Figure 58 PM1 Pellets after trial 22/4 (left) and 24/4 (right). 4.6.3 Reaction evaluation and final product characterization
The compressive strength of green pellets has been recorded as a function of pellet diameter, see Figure 59. The pellets showed an increase in the compressive strength as the size increases irrespective of the pellet composition. The compressive strength of PM1-pellet (5% BF-dust) reaches almost saturation level as the pellet diameter reaches about 12 mm. unlike PM1-pellets, the compressive strength of PM2-pellets (20% BF-dust) continuously increases with diameter. Comparing the compressive strength of PM1- and PM2-pellets having the same diameter, one can recognize two different zones. For pellets smaller than 12 mm diameter, PM1-pellets show always higher strength than that for PM2-pellets while the opposite behavior is realized for bigger pellets.
Single pellet experiments were conducted using thermogravimetric analyzer TGA (Figure 3). A dry single pellet was placed in the even temperature zone and then heated up to 1100°C with a heating rate of 5°C/min under continuous flow of argon gas (100 ml/min). Figure 60 shows the reduction curves for PM1- and PM2-pellets as a function of temperature. A step wise process with three consecutive steps could be clearly distinguished. Careful looking at the steps, it can be suggested that each step might be composed of several steps. Based on a previous investigation for briquettes (section 4.5.2) having similar composition, the reduction mechanism can be depicted as follows;
Figure 59 Compressive strength as a function of pellets diameter.
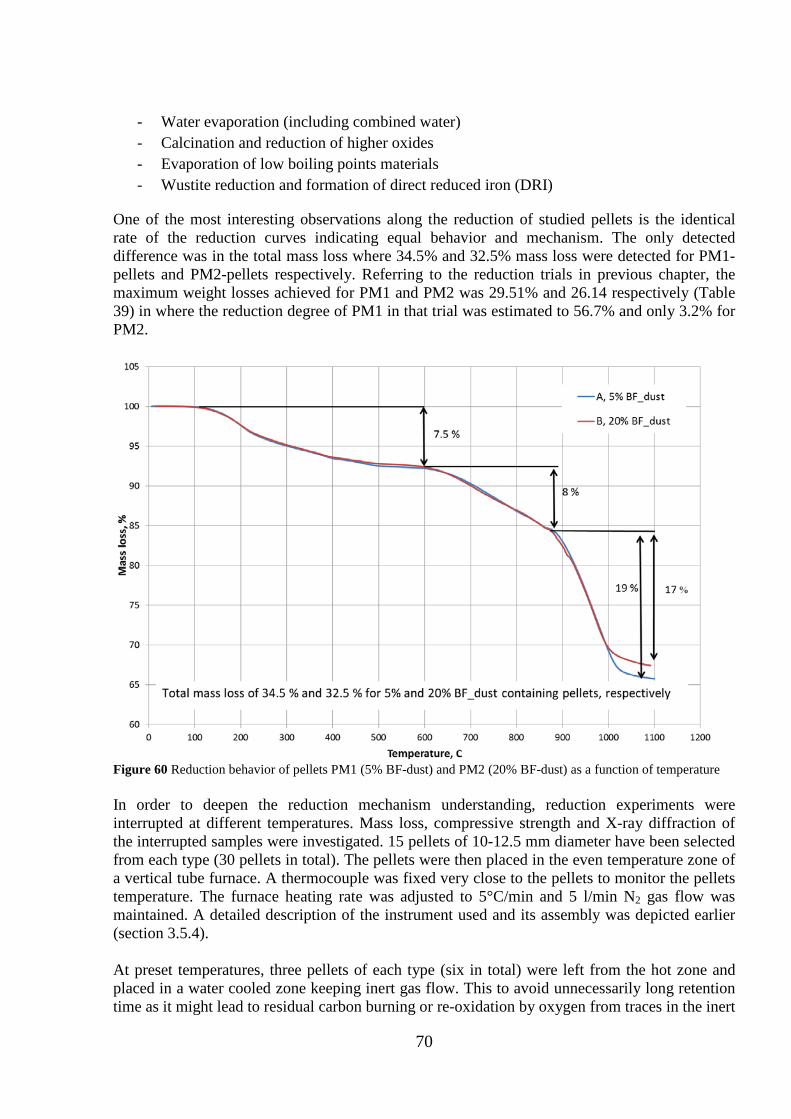
70
- Water evaporation (including combined water) - Calcination and reduction of higher oxides - Evaporation of low boiling points materials - Wustite reduction and formation of direct reduced iron (DRI)
One of the most interesting observations along the reduction of studied pellets is the identical rate of the reduction curves indicating equal behavior and mechanism. The only detected difference was in the total mass loss where 34.5% and 32.5% mass loss were detected for PM1-pellets and PM2-pellets respectively. Referring to the reduction trials in previous chapter, the maximum weight losses achieved for PM1 and PM2 was 29.51% and 26.14 respectively (Table 39) in where the reduction degree of PM1 in that trial was estimated to 56.7% and only 3.2% for PM2.
Figure 60 Reduction behavior of pellets PM1 (5% BF-dust) and PM2 (20% BF-dust) as a function of temperature In order to deepen the reduction mechanism understanding, reduction experiments were interrupted at different temperatures. Mass loss, compressive strength and X-ray diffraction of the interrupted samples were investigated. 15 pellets of 10-12.5 mm diameter have been selected from each type (30 pellets in total). The pellets were then placed in the even temperature zone of a vertical tube furnace. A thermocouple was fixed very close to the pellets to monitor the pellets temperature. The furnace heating rate was adjusted to 5°C/min and 5 l/min N2 gas flow was maintained. A detailed description of the instrument used and its assembly was depicted earlier (section 3.5.4). At preset temperatures, three pellets of each type (six in total) were left from the hot zone and placed in a water cooled zone keeping inert gas flow. This to avoid unnecessarily long retention time as it might lead to residual carbon burning or re-oxidation by oxygen from traces in the inert
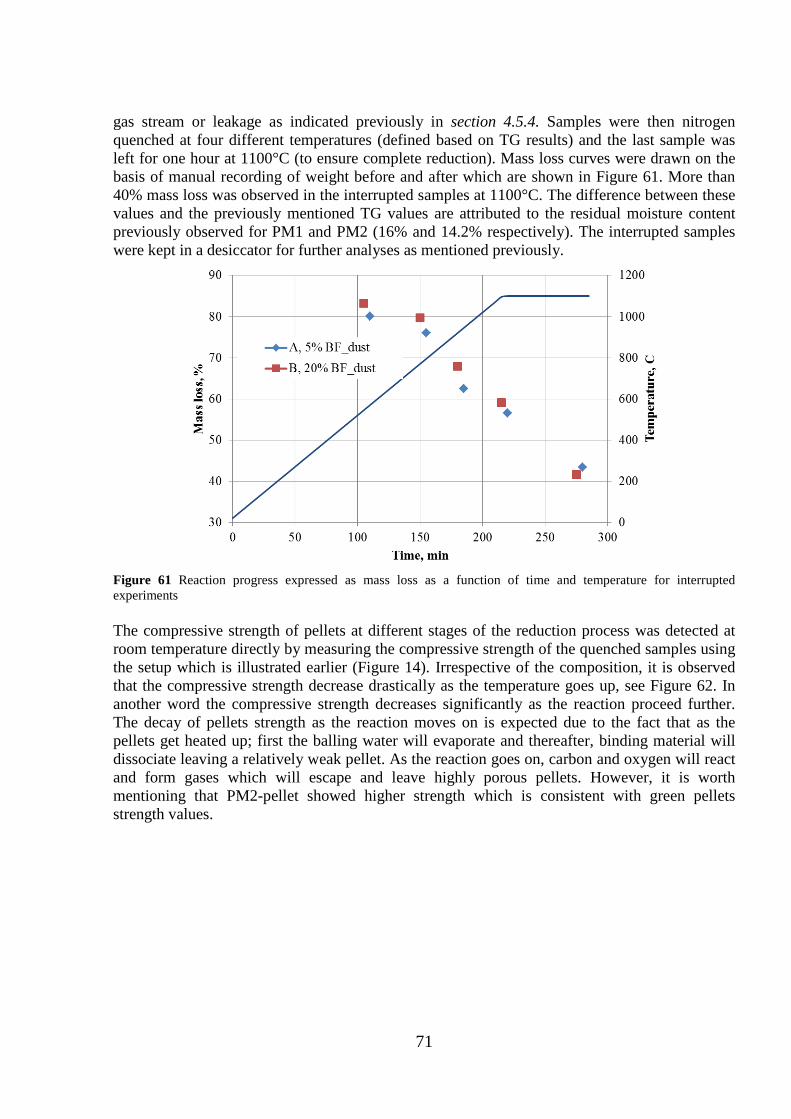
71
gas stream or leakage as indicated previously in section 4.5.4. Samples were then nitrogen quenched at four different temperatures (defined based on TG results) and the last sample was left for one hour at 1100°C (to ensure complete reduction). Mass loss curves were drawn on the basis of manual recording of weight before and after which are shown in Figure 61. More than 40% mass loss was observed in the interrupted samples at 1100°C. The difference between these values and the previously mentioned TG values are attributed to the residual moisture content previously observed for PM1 and PM2 (16% and 14.2% respectively). The interrupted samples were kept in a desiccator for further analyses as mentioned previously.
Figure 61 Reaction progress expressed as mass loss as a function of time and temperature for interrupted experiments The compressive strength of pellets at different stages of the reduction process was detected at room temperature directly by measuring the compressive strength of the quenched samples using the setup which is illustrated earlier (Figure 14). Irrespective of the composition, it is observed that the compressive strength decrease drastically as the temperature goes up, see Figure 62. In another word the compressive strength decreases significantly as the reaction proceed further. The decay of pellets strength as the reaction moves on is expected due to the fact that as the pellets get heated up; first the balling water will evaporate and thereafter, binding material will dissociate leaving a relatively weak pellet. As the reaction goes on, carbon and oxygen will react and form gases which will escape and leave highly porous pellets. However, it is worth mentioning that PM2-pellet showed higher strength which is consistent with green pellets strength values.
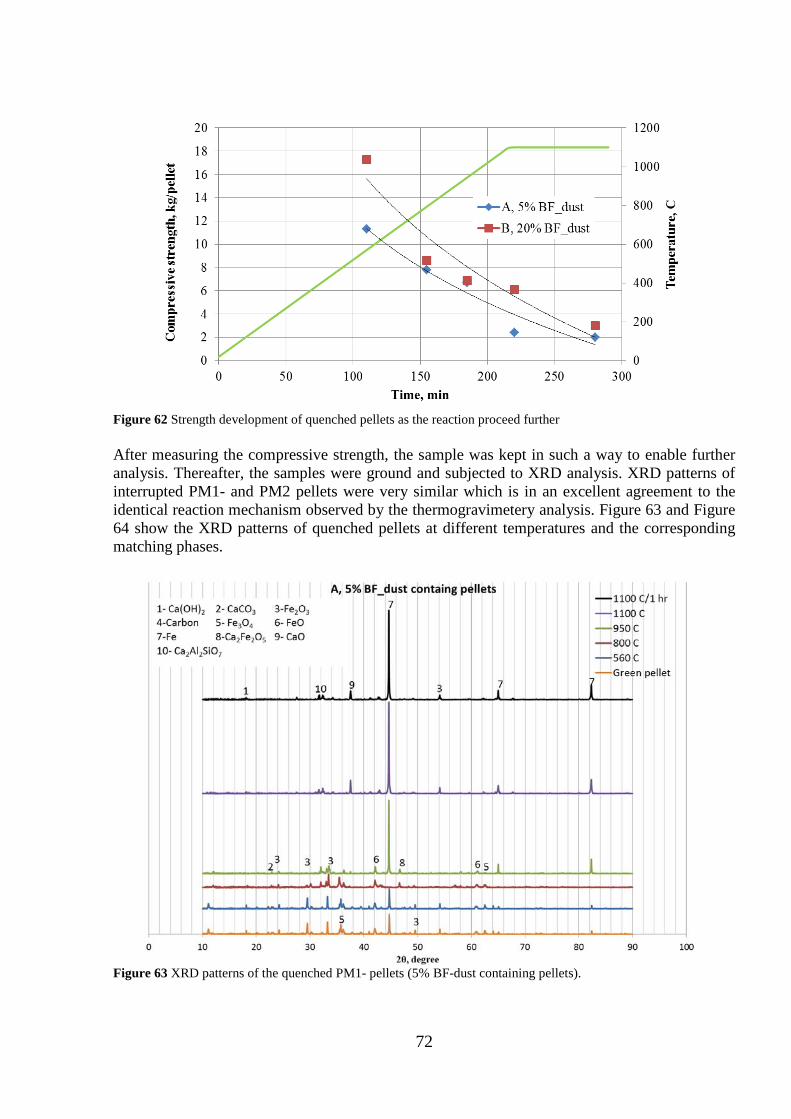
72
Figure 62 Strength development of quenched pellets as the reaction proceed further After measuring the compressive strength, the sample was kept in such a way to enable further analysis. Thereafter, the samples were ground and subjected to XRD analysis. XRD patterns of interrupted PM1- and PM2 pellets were very similar which is in an excellent agreement to the identical reaction mechanism observed by the thermogravimetery analysis. Figure 63 and Figure 64 show the XRD patterns of quenched pellets at different temperatures and the corresponding matching phases.
Figure 63 XRD patterns of the quenched PM1- pellets (5% BF-dust containing pellets).
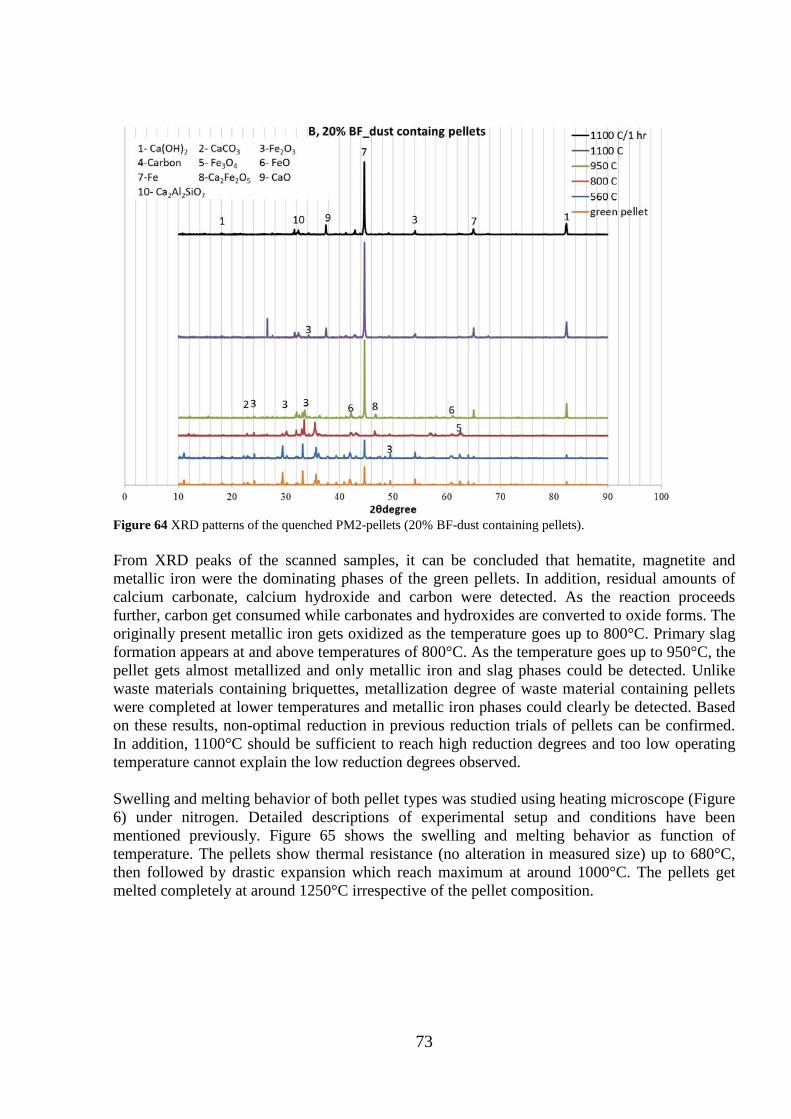
73
Figure 64 XRD patterns of the quenched PM2-pellets (20% BF-dust containing pellets). From XRD peaks of the scanned samples, it can be concluded that hematite, magnetite and metallic iron were the dominating phases of the green pellets. In addition, residual amounts of calcium carbonate, calcium hydroxide and carbon were detected. As the reaction proceeds further, carbon get consumed while carbonates and hydroxides are converted to oxide forms. The originally present metallic iron gets oxidized as the temperature goes up to 800°C. Primary slag formation appears at and above temperatures of 800°C. As the temperature goes up to 950°C, the pellet gets almost metallized and only metallic iron and slag phases could be detected. Unlike waste materials containing briquettes, metallization degree of waste material containing pellets were completed at lower temperatures and metallic iron phases could clearly be detected. Based on these results, non-optimal reduction in previous reduction trials of pellets can be confirmed. In addition, 1100°C should be sufficient to reach high reduction degrees and too low operating temperature cannot explain the low reduction degrees observed. Swelling and melting behavior of both pellet types was studied using heating microscope (Figure 6) under nitrogen. Detailed descriptions of experimental setup and conditions have been mentioned previously. Figure 65 shows the swelling and melting behavior as function of temperature. The pellets show thermal resistance (no alteration in measured size) up to 680°C, then followed by drastic expansion which reach maximum at around 1000°C. The pellets get melted completely at around 1250°C irrespective of the pellet composition.
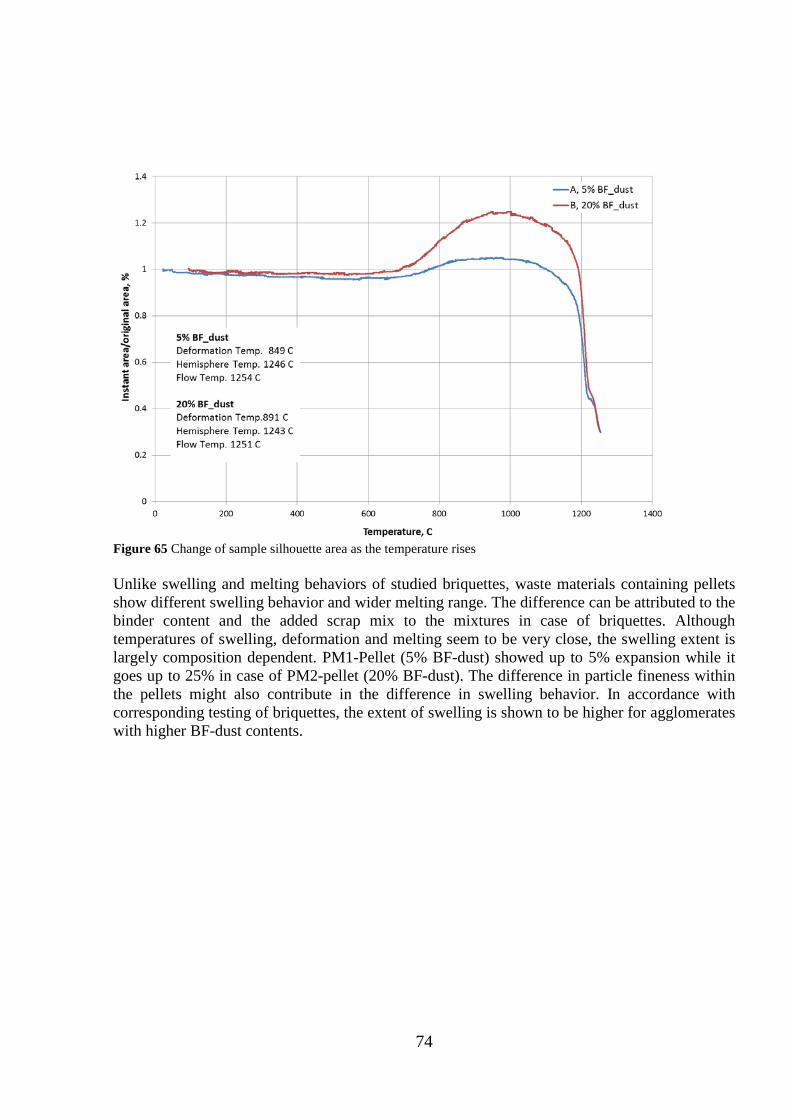
74
Figure 65 Change of sample silhouette area as the temperature rises Unlike swelling and melting behaviors of studied briquettes, waste materials containing pellets show different swelling behavior and wider melting range. The difference can be attributed to the binder content and the added scrap mix to the mixtures in case of briquettes. Although temperatures of swelling, deformation and melting seem to be very close, the swelling extent is largely composition dependent. PM1-Pellet (5% BF-dust) showed up to 5% expansion while it goes up to 25% in case of PM2-pellet (20% BF-dust). The difference in particle fineness within the pellets might also contribute in the difference in swelling behavior. In accordance with corresponding testing of briquettes, the extent of swelling is shown to be higher for agglomerates with higher BF-dust contents.
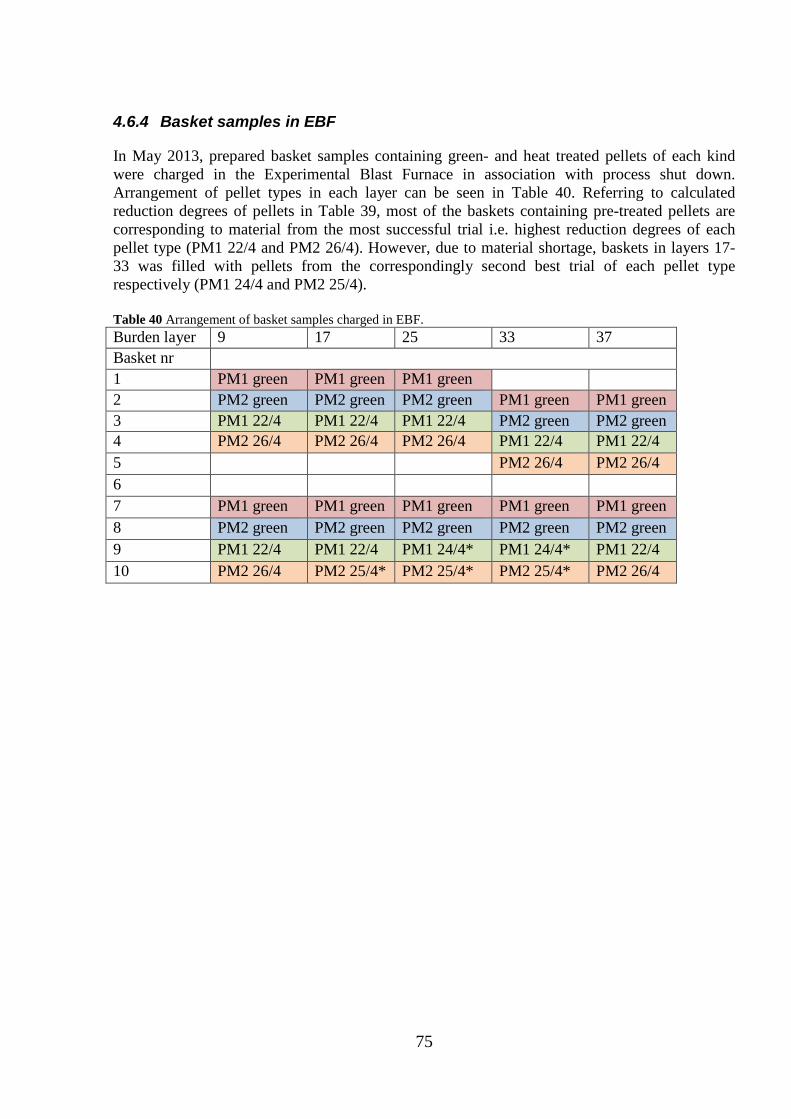
75
4.6.4 Basket samples in EBF
In May 2013, prepared basket samples containing green- and heat treated pellets of each kind were charged in the Experimental Blast Furnace in association with process shut down. Arrangement of pellet types in each layer can be seen in Table 40. Referring to calculated reduction degrees of pellets in Table 39, most of the baskets containing pre-treated pellets are corresponding to material from the most successful trial i.e. highest reduction degrees of each pellet type (PM1 22/4 and PM2 26/4). However, due to material shortage, baskets in layers 17-33 was filled with pellets from the correspondingly second best trial of each pellet type respectively (PM1 24/4 and PM2 25/4). Table 40 Arrangement of basket samples charged in EBF. Burden layer 9 17 25 33 37 Basket nr 1 PM1 green PM1 green PM1 green 2 PM2 green PM2 green PM2 green PM1 green PM1 green 3 PM1 22/4 PM1 22/4 PM1 22/4 PM2 green PM2 green 4 PM2 26/4 PM2 26/4 PM2 26/4 PM1 22/4 PM1 22/4 5 PM2 26/4 PM2 26/4 6 7 PM1 green PM1 green PM1 green PM1 green PM1 green 8 PM2 green PM2 green PM2 green PM2 green PM2 green 9 PM1 22/4 PM1 22/4 PM1 24/4* PM1 24/4* PM1 22/4 10 PM2 26/4 PM2 25/4* PM2 25/4* PM2 25/4* PM2 26/4
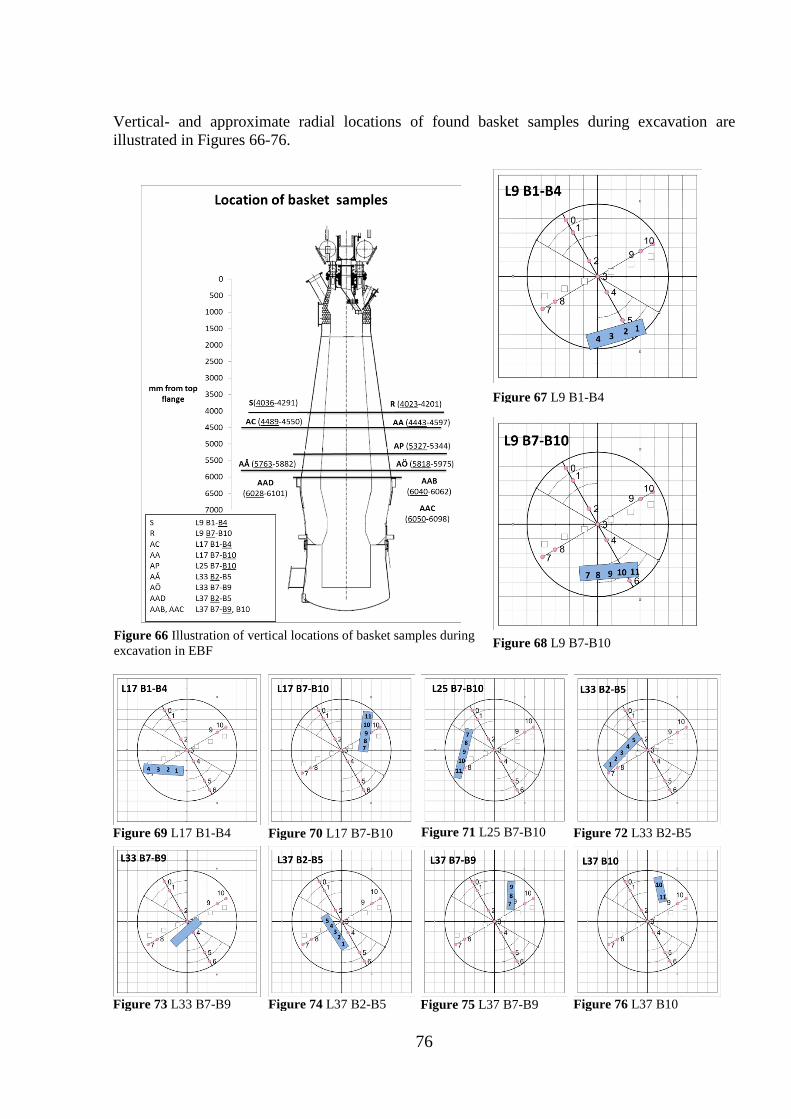
76
Vertical- and approximate radial locations of found basket samples during excavation are illustrated in Figures 66-76.
Figure 66 Illustration of vertical locations of basket samples during excavation in EBF
Figure 67 L9 B1-B4
Figure 68 L9 B7-B10
Figure 69 L17 B1-B4 Figure 70 L17 B7-B10 Figure 71 L25 B7-B10 Figure 72 L33 B2-B5
Figure 73 L33 B7-B9 Figure 74 L37 B2-B5 Figure 75 L37 B7-B9 Figure 76 L37 B10
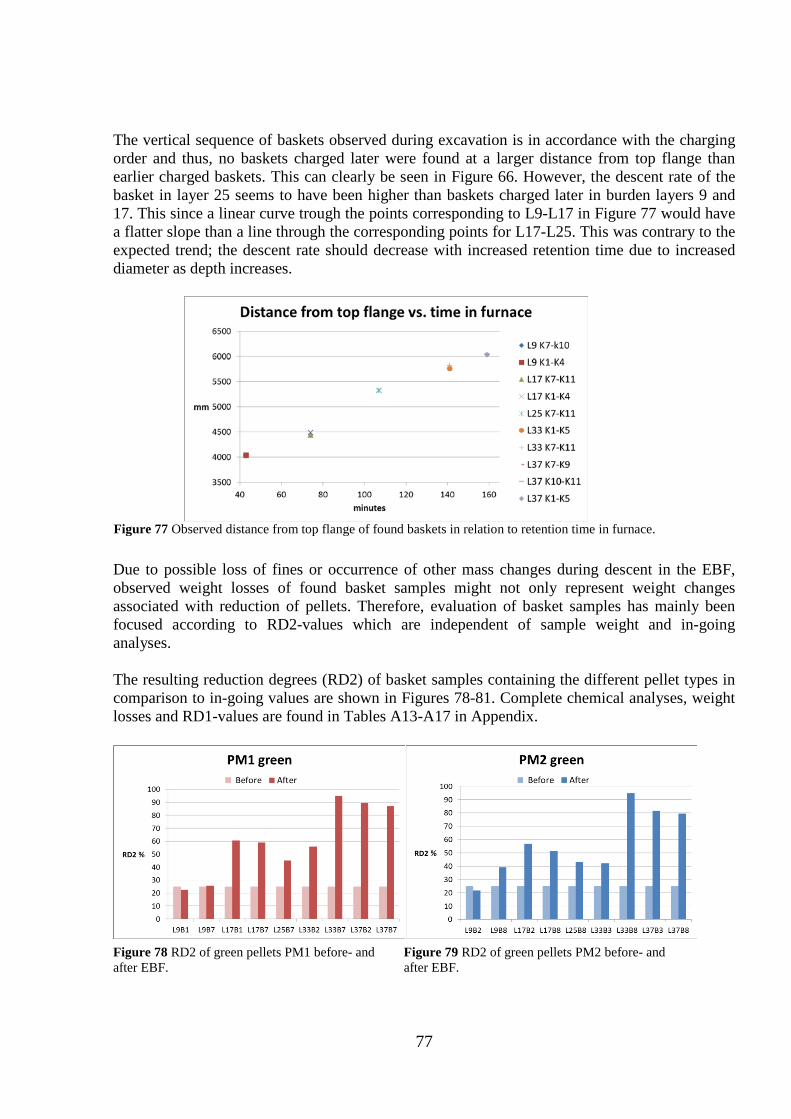
77
The vertical sequence of baskets observed during excavation is in accordance with the charging order and thus, no baskets charged later were found at a larger distance from top flange than earlier charged baskets. This can clearly be seen in Figure 66. However, the descent rate of the basket in layer 25 seems to have been higher than baskets charged later in burden layers 9 and 17. This since a linear curve trough the points corresponding to L9-L17 in Figure 77 would have a flatter slope than a line through the corresponding points for L17-L25. This was contrary to the expected trend; the descent rate should decrease with increased retention time due to increased diameter as depth increases.
Due to possible loss of fines or occurrence of other mass changes during descent in the EBF, observed weight losses of found basket samples might not only represent weight changes associated with reduction of pellets. Therefore, evaluation of basket samples has mainly been focused according to RD2-values which are independent of sample weight and in-going analyses. The resulting reduction degrees (RD2) of basket samples containing the different pellet types in comparison to in-going values are shown in Figures 78-81. Complete chemical analyses, weight losses and RD1-values are found in Tables A13-A17 in Appendix.
Figure 77 Observed distance from top flange of found baskets in relation to retention time in furnace.
Figure 78 RD2 of green pellets PM1 before- and after EBF.
Figure 79 RD2 of green pellets PM2 before- and after EBF.
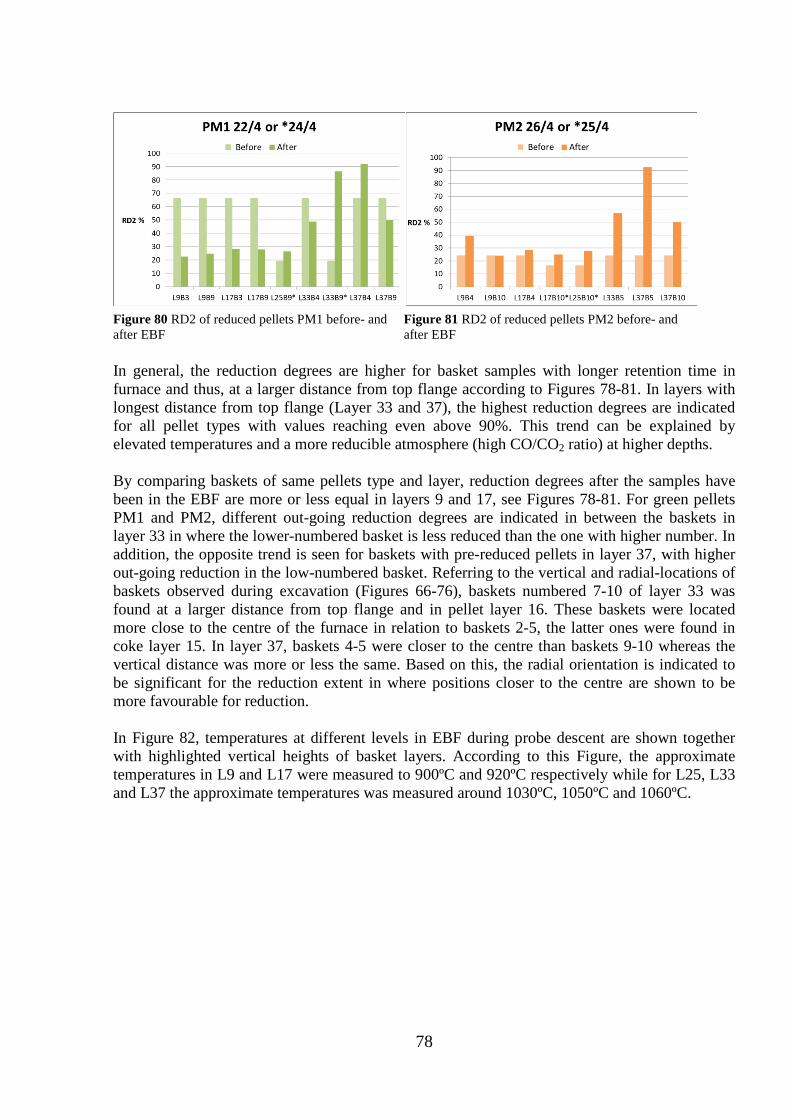
78
In general, the reduction degrees are higher for basket samples with longer retention time in furnace and thus, at a larger distance from top flange according to Figures 78-81. In layers with longest distance from top flange (Layer 33 and 37), the highest reduction degrees are indicated for all pellet types with values reaching even above 90%. This trend can be explained by elevated temperatures and a more reducible atmosphere (high CO/CO2 ratio) at higher depths. By comparing baskets of same pellets type and layer, reduction degrees after the samples have been in the EBF are more or less equal in layers 9 and 17, see Figures 78-81. For green pellets PM1 and PM2, different out-going reduction degrees are indicated in between the baskets in layer 33 in where the lower-numbered basket is less reduced than the one with higher number. In addition, the opposite trend is seen for baskets with pre-reduced pellets in layer 37, with higher out-going reduction in the low-numbered basket. Referring to the vertical and radial-locations of baskets observed during excavation (Figures 66-76), baskets numbered 7-10 of layer 33 was found at a larger distance from top flange and in pellet layer 16. These baskets were located more close to the centre of the furnace in relation to baskets 2-5, the latter ones were found in coke layer 15. In layer 37, baskets 4-5 were closer to the centre than baskets 9-10 whereas the vertical distance was more or less the same. Based on this, the radial orientation is indicated to be significant for the reduction extent in where positions closer to the centre are shown to be more favourable for reduction. In Figure 82, temperatures at different levels in EBF during probe descent are shown together with highlighted vertical heights of basket layers. According to this Figure, the approximate temperatures in L9 and L17 were measured to 900ºC and 920ºC respectively while for L25, L33 and L37 the approximate temperatures was measured around 1030ºC, 1050ºC and 1060ºC.
Figure 80 RD2 of reduced pellets PM1 before- and after EBF
Figure 81 RD2 of reduced pellets PM2 before- and after EBF
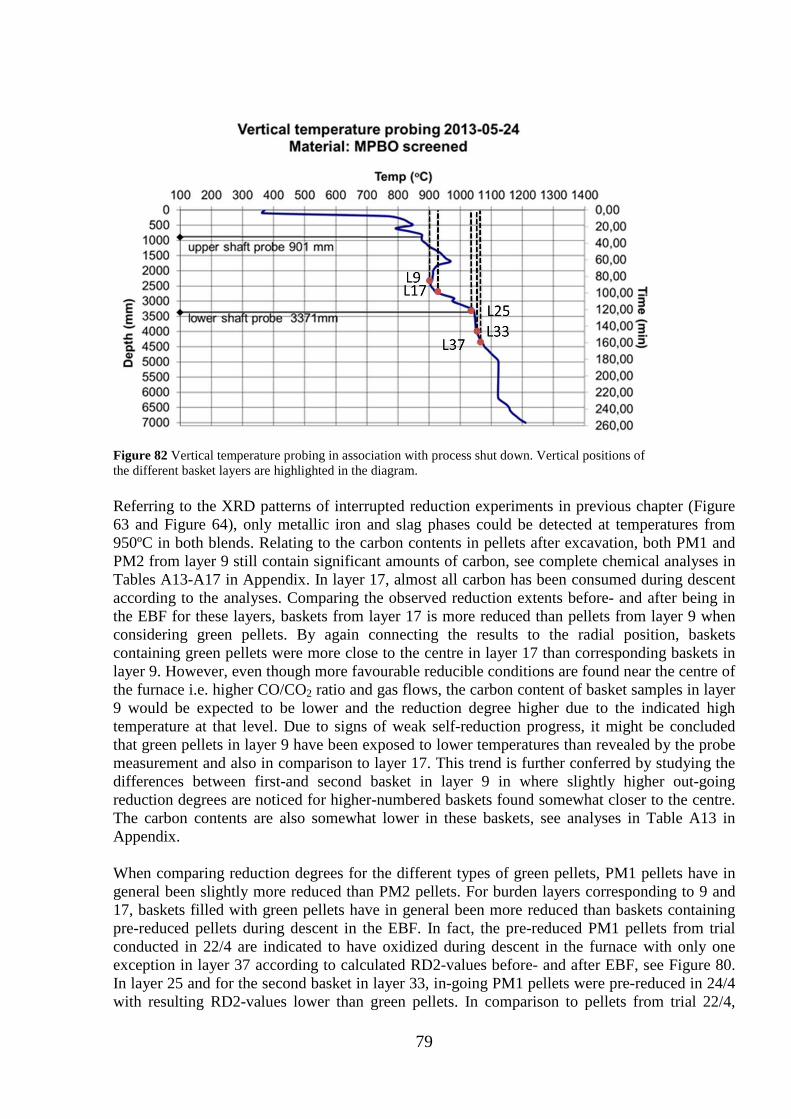
79
Referring to the XRD patterns of interrupted reduction experiments in previous chapter (Figure 63 and Figure 64), only metallic iron and slag phases could be detected at temperatures from 950ºC in both blends. Relating to the carbon contents in pellets after excavation, both PM1 and PM2 from layer 9 still contain significant amounts of carbon, see complete chemical analyses in Tables A13-A17 in Appendix. In layer 17, almost all carbon has been consumed during descent according to the analyses. Comparing the observed reduction extents before- and after being in the EBF for these layers, baskets from layer 17 is more reduced than pellets from layer 9 when considering green pellets. By again connecting the results to the radial position, baskets containing green pellets were more close to the centre in layer 17 than corresponding baskets in layer 9. However, even though more favourable reducible conditions are found near the centre of the furnace i.e. higher CO/CO2 ratio and gas flows, the carbon content of basket samples in layer 9 would be expected to be lower and the reduction degree higher due to the indicated high temperature at that level. Due to signs of weak self-reduction progress, it might be concluded that green pellets in layer 9 have been exposed to lower temperatures than revealed by the probe measurement and also in comparison to layer 17. This trend is further conferred by studying the differences between first-and second basket in layer 9 in where slightly higher out-going reduction degrees are noticed for higher-numbered baskets found somewhat closer to the centre. The carbon contents are also somewhat lower in these baskets, see analyses in Table A13 in Appendix. When comparing reduction degrees for the different types of green pellets, PM1 pellets have in general been slightly more reduced than PM2 pellets. For burden layers corresponding to 9 and 17, baskets filled with green pellets have in general been more reduced than baskets containing pre-reduced pellets during descent in the EBF. In fact, the pre-reduced PM1 pellets from trial conducted in 22/4 are indicated to have oxidized during descent in the furnace with only one exception in layer 37 according to calculated RD2-values before- and after EBF, see Figure 80. In layer 25 and for the second basket in layer 33, in-going PM1 pellets were pre-reduced in 24/4 with resulting RD2-values lower than green pellets. In comparison to pellets from trial 22/4,
Figure 82 Vertical temperature probing in association with process shut down. Vertical positions of the different basket layers are highlighted in the diagram.
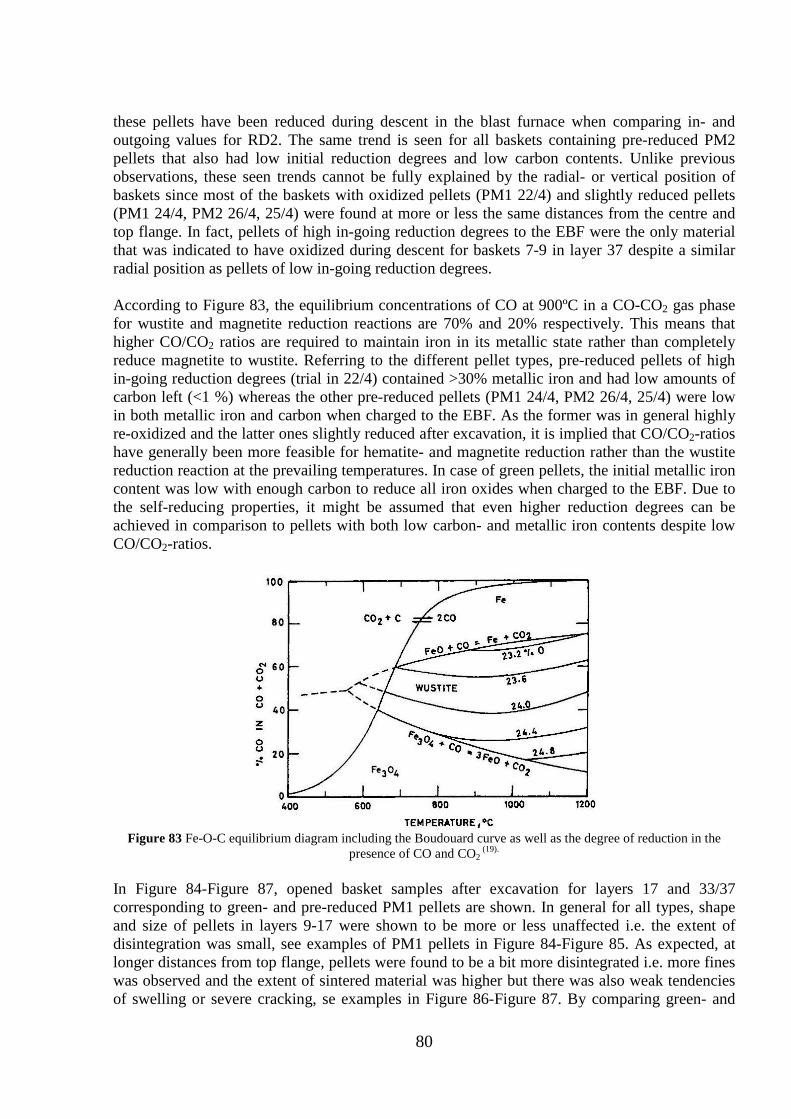
80
these pellets have been reduced during descent in the blast furnace when comparing in- and outgoing values for RD2. The same trend is seen for all baskets containing pre-reduced PM2 pellets that also had low initial reduction degrees and low carbon contents. Unlike previous observations, these seen trends cannot be fully explained by the radial- or vertical position of baskets since most of the baskets with oxidized pellets (PM1 22/4) and slightly reduced pellets (PM1 24/4, PM2 26/4, 25/4) were found at more or less the same distances from the centre and top flange. In fact, pellets of high in-going reduction degrees to the EBF were the only material that was indicated to have oxidized during descent for baskets 7-9 in layer 37 despite a similar radial position as pellets of low in-going reduction degrees. According to Figure 83, the equilibrium concentrations of CO at 900ºC in a CO-CO2 gas phase for wustite and magnetite reduction reactions are 70% and 20% respectively. This means that higher CO/CO2 ratios are required to maintain iron in its metallic state rather than completely reduce magnetite to wustite. Referring to the different pellet types, pre-reduced pellets of high in-going reduction degrees (trial in 22/4) contained >30% metallic iron and had low amounts of carbon left (<1 %) whereas the other pre-reduced pellets (PM1 24/4, PM2 26/4, 25/4) were low in both metallic iron and carbon when charged to the EBF. As the former was in general highly re-oxidized and the latter ones slightly reduced after excavation, it is implied that CO/CO2-ratios have generally been more feasible for hematite- and magnetite reduction rather than the wustite reduction reaction at the prevailing temperatures. In case of green pellets, the initial metallic iron content was low with enough carbon to reduce all iron oxides when charged to the EBF. Due to the self-reducing properties, it might be assumed that even higher reduction degrees can be achieved in comparison to pellets with both low carbon- and metallic iron contents despite low CO/CO2-ratios.
Figure 83 Fe-O-C equilibrium diagram including the Boudouard curve as well as the degree of reduction in the
presence of CO and CO2 (19).
In Figure 84-Figure 87, opened basket samples after excavation for layers 17 and 33/37 corresponding to green- and pre-reduced PM1 pellets are shown. In general for all types, shape and size of pellets in layers 9-17 were shown to be more or less unaffected i.e. the extent of disintegration was small, see examples of PM1 pellets in Figure 84-Figure 85. As expected, at longer distances from top flange, pellets were found to be a bit more disintegrated i.e. more fines was observed and the extent of sintered material was higher but there was also weak tendencies of swelling or severe cracking, se examples in Figure 86-Figure 87. By comparing green- and
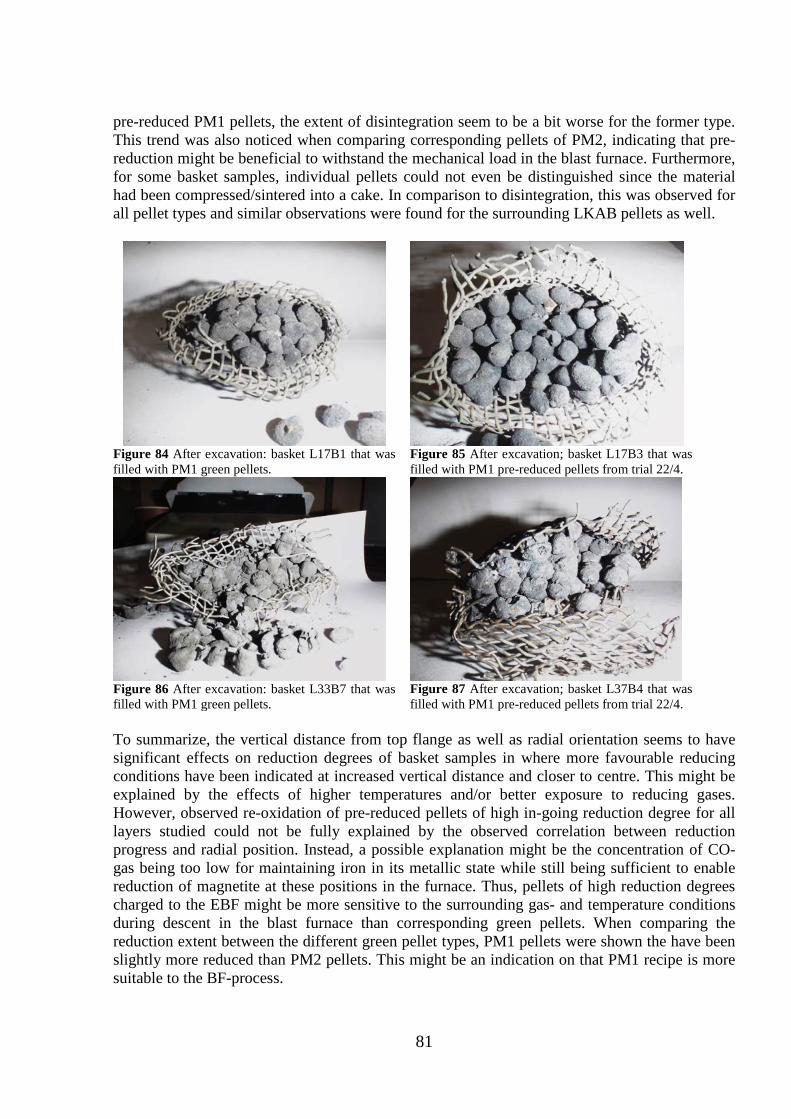
81
pre-reduced PM1 pellets, the extent of disintegration seem to be a bit worse for the former type. This trend was also noticed when comparing corresponding pellets of PM2, indicating that pre-reduction might be beneficial to withstand the mechanical load in the blast furnace. Furthermore, for some basket samples, individual pellets could not even be distinguished since the material had been compressed/sintered into a cake. In comparison to disintegration, this was observed for all pellet types and similar observations were found for the surrounding LKAB pellets as well.
Figure 84 After excavation: basket L17B1 that was filled with PM1 green pellets.
Figure 85 After excavation; basket L17B3 that was filled with PM1 pre-reduced pellets from trial 22/4.
Figure 86 After excavation: basket L33B7 that was filled with PM1 green pellets.
Figure 87 After excavation; basket L37B4 that was filled with PM1 pre-reduced pellets from trial 22/4.
To summarize, the vertical distance from top flange as well as radial orientation seems to have significant effects on reduction degrees of basket samples in where more favourable reducing conditions have been indicated at increased vertical distance and closer to centre. This might be explained by the effects of higher temperatures and/or better exposure to reducing gases. However, observed re-oxidation of pre-reduced pellets of high in-going reduction degree for all layers studied could not be fully explained by the observed correlation between reduction progress and radial position. Instead, a possible explanation might be the concentration of CO-gas being too low for maintaining iron in its metallic state while still being sufficient to enable reduction of magnetite at these positions in the furnace. Thus, pellets of high reduction degrees charged to the EBF might be more sensitive to the surrounding gas- and temperature conditions during descent in the blast furnace than corresponding green pellets. When comparing the reduction extent between the different green pellet types, PM1 pellets were shown the have been slightly more reduced than PM2 pellets. This might be an indication on that PM1 recipe is more suitable to the BF-process.

82
To enable further confirmation, more work is needed. For instance, if each basket is split into subsections by separating walls, baskets can be loaded with both pre-reduced and green pellets. This would allow for more accurate evaluation of reduction behaviour as the different pellet types within one basket would be exposed to more alike furnace conditions during descent. As this suggested set-up would theoretically contribute to smaller variations in applied mechanical load for material within one basket, another advantage would be the possibility of getting a better understanding on how the mechanical strength is affected during descent in the furnace for the different pellet types. Furthermore, to support the reduction extent revealed by out-going chemical analyses, analyses in microscope should also be conducted.
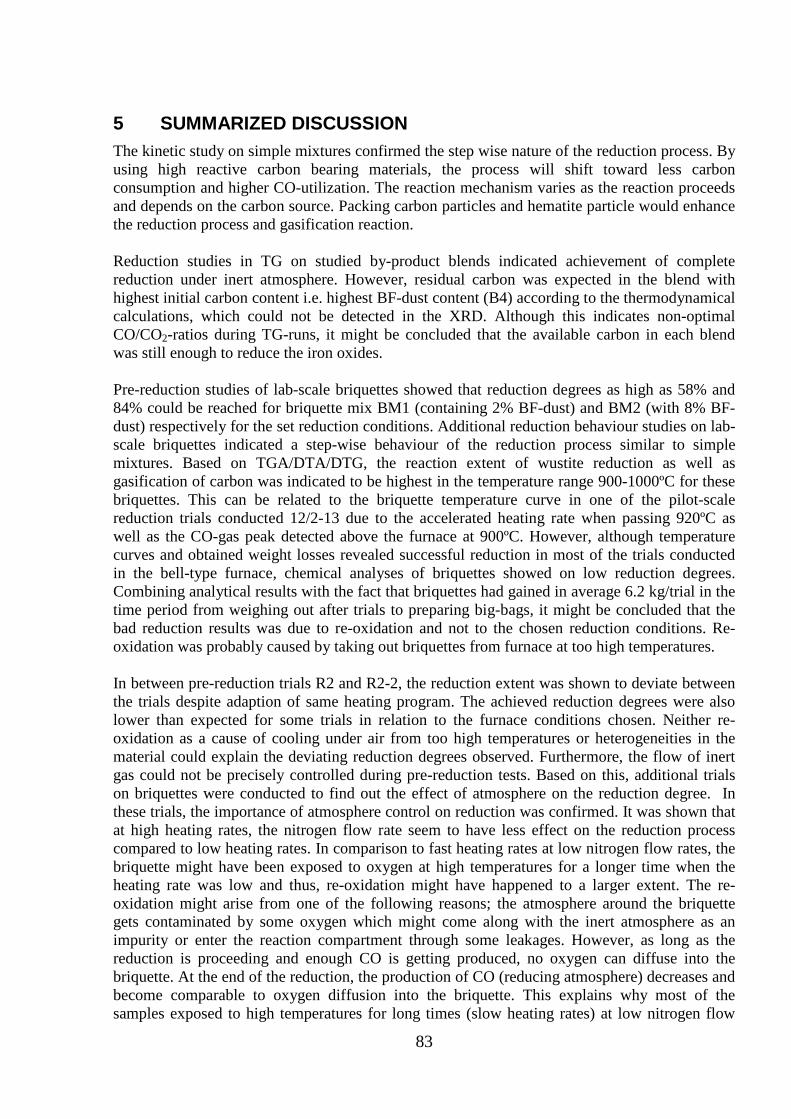
83
5 SUMMARIZED DISCUSSION The kinetic study on simple mixtures confirmed the step wise nature of the reduction process. By using high reactive carbon bearing materials, the process will shift toward less carbon consumption and higher CO-utilization. The reaction mechanism varies as the reaction proceeds and depends on the carbon source. Packing carbon particles and hematite particle would enhance the reduction process and gasification reaction. Reduction studies in TG on studied by-product blends indicated achievement of complete reduction under inert atmosphere. However, residual carbon was expected in the blend with highest initial carbon content i.e. highest BF-dust content (B4) according to the thermodynamical calculations, which could not be detected in the XRD. Although this indicates non-optimal CO/CO2-ratios during TG-runs, it might be concluded that the available carbon in each blend was still enough to reduce the iron oxides. Pre-reduction studies of lab-scale briquettes showed that reduction degrees as high as 58% and 84% could be reached for briquette mix BM1 (containing 2% BF-dust) and BM2 (with 8% BF-dust) respectively for the set reduction conditions. Additional reduction behaviour studies on lab-scale briquettes indicated a step-wise behaviour of the reduction process similar to simple mixtures. Based on TGA/DTA/DTG, the reaction extent of wustite reduction as well as gasification of carbon was indicated to be highest in the temperature range 900-1000ºC for these briquettes. This can be related to the briquette temperature curve in one of the pilot-scale reduction trials conducted 12/2-13 due to the accelerated heating rate when passing 920ºC as well as the CO-gas peak detected above the furnace at 900ºC. However, although temperature curves and obtained weight losses revealed successful reduction in most of the trials conducted in the bell-type furnace, chemical analyses of briquettes showed on low reduction degrees. Combining analytical results with the fact that briquettes had gained in average 6.2 kg/trial in the time period from weighing out after trials to preparing big-bags, it might be concluded that the bad reduction results was due to re-oxidation and not to the chosen reduction conditions. Re-oxidation was probably caused by taking out briquettes from furnace at too high temperatures. In between pre-reduction trials R2 and R2-2, the reduction extent was shown to deviate between the trials despite adaption of same heating program. The achieved reduction degrees were also lower than expected for some trials in relation to the furnace conditions chosen. Neither re-oxidation as a cause of cooling under air from too high temperatures or heterogeneities in the material could explain the deviating reduction degrees observed. Furthermore, the flow of inert gas could not be precisely controlled during pre-reduction tests. Based on this, additional trials on briquettes were conducted to find out the effect of atmosphere on the reduction degree. In these trials, the importance of atmosphere control on reduction was confirmed. It was shown that at high heating rates, the nitrogen flow rate seem to have less effect on the reduction process compared to low heating rates. In comparison to fast heating rates at low nitrogen flow rates, the briquette might have been exposed to oxygen at high temperatures for a longer time when the heating rate was low and thus, re-oxidation might have happened to a larger extent. The re-oxidation might arise from one of the following reasons; the atmosphere around the briquette gets contaminated by some oxygen which might come along with the inert atmosphere as an impurity or enter the reaction compartment through some leakages. However, as long as the reduction is proceeding and enough CO is getting produced, no oxygen can diffuse into the briquette. At the end of the reduction, the production of CO (reducing atmosphere) decreases and become comparable to oxygen diffusion into the briquette. This explains why most of the samples exposed to high temperatures for long times (slow heating rates) at low nitrogen flow
84
rates was characterized by low weight losses. Thus, at least for the same conditions as in conducted trials within this project, high nitrogen flow rates are preferable for slow heating rates to maintain inert atmosphere even when the reduction reactions are ending. However, as highest flow rates have not shown to correspond to the highest reduction degrees, too high flows might also be negative for the reduction extent. Briquettes produced at the briquette plant for the industrial melt-in trial was shown to have sufficient mechanical strength for handling and reduction after two weeks of hardening. This combined with other technical aspects revealed that it is possible to produce briquettes containing 50% dust and sludge. However, presence of inhomogeneities and voids was revealed by visual examination of some briquettes which is an indication that the production can be further improved. Moreover, the material treatment before briquetting and pre-drying of sludges was shown to be crucial for briquetting. The melt-in trials conducted at SSAB EMEA in Luleå during spring 2013 indicated that it is possible to charge pre-reduced briquettes in hot metal ladle before desulphurisation without any significant process impacts. This was indicated even when charging two big bags amounting to 400 kg where some un-melted briquettes could be observed in the slag phase when the ladle arrived at the desulphurisation station. For a charged amount of 400 kg per 130 ton hot metal at an annual HM-production of 3.8 Mtonnes, the amount recycled per year by this recycling method is 11.7 kton. This is corresponding to 16.7% of the total amount of DRI that can be produced by generated dust and sludge from integrated steelplants in Sweden (based on annual production in 2007) in where the potential energy saving is expected to 35 GWh/year. However, as melt-in trials are corresponding to a limited number of heats, recycling by this method need further confirmation by conducting additional trials before stating the maximum amount of briquettes that can be charged without any significant process impact. Moreover, charging pellets instead of briquettes could benefit the melt-in stage and thereby allow for larger amounts to be charged in each heat and improve the recycling yield. This alternative might therefore have the potential to reach even higher energy savings and is therefore recommended to be considered in future work. The importance of atmosphere was also indicated during reduction of pellets in where the reduction degrees became significantly lower when starting suction of furnace exhaust gases near the outlet. This might have contributed to higher concentrations of air leaking into the furnace due to a created under pressure and thus, an inert atmosphere could not be maintained. The maximum reduction degree achieved for these trials was 56.7% corresponding to recipe PM1. Moreover, this trial was the only one without any ventilation of furnace gases. Based on the chemical analyses of pellets from each trial, it was shown that the Zn-content had been reduced in all cases from approximately 3000 to 125 ppm. In TG-results of both pellets types, higher weight losses were achieved than in any of the trials conducted in the lab furnace. This implies that higher reduction degrees than 56.7% can be expected with better control of atmosphere. The evaluation of reduction behaviour of green- and pre-reduced pellets in blast furnace showed that high vertical depths and positions closer to the centre are advantageous for the reduction progress. This can be attributed to higher temperatures and/or higher CO/CO2-ratios at these positions. Pre-reduced pellets of highest reduction degree (22/4) was shown to have oxidized during descent in the furnace for layers 9-33 whereas the corresponding pre-reduced pellets of low reduction degree and carbon content as well as green pellets had been reduced. A possible
85
explanation to this is that the CO/CO2 ratio has been too low in these regions to allow for iron being kept in its metallic state while still being high enough to enable hematite- and magnetite reduction. In case of green pellets, higher reduction degrees was in general achieved for all layers which might be explained by the self-reducing properties and thus, these pellets are less dependent on the surrounding gas composition. This implies that green pellets are better adapted to be charged in the blast furnace with respect to reduction. However if the Zn-load to the blast furnace is limited, some kind of pre-treatment is still necessary to decrease the Zn content in by-product pellets. Alternatively, the pellet recipe can be adapted to choose by-products with low Zn-contents and thereby allow for direct recycling in the blast furnace without pre-reduction. As charging metallic material as e.g. scrap or DRI in industrial blast furnaces is known to result in lower consumption of coke and coal, pre-reduction will still be beneficial for reduced energy consumption. Thus, the results are indicating that charging green- or pre-reduced pellets will in both cases improve the material- and energy efficiencies. Moreover, by visually observing pellets inside basket samples after excavation, no significant sign of swelling or cracking was shown at high depths in the furnace but some small tendencies of sintering and disintegration could be seen. The latter trend was observed to be slightly worse for green pellets which imply that the pre-reduction is also beneficial for the pellets mechanical properties during descent in the blast furnace.
86
6 CONCLUSIONS • Agglomeration tests have shown that briquettes and pellets with sufficient mechanical
properties and self-reducibility can be prepared from available by-products and used for recycling.
• Carbonaceous materials characterization as well as reduction behavior studies of simple mixtures with hematite and by-product blends have indicated that utilization of BF-dust as reductant in self-reducing mixtures with iron- and steelmaking dust and sludge bring comparable results relative to charcoal, coke and graphite.
• Reduction behavior studies have shown that the reduction progress of studied recipes of both blend- and agglomerates were found to proceed in accordance with seen behavior of simple mixtures of carbonaceous materials and hematite, namely through three consecutive reduction steps; hematite to magnetite, magnetite to wustite and wustite to metallic iron. At low temperatures, the reduction was shown to be controlled by mainly reaction rate of carbon gasification whereas mass gas diffusion becomes more important at higher temperatures.
• In pre-reduction studies and for basket samples, the maximum reduction degrees
achieved for pellets and briquette was in the range of 50-80%. However, potential for higher reduction degrees, up to almost 100%, were indicated during thermal analyses and in trials with single agglomerates.
• According to conducted reduction studies within this project, heating rate, inert gas flow rate and atmosphere are crucial parameters for the reduction process of agglomerates. However, the observed correlations need further confirmation by additional studies before any final conclusions on optimal reducing conditions can be drawn.
• After cessation of reduction reactions, cooling under air from 600-500ºC should be avoided to prevent re-oxidation of reduced agglomerates. This probably happened during reduction of briquettes for the industrial melt-in trial at SSAB EMEA.
• Charging pre-reduced briquettes in hot metal ladle gave no negative effect on hot metal losses to the slag or hot metal quality according to melt-in trial and this recycling alternative have at least an energy saving potential of 35 GWh/year based on 0.31% agglomerate addition relative hot metal in the ladle.
• Reduction trials showed that 95-97% of initial zinc content in pellets can be removed during reduction, achieving final contents in the range of 80-125 ppm.
• According to evaluation of basket samples in EBF, green pellets attained the highest reduction degrees during descent in BF in comparison to corresponding pre-reduced pellets. However, pre-reduction might be required for the BF process with respect to Zn, Pb and alkali load.
87
7 REFERENCES 1. Annual book of ASTM standards. u.o. : American national standard institute, ss. Part 26, D121-72, D3172-73 & D3174-73. 2. Ng KW, Giroux L, MacPhee T, Todoschuk T. Combustibility of charcoal for direct injection in blast furnace ironmaking. Association for Iron & Steel Technology. 3, March 2012, Vol. 9, ss. 70-75. 3. Katta S, Keairns DL. Study of kinetics of carbon gasification reactions. Industrial & Engineering Chemistry Fundamentals. 1, 1981, Vol. 20, ss. 6-13. 4. Babich A, Senk D, Gudenau HW. Effect of coke reactivity and nut coke on blast furnace operation. Ironmaking and Steelmaking. 3, April 2009, Vol. 36, ss. 222-229. 5. Su F, Lampinen H, Robinson R. Recycling of sludge and dust to the BOF converterby cold bonded pelletizing. ISIJ International. 4, 2004, Vol. 44, ss. 770-776. 6. Swedish Standards Institute: SS-ISO 3271:2007, Iron ores for blast furnace and direct reduction feedstocks – Determination of the tumble and abrasion indices, SIS Förlag AB Stockholm, 2007. 7. Ueda S, Watanabe K, Inoue R, Ariyama T. Catalytic effect of Fe, CaO and molten oxide on the gasification reaction of coke and biomass char. ISIJ International. 8, August 2011, Vol. 51, ss. 1262-1268. 8. Naito M, Okamoto A, Yamaguchi K, Yamaguchi T, Inoue Y. Improvement of blast furnace reaction efficiency by temperature control of thermal reserve zone. Nippon Steel Technical Report. 94, July 2006, ss. 103-108. 9. Nonmura S, Kitaguchi H, Yamaguchi K, Naito M. The characteristics of catalyst-coated highly reactive coke. ISIJ International. 2, 2007, Vol. 47, ss. 245-253. 10. Srinivasan NS, Lahiri AK. Studies on the reduction of hematite by carbon. Metallurgical Transactions B. 1, March 1977, Vol. 8, ss. 175-178. 11. YK., Rao. The kinetics of reduction of hematite by carbon. Metallurgical Transactions. 5, May 1971, Vol. 2, ss. 1439-1447. 12. Fortini OM., Fruehan RJ. Rate of reduction of ore-carbon composites: Part I. Metallurgical and Materials Transacitons B: Process Metallurgy and Materials Processing Sience. 6, December 2005, Vol. 36, ss. 865-872. 13. Study on iron formation duing the carbothermic reduction of iron ore in carbon composite pellets in the temperature range 1423-1623 K. Martins SD, Breda MM, Cyro T. 2009. 5th International Congress on the Science and Technology of Ironmaking. ss. 1314-1317. 98865. 14. Iguchi Y, Yokomoto S. Kinetics of the reactions in carbon composite iron ore pellets under various pressures from vacuum to 0.1 MPa. ISIJ International. 12, 2004, Vol. 44, ss. 2008-2017. 15. Coetsee T, Pistorius PC, de Villiers EE. Rate-determining steps for reduction in magnetite-coal pellets. Minerals Engineering. 11, November 2002, Vol. 15, ss. 919-929. 16. Trushenski SP, Li K, Philbrook WO. Non-topochemical reduction of iron oxides. Metall Trans. 5, May 1974, Vol. 5, ss. 1149-1158. 17. Turkdogan ET, Vinters JV. Gaseous reduction of iron oxides: Part III. Reduction-oxidation of porous and dense iron oxides and iron. Metall Trans. 6, June 1972, Vol. 3, ss. 1561-1574. 18. LKAB. LKAB PRODUCTS 2012.
88
19. Biswas, A. K. Principles of Blast Furnace Ironmaking, Theory and Practice. Cootha Publishing House, Brisbane, Australia : u.n., 1985. ISBN 0-949917-00-1, ISBN 0-949917-08-7. 20. TUNNPLÅT, SSAB. SSAB TUNNPLÅT MILJÖRAPPORT. Luleå : u.n., 2007. s. 39. 21. Miljörapport 2008 SSAB Oxelösund AB, SSAB Merox AB. s. 46. 22. AB, SSAB EMEA. Miljörapport 2012 SSAB EMEA AB Luleå. http://www.ssab.com/Global/SSAB/Environment/sv/062_Miljörapport%202012%20-%20Luleå.pdf. 23. SSAB EMEA AB, SSAB Merox AB Oxelösund. Miljörapport 2012, SSAB EMEA AB, SSAB Merox AB Oxelösund. ss. 48-49. http://www.ssab.com/Global/SSAB/Environment/sv/060_Miljörapport%202012%20-%20Oxelösund.pdf.

89
8 ACKNOWLEDGEMENTS The Swedish Energy Agency and Jernkontoret–The Swedish Steel Producers’ Association (TO21–Iron ore based metallurgy) is gratefully acknowledged for the financing and support of the project.

Appendix
i
Table A1 Amounts of generated dust and sludge available for recycling at SSAB EMEA AB steelplants in Luleå and Oxelösund given in ktonne for 2007/2008 and 2012.
Annual amount landfilled 2007/2008 (ktonne dry material)
Annual amount landfilled 2012 (ktonne dry material)
Luleå (20) Oxelösund (21)
Luleå (22) Oxelösund (23)
BOF-sludge 43.43* 0 40.4* 0
BOF-dust 2.44 1.13 2.1 0.59
BF-sludge 15.43 23.0** 14.7 5.23**
BF-dust 0 12.35 0 6.63 *wet material **The figure was calculated based on 35% moisture in the material.
Table A2 Added water, moisture measurements and number of lab-scale briquettes produced. BM 1 BM 2 Batch nr 1 2 3 1 2 3
Added H2O (l) 2 2.5 2.5 3 3 3 Moisture (meas.) % 13.7 18.3 15.1 14.9 16.9 15.5 14.8 13.5 14.8
Moisture (theo.) % 13.0 14.9 14.9 15.1 15.1 15.1 Number of briquettes 16 48 42 48 48 48
Table A3 Chemical analysis of scrap mix and cement used in lab-scale briquettes. Scrap mix cement Fe % 54.2 2.46 CaO % 17.7 65 SiO2 % 4.94 20.1 MnO % 1.7 0.04 P2O5 % 0.24 0.1 Al2O3 % 2.16 3.47 MgO % 4.38 2.11 Na2O % 0.04 0.17 K2O % 0.08 0.93 V2O5 % 1.51 0.02 TiO2 % 0.74 0.21 Cr2O3 % 0.14 0.03 C % 2.82 0.7 S % 0.26 1.37 Zn % 0.04 0 Total 90.95 96.71
Appendix
ii
Table A4 Distribution of briquettes in big bags and total amount for each produced batch.
Date Briquettes/bag (kg) Briquettes total (kg) 12/2 2013 24,9 149,3 13/2 2013 13,7 82,0 18/2 2013 27,9 167,3 20/2 2013 26,0 156 25/2 2013 25,5 153,3 27/2 2013 26,0 156,5 1/3 2013 27,0 162,4 5/3 2013 26,0 156,1 7/3 2013 25,7 154,2
Total 222,8 1337,0 Table A5 Estimated analyses for B1-B4 based on adjusted by-product analyses in Table 17. B1 B2 B3 B4 BF-sludge % 40 38 36 32 BF-dust % 0 5 10 20 BOF-sludge % 58 55.1 52.2 46.4 BOF-dust % 2 1.9 1.8 1.6 Fe met % 4.81 4.57 4.33 3.85 Fe3O4 % 20.35 19.34 18.32 16.28 Fe2O3 % 15.33 15.97 16.60 17.88 FeO % 13.14 12.48 11.82 10.51 CaO % 0.39 0.82 1.26 2.12 SiO2 % 3.15 3.28 3.42 3.70 MnO % 0.70 0.68 0.67 0.64 P2O5 % 0.06 0.06 0.06 0.06 Al2O3 % 1.10 1.15 1.21 1.33 MgO % 2.65 2.59 2.52 2.40 Na2O % 0.04 0.04 0.04 0.04 K2O % 0.12 0.13 0.14 0.17 V2O5 % 0.30 0.30 0.29 0.28 TiO2 % 0.23 0.23 0.24 0.24 Cr2O3 % 0.04 0.04 0.04 0.04 C (LECO) % 10.90 12.71 14.72 18.67 S (LECO) % 0.13 0.15 0.17 0.21 CaCO3 11.59 11.83 10.39 8.14 Ca(OH)2 12.75 11.51 11.51 11.06 SUM 97.78 97.88 97.75 97.62 C/O* 1.10 1.31 1.55 2.04 *Molar ratio between carbon and bound oxygen in iron oxides
Appendix
iii
Table A6 XRF analyses and calculated reduction degrees for trials corresponding to briquette mix 1. R1 Te1.1100 Ti1.40 Ti1.40.1100 Ti1.40.1100-2
Fe % 52.02 45.63 57.63 56.20 49.68 SiO2 % 7.83 7.39 7.20 7.01 7.07 K2O % 0.10 0.13 0.08 0.11 0.14 Al2O3 % 2.38 2.19 2.11 2.12 2.12 CaO % 25.45 24.30 23.28 23.04 23.42 MgO % 3.73 3.68 3.49 3.70 3.62 MnO % 1.12 1.13 1.13 1.44 1.10 TiO2 % 0.75 0.72 0.70 0.67 0.71 V2O5 % 0.80 0.85 0.83 0.79 0.78 P2O5 % 0.13 0.13 0.14 0.14 0.16 Na2O % 0.12 0.14 0.15 0.15 0.15 C % 0.28 0.38 0.28 0.51 0.42 S % 0.90 0.83 0.86 0.78 0.78 SUM XRF 95.62 87.50 97.87 96.65 90.14 LOI 16.66 5.75 21.34 19.35 10.12 Fe2+ % 5.46 2.66 4.86 5.58 4.69 Fe met % 33.83 17.76 39.97 43.69 23.57 Fe3+ % 12.73 25.21 12.80 6.93 21.42 Fe2O3 % OUT 18.20 36.04 18.30 9.91 30.63 FeO % OUT 7.02 3.42 6.25 7.18 6.03 SUM 102.65 99.09 104.77 101.23 100.69 Fe2O3 % IN 22.55 22.55 22.55 22.55 22.55 FeO % IN 6.65 6.65 6.65 6.65 6.65 IN (g) 2950.22 2948.30 3051.00 3032.20 2970.00 OUT (g) 2197.20 2424.90 2261.70 2282.60 2431.20 wt-loss % -25.52 -17.75 -25.87 -24.72 -18.14 O IN (mole) 15.23 15.22 15.75 15.65 15.33 O OUT (mole) 9.66 17.58 9.74 6.53 16.03 RD1% 36.56 -15.49 38.12 58.28 -4.56
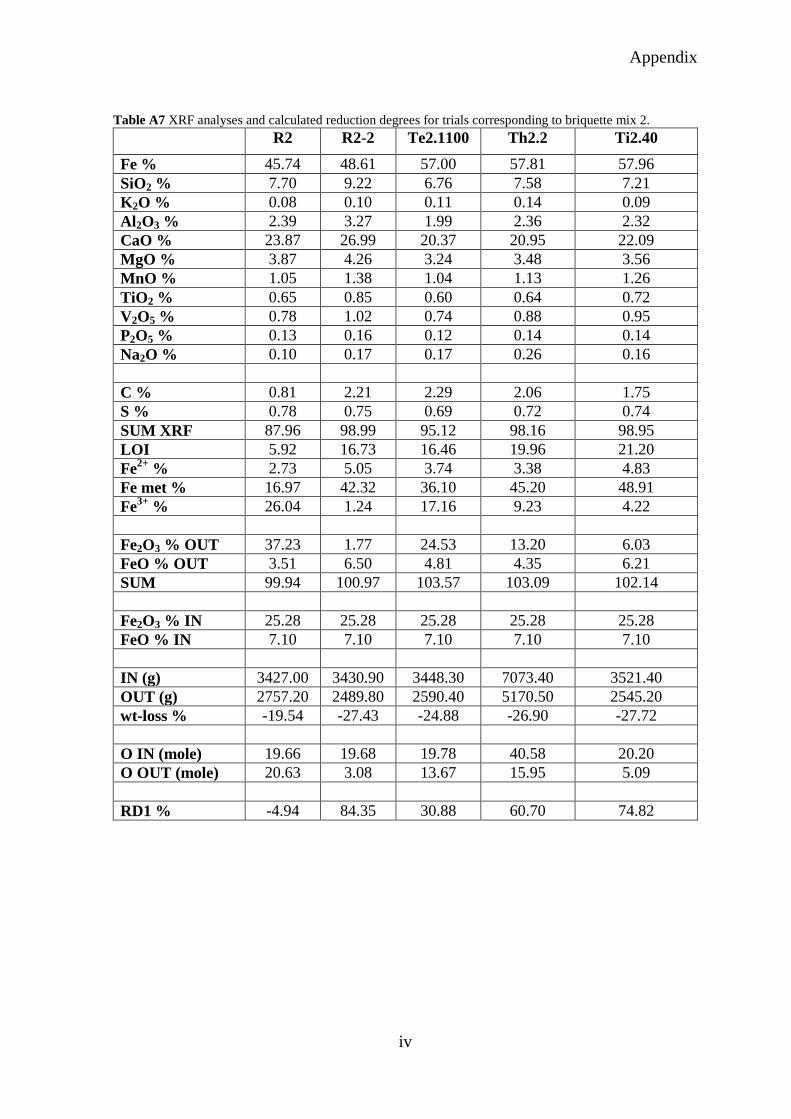
Appendix
iv
Table A7 XRF analyses and calculated reduction degrees for trials corresponding to briquette mix 2. R2 R2-2 Te2.1100 Th2.2 Ti2.40
Fe % 45.74 48.61 57.00 57.81 57.96 SiO2 % 7.70 9.22 6.76 7.58 7.21 K2O % 0.08 0.10 0.11 0.14 0.09 Al2O3 % 2.39 3.27 1.99 2.36 2.32 CaO % 23.87 26.99 20.37 20.95 22.09 MgO % 3.87 4.26 3.24 3.48 3.56 MnO % 1.05 1.38 1.04 1.13 1.26 TiO2 % 0.65 0.85 0.60 0.64 0.72 V2O5 % 0.78 1.02 0.74 0.88 0.95 P2O5 % 0.13 0.16 0.12 0.14 0.14 Na2O % 0.10 0.17 0.17 0.26 0.16 C % 0.81 2.21 2.29 2.06 1.75 S % 0.78 0.75 0.69 0.72 0.74 SUM XRF 87.96 98.99 95.12 98.16 98.95 LOI 5.92 16.73 16.46 19.96 21.20 Fe2+ % 2.73 5.05 3.74 3.38 4.83 Fe met % 16.97 42.32 36.10 45.20 48.91 Fe3+ % 26.04 1.24 17.16 9.23 4.22 Fe2O3 % OUT 37.23 1.77 24.53 13.20 6.03 FeO % OUT 3.51 6.50 4.81 4.35 6.21 SUM 99.94 100.97 103.57 103.09 102.14 Fe2O3 % IN 25.28 25.28 25.28 25.28 25.28 FeO % IN 7.10 7.10 7.10 7.10 7.10 IN (g) 3427.00 3430.90 3448.30 7073.40 3521.40 OUT (g) 2757.20 2489.80 2590.40 5170.50 2545.20 wt-loss % -19.54 -27.43 -24.88 -26.90 -27.72 O IN (mole) 19.66 19.68 19.78 40.58 20.20 O OUT (mole) 20.63 3.08 13.67 15.95 5.09 RD1 % -4.94 84.35 30.88 60.70 74.82
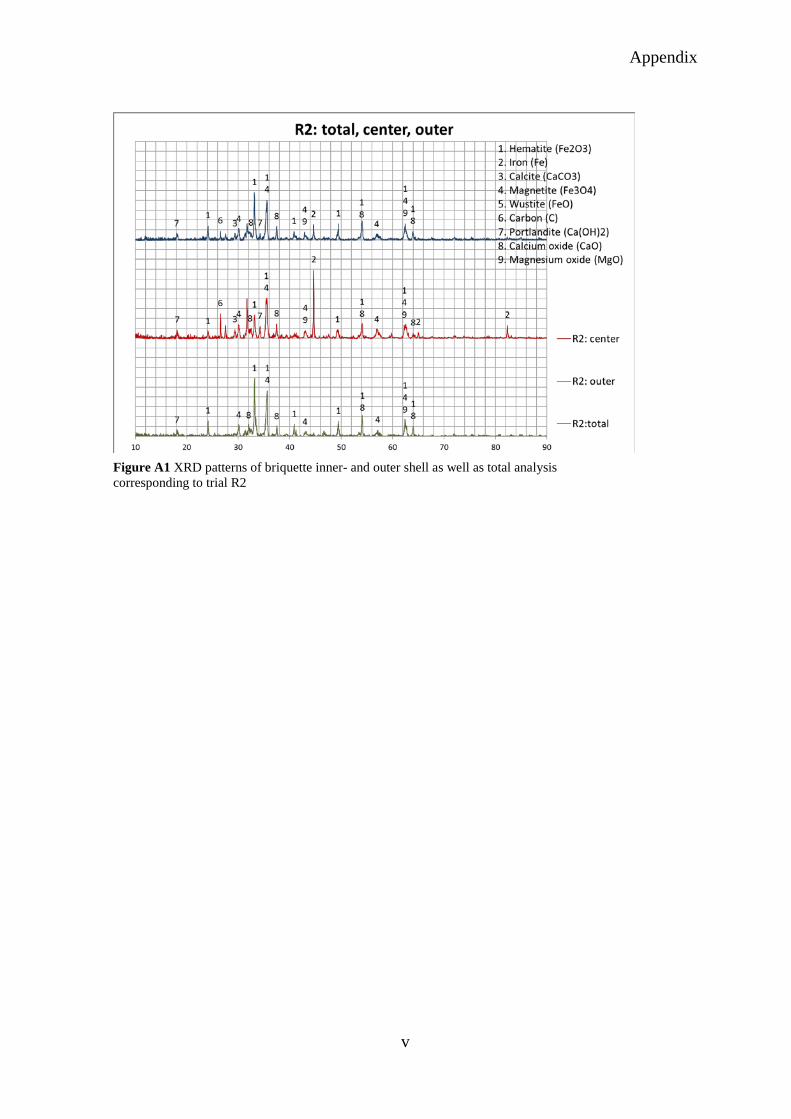
Appendix
v
Figure A1 XRD patterns of briquette inner- and outer shell as well as total analysis corresponding to trial R2
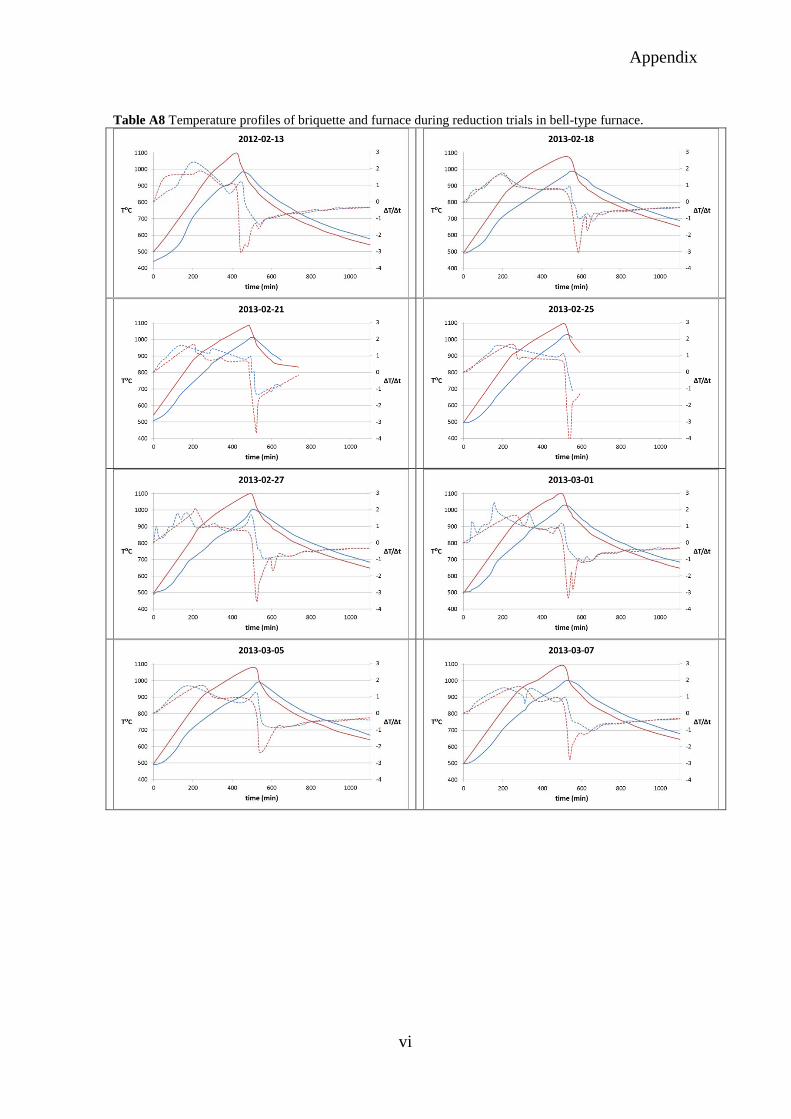
Appendix
vi
Table A8 Temperature profiles of briquette and furnace during reduction trials in bell-type furnace.
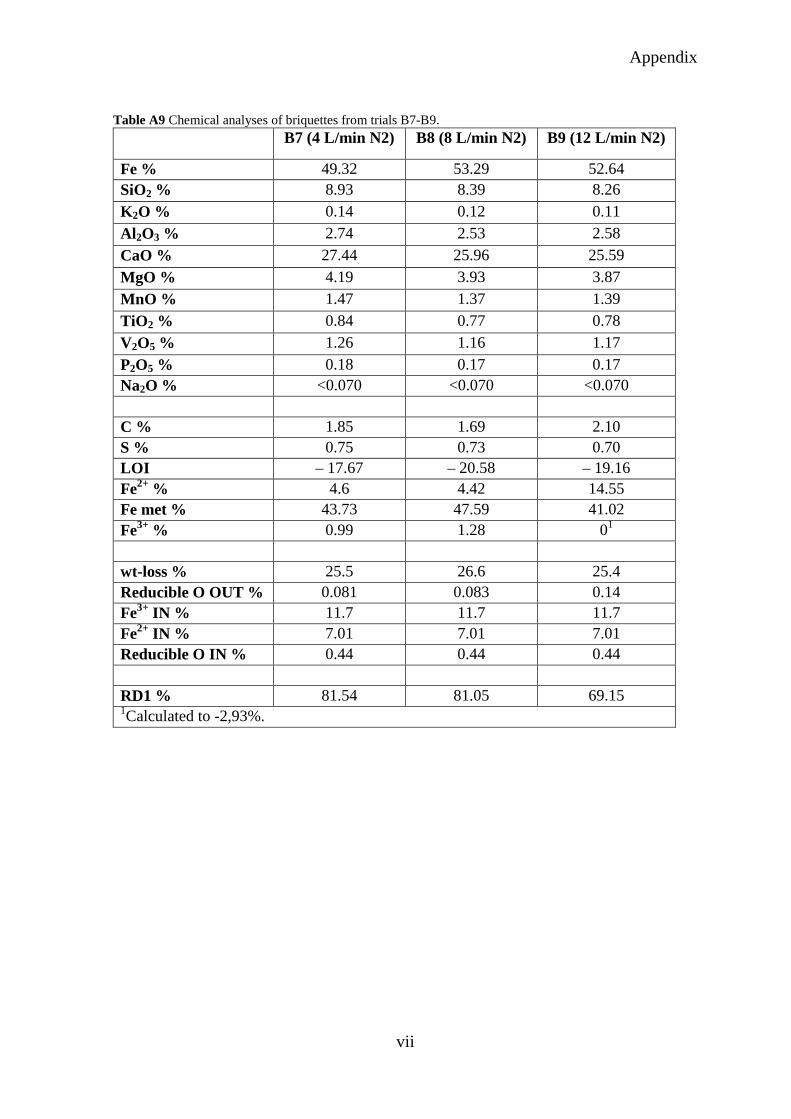
Appendix
vii
Table A9 Chemical analyses of briquettes from trials B7-B9. B7 (4 L/min N2) B8 (8 L/min N2) B9 (12 L/min N2)
Fe % 49.32 53.29 52.64 SiO2 % 8.93 8.39 8.26 K2O % 0.14 0.12 0.11 Al2O3 % 2.74 2.53 2.58 CaO % 27.44 25.96 25.59 MgO % 4.19 3.93 3.87 MnO % 1.47 1.37 1.39 TiO2 % 0.84 0.77 0.78 V2O5 % 1.26 1.16 1.17 P2O5 % 0.18 0.17 0.17 Na2O % <0.070 <0.070 <0.070 C % 1.85 1.69 2.10 S % 0.75 0.73 0.70 LOI – 17.67 – 20.58 – 19.16 Fe2+ % 4.6 4.42 14.55 Fe met % 43.73 47.59 41.02 Fe3+ % 0.99 1.28 01 wt-loss % 25.5 26.6 25.4 Reducible O OUT % 0.081 0.083 0.14 Fe3+ IN % 11.7 11.7 11.7 Fe2+ IN % 7.01 7.01 7.01 Reducible O IN % 0.44 0.44 0.44 RD1 % 81.54 81.05 69.15 1Calculated to -2,93%.
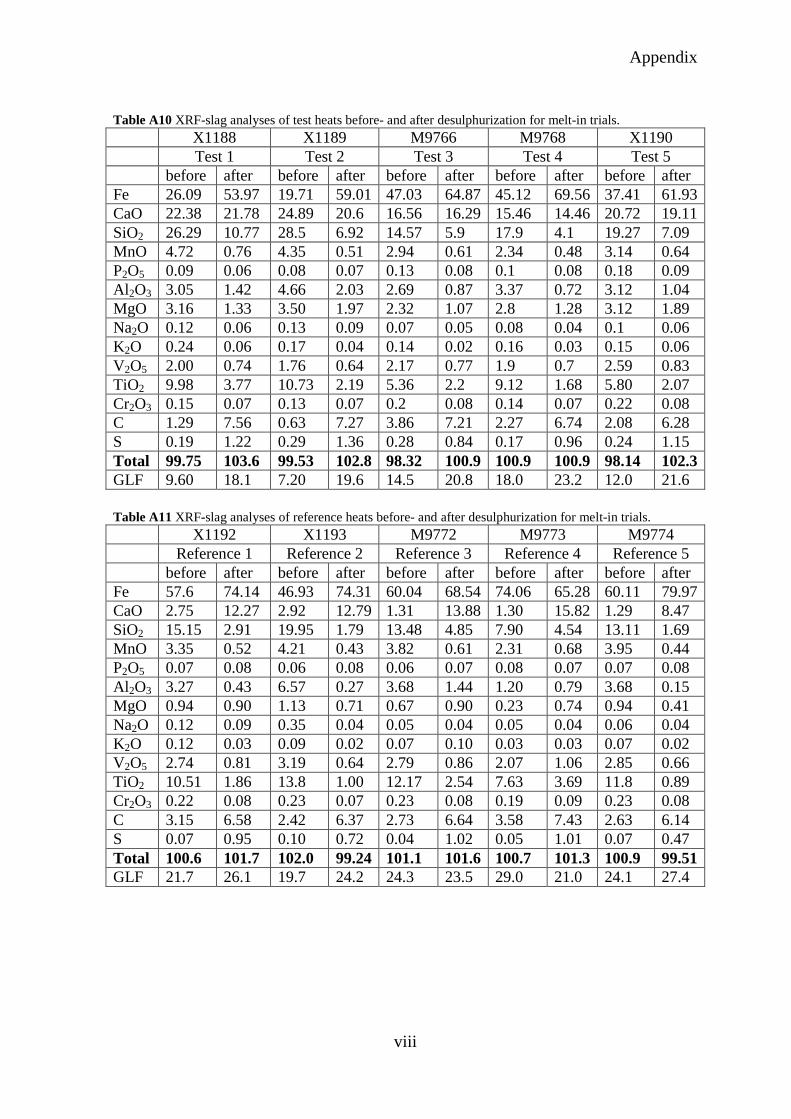
Appendix
viii
Table A10 XRF-slag analyses of test heats before- and after desulphurization for melt-in trials. X1188 X1189 M9766 M9768 X1190 Test 1 Test 2 Test 3 Test 4 Test 5 before after before after before after before after before after Fe 26.09 53.97 19.71 59.01 47.03 64.87 45.12 69.56 37.41 61.93 CaO 22.38 21.78 24.89 20.6 16.56 16.29 15.46 14.46 20.72 19.11 SiO2 26.29 10.77 28.5 6.92 14.57 5.9 17.9 4.1 19.27 7.09 MnO 4.72 0.76 4.35 0.51 2.94 0.61 2.34 0.48 3.14 0.64 P2O5 0.09 0.06 0.08 0.07 0.13 0.08 0.1 0.08 0.18 0.09 Al2O3 3.05 1.42 4.66 2.03 2.69 0.87 3.37 0.72 3.12 1.04 MgO 3.16 1.33 3.50 1.97 2.32 1.07 2.8 1.28 3.12 1.89 Na2O 0.12 0.06 0.13 0.09 0.07 0.05 0.08 0.04 0.1 0.06 K2O 0.24 0.06 0.17 0.04 0.14 0.02 0.16 0.03 0.15 0.06 V2O5 2.00 0.74 1.76 0.64 2.17 0.77 1.9 0.7 2.59 0.83 TiO2 9.98 3.77 10.73 2.19 5.36 2.2 9.12 1.68 5.80 2.07 Cr2O3 0.15 0.07 0.13 0.07 0.2 0.08 0.14 0.07 0.22 0.08 C 1.29 7.56 0.63 7.27 3.86 7.21 2.27 6.74 2.08 6.28 S 0.19 1.22 0.29 1.36 0.28 0.84 0.17 0.96 0.24 1.15 Total 99.75 103.6 99.53 102.8 98.32 100.9 100.9 100.9 98.14 102.3 GLF 9.60 18.1 7.20 19.6 14.5 20.8 18.0 23.2 12.0 21.6 Table A11 XRF-slag analyses of reference heats before- and after desulphurization for melt-in trials. X1192 X1193 M9772 M9773 M9774 Reference 1 Reference 2 Reference 3 Reference 4 Reference 5 before after before after before after before after before after Fe 57.6 74.14 46.93 74.31 60.04 68.54 74.06 65.28 60.11 79.97 CaO 2.75 12.27 2.92 12.79 1.31 13.88 1.30 15.82 1.29 8.47 SiO2 15.15 2.91 19.95 1.79 13.48 4.85 7.90 4.54 13.11 1.69 MnO 3.35 0.52 4.21 0.43 3.82 0.61 2.31 0.68 3.95 0.44 P2O5 0.07 0.08 0.06 0.08 0.06 0.07 0.08 0.07 0.07 0.08 Al2O3 3.27 0.43 6.57 0.27 3.68 1.44 1.20 0.79 3.68 0.15 MgO 0.94 0.90 1.13 0.71 0.67 0.90 0.23 0.74 0.94 0.41 Na2O 0.12 0.09 0.35 0.04 0.05 0.04 0.05 0.04 0.06 0.04 K2O 0.12 0.03 0.09 0.02 0.07 0.10 0.03 0.03 0.07 0.02 V2O5 2.74 0.81 3.19 0.64 2.79 0.86 2.07 1.06 2.85 0.66 TiO2 10.51 1.86 13.8 1.00 12.17 2.54 7.63 3.69 11.8 0.89 Cr2O3 0.22 0.08 0.23 0.07 0.23 0.08 0.19 0.09 0.23 0.08 C 3.15 6.58 2.42 6.37 2.73 6.64 3.58 7.43 2.63 6.14 S 0.07 0.95 0.10 0.72 0.04 1.02 0.05 1.01 0.07 0.47 Total 100.6 101.7 102.0 99.24 101.1 101.6 100.7 101.3 100.9 99.51 GLF 21.7 26.1 19.7 24.2 24.3 23.5 29.0 21.0 24.1 27.4
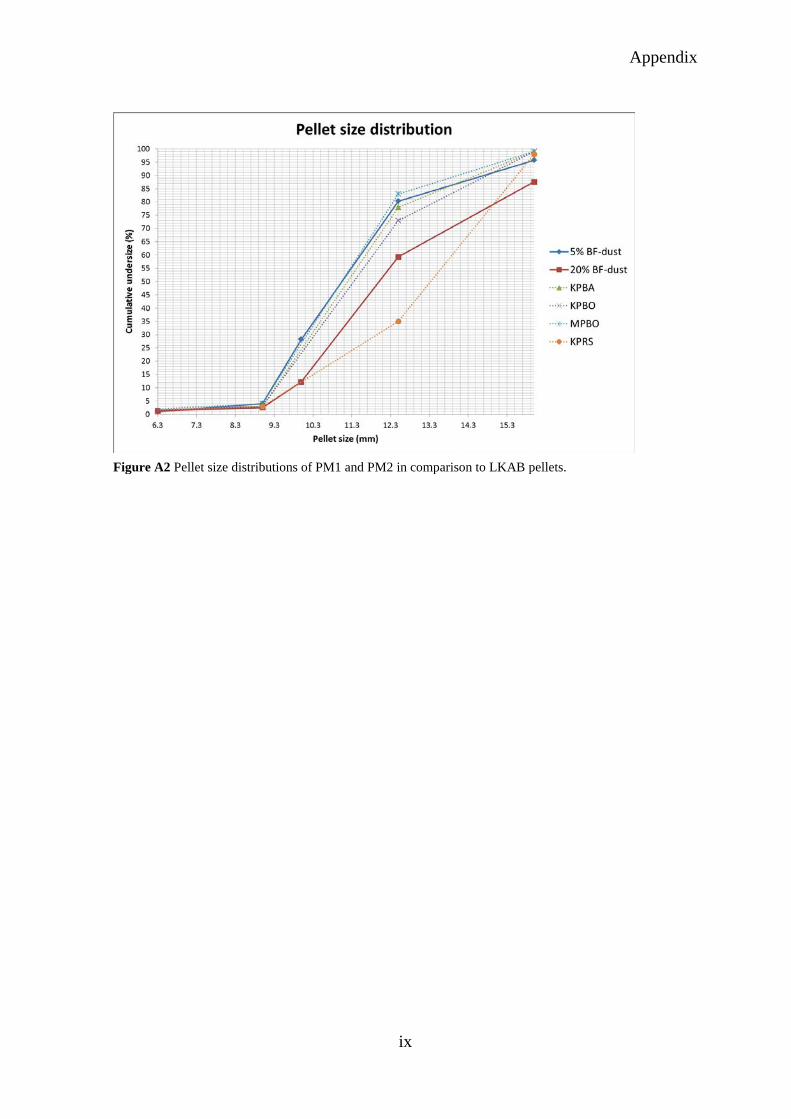
Appendix
ix
Figure A2 Pellet size distributions of PM1 and PM2 in comparison to LKAB pellets.
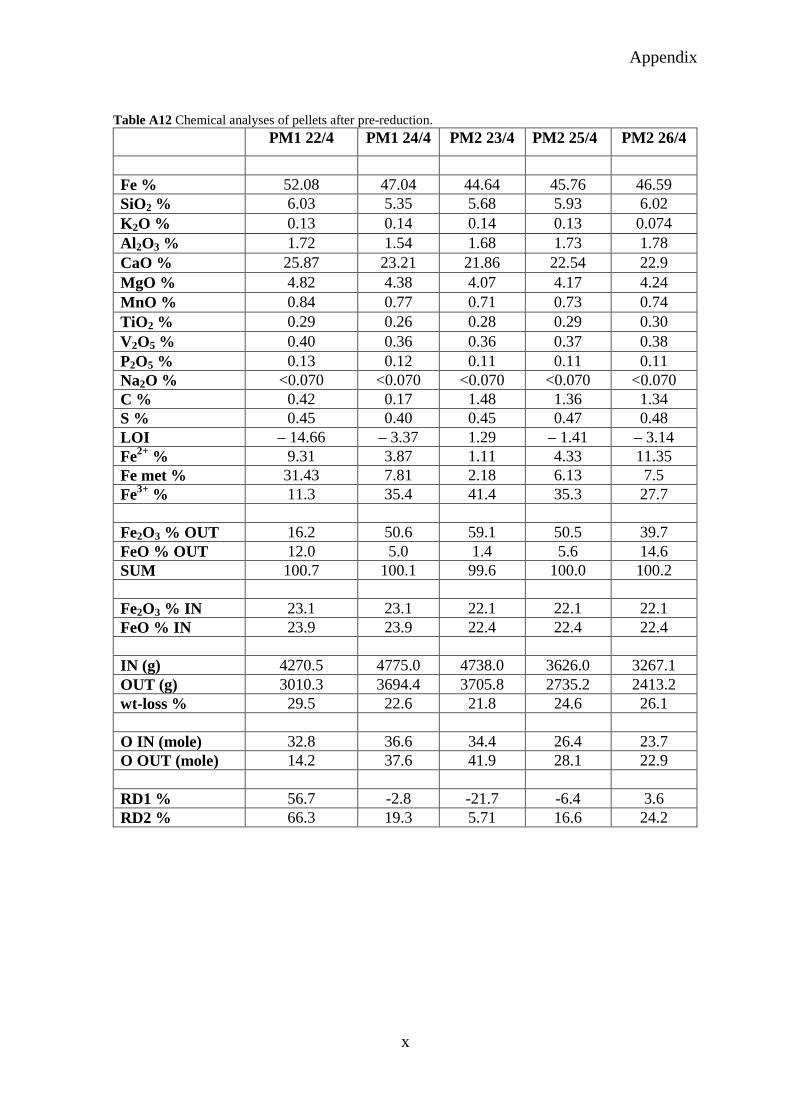
Appendix
x
Table A12 Chemical analyses of pellets after pre-reduction. PM1 22/4 PM1 24/4 PM2 23/4 PM2 25/4 PM2 26/4
Fe % 52.08 47.04 44.64 45.76 46.59 SiO2 % 6.03 5.35 5.68 5.93 6.02 K2O % 0.13 0.14 0.14 0.13 0.074 Al2O3 % 1.72 1.54 1.68 1.73 1.78 CaO % 25.87 23.21 21.86 22.54 22.9 MgO % 4.82 4.38 4.07 4.17 4.24 MnO % 0.84 0.77 0.71 0.73 0.74 TiO2 % 0.29 0.26 0.28 0.29 0.30 V2O5 % 0.40 0.36 0.36 0.37 0.38 P2O5 % 0.13 0.12 0.11 0.11 0.11 Na2O % <0.070 <0.070 <0.070 <0.070 <0.070 C % 0.42 0.17 1.48 1.36 1.34 S % 0.45 0.40 0.45 0.47 0.48 LOI – 14.66 – 3.37 1.29 – 1.41 – 3.14 Fe2+ % 9.31 3.87 1.11 4.33 11.35 Fe met % 31.43 7.81 2.18 6.13 7.5 Fe3+ % 11.3 35.4 41.4 35.3 27.7 Fe2O3 % OUT 16.2 50.6 59.1 50.5 39.7 FeO % OUT 12.0 5.0 1.4 5.6 14.6 SUM 100.7 100.1 99.6 100.0 100.2 Fe2O3 % IN 23.1 23.1 22.1 22.1 22.1 FeO % IN 23.9 23.9 22.4 22.4 22.4 IN (g) 4270.5 4775.0 4738.0 3626.0 3267.1 OUT (g) 3010.3 3694.4 3705.8 2735.2 2413.2 wt-loss % 29.5 22.6 21.8 24.6 26.1 O IN (mole) 32.8 36.6 34.4 26.4 23.7 O OUT (mole) 14.2 37.6 41.9 28.1 22.9 RD1 % 56.7 -2.8 -21.7 -6.4 3.6 RD2 % 66.3 19.3 5.71 16.6 24.2
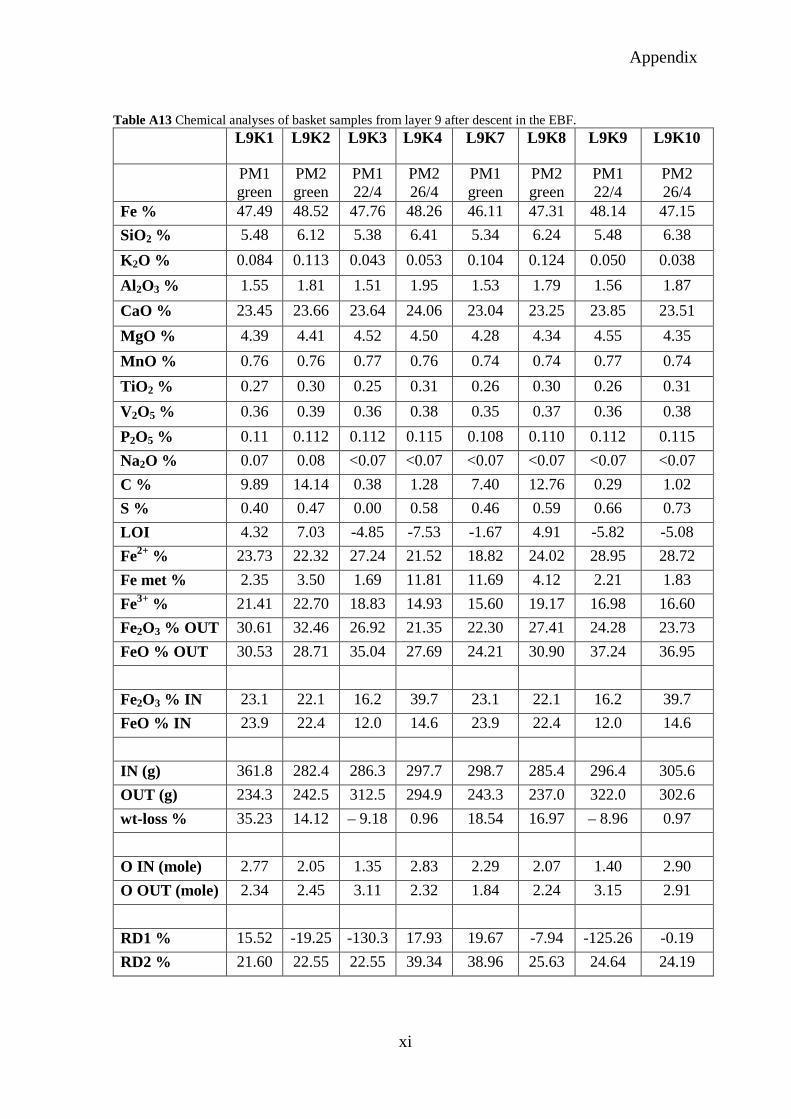
Appendix
xi
Table A13 Chemical analyses of basket samples from layer 9 after descent in the EBF. L9K1 L9K2 L9K3 L9K4 L9K7 L9K8 L9K9 L9K10
PM1 green
PM2 green
PM1 22/4
PM2 26/4
PM1 green
PM2 green
PM1 22/4
PM2 26/4
Fe % 47.49 48.52 47.76 48.26 46.11 47.31 48.14 47.15 SiO2 % 5.48 6.12 5.38 6.41 5.34 6.24 5.48 6.38 K2O % 0.084 0.113 0.043 0.053 0.104 0.124 0.050 0.038 Al2O3 % 1.55 1.81 1.51 1.95 1.53 1.79 1.56 1.87 CaO % 23.45 23.66 23.64 24.06 23.04 23.25 23.85 23.51 MgO % 4.39 4.41 4.52 4.50 4.28 4.34 4.55 4.35 MnO % 0.76 0.76 0.77 0.76 0.74 0.74 0.77 0.74 TiO2 % 0.27 0.30 0.25 0.31 0.26 0.30 0.26 0.31 V2O5 % 0.36 0.39 0.36 0.38 0.35 0.37 0.36 0.38 P2O5 % 0.11 0.112 0.112 0.115 0.108 0.110 0.112 0.115 Na2O % 0.07 0.08 <0.07 <0.07 <0.07 <0.07 <0.07 <0.07 C % 9.89 14.14 0.38 1.28 7.40 12.76 0.29 1.02 S % 0.40 0.47 0.00 0.58 0.46 0.59 0.66 0.73 LOI 4.32 7.03 -4.85 -7.53 -1.67 4.91 -5.82 -5.08 Fe2+ % 23.73 22.32 27.24 21.52 18.82 24.02 28.95 28.72 Fe met % 2.35 3.50 1.69 11.81 11.69 4.12 2.21 1.83 Fe3+ % 21.41 22.70 18.83 14.93 15.60 19.17 16.98 16.60 Fe2O3 % OUT 30.61 32.46 26.92 21.35 22.30 27.41 24.28 23.73 FeO % OUT 30.53 28.71 35.04 27.69 24.21 30.90 37.24 36.95 Fe2O3 % IN 23.1 22.1 16.2 39.7 23.1 22.1 16.2 39.7 FeO % IN 23.9 22.4 12.0 14.6 23.9 22.4 12.0 14.6 IN (g) 361.8 282.4 286.3 297.7 298.7 285.4 296.4 305.6 OUT (g) 234.3 242.5 312.5 294.9 243.3 237.0 322.0 302.6 wt-loss % 35.23 14.12 – 9.18 0.96 18.54 16.97 – 8.96 0.97 O IN (mole) 2.77 2.05 1.35 2.83 2.29 2.07 1.40 2.90 O OUT (mole) 2.34 2.45 3.11 2.32 1.84 2.24 3.15 2.91 RD1 % 15.52 -19.25 -130.3 17.93 19.67 -7.94 -125.26 -0.19 RD2 % 21.60 22.55 22.55 39.34 38.96 25.63 24.64 24.19
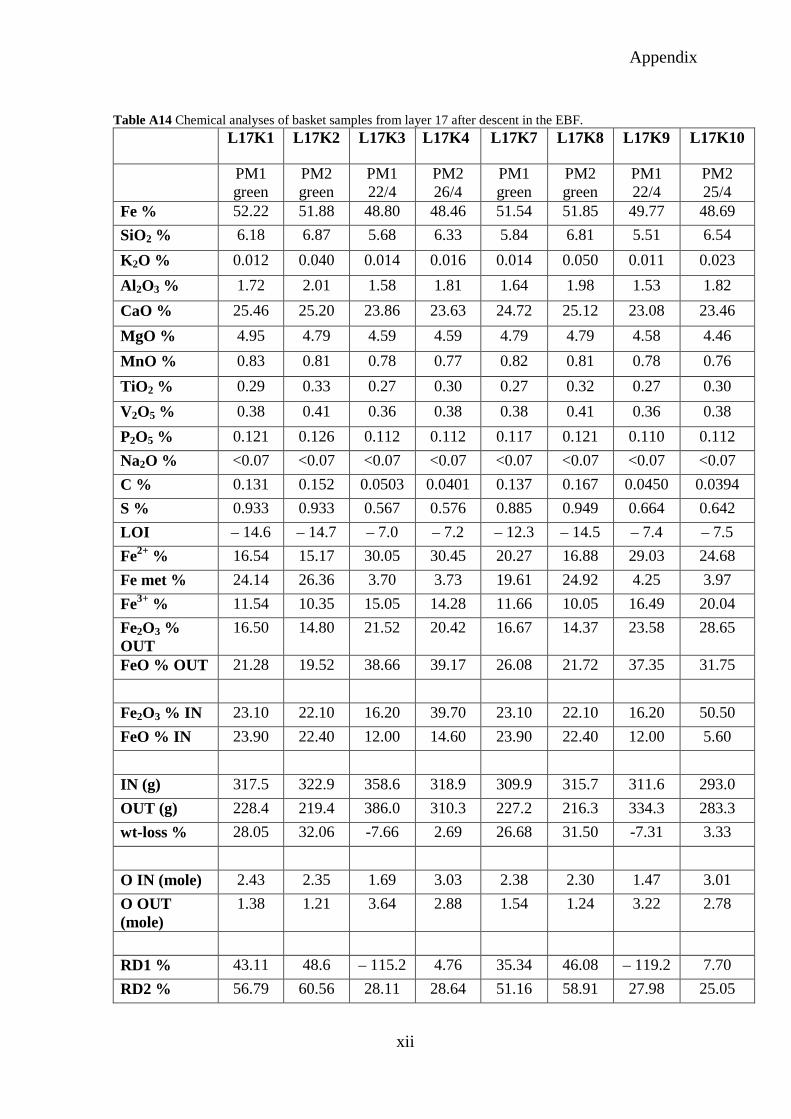
Appendix
xii
Table A14 Chemical analyses of basket samples from layer 17 after descent in the EBF. L17K1 L17K2 L17K3 L17K4 L17K7 L17K8 L17K9 L17K10
PM1 green
PM2 green
PM1 22/4
PM2 26/4
PM1 green
PM2 green
PM1 22/4
PM2 25/4
Fe % 52.22 51.88 48.80 48.46 51.54 51.85 49.77 48.69 SiO2 % 6.18 6.87 5.68 6.33 5.84 6.81 5.51 6.54 K2O % 0.012 0.040 0.014 0.016 0.014 0.050 0.011 0.023 Al2O3 % 1.72 2.01 1.58 1.81 1.64 1.98 1.53 1.82 CaO % 25.46 25.20 23.86 23.63 24.72 25.12 23.08 23.46 MgO % 4.95 4.79 4.59 4.59 4.79 4.79 4.58 4.46 MnO % 0.83 0.81 0.78 0.77 0.82 0.81 0.78 0.76 TiO2 % 0.29 0.33 0.27 0.30 0.27 0.32 0.27 0.30 V2O5 % 0.38 0.41 0.36 0.38 0.38 0.41 0.36 0.38 P2O5 % 0.121 0.126 0.112 0.112 0.117 0.121 0.110 0.112 Na2O % <0.07 <0.07 <0.07 <0.07 <0.07 <0.07 <0.07 <0.07 C % 0.131 0.152 0.0503 0.0401 0.137 0.167 0.0450 0.0394 S % 0.933 0.933 0.567 0.576 0.885 0.949 0.664 0.642 LOI – 14.6 – 14.7 – 7.0 – 7.2 – 12.3 – 14.5 – 7.4 – 7.5 Fe2+ % 16.54 15.17 30.05 30.45 20.27 16.88 29.03 24.68 Fe met % 24.14 26.36 3.70 3.73 19.61 24.92 4.25 3.97 Fe3+ % 11.54 10.35 15.05 14.28 11.66 10.05 16.49 20.04 Fe2O3 % OUT
16.50 14.80 21.52 20.42 16.67 14.37 23.58 28.65
FeO % OUT 21.28 19.52 38.66 39.17 26.08 21.72 37.35 31.75 Fe2O3 % IN 23.10 22.10 16.20 39.70 23.10 22.10 16.20 50.50 FeO % IN 23.90 22.40 12.00 14.60 23.90 22.40 12.00 5.60 IN (g) 317.5 322.9 358.6 318.9 309.9 315.7 311.6 293.0 OUT (g) 228.4 219.4 386.0 310.3 227.2 216.3 334.3 283.3 wt-loss % 28.05 32.06 -7.66 2.69 26.68 31.50 -7.31 3.33 O IN (mole) 2.43 2.35 1.69 3.03 2.38 2.30 1.47 3.01 O OUT (mole)
1.38 1.21 3.64 2.88 1.54 1.24 3.22 2.78
RD1 % 43.11 48.6 – 115.2 4.76 35.34 46.08 – 119.2 7.70 RD2 % 56.79 60.56 28.11 28.64 51.16 58.91 27.98 25.05
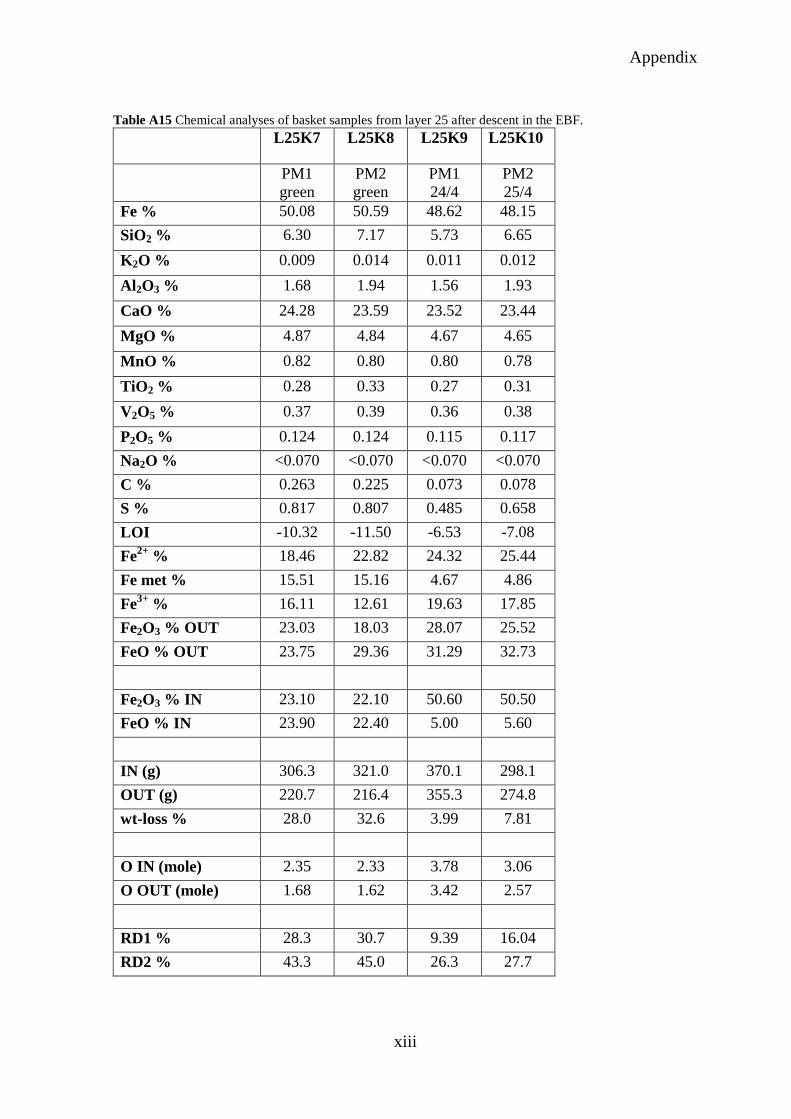
Appendix
xiii
Table A15 Chemical analyses of basket samples from layer 25 after descent in the EBF. L25K7 L25K8 L25K9 L25K10
PM1 green
PM2 green
PM1 24/4
PM2 25/4
Fe % 50.08 50.59 48.62 48.15 SiO2 % 6.30 7.17 5.73 6.65 K2O % 0.009 0.014 0.011 0.012 Al2O3 % 1.68 1.94 1.56 1.93 CaO % 24.28 23.59 23.52 23.44 MgO % 4.87 4.84 4.67 4.65 MnO % 0.82 0.80 0.80 0.78 TiO2 % 0.28 0.33 0.27 0.31 V2O5 % 0.37 0.39 0.36 0.38 P2O5 % 0.124 0.124 0.115 0.117 Na2O % <0.070 <0.070 <0.070 <0.070 C % 0.263 0.225 0.073 0.078 S % 0.817 0.807 0.485 0.658 LOI -10.32 -11.50 -6.53 -7.08 Fe2+ % 18.46 22.82 24.32 25.44 Fe met % 15.51 15.16 4.67 4.86 Fe3+ % 16.11 12.61 19.63 17.85 Fe2O3 % OUT 23.03 18.03 28.07 25.52 FeO % OUT 23.75 29.36 31.29 32.73 Fe2O3 % IN 23.10 22.10 50.60 50.50 FeO % IN 23.90 22.40 5.00 5.60 IN (g) 306.3 321.0 370.1 298.1 OUT (g) 220.7 216.4 355.3 274.8 wt-loss % 28.0 32.6 3.99 7.81 O IN (mole) 2.35 2.33 3.78 3.06 O OUT (mole) 1.68 1.62 3.42 2.57 RD1 % 28.3 30.7 9.39 16.04 RD2 % 43.3 45.0 26.3 27.7
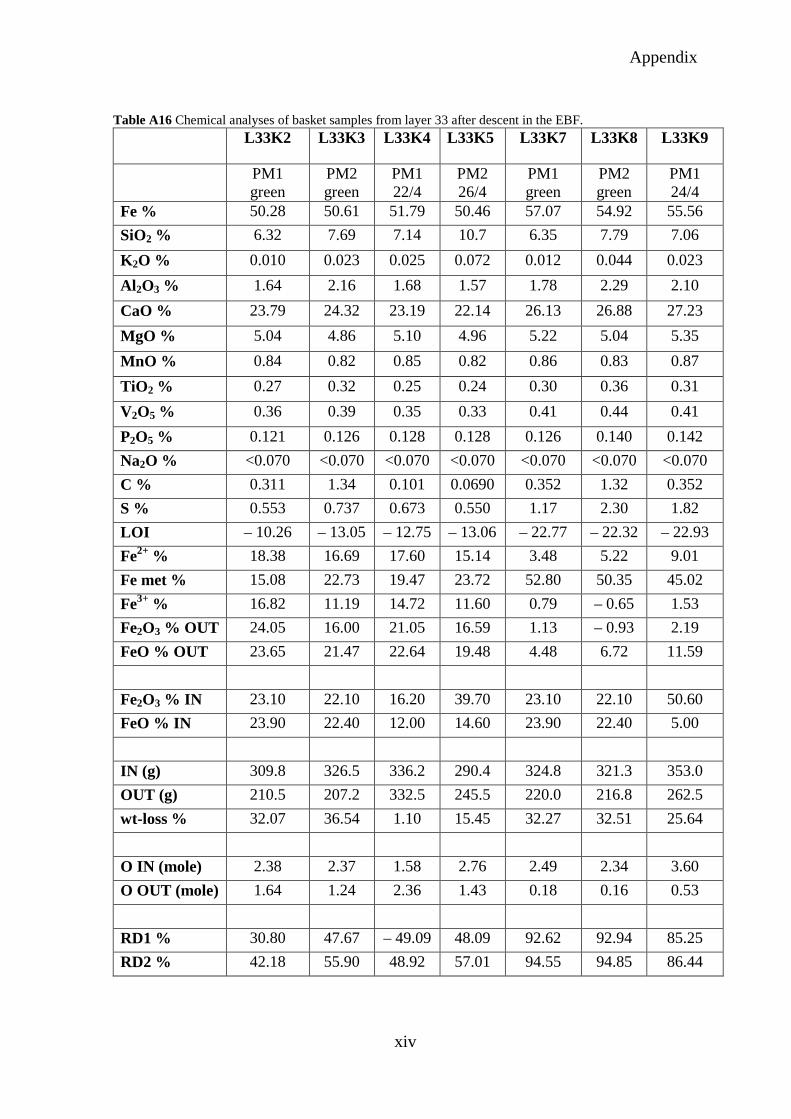
Appendix
xiv
Table A16 Chemical analyses of basket samples from layer 33 after descent in the EBF. L33K2 L33K3 L33K4 L33K5 L33K7 L33K8 L33K9
PM1 green
PM2 green
PM1 22/4
PM2 26/4
PM1 green
PM2 green
PM1 24/4
Fe % 50.28 50.61 51.79 50.46 57.07 54.92 55.56 SiO2 % 6.32 7.69 7.14 10.7 6.35 7.79 7.06 K2O % 0.010 0.023 0.025 0.072 0.012 0.044 0.023 Al2O3 % 1.64 2.16 1.68 1.57 1.78 2.29 2.10 CaO % 23.79 24.32 23.19 22.14 26.13 26.88 27.23 MgO % 5.04 4.86 5.10 4.96 5.22 5.04 5.35 MnO % 0.84 0.82 0.85 0.82 0.86 0.83 0.87 TiO2 % 0.27 0.32 0.25 0.24 0.30 0.36 0.31 V2O5 % 0.36 0.39 0.35 0.33 0.41 0.44 0.41 P2O5 % 0.121 0.126 0.128 0.128 0.126 0.140 0.142 Na2O % <0.070 <0.070 <0.070 <0.070 <0.070 <0.070 <0.070 C % 0.311 1.34 0.101 0.0690 0.352 1.32 0.352 S % 0.553 0.737 0.673 0.550 1.17 2.30 1.82 LOI – 10.26 – 13.05 – 12.75 – 13.06 – 22.77 – 22.32 – 22.93 Fe2+ % 18.38 16.69 17.60 15.14 3.48 5.22 9.01 Fe met % 15.08 22.73 19.47 23.72 52.80 50.35 45.02 Fe3+ % 16.82 11.19 14.72 11.60 0.79 – 0.65 1.53 Fe2O3 % OUT 24.05 16.00 21.05 16.59 1.13 – 0.93 2.19 FeO % OUT 23.65 21.47 22.64 19.48 4.48 6.72 11.59 Fe2O3 % IN 23.10 22.10 16.20 39.70 23.10 22.10 50.60 FeO % IN 23.90 22.40 12.00 14.60 23.90 22.40 5.00 IN (g) 309.8 326.5 336.2 290.4 324.8 321.3 353.0 OUT (g) 210.5 207.2 332.5 245.5 220.0 216.8 262.5 wt-loss % 32.07 36.54 1.10 15.45 32.27 32.51 25.64 O IN (mole) 2.38 2.37 1.58 2.76 2.49 2.34 3.60 O OUT (mole) 1.64 1.24 2.36 1.43 0.18 0.16 0.53 RD1 % 30.80 47.67 – 49.09 48.09 92.62 92.94 85.25 RD2 % 42.18 55.90 48.92 57.01 94.55 94.85 86.44
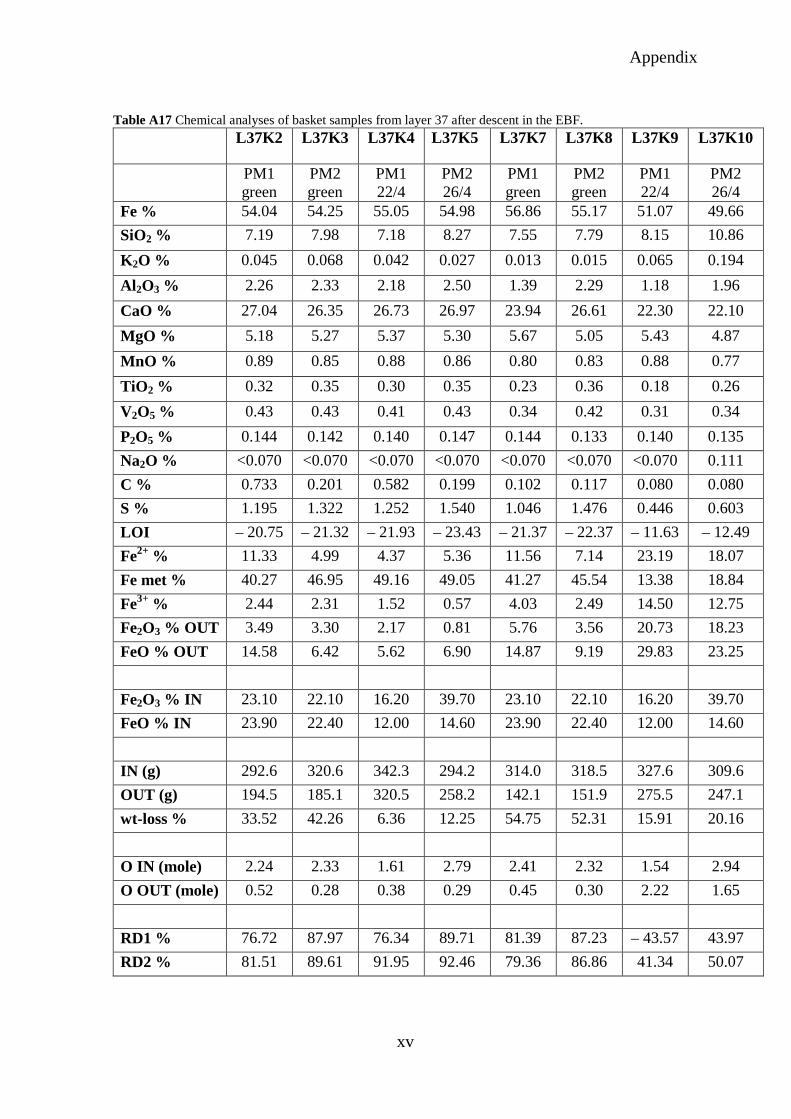
Appendix
xv
Table A17 Chemical analyses of basket samples from layer 37 after descent in the EBF. L37K2 L37K3 L37K4 L37K5 L37K7 L37K8 L37K9 L37K10
PM1 green
PM2 green
PM1 22/4
PM2 26/4
PM1 green
PM2 green
PM1 22/4
PM2 26/4
Fe % 54.04 54.25 55.05 54.98 56.86 55.17 51.07 49.66 SiO2 % 7.19 7.98 7.18 8.27 7.55 7.79 8.15 10.86 K2O % 0.045 0.068 0.042 0.027 0.013 0.015 0.065 0.194 Al2O3 % 2.26 2.33 2.18 2.50 1.39 2.29 1.18 1.96 CaO % 27.04 26.35 26.73 26.97 23.94 26.61 22.30 22.10 MgO % 5.18 5.27 5.37 5.30 5.67 5.05 5.43 4.87 MnO % 0.89 0.85 0.88 0.86 0.80 0.83 0.88 0.77 TiO2 % 0.32 0.35 0.30 0.35 0.23 0.36 0.18 0.26 V2O5 % 0.43 0.43 0.41 0.43 0.34 0.42 0.31 0.34 P2O5 % 0.144 0.142 0.140 0.147 0.144 0.133 0.140 0.135 Na2O % <0.070 <0.070 <0.070 <0.070 <0.070 <0.070 <0.070 0.111 C % 0.733 0.201 0.582 0.199 0.102 0.117 0.080 0.080 S % 1.195 1.322 1.252 1.540 1.046 1.476 0.446 0.603 LOI – 20.75 – 21.32 – 21.93 – 23.43 – 21.37 – 22.37 – 11.63 – 12.49 Fe2+ % 11.33 4.99 4.37 5.36 11.56 7.14 23.19 18.07 Fe met % 40.27 46.95 49.16 49.05 41.27 45.54 13.38 18.84 Fe3+ % 2.44 2.31 1.52 0.57 4.03 2.49 14.50 12.75 Fe2O3 % OUT 3.49 3.30 2.17 0.81 5.76 3.56 20.73 18.23 FeO % OUT 14.58 6.42 5.62 6.90 14.87 9.19 29.83 23.25 Fe2O3 % IN 23.10 22.10 16.20 39.70 23.10 22.10 16.20 39.70 FeO % IN 23.90 22.40 12.00 14.60 23.90 22.40 12.00 14.60 IN (g) 292.6 320.6 342.3 294.2 314.0 318.5 327.6 309.6 OUT (g) 194.5 185.1 320.5 258.2 142.1 151.9 275.5 247.1 wt-loss % 33.52 42.26 6.36 12.25 54.75 52.31 15.91 20.16 O IN (mole) 2.24 2.33 1.61 2.79 2.41 2.32 1.54 2.94 O OUT (mole) 0.52 0.28 0.38 0.29 0.45 0.30 2.22 1.65 RD1 % 76.72 87.97 76.34 89.71 81.39 87.23 – 43.57 43.97 RD2 % 81.51 89.61 91.95 92.46 79.36 86.86 41.34 50.07


DEN SVENSKA STÅLINDUSTRINS BRANSCHORGANISATION
Organisationen grundades 1747 och ägs sedan dess av de svenska stålföretagen. Jernkontoret företräder stålindustrin i frågor som berör handelspolitik, forskning och utbildning, standardisering, energi och miljö samt skatter och avgifter. Jernkontoret leder den gemensamma nordiska stålforskningen. Dessutom utarbetar Jernkontoret branschstatistik och bedriver bergshistorisk forskning.