Embed Size (px)
Citation preview
PROJECT DESIGN DOCUMENT FORM (CDM PDD) - Version 02
CDM – Executive Board page 1
This template shall not be altered. It shall be completed without modifying/adding headings or logo, format or font.
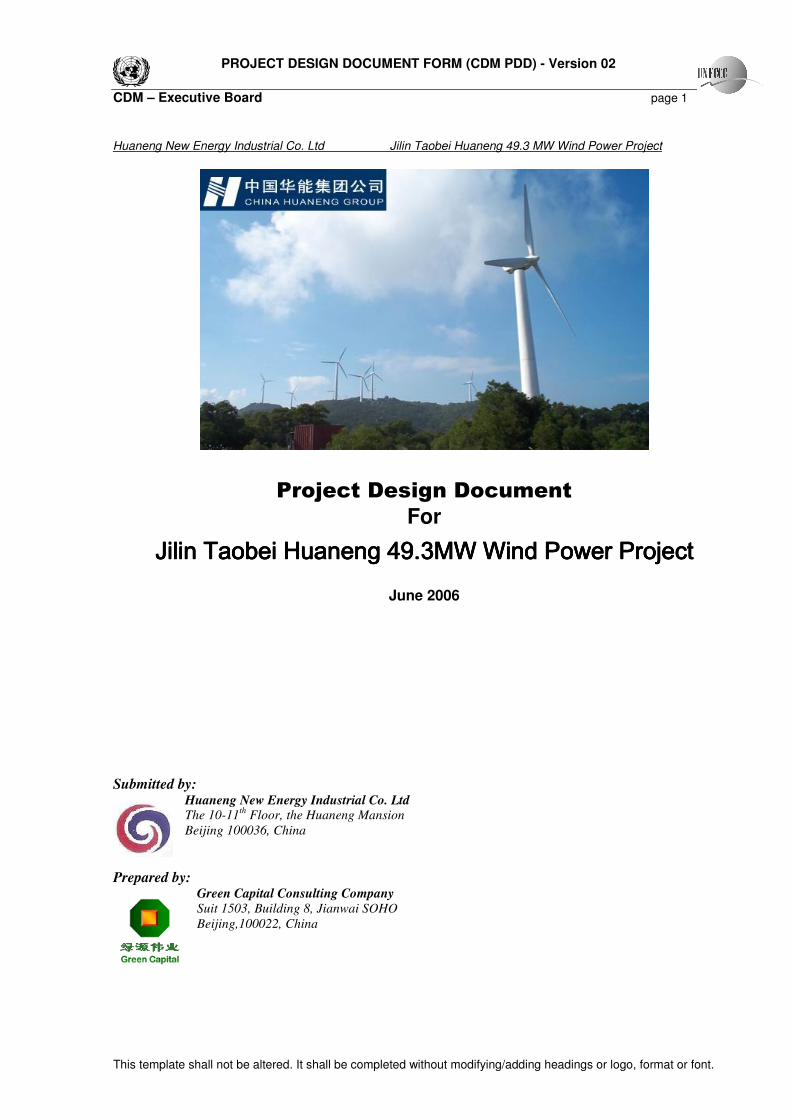
Huaneng New Energy Industrial Co. Ltd Jilin Taobei Huaneng 49.3 MW Wind Power Project
Project Design Document
For
Jilin Jilin Jilin Jilin TaobeiTaobeiTaobeiTaobei Huaneng Huaneng Huaneng Huaneng 44449999.3.3.3.3MW Wind Power ProjectMW Wind Power ProjectMW Wind Power ProjectMW Wind Power Project
June 2006
Submitted by: Huaneng New Energy Industrial Co. Ltd The 10-11
th Floor, the Huaneng Mansion
Beijing 100036, China
Prepared by: Green Capital Consulting Company Suit 1503, Building 8, Jianwai SOHO
Beijing,100022, China

PROJECT DESIGN DOCUMENT FORM (CDM PDD) - Version 02
CDM – Executive Board page 2
This template shall not be altered. It shall be completed without modifying/adding headings or logo, format or font.
CLEAN DEVELOPMENT MECHANISM PROJECT DESIGN DOCUMENT FORM (CDM-PDD)
Version 02 – (in effect as of: 1 July 2004) 1
CONTENTS
A. General description of project activity B. Application of a baseline methodology C. Duration of the project activity / Crediting period D. Application of a monitoring methodology and plan E. Estimation of GHG emissions by sources F. Environmental impacts G. Stakeholders’ comments
Annexes Annex 1: Contact information on participants in the project activity Annex 2: Information regarding public funding Annex 3: Baseline information
Annex 4: Monitoring plan
1 The PDD form is revised according to EB 19 Report Annex 14: REVISED GUIDELINES FOR COMPLETING THE FORMS: CDM-PDD, CDM-NMB AND CDM-NMM, 13 May, 2005.
PROJECT DESIGN DOCUMENT FORM (CDM PDD) - Version 02
CDM – Executive Board page 3
This template shall not be altered. It shall be completed without modifying/adding headings or logo, format or font.
SECTION A. General description of project activity
A.1 Title of the project activity: >> Jilin Taobei Huaneng 49.3MW Wind Power Project Version number of the document: revised-01 Date: Jun, 22th 2006
A.2. Description of the project activity: >> The objective of Jilin Taobei Huaneng 49.3MW Wind Power Project (hereafter refered to as the Project), a grid-connected renewable project, is to utilize the wind power for generating electricity which will be sold into the Jilin Power Grid, an integral central part of the Northeast China Grid. The Project activity will achieve greenhouse gas (GHG) emission reductions by avoiding CO2 emissions from the business-as-usual scenario electricity generation of those fossil fuel-fired power plants connected into the Northeast China Grid. The Project is sited within the Qinshan Grass Farm of Taobei District, Baicheng City of Jilin Province. The Qinshan Grass Farm is a board and smooth grassland with abundant wind resources. According to the anemometry data collected during the past years, the average wind speed at the 40 m and 48 m height is about 6.18 m/s and 6.60 m/s respectively. Moreover, the prevailing wind direction and main wind energy direction are both from the north, which provides the favourable conditions for the arrangement of the turbines. The Project involves the installation of 58 sets of turbines, each of which has a capacity of 850 kW, providing a total installed capacity of 49.3 MW. It is estimated that the feed-in electricity to the Northeast China Grid from the 58 sets of turbines of the Project is 92.4886 GWh per year. The Project clearly fits into the development priority of China, and will support China in stimulating and accelerating the commercialization of grid-connected renewable energy technologies and the green-power market development. It will therefore help reduce GHG emissions resulting from the high-growth, coal-dominated business-as-usual scenario. Being an environment sound project, the Project will also play a complementary role in supplying the electricity to the Northeast China Grid. Moreover, given the fact that turbines are often perceived as aesthetic in China, the site of the Project is expected to become a local attraction so as to promote the development of local tourism industry. Moreover, the proposed project will demonstrate the contribution of large grid connected wind power projects as alternative sustainable energy future in improving energy security, air quality, local livelihoods and the overall sustainable development of the renewable energy industry in China. The Project will not only supply renewable electricity to the grid, but also contribute to sustainable development of the local community, host country and the world by means of: � reducing greenhouse gas emissions compared to business-as-usual scenario; � helping to stimulate the growth of the wind power industry in China; � reducing the emission of other pollutants resulting from the power generation industry in China,
compared to business-as-usual scenario; � creating local employment opportunities during the project construction and operation period; � promoting the local tourism industry so as to improve the overall industrial development structure; and
PROJECT DESIGN DOCUMENT FORM (CDM PDD) - Version 02
CDM – Executive Board page 4
This template shall not be altered. It shall be completed without modifying/adding headings or logo, format or font.
� supporting the overall sustainable economic development in the region.
A.3. Project participants: >> Participants to the project activity are the following:
Please list project participants and Party(ies) involved and provide contact information in Annex 1. Information shall be in indicated using the following tabular format.
Name of Party involved (*) ((host) indicates a host Party)
Private and/or public entity(ies) project participants (*)
(as applicable)
Kindly indicate if the Party involved
wishes to be considered as
project participant (Yes/No)
P.R.China
(host country)
Huaneng New Energy Industrial Co.
Ltd. (project owner) No
Spain Endesa, S.A. No
(*) In accordance with the CDM modalities and procedures, at the time of making the CDM-PDD public at the stage of validation, a Party involved may or may not have provided its approval. At the time of requesting registration, the approval by the Party(ies) involved is required. Note: When the PDD is filled in support of a proposed new methodology (forms CDM-NBM and CDM-NMM), at
least the host Party(ies) and any known project participant (e.g. those proposing a new methodology) shall be
identified.
The following are the main Project Participants: Project Owner: Huaneng New Energy Industrial Co. Ltd. (HNEIC), a subsidiary company solely owned by China Huaneng Group. Registered in Nov 2002 with a total registered capital of 80 million RMB (US$9.67million), HNEIC has involved in the business areas of new energy project development, investment and operation, and aimed to be a successful state-owned enterprise specializing in wind power, small-scale hydro and solar project development. The main business activities of HNEIC include: new energy project development and investment, OEM, engineering construction and operation for various types of new energy projects including hydro, wind power, LFG power, solar and etc; it also provides services in the areas of sales and marketing of the engineering construction equipment, as well as the related technology development, transference, training and maintenance. HNEIC believes that the company should supply “green power” to the market, and assumes responsibility in protecting the environment. It has made a full commitment to the sustainable development for the society at large. Translating its commitment into action, HNEIC has developed a large number of renewable energy projects, thus reducing significant amount of GHG emissions in the market of China. Host Country: The host country is the People’s Republic of China and its Designated National Authority is the National Development and Reform Commission (NDRC). The government of the People’s Republic of China announced its ratification of the Kyoto Protocol in August 2002. Purchasing Party: Endesa, S.A. As one of the world’s largest electric utilities and the only Spanish electricity multinational, Endesa carries out electricity generation, transmission, distribution and supply activities, directly or through its subsidiaries, in Spain, Portugal, Italy, France, Chile, Argentina, Peru, Colombia, Brazil, the Dominican Republic, Morocco, Poland and Turkey.
PROJECT DESIGN DOCUMENT FORM (CDM PDD) - Version 02
CDM – Executive Board page 5
This template shall not be altered. It shall be completed without modifying/adding headings or logo, format or font.
It is the leader in the Spanish electricity market, the largest private electricity multinational in Latin America, the largest electricity company in Chile, Argentina, Peru and Colombia, and one of the best positioned electricity companies in Southern Europe. Endesa has an installed capacity of 46,364 MW and 48 billion Euros in total assets. In 2004, it produced 184,951 GWh and supplied 192,519 GWh to 22 million customers. Other parties involved in the Project but who are not Project Participants include: Project Developer: Green Capital Consulting Company, a China-registered legal entity specializing in providing solutions for green project development, financing and implementation in the China. More detailed contact information on the Participants and other Parties are provided in Annex 1.
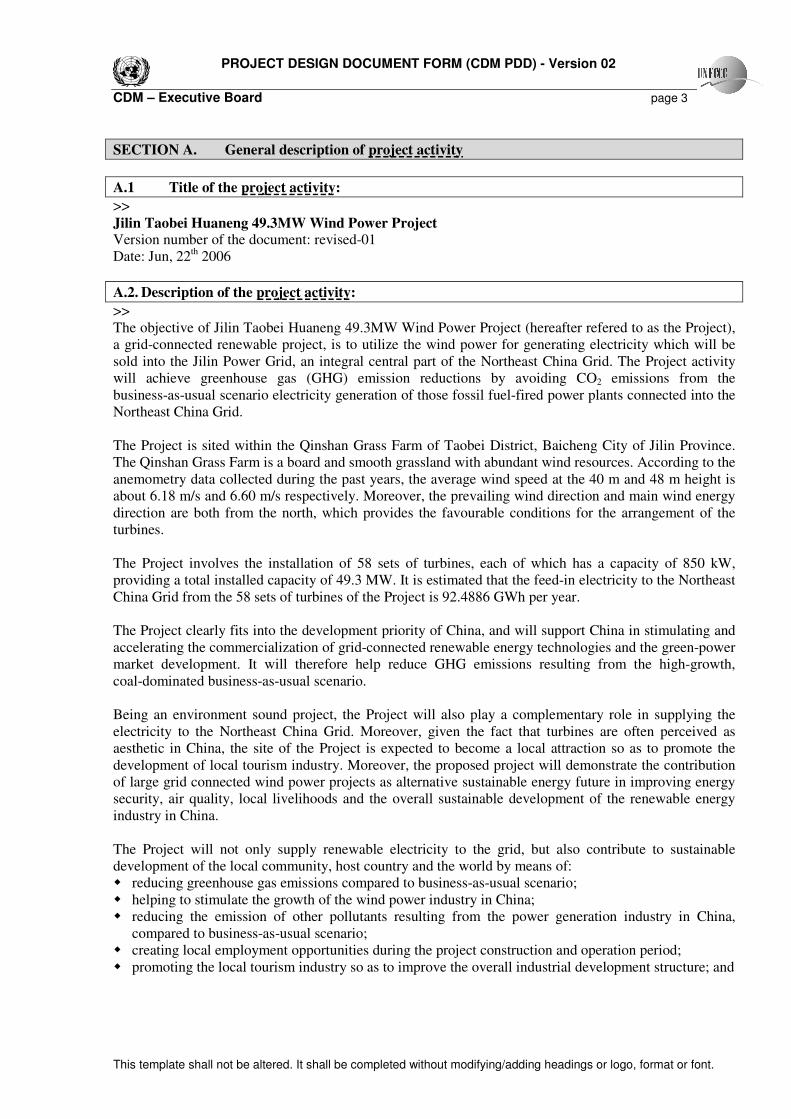
A.4. Technical description of the project activity: A.4.1. Location of the project activity: >> The Project is sited within Qinshan Grass Farm of Taobei District, Baicheng City in Jilin Province of Northeast China. Being in the northwest of Jilin Province, the Baicheng City is sited in the west of the Nenjiang Flatland and in the east of the Knorchin Prairie. The Project has geographical coordinates with east longitude of 122º51' ~122°54′ and north latitude of 45º48'~45°51′. Figure 1 shows the location of Baicheng City.
Figure 1. Map showing the location of Baicheng City
Capital City Changchun
Helongjiang Province
City of Baicheng
HelongjiangProvince
Jilin
Province
Liaoning
Province
Beijing
Jilin
Province
Northeast China Power
Grid
Inner Mongolia
Capital City Changchun
Helongjiang Province
City of Baicheng
HelongjiangProvince
Jilin
Province
Liaoning
Province
Beijing
Jilin
Province
Northeast China Power
Grid
Inner Mongolia
PROJECT DESIGN DOCUMENT FORM (CDM PDD) - Version 02
CDM – Executive Board page 6
This template shall not be altered. It shall be completed without modifying/adding headings or logo, format or font.
A.4.1.1. Host Party(ies):
>> The Host Country is the People’s Republic of China.
A.4.1.2. Region/State/Province etc.:
>> Jilin Province
A.4.1.3. City/Town/Community etc: >> Taobei District, Baicheng City
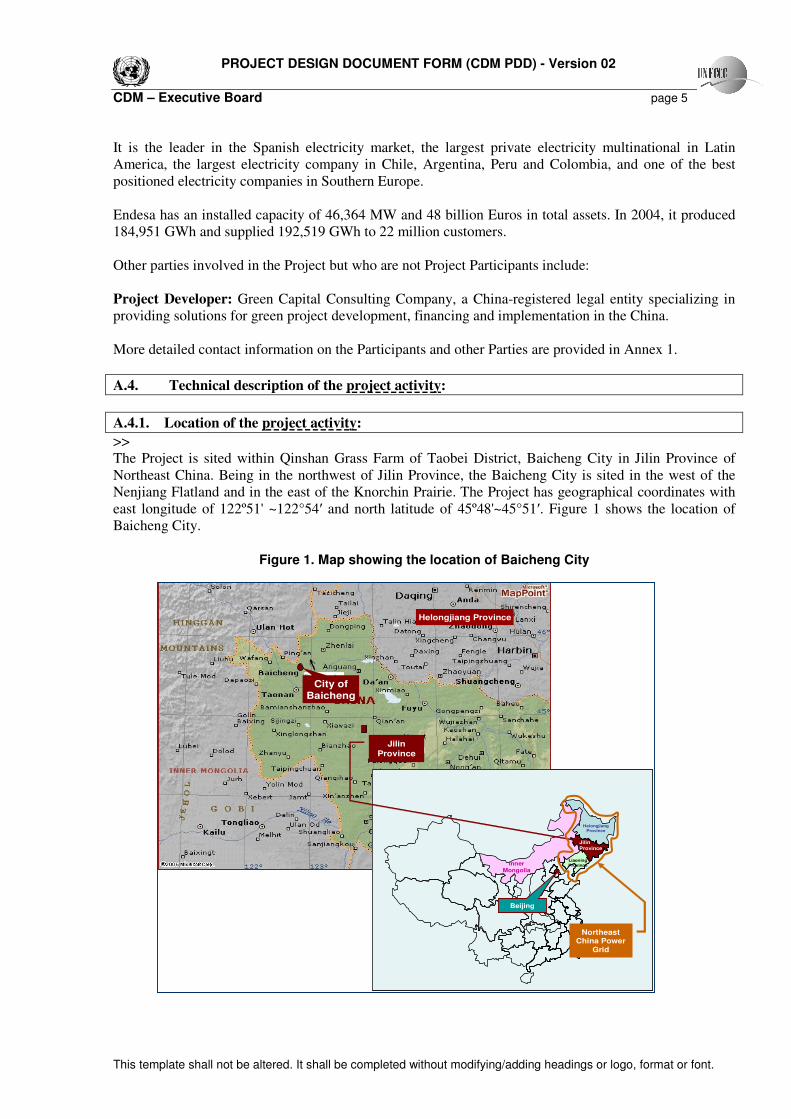
A.4.1.4. Detail of physical location, including information allowing the unique identification of this project activity (maximum one page): >> The Project is sited within Qinshan Grass Farm of Qinshan Town, Taobei District, Baicheng City. With a total area about 100 km2 of board and smooth degenerated grass land, the Qinshan Grass Farm is sited in northeast area within Taobei District, where there is also a temperate zone with continental climate and abundant wind resources. Climate conditions at the Project site are featured with the violent changes between the hot and cold whether, strong wind and less rain. The average temperature of the site is about
5.4℃ and the difference of elevation of the site is about 142~179 m. The Project site is also convenient to access through the Provincial Route 204 in the south, and easier to be connected into a city primary power substation in Baicheng City and a county primary power substation in Zhenlai County of Baicheng city. Both substations are about 20 km away from the Project site. Figure 2 shows the location of the Project.
Figure 2. Location of the Project
City of
Baicheng
Project
Site
City of
Baicheng
Project
Site
PROJECT DESIGN DOCUMENT FORM (CDM PDD) - Version 02
CDM – Executive Board page 7
This template shall not be altered. It shall be completed without modifying/adding headings or logo, format or font.
A.4.2. Category(ies) of project activity: >> This category would fall within sectoral scope 1: energy industries.
A.4.3. Technology to be employed by the project activity:
>> The Project involves the installation of 58 sets of turbines with a unit capacity of 850 kW. According to the equipment tendering documents, 58 turbines with a unit capacity of 850 kW made by the Spanish manufacture, Gamesa Eolica, were selected for the Project. The turbines will be arranged in the matrix shape with row spacing of 9D (D equals the turbine diameter) and column spacing of 6D. The deployment direction of turbines is vertical to main wind energy. The hub height is 70 m. The estimated electricity output to the grid is 92.4886 GWh per year, the annual average operational hour is 1876.04 h, and the capacity factor is 0.2142. The Project will adopt a unit connection mode of one-turbine-one-transformer. Each turbine has an exit voltage of 0.69 kV and will be connected to a 1 kV current collection line linked into a 10 kV converting box. Then, a 10 kV current collection line will be linked into a grid-connected 66 kV switchgear transformer substation within the site, where the electricity output of the Project will be transferred, and also measured at the same time for the total amount of output to be sold into the Northeast China Grid. The measurement activities during the monitoring and verification stage at the exit point of the switchgear transformer substation will be critical for the calculation of the total amount of emission reductions to be generated by the Project.
A.4.4. Brief explanation of how the anthropogenic emissions of anthropogenic greenhouse gas
(GHGs) by sources are to be reduced by the proposed CDM project activity, including why the emission reductions would not occur in the absence of the proposed project activity, taking into account national and/or sectoral policies and circumstances:
>> The Project is additional and therefore not the baseline scenario as it faces some key financial and technological barriers. In the absence of the additional revenues, possibly from the CERs sales, the Project will have the difficulties to be implemented and the GHG emission reductions generated by the Project is unlikely to occur. The major barriers faced by the Project s are as follows: � Compared to those typical grid-connected fossil fuel-fired power plants connected into the
Northeast China Grid, the grid-connected wind power project has obvious disadvantages, including much higher cost in per kW installation and initial capital investment, and much shorter annual operational hours. Since the key part of the turbines were imported from abroad, even with preferential bus-bar tariff (0.6065 RMB/kWh), the IRR of total investment of the Project is only 6.84% and the IRR of equity of the Project is only 9.05%. . The Project is unfeasible in terms of economic and commercial considerations. Therefore it is not attractive to investors.
� Compared to those conventional commercial power plants, technology know-how requirements for
renewable energy power generation are much higher. Some key components of the turbines of the Project need to be imported, resulting in an increased cost not only for the investment but also for the maintenance services of the turbines. Furthermore, as it will be greatly influenced by climate conditions at the Project site, the wind power project is also featured in an unstable amount of output during a certain generation period, resulting in a challenge to the local grid for overall
PROJECT DESIGN DOCUMENT FORM (CDM PDD) - Version 02
CDM – Executive Board page 8
This template shall not be altered. It shall be completed without modifying/adding headings or logo, format or font.
stabled operation. Therefore, in a technical sense, a new build renewable power investment project has little attractiveness to grid managers and power project developers compared to those conventional commercial power plants.
� At present, the total amount of renewable energy power generation accounts less than 1% of the
total amount of power generation in China, which demonstrates that the wind power projects are the less option compared to those conventional fossil fuel power plants.
A.4.4.1. Estimated amount of emission reductions over the chosen crediting period:
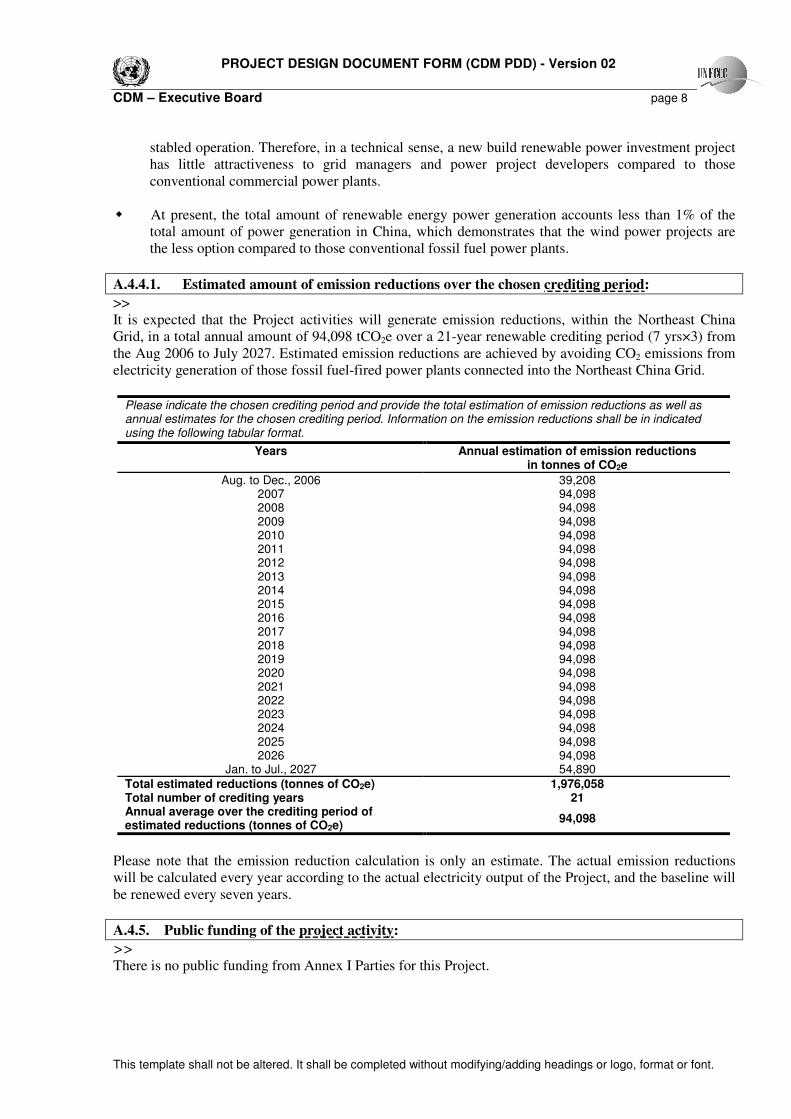
>> It is expected that the Project activities will generate emission reductions, within the Northeast China Grid, in a total annual amount of 94,098 tCO2e over a 21-year renewable crediting period (7 yrs×3) from the Aug 2006 to July 2027. Estimated emission reductions are achieved by avoiding CO2 emissions from electricity generation of those fossil fuel-fired power plants connected into the Northeast China Grid.
Please indicate the chosen crediting period and provide the total estimation of emission reductions as well as annual estimates for the chosen crediting period. Information on the emission reductions shall be in indicated using the following tabular format.
Years
Annual estimation of emission reductions in tonnes of CO2e
Aug. to Dec., 2006 39,208 2007 94,098 2008 94,098 2009 94,098 2010 94,098 2011 94,098 2012 94,098 2013 94,098 2014 94,098 2015 94,098 2016 94,098 2017 94,098 2018 94,098 2019 94,098 2020 94,098 2021 94,098 2022 94,098 2023 94,098 2024 94,098 2025 94,098 2026 94,098
Jan. to Jul., 2027 54,890
Total estimated reductions (tonnes of CO2e) 1,976,058 Total number of crediting years 21 Annual average over the crediting period of estimated reductions (tonnes of CO2e)
94,098
Please note that the emission reduction calculation is only an estimate. The actual emission reductions will be calculated every year according to the actual electricity output of the Project, and the baseline will be renewed every seven years.
A.4.5. Public funding of the project activity: >>
There is no public funding from Annex I Parties for this Project.
PROJECT DESIGN DOCUMENT FORM (CDM PDD) - Version 02
CDM – Executive Board page 9
This template shall not be altered. It shall be completed without modifying/adding headings or logo, format or font.
SECTION B. Application of a baseline methodology
B.1. Title and reference of the approved baseline methodology applied to the project activity: >> ACM0002.ver 06 – “Consolidated baseline methodology for grid-connected electricity generation from renewable sources.” For more information regarding the methodology please refer to http://cdm.unfccc.int/methodologies/approved.
B.1.1. Justification of the choice of the methodology and why it is applicable to the project activity: >> Wind power generation technology is a renewable electricity generation technology to displace fossil fuel-fired power generation technology to supply electricity to the grid. Therefore the Project applies the consolidated baseline methodology ACM0002 approved by CDM EB to determine the project baseline and calculate GHG emission reductions achieved by wind power generation. The Project meets all applicability conditions of the consolidated baseline methodology ACM0002 as follows:
1�
The Project involves the electricity capacity additions from wind power.
2�
The Project does not involve switching from fossil fuels to renewable energy at the site of the Project activity.
3�
The geographic and system boundaries for the Northeast China Grid can be clearly identified and information on the characteristics of the Northeast China Grid is available.
B.2. Description of how the methodology is applied in the context of the project activity: >> GHG emission reductions of the Project were calculated based on the consolidated baseline methodology ACM0002.
Baseline emission factors of operating margin ( yOMEF , ) and build margin ( yBMEF , ) were calculated
based on the data of the Northeast China Grid, which include installed capacity, electricity output and
consumption of different types of fuels of all plants. The baseline emission factor ( yEF ) is calculated as a
combined margin (CM) of yOMEF , and yBMEF , , according to the following three steps:
STEP 1. Calculate the Operating Margin Emission Factor(s) ( yOMEF , ) based on one of the four
following methods: (a) Simple OM, or (b) Simple adjusted OM, or (c) Dispatch data analysis OM, or (d) Average OM.
Each method is analyzed as below. Method (a) Simple OM The simple OM method only can be used when low-cost/must run resources constitute less than 50% of total amount of grid generating output 1) in the recent five years, or 2) by taking into account long-term
PROJECT DESIGN DOCUMENT FORM (CDM PDD) - Version 02
CDM – Executive Board page 10
This template shall not be altered. It shall be completed without modifying/adding headings or logo, format or font.
normal for hydroelectricity generation. Among the total electricity generations in 2004 of the Northeast China Grid which the Project is connected into, the electricity output of low-cost/must run resources accounts for about 6%, less than 50%. Thus, the method (a) Simple OM can be used to calculate the
baseline emission factor of operating margin ( yOMEF , ) for the Project.
Method (b) Simple adjusted OM The application of simple adjusted OM method requires annual load duration curve of the grid. The power sector in China is in a transitional period of “separating the plant operation from the grid operation”, resulting in the detailed data of dispatch and fuel consumption are often taken as confidential business information by the grid company and the power plants. Therefore those data are not publicly available. In most cases, it is difficult for the CDM projects in China to adopt Method (b) for the
calculation of the baseline emission factor of operating margin ( yOMEF , ). Similarly, the Project can not
adopt Method (b) for the calculation of the baseline emission factor of operating margin ( yOMEF , ) due to
unavailability of the dispatch data of the Northeast China Grid. Method (c) Dispatch data analysis OM Dispatch data analysis OM method should be the first choice if the dispatch data are available, because the method can truly reflect the substitutable relationship between the amount of electricity output from power plants of the baseline grid and that from the Project activity and the emission reductions generated. However, Method (c) cannot be adopted for the Project because of unavailability of the dispatch data of the Northeast China Grid, similar reason as method (b). Method (d) Average OM Method (d) can only be used when 1) low-cost/must run resources constitute more than 50% of total amount of grid electricity output and 2) detailed data required by applying method (b) and method (c) is unavailable. Among the total amount of electricity output in 2004 of the Northeast China Grid where the Project is connected into, the electricity output of low-cost/must run resources accounts for about 6%, less than 50%, so method (d) cannot be applied to the Project. In conclusion, Method (a) Simple OM is the only reasonable and feasible method among the four
methods for the calculation of the operating margin emission factor(s) ( yOMEF , ) of the Project.
In accordance with the consolidated baseline methodology ACM0002, the Simple OM emission factor
( ysimpleOMEF ,, ) is calculated as the generation-weighted average emissions per electricity unit
(tCO2e/MWh) of all generating sources serving the system, excluding those low-operating cost and
must-run power plants. The formula of ysimpleOMEF ,, calculation is
∑
∑ ⋅
=
j
yj
ji
ji
yji
ysimpleOMGEN
COEFF
EF,
,
,
,,
,, (1)
where:
yjiF ,, is the total amount of fuel i (in a mass or volume unit) consumed by all the relevant power
sources j in year(s) y, j refers to the power sources serving the grid, excluding those low-operating cost
PROJECT DESIGN DOCUMENT FORM (CDM PDD) - Version 02
CDM – Executive Board page 11
This template shall not be altered. It shall be completed without modifying/adding headings or logo, format or font.
and must-run power plants, and including imports to the grid,
yjiCOEF ,, is the total amount the CO2 emission coefficient of fuel i (tCO2/mass or volume unit of
the fuel), taking into account the carbon content of the fuels used by relevant power sources j and the oxidation rate of the fuel in year(s) y, and
yjGEN , is the electricity output (MWh) supplied to the grid by the sources j.
The CO2 emission coefficient iCOEF is then obtained from equation (2) as
iiCOii OXIDEFNCVCOEF ⋅⋅= ,2 (2)
where:
iNCV is the net calorific value (energy content) per mass or volume unit of fuel i,
iOXID is the oxidation factor of the fuel i (see page 1.29 in the 1996 Revised IPCC Guidelines for
Default Values), and
iCOEF ,2 is the CO2 emission factor per unit of energy of the fuel i.
The net calorific values of the fuels adopted are data obtained from the China Energy Statistical Yearbook 2005 Edition and IPCC default, and the oxidation factors of the fuels adopted are obtained from IPCC default.
The Simple OM emission factor ( yOMEF , ) of the Project is calculated based on the electricity generation
mix of the Northeast China Grid, excluding those low-operating cost and must-run power plants, such as
wind power and hydropower etc1. Based on these data, the Simple OM emission factor ( yOMEF , ) of the
Northeast China Grid is calculated as 1.1048 tCO2e/MWh (see Annex 3 for details).
STEP 2. Calculate the Build Margin Emission Factor ( yBMEF , ) according to the consolidated baseline
methodology ACM0002 using equation (3):
∑
∑ ⋅
=
m
ym
mi
miymi
yBMGEN
COEFF
EF,
,
,,,
, (3)
where:
ymiF ,, is the total amount of fuel i (in a mass or volume unit) consumed by all the sample power
sources m in year(s) y, m refers to the sample power plants serving the grid, excluding those low-operating cost and must-run power plants, and including imports to the grid,
ymiCOEF ,, is the total amount the CO2 emission coefficient of fuel i (tCO2/mass or volume unit of
the fuel), taking into account the carbon content of the fuels used by sample power sources m and the
1 The data on installed capacity and electricity output of different power generation technology options are obtained from the China Electric Power Yearbook (published annually) 2003, 2004 and 2005 editions. The data on different fuel consumptions for power generation in the Northeast China Grid are obtained from the provincial Energy
Balance Table (of year 2002 to 2004) from the China Energy Statistical Yearbook (2000~2002) and the China
Energy Statistical Yearbook 2004 and 2005 Edition (published annually after 2003). The China Energy Statistical
Yearbook 2005 Edition is published in June, 2006.
PROJECT DESIGN DOCUMENT FORM (CDM PDD) - Version 02
CDM – Executive Board page 12
This template shall not be altered. It shall be completed without modifying/adding headings or logo, format or font.
oxidation rate of the fuel in year(s) y, and
ymGEN , is the electricity output (MWh) supplied to the grid by the sources m.
The consolidated baseline methodology ACM0002 provides two options for sample group m: (1) The five power plants built most recently, or (2) The power plants capacity additions in the electricity system that comprise 20% of the system
generation (in MWh) and that were built most recently. It is suggested that the sample group that comprises the larger annual generation should be used. In China, it is very difficult to obtain the data of the five existing power plants built most recently or the power plants capacity additions in the electricity system that comprise 20% of the system generation (in MWh) and that were built most recently because these data are considered as confidential business information by the plants owners. Taking notice of this situation, EB accepts the following deviation in methodology application: 1) Use of capacity additions during the last 1~3 years for estimating the build margin emission factor for
grid electricity. 2) Use of weights estimated using installed capacity in place of annual electricity generation. And it is suggested to use the efficiency level of the best technology commercially available in the provincial/regional or national grid of China, as a conservative proxy.
In this PDD, as required, capacity additions of the Northeast China Grid during 2001~20042 were
calculated and the 600 MW sub-critical coal-fired power plant was used as the proxy of efficiency level
of the best technology in China3 for estimating the yBMEF , . Based on these data, the build margin
emission factor ( yBMEF , ) of the Northeast China Grid is calculated as 0.7551 tCO2e/MWh (see Annex 3
for details).
STEP3. Calculate the baseline emission factor ( yEF )
Based on the consolidated baseline methodology ACM0002, the baseline emission factor ( yEF ) is
calculated as the weighted average of the operating margin emission factor ( yOMEF , ) and the build
margin emission factor ( yBMEF , ), as
yBMBMyOMOMy EFwEFwEF ,, ⋅+⋅=
(4)
According to the consolidated baseline methodology ACM0002, the weight wOM is 0.75 and the weight wBM is 0.25 for wind power projects. Therefore the combined baseline emission factor
yEF =0.75×1.1048+0.25×0.7551=1.0174 (tCO2e/MWh).
Baseline emissions 2 Capacity addition during 2001~2004 are most close to 20%. Calculation details are available for DNA and DOE. 3 http://www.ccchina.gov.cn/source/fa/fa2002082803.html
PROJECT DESIGN DOCUMENT FORM (CDM PDD) - Version 02
CDM – Executive Board page 13
This template shall not be altered. It shall be completed without modifying/adding headings or logo, format or font.
Baseline emissions are calculated with combined baseline emission factor and electricity output of the Project as follows:
yyy EFEGBE ×= (5)
According to the consolidated baseline methodology ACM0002, the main indirect emissions potentially giving rise to leakage in the context of electric sector projects result from activities such as power plant construction, fuel handling(mining, processing, and transportation), and land inundation (for hydroelectric projects). The project developer does not need to consider such indirect emissions when applying the
methodology. So the Project can take no account of such leakages, 0=yL .
The Project activity will generate greenhouse gas (GHG) emission reductions by avoiding CO2 emissions
from electricity generation by fossil fuel power plants. The emission reduction ( yER ) during a given year
y is calculated as follows:
yyyy LPEBEER −−= (6)
Since the project emission for wind power ( yPE ) and the linkage ( yL ) is considered as zero, the emission
reduction is equal to baseline emission ( yBE ), i.e.:
yyyy EFEGBEER ⋅== (7)
yBE is (in the absence of the Project activity) the GHG emission of the part of electricity generation,
which is equivalent to that of the Project, of the Northeast China Grid, i.e. annual emission reductions of the Project.
B.3. Description of how the anthropogenic emissions of GHG by sources are reduced below those that would have occurred in the absence of the registered CDM project activity:
>> The additionality of the Project is demonstrated and assessed by using the Tool for the Demonstration and
Assessment of Additionality approved in the sixteenth meeting of the Executive Board (EB16). It includes the following steps: Step 1. Identification of alternatives to the project activity consistent with current laws and regulations The objective of the Step 1 is to define realistic and credible alternatives to the project activity(s) that can be (part of) the baseline scenario through the following sub-steps: Sub-step 1a. Define alternatives to the project activity: Plausible and credible alternatives available to the Project that provide outputs or services comparable to the proposed CDM project activity include: Alternative I: Construction of a fuel-fired power plant with equivalent amount of annual electricity generation; Alternative II: The Project activity not undertaken as a CDM project activity; Alternative III: Construction of a power plant using other sources of renewable energy with equivalent amount of annual electricity generation; and Alternative IV: Provision of equivalent amount of annual power output by the grid where the Project is connected (excluding those low cost/must run plants).
PROJECT DESIGN DOCUMENT FORM (CDM PDD) - Version 02
CDM – Executive Board page 14
This template shall not be altered. It shall be completed without modifying/adding headings or logo, format or font.
Based on Step 2: Investment Analysis, the Project is not financially attractive without consideration of CDM sales revenues. Alternative II is not feasible. Since there are no economically exploitable technology options of grid-connected renewable energy power projects in Baicheng City, Alternative III is not feasible. Sub-step 1b. Enforcement of applicable laws and regulations: For Alternative I, considering the same annual electricity generation, the alternative baseline scenario for the Project should be a fuel-fired power plant with installed capacity of 25 MW or lower. Further, as the Project is a grid-connected wind power generation project, the alternative baseline scenario must be a grid-connected fuel-fired power generation project. However, according to China’s regulations, construction of coal-fired power plants with capacity of less than 135 MW are prohibited in the areas which can be covered by large grids such as provincial grids4, and the fossil fuel-fired power units with capacity of less than 100 MW is strictly limited for installation 5. For these reasons, the possible alternative baseline scenario of building a 25 MW fuel-fired power plant conflicts with China’s current regulations. Therefore, Alternative I is not feasible. For Alternative IV, the installed capacity of the Northeast China Grid for both the existing power plants and the power plants to be built in a foreseeable future satisfies China’s regulations, which is also economically feasible. Therefore, Alternative IV is feasible. In conclusion, the practical and feasible baseline scenario is Alternative IV, the provision of equivalent amount of annual power output by the Northeast China Grid. Step 2. Investment Analysis The purpose of this step is to determine whether the Project activity is economically or financially less attractive than other alternatives without an additional revenue/funding, possibly from the sale of certified emission reductions (CERs). The investment analysis was conducted in the following steps: Sub-step 2a. Determine appropriate analysis method Tools for the Demonstration and Assessment of Additionality suggests three analysis methods which are simple cost analysis (Option I), investment comparison analysis (Option II) and benchmark analysis (Option III). Since the Project will earn the revenues not only from the CERs sales but also from electricity sales, the simple cost analysis method is not appropriate. Investment comparison analysis method is only applicable to projects whose alternatives are similar investment projects. The alternative baseline scenario of the Project is the Northeast China Grid rather than new investment projects. Therefore Option II is not appropriate. The Project will use benchmark analysis method (Option III) based on the consideration that benchmark IRR of the power sector is available. Sub-step 2b. Benchmark Analysis Method (Option III)
4 Notice on Strictly Prohibiting the Installation of Fuel-fired Generators with the Capacity of 135 MW or below issued by the General Office of the State Council, decree no. 2002-6. 5 Interim Rules on the Installation and Management of Small-scale Fuel-fired Generators(issued in Aug., 1997)
PROJECT DESIGN DOCUMENT FORM (CDM PDD) - Version 02
CDM – Executive Board page 15
This template shall not be altered. It shall be completed without modifying/adding headings or logo, format or font.
With reference to the Interim Rules on Economic Assessment of Electrical Engineering Retrofit Projects,
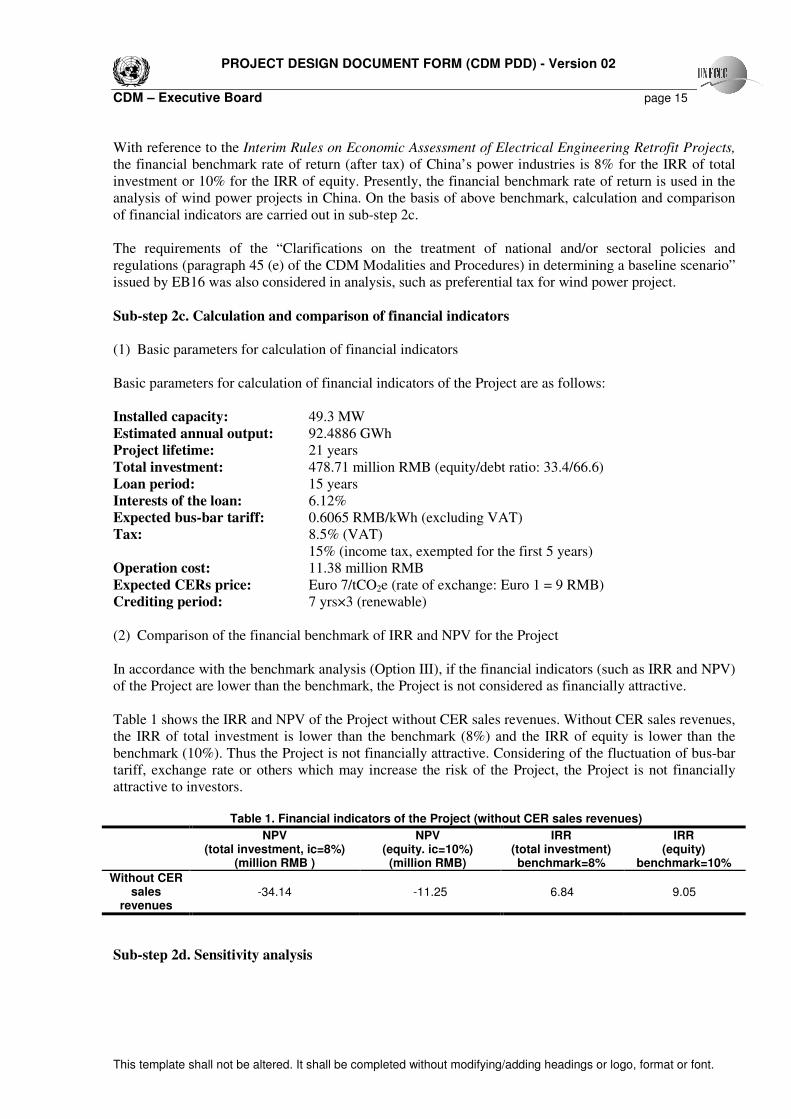
the financial benchmark rate of return (after tax) of China’s power industries is 8% for the IRR of total investment or 10% for the IRR of equity. Presently, the financial benchmark rate of return is used in the analysis of wind power projects in China. On the basis of above benchmark, calculation and comparison of financial indicators are carried out in sub-step 2c. The requirements of the “Clarifications on the treatment of national and/or sectoral policies and regulations (paragraph 45 (e) of the CDM Modalities and Procedures) in determining a baseline scenario” issued by EB16 was also considered in analysis, such as preferential tax for wind power project. Sub-step 2c. Calculation and comparison of financial indicators (1) Basic parameters for calculation of financial indicators Basic parameters for calculation of financial indicators of the Project are as follows: Installed capacity: 49.3 MW Estimated annual output: 92.4886 GWh Project lifetime: 21 years Total investment: 478.71 million RMB (equity/debt ratio: 33.4/66.6) Loan period: 15 years Interests of the loan: 6.12% Expected bus-bar tariff: 0.6065 RMB/kWh (excluding VAT) Tax: 8.5% (VAT) 15% (income tax, exempted for the first 5 years) Operation cost: 11.38 million RMB Expected CERs price: Euro 7/tCO2e (rate of exchange: Euro 1 = 9 RMB) Crediting period: 7 yrs×3 (renewable) (2) Comparison of the financial benchmark of IRR and NPV for the Project In accordance with the benchmark analysis (Option III), if the financial indicators (such as IRR and NPV) of the Project are lower than the benchmark, the Project is not considered as financially attractive. Table 1 shows the IRR and NPV of the Project without CER sales revenues. Without CER sales revenues, the IRR of total investment is lower than the benchmark (8%) and the IRR of equity is lower than the benchmark (10%). Thus the Project is not financially attractive. Considering of the fluctuation of bus-bar tariff, exchange rate or others which may increase the risk of the Project, the Project is not financially attractive to investors.
Table 1. Financial indicators of the Project (without CER sales revenues)
NPV
(total investment, ic=8%) (million RMB )
NPV (equity. ic=10%)
(million RMB)
IRR (total investment) benchmark=8%
IRR (equity)
benchmark=10%
Without CER sales
revenues -34.14 -11.25 6.84 9.05
Sub-step 2d. Sensitivity analysis
PROJECT DESIGN DOCUMENT FORM (CDM PDD) - Version 02
CDM – Executive Board page 16
This template shall not be altered. It shall be completed without modifying/adding headings or logo, format or font.
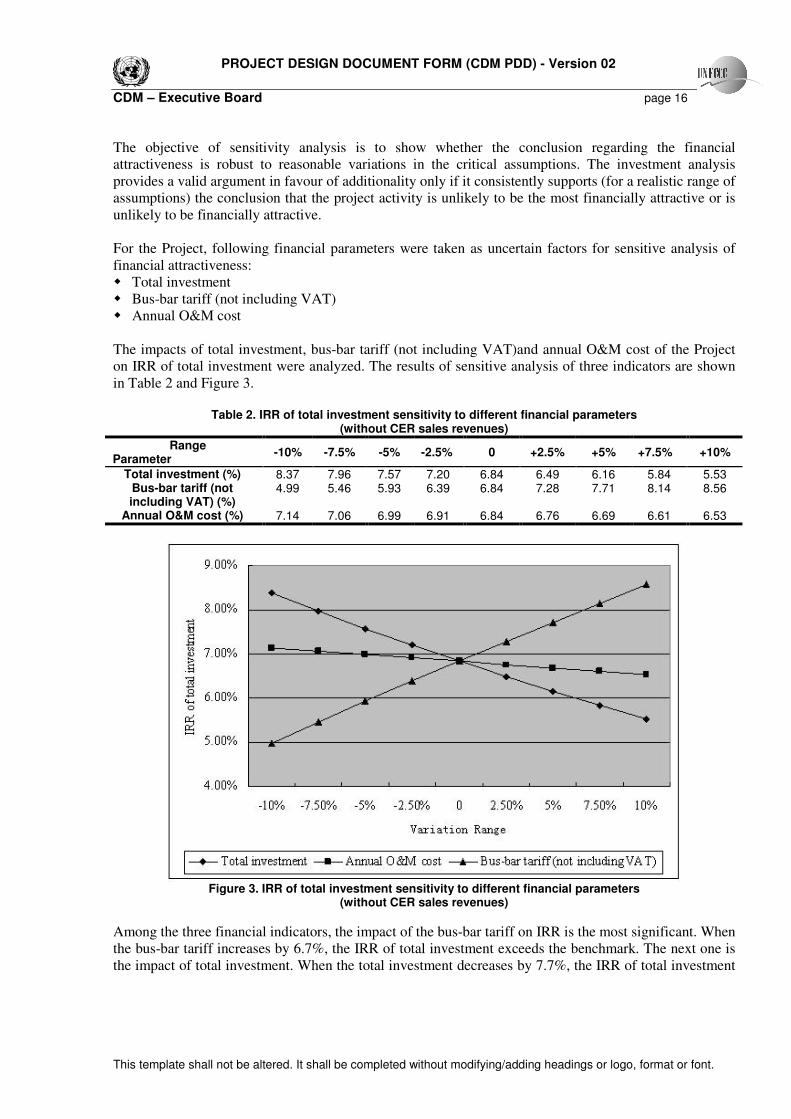
The objective of sensitivity analysis is to show whether the conclusion regarding the financial attractiveness is robust to reasonable variations in the critical assumptions. The investment analysis provides a valid argument in favour of additionality only if it consistently supports (for a realistic range of assumptions) the conclusion that the project activity is unlikely to be the most financially attractive or is unlikely to be financially attractive. For the Project, following financial parameters were taken as uncertain factors for sensitive analysis of financial attractiveness: � Total investment � Bus-bar tariff (not including VAT) � Annual O&M cost The impacts of total investment, bus-bar tariff (not including VAT)and annual O&M cost of the Project on IRR of total investment were analyzed. The results of sensitive analysis of three indicators are shown in Table 2 and Figure 3.
Table 2. IRR of total investment sensitivity to different financial parameters (without CER sales revenues)
Range Parameter
-10% -7.5% -5% -2.5% 0 +2.5% +5% +7.5% +10%
Total investment (%) 8.37 7.96 7.57 7.20 6.84 6.49 6.16 5.84 5.53 Bus-bar tariff (not including VAT) (%)
4.99 5.46 5.93 6.39 6.84 7.28 7.71 8.14 8.56
Annual O&M cost (%) 7.14 7.06 6.99 6.91 6.84 6.76 6.69 6.61 6.53
Figure 3. IRR of total investment sensitivity to different financial parameters
(without CER sales revenues) Among the three financial indicators, the impact of the bus-bar tariff on IRR is the most significant. When the bus-bar tariff increases by 6.7%, the IRR of total investment exceeds the benchmark. The next one is the impact of total investment. When the total investment decreases by 7.7%, the IRR of total investment
PROJECT DESIGN DOCUMENT FORM (CDM PDD) - Version 02
CDM – Executive Board page 17
This template shall not be altered. It shall be completed without modifying/adding headings or logo, format or font.
exceeds the benchmark. The impact of annual O&M cost on IRR is minimal. When the annual O&M cost decreases by 40%, the IRR of total investment exceeds the benchmark. Step 3. Barrier analysis This step is used to determine whether the Project activity faces real barriers that: (a) Prevent the implementation of this type of Project activity; and (b) Do not prevent the implementation of at least one of the alternatives. Step 3 uses the following sub-steps:
Sub-step 3a. Identify barriers that would prevent the implementation of type of the Project
activity:
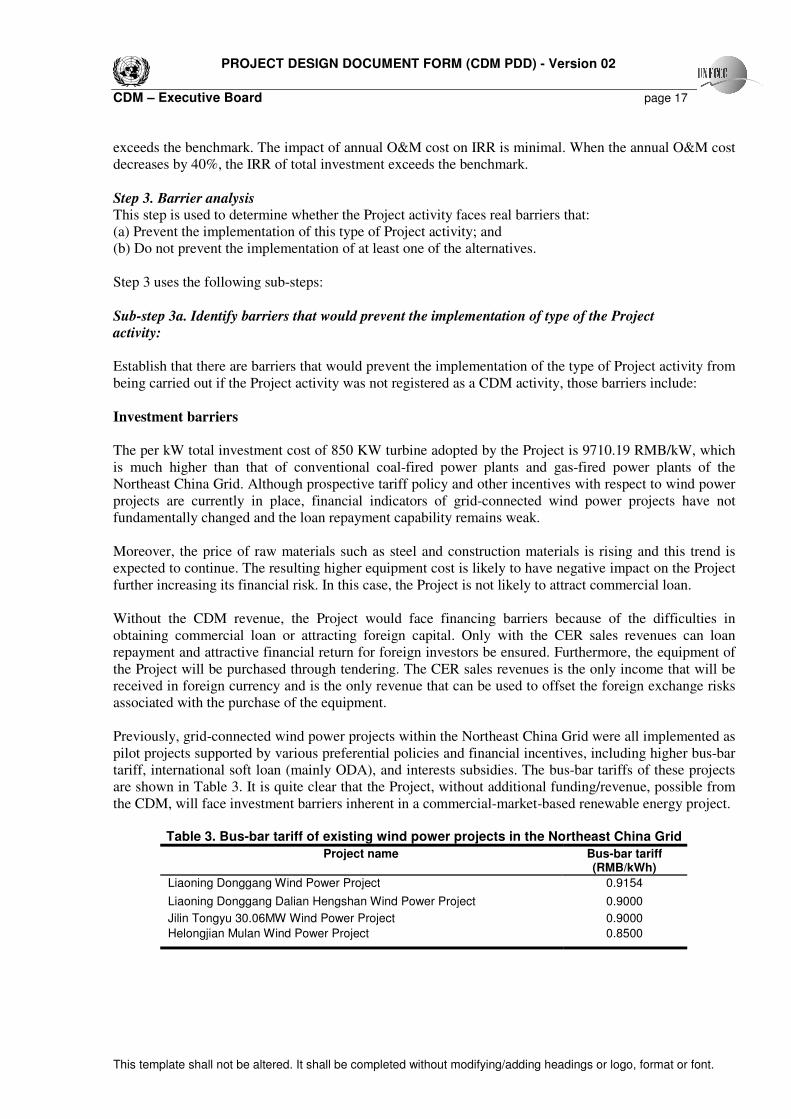
Establish that there are barriers that would prevent the implementation of the type of Project activity from being carried out if the Project activity was not registered as a CDM activity, those barriers include: Investment barriers The per kW total investment cost of 850 KW turbine adopted by the Project is 9710.19 RMB/kW, which is much higher than that of conventional coal-fired power plants and gas-fired power plants of the Northeast China Grid. Although prospective tariff policy and other incentives with respect to wind power projects are currently in place, financial indicators of grid-connected wind power projects have not fundamentally changed and the loan repayment capability remains weak. Moreover, the price of raw materials such as steel and construction materials is rising and this trend is expected to continue. The resulting higher equipment cost is likely to have negative impact on the Project further increasing its financial risk. In this case, the Project is not likely to attract commercial loan. Without the CDM revenue, the Project would face financing barriers because of the difficulties in obtaining commercial loan or attracting foreign capital. Only with the CER sales revenues can loan repayment and attractive financial return for foreign investors be ensured. Furthermore, the equipment of the Project will be purchased through tendering. The CER sales revenues is the only income that will be received in foreign currency and is the only revenue that can be used to offset the foreign exchange risks associated with the purchase of the equipment. Previously, grid-connected wind power projects within the Northeast China Grid were all implemented as pilot projects supported by various preferential policies and financial incentives, including higher bus-bar tariff, international soft loan (mainly ODA), and interests subsidies. The bus-bar tariffs of these projects are shown in Table 3. It is quite clear that the Project, without additional funding/revenue, possible from the CDM, will face investment barriers inherent in a commercial-market-based renewable energy project.
Table 3. Bus-bar tariff of existing wind power projects in the Northeast China Grid
Project name Bus-bar tariff (RMB/kWh)
Liaoning Donggang Wind Power Project 0.9154
Liaoning Donggang Dalian Hengshan Wind Power Project 0.9000
Jilin Tongyu 30.06MW Wind Power Project 0.9000
Helongjian Mulan Wind Power Project 0.8500
PROJECT DESIGN DOCUMENT FORM (CDM PDD) - Version 02
CDM – Executive Board page 18
This template shall not be altered. It shall be completed without modifying/adding headings or logo, format or font.
Technological barriers Huge technological risk is associated with the adoption of the 850 kW turbine which has higher efficiency and is more technically advanced compare to 600 kW turbine. Specific risks are: (1) Equipment disrepair and malfunctioning resulting from the lack of skilled and/or properly trained staff to operate and maintain the technology and the lack of education/training institution in China providing the needed skill;(2) Lack of infrastructure for implementation of the technology, or (3) Lack of qualified service agents to provide after-sale service for the maintenance of turbines and related equipment. The technological risks that wind power projects face were demonstrated in the PDD of the EB registered Huitengxile Wind Power Project. Some of the CDM revenue can be used as a reserve for the operation and maintenance of the 850KW turbines therefore enabling the project to overcome the technological barriers. Bus-bar tariff barriers Bus-bar tariff is one of the key barriers impeding the development of grid-connected wind power projects. The barrier is also faced by the Project. The prospective bus-bar tariff of the Project is RMB 0.6065 RMB/kWh (not including VAT), much higher than 0.25 RMB/kWh for coal-fired electricity (including desulfuration cost). However, even when the prospective bus-bar tariff can be realized, the financial indicators of the Project are still lower than benchmarks and not attractive to investors (which means the investment cannot be fully recovered in the project lifetime with the bus-bar tariff of the Project). Thus, in the absence of the CDM revenues, the bus-bar tariff barrier would impede the implementation of the Project activity. The letter from Jilin Pricing Bureau acknowledged that the break-even bus-bar tariff for the Project is 0.65 RMB/kwh (including VAT), but also stated that the actual tariff will be subject to national tariff policy updates. It is very difficult to obtain the bus-bar tariff of 0.6 RMB/kWh (not including VAT) because presently, the average bus-bar tariff of wind power projects in China is only around 0.5 RMB/kWh(including VAT). It is reported that attributed to the bus-bar tariff of 0.528 RMB/kWh, wind power projects in Guangdong Province has become hotspot for wind power investment6. The economic condition of Jilin is worse than that of Guangdong (in 2003, per capital GDP in Guangdong and Jilin was 17213 RMB and 9338 RMB respectively). Therefore, the prospective contracted bus-bar tariff for the Project is unlikely to exceed 0.6 RMB/kWh. Table 3 demonstrates that IRR of the Project is very sensitive to tariff which remains highly certain. For this reason, the project owner hopes to get the highest CER price possible in order to make the project feasible. Sub-step 3 b. Show that the identified barriers would not prevent the implementation of at least one of
the alternatives (except the Project activity):
As mentioned in Sub-step 1a, plausible and credible alternatives available to the Project include: Alternative I: Construction of a fuel-fired power plant with equivalent amount of annual electricity generation; Alternative II: The Project activity not undertaken as a CDM project activity;
6 Windpower investment rush in Guandong due to high bus-bar tariff for windpower,
http://www.gd.xinhuanet.com/newscenter/2004-07/07/content_2444252.htm�
China Business Review: Wind power becomes hotspot to power companies in Guangdong. http://www.cb.com.cn/1582/00008705.htm
PROJECT DESIGN DOCUMENT FORM (CDM PDD) - Version 02
CDM – Executive Board page 19
This template shall not be altered. It shall be completed without modifying/adding headings or logo, format or font.
Alternative III: Construction of a power plant using other sources of renewable energy with equivalent amount of annual electricity generation; and Alternative IV: Provision of equivalent amount of annual power output by the grid where the Project is connected (excluding those low cost/must run plants). As analyzed in sub-step 1a and sub-step 1b, Alternative I, Alternative II and Alternative III are not feasible. The only feasible and reasonable alternative baseline is Alternative IV, i.e. the Northeast China Grid provides equivalent amount of annual power output, not including low operating cost and must run power plants. The installed capacity of the Northeast China Grid for both the existing power plants and the power plants to be built in a foreseeable future satisfies China’s regulations, which is also economically feasible. Step 4 Common practice analysis
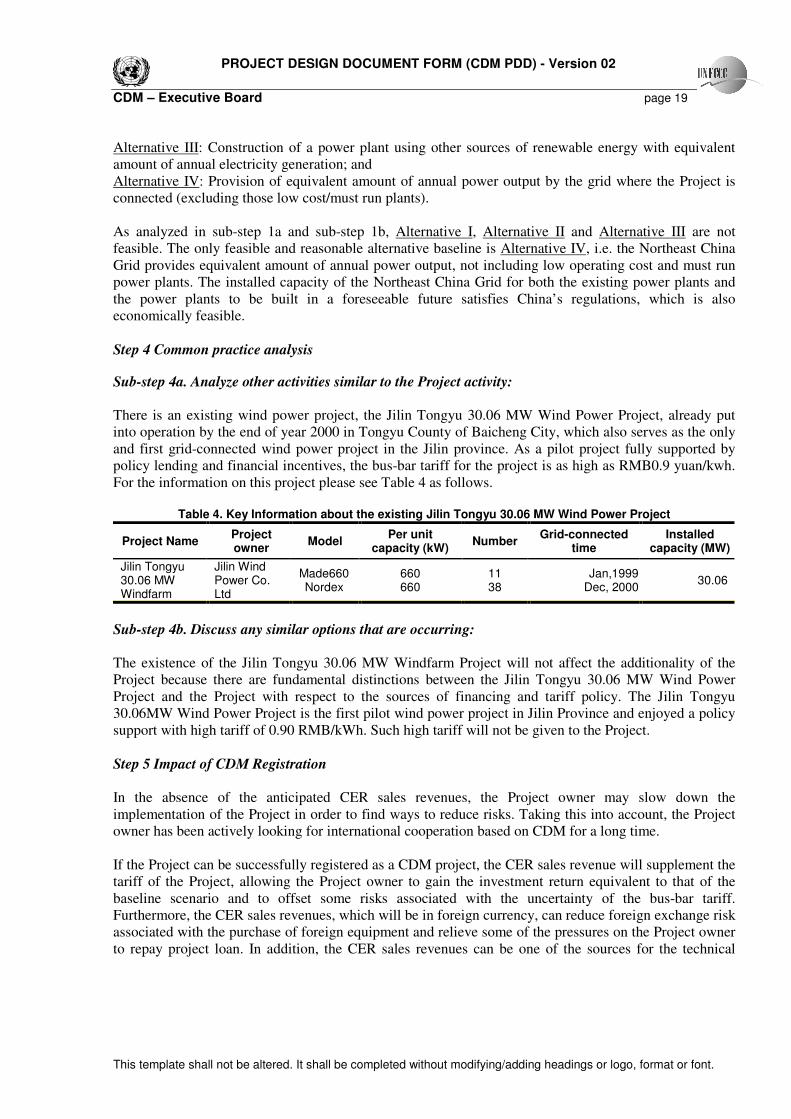
Sub-step 4a. Analyze other activities similar to the Project activity: There is an existing wind power project, the Jilin Tongyu 30.06 MW Wind Power Project, already put into operation by the end of year 2000 in Tongyu County of Baicheng City, which also serves as the only and first grid-connected wind power project in the Jilin province. As a pilot project fully supported by policy lending and financial incentives, the bus-bar tariff for the project is as high as RMB0.9 yuan/kwh. For the information on this project please see Table 4 as follows.
Table 4. Key Information about the existing Jilin Tongyu 30.06 MW Wind Power Project
Project Name Project owner
Model Per unit
capacity (kW) Number
Grid-connected time
Installed capacity (MW)
Jilin Tongyu 30.06 MW Windfarm
Jilin Wind Power Co. Ltd
Made660 Nordex
660 660
11 38
Jan,1999 Dec, 2000
30.06
Sub-step 4b. Discuss any similar options that are occurring: The existence of the Jilin Tongyu 30.06 MW Windfarm Project will not affect the additionality of the Project because there are fundamental distinctions between the Jilin Tongyu 30.06 MW Wind Power Project and the Project with respect to the sources of financing and tariff policy. The Jilin Tongyu 30.06MW Wind Power Project is the first pilot wind power project in Jilin Province and enjoyed a policy support with high tariff of 0.90 RMB/kWh. Such high tariff will not be given to the Project. Step 5 Impact of CDM Registration In the absence of the anticipated CER sales revenues, the Project owner may slow down the implementation of the Project in order to find ways to reduce risks. Taking this into account, the Project owner has been actively looking for international cooperation based on CDM for a long time. If the Project can be successfully registered as a CDM project, the CER sales revenue will supplement the tariff of the Project, allowing the Project owner to gain the investment return equivalent to that of the baseline scenario and to offset some risks associated with the uncertainty of the bus-bar tariff. Furthermore, the CER sales revenues, which will be in foreign currency, can reduce foreign exchange risk associated with the purchase of foreign equipment and relieve some of the pressures on the Project owner to repay project loan. In addition, the CER sales revenues can be one of the sources for the technical
PROJECT DESIGN DOCUMENT FORM (CDM PDD) - Version 02
CDM – Executive Board page 20
This template shall not be altered. It shall be completed without modifying/adding headings or logo, format or font.
maintenance reserve for the 850 kW turbine which helps guarantee successful implementation of the Project. If the Project fails to be approved and registered, the absence of the CER sales revenues may weaken the loan repayment capability and equipment maintenance capacity of the Project, which may lead to cash flow crisis and failure of the Project. Considering of the CER sales revenues (calculated with Euro 7/tCO2e, 7yrs×3 crediting period), the IRR of the Project will be significantly improved to meet the financial benchmark requirements of the power sector in China.
Table 5. Financial indicators of the Project (with CER sales revenues)
NPV (total investment, ic=8%)
(million RMB)
NPV (equity. ic=10%)
(million RMB)
IRR (total investment) benchmark=8%
IRR (equity)
benchmark=10%
With CER sales revenues
6.78 25.54 8.23 12.28
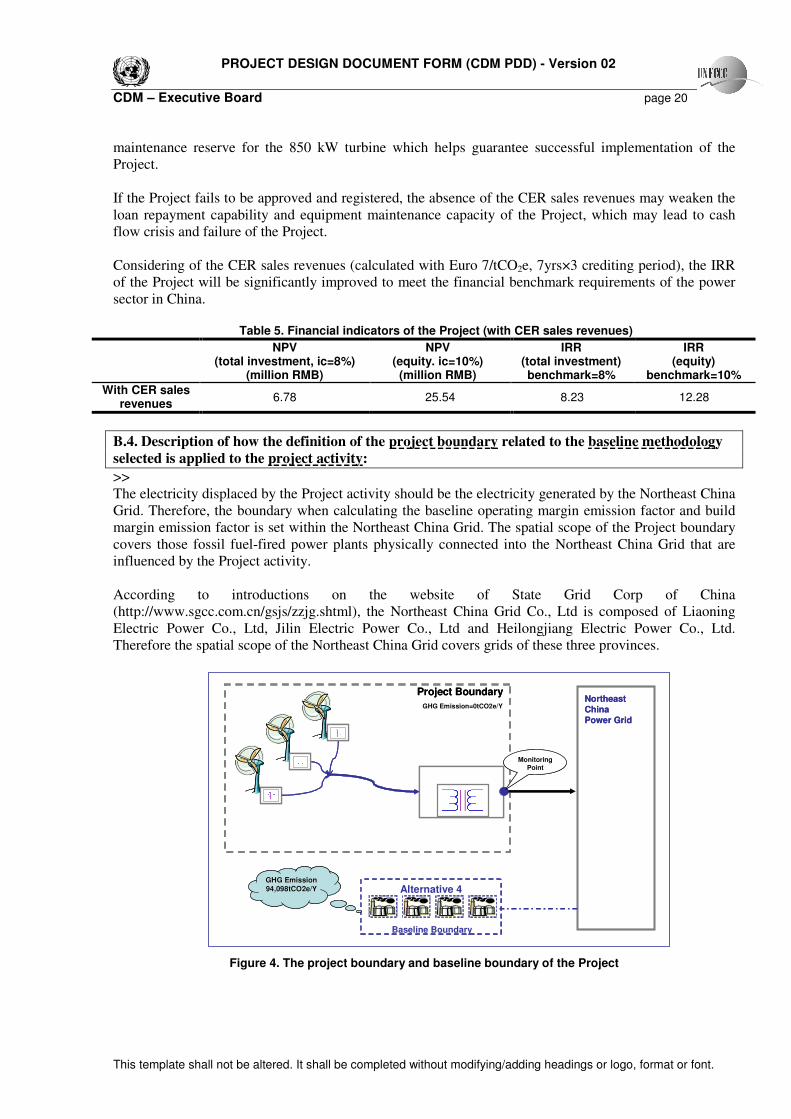
B.4. Description of how the definition of the project boundary related to the baseline methodology selected is applied to the project activity: >> The electricity displaced by the Project activity should be the electricity generated by the Northeast China Grid. Therefore, the boundary when calculating the baseline operating margin emission factor and build margin emission factor is set within the Northeast China Grid. The spatial scope of the Project boundary covers those fossil fuel-fired power plants physically connected into the Northeast China Grid that are influenced by the Project activity. According to introductions on the website of State Grid Corp of China (http://www.sgcc.com.cn/gsjs/zzjg.shtml), the Northeast China Grid Co., Ltd is composed of Liaoning Electric Power Co., Ltd, Jilin Electric Power Co., Ltd and Heilongjiang Electric Power Co., Ltd. Therefore the spatial scope of the Northeast China Grid covers grids of these three provinces.
Figure 4. The project boundary and baseline boundary of the Project
Alternative 4
Northeast
China
Power Grid
GHG EmissionGHG Emission
94,098tCO2e/Y94,098tCO2e/Y
Project Boundary
GHG Emission=0tCO2e/Y
Monitoring Point
Baseline Boundary
Alternative 4Alternative 4
Northeast
China
Power Grid
GHG EmissionGHG Emission
94,098tCO2e/Y94,098tCO2e/Y
Project Boundary
GHG Emission=0tCO2e/Y
Monitoring Point
Baseline Boundary

PROJECT DESIGN DOCUMENT FORM (CDM PDD) - Version 02
CDM – Executive Board page 21
This template shall not be altered. It shall be completed without modifying/adding headings or logo, format or font.
B.5. Details of baseline information, including the date of completion of the baseline study and the name of person (s)/entity (ies) determining the baseline: >> The baseline study of the Project was completed on June 2006 by following key individuals: 1. Mr. Zheng Zhaoning, [email protected]. 2. Ms. Pan Tao, [email protected]. 3. Ms. Xia Xiaoshu, [email protected], Green Capital Consulting Company, Suit 2001,
Building 7, Jianwai SOHO, Beijing 100022, China. The person/entity is not project participant listed in Annex 1.
PROJECT DESIGN DOCUMENT FORM (CDM PDD) - Version 02
CDM – Executive Board page 22
This template shall not be altered. It shall be completed without modifying/adding headings or logo, format or font.
SECTION C. Duration of the project activity / Crediting period C.1 Duration of the project activity: C.1.1. Starting date of the project activity:
>> 16/12/2004.
C.1.2. Expected operational lifetime of the project activity: >> 21y-0m.
C.2 Choice of the crediting period and related information:
C.2.1. Renewable crediting period
C.2.1.1. Starting date of the first crediting period: >> 01/08/2006
C.2.1.2. Length of the first crediting period: >> 7y-0m
C.2.2. Fixed crediting period:
C.2.2.1. Starting date: >> Not applicable.
C.2.2.2. Length:
>> Not applicable.

PROJECT DESIGN DOCUMENT FORM (CDM PDD) - Version 02
CDM – Executive Board page 23
This template shall not be altered. It shall be completed without modifying/adding headings or logo, format or font.
SECTION D. Application of a monitoring methodology and plan
D.1. Name and reference of approved monitoring methodology applied to the project activity:
>> ACM0002. – “Consolidated monitoring methodology for grid-connected electricity generation from renewable sources.” For more information regarding the methodology please refer to http://cdm.unfccc.int/methodologies/approved.
D.2. Justification of the choice of the methodology and why it is applicable to the project activity:
>> Applying the consolidated monitoring methodology ACM0002 to the Project is justified because: � This monitoring methodology shall be used in conjunction with the consolidated baseline
methodology ACM0002, and the Project has adopted the consolidated baseline methodology ACM0002.
� The Project involves an electricity capacity addition of a renewable source (wind energy) providing power to the grid.
� The Project does not involve switching from fossil fuels to renewable energy at the site of the project activity.
� The geographic and system boundaries for the Northeast China Grid can be clearly identified and information on the characteristics of the Northeast China Grid is available.
In line with the consolidated monitoring methodology ACM0002, Option 1 is chosen as the monitoring method.
PROJECT DESIGN DOCUMENT FORM (CDM PDD) - Version 02
CDM – Executive Board page 24
This template shall not be altered. It shall be completed without modifying/adding headings or logo, format or font.
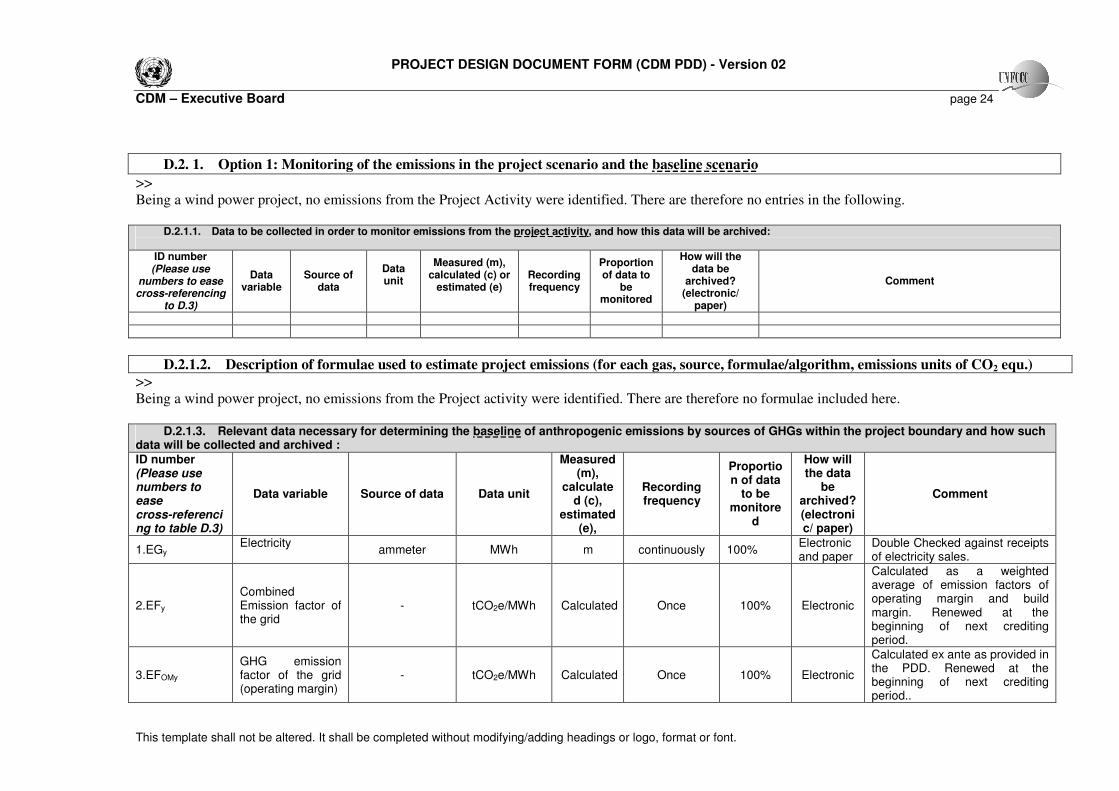
D.2. 1. Option 1: Monitoring of the emissions in the project scenario and the baseline scenario >> Being a wind power project, no emissions from the Project Activity were identified. There are therefore no entries in the following.
D.2.1.1. Data to be collected in order to monitor emissions from the project activity, and how this data will be archived:
ID number (Please use
numbers to ease cross-referencing
to D.3)
Data variable
Source of data
Data unit
Measured (m), calculated (c) or
estimated (e)
Recording frequency
Proportion of data to
be monitored
How will the data be
archived? (electronic/
paper)
Comment
D.2.1.2. Description of formulae used to estimate project emissions (for each gas, source, formulae/algorithm, emissions units of CO2 equ.) >> Being a wind power project, no emissions from the Project activity were identified. There are therefore no formulae included here. D.2.1.3. Relevant data necessary for determining the baseline of anthropogenic emissions by sources of GHGs within the project boundary and how such data will be collected and archived :
ID number (Please use numbers to ease cross-referencing to table D.3)
Data variable Source of data Data unit
Measured (m),
calculated (c),
estimated (e),
Recording frequency
Proportion of data
to be monitore
d
How will the data
be archived? (electronic/ paper)
Comment
1.EGy Electricity
ammeter MWh m continuously 100% Electronic and paper
Double Checked against receipts of electricity sales.
2.EFy
Combined Emission factor of the grid
- tCO2e/MWh Calculated Once 100% Electronic
Calculated as a weighted average of emission factors of operating margin and build margin. Renewed at the beginning of next crediting period.
3.EFOMy
GHG emission factor of the grid (operating margin)
- tCO2e/MWh Calculated Once 100% Electronic
Calculated ex ante as provided in the PDD. Renewed at the beginning of next crediting period..
PROJECT DESIGN DOCUMENT FORM (CDM PDD) - Version 02
CDM – Executive Board page 25
This template shall not be altered. It shall be completed without modifying/adding headings or logo, format or font.
4.EF_BMy
GHG emission factor of the grid (Build margin)
- tCO2e/MWh Calculated Once 100% Electronic
Calculated ex ante as provided in the PDD. Renewed at the beginning of next crediting period.
5.F i,y
Amount of fossil fuel consumed in the grid
China Energy Statistical Yearbook
Physical unit Measured Once 100% electronic
Obtained from the China Energy Statistical Yearbook for ex ante calculation. Renewed at the beginning of next crediting period.
6.COEFi
GHG emission coefficient of each fuel i
- tCO2e/eq (physical unit of fuel)
Measured Once 100% electronic
IPCC default values are used for ex ante calculation. Renewed at the beginning of next crediting period.
7.GENj,y
The electricity (MWh) delivered to the grid by source j,not including low operating cost and must run plants
China Electric Power Yearbook
MWh Calculated Once 100% electronic
Obtained from the China Electric Power Yearbook for ex ante calculation. Renewed at the beginning of next crediting period.
8.wom and wbm Weight factor of OM and BM
ACM0002 ver.06 - - Fixed 100% electronic Default weight factor of wom is 0.75 while wbm is 0.25.
All the monitoring data will be archived during and at least two years after the crediting period.
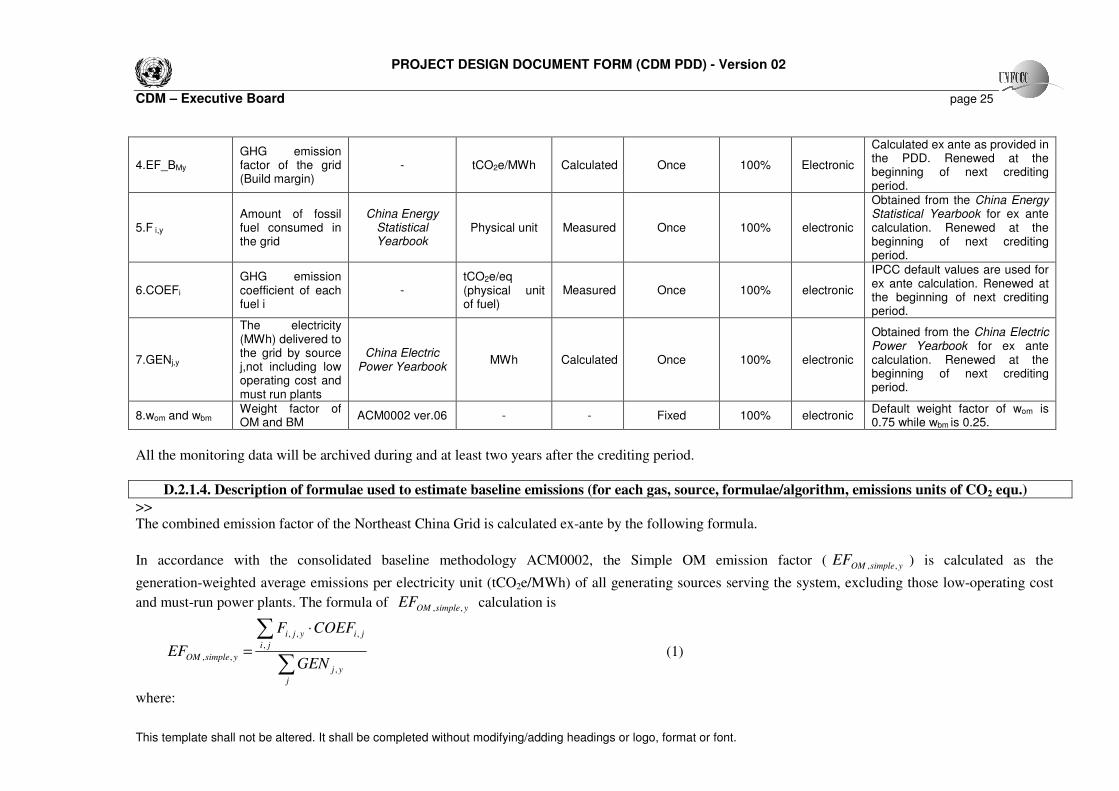
D.2.1.4. Description of formulae used to estimate baseline emissions (for each gas, source, formulae/algorithm, emissions units of CO2 equ.) >> The combined emission factor of the Northeast China Grid is calculated ex-ante by the following formula.
In accordance with the consolidated baseline methodology ACM0002, the Simple OM emission factor ( ysimpleOMEF ,, ) is calculated as the
generation-weighted average emissions per electricity unit (tCO2e/MWh) of all generating sources serving the system, excluding those low-operating cost
and must-run power plants. The formula of ysimpleOMEF ,, calculation is
∑
∑ ⋅
=
j
yj
ji
ji
yji
ysimpleOMGEN
COEFF
EF,
,
,
,,
,, (1)
where:
PROJECT DESIGN DOCUMENT FORM (CDM PDD) - Version 02
CDM – Executive Board page 26
This template shall not be altered. It shall be completed without modifying/adding headings or logo, format or font.
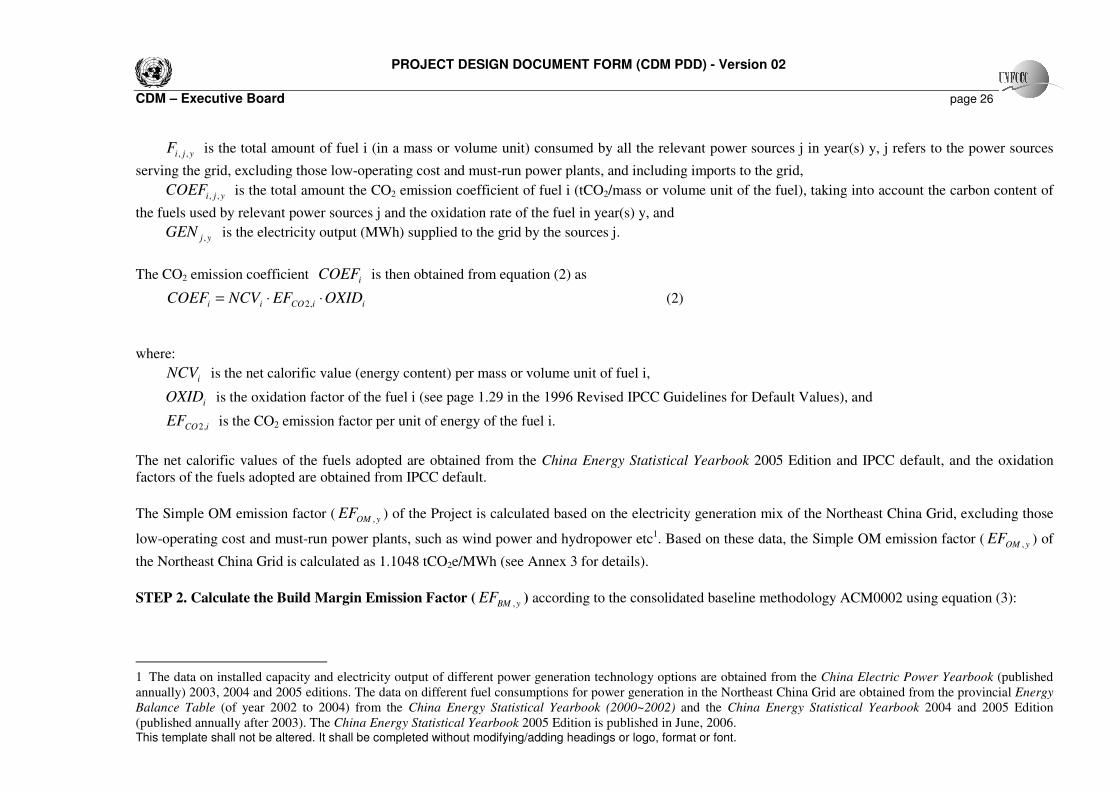
yjiF ,, is the total amount of fuel i (in a mass or volume unit) consumed by all the relevant power sources j in year(s) y, j refers to the power sources
serving the grid, excluding those low-operating cost and must-run power plants, and including imports to the grid,
yjiCOEF ,, is the total amount the CO2 emission coefficient of fuel i (tCO2/mass or volume unit of the fuel), taking into account the carbon content of
the fuels used by relevant power sources j and the oxidation rate of the fuel in year(s) y, and
yjGEN , is the electricity output (MWh) supplied to the grid by the sources j.
The CO2 emission coefficient iCOEF is then obtained from equation (2) as
iiCOii OXIDEFNCVCOEF ⋅⋅= ,2 (2)
where:
iNCV is the net calorific value (energy content) per mass or volume unit of fuel i,
iOXID is the oxidation factor of the fuel i (see page 1.29 in the 1996 Revised IPCC Guidelines for Default Values), and
iCOEF ,2 is the CO2 emission factor per unit of energy of the fuel i.
The net calorific values of the fuels adopted are obtained from the China Energy Statistical Yearbook 2005 Edition and IPCC default, and the oxidation factors of the fuels adopted are obtained from IPCC default.
The Simple OM emission factor ( yOMEF , ) of the Project is calculated based on the electricity generation mix of the Northeast China Grid, excluding those
low-operating cost and must-run power plants, such as wind power and hydropower etc1. Based on these data, the Simple OM emission factor ( yOMEF , ) of
the Northeast China Grid is calculated as 1.1048 tCO2e/MWh (see Annex 3 for details).
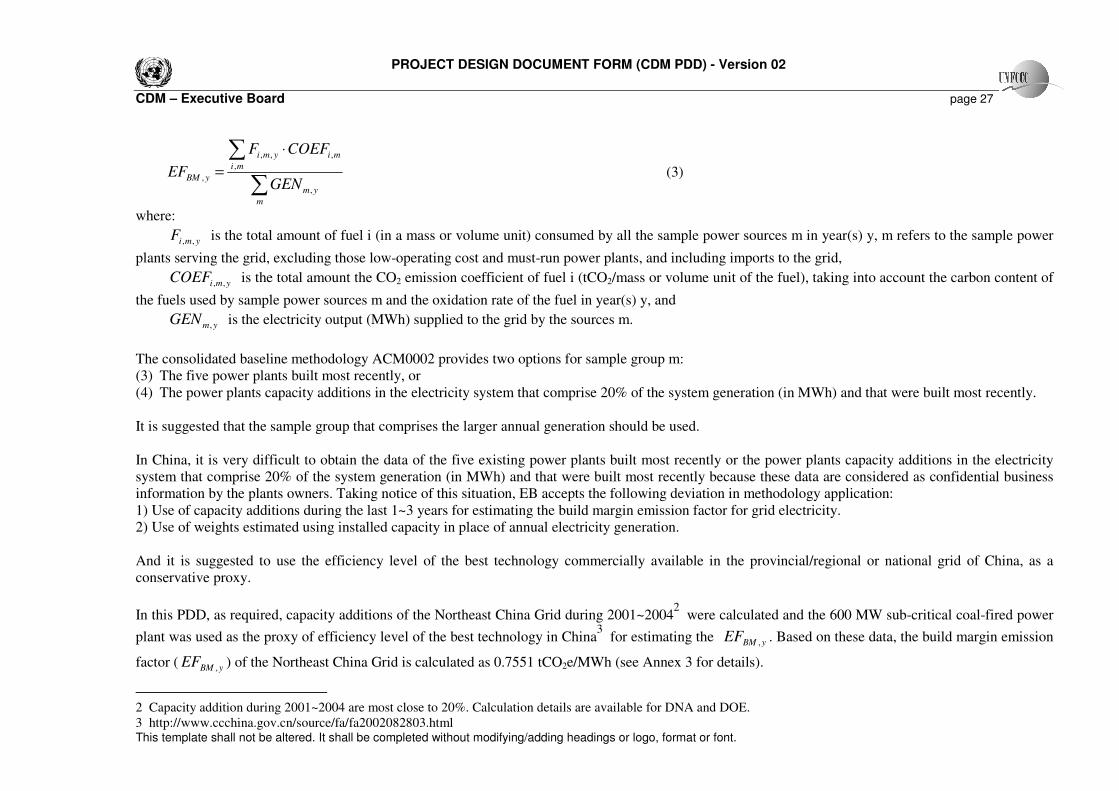
STEP 2. Calculate the Build Margin Emission Factor ( yBMEF , ) according to the consolidated baseline methodology ACM0002 using equation (3):
1 The data on installed capacity and electricity output of different power generation technology options are obtained from the China Electric Power Yearbook (published annually) 2003, 2004 and 2005 editions. The data on different fuel consumptions for power generation in the Northeast China Grid are obtained from the provincial Energy
Balance Table (of year 2002 to 2004) from the China Energy Statistical Yearbook (2000~2002) and the China Energy Statistical Yearbook 2004 and 2005 Edition (published annually after 2003). The China Energy Statistical Yearbook 2005 Edition is published in June, 2006.
PROJECT DESIGN DOCUMENT FORM (CDM PDD) - Version 02
CDM – Executive Board page 27
This template shall not be altered. It shall be completed without modifying/adding headings or logo, format or font.
∑
∑ ⋅
=
m
ym
mi
miymi
yBMGEN
COEFF
EF,
,
,,,
, (3)
where:
ymiF ,, is the total amount of fuel i (in a mass or volume unit) consumed by all the sample power sources m in year(s) y, m refers to the sample power
plants serving the grid, excluding those low-operating cost and must-run power plants, and including imports to the grid,
ymiCOEF ,, is the total amount the CO2 emission coefficient of fuel i (tCO2/mass or volume unit of the fuel), taking into account the carbon content of
the fuels used by sample power sources m and the oxidation rate of the fuel in year(s) y, and
ymGEN , is the electricity output (MWh) supplied to the grid by the sources m.
The consolidated baseline methodology ACM0002 provides two options for sample group m: (3) The five power plants built most recently, or (4) The power plants capacity additions in the electricity system that comprise 20% of the system generation (in MWh) and that were built most recently. It is suggested that the sample group that comprises the larger annual generation should be used. In China, it is very difficult to obtain the data of the five existing power plants built most recently or the power plants capacity additions in the electricity system that comprise 20% of the system generation (in MWh) and that were built most recently because these data are considered as confidential business information by the plants owners. Taking notice of this situation, EB accepts the following deviation in methodology application: 1) Use of capacity additions during the last 1~3 years for estimating the build margin emission factor for grid electricity. 2) Use of weights estimated using installed capacity in place of annual electricity generation. And it is suggested to use the efficiency level of the best technology commercially available in the provincial/regional or national grid of China, as a conservative proxy.
In this PDD, as required, capacity additions of the Northeast China Grid during 2001~20042 were calculated and the 600 MW sub-critical coal-fired power
plant was used as the proxy of efficiency level of the best technology in China3 for estimating the yBMEF , . Based on these data, the build margin emission
factor ( yBMEF , ) of the Northeast China Grid is calculated as 0.7551 tCO2e/MWh (see Annex 3 for details).
2 Capacity addition during 2001~2004 are most close to 20%. Calculation details are available for DNA and DOE. 3 http://www.ccchina.gov.cn/source/fa/fa2002082803.html
PROJECT DESIGN DOCUMENT FORM (CDM PDD) - Version 02
CDM – Executive Board page 28
This template shall not be altered. It shall be completed without modifying/adding headings or logo, format or font.
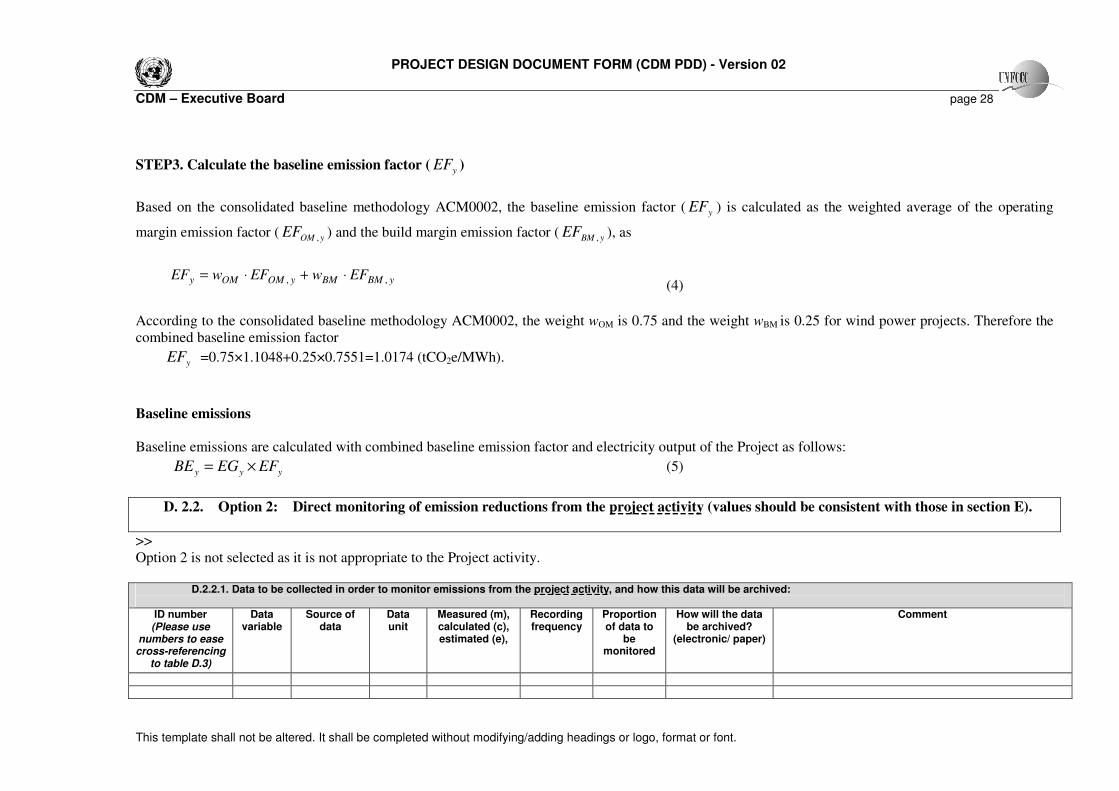
STEP3. Calculate the baseline emission factor ( yEF )
Based on the consolidated baseline methodology ACM0002, the baseline emission factor ( yEF ) is calculated as the weighted average of the operating
margin emission factor ( yOMEF , ) and the build margin emission factor ( yBMEF , ), as
yBMBMyOMOMy EFwEFwEF ,, ⋅+⋅=
(4)
According to the consolidated baseline methodology ACM0002, the weight wOM is 0.75 and the weight wBM is 0.25 for wind power projects. Therefore the combined baseline emission factor
yEF =0.75×1.1048+0.25×0.7551=1.0174 (tCO2e/MWh).
Baseline emissions Baseline emissions are calculated with combined baseline emission factor and electricity output of the Project as follows:
yyy EFEGBE ×= (5)
D. 2.2. Option 2: Direct monitoring of emission reductions from the project activity (values should be consistent with those in section E).
>> Option 2 is not selected as it is not appropriate to the Project activity. D.2.2.1. Data to be collected in order to monitor emissions from the project activity, and how this data will be archived:
ID number (Please use
numbers to ease cross-referencing
to table D.3)
Data variable
Source of data
Data unit
Measured (m), calculated (c), estimated (e),
Recording frequency
Proportion of data to
be monitored
How will the data be archived?
(electronic/ paper)
Comment
PROJECT DESIGN DOCUMENT FORM (CDM PDD) - Version 02
CDM – Executive Board page 29
This template shall not be altered. It shall be completed without modifying/adding headings or logo, format or font.
D.2.2.2. Description of formulae used to calculate project emissions (for each gas, source, formulae/algorithm, emissions units of CO2 equ.): D.2.3. Treatment of leakage in the monitoring plan D.2.3.1. If applicable, please describe the data and information that will be collected in order to monitor leakage effects of the project activity
ID number (Please use numbers to ease cross-referencing to table D.3)
Data variable
Source of data Data
unit
Measured (m), calculated (c) or estimated (e)
Recording frequency
Proportion of data to be monitored
How will the data be archived? (electronic/ paper)
Comment
D.2.3.2. Description of formulae used to estimate leakage (for each gas, source, formulae/algorithm, emissions units of CO2 equ.)
>> According to the consolidated baseline methodology ACM0002, the main indirect emissions potentially giving rise to leakage in the context of electric sector projects result from activities such as power plant construction, fuel handling(mining, processing, and transportation), and land inundation (for hydroelectric projects). The project developer does not need to consider such indirect emissions when applying the methodology. So the Project can take no
account of such leakages, 0=yL .
D.2.4. Description of formulae used to estimate emission reductions for the project activity (for each gas, source, formulae/algorithm, emissions units of CO2 equ.) >> The Project activity will generate greenhouse gas (GHG) emission reductions by avoiding CO2 emissions from electricity generation by fossil fuel power
plants. The emission reduction ( yER ) during a given year y is calculated as follows:
yyyy LPEBEER −−= (6)
Since the project emission for wind power ( yPE ) and the linkage ( yL ) is considered as zero, the emission reduction is equal to baseline emission ( yBE ),
i.e.:
yyyy EFEGBEER ⋅== (7)
yBE is (in the absence of the Project activity) the GHG emission of the part of electricity generation, which is equivalent to that of the Project, of the
Northeast China Grid, i.e. annual emission reductions of the Project.
PROJECT DESIGN DOCUMENT FORM (CDM PDD) - Version 02
CDM – Executive Board page 30
This template shall not be altered. It shall be completed without modifying/adding headings or logo, format or font.
D.3. Quality control (QC) and quality assurance (QA) procedures are being undertaken for data monitored Data (Indicate table and ID number e.g. 3.-1.; 3.2.)
Uncertainty level of data (High/Medium/Low)
Explain QA/QC procedures planned for these data, or why such procedures are not necessary.
D.2.1.3-1 low
The grid-connected electricity generation will be monitored by electric-meter in compliance with relevant standards in China. Electricity sales receipts from the commercial metering system for power wheeled into the Northeast China Grid will also be obtained for cross-check.
From D.2.1.3-2 to D.2.1.3-8
low Data is obtained from the China Electric Power Yearbook (published by State Power Grid Corporation), the IPCC Guideline and the China Energy Statistical Yearbook. These sources will be checked against other sources.
D.4 Please describe the operational and management structure that the project operator will implement in order to monitor emission reductions and any leakage effects, generated by the project activity
>> Detailed monitoring arrangements of emission reduction will be determined before the Project starts its operation, according to Section D and Annex 4: monitoring plan. A CDM manual was designed as a guideline for the project owner to manage and monitor the Project during the project implementation. In reference to the
PDD of the Huitengxile project, the table of contents of the manual is as follows:
1.0 Introduction
2.0 Overall Project Management
3.0 CDM Project Management and Calculations
3.1 Data to be monitored and recorded (as per the PDD)
3.2 Emissions Reduction Calculation for the Project
3.3 Monitoring Leakage
4.0 Procedures to be followed
4.1 Monitoring Procedures
4.2 Calibration Procedures
PROJECT DESIGN DOCUMENT FORM (CDM PDD) - Version 02
CDM – Executive Board page 31
This template shall not be altered. It shall be completed without modifying/adding headings or logo, format or font.
4.3 Maintenance Procedures
4.4 Procedure for Training of Personnel engaged in this MVP
5.0 Records Keeping, Error Handling and Reporting Procedures
5.1 Records Keeping and Internal Reporting Procedure
5.2 Error Handling Procedure
5.3 External Reporting Procedure
5.4 Procedure for corrective actions arising
5.5 Change of CDM Responsible Person
6.0 Confirmation of the adoption of these CDM Operating Procedures The manual is available for validation by the DOE and will be updated and revised post-validation based on the comments from the DOE.
D.5 Name of person/entity determining the monitoring methodology:
>> The monitoring plan of the Project was completed on June 2006 by following key individuals:
1. Mr. Zheng Zhaoning, [email protected]. 2. Ms. Pan Tao, [email protected]. 3. Ms. Xia Xiaoshu, [email protected], Green Capital Consulting Company, Suit 2001, Building 7, Jianwai SOHO, Beijing 100022, China.
The person/entity is not project participant listed in Annex 1.
PROJECT DESIGN DOCUMENT FORM (CDM PDD) - Version 02
CDM – Executive Board page 32
This template shall not be altered. It shall be completed without modifying/adding headings or logo, format or font.
SECTION E. Estimation of GHG emissions by sources
E.1. Estimate of GHG emissions by sources: >> As per section D.2.1.2, based on the assumption that the leakage at the construction phase of the project is
neglected, the GHG emission of the Project within the project boundary is zero, i.e. yPE =0.
E.2. Estimated leakage:
>>
As above mentioned, the leakage of the Project is not considered, i.e. yL =0.
E.3. The sum of E.1 and E.2 representing the project activity emissions: >>
The emission of the Project is zero, i.e.E.1+E.2= yPE + yL =0.
E.4. Estimated anthropogenic emissions by sources of greenhouse gases of the baseline: >> According to the Feasibility Study Report of the Project, the annual power generation is estimated to be 92.4886 GWh. As per the calculation formula of baseline combined emission factor in section D.2.1.4, the baseline emission factor for 2005 is 1.0174 tCO2e/MWh. As per the calculation formula of baseline emission, the annual baseline emission of the Project is 94,098 tCO2e. (See Annex 3 for details)
E.5. Difference between E.4 and E.3 representing the emission reductions of the project activity: >> With the emissions from the Project being zero, the emission reductions of the Project activity are equivalent to the emissions of the baseline. The annual reductions are estimated to be 94,098 tCO2e. (See Annex 3 for detail)
E.6. Table providing values obtained when applying formulae above: >> It is expected that the Project activities will generate emission reductions, within the Northeast China Grid, in an annual amount of 94,098 tCO2e over a 21-year renewable crediting period (7 yrs×3) from the Aug 2006 to the July 2027. Estimated emission reductions are achieved by avoiding CO2 emissions from electricity generation of those fossil fuel-fired power plants connected into the Northeast China Grid.
PROJECT DESIGN DOCUMENT FORM (CDM PDD) - Version 02
CDM – Executive Board page 33
This template shall not be altered. It shall be completed without modifying/adding headings or logo, format or font.
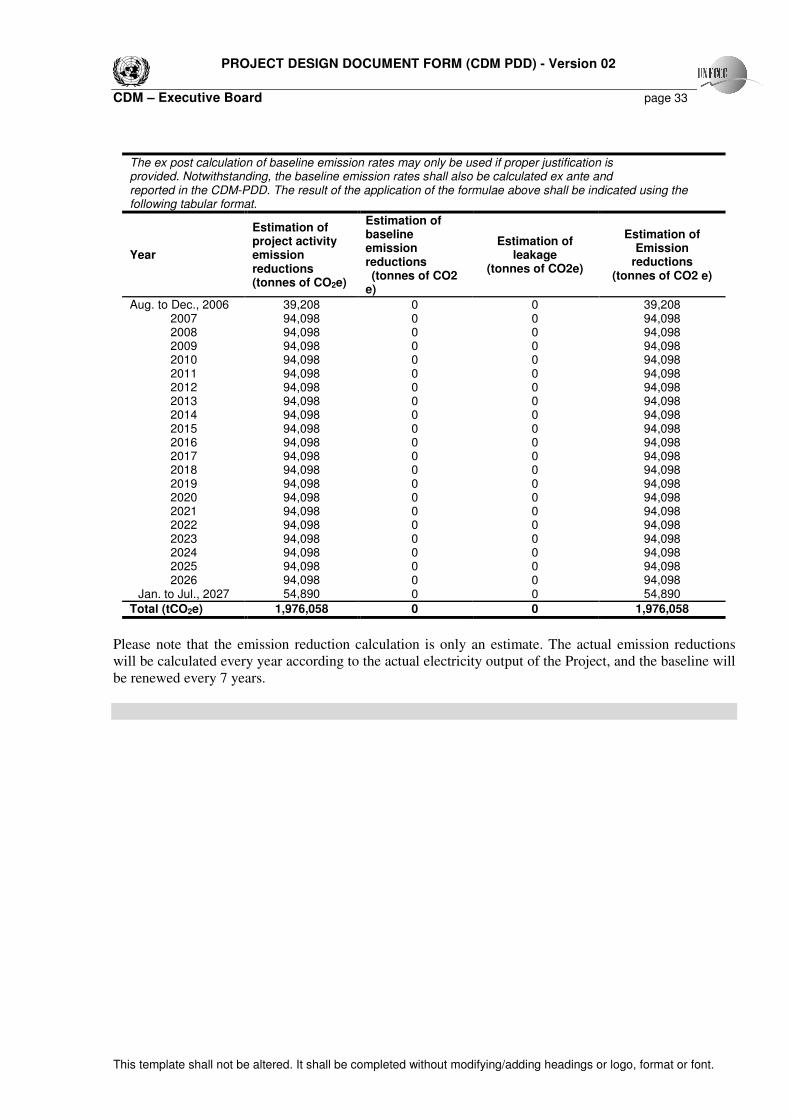
The ex post calculation of baseline emission rates may only be used if proper justification is provided. Notwithstanding, the baseline emission rates shall also be calculated ex ante and reported in the CDM-PDD. The result of the application of the formulae above shall be indicated using the following tabular format.
Year
Estimation of project activity emission reductions (tonnes of CO2e)
Estimation of baseline emission reductions (tonnes of CO2 e)
Estimation of leakage
(tonnes of CO2e)
Estimation of Emission
reductions (tonnes of CO2 e)
Aug. to Dec., 2006 39,208 0 0 39,208 2007 94,098 0 0 94,098 2008 94,098 0 0 94,098 2009 94,098 0 0 94,098 2010 94,098 0 0 94,098 2011 94,098 0 0 94,098 2012 94,098 0 0 94,098 2013 94,098 0 0 94,098 2014 94,098 0 0 94,098 2015 94,098 0 0 94,098 2016 94,098 0 0 94,098 2017 94,098 0 0 94,098 2018 94,098 0 0 94,098 2019 94,098 0 0 94,098 2020 94,098 0 0 94,098 2021 94,098 0 0 94,098 2022 94,098 0 0 94,098 2023 94,098 0 0 94,098 2024 94,098 0 0 94,098 2025 94,098 0 0 94,098 2026
Jan. to Jul., 2027 94,098 54,890
0 0
0 0
94,098 54,890
Total (tCO2e) 1,976,058 0 0 1,976,058
Please note that the emission reduction calculation is only an estimate. The actual emission reductions will be calculated every year according to the actual electricity output of the Project, and the baseline will be renewed every 7 years.
PROJECT DESIGN DOCUMENT FORM (CDM PDD) - Version 02
CDM – Executive Board page 34
This template shall not be altered. It shall be completed without modifying/adding headings or logo, format or font.
SECTION F. Environmental impacts
F.1. Documentation on the analysis of the environmental impacts, including transboundary impacts:
>> The Environmental Impact Registration Form was completed by the Project owner, and approved by the Environment Protection Bureau of Jilin Province in June, 2004 (Document No. 2004064). The environmental impacts arising from the Project are analyzed in the following two phases: Construction Phase Noise The construction work for the Project will be conducted during the daytime. The noise considered for the Project are primarily arising from the construction activities, including the flash explosion for loosen the soil, and machinery equipment operations for turbines installations. As the explosion is used only for the loosing the soil with a very light explosive charges and be limited in numbers, therefore the expected impact from the noise of the explosion will be of only momentary and considered to be very little. Further, as the site is surrounded by the degenerated wasteland where is nearly no residences, resulting in no issues of “disturbing of sweet dreams”. Land Use The Project will make a long-term requisition of land in an area of 97490.4m², which is to be used for the turbine installation, a new control centre, and for laying cables, while some of additional land area will be occupied on a short-term basis by the Project during the construction period for workers’ living and production, turbine work platform and storage of turbine equipments, and transportations. To reduce the size of land occupied on a short-term basis, the Project will located it within the permanently occupied land. The land will be occupied for the Project is degenerated grassland. The local district government as the owners of the land will be compensated according to the related regulations. When construction are competed, the land will be covered with vegetation, and all the temporary facilities during the construction period will be removed or demolished, and temporarily occupied land will be reinstated and made green based on the characteristics of the land. Overall, the land use impact arising from the project is not considered to be significant.
Dust Dust is expected to be the main air pollutant during the construction period. As the Project will be involved with earthwork construction and vehicle transportation, the dust and raise dust will likely to be occurred in the open working area and the neighbouring area, thus resulting in partial local air pollution. As the construction area is far from residential area, such an impact will be limited to a countable group of people working at the site but rather at large. To mitigate such an impact at the site, construction party has adopted various dustproof measures to protect the overall environment for the people living and working at site, including frequently watering the site area for the construction work and the main roads for the transportations, keeping dusting row materials at the specific worksite, providing regular

PROJECT DESIGN DOCUMENT FORM (CDM PDD) - Version 02
CDM – Executive Board page 35
This template shall not be altered. It shall be completed without modifying/adding headings or logo, format or font.
maintenance for the construction equipments and transportation vehicles, and tightening administrative control and overall management at the site. Solid Waste The total amount of spoil as the only solid waste of the Project will very small, and can be used for backfilling turbine foundation platform and building temporary roads. Therefore, impact of solid waste on the environment is considered to be insignificant. At the same, the side pilings of the spoil, if any, during the construction, will be sheltered to avoid soil run-off. Ecological Impact
The Project will be located within the Project site area of the Qingshan Grass Farm where there is no reported state-protected wild animal. Ecological impacts are negligible. Operation Phase Noise
The sources of noise emitted from operating turbine include the rotation of mechanical and electrical equipment and aerodynamic noise originating from the flow of air around the blade. The noise pollution from operating turbines is minimal to local residents as the propose project is sited far from residential areas. Interference with Communications
Based on the survey of residents residing close to the existing wind power projects, there is no reported case of electromagnetic wave interfering with television and radio broadcasting as well as other electrical appliances. It can be concluded that interference with communication is highly unlikely to arise from this project. In conclusion, environmental impacts arising from this project are considered insignificant.
F.2. If environmental impacts are considered significant by the project participants or the host Party, please provide conclusions and all references to support documentation of an environmental impact assessment undertaken in accordance with the procedures as required by the host Party: >> Impacts are not considered significant
PROJECT DESIGN DOCUMENT FORM (CDM PDD) - Version 02
CDM – Executive Board page 36
This template shall not be altered. It shall be completed without modifying/adding headings or logo, format or font.
SECTION G. Stakeholders’ comments
G.1. Brief description how comments by local stakeholders have been invited and compiled: >> In July 2005, staff from the Huaneng New Energy Industrial Co. Ltd carried out a survey of the local residents in the area where the Project will be sited. Some governments of Taobei District issued a support letter for the project - see G.2. below.
G.2. Summary of the comments received: >> The stakeholders’ comments are summarized as follows: In July 2005, staff from the Huaneng International Power Development Co. Ltd. carried out a survey of the local villagers in the area where the Project will be sited. The survey was conducted through distributing and collecting responses to a questionnaire.
The 1 page questionnaire contains the following sections:
1) Project introduction 2) Respondent’s basic information and education level 3) Questions on:
� How do they feel about their surrounding environment? � How much familiarity do they have with wind power projects? � What is their attitude towards the existing wind farms in the area? � What are the positive impacts the project will have on their livelihood? � What are the negative impacts the project will have on their livelihood? � Among the perceived negative impacts, what are considered the most important, somewhat
important and the least important? � What are the measures that can be taken to mitigate the negative impacts? � Will the overall impact of the project on their livelihood be positive, negative or negligible? � What other comments and suggestions do they have regarding the project?
4) Signature and date The survey had a 96.7% response rate (29 questionnaires returned out of 30). The following is a summary of the key findings: � Education level of the respondents: primary level (63.3%), middle level (10%), high level (26.6%) � 66.6% of the respondents are satisfied with their life condition and surrounding environment, 33.3%
are not too satisfied; two respondents expressed their dissatisfaction towards the low salary � Most respondents (66.6%) have some understanding of wind power projects while 26.6% has
thorough understanding of wind power projects. Two have never heard of wind power projects. � 93.3% of the respondents support the existing wind farms in the area; the other one has no opinion. � Among the positive impacts the project will have on the respondents’ livelihoods, “improvement of
standard of living” accounts for the highest percentage (100%), followed by “improvement of air quality” (90%), “decrease of tariff” (86.7%), “increase of income” (76.6%) and “increase of job opportunities”(63.3%).
� 34.5% of the respondents deemed that the project may have minor negative impacts on their livelihoods while the rest expressed no opinion. Among the negative impacts mentioned, the main concerns were the impacts on the natural environment (50%), land use impacts (46.6%), noise (23.3%)

PROJECT DESIGN DOCUMENT FORM (CDM PDD) - Version 02
CDM – Executive Board page 37
This template shall not be altered. It shall be completed without modifying/adding headings or logo, format or font.
and interferences with TV and other communication systems (20%). Two respondents raised their concerns on the increasing amount of solid waste and wastewater discharge at the construction phase of the Project.
� Two respondents hope that the Project activity can increase the electricity supply to agriculture � 100% of the respondents deemed that the project will have overall positive impacts on their
livelihoods. � 100% of the respondents supported the construction of the project.
Conclusion The survey shows that the Project receives very strong support from local people. This is closely linked to the fact that the majority of local villagers have had some familiarity with wind power projects and they hold highly positive attitude towards the existing wind farms in the region. The respondents generally deem that the project will improve their standard of living and bring them multiple benefits. Among the negative impacts, the increasing amount of solid waste and the increasing amount of wastewater discharge at the construction phase of the Project seem to be the prominent issues. However, as the environmental impact assessment demonstrates, both impacts only occur at the construction phase of the project. Thus, these impacts will be minimized after the construction finishes. The other main issues are noise and interference with communication signals e.g. TV and radio. Since there is no residential area located near the Project and the impacts (if any) can be effectively mitigated by some measures, noise and interferences with communication systems are, as a matter of fact, perceived issues rather than real problems. The District governments of Taobei issued a support letter for the project as below.
PROJECT DESIGN DOCUMENT FORM (CDM PDD) - Version 02
CDM – Executive Board page 38
This template shall not be altered. It shall be completed without modifying/adding headings or logo, format or font.
G.3. Report on how due account was taken of any comments received: The residents and local government are all very supportive of the Project therefore there has been no need to modify the project due to the comments received.
Translation of support letter from the local government with regard to the Project To whom it may concern, We are aware that a 49.3MW wind power project will be developed by the Huaneng New Energy Industrial Co. Ltd. in our District. Through thorough investigation and discussion, we deem that:
1) Wind power, as a type of clean energy, emits significantly less pollutants compared with fuel-fired power therefore does no harm to the local ecological environment;
2) The project can supply a proportion of the electricity that would otherwise by provided by coal-fired power plants therefore help reduce environmental pollution;
3) The construction and operation of the project can accelerate the development of transportation, construction material, and construction-related industries in the District driving its economy forward;
4) Since turbines are often perceived as attractive, the project can promote the development of the tourism of the county;
5) The project demonstrates that the construction and operation of wind power projects can be facilitated through an international environment cooperation mechanism, known as the clean development mechanism, therefore further promotes the wind power development in the region.
To summarize, we have no doubt that the project will be conducive to the improvement of energy mix, the improvement of overall environmental quality of the northeast region, and benefit the development of wind power industry in Taobei. We fully support the development and implementation of the project. The District Government of Taobei, Baicheng City Bureau of Finance, Taobei District, Baicheng City Planning Commission, Taobei District , Baicheng City Bureau of Tourism, Taobei District, Baicheng City Bureau of Environmental Protection, Taobei Distric, Baicheng City t Bureau of Taxation, Taobei District, Baicheng City Power Supply Company, Baicheng City
(Stamp)
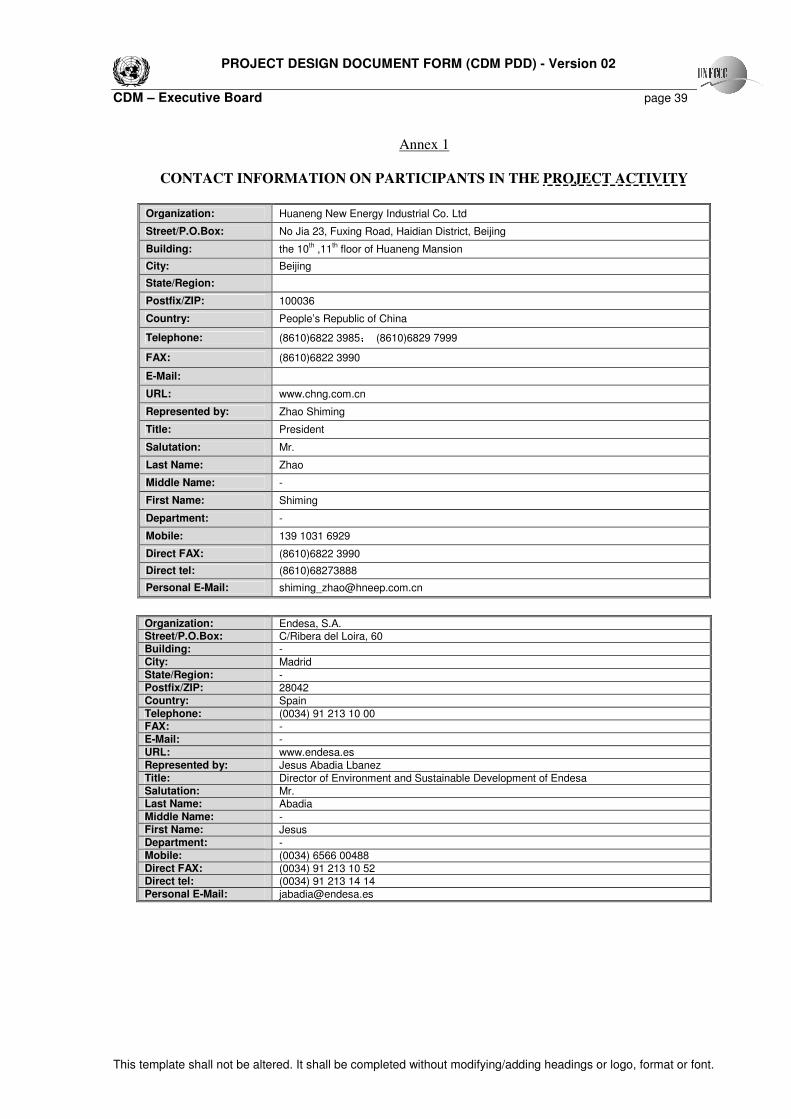
PROJECT DESIGN DOCUMENT FORM (CDM PDD) - Version 02
CDM – Executive Board page 39
This template shall not be altered. It shall be completed without modifying/adding headings or logo, format or font.
Annex 1
CONTACT INFORMATION ON PARTICIPANTS IN THE PROJECT ACTIVITY
Organization: Huaneng New Energy Industrial Co. Ltd
Street/P.O.Box: No Jia 23, Fuxing Road, Haidian District, Beijing
Building: the 10th ,11
th floor of Huaneng Mansion
City: Beijing
State/Region:
Postfix/ZIP: 100036
Country: People’s Republic of China
Telephone: (8610)6822 3985� (8610)6829 7999
FAX: (8610)6822 3990
E-Mail:
URL: www.chng.com.cn
Represented by: Zhao Shiming
Title: President
Salutation: Mr.
Last Name: Zhao
Middle Name: -
First Name: Shiming
Department: -
Mobile: 139 1031 6929
Direct FAX: (8610)6822 3990
Direct tel: (8610)68273888
Personal E-Mail: [email protected]
Organization: Endesa, S.A. Street/P.O.Box: C/Ribera del Loira, 60 Building: - City: Madrid State/Region: - Postfix/ZIP: 28042 Country: Spain Telephone: (0034) 91 213 10 00 FAX: - E-Mail: - URL: www.endesa.es Represented by: Jesus Abadia Lbanez Title: Director of Environment and Sustainable Development of Endesa Salutation: Mr. Last Name: Abadia Middle Name: - First Name: Jesus Department: - Mobile: (0034) 6566 00488 Direct FAX: (0034) 91 213 10 52 Direct tel: (0034) 91 213 14 14 Personal E-Mail: [email protected]

PROJECT DESIGN DOCUMENT FORM (CDM PDD) - Version 02
CDM – Executive Board page 40
This template shall not be altered. It shall be completed without modifying/adding headings or logo, format or font.
The following are the contact details for the other Parties involved:
Organization: Green Capital Consulting Company Street/P.O.Box: No 39 , East Thee-Ring Road, Building: Suit 1503, Building 8, Jianwai SOHO Plaza City: Beijing State/Region: Postfix/ZIP: 100022 Country: People’s Republic of China Telephone: (8610) 5869 3461 FAX: (8610) 5869 3463 E-Mail: [email protected] URL: www.co2-china.com Represented by: Victoria Qi Wang Title: CEO Salutation: Ms Last Name: Wang Middle Name: Qi First Name: Victoria Department: - Mobile: 1360 126 4769 Direct FAX: - Direct tel: - Personal E-Mail: [email protected]

PROJECT DESIGN DOCUMENT FORM (CDM PDD) - Version 02
CDM – Executive Board page 41
This template shall not be altered. It shall be completed without modifying/adding headings or logo, format or font.
Annex 2
INFORMATION REGARDING PUBLIC FUNDING There is no public funding from Annex I Part(ies) for the Project.
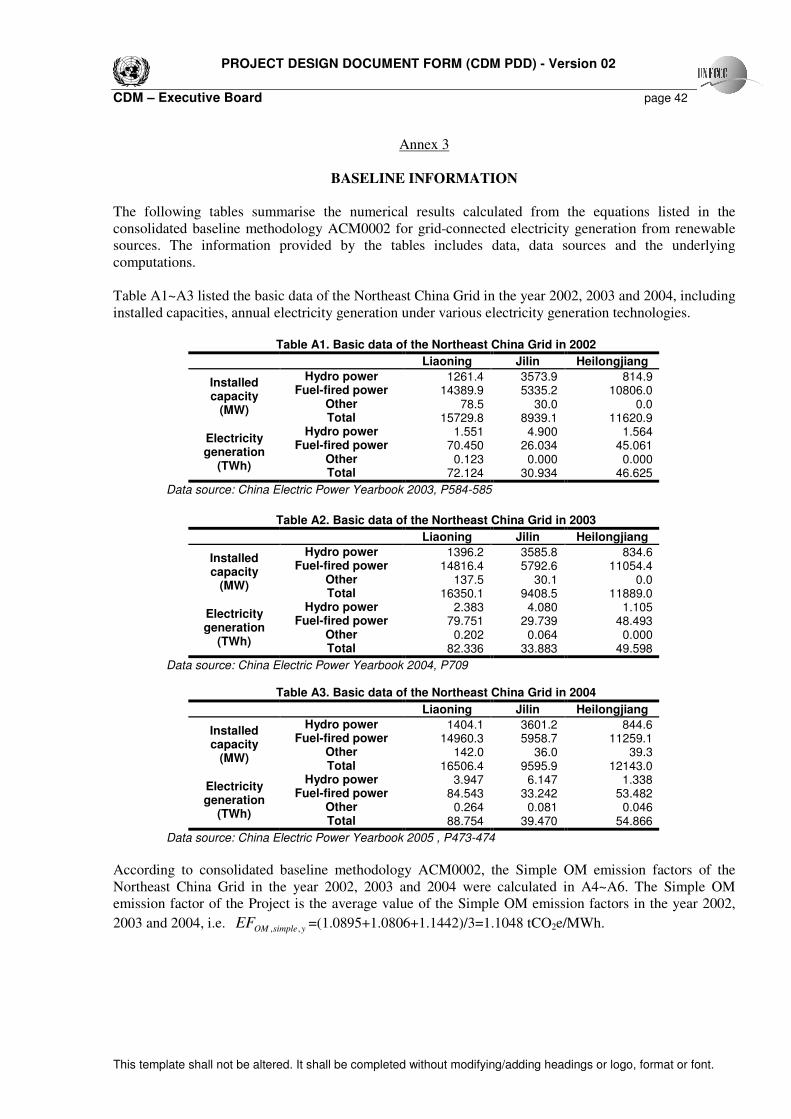
PROJECT DESIGN DOCUMENT FORM (CDM PDD) - Version 02
CDM – Executive Board page 42
This template shall not be altered. It shall be completed without modifying/adding headings or logo, format or font.
Annex 3
BASELINE INFORMATION
The following tables summarise the numerical results calculated from the equations listed in the consolidated baseline methodology ACM0002 for grid-connected electricity generation from renewable sources. The information provided by the tables includes data, data sources and the underlying computations. Table A1~A3 listed the basic data of the Northeast China Grid in the year 2002, 2003 and 2004, including installed capacities, annual electricity generation under various electricity generation technologies.
Table A1. Basic data of the Northeast China Grid in 2002
Liaoning Jilin Heilongjiang
Hydro power 1261.4 3573.9 814.9 Fuel-fired power 14389.9 5335.2 10806.0
Other 78.5 30.0 0.0
Installed capacity
(MW) Total 15729.8 8939.1 11620.9
Hydro power 1.551 4.900 1.564 Fuel-fired power 70.450 26.034 45.061
Other 0.123 0.000 0.000
Electricity generation
(TWh) Total 72.124 30.934 46.625
Data source: China Electric Power Yearbook 2003, P584-585
Table A2. Basic data of the Northeast China Grid in 2003
Liaoning Jilin Heilongjiang
Hydro power 1396.2 3585.8 834.6 Fuel-fired power 14816.4 5792.6 11054.4
Other 137.5 30.1 0.0
Installed capacity
(MW) Total 16350.1 9408.5 11889.0
Hydro power 2.383 4.080 1.105 Fuel-fired power 79.751 29.739 48.493
Other 0.202 0.064 0.000
Electricity generation
(TWh) Total 82.336 33.883 49.598
Data source: China Electric Power Yearbook 2004, P709
Table A3. Basic data of the Northeast China Grid in 2004
Liaoning Jilin Heilongjiang
Hydro power 1404.1 3601.2 844.6 Fuel-fired power 14960.3 5958.7 11259.1
Other 142.0 36.0 39.3
Installed capacity
(MW) Total 16506.4 9595.9 12143.0
Hydro power 3.947 6.147 1.338 Fuel-fired power 84.543 33.242 53.482
Other 0.264 0.081 0.046
Electricity generation
(TWh) Total 88.754 39.470 54.866
Data source: China Electric Power Yearbook 2005 , P473-474
According to consolidated baseline methodology ACM0002, the Simple OM emission factors of the Northeast China Grid in the year 2002, 2003 and 2004 were calculated in A4~A6. The Simple OM emission factor of the Project is the average value of the Simple OM emission factors in the year 2002,
2003 and 2004, i.e. ysimpleOMEF ,, =(1.0895+1.0806+1.1442)/3=1.1048 tCO2e/MWh.
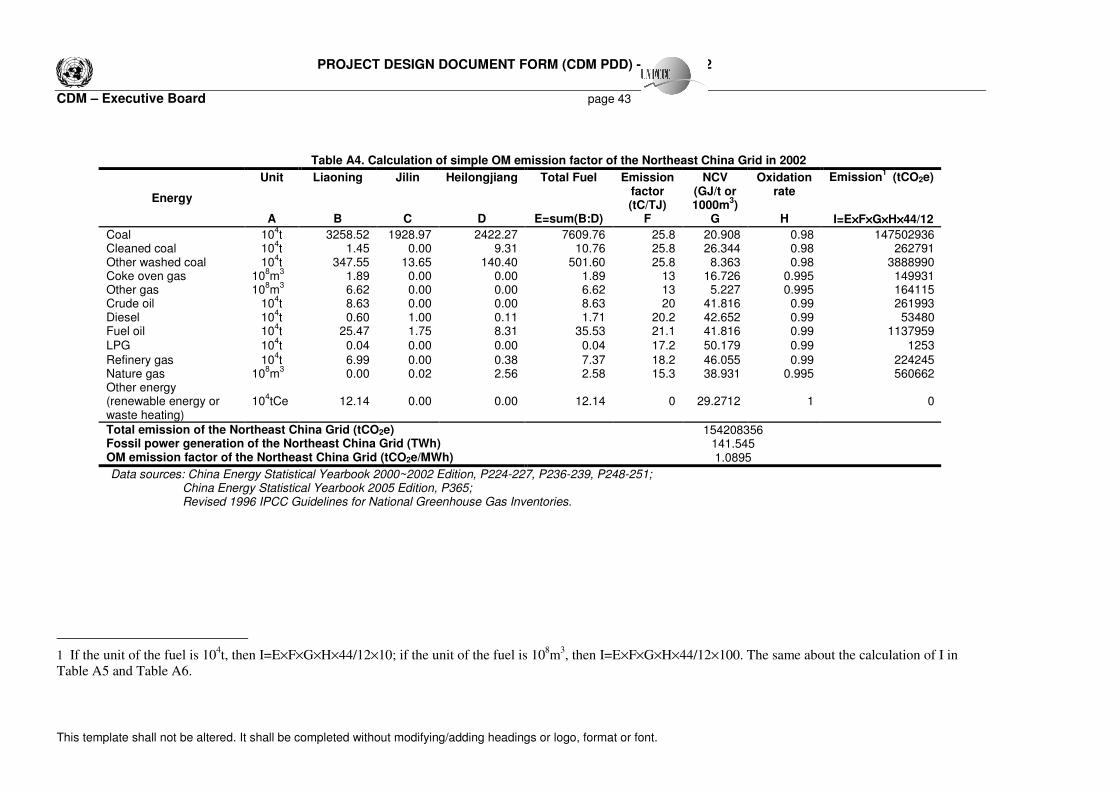
PROJECT DESIGN DOCUMENT FORM (CDM PDD) - Version 02
CDM – Executive Board page 43
This template shall not be altered. It shall be completed without modifying/adding headings or logo, format or font.
Table A4. Calculation of simple OM emission factor of the Northeast China Grid in 2002
Energy
Unit
A
Liaoning
B
Jilin
C
Heilongjiang
D
Total Fuel
E=sum(B:D)
Emission factor (tC/TJ)
F
NCV (GJ/t or 1000m
3)
G
Oxidation rate
H
Emission1 (tCO2e)
I=E××××F××××G××××H××××44/12
Coal 104t 3258.52 1928.97 2422.27 7609.76 25.8 20.908 0.98 147502936
Cleaned coal 104t 1.45 0.00 9.31 10.76 25.8 26.344 0.98 262791
Other washed coal 104t 347.55 13.65 140.40 501.60 25.8 8.363 0.98 3888990
Coke oven gas 108m
3 1.89 0.00 0.00 1.89 13 16.726 0.995 149931
Other gas 108m
3 6.62 0.00 0.00 6.62 13 5.227 0.995 164115
Crude oil 104t 8.63 0.00 0.00 8.63 20 41.816 0.99 261993
Diesel 104t 0.60 1.00 0.11 1.71 20.2 42.652 0.99 53480
Fuel oil 104t 25.47 1.75 8.31 35.53 21.1 41.816 0.99 1137959
LPG 104t 0.04 0.00 0.00 0.04 17.2 50.179 0.99 1253
Refinery gas 104t 6.99 0.00 0.38 7.37 18.2 46.055 0.99 224245
Nature gas 108m
3 0.00 0.02 2.56 2.58 15.3 38.931 0.995 560662
Other energy (renewable energy or waste heating)
104tCe 12.14 0.00 0.00 12.14 0 29.2712 1 0
Total emission of the Northeast China Grid (tCO2e) 154208356 Fossil power generation of the Northeast China Grid (TWh) 141.545 OM emission factor of the Northeast China Grid (tCO2e/MWh) 1.0895
Data sources: China Energy Statistical Yearbook 2000~2002 Edition, P224-227, P236-239, P248-251; China Energy Statistical Yearbook 2005 Edition, P365;
Revised 1996 IPCC Guidelines for National Greenhouse Gas Inventories.
1 If the unit of the fuel is 104t, then I=E×F×G×H×44/12×10; if the unit of the fuel is 10
8m
3, then I=E×F×G×H×44/12×100. The same about the calculation of I in
Table A5 and Table A6.
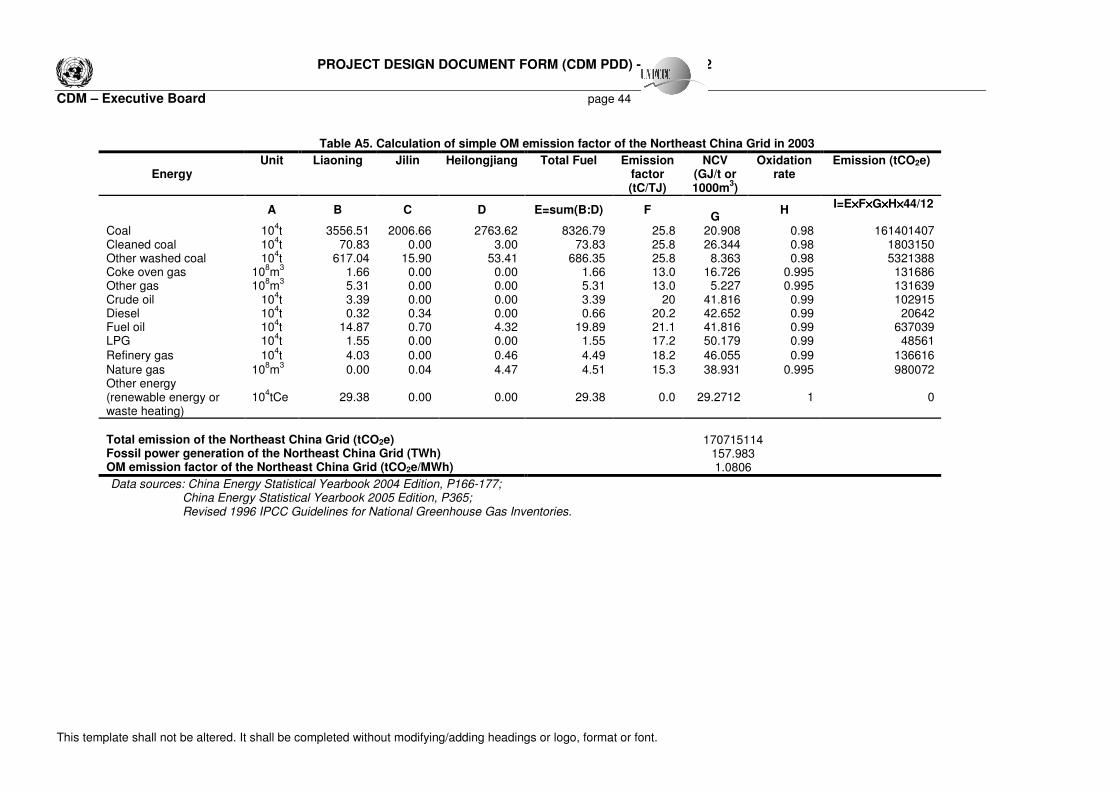
PROJECT DESIGN DOCUMENT FORM (CDM PDD) - Version 02
CDM – Executive Board page 44
This template shall not be altered. It shall be completed without modifying/adding headings or logo, format or font.
Table A5. Calculation of simple OM emission factor of the Northeast China Grid in 2003
Energy Unit
Liaoning
Jilin
Heilongjiang
Total Fuel
Emission factor (tC/TJ)
NCV (GJ/t or 1000m
3)
Oxidation rate
Emission (tCO2e)
A B C D E=sum(B:D) F
G H
I=E××××F××××G××××H××××44/12
Coal 104t 3556.51 2006.66 2763.62 8326.79 25.8 20.908 0.98 161401407
Cleaned coal 104t 70.83 0.00 3.00 73.83 25.8 26.344 0.98 1803150
Other washed coal 104t 617.04 15.90 53.41 686.35 25.8 8.363 0.98 5321388
Coke oven gas 108m
3 1.66 0.00 0.00 1.66 13.0 16.726 0.995 131686
Other gas 108m
3 5.31 0.00 0.00 5.31 13.0 5.227 0.995 131639
Crude oil 104t 3.39 0.00 0.00 3.39 20 41.816 0.99 102915
Diesel 104t 0.32 0.34 0.00 0.66 20.2 42.652 0.99 20642
Fuel oil 104t 14.87 0.70 4.32 19.89 21.1 41.816 0.99 637039
LPG 104t 1.55 0.00 0.00 1.55 17.2 50.179 0.99 48561
Refinery gas 104t 4.03 0.00 0.46 4.49 18.2 46.055 0.99 136616
Nature gas 108m
3 0.00 0.04 4.47 4.51 15.3 38.931 0.995 980072
Other energy (renewable energy or waste heating)
104tCe 29.38 0.00 0.00 29.38 0.0 29.2712 1 0
Total emission of the Northeast China Grid (tCO2e) 170715114 Fossil power generation of the Northeast China Grid (TWh) 157.983 OM emission factor of the Northeast China Grid (tCO2e/MWh) 1.0806
Data sources: China Energy Statistical Yearbook 2004 Edition, P166-177; China Energy Statistical Yearbook 2005 Edition, P365;
Revised 1996 IPCC Guidelines for National Greenhouse Gas Inventories.
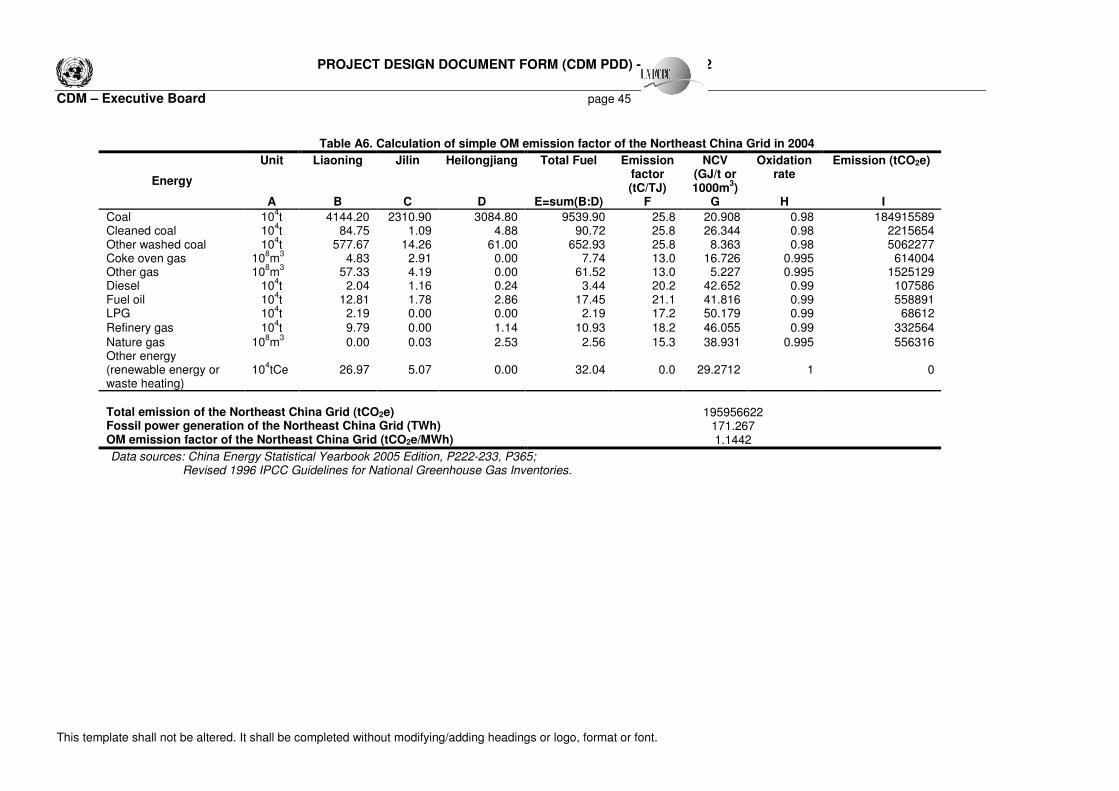
PROJECT DESIGN DOCUMENT FORM (CDM PDD) - Version 02
CDM – Executive Board page 45
This template shall not be altered. It shall be completed without modifying/adding headings or logo, format or font.
Table A6. Calculation of simple OM emission factor of the Northeast China Grid in 2004
Energy
Unit
A
Liaoning
B
Jilin
C
Heilongjiang
D
Total Fuel
E=sum(B:D)
Emission factor (tC/TJ)
F
NCV (GJ/t or 1000m
3)
G
Oxidation rate
H
Emission (tCO2e) I
Coal 104t 4144.20 2310.90 3084.80 9539.90 25.8 20.908 0.98 184915589
Cleaned coal 104t 84.75 1.09 4.88 90.72 25.8 26.344 0.98 2215654
Other washed coal 104t 577.67 14.26 61.00 652.93 25.8 8.363 0.98 5062277
Coke oven gas 108m
3 4.83 2.91 0.00 7.74 13.0 16.726 0.995 614004
Other gas 108m
3 57.33 4.19 0.00 61.52 13.0 5.227 0.995 1525129
Diesel 104t 2.04 1.16 0.24 3.44 20.2 42.652 0.99 107586
Fuel oil 104t 12.81 1.78 2.86 17.45 21.1 41.816 0.99 558891
LPG 104t 2.19 0.00 0.00 2.19 17.2 50.179 0.99 68612
Refinery gas 104t 9.79 0.00 1.14 10.93 18.2 46.055 0.99 332564
Nature gas 108m
3 0.00 0.03 2.53 2.56 15.3 38.931 0.995 556316
Other energy (renewable energy or waste heating)
104tCe 26.97 5.07 0.00 32.04 0.0 29.2712 1 0
Total emission of the Northeast China Grid (tCO2e) 195956622 Fossil power generation of the Northeast China Grid (TWh) 171.267 OM emission factor of the Northeast China Grid (tCO2e/MWh) 1.1442
Data sources: China Energy Statistical Yearbook 2005 Edition, P222-233, P365; Revised 1996 IPCC Guidelines for National Greenhouse Gas Inventories.
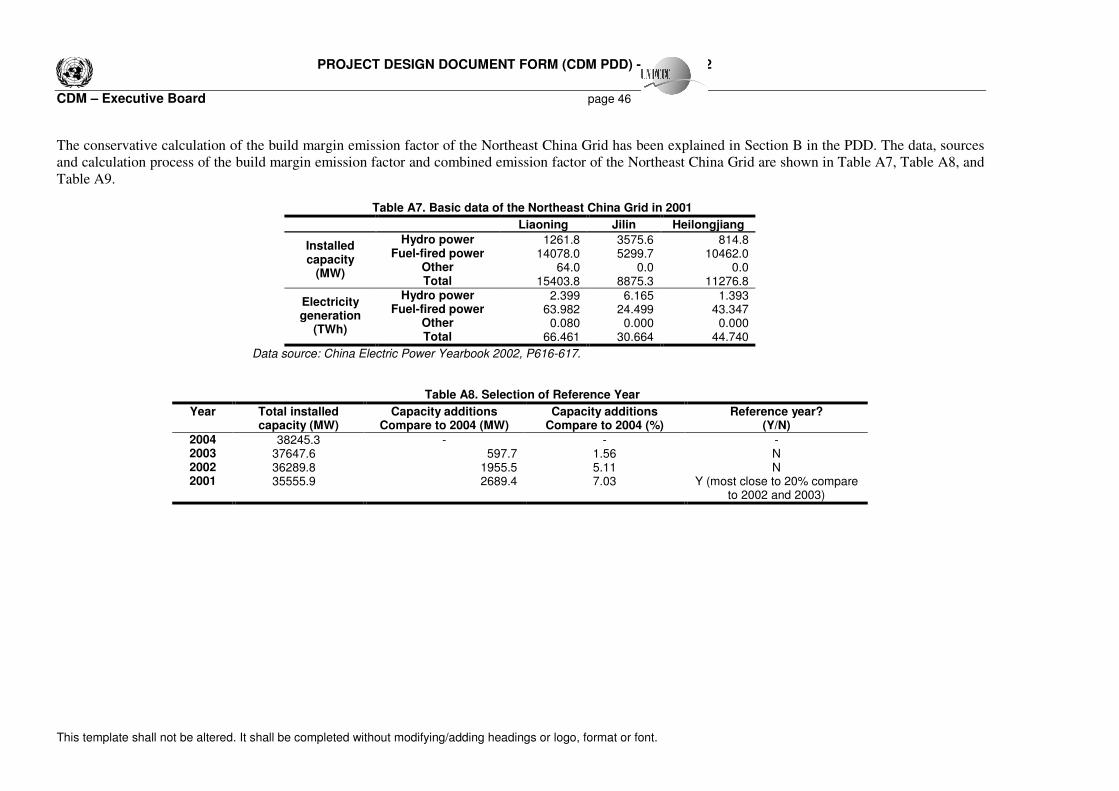
PROJECT DESIGN DOCUMENT FORM (CDM PDD) - Version 02
CDM – Executive Board page 46
This template shall not be altered. It shall be completed without modifying/adding headings or logo, format or font.
The conservative calculation of the build margin emission factor of the Northeast China Grid has been explained in Section B in the PDD. The data, sources and calculation process of the build margin emission factor and combined emission factor of the Northeast China Grid are shown in Table A7, Table A8, and Table A9.
Table A7. Basic data of the Northeast China Grid in 2001
Liaoning Jilin Heilongjiang
Hydro power 1261.8 3575.6 814.8 Fuel-fired power 14078.0 5299.7 10462.0
Other 64.0 0.0 0.0
Installed capacity
(MW) Total 15403.8 8875.3 11276.8
Hydro power 2.399 6.165 1.393 Fuel-fired power 63.982 24.499 43.347
Other 0.080 0.000 0.000
Electricity generation
(TWh) Total 66.461 30.664 44.740
Data source: China Electric Power Yearbook 2002, P616-617.
Table A8. Selection of Reference Year
Year Total installed capacity (MW)
Capacity additions Compare to 2004 (MW)
Capacity additions Compare to 2004 (%)
Reference year? (Y/N)
2004 38245.3 - - - 2003 37647.6 597.7 1.56 N 2002 36289.8 1955.5 5.11 N 2001 35555.9 2689.4 7.03 Y (most close to 20% compare
to 2002 and 2003)

PROJECT DESIGN DOCUMENT FORM (CDM PDD) - Version 02
CDM – Executive Board page 47
This template shall not be altered. It shall be completed without modifying/adding headings or logo, format or font.
Table A9. Calculation of build margin emission factor and combined emission factor of the Northeast China Grid
Change in installed capacity
(2004 compared to 2001, MW)
Best commercially available power generation technology in China
(600MW sub-critical coal-fired power plant)
Hydro power 197.7
Fossil fuel-fired power 2338.4
Other 153.3
Total 2689.4
Fuel-fried electricity capacity share
0.86949
Coal consumed by power generation: 320 gCe/kWh Emission factor: 0.8684 tCO2e/MWh
(Calculated as:
320 gCe/kWh = 0.32 tCe/MWh 0.32 tCe/MWh × 0.02927 TJ/t × 25.8 tC/TJ × 44/12 × 0.98 = 0.8684 tCO2e/MWh)
Build margin emission factor in the Northeast China Grid (tCO2e/MWh)
0.7551
Combined emission factor in the Northeast China Grid (tCO2e/MWh)
1.0174
Fuel-fried electricity capacity weights 0.86949 of capacity additions during 2001~2004, therefore build margin emission factor in the Northeast China Grid is calculated as BM=0.8684×0.86949=0.7551 (tCO2e/MWh).
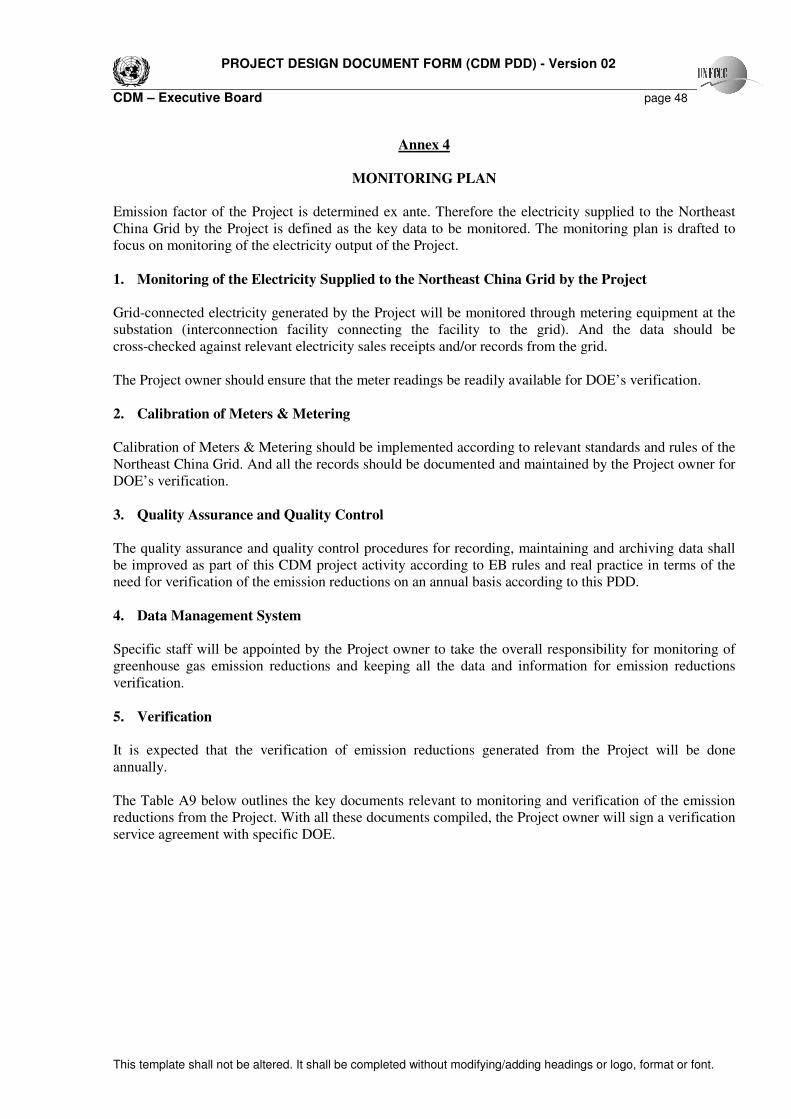
PROJECT DESIGN DOCUMENT FORM (CDM PDD) - Version 02
CDM – Executive Board page 48
This template shall not be altered. It shall be completed without modifying/adding headings or logo, format or font.
Annex 4
MONITORING PLAN
Emission factor of the Project is determined ex ante. Therefore the electricity supplied to the Northeast China Grid by the Project is defined as the key data to be monitored. The monitoring plan is drafted to focus on monitoring of the electricity output of the Project. 1. Monitoring of the Electricity Supplied to the Northeast China Grid by the Project Grid-connected electricity generated by the Project will be monitored through metering equipment at the substation (interconnection facility connecting the facility to the grid). And the data should be cross-checked against relevant electricity sales receipts and/or records from the grid. The Project owner should ensure that the meter readings be readily available for DOE’s verification.
2. Calibration of Meters & Metering Calibration of Meters & Metering should be implemented according to relevant standards and rules of the Northeast China Grid. And all the records should be documented and maintained by the Project owner for DOE’s verification. 3. Quality Assurance and Quality Control The quality assurance and quality control procedures for recording, maintaining and archiving data shall be improved as part of this CDM project activity according to EB rules and real practice in terms of the need for verification of the emission reductions on an annual basis according to this PDD. 4. Data Management System Specific staff will be appointed by the Project owner to take the overall responsibility for monitoring of greenhouse gas emission reductions and keeping all the data and information for emission reductions verification. 5. Verification It is expected that the verification of emission reductions generated from the Project will be done annually. The Table A9 below outlines the key documents relevant to monitoring and verification of the emission reductions from the Project. With all these documents compiled, the Project owner will sign a verification service agreement with specific DOE.
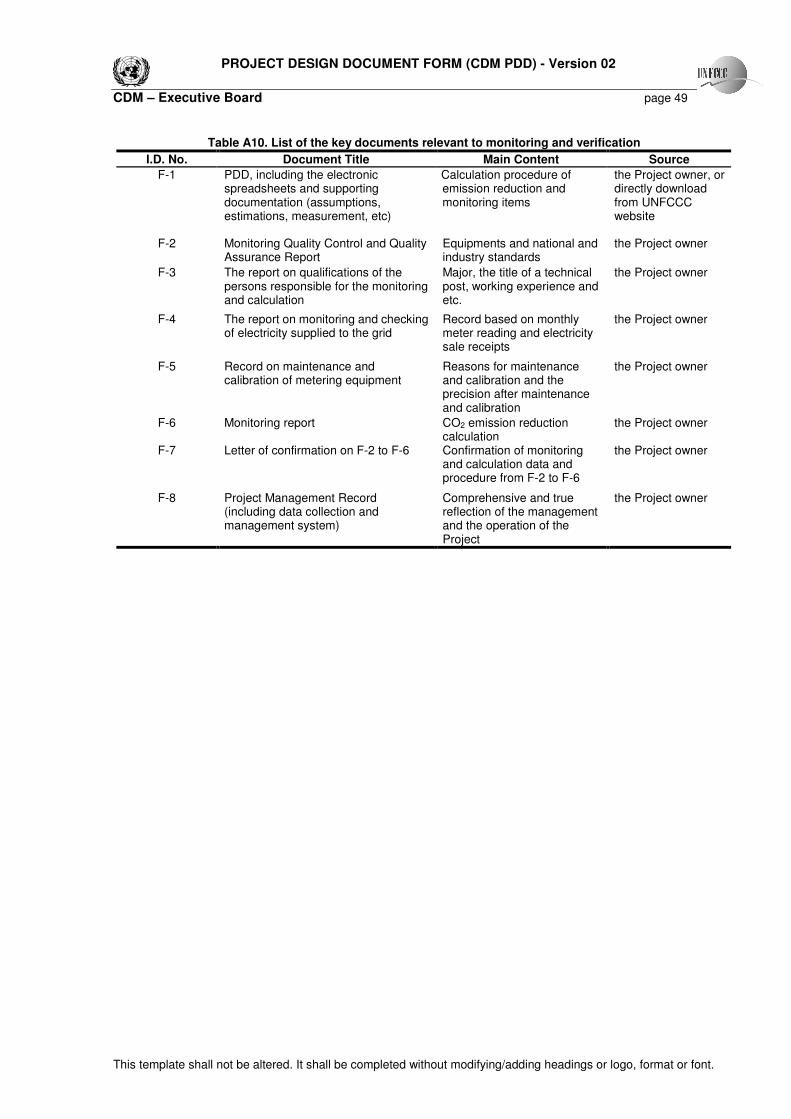
PROJECT DESIGN DOCUMENT FORM (CDM PDD) - Version 02
CDM – Executive Board page 49
This template shall not be altered. It shall be completed without modifying/adding headings or logo, format or font.
Table A10. List of the key documents relevant to monitoring and verification
I.D. No. Document Title Main Content Source
F-1 PDD, including the electronic spreadsheets and supporting documentation (assumptions, estimations, measurement, etc)
Calculation procedure of emission reduction and monitoring items
the Project owner, or directly download from UNFCCC website
F-2 Monitoring Quality Control and Quality Assurance Report
Equipments and national and industry standards
the Project owner
F-3 The report on qualifications of the persons responsible for the monitoring and calculation
Major, the title of a technical post, working experience and etc.
the Project owner
F-4 The report on monitoring and checking of electricity supplied to the grid
Record based on monthly meter reading and electricity sale receipts
the Project owner
F-5 Record on maintenance and calibration of metering equipment
Reasons for maintenance and calibration and the precision after maintenance and calibration
the Project owner
F-6 Monitoring report CO2 emission reduction calculation
the Project owner
F-7 Letter of confirmation on F-2 to F-6 Confirmation of monitoring and calculation data and procedure from F-2 to F-6
the Project owner
F-8 Project Management Record (including data collection and management system)
Comprehensive and true reflection of the management and the operation of the Project
the Project owner
PROJECT DESIGN DOCUMENT FORM (CDM PDD) - Version 02
CDM – Executive Board page 50
This template shall not be altered. It shall be completed without modifying/adding headings or logo, format or font.
Annex 5.
List of key abbreviations
CDM Clean Development Mechanism
CDM EB CDM Executive Board
CER Certified Emission Reduction
CO2e Carbon Dioxide Equivalent
DOE Designated Operation Entity
gCe gram of standard coal equivalent
gCe/KWh gram of standard coal equivalent per kilowatt-hour
gCO2/gCe gram of carbon dioxide per gram of standard coal
GHG Greenhouse Gas
GWh Gigawatt-hour
IRR Internal Rate of Return
KWh kilowatt-hour
Mt million tonnes
MW Megawatt
NCV Net Calorific Value
NDRC National Development and Reform Commission
MOST Ministry of Science and Technology
OM Operating Margin
O&M Operation and maintenance
PPA Power Purchase Agreement
RE Renewable Energy
TBD To Be Determined
TWh Terawatt-hour
t ton
VAT Value-added Tax
PROJECT DESIGN DOCUMENT FORM (CDM PDD) - Version 02
CDM – Executive Board page 51
This template shall not be altered. It shall be completed without modifying/adding headings or logo, format or font.
Reference IPCC (2000). Good Practice Guidance and Uncertainty Management in National Greenhouse Gas
Inventories. http://www.ipcc-nggip.iges.or.jp/public/gp/english/ IPCC (1996). Revised 1996 IPCC Guidelines for National Greenhouse Gas Inventories. http://www.ipcc-nggip.iges.or.jp/public/gl/invs1.htm The World Bank (2004). Clean Development Mechanism in China: taking proactive and sustainable
approach. Zheng Zhaoning, Liu Deshun (2004). Forecasting the investment cost of Wind power in China. Electric Power/Zhongguo Dianli. Vol.37, No.7, p77-80. Pan Tao, Liu Deshun (2004). CDM/JI Wind Power Project Status and China Opportunity. The 3rd World Wind Energy Conference & Renewable Energy Exhibition & the 2nd Wind Power Asia, Oct.31-Nov.4, 2004. Zhang Zhengmin (2002), incentive Policies Study of wind power in China, China Environment Press. Wang Zhanggui, Cui Rongqiang, Zhou Huang (2004). New Energy Power Generation Technology
Options (2nd edition). China Electric Power Press Project Design Document (PDD) of Huitengxile Windfarm Project. Available from http://cdm.unfccc.int/Projects/registered.html Project Design Document (PDD) of Zhangbei Manjing Windfarm Project, Available from http://www.dnv.com/certification/climatechange/Projects/ProjectList.asp?Country=China Project Design Document (PDD) of Wigton Wind Farm Project. Available from http://cdm.unfccc.int/Projects/registered.html Project Design Document (PDD) of the Gangwon Wind Park Project (GaWiP). Available from http://cdm.unfccc.int/ TÜV SUD Validation Report, of the Huitengxile Windfarm Project. Available from cdm.unfccc.int