Embed Size (px)
DESCRIPTION
tt
Citation preview

A Project On Activity Based Costing JK TYRES

CHAPTER-1
INTRODUCTION

INTRODUCTION
In materials management, the ABC analysis (or Selective Inventory Control) is an inventory categorization technique. ABC analysis divides an inventory into three categories- "A items" with very tight control and accurate records, "B items" with less tightly controlled and good records, and "C items" with the simplest controls possible and minimal records.
The ABC analysis provides a mechanism for identifying items that will have a significant impact on overall inventory cost, while also providing a mechanism for identifying different categories of stock that will require different management and controls.
The ABC analysis suggests that inventories of an organization are not of equal value. [2] Thus, the inventory is grouped into three categories (A, B, and C) in order of their estimated importance.
'A' items are very important for an organization. Because of the high value of these 'A' items, frequent value analysis is required. In addition to that, an organization needs to choose an appropriate order pattern (e.g. ‘Just- in- time’) to avoid excess capacity. 'B' items are important, but of course less important than 'A' items and more important than 'C' items. Therefore 'B' items are intergroup items. 'C' items are marginally important.
ABC analysis categories
There are no fixed threshold for each class, different proportion can be applied based on objective and criteria. ABC Analysis is similar to the Pareto principle in that the 'A' items will typically account for a large proportion of the overall value but a small percentage of number of items.
Example of ABC class are
‘A’ items – 20% of the items accounts for 70% of the annual consumption value of the items.
‘B’ items - 30% of the items accounts for 25% of the annual consumption value of the items.
‘C’ items - 50% of the items accounts for 5% of the annual consumption value of the items.
Another recommended breakdown of ABC classes:[4]
"A" approximately 10% of items or 66.6% of value
"B" approximately 20% of items or 23.3% of value
"C" approximately 70% of items or 10.1% of value

Distribution of ABC class
ABC classNumber of
itemsTotal amount required
A 10% 70%
B 20% 20%
C 70% 10%
Total 100% 100%

NEED &IMPORTANT OF THE STUDY
There are a number of problems that can cause havoc with inventory management. Some
happen more frequently than others. Here are some of the more common problems with
inventory systems.
Unqualified employees in charge of inventory, Using a measure of performance for their
business that is too narrow, Not identifying shortages ahead of time, Bottlenecks and weak points
can interfere with on-time product delivery, Too much distressed stock in inventory, Excessive
inventory in stock and unable to move it quickly enough, Computer assessment of inventory
items for sale is inaccurate, Computer inventory systems are too complicated , Items in-stock gets
misplaced, Not keeping up with the rising price of raw materials.

OBJECTIVES OF THE STUDY
To study the manufacturing of JK TYRES in Hyderabad 2014
To analyze the inventory those are sufficient to perform production and sales
activities smoothly.
To study the inventory management followed in JK TYRES in Hyderabad
To identify the existing inventory management and its effectiveness.
To calculate analysis for their performance in inventory management.

SCOPE OF THE STUDY
The study helps the management to improve its profitability through a reduction in non- moving
inventory.
It develops the policies for both continuous review of inventory management system.
The study helps to show the level of the inventory in the organization. The company will make
the proper inventory methods from the suggestions of the study.
RESEARCH METHODOLOGY
Research Design
The Descriptive type of research has been applied in the study. This research the
researcher has no control over the variables. Only reports what has happened or what is
happening. The research can only discover causes but cannot control the variables.
Data collection
This study purely based on secondary sources of information. The necessary data
calculated from annual report, books, journals and websites.
Period of study
This study covers a period of five years from 2010 -2014.
Area of study
This study was conducted in JK TYRES Hyderabad
Tools for analysis
The following tools have been applied in the present study.
They are listed below
Ration analysis (inventory)

CHAPTER-2
COMPANY
PROFILE&INDUSTRY
PROFILE

COMPANY PROFILE
VISION OF JK TYRES
“To be amongst the most admired companies in India commited to
excellence.”
MISSION OF JK TYRES
To be the largest & most profitable tyre company in india.
To retain No. 1 position in truck & bus segment & to be amongst top two in all
other 4-wheller tyre
To make truck/bus radial operations profitable & retain leadership in the
passenger radial market.
To be the largest indian tyre exporter. Continue to be a significant player in the
world in truck & bias market.
To be a customer obsessed company.
To enhance value to shareholders & service to all stakeholder.
We the people of J K TYRES will have an organisation committed to quality
in everything we do.
We will continuously anticipate and understand our customer’s
requirements, convert these into performance standards for our products and
services and meet these standards everytime. Full-customer satisfaction- both
internal and external- is our motto.
J K industries set up its first tyre plant at Jajkajgram near Udaypur,
Rajasthan in 1977. The plant with an installed capacity of 5 lakh tyres per annum
was established in technical collaboration with General Tire International co., U
S A.

As J K Tyre grew from strength to strength, demand for tyres increased
proportionally to meet this growing demand, the plant at Rajasthan was expanded
and by 1990. The plant was producing nearly 14 lakhs tyres per annum.
J K Tyre then went on to establish what is rated as the most modern plant in
India, a state of the art tyre plant in 1991, at Banmore near Gwalior, Madya
pradesh.
The plant deploys the most sophisticated techniques such as a Betaray
scanner, X-ray, units, computer controlled processing and tyre testing machines to
ensure a high quality of products. Both the plants have set standards of efficiency
and productivity in the tyre industry and have consistency operated at high
capacity utilisation with a total capacity of 28.13 lakhs tyres per annum.
J K Tyres focus on R & D the plants ensures not just the incorporation of
the latest technology in products but also helps in the development of new types
and sizes of tyres. With the strategic acquisitions of a controlling interest in
Vikrant Tyre Limited. The V T L plant at Mysore to contributes to J K Tyres
total production capacity at its plants, which amounts to 40 lakhs tyres per annum.
We believe that people are the biggest asset that a firm can possess. J K Tyre
offers unlimited opportunity for committed motivated individuals at all levels and
across a wide range of areas.

To ensure the same, J K Tyre has developed for its employees an
infrastructure consisting of: -
1) Regular upgradation of skill and practices
2) Management development programs
3) National and international training if you dream of working for a
globally growing
Corporation that encourages excellence rewards merit and initiative.
Vast in its operations and massive in its seal of activities JK Industries is a
mega corporate entity that is emblematic excellence diversification and pioneering
new technologies.
A part of J K Organisation that ranks among the top private groups in India,
J K Industries is committed to self-reliance and follow an ethic that views customer
satisfaction as an index of achievement.
Aside from J K Tyre, the flagship brand of the corporation, J K Industries includes:
-
JK Sugar – The manufacturer of the best quality sugar in the country.

JK Agrigenetics – The Company that is revolutionizing Indian agriculture
through its research and production of pest-resistant and high yield hybrid seeds
and crops.
J K International: - A diversified trading house that exports a range of
products including textiles and leather goods, pharmaceuticals, tea, coffee,
spices, processed food and de-oiled cakes, to developed countries like USA, UK,
Canada, Germany, Netherlands and to countries in the middle east, west Asia.

3.2 WHAT IS J K TYRE: -
1) It is the leading manufacturer of Radial tyres for both truck and car
2) It is the only supplier of the tyre for Mercedizs Benz
3) First to get the ISO 9001 certificate in the entire world for the entire
operation
4) 2nd largest manufacturer for 4 wheelers in India
5) 16th largest tyre manufacturer in the world
6) First Indian company to export for radials to Europe
7) First Indian company to export over 45 countries across Six Continents
8) First and only Indian company to get the ‘E’ mark Certificate
9) J K Tyre has 25-customer centers around the country.

10} J K Tyre the only Indian Company producing radials for the entire
ranges i.e., Trucks, buses, LCV’s and Cars.
J K Tyre supplies tyres to different cars they are as follows: -
Ambassador, Armada, Cielo GL, Cielo GLE, Contessa, Fiat UNO,
Ford Escort, Mahindra commander, Mahindra classic, Maruthi Esteem, Maruthi
Omni, Maruthi Gypsy, Maruthi Zen, Maruthi 800, Hyundai santro, Mercedise
Benz, Opel astra, Peugot GI and GLD, Premier padmni, Premier 118NE, TATA
Estate,
TATA Mobile, TATA Sierra, TATA sumo, Honda City, Mitsubishi lancer.
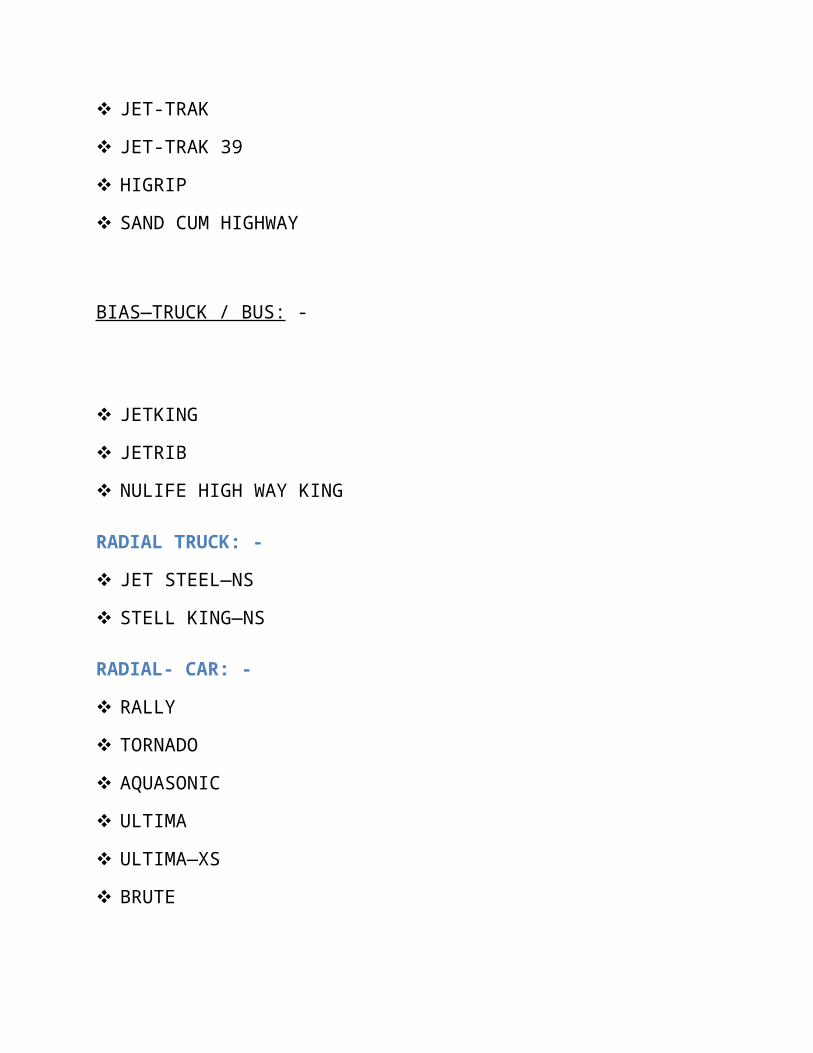
3.3 PRODUCT MIX OF JK TYRES: -
BIAS—TRUCK: -
JET-TRAK
JET-TRAK 39
HIGRIP
SAND CUM HIGHWAY
BIAS—TRUCK / BUS: -

JETKING
JETRIB
NULIFE HIGH WAY KING
RADIAL TRUCK: -
JET STEEL—NS
STELL KING—NS
RADIAL- CAR: -
RALLY
TORNADO
AQUASONIC
ULTIMA
ULTIMA—XS
BRUTE
JK TYRE launched the radial tyres because of the following advantages it gave to
its customer some of the advantages are as follows: -
1) J K Steel belted radials help in fuel saving
2) Retreated radials give better mileage than retreated ordinary bias tyres.
3) Radials enhance the comfort level while driving

4) Tyre can wear and tear the effect even if there is under –inflation
pressure.
ABOUT THE RALLY: -
J K Tyre has been largely responsible for promoting motor sports in India
and bringing it to the forefront of national consciousness a role the company
continues to play.
Our involvement extends to all levels from the grass roots to the professional
and encompasses rallying, racing, Go-karting. Family navigational rallies and
vintage car rallies, pioneer in developing motor car rally talent in the nation, J K
Tyre has the country’s most successful rally team.
THE DIFFERENT STANDARDS HELD BY THE J K TYRES: -
1. I S O 9001 Standard
2. Q C 9000 Standard
J K Tyre is the Ist tyre manufacturer in the world to get the ISO 9001
certificate in 1994 itself, for its entire operations, including marketing, design,
development, manufacturing, testing, stocking, distribution, sales and services of
conventional (bias) and radial tyres, tubes and flaps.

J K Tyre has become the only tyre manufacturer in India and the first tyre
manufacturer in the world to achieve the Q C 9000 for multi location operations, in
the year 1998.
J K Tyre is attaining another milestone in its plan of achieving TQM, i.e.,
Total Quality Management, and CII-EXIM award by 2000
THE DIFFERENT AWARDS HELD BY THE J K TYRE AND J K
INDUSTRIES ARE : -
National Export award
Brand Equity award
Capexil award (top export award)
CHAPTER-III
REVIEW OF LITERATURE

REVIEW OF LITERATURE
Every enterprise needs inventory for smooth running of its activities. It serves as a link between the
production and distribution process. The greater a time lag, the higher the requirement of inventory the
unforeseen fluctuation of inventory demand and supply of goods, fluctuating inventory prices, necessitate
the need for inventory management.
The investment inventory constitutes the most significant part of the current assets inventory of the under
taking. Thus it is very essential to have a proper control and management of inventory.
Meaning and nature of inventory
The general meaning of inventory is stock of goods or list of goods inventory. In accounting language it
means stock of finished goods. For inventory manufacturing concern it includes raw materials, work in
progress, consumables finished goods and spares etc.
1) Raw materials:
If forms a major input inventory in organization. The quantity of raw materials required will be
determined by the rate of consumption.
2) Work in Progress :
The work in progress is that stage of stocks, which are in between raw materials and finished goods.
3) Consumables :
These are the material, which are needed to smoothen, the process of production. These do not
directly go into production, but act as catalyst.

4) Finished Goods :
These are the goods, which are ready to sale for the consumers. The stock of finished goods
provides as buffer between production and market.
5) Spares: Spares also from a part of inventory. The stocking policies differ from industry to
industry.
Inventories cost account for nearly 55 percent of the cost of production, as it is clear from an
analysis of financial statements of large number of private and public sector organizations. So, It essential
to establish suitable procedures for proper control of materials from the time of purchase order placed
with supplier until they have been consumed properly and accounted for.
Definition:
The term inventory refers to assets, which will be sold in future in the normal course of business operations. The assets, which the firm stores as inventory in anticipation of need, are raw materials, work-in-progress/process, and finished goods.
Inventory often constitute a major element of a total working capital and hence ft has been correctly observed, 'Good inventory management is good financial management’.
Inventory control is a system, which ensures the provision of the required quantity at the required time with the minimum amount of capital.
Inventories are the second largest asset category for the manufacturing firms next to plant and equipment.
Inventory control includes scheduling, the requirements, purchasing, receiving and
inspecting, maintaining stock records and stock control. Inventory control is a matter of
coordination. A proper material control helps in improving the input-output ratio.
Objective of inventory management
The main objective of inventory management are operational and financial. The operational object means
availability of materials and spares in sufficient quantities for undisturbed flow of production. The
financial objective means investments in inventories should not remain idle and minimum working capital
should be locked in it.

DEFINITION
Inventory management is primarily about specifying the size and placement of stocked goods.
Inventory management is required at different locations within a facility or within multiple
locations of a supply network to protect the regular and planned course of production against the
random disturbance of running out of materials or goods. The scope of inventory management
also concerns the fine lines between replenishment lead time, carrying costs of inventory, asset
management, inventory forecasting, inventory valuation, inventory visibility, future inventory
price forecasting, physical inventory, available physical space for inventory, quality
management, replenishment, returns and defective goods and demand forecasting.
Or can be defined as the stock of any item used in an organization.
Business inventory
The reasons for keeping stock
There are three basic reasons for keeping an inventory:
Time - The time lags present in the supply chain, from supplier to user at every stage, requires
that you maintain certain amounts of inventory to use in this lead time. However, in practice,
inventory is to be maintained for consumption during 'variations in lead time'. Lead time itself
can be addressed by ordering that many days in advance.
Uncertainty - Inventories are maintained as buffers to meet uncertainties in demand, supply and
movements of goods.
Economies of scale - Ideal condition of "one unit at a time at a place where a user needs it, when
he needs it" principle tends to incur lots of costs in terms of logistics. So bulk buying, movement
and storing brings in economies of scale, thus inventory.
All these stock reasons can apply to any owner or product
Special terms used in dealing with inventory
Stock Keeping Unit (SKU) is a unique combination of all the components that are assembled
into the purchasable item. Therefore, any change in the packaging or product is a new SKU. This
level of detailed specification assists in managing inventory.
Stock out means running out of the inventory of an SKU
"New old stock" (sometimes abbreviated NOS) is a term used in business to refer to merchandise
being offered for sale that was manufactured long ago but that has never been used. Such

merchandise may not be produced anymore, and the new old stock may represent the only
market source of a particular item at the present time.
Typology
Buffer/safety stock
Cycle stock (Used in batch processes, it is the available inventory, excluding buffer stock)
De-coupling (Buffer stock held between the machines in a single process which serves as a
buffer for the next one allowing smooth flow of work instead of waiting the previous or next
machine in the same process)
Anticipation stock (Building up extra stock for periods of increased demand - e.g. ice cream for
summer)
Pipeline stock (Goods still in transit or in the process of distribution - have left the factory but
not arrived at the customer yet)
[edit]Inventory examples
While accountants often discuss inventory in terms of goods for sale, organizations -
manufacturers, service-providers and not-for-profits - also have inventories (fixtures, furniture,
supplies, etc.) that they do not intend to sell. Manufacturers', distributors', and wholesalers'
inventory tends to cluster in warehouses. Retailers' inventory may exist in a warehouse or in a
shop or store accessible to customers. Inventories not intended for sale to customers or to clients
may be held in any premises an organization uses. Stock ties up cash and, if uncontrolled, it will
be impossible to know the actual level of stocks and therefore impossible to control them.
While the reasons for holding stock were covered earlier, most manufacturing organizations
usually divide their "goods for sale" inventory into:
Raw materials - materials and components scheduled for use in making a product.
Work in process, WIP - materials and components that have began their transformation to
finished goods.
Finished goods - goods ready for sale to customers.
Goods for resale - returned goods that are salable.
For example:
Manufacturing
A canned food manufacturer's materials inventory includes the ingredients to form the foods to
be canned, empty cans and their lids (or coils of steel or aluminum for constructing those

components), labels, and anything else (solder, glue, etc.) that will form part of a finished can.
The firm's work in process includes those materials from the time of release to the work floor
until they become complete and ready for sale to wholesale or retail customers. This may be vats
of prepared food, filled cans not yet labeled or sub-assemblies of food components. It may also
include finished cans that are not yet packaged into cartons or pallets. Its finished good inventory
consists of all the filled and labeled cans of food in its warehouse that it has manufactured and
wishes to sell to food distributors (wholesalers), to grocery stores (retailers), and even perhaps to
consumers through arrangements like factory stores and outlet centers.
Principle of inventory proportionality
Purpose
Inventory proportionality is the goal of demand-driven inventory management. The primary
optimal outcome is to have the same number of days' (or hours', etc.) worth of inventory on hand
across all products so that the time of runout of all products would be simultaneous. In such a
case, there is no "excess inventory," that is, inventory that would be left over of another product
when the first product runs out. Excess inventory is sub-optimal because the money spent to
obtain it could have been utilized better elsewhere, i.e. to the product that just ran out.
The secondary goal of inventory proportionality is inventory minimization. By integrating
accurate demand forecasting with inventory management, rather than to past averages, a much
more accurate and optimal outcome.
Integrating demand forecasting into inventory management in this way also allows for the
prediction of the "can fit" point when inventory storage is limited on a per-product basis.
Applications
The technique of inventory proportionality is most appropriate for inventories that remain unseen
by the consumer, as opposed to "keep full" systems where a retail consumer would like to see
full shelves of the product they are buying so as not to think they are buying something old,
unwanted or stale; and differentiated from the "trigger point" systems where product is reordered
when it hits a certain level; inventory proportionality is used effectively by just-in-time
manufacturing processes and retail applications where the product is hidden from view.
One early example of inventory proportionality used in a retail application in the United States
was for motor fuel. Motor fuel (e.g. gasoline) is generally stored in underground storage tanks.
The motorists do not know whether they are buying gasoline off the top or bottom of the tank,

nor need they care. Additionally, these storage tanks have a maximum capacity and cannot be
overfilled. Finally, the product is expensive. Inventory proportionality is used to balance the
inventories of the different grades of motor fuel, each stored in dedicated tanks, in proportion to
the sales of each grade. Excess inventory is not seen or valued by the consumer, so it is simply
cash sunk (literally) into the ground. Inventory proportionality minimizes the amount of excess
inventory carried in underground storage tanks. This application for motor fuel was first
developed and implemented by Petrol soft Corporation in 1990 for Chevron Products Company.
Most major oil companies use such systems today
Roots
The use of inventory proportionality in the United States is thought to have been inspired by
Japanese just-in-time parts inventory management made famous by Toyota Motors in the 1980s.
[3]
[edit]High-level inventory management
It seems that around 1880[4] there was a change in manufacturing practice from companies with
relatively homogeneous lines of products to horizontally integrated companies with
unprecedented diversity in processes and products. Those companies (especially in
metalworking) attempted to achieve success through economies of scope - the gains of jointly
producing two or more products in one facility. The managers now needed information on the
effect of product-mix decisions on overall profits and therefore needed accurate product-cost
information. A variety of attempts to achieve this were unsuccessful due to the huge overhead of
the information processing of the time. However, the burgeoning need for financial reporting
after 1900 created unavoidable pressure for financial accounting of stock and the management
need to cost manage products became overshadowed. In particular, it was the need for audited
accounts that sealed the fate of managerial cost accounting. The dominance of financial reporting
accounting over management accounting remains to this day with few exceptions, and the
financial reporting definitions of 'cost' have distorted effective management 'cost' accounting
since that time. This is particularly true of inventory.
Hence, high-level financial inventory has these two basic formulas, which relate to the
accounting period:

Cost of Beginning Inventory at the start of the period + inventory purchases within the period +
cost of production within the period = cost of goods available
Cost of goods available − cost of ending inventory at the end of the period = cost of goods sold
The benefit of these formulas is that the first absorbs all overheads of production and raw
material costs into a value of inventory for reporting. The second formula then creates the new
start point for the next period and gives a figure to be subtracted from the sales price to
determine some form of sales-margin figure.
Manufacturing management is more interested in inventory turnover ratio or average days to sell
inventory since it tells them something about relative inventory levels.
Inventory turnover ratio (also known as inventory turns) = cost of goods sold / Average
Inventory = Cost of Goods Sold / ((Beginning Inventory + Ending Inventory) / 2)
and its inverse
Average Days to Sell Inventory = Number of Days a Year / Inventory Turnover Ratio = 365 days
a year / Inventory Turnover Ratio
This ratio estimates how many times the inventory turns over a year. This number tells how
much cash/goods are tied up waiting for the process and is a critical measure of process
reliability and effectiveness. So a factory with two inventory turns has six months stock on hand,
which is generally not a good figure (depending upon the industry), whereas a factory that moves
from six turns to twelve turns has probably improved effectiveness by 100%. This improvement
will have some negative results in the financial reporting, since the 'value' now stored in the
factory as inventory is reduced.
While these accounting measures of inventory are very useful because of their simplicity, they
are also fraught with the danger of their own assumptions. There are, in fact, so many things that
can vary hidden under this appearance of simplicity that a variety of 'adjusting' assumptions may
be used. These include:
Specific Identification
Weighted Average Cost
Moving-Average Cost
FIFO and LIFO.
Inventory Turn is a financial accounting tool for evaluating inventory and it is not necessarily a
management tool. Inventory management should be forward looking. The methodology applied

is based on historical cost of goods sold. The ratio may not be able to reflect the usability of
future production demand, as well as customer demand.
Business models, including Just in Time (JIT) Inventory, Vendor Managed Inventory (VMI) and
Customer Managed Inventory (CMI), attempt to minimize on-hand inventory and increase
inventory turns. VMI and CMI have gained considerable attention due to the success of third-
party vendors who offer added expertise and knowledge that organizations may not possess.
Accounting for inventory
Accountancy
Key concepts
Accountant Accounting period Accrual Bookkeeping Cash and accrual basis Cash flow
forecasting Chart of accounts Convergence Journal Special journals Constant item purchasing
power accounting Cost of goods sold Credit terms Debits and credits Double-entry system Mark-
to-market accounting FIFO and LIFO GAAP / IFRS Management Accounting Principles
General ledger Goodwill Historical cost Matching principle Revenue recognition Trial balance
Fields of accounting
Cost Financial Forensic Fund Management Tax (U.S.)
Financial statements
Balance Sheet
Cash flow statement Income statement Statement of retained earnings Notes Management
discussion and analysis XBRL
Auditing
Auditor's report Control self-assessment Financial audit GAAS / ISA Internal audit Sarbanes–
Oxley Act
Accounting qualifications
CIA CA CPA CCA CGA CMA CAT CIIA IIA CTP
v t e
Each country has its own rules about accounting for inventory that fit with their financial-
reporting rules.
For example, organizations in the U.S. define inventory to suit their needs within US Generally
Accepted Accounting Practices (GAAP), the rules defined by the Financial Accounting
Standards Board (FASB) (and others) and enforced by the U.S. Securities and Exchange
Commission (SEC) and other federal and state agencies. Other countries often have similar
arrangements but with their own accounting standards and national agencies instead.
It is intentional that financial accounting uses standards that allow the public to compare firms'
performance, cost accounting functions internally to an organization and potentially with much
greater flexibility. A discussion of inventory from standard and Theory of Constraints-based
(throughput) cost accounting perspective follows some examples and a discussion of inventory
from a financial accounting perspective.
The internal costing/valuation of inventory can be complex. Whereas in the past most enterprises
ran simple, one-process factories, such enterprises are quite probably in the minority in the 21st
century. Where 'one process' factories exist, there is a market for the goods created, which
establishes an independent market value for the good. Today, with multistage-process
companies, there is much inventory that would once have been finished goods which is now held
as 'work in process' (WIP). This needs to be valued in the accounts, but the valuation is a
management decision since there is no market for the partially finished product. This somewhat
arbitrary 'valuation' of WIP combined with the allocation of overheads to it has led to some
unintended and undesirable results.
Financial accounting
An organization's inventory can appear a mixed blessing, since it counts as an asset on the
balance sheet, but it also ties up money that could serve for other purposes and requires
additional expense for its protection. Inventory may also cause significant tax expenses,
depending on particular countries' laws regarding depreciation of inventory, as in Thor Power
Tool Company v. Commissioner.
Inventory appears as a current asset on an organization's balance sheet because the organization
can, in principle, turn it into cash by selling it. Some organizations hold larger inventories than
their operations require in order to inflate their apparent asset value and their perceived
profitability.
In addition to the money tied up by acquiring inventory, inventory also brings associated costs
for warehouse space, for utilities, and for insurance to cover staff to handle and protect it from
fire and other disasters, obsolescence, shrinkage (theft and errors), and others. Such holding costs
can mount up: between a third and a half of its acquisition value per year.

Businesses that stock too little inventory cannot take advantage of large orders from customers if
they cannot deliver. The conflicting objectives of cost control and customer service often pit an
organization's financial and operating managers against its sales and marketing departments.
Salespeople, in particular, often receive sales-commission payments, so unavailable goods may
reduce their potential personal income. This conflict can be minimised by reducing production
time to being near or less than customers' expected delivery time. This effort, known as "Lean
production" will significantly reduce working capital tied up in inventory and reduce
manufacturing costs (See the Toyota Production System).
Role of inventory accounting
By helping the organization to make better decisions, the accountants can help the public sector
to change in a very positive way that delivers increased value for the taxpayer’s investment. It
can also help to incentivise progress and to ensure that reforms are sustainable and effective in
the long term, by ensuring that success is appropriately recognized in both the formal and
informal reward systems of the organization.
To say that they have a key role to play is an understatement. Finance is connected to most, if not
all, of the key business processes within the organization. It should be steering the stewardship
and accountability systems that ensure that the organization is conducting its business in an
appropriate, ethical manner. It is critical that these foundations are firmly laid. So often they are
the litmus test by which public confidence in the institution is either won or lost.
Finance should also be providing the information, analysis and advice to enable the
organizations’ service managers to operate effectively. This goes beyond the traditional
preoccupation with budgets – how much have we spent so far, how much do we have left to
spend? It is about helping the organization to better understand its own performance. That means
making the connections and understanding the relationships between given inputs – the resources
brought to bear – and the outputs and outcomes that they achieve. It is also about understanding
and actively managing risks within the organization and its activities.
[edit]FIFO vs. LIFO accounting
Main article: FIFO and LIFO accounting
When a merchant buys goods from inventory, the value of the inventory account is reduced by
the cost of goods sold (COGS). This is simple where the CoG has not varied across those held in
stock; but where it has, then an agreed method must be derived to evaluate it. For commodity
items that one cannot track individually, accountants must choose a method that fits the nature of
the sale. Two popular methods that normally exist are: FIFO and LIFO accounting (first in - first
out, last in - first out). FIFO regards the first unit that arrived in inventory as the first one sold.
LIFO considers the last unit arriving in inventory as the first one sold. Which method an
accountant selects can have a significant effect on net income and book value and, in turn, on
taxation. Using LIFO accounting for inventory, a company generally reports lower net income
and lower book value, due to the effects of inflation. This generally results in lower taxation.
Due to LIFO's potential to skew inventory value, UK GAAP and IAS have effectively banned
LIFO inventory accounting.
Standard cost accounting
Standard cost accounting uses ratios called efficiencies that compare the labour and materials
actually used to produce a good with those that the same goods would have required under
"standard" conditions. As long as actual and standard conditions are similar, few problems arise.
Unfortunately, standard cost accounting methods developed about 100 years ago, when labor
comprised the most important cost in manufactured goods. Standard methods continue to
emphasize labor efficiency even though that resource now constitutes a (very) small part of cost
in most cases.
Standard cost accounting can hurt managers, workers, and firms in several ways. For example, a
policy decision to increase inventory can harm a manufacturing manager's performance
evaluation. Increasing inventory requires increased production, which means that processes must
operate at higher rates. When (not if) something goes wrong, the process takes longer and uses
more than the standard labor time. The manager appears responsible for the excess, even though
s/he has no control over the production requirement or the problem.
In adverse economic times, firms use the same efficiencies to downsize, right size, or otherwise
reduce their labor force. Workers laid off under those circumstances have even less control over
excess inventory and cost efficiencies than their managers.
Many financial and cost accountants have agreed for many years on the desirability of replacing
standard cost accounting. They have not, however, found a successor.
Theory of constraints cost accounting
Eliyahu M. Goldratt developed the Theory of Constraints in part to address the cost-accounting
problems in what he calls the "cost world." He offers a substitute, called throughput accounting,

that uses throughput (money for goods sold to customers) in place of output (goods produced
that may sell or may boost inventory) and considers labor as a fixed rather than as a variable
cost. He defines inventory simply as everything the organization owns that it plans to sell,
including buildings, machinery, and many other things in addition to the categories listed here.
Throughput accounting recognizes only one class of variable costs: the truly variable costs, like
materials and components, which vary directly with the quantity produced
Finished goods inventories remain balance-sheet assets, but labor-efficiency ratios no longer
evaluate managers and workers. Instead of an incentive to reduce labor cost, throughput
accounting focuses attention on the relationships between throughput (revenue or income) on one
hand and controllable operating expenses and changes in inventory on the other.
National accounts
Inventories also play an important role in national accounts and the analysis of the business
cycle. Some short-term macroeconomic fluctuations are attributed to the inventory cycle.
]Distressed inventory
Also known as distressed or expired stock, distressed inventory is inventory whose potential to
be sold at a normal cost has passed or will soon pass. In certain industries it could also mean that
the stock is or will soon be impossible to sell. Examples of distressed inventory include products
that have reached their expiry date, or have reached a date in advance of expiry at which the
planned market will no longer purchase them (e.g. 3 months left to expiry), clothing that is
defective or out of fashion, music that is no longer popular and old newspapers or magazines. It
also includes computer or consumer-electronic equipment that is obsolete or discontinued and
whose manufacturer is unable to support it. One current example of distressed inventory is the
VHS format.[5]
In 2001, Cisco wrote off inventory worth US $2.25 billion due to duplicate orders.[6] This is one
of the biggest inventory write-offs in business history.
Inventory credit
Inventory credit refers to the use of stock, or inventory, as collateral to raise finance. Where
banks may be reluctant to accept traditional collateral, for example in developing countries
where land title may be lacking, inventory credit is a potentially important way of overcoming
financing constraints. This is not a new concept; archaeological evidence suggests that it was
practiced in Ancient Rome. Obtaining finance against stocks of a wide range of products held in

a bonded warehouse is common in much of the world. It is, for example, used with Parmesan
cheese in Italy.[7] Inventory credit on the basis of stored agricultural produce is widely used in
Latin American countries and in some Asian countries.[8] A precondition for such credit is that
banks must be confident that the stored product will be available if they need to call on the
collateral; this implies the existence of a reliable network of certified warehouses. Banks also
face problems in valuing the inventory. The possibility of sudden falls in commodity prices
means that they are usually reluctant to lend more than about 60% of the
USES OF INVENTORY TURNOVER ANALYSIS, ANALYSIS
It is helpful in assessing the stock position and productivity position of a concern. The main
objectives of a inventory turnover analysis are to assess
The present and future stock capacity of a concern.
To give corrective solution for the inventory problem.
To differentiates the investment with and invest without for purchasing of the raw
material
INVENTORY TURNOVER RATIOS
Inventory turnover ratio
A ratio showing how many times a company's inventory is sold and replaced over a period.
Inventory turnover period
How often interest is calculated and added on to your investment. If you have two conversion
periods, it means that interest is calculated every six months. The inventory conversion period
for calculate the interest for credit sales to their agents
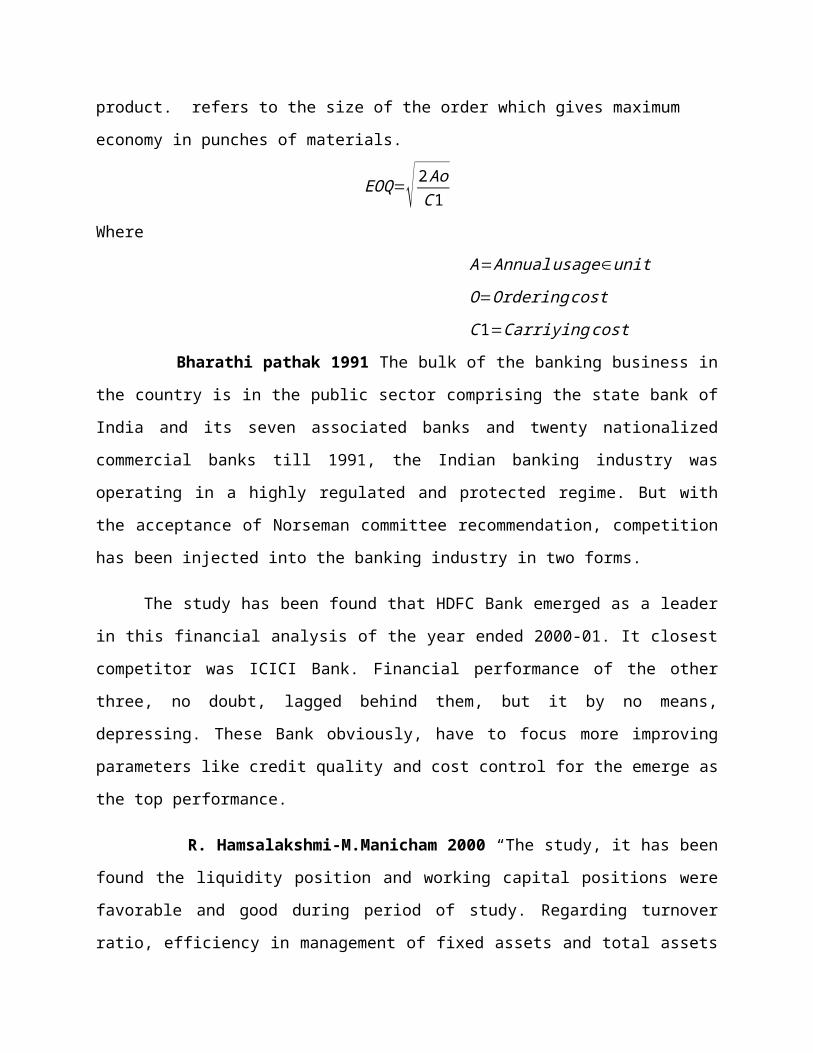
ECONOMIC ORDER QUANTITY
Economic order quantity is that level of inventory that minimizes the total of
Inventory holding cost and ordering cost. The framework used to determine this order quantity is
also known as Wilson Model. The model was developed by F. W. Harris in 1913.The most
economical quantity of a product that should be purchased at one time. The is based on all
associated costs for ordering and maintaining the product. refers to the size of the order which
gives maximum economy in punches of materials.

EOQ=√ 2 AoC 1
Where
A=Annual usage∈unit
O=Ordering cost
C 1=Carriyingcost
Bharathi pathak 1991 The bulk of the banking business in the country is in the public
sector comprising the state bank of India and its seven associated banks and twenty nationalized
commercial banks till 1991, the Indian banking industry was operating in a highly regulated and
protected regime. But with the acceptance of Norseman committee recommendation, competition
has been injected into the banking industry in two forms.
The study has been found that HDFC Bank emerged as a leader in this financial analysis
of the year ended 2000-01. It closest competitor was ICICI Bank. Financial performance of the
other three, no doubt, lagged behind them, but it by no means, depressing. These Bank
obviously, have to focus more improving parameters like credit quality and cost control for the
emerge as the top performance.
R. Hamsalakshmi-M.Manicham 2000 “The study, it has been found the liquidity position
and working capital positions were favorable and good during period of study. Regarding
turnover ratio, efficiency in management of fixed assets and total assets must be increased.
Regarding return on investment and return on equity was proved that the overall profitability
position of the software companies had been increasing at a moderate way.
Dr R.Dharmaraj 2003 ”The study airtical “positing in Indian management industry ’’ have
concluded that for the last five year, there has been proliferation of international and domestic
providence of mutual funds. He says that this increased growth is due to the increasing cash
flows among innovative young companies through India.
.Bharathi pathak, Finance India Dec 2003
R. Hamsalakshmi-M.Manicham, Finance India Sep2 2009
Dr R.Dharmaraj Indian journal of finance volume4 Allen and Carolinian (2003)

Dr Harish kumar 2008 A capital adequacy ratio was constant over a period of time. During the
study period. It was observed that the return on net worth had negative correlation with the debt
equity ratio. Inters income to working funds also had a negative association with interest
coverage ratio and the non performing to net advance was negatively correlated with interest
coverage ratio.
J R Raiyani 2009 During the periods of high inflation depending on conventional accounting
wisdom. May results in firm’s financial information losing its meaning and creation of
unrealistic expectation among information users.
Dr.Kavitha Chavvali 2009 Inventory analysis of gold exchange trade funds. Mathew
T.Jones and Maurice ousted (2007) revised and evaluated pre world war ii current date for
countries by treating gold follows on a continuous basis. The historical data of saving and
investment was taken over a time period of 1850- 1945.
N.Prasanna 2009 Stock performance Aitkin 1997 the external effect foreign direct
investment on export with example of Bangladesh where entry of a koala multinational in
garment exports led establishment of a member of domestic export firms creating the country’s
largest export industry.
Awedh 2005 defend that inflator does not have really an effect on the profitability
measured by return on equity of foreign banks exerting in Lebanon. In the same way, the author
steers that the level of inflation affect more than the return on assets of Lebanese bank than
foreign banks in Lebanon.
Dr Harish kumar single,The icfai journal of inventory management (vol vii Feb. 2008)
J R Raiyani, The infaciS university journal of inventory research (vol viii, No 2 Feb. 2009)
Dr.Kavitha Chavvali, Indian journal of inventory (vol 3 No: 2 dec 2009)
N.Prasanna, Indian journal of inventory (vol 5 No: 1 Jan 2008)
Dr.R.B.Bhatasna, Indian journal of inventory (vol 5 No: 2 Feb 2011)

Dr Sushil kumar Mehta 2010 The financial performance mutual funds schemes. Jayadew
(1996) attempted of evaluate the performance of two growth oriented mutual funds on the basis
of monthly return. It was found that master gain performed better according to Jensen and trey
nor measures and basis of sharps ratio.
Monika uppal 2010 Financial performance factors a survey of the literature shows that the
foreign bank performance is affected by factors like the economic and financial environment.
Among these factors one can equate the growth rate of gross domestic product, monetary market
rate, inflation rate and foreign exchange rate. (Williams 1998).
Dr Sushil kumar Mehta, Indian Journal of inventory vol: 4 No: 2 Feb, 2010
Monika uppal, Indian Journal of inventory vol: 5 No: 1 Jan 2011

INDUSTRY PROOFILE
CHAPTER-IV
DATA ANALYSIS

DATA ANALYSIS
ABC class No of items % of total value Equal purchaseWeighed purchase
No of delivery in 4 weeks
average supply level
No of delivery in 4 weeks
average supply level
A 200 75% 800 2.5 weeks
B 400 15% 1600 2.5 weeks
C 3400 10% 13600 2.5 weeks
Total 4000 100% 16000 2.5 weeks
A class item can be applied much tighter control like JIT daily delivery. If daily delivery with
one day stock is applied, delivery frequency will be 4000 and average inventory level of A class
item will be 1.5 days supply and total inventory level will be 1.025 week supply. reduction of
inventory by 59%. Total delivery frequency also reduced to half from 16000 to 8200.
By applying weighed control based on ABC classification, required man-hours and inventory
level are drastically reduced.
• Alternate way of finding ABC analysis:-
The ABC concept is based on Pareto's law. If too much inventory is kept, the ABC analysis can
be performed on a sample. After obtaining the random sample the following steps are carried out
for the ABC analysis.
HOLDING PERIOD OF RAW MATERIAL:
It refers to the number of days taken for the production unit to convert raw material to finish goods.

Formula:
Holding Period Of Raw Material=360 /Raw material turnover ratio
Holding period of raw material
Year Total Days Ratio Days
2014 360 10.75 33
2013 360 10.27 35
2012 360 1.74 206
0123456789
10
Series1 Series2 Series3
Interpretation:
As the raw material turnover ratio is increasing form to 10.27 for 2012 it indicates that firm is
taking less days for conversion as compared to 2011. In 2011 conversion period was 206 days
but in decreased to 35 days for 2012. This is shown in above graph.
WORK IN PROCESS TURNOVER RATIO:
Work in process turnover ratio is velocity at which W.I.P converted into goods ready for sale. If
W.I.P turnover ratio is high then company is efficiency converting into finished goods.
Formula:
Work in process turnover ratio= Cost of production
Average W.I.P
W.I.P turnover ratio
Year Cost of production Avg W.I.P Ratio
2014 849,054,442 36,720,702 23.12196
2013 555,094,500 15,010,347 36.98
2012 361,110,197 9,755,839 37.01
2013 2012 2011
849,054,442
555,094,500
361,110,197
36,720,702 15,010,347 9,755,83923.1219556205
652 36.98 37.01
Year Cost of production Avg W.I.P Ratio
Interpretation:
The above graph shown to identify the that Work in process turnover ratio is decreasing from 37.01 in
2011 to 23.12 2013. The ratio was high in 2011 as compared to 2012 and 2013. The ratio was 37.01.
Indicates that company is converting semi finished into finished goods quickly

HOLDING PERIOD OF W.I.P:
It refers to the number of days taken for the production unit to convert semi finished goods into
finish goods.
Formula:
360
Holding period of W.I.P= W.I.P turnover ratio
Holding period of W.I.P
Year Total Days Ratio Days
2014 360 23.12 15.57
2013 360 36.98 9.73
2012 360 37.01 9.72
0
1
2
3
4
5
6
7
8
9
10
Series1 Series2 Series3
Interpretation:
As the work in process turnover ratio is increasing form 9.72. in 2011 To 15.57 for 2013 it indicates that
firm is taking less days for conversion. Which shown in above graph

Finished goods turnover ratio:
Finished goods turnover ratio is velocity at which finished goods converted into for sale. If
finished goods turnover ratio is high then company is efficient.
Formula:
Finished goods turnover ratio = Cost of goods sold
Average finished goods
Finished goods turnover ratio
Year cost of goods sold Avg F.G Ratio
2014 849,054,442 26,243,339 32.35
2013 555,094,500 19,858,482 27.95
2012 361,110,197 10,940,008 33.01
2013 2012 2011
849,054,442
555,094,500
361,110,197
26,243,339 19,858,482 10,940,00832.35 27.95 33.01
Finished goods turnover ratio YearFinished goods turnover ratio cost of goods soldFinished goods turnover ratio Avg F.GFinished goods turnover ratio Ratio
Interpretation:
The above graph shown to identify the that finished goods turnover ratio is decreasing from 33.01 in 2011
to 27.95 for 2012. Indicates that company is selling goods little slowly as compared to 2011 but it is bit
fast as compared to 2013. Where the ratio for that particular period was 32.35
Decreased to 11.20 for 2013 it is satisfactory. Which shown in above graph.

INVENTORY TO CAPITAL EMPLOYED:
This ratio indicates the relationship between the total capitals employed and inventories it shows
how much capital utilized to invest in the inventories other than the other assets. The normal
manufacturing firms have low ratio of inventory total capital employed in the organization.
Formula:
inventory to capital employed = Inventory / Total capital employed
Inventory to capital employed
Year Inventory Total capital employed Percentage
2014 197,465,069 301,443,215 65.5
2013 121,558,000 145,492,599 83.54
2012 67,994,623 98,333,324 69.14
2013 2012 2011
849,054,442
555,094,500
361,110,197
26,243,339 19,858,482 10,940,00832.35 27.95 33.01
Finished goods turnover ratio Year Finished goods turnover ratio cost of goods soldFinished goods turnover ratio Avg F.G Finished goods turnover ratio Ratio
Interpretation:
The above graph shown to identify the that the firm investing huge amount in inventories compared to
other assets. It invested 83.54% of its capital in inventory in 2012 where as it reduced to 65.50% in 2013.

INVENTORY TO CURRENT ASSET RATIO:
This ratio indicates the relationship between the inventory and current assets. It shows the
percentage of inventory to current assets, which helps the organizations in deciding the current assets
policy which also affect the liquidity position of the organization.
Formula:
Inventory To Current Asset Ratio= Inventory / Current assets
Inventory to current asset ratio
Year Inventory current assets Percentage
2014 197,465,069 331,314,504 59.6
2013 121,558,000 237,687,684 51.14
2012 67,994,623 117,022,625 58.1
0
50000000
100000000
150000000
200000000
250000000
300000000
350000000
2013 2012 2011
197,465,069
121,558,000
67,994,623
331,314,504
237,687,684
117,022,625
59.6 51.14 58.1
Inventory to current asset ratio Year Inventory to current asset ratio InventoryInventory to current asset ratio current assets Inventory to current asset ratio Percentage
Interpretation:
The inventory to current assets ratio in the year 2011 was 58.10% and it decreased to 51.14% in the year
2012 but again it increased to 59.60% in 2013. It shows that the firm investing 59.60% of its investment
is for inventory only.

INVENTORY TO TOTAL ASSETS:
This ratio indicates the relationship between the inventory and total assets. The
significance of this ratio is it reflects the portion the inventory as a percentage of the total assets, which
helps the management deciding the utilization remaining resources profitably, since the inventory will
lock up the huge funds and reduces the profitability of the organization
Formula:
Inventory To Total Assets = Inventory / Total assets
Inventory to total assets
Year Inventory Total assets Percentage
2014 197,465,069 990,329,087 19.93
2013 121,558,000 540,916,088 22.47
2012 67,994,623 414,901,234 16.38
0100000000200000000300000000400000000500000000600000000700000000800000000900000000
1000000000
2013 2012 2011
197,465,069121,558,000
67,994,623
990,329,087
540,916,088
414,901,234
19.93 22.47 16.38
Inventory to total assets Year Inventory to total assets InventoryInventory to total assets Total assets Inventory to total assets Percentage
Interpretation:
During the year 2011 the rate of inventory to total assets was 16.38% it increased to 22.47% in 2012. But
again it reduced to 19.93% in 2013. It indicates that firm investing only 19.93% in inventory out of total
assets.
INVENTORY TO WORKING CAPITAL:
This ratio indicates the relationship between inventory to working capital and it also
indicates the amount to inventory tied up in the working capital and it also shows the efficiency of
inventory management.
Formula:
Inventory To Working Capital = Inventory
Working capital
Inventory to working capital
Year InventoryWorking capital Percentage
2014 197,465,069 199,345,123 99.05
2013 121,558,000 146,097,210 83.2
2012 67,994,623 46,338,277 146.45
2013 2012 2011
2013 2012 2011
197,465,069
121,558,000
67,994,623
199,345,123
146,097,210
46,338,277
99.05 83.2 146.45
Inventory to working capital Year Inventory to working capital InventoryInventory to working capital Working capital Inventory to working capital Percentage
Interpretation:
In the year the ratio was 146.45% in 2011. It decreased to 83.20% for 2012 but it increased it to 99.05%
in 2013. It indicates that firm investing huge amount in inventory
CHAPTER-5
FINDINGS, SUGGESIONS,
CONCLUSIONS
FINDINGS
Raw material turnover ratio is increased rapidly in 2012 from 1.74 in 2011 to 10.27 for 2012.
As the raw material turnover ratio is increasing form to 10.27 for 2012 it indicates that firm is taking less days for conversion as compared to 2011.
Work in process turnover ratio is decreasing from 37.01 in 2011 to 23.12 2013. The ratio was high in 2011 as compared to 2012 and 2013.
As the work in process turnover ratio is increasing form 9.72. in 2011 To 15.57 for 2013 it indicates that firm is taking less days for conversion
Finished goods turnover ratio is decreasing from 33.01 in 2011 to 27.95 for 2012. Indicates that company is selling goods little slowly as compared to 2011 but it is bit fast as compared to 2013.
Company is selling goods little slowly as compared to 2011 but it is bit fast as compared to 2013. Where the ratio for that particular period was 32.35
The inventory to current assets ratio in the year 2012 was 58.10% and it decreased to 51.14% in the year 2013 but again it increased to 59.60% in 2013. It shows that the firm investing 59.60% of its investment is for inventory only.
In the year the ratio was 146.45% in 2011. It decreased to 83.20% for 2012 but it increased it to 99.05% in 2013. It indicates that firm investing huge amount in inventory.

SUGGESTIONS
a. From the findings it is came to know that in the year 2011 the number of days for
holding Raw material is more, it is not good for the company because it eats
unnecessary investment. To avoid this problem the following points will help.
Purchase Raw Materials at the time when the stock reaches the minimum level.
The purchases should not cross the Maximum limit otherwise the stock kept in
stores idle.
Quantity should be ordered as per the demand. We can assume the demand for the
goods from past experience.
We can have more Raw materials which are imported from other countries but carry
reasonable stocks which are available locally.
b. If we purchase less quantity of materials at a time it will reduce the carrying cost
but increases the ordering cost and vise versa. Therefore optimum ordering quantity
is necessary, which minimizes the cost.
c. The company should maintain a safety level and also reordering point so that they come to
know at what time they should order for the supply of material and need not to suffer from
short fall of required material.

CONCLUSION
After the study to a conclusion that, effectiveness of inventory management should improve in all the
aspects; hence the industry can still strengthen its position by looking into the following.
The inventory should be fast moving so that warehouse cost can be reduced.
The finished goods have to be dispatched in feasible time as soon as manufacturing is
completed.
Optimum order quantity should be maintained, hence cost can be minimized.
Proper inventory control techniques are employed by the inventory control organization
within the framework of one of the basic models like ABC, HML and VED etc.
BIBILOGRAPHY
BOOKS
Financial Management: I.M.Panday
Production Management: K. Ashwatappa
PRASANNA CHANDRA, Financial Management, Tata McGraw-hill, 6th Edition.
M.Y.KHAN & P.K.JAIN, Financial Management, Tata McGraw-hill, 4th Edition.
R.P.TRIVEDI & MANOJ TRIVEDI, Cost and Management Accounting,
Pankaj publications.
WEBSITES
www.Tata Motors.com
www.google.com
http://en.wikipedia.org/wiki/Portal:Architecture
www.knrcl.com
http://en.wikipedia.org/wiki/History_of_construction


![F!RSRQP - Canon · Q "" ’(F!RSRQP T!UVWXYZ[\]^_‘abc^‘ TQUVZ[\]^_‘abc^‘def TgUVhi-jk?$ TlUVhi-.$ TmUVnopqr9sq-Lt Z[\]^_‘abc^‘-uv?$ l hi-xyz9D{|}& ~](https://img.pdfslide.net/doc/110x75/5f350a9fb8152c11dc41f9e7/frsrqp-canon-q-afrsrqp-tuvwxyzaabca-tquvzaabcadef.jpg)

![Approved Namelist for Internal Competition 075.76 · JK _kKte gkYDxNk JK aka [k[n ÿgkU JK ld 5 _ÆKW l]® JK dn ÅU ]hKªW JK g ! / X " X JK lele_ YxE_ta](https://img.pdfslide.net/doc/110x75/5e43f6143e07d855092501cc/approved-namelist-for-internal-competition-07576-jk-kkte-gkydxnk-jk-aka-kn-gku.jpg)


![Tsinghua · 2011. 9. 14. · !4 ˜D⁄1Hœþw23iðN!Æ‹1H£jk¢ai!Hiæ¨@4¥&5(ˆ_34F GÚï!Õ=BFGZ)˝?s" %"’;YZ[\]^_!VWX1‘abc 3"’;](https://img.pdfslide.net/doc/110x75/60ac0a6d3daec024074ac890/2011-9-14-4-oeda1hw23ina1hjkaihi4534f-gbfgzs.jpg)
![‹r ›‚*˚˚N›…]‰ 7a‚‰… 7*- · ˘ˇ ˆ ˙˝˛˚ ˜ !"#$%&’($!˘ ) * + ,- ./ 0 12!(3456 ) 78 ,- 9: 346˘˜ ;˛?@’ abc](https://img.pdfslide.net/doc/110x75/5e75ad77c03bfa5c2d3d7ee4/ar-aanaa-7aaa-7-oe-a.jpg)


![!4 ˜D⁄1Hœþw23iðN!Æ‹1H£jk¢ai!Hiæ¨@4¥&5(ˆ_34F GÚï!Õ=BFGZ)˝?s" %"’;YZ[\]^_!VWX1‘abc 3"’;](https://img.pdfslide.net/doc/110x75/60bf0a56cb85e31a561b9a15/4-oeda1hw23ina1hjkaihi4534f-gbfgzs.jpg)
