Embed Size (px)
Citation preview

Job Classification and Salary Study 2021
(Revised 8/2021)

2
Table of Contents
Section 1: Introduction ......................................................................................... 3
Section 2: Methodology ........................................................................................ 5
Section 3: Market Salary Study Summary, Findings and Recommendations ......... 9
Section 4: Proposed Pay Plans & Structure .......................................................... 25
Section 5: Personnel Policies and Processes ........................................................ 35
Section 6: Implementation and Costs .................................................................. 41

3
Section 1: Introduction

4
Introduction The college president requested that the TVCC Human Resources department conduct a classification
and salary assessment of jobs for all current college classifications. This report presents the findings and
recommendations of the study. HR’s findings and recommendations are based on:
• Market salary research results.
• Current organizational structure.
• Meetings with employees, supervisory, managerial, and senior management employees.
• Job analysis based on input from individuals, groups, and members of job families.
• Internal equity and external competitiveness considerations.
The goal of TVCC HR for this project was to provide the foundation for an appropriate classification and
compensation system and pay plan based on current compensation levels for similar higher education
sector employers. In response, TVCC HR has developed a proposed pay plan and developed salary
adjustment recommendations for current incumbents in included TVCC classifications.
Project Focus
The objectives of the study were to:
• Conduct a review of all college job descriptions.
• Gather salary and classification and compensation data from similar/competitor institutions.
• Develop a revised classification plan; and,
• Develop a revised compensation and pay plan.
• Provide options for the board’s consideration to find a reasonable and cost-effective way to
transition to the new plan(s).

5
Section 2: Methodology

6
TVCC HR PROJECT STAGES AND ACTIVITIES Project Initiation – Developed project proposal, work plan and timeline. Discussed with administration and HR staff and revised project work plan.
Initial Meetings – Met with Human Resources staff to clearly define the scope, goal(s), and objective(s) for the proposed study.
Conducted classification data and Distributed PDQ’s – Collected and reviewed classification data from employees. HR’s online, web-based job information questionnaire – available to all current TVCC employees in included classifications to gather job specific information on specific duties, responsibilities, and essential knowledge, skills, and abilities.
Developed New Job Descriptions – Created updated job descriptions based on data provided by the employees.
Conducted supervisor sessions – conducted supervisor sessions to gather input regarding the job descriptions. Supervisors were to help provide information regarding job duties that the employees are expected to perform and either approved, modified, or removed any proposed changes made by the employee.
Collected job descriptions – collected and reviewed job descriptions from available descriptions that could be found online. Benchmarked job duties against those of TVCC. Only job duties that matched TVCC’s by a minimum of 70% were selected as an eligible position.
Collected/Analyzed Compensation Data – Collected and reviewed compensation data from institutions and salary data from the Texas Association of School Boards (TASB) and the College and University Professional Association for Human Resources. Salary data from TASB and CUPA-HR were both filtered by enrollment size to match TVCC. TASB data is only from the state of Texas and CUPA-HR data is nationwide.
Conducted Job Analysis – Performed analysis of compensable factors based on completed jobs. Met with Senior Leadership to ensure transparency and to allow for feedback and input.
Developed Revised Pay Plan – Developed a preliminary proposed pay plan based on the results of the market salary study, job analysis, and internal/external equity considerations.
Developed Salary Adjustment Recommendations – Developed salary adjustment recommendations for all College classifications based on the revised pay plan(s) and employee classification, longevity in current positions, and current salary.
Developed & Submitted Draft Report – Developed and submitted a Draft Report for College review integrating the job analysis, proposed pay and classification plan, salary study, and implementation recommendations.
Develop & Submit Final Report – Submitted a Final Report upon final review.

7
Exhibit 1-2 illustrates a flow-chart process used for developing a proposed pay and classification plan.

8
Approach Overview
To begin the study, TVCC’s HR department reviewed preliminary information. At this time, HR
conducted initial meetings with HR staff and administration and tailored several instruments to be used
in conducting the compensation and classification analysis, including:
• a Position Description Questionnaire (PDQ); and
• a Market Salary Study to be conducted with comparable classifications with a selected group
of institutions and external data providers.
The study methodology included:
• Collection of current personnel, human resources, and organizational background
information.
• Development, distribution, collection, and analysis of PDQ’s.
• Identification and selection of comparable institutions for the market salary data.
• Identification of classification benchmarks.
• Conduct of a salary research for selected positions; and
• Analysis with recommendations concerning the relative ranking of college positions to
develop a classification plan that will ensure internal equity.

9
Section 3: Market Salary Study Summary, Findings and Recommendations

10
Market Salary Study
The College employs a wide range of jobs that contain a mix of work responsibilities found in
both the public and private sectors. The Market Salary Study of selected benchmark positions reflected
the variety of duties and responsibilities in which higher education institution employees engage. The
Market Salary Study is one of the key components of a classification and compensation study, as well as
one of the more difficult and sensitive activities in the study process.
The Human Resources staff developed a list of target institutions to be studied. Unfortunately,
due to timing of the needed data we were not able to retrieve data from all the target institutions. This
required the staff to on occasion reach beyond the targeted institutions, as well as outside the State of
Texas and gather job duty data from institutions. However, with the comprehensive adjustments for
Cost of Living (COL), Educational Level and Year of Experience (YOE) comparisons, the data was found to
be useful. Using benchmark classifications, HR performed the technical analysis and evaluation for each
job at the institution. Organizations included as targets in the salary study are those that are:
• Competing with the College for employees, for either lower level or higher-level positions.
• Geographically situated in such a fashion as to almost automatically be considered
a competitor.
• Institutions that are similar in size based on enrollment.
• Structured similarly to the College or providing similar types of services.
• Attractive to highly valued employees for one reason or another; and,
• Provided readily available data online.
Benchmark Jobs
The job descriptions included as benchmarks in the study were clearly and concisely described.
All job duties had a clear and identifiable relationship to other College jobs and were representative of
the various functional areas within the various work areas/units within TVCC. Job descriptions that had
at a minimum of 70% match to the job duties to TVCC’s job description was considered a viable
benchmark.
In addition to the statement of job duties and responsibilities, specific information pertaining to
the education requirements and work experience needed for the job was included. The institutions
matching job title, annual minimum salary, duty days, and annual hours was also included in the study.

11
The data from the study was used to assist with the classification of the various jobs within the
pay structure. It is important to note, however, that the market study simply serves as an indicator of
market trends and the internal job analysis is a critical element in determining pay grade assignments.
Institutions Studied:
Alvin Community College
Austin Community College
Barstow Community College
Blinn College
Boston College
Brazosport College
Cerritos Community College
Collin College
Colorado State University
Community college of Rhode Island
CUPA-HR- Salary Data
Dallas College
El Camino College
El Paso Community College
Grayson College
Lane Community College
Laredo College
Lee College
Los Angeles Community College
McLennan Community College
Middlebury College
Navarro College
Pima Community College
Portland Community College
Reading Area Community College
San Antonio ISD
San Jacinto Community College
Tarrant County College
TASB- Community College Salary Data
TASB- ISD Salary Data
Texas Southmost College
Tyler Junior College
University of New Mexico
University of Southern California
Studied Job Classes
The proposed pay plan put employees into a grade range for Staff employees, Police and Public
Safety positions, Information Technology, Administration, and a separate schedule for Faculty. Specific
details of the plans are provided in report tables starting in Section 4: Proposed Pay Plans and Structure.

12
Studied Job Titles:
Academic/Workforce Advisor
Accounting Specialist
Administrative Assistant
Admissions Specialist
Assistant Athletic Trainer
Assistant Campus Director
Assistant Controller
Assistant Registrar
Associate Vice Provost
Asst. Dir. of Bookstore Services
Asst. Director SFA
AVP Academic Affairs
AVP Instructional Innovation
AVP of Enrollment Mgmt.
AVP of Facilities Mgmt.
AVP of TDCJ
AVP Workforce Education
Bookstore General Clerk
Bookstore Purchasing Clerk
Building Services Manager
Building Services Technician
Campus Events Specialist
Campus Police Investigator
Campus Police Officer
Campus Police Sergeant
Continuing Ed Coordinator
Counselor
Development Officer/Scholarships
Director of Acct Svcs. /Controller
Director of Adult & Cont. Ed.
Director of Athletics
Director of Bookstore Svcs.
Director of Building Services
Director of Campus Police
Director of Client Support Services
Director of Dual Credit
Director of ERP Programming
Director of Financial Aid
Director of Human Resources
Director of International Students
Director of LRC
Director of Marketing & Comm.
Director of Media Support Svcs.
Director of Network Support Svcs.
Director of Recruiting & HSO
Director of SPEA
Director of SSS
Director of Student Housing
Director of Student Life
Director of Student Pathways
Director of System Support Svcs.
Director of Testing
Director of Trans. & Log.
Dispatcher
Dual Credit Specialist
Enrollment & Administrative Advisor
Enrollment Coordinator- TDCJ
ERP Analyst
Executive Assistant I
Executive Assistant II

13
Executive Assistant III
Executive Director of the Foundation
Facilities Coordinator
Financial Aid Officer I
Financial Aid Officer II
Graphic Art & Design Coord.
Graphic Art Design Specialist
Head Athletic Trainer
Housing Manager
Housing Specialist
Human Resource Generalist
Human Resources Specialist
Institutional Effect & Res Analyst
Instructional Aid
Instructional Designer
IT Procurement Specialist
Librarian
LMS Administrator
LRC Specialist
LRC Technical Assistant
Multimedia Specialist
Network Administrator
Payroll Coordinator
PC LAN Analyst
PCI Coordinator
Provost
Recruiter
Recruiting Coordinator
Reference Librarian
Research & Assessment Generalist
Senior Business Analyst
SFA Specialist: VA/PELL
Specialist, HSC
Sports Information Officer
Sr. Acct- Financial Reporting
Sr. Acct-Grants & RR
Student Retention Advisor
Systems Administrator
Technical Workforce Advisor
Testing Specialist
Trans & Logistics Specialist
Tutor Coordinator
Unit Enrollment Coordinator-TDCJ
VC/LAN Analyst
Videographer
VP of Admin Svcs/CFO
VP of Information Technology
VP of Instruction
VP of Student Services
Web Programmer
Classification
An organization’s classification system establishes how its human resources are employed to
perform its core services. The classification system consists of the titles and descriptions of the different
classifications which define how work is organized and assigned. It is essential that the titles and
descriptions of an organization’s classifications accurately depict the work being performed by
employees to ensure equity within the organization and to enable comparisons with positions at peer

14
organizations. The purpose of a classification analysis is to identify such issues as incorrect titles,
outdated job descriptions, and inconsistent titles across departments and levels.
In the analysis of the College’s classification system, TVCC HR collected classification data
through the Position Description Questionnaire (PDQ) and benchmarking processes. The PDQ’s, which
were completed by employees and reviewed by their supervisors, provided information about the type
and level of work being performed for each of the College’s classifications. The benchmarking process
provided supervisors an opportunity to provide specific recommendations regarding the pay or
classification of positions in their areas.
An additional secondary process was performed prior to the completion of the job description
submission period. TVCC HR conducted a series of job specific discussions with supervisors to further
clarify and explore issues related to the College’s classification system. TVCC HR reviewed and utilized
the data provided in the PDQ’s and benchmarks, as well as through the secondary discussions, as a basis
for the classification recommendations below.
Classification Findings
The classification system being used by the College was found to be generally accurate and job
titles typically described the work being performed by employees. However, it was found that some
classification titles did not accurately reflect the pay grade or tasks completed by the employee. TVCC
HR has proposed the following classification changes within the current classification system. A
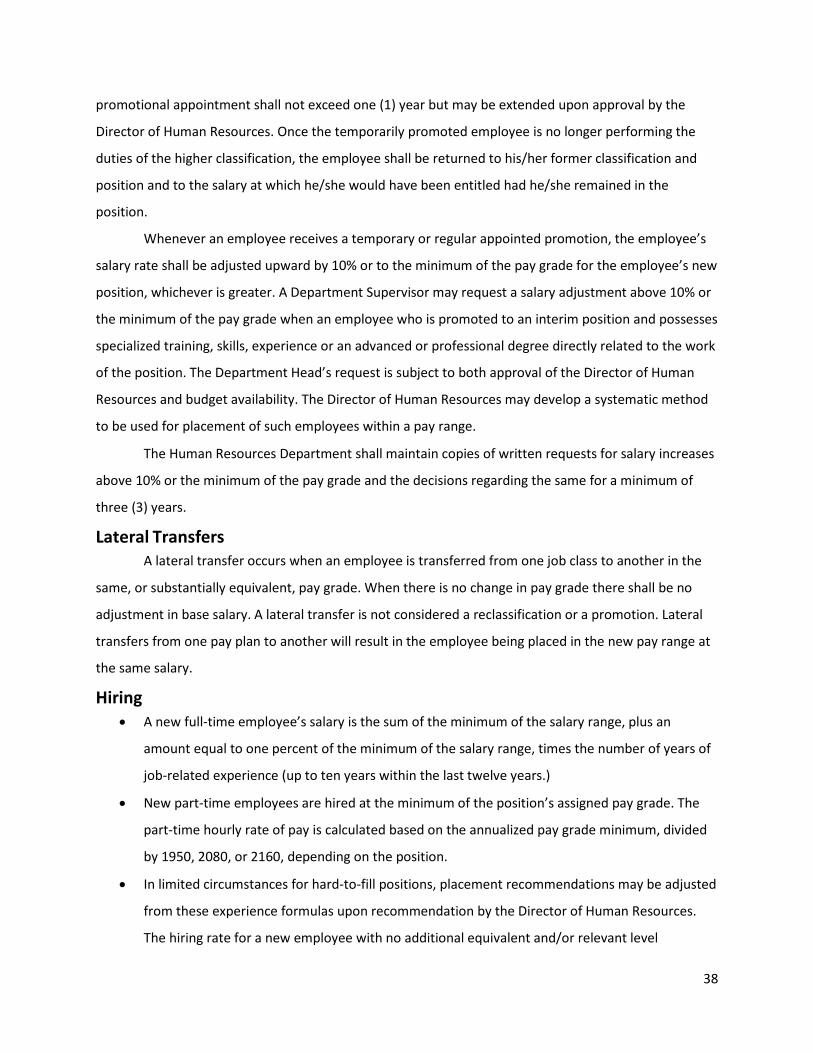
comprehensive listing of the classification changes can be found in Exhibit 3-1.
EXHIBIT 3-1 Proposed Classification Title Changes
Old Classification Title New Classification Title Enrollment Specialist Admissions & Records Specialist Admissions Specialist Admissions & Records Specialist
Enrollment Coordinator- Pre-Service Enrollment Coordinator- TDCJ Enrollment Coordinator- In-Service Enrollment Coordinator- TDCJ
Guidance Associate II Academic/Workforce Advisor Counselor- HSC Assistant Campus Director
Counselor/Assistant to the Provost Assistant Campus Director Counselor- TDCJ Unit Enrollment Coordinator- TDCJ
Payroll Coordinator Human Resources Specialist Research & Assessment Generalist Sr. Research & Assessment Analyst
Campus Events Specialist Student Life Specialist Accounting Specialist- General Accounting Clerk

15
If approved TVCC HR will be providing the updated job descriptions, which encompass any edits or
changes necessary to reflect the most current work being performed in the role.
Compensation
The compensation system analysis consisted of three parts:
• An assessment of the current compensation system.
• An external salary study; and
• An internal equity assessment.
Using data related to the College’s salary schedules and employees, an assessment was
performed to examine the nature of the existing salary schedules, the progression of employee salaries
through pay grades, employee tenure, and the distribution of employees in the College.
During the market salary study, the College’s pay ranges for selected benchmarked
classifications were compared to the median minimum of the identified market. Details regarding the
market salary study were provided in Compensation Findings of this report.
EXHIBIT 3-2 Example of a studied position
Organization Duty Days Hours
Minimum Pay
Range
Degree Match
YOE MATCH
COL Adjustment
Adjusted Salary or Median
Minimum
% Job Duty
Match
TASB-CC 260 8
$48,703
TASB- ISD 260 8
$36,605
CUPA-HR 260 8
$41,988
Austin CC 260 8 $40,494 0% 3% -5.50% $39,482 90%
Dallas CC 260 8 $36,000 10% 3% -4.55% $39,042 100%
Collin College 260 8 $40,863 0% 3% -3.65% $40,597 100%
AVG $41,070
MEDIAN $40,040 Job Placement TVCC HR evaluated the included college classifications to assign positions to an appropriate
pay range. There are three primary sources of input for job placement:

16
1. The value of the job profile as determined by the employee, the direct supervisor and when
available, a combination of the values collectively provided by subject matter experts through
the combination point assessment derived from the PDQ.
2. The value of the market data as determined by published data was entered into the database as
a reference point for job placements and for referential jobs within the same or similar
occupational families.
3. The input from the leadership of the organizational unit directly responsible for the jobs in his or
her department. This is reflected in the Internal Relationship Adjustment (IRA) setting, which
may be either a positive or negative number, depending on final discussion with leadership
regarding job profile placement within the overall organizational hierarchy.
TVCC staff served as a facilitator to bring the primary source data together in a meaningful way,
organize it into a pay plan or plans, depending on the needs of the institution and to support and assist
the institution with making crucial decisions regarding overall hierarchal placement of jobs.
The study results and outcomes are not the result of decisions made in isolation by HR but are the
result of the staff working to bring together all the different viewpoints of the shareholders, from the
entry level employee to the highest-level executives, assisting and supporting in ordering responsibilities
of the work into a compensation and classification plan that serves as a starting point for making current
and future placement decisions.
Information about each employee’s job was collected through a PDQ. The questionnaire was
available online, sent via email from HR, and was made available to all incumbents in included TVCC’s
classifications. The PDQ asked employees to rank their job based on the decision band method (DBM) in
each of six different decision bands and provide additional information about their characteristics of the
decision and responsibility levels.
Descriptions of each Band Level:
Band F – Policy Making Decisions
Band F decisions determine the scope, the direction, and overall goals of the organization. They take
into consideration all the major departments, the limits of funds available to each department, and the
scope of their programs. The only limits on Band F are those imposed by law and/or economic
conditions. Band F decisions are typically made at the board or senior executive level (Board, Council,
CEO)
Band E – Programming Decisions

17
Band E decisions deal with the means of achieving the goals established by Band F. These decisions are
concerned with the formulation or adjustment of strategic direction for major
functions/divisions/departments of an organization, and allocation of resources amongst these groups.
The positions at Band E are typically in charge of or responsible for advising managers heading up such
major functions as marketing, administration, finance, etc. Band E decisions are generally made at the
senior management level.
Band D – Interpretive Decisions
Band D decisions involve strategic plans and programs for divisions/ departments needed to interpret
and carry out the goals and objectives developed by higher levels. These decisions specify what is
required in the lower Bands, and how the resources allocated by Band E are to be deployed. If
circumstances change, involving uncertainty of information or outcome, Band D decisions set
precedents, establishing what is to be done in similar circumstances in the future. Middle managers or
departmental heads typically make Band D decisions.
Band C – Process Decision
Band C decisions involve determining the means or process of achieving the objectives, standards or
guidelines established by higher Bands. They are subjected to limits such as; available technology and
resources and to the constraints set by Band D. There is an analytical component in positions at this
level. Supervisors, professional staff, senior technical specialists and senior level support staff typically
make Band C decisions.
Band B – Operational Decisions
Band B decisions focus on how to carry out the process indicated by Band C decisions. Band B
employees are required to complete the tasks within the limits set by the specified process but they do
have a choice as to how and when the operations are carried out. Band B decisions are generally made
by lower-level professionals and office personnel.
Band A – Defined Decisions
Band A decisions have to do with the manner and speed of performing the elements of the operation.
There is no choice as to what the elements of the process are, but there is a choice as to how the
elements are performed. Band A decisions are typically made at entry level and in semi-skilled positions.

18
The internal equity assessment reviewed and analyzed the relationships between, and the type
of work being performed by the College’s employees. Specifically, a composite score was assigned to
each of the College’s classifications that quantified the classification’s level on five separate
compensatory factors. The level for each factor was determined based on responses to the PDQ.
These compensatory (job) factors are:
• Leadership - degree to which a position receives direction or provides direction to others.
• Working Conditions - degree to which a position operates in an environment of change or risk
to oneself or others
• Complexity - degree to which higher level educational, knowledge, or analytical abilities must be
utilized
• Decision Making - degree to which a position acts autonomously and oversees the actions of
others. (Band Level)
• Relationships – degree to which the position interacts with others
Compensation Findings Market Minimums
A starting point of the analysis is to compare the average market minimum for each
classification to the College’s range minimums. Market minimums are generally considered as an entry-
level salary for employees who meet the minimum qualifications of a classification.
Employees with salaries at or near the range minimums are less likely to have mastered the job
and would have not acquired the skills and experience necessary to be fully proficient in their
classification.
Exhibit 3-3 illustrates that the College is, on average, 23.3% below market at the minimum of their
respective salary ranges for all surveyed classifications.
Several conclusions can be drawn based on the collected data:
• The surveyed position differentials range from 77% below market minimum for the Housing
Manager classification to 0.4% percent below market for the Development Officer & Scholarship
Coordinator.
• Of the 111 classifications with market minimum percentage differentials, 95 (85.6%) were below
market at the minimum. (Note: 16 (14.4%) classifications do not have an established pay range).
• 48 surveyed positions are 20 percent or more below their respective market minimums.

19
Market Midpoints
This subsection explores the comparison between average peer midpoints and the midpoints for
classifications in the College. Market midpoints are important to consider as they are commonly
recognized as the salary point at which employees have achieved full proficiency and are performing
satisfactorily in their classification.
Exhibit 3-3 illustrates that the College is, on average, 28.5% below market at the midpoint of the
respective salary ranges for all surveyed classifications.
Based on the collected data, the following observations can be made:
• The surveyed position differentials range from 75% below market midpoint for the Housing
Manager to 4% below for the Development Officer & Scholarship Coordinator classifications.
• Of the 111 classifications with market midpoint percentage differentials, 95 (85.6%) are below
market at the midpoint, while the remaining 16 (14.4%) do not have established pay range
midpoints to compare.
• 59 surveyed positions were 20 percent or more below their respective market midpoints.
Market Maximums
The peer salary range maximums are compared to the College’s range maximums for each
benchmarked classification. The market maximum is significant as it represents the upper limit salary
that an organization might provide to retain and/or reward experienced and high performing
incumbents. Additionally, being competitive at the maximum allows organizations to retain highly
qualified employees in classifications that are difficult to fill.
Exhibit 3-3 illustrates that the College was, on average, 31.8% below market at the maximum of
the respective salary ranges for all surveyed classifications.
Based on the collected data, the following observations can be made:
• The surveyed position differentials range from 79% below market maximum for the Housing
Manager to 7% below for the Development Officer/Scholarship Coordinator classifications.
• Of the 111 classifications with market maximum percentage differentials, 95 (91.7 percent)
were below market at the maximum, while the remaining 16 (14.4%) classifications do not have
established pay range maximums.
• 62 surveyed positions were 20 percent or more below their respective market maximums.
Range Spreads Range spreads (the width of salary ranges) allow for flexibility when determining hiring salaries,
indicate the room for growth within a classification, and provide a metric for which the College can

20
compare its current compensation structure to the rest of the market. Range spread is generally set
between 50 to 70 percent for best practice.
Exhibit 3-3 shows the average range spreads for each of the surveyed positions. The College’s
range spreads vary between 34.4% for the Admissions Specialist classification and 76.4% for the
Continuing Education Program Coordinator classification. Overall, the College has much narrower range
spreads compared to the market which is 60%, with an overall average range spread of 49.7% across all
pay ranges.
EXHIBIT 3-3 Minimum, Midpoint, Maximum, and Range Spread Summary
Job Title Below Minimum
Below Midpoint
Below Maximum
Range Spread
Academic Support Coordinator No Data Academic/Workforce Advisor 30% 35% 38% 50.00% Accounting Specialist- AP 10% 14% 17% 50.00% Accounting Specialist, General 42% 47% 45% 56.25% Accounting Specialist, Accts Rec. 11% 15% 18% 50.00% Administrative Assistant 51% 57% 61% 50.00% Admissions Specialist 37% 59% 63% 34.37% Assistant Athletic Trainer 17% 26% 30% 44.00% Assistant Controller 19% 23% 27% 50.00% Assistant Registrar 2% 6% 9% 50.00% Associate Vice Provost No Data Asst. Dir. of Bookstore Svcs 28% 33% 36% 50.00% Asst. Director SFA 18% 23% 26% 50.00% AVP Academic Affairs No Data AVP Instructional Innovation No Data AVP of Enrollment Mgmt. 20% 30% 34% 44.00% AVP of Facilities Mgmt. 37% 44% 48% 48.26% AVP of TDCJ No Data AVP Workforce Education No Data Bookstore General Clerk 27% 32% 35% 50.00% Bookstore Purchasing Clerk 7% 11% 14% 50.00% Building Services Manager 38% 44% 48% 50.00% Building Services Technician 1% 5% 8% 50.00% Campus Police Investigator 17% 22% 25% 50.00% Campus Police Officer 26% 32% 36% 48.91%

21
Campus Police Sergeant 24% 29% 32% 50.00% Continuing Ed Coordinator 23% 8% 11% 76.42% Counselor No Data Unit Enrollment Coordinator- TDCJ No Data Asst. Campus Director No Data Develop Officer & Scholarships 0% 4% 7% 50.00% Dir Inter Stu/Completion Advisor No Data Dir, Marketing & Communication 20% 25% 28% 50.00% Dir. Adult & Cont. Ed. No Data Director of Acct Svcs/Controller 27% 37% 41% 44.00% Director of Athletics 33% 39% 42% 50.00% Director of Bookstore Svcs 8% 13% 15% 50.00% Director of Building Services 56% 62% 66% 50.00% Director of Campus Police 21% 26% 30% 50.00% Director of Client Support Services 19% 23% 26% 50.00% Director of Dual Credit 8% 13% 11% 56.25% Director of ERP Programming 3% 7% 10% 50.00% Director of Financial Aid 23% 19% 22% 61.67% Director of Human Resources 44% 49% 53% 50.00% Director of LRC No Data Director of Media Support Svcs 2% 6% 9% 50.00% Director of Network Sup Svcs 2% 6% 8% 50.00% Director of Recruiting & HSO 2% 6% 8% 50.00% Director of SBDC No Data Director of Student Life 44% 38% 41% 63.64% Director of SPEA 18% 28% 31% 44.00% Director of SSS 4% 8% 11% 50.00% Director of Student Housing No Data Director of Student Pathways 7% 11% 14% 50.00% Director of System Support Svcs 8% 12% 15% 50.00% Director of Testing No Data Director of Trans. & Log. 9% 14% 16% 50.00% Dispatcher 28% 33% 37% 50.01% Dual Credit Specialist 32% 43% 47% 44.00% Campus Events Specialist 28% 33% 37% 50.00% Enrollment & Administrative Advisor 6% 10% 13% 50.00% Enrollment Coordinator 41% 46% 50% 50.00%

22
ERP Analyst 21% 26% 29% 50.00% Executive Assistant I 67% 73% 78% 50.00% Executive Assistant II 51% 57% 61% 50.00% Executive Assistant III 50% 56% 60% 50.00% Executive Director 11% 22% 30% 36.98% Facilities Coordinator 2% 6% 9% 50.00% Financial Aid Officer I 27% 38% 41% 44.00% Financial Aid Officer II 17% 26% 30% 44.00% Graphic Art & Des Coord 63% 69% 74% 50.00% Graphic Art Design Specialist 43% 48% 52% 50.00% Head Athletic Trainer No Data Housing Manager 77% 75% 79% 58.50% Housing Specialist 27% 33% 36% 50.00% Human Resource Generalist 18% 23% 26% 50.00% Human Resources Specialist 36% 41% 45% 50.00% Inst. Effect & Research Analyst 18% 28% 32% 44.00% Instructional Aide 34% 45% 49% 44.00% Instructional Designer 55% 54% 58% 56.96% IT Procurement Specialist 9% 18% 21% 44.00% Librarian 17% 22% 25% 50.00% LMS Admin No Data LRC Specialist 41% 47% 51% 50.00% LRC Technical Assistant 58% 55% 59% 58.50% Multimedia Specialist 2% 7% 9% 50.00% Network Administrator 2% 6% 8% 50.00% PC LAN Analyst 2% 7% 9% 50.00% PCI Coordinator 3% 7% 10% 50.00% Provost No Data Recruiter 14% 24% 27% 44.00% Reference Librarian 17% 22% 25% 49.33% Research & Assmnt Generalist 7% 11% 14% 50.00% SBDC Advisor No Data Senior Business Analyst 14% 25% 29% 41.60% SFA Specialist: VA/PELL 27% 33% 36% 49.71% Specialist, HSC 9% 18% 21% 44.00% Sports Information Officer 63% 70% 74% 50.00% Sr. Acct- Financial Reporting 22% 27% 30% 50.00%

23
Sr. Acct-Grants & RR 15% 20% 23% 50.00% Student Retention Specialist 9% 13% 16% 50.00% Systems Administrator 11% 15% 18% 50.00% Technical Workforce Advisor 1% 9% 12% 44.00% Testing Specialist 33% 39% 42% 50.00% Trans & Logistics Specialist 42% 47% 51% 50.00% Tutor Coordinator 47% 53% 57% 50.00% VC/LAN Analyst 12% 16% 19% 50.00% Videographer 10% 14% 17% 50.00% VP of Admin Svcs/CFO 45% 51% 55% 50.00% VP of Information Tech. 6% 10% 13% 50.00% VP of Instruction No Data VP of Student Services 27% 32% 35% 50.00% Web Programmer 4% 8% 11% 50.00%
23.3% 28.5% 31.8% 49.7%
Faculty Compensation
A starting point of the analysis is to compare the average market minimum for each level to the
College’s range minimums. Market minimums are generally considered as an entry-level salary for
faculty who meet the minimum qualifications of a classification.
Faculty with salaries at or near the range minimums are less likely to have mastered the job and
would have not acquired the skills and experience necessary to be fully proficient in their classification.
Exhibit 3-4 illustrates that the College is, on average, 21.6% below market at the minimum, 9.4% below
midpoint, and 25.5% below Maximum of their respective salary ranges for all studied schedules.

24
EXHIBIT 3-4 Minimum, Midpoint, Maximum, and Range Spread Summary
9 Month Salary Range
Below Minimum
Below Midpoint
Below Maximum
Range Spread
Level 0 No Data Level 1 23% 8% 22% 60% Level 2 26% 11% 26% 59% Level 3 13% 8% 24% 56% Level 4 21% 8% 24% 54% Level 5 25% 13% 31% 50%
21.6% 9.4% 25.5% 55.8%
Range Spreads
Range spreads (the width of salary ranges) allow for flexibility when determining hiring salaries,
indicate the room for growth within a classification, and provide a metric for which the College can
compare its current compensation structure to the rest of the market. Range spread is generally set
between 50 to 70 percent for best practice.
Exhibit 3-4 shows the average market range spreads for each of the studied levels. The College’s
range spreads vary between 50% for Level 5 to 60% for Level 1. Overall, the College has an in average
range spread compared to the market, with an overall average range spread of 55.8% across all pay
ranges.
Summary
From the analysis of the data gathered in the external labor market assessment, the following
conclusions can be made:
• From 405 external job descriptions and 351 salary data points and 14 faculty salary schedules
(6.5 per benchmarked classification), it was determined that College is 23.3% below the market
minimum of salary ranges of benchmark positions for staff and 21.6% below market minimum
for Faculty.
• The average market range spread across the salary ranges of all surveyed positions is 60%,
which is broader than the 49.6% overall average found across all the College’s pay ranges for
staff, but Faculty were found to be within the average at 55.8%.

25
Section 4: Proposed Pay Plans & Structure

26
Proposed Compensation Plan Pay Plan Structure
TVCC HR has established a pay plan structure as follows:
• “S” series for all staff positions included within the scope of the study.
• “P” series represents all Public Safety positions included in the scope of the study.
• “T” series for all Information Technology positions included within the scope of the study.
• “A” series for all Administration positions included within the scope of the study.
Pay Range widths:
Range spreads (the difference between the minimum and maximum salary levels for each pay
grade) are generally set between 50 and 70 percent for best practice. TVCC HR has chosen to use 60% as
the standard pay range spread.
Pay Grades TVCC HR has established Pay Grades as follows (See Band Descriptions in Section 3):
• For positions with pay band “A” will have a pay range of 100-155
• For positions with pay band “B” will have a pay range of 135-195
• For positions with pay band “C” will have a pay range of 175-225
• For positions with pay band “D” will have a pay range of 230-280
• For positions with pay band “E” will have a pay range of 285-335
• For positions with pay band “F” will have a pay range of 340-350
• The only position with no pay range is the President as its salary is set by the Board of
Trustees.
EXHIBIT 4-1 Pay Grades
Pay Grade
Minimum Salary
Mid-Point Max
100 $25,837 $33,588 $41,339 105 $26,612 $34,596 $42,579 110 $27,410 $35,633 $43,856 115 $28,233 $36,703 $45,173 120 $29,080 $37,804 $46,528 125 $29,952 $38,938 $47,923 130 $30,851 $40,106 $49,362

27
135 $31,776 $41,309 $50,842 140 $32,730 $42,549 $52,368 145 $33,711 $43,824 $53,938 150 $34,723 $45,140 $55,557 155 $35,764 $46,493 $57,222 160 $36,837 $47,888 $58,939 165 $37,943 $49,326 $60,709 170 $39,081 $50,805 $62,530 175 $40,253 $52,329 $64,405 180 $41,461 $53,899 $66,338 185 $42,705 $55,517 $68,328 190 $43,986 $57,182 $70,378 195 $45,305 $58,897 $72,488 200 $46,664 $60,663 $74,662 205 $48,064 $62,483 $76,902 210 $49,506 $64,358 $79,210 215 $50,992 $66,290 $81,587 220 $52,521 $68,277 $84,034 225 $54,097 $70,326 $86,555 230 $55,720 $72,436 $89,152 235 $57,391 $74,608 $91,826 240 $59,113 $76,847 $94,581 245 $60,887 $79,153 $97,419 250 $62,713 $81,527 $100,341 255 $64,595 $83,974 $103,352 260 $66,532 $86,492 $106,451 265 $68,528 $89,086 $109,645 270 $70,584 $91,759 $112,934 275 $72,702 $94,513 $116,323 280 $74,883 $97,348 $119,813 285 $77,129 $100,268 $123,406 290 $79,443 $103,276 $127,109 295 $81,826 $106,374 $130,922 300 $84,281 $109,565 $134,850 305 $86,810 $112,853 $138,896 310 $89,414 $116,238 $143,062 315 $92,096 $119,725 $147,354 320 $94,859 $123,317 $151,774 325 $97,705 $127,017 $156,328 330 $100,636 $130,827 $161,018

28
335 $103,655 $134,752 $165,848 340 $106,765 $138,795 $170,824 345 $109,968 $142,958 $175,949 350 $113,267 $147,247 $181,227
PROPOSED CLASSIFICATION SLOTTING To ensure that classifications are being compensated competitively in comparison to the
market, TVCC HR proceeded to determine the placement of classifications within the proposed salary
schedules, using the results of the market salary survey as a guide.
After initial slotting was complete, additional adjustments were made to maintain existing
hierarchy and to account for the College’s understanding and knowledge of each position which cannot
be captured through the PDQ or salary survey processes. Based on this process, Exhibit 4-2 displays the
proposed placement of each classification into a specific pay grade.
EXHIBIT 4-2 Proposed Salary Grade Assignments
Class Position/Title S,P,T, or A Band Grade
SA100 Bookstore General Clerk S A 100 SA105 Bookstore Purchasing Clerk S A 105 SA110 Ranch Hand S A 110 SA120 Building Services Technician S A 120 SA120 Dual Credit Specialist S A 120 SA120 Instructional Aide S A 120 SA120 Student Life Specialist S A 120 SA120 Testing Specialist S A 120 SA125 Admissions & Records Specialist S A 125 SA125 LRC Technical Assistant S A 125
SPA125 Police Dispatcher SP A 125 SA130 Administrative Assistant S A 130 SA130 Accounting Clerk S A 130 SA130 LRC Specialist S A 130 SB135 Accounting Specialist S B 135 SA140 Recruiter S A 140 SA145 CE Program Development Specialist S A 145 SA145 Housing Specialist S A 145

29
SA145 SFA Specialist S A 145 SA145 Transportation & Logistics Specialist S A 145 SB150 Enroll & Admin Advisor S B 150 SA155 FA Officer I S A 155 SA155 Graphic Art & Design Specialist S A 155 SB155 Housing Manager S B 155 SB160 Academic Support Coordinator S B 160 SB160 Enrollment Coordinator S B 160 SB160 Student Retention Specialist S B 160 SB165 Executive Assistant I S B 165 SB165 Facilities Coordinator S B 165 SB165 HR Specialist S B 165 SB165 Videographer S B 165 SB170 FA Officer II S B 170 SB170 Graphic Art & Design Coordinator S B 170 SB170 Recruiting Coordinator S B 170 SB170 Tutor Coordinator S B 170
STB175 IT Procurement Specialist ST B 175 SB175 Assistant Director of Bookstore S B 175 SB175 CE Program Development Coordinator S B 175 SB175 Develop Officer & Grants S B 175 SB175 Executive Assistant II S B 175 SB175 Inst. Effectiveness & Research Analyst S B 175 TB175 Multimedia Specialist T B 175 TC175 PC/LAN Analyst T B 175 SB175 Technical Workforce Specialist S B 175 SB180 Assistant Athletic Trainer S B 180 PB180 Police Officer P B 180 SB185 Academic Workforce Advisor S B 185 PB190 Police Investigator P B 190 SB185 Sports Information Officer S B 190 TC190 VC/LAN Analyst T B 190 SB195 Building Services Manager S B 195 TC195 Web Programmer T B 195 SC200 Assistant Director of SFA S C 200 SC200 HR Generalist S C 200 SC200 Instructional Designer S C 200 PC200 Police Sergeant P C 200 SC200 Senior Research & Assessment Analyst S C 200

30
SC200 Unit Enrollment Coordinator- TDCJ S C 200 AC205 Director of Bookstore Svcs A C 205 AC210 Director of Transportation & Logistics A C 210 SC210 Executive Assistant III S C 210 SC210 Senior Acct- Grants S C 210 SC215 Counselor S C 215 SC215 PCI Coordinator S C 215 SC215 SBDC Advisor S C 215 SC220 Librarian S C 220 SC220 LMS Administrator S C 220 SC220 Reference Librarian S C 220 SC220 Senior Acct- Financial Reporting S C 220 AC225 Director of International Students A C 225 TC225 ERP Analyst T C 225 SD230 Asst. Campus Director S D 230 AD230 Director of Media Support Svcs A D 230 AD230 Director of Testing A D 230 AD240 Director of Dual Credit A D 240 AD240 Director of SSS A D 240 AD240 Director of Student Life A D 240 SD240 Head Athletic Trainer S D 240 TD240 Network Administrator T D 240 SD240 Senior Business Analyst S D 240 AD245 Director of Adult & Cont. Ed. A D 245 AD245 Director of Student Pathways A D 245 AD250 Assistant Controller A D 250 AD250 Director of Recruiting & HS Outreach A D 250 AD255 Director of Admissions/Registrar A D 255 AD255 Director of Campus Police A D 255 AD255 Director of Client Support Services A D 255 AD255 Director of Student Housing A D 255 TD255 Systems Administrator T D 255 AD260 Director of Building Services A D 260 AD260 Director of Network Support Svcs A D 260 AD265 Director of Marketing & Communications A D 265 AD270 Director of SBDC A D 270 AD270 Director of System Support Svcs A D 270 AD275 Director of Athletics A D 275 AD275 Director of LRC A D 275

31
AD280 Director of SPEA A D 280 AD280 Associate Provost A D 280 AD280 Director of Financial Aid A D 280 AE285 Director of Acct Svcs/Controller A E 285 AE285 Director of ERP Programming A E 285 AE285 Executive Director of Foundation A E 285 AE295 Director of Human Resources A E 295 AE300 AVP Academic Affairs A E 300 AE300 AVP Instructional Support & Innovation A E 300 AE300 AVP of Enrollment Management A E 300 AE300 AVP of Facilities Mgmt. A E 300 AE300 AVP TDCJ A E 300 AE300 AVP Workforce A E 300 AE305 Provost A E 305 AF350 VP of Admin Svcs/CFO A F 350 AF350 VP of Information Tech. A F 350 AF350 VP of Instruction A F 350 AF350 VP of Student Services A F 350
EXHIBIT 4-3 Proposed Faculty Grades/Levels
Level 0 Level 1 Level 2 Level 3 Level 4 Level 5
Cert/Diploma Bachelor's Master's degree +
0-23 additional graduate hours
Master's degree + 24-44 additional graduate hours
Master's degree + 45 additional
graduate hours Ph.D.
EXHIBIT 4-4 Proposed Faculty Salary Schedule (9-Month)
9 Month Salary Range Min Mid Max
Level 0 $39,900 $46,552 $61,433 Level 1 $43,890 $51,207 $67,577 Level 2 $46,085 $53,768 $70,956 Level 3 $47,928 $55,918 $73,794 Level 4 $49,845 $58,155 $76,745 Level 5 $56,325 $65,715 $86,722

32
Master’s Degree No prior teaching
Experience
Master’s Degree No credit hours
on Doctorate
Master’s Degree No credit hours
on Doctorate
Master’s Degree plus 36 graduate
credit hours
Master’s Degree plus 36 graduate
credit hours
Doctorate (No credit hours
beyond doctorate)
Tyler Jr. College
Angelina College
Kilgore College
Paris Jr. College #
Panola College #
Texarkana College
Trinity Valley Community College #
37,796 45,293** 51,177** 62,692** 66,483** 78,166**
59,745 (7)
43,658 47,423 51,204 56,685 59,328 64,049
36,518 (8) 42,018 (7) 44,077 (7) 51,336 (7) 54,433 (7)
63,005
46,150 51,365 57,872 64,425 64,425 67,564
43,880 47,180 50,480 56,402 59,702
44,100
43,684 47,978 51,828 57,134 60,982
41,100* 41,100 41,100 42,100 42,100
COLLEGE DISTRICT
61,688
Northeast Texas Community College
BASE SALARY – NINE-MONTH CONTRACT
BEGINNING SALARY
AFTER 10 CONSECUTIVE
YEARS
AFTER 15 CONSECUTIVE
YEARS
AFTER 20 CONSECUTIVE
YEARS
AFTER 20 CONSECUTIVE
YEARS
AFTER 5 CONSECUTIVE
YEARS
39,840 43,918 47,604 54,079 57,379
66,317
The faculty salary schedule promotes additional pay for years of experience as well. At year 15 each
year of experience is worth 1.5%, and at year 20 each year of experience is worth 2%. Additionally with
this new schedule this now puts TVCC faculty in line with other institutions as has been brought up in
past budget consultations. See Exhibit 4-5 for the annual East Texas Faculty Salary Survey. In 19-20
TVCC was ranked the lowest starting salary for a faculty member with a Master’s Degree and no prior
teaching experience.
EXHIBIT 4-5 East Texas Community Colleges Survey of Faculty Salaries (2019-2020) *(No data for 2020-2021)
BEFORE

33
AFTER
The proposed salary schedules will feature the following common elements:
For staff, police and public safety, information technology and administration:
• 61 separate pay grades
• a constant range spread of 60% for Grades 100 through 400
• a consistent spread between grades of 3%
In addition to the previously mentioned features, the schedule has a minimum of $25,837 (equivalent to
$12.42 per hour), which is close to the Living Wage (LW) calculation from
https://livingwage.mit.edu/counties/48213, of $12.75 for 1 adult with 0 children, and a constant
midpoint progression between Grades 100 and 400 of 3%.
For Faculty:
• 6 different levels for educational attainment
• Ranges between levels are more consistent
• Ranges between years of experience are 1% until year 15, then goes to 1.5% for years 15-19,
and then 2% for years 20-30.
Master’s Degree No prior teaching
Experience
Master’s Degree No credit hours
on Doctorate
Master’s Degree No credit hours on
Doctorate
Master’s Degree plus 36 graduate
credit hours
Master’s Degree plus 36 graduate
credit hours
Doctorate (No credit hours
beyond doctorate)
Tyler Jr. College 37,796 45,293** 51,177** 62,692** 66,483** 78,166**
COLLEGE DISTRICT
59,328 64,049
Trinity Valley Community College # 46,085 (2) 48,435 (2) 50,906 (5) 58,155 (3) 62,958 (2) 71,143 (2)
Texarkana College 43,658 47,423 51,204 56,685
67,564
Panola College # 43,880 47,180 50,480 56,402 59,702 63,005
46,150 51,365 57,872 64,425 64,425
47,978 51,828 57,134 60,982 66,317
BASE SALARY – NINE-MONTH CONTRACT
BEGINNING SALARY
AFTER 5 CONSECUTIVE
YEARS
AFTER 10 CONSECUTIVE
YEARS
AFTER 15 CONSECUTIVE
YEARS
AFTER 20 CONSECUTIVE
YEARS
AFTER 20 CONSECUTIVE
YEARS
Angelina College 39,840 43,918 47,604 54,079 57,379 61,688
Kilgore College 41,100* 41,100 41,100 42,100 42,100 44,100
Northeast Texas Community College 43,684
Paris Jr. College #

34
• The faculty salary schedule will be used for placement only for new incoming faculty.
• No steps, if the college wishes to do steps then a set amount would need to be
determined and that can be entered into the budget and calculated each year.
In addition to the previously mentioned features, the schedule has a minimum of $39,900 (equivalent to
$19.19 per hour), which is above the Living Wage (LW) calculation from
https://livingwage.mit.edu/counties/48213, of $12.75 for 1 adult with 0 children.
Allocation of Employees within the New Proposed Ranges
• For employees whose current salary level is below the minimum level in the assigned range, the
salary level would be at least to the minimum in the range.
• For employees with current salary levels exceeding the maximum level in the assigned range,
the salary would be frozen at that level, and the employee would be ineligible for any raises
until the range is adjusted to allow movement. (This does not apply to COLA adjustments).
The placement of employees within the newly proposed salary plan is based on a formula
designed to address internal equity. No salary for any employee is recommended for reduction. Each
employee has a calculated target salary and is then recommended for placement in the proposed pay
grade. No salary will be calculated above the range maximum.
Maintaining the Integrity of a Plan Regardless of an institution’s philosophy concerning advancement opportunities afforded to
employees, it is essential that movements in the economy, and more specifically, the labor market in
which the college competes, be addressed at the system level. Accordingly, salary administration
procedures should take their priority based on funding levels and the college’s philosophies on pay.
Cost of Living Increases (COLA) • Any cost-of-living adjustments should be applied to the entire plan.
• If the cost-of-living adjustment is applied to the base salary, then the employee would get the
cost-of-living increase. Employees who are at the maximum of their salary range who are not
eligible to additional compensation can receive the COLA adjustment but nothing above that.

35
Section 5: Personnel Policies and Processes

36
Compensation Philosophy Recommendations As an employer, TVCC embraces a fair and equitable compensation plan to support achievement of
the following goals:
1. The College strives to provide a total compensation program that is fiscally sound and equitable
in the defined marketplace.
2. Benchmarking of select classifications is used as a best practice for compensation of similar
positions.
3. Competitive ranges are established for all positions to provide the flexibility needed to adapt to
market changes, maintain internal equity, and address needs of the College that will ensure a
high level of service to the students and communities that it serves.
4. Starting pay for new employees is based upon education and work experience related to
positional requirements as well as market conditions.
5. Pay adjustments, other than allowances and supplements, should be provided to employees
when appropriate to address equity, market responsiveness, and consistency in the
administration of the College’s compensation program.
6. Employees are eligible for pay increases resulting from true promotions and reclassifications.
7. Pay ranges for TVCC job groups should be reviewed as needed, but not less than every two
years.
Personnel Policies The following recommendations cover both the implementation of the plan, as well as the on-
going administration of the plan. Numerous opportunities exist for varied work experiences and career
advancement within the institution. The following outlines how associated pay changes can be
administered based on the category of change. All final decisions on the administration of pay are
subject to approval. In all instances of employee/job reassignment, the employee would be placed in the
range, not to exceed the maximum of the range unless specifically stated.
Reclassification When a class has been reclassified to a higher pay grade, the employee’s salary shall increase at
least 3%, but not more than the maximum salary of the new pay grade.
If the reclassification results in an upgrade of one pay grade, the employee’s pay will be moved
upward by 3%. An upgrade of two or more pay grades will increase the employee’s pay by an additional
2% increase for each additional pay grade, up to a maximum of 10%.

37
Any increase of more than 10% would require documentation by the department or agency and
a supporting recommendation from Human Resources. For an individual reclassification, done outside
the normal budget cycle, the effective date of the pay increase will be consistent with the next full pay
period. Reclassification or changes in pay grade, whether resulting from an internal or external
compensation study or individual change in pay grade, shall not be retroactive.
Internal Equity Adjustments, because of the implementation of a system-wide study, shall not be
subject to the same guidelines as the “Reclassification” guideline. Internal Equity Adjustments can be the
result of the application of a formula, applied to all positions in the same pay plan, and are done to ensure
employees’ salaries are internally equitable and are not done to reflect an individual “job audit” of a single
member incumbent. Internal Equity Adjustments are also not tied to performance measures. TVCC may
determine an Internal Equity Adjustment strategy that is separate and apart from the guidelines that
cover reclassification.
A reclassification that results in movement to a lower pay grade shall be processed in the same
manner as a demotion. In the case of a voluntary demotion, or the reclassification of a position to a lower
pay grade, adjustment to an employee’s salary will be made as follows:
• a 3% salary reduction for a demotion of one pay grade level,
• a 5.5% salary reduction for a demotion of two pay grade levels,
• an added 1.5% salary reduction for each additional pay grade level thereafter.
If, after the pay grade adjustment, the employee(s) salary is greater than the maximum salary of the
new pay range, the employee will continue to be paid at the higher rate of pay for the remainder of the
current fiscal year and through the last day of the next full fiscal year. On the first day of the subsequent
fiscal year the salary will be adjusted to the maximum salary of the assigned pay grade.
Promotion A promotion is an appointment to a position in a classification with a higher pay grade. An
employee may be promoted while in any status if they have established current eligibility for the
promotional position. Promotional recruitment shall be open only to current TVCC employees who have
been employed at least 90 days prior to the posting of the job announcement.
An employee may be appointed to serve regular appointed or temporarily in a higher class upon
the recommendation of the Department Supervisor and approval of the Director of Human Resources,
provided that the employee meets the eligibility requirements of such higher classification. A temporary
38
promotional appointment shall not exceed one (1) year but may be extended upon approval by the
Director of Human Resources. Once the temporarily promoted employee is no longer performing the
duties of the higher classification, the employee shall be returned to his/her former classification and
position and to the salary at which he/she would have been entitled had he/she remained in the
position.
Whenever an employee receives a temporary or regular appointed promotion, the employee’s
salary rate shall be adjusted upward by 10% or to the minimum of the pay grade for the employee’s new
position, whichever is greater. A Department Supervisor may request a salary adjustment above 10% or
the minimum of the pay grade when an employee who is promoted to an interim position and possesses
specialized training, skills, experience or an advanced or professional degree directly related to the work
of the position. The Department Head’s request is subject to both approval of the Director of Human
Resources and budget availability. The Director of Human Resources may develop a systematic method
to be used for placement of such employees within a pay range.
The Human Resources Department shall maintain copies of written requests for salary increases
above 10% or the minimum of the pay grade and the decisions regarding the same for a minimum of
three (3) years.
Lateral Transfers A lateral transfer occurs when an employee is transferred from one job class to another in the
same, or substantially equivalent, pay grade. When there is no change in pay grade there shall be no
adjustment in base salary. A lateral transfer is not considered a reclassification or a promotion. Lateral
transfers from one pay plan to another will result in the employee being placed in the new pay range at
the same salary.
Hiring • A new full-time employee’s salary is the sum of the minimum of the salary range, plus an
amount equal to one percent of the minimum of the salary range, times the number of years of
job-related experience (up to ten years within the last twelve years.)
• New part-time employees are hired at the minimum of the position’s assigned pay grade. The
part-time hourly rate of pay is calculated based on the annualized pay grade minimum, divided
by 1950, 2080, or 2160, depending on the position.
• In limited circumstances for hard-to-fill positions, placement recommendations may be adjusted
from these experience formulas upon recommendation by the Director of Human Resources.
The hiring rate for a new employee with no additional equivalent and/or relevant level

39
experience over the requirement is the minimum of the salary range to which the job
classification is assigned. Salary Rate Determination is calculated in accordance with the
systematic method developed by the Director of Human Resources for use in determining the
placement of employees within a pay range.
• Upon approval by the Director of Human Resources, a new employee appointed to a position
may be offered an entry salary rate above the minimum rate of the salary range for the position.
To obtain approval to offer an entry salary above the minimum rate, a department supervisor
must submit a written request to the Director of Human Resources. In recommending an entry
salary rate above the minimum rate of the salary range for a position, a Department supervisor
shall consider an applicant’s prior experience, education, unique competencies, and other
qualifications directly related to the position as well as internal budget constraints.
• Former TVCC employees who (a) left their employment in good standing; who were not
terminated from employment; (c) who have no disciplinary actions, including written warnings,
written reprimands, demotions or suspensions within the twenty-four (24) months preceding
their separation; and (d) who apply for re-employment to a position within the same pay grade
within six (6) months from the date of their most recent separation from a regular appointed
position may be re-hired at the same salary rate of the position held when separated, subject to
budget availability. If a former employee is re-hired into a position with a higher salary grade,
the employee may receive the equivalent of either their salary at separation or the minimum of
the salary range for the new position, whichever is greater, and this shall not trigger the raising
of salaries of incumbent employees. The employee must meet current standards and eligibility
requirements for the class in which the employee is re-hired.
• Difficult to fill positions include those that have not received adequate interest to select a
qualified candidate and/or where a job offer has been made that is rejected by one or more
qualified applicants.
• Internal Equity is an equally important consideration in filling a vacant position. Before a salary
offer is made, Human Resources will also consider the current salaries and length of service in
the same/similar job class or classes of current incumbents. It is the policy of college to make
every effort to avoid inverted salary relationships by bringing in newly hired employees at a
salary or rate that exceeds the current salaries of comparably placed existing employees in the
same/similar job class.
• The Human Resources department may additionally consider current salary if the open position

40
is determined to be a “hard to fill” position. “Hard to fill” positions will be determined by the
college based on recommendations and documentation by the Human Resources department
and will be based on the length of time the position has remained unfilled, the difficulty to
recruit, and the market conditions of the position, at the time of a vacancy.
• Hiring Range is typically considered that span in salary between the minimum of the range and
the midpoint for most positions. For Administration level positions, the qualifications of the
applicant and/or the needs of the college should include the discretion to hire anywhere within
the range. However, consideration should still be given to existing salaries of other employees
who are in directly comparable positions.
Maximum of the Range Ranges are established to reflect the market value of a job and not an incumbent. Once an
employee reaches the maximum of his/her assigned range, the salary is frozen, and the employee is not
eligible for any additional compensation unless there is a range movement that would result in a higher
maximum.
Future Salary Adjustment Recommendations
The cost to implement and maintain the compensation system should be driven by changes in
the labor market and should be applied globally to the system, which, in turn, adjusts each salary range.
Compensation systems that are well maintained address two primary issues on an annual basis:
• the cost to maintain competitiveness within the system; and,
• The cost to adjust individual salaries.
From time to time, the college may determine the need to adjust pay grades/ranges based on
some factor, such as the Economic Cost Index (ECI) or the Consumer Price Index (CPI) to maintain
competitiveness at salary range minimums and hiring rates, as well as accommodate current incumbent
pay progression within the grades. Ideally, funding permitting, the college should conduct a
salary/market review periodically to assess market conditions and ensure a competitive posture in
personnel recruitment and retention. At this time, a more detailed comparison to the external market,
as well as, to immediate competitors can be made using a comprehensive methodology such as that
used in this review.

41
Section 6: Implementation and Costs

42
Plan Implementation
TVCC HR recommends that the new compensation structure go into effect as soon as feasible
along with the recommended salary adjustments. The Implementation model brings any current
employee whose base salary is below the proposed minimum up to the minimum. For those employees
whose current base pay exceeds the proposed minimums, no change is recommended to their salaries
at this time because they are paid within the proposed salary range, which reflects current market
conditions.
TVCC HR recognizes that implementation of the new or revised compensation and classification
programs must consider the financial disposition, current salary levels, and other variables unique to the
College. Only after all of these factors are considered can a feasible implementation program be
designed. TVCC HR has worked to provide implementation options that will permit the College to
address the current inequities and will provide a framework for external competitiveness.
It is especially important that during the current economic times that the College retain its
highly qualified work force by providing a fair, and competitive, compensation program. Additionally, it
is equally important, that the College does not overpay for positions. The proposed implementation plan
carefully attempts to balance these two important considerations.
Purpose of the Implementation Plan
The foundation of the implementation calculation is one that is forward looking and does not
look back on how current salaries came about. Transition to a new plan is not meant to change every
pay decision, promotion or other legal changes in salary that have occurred over the tenure of the
employee; nor is it meant to pretend the new pay structure should be retroactive in concept to the day
an employee was hired.
To the extent that any uniform formula may result in unintended consequences, there may be
isolated instances where administrative adjustments would be needed to address an inequity that is not
readily apparent. This is not intended to address internal inequities, perceived by employees that might
result from previous pay structures or previous pay decisions. TVCC HR assumes that all previous salary
changes were based on information that was considered valid and appropriate at the time the decision
was made.

43
As part of the overall study, observations and recommendations regarding personnel policies and
processes directly related to the implementation and subsequent administration of the proposed pay
plans were discussed.
Options
As part of this study, TVCC HR is presenting various implementation options for transitioning the College from the old pay structure to the new pay structure, each of which carries different annual fiscal impacts.
The options and their operational definitions are:
• Bring to New Minimum (BNM) – This approach maintains current employee salaries unless their
existing salary falls below their newly assigned pay grades minimum. When this occurs, the
employee’s salary is raised to the new minimum.
• Classification Date Parity (CDP) – Each employee's salary is placed within their recommended
range based on how long they have worked in their current position.
• Total YOE (10 Yr. Cap) (TOT) – Each employee’s salary placed within their recommended range
based on how long they have worked in in their current position, along with any prior applicable
experience within the last 12 years that is comparable, with a cap of 10 years.
• Hybrid- Upon analyzing the data HR found that using the CDP for faculty, and TOT for staff
brought about the best results in terms of amount of employee adjustments, compression, and
overall streamlines employees’ salaries along with their classifications appropriately.
There is not a “correct” approach for transitioning employees into the proposed system and each has its
own unique strengths. For example, a strength of the Bring to New Minimum approach is that it
minimizes transition costs, however, can cause issues when hiring in new employees with the new
ranges, whereas a strength of the Classification Date Parity and the Hybrid model is that it addresses
compression to the extent possible, however, the costs may not be feasible.
Implementation Costs
Implementation options and recommendations consider the following:
• Current salary.
• Current job title or rank; and,
• Longevity with TVCC.

44
HR has calculated a target salary for each employee that fairly and equitably makes an
adjustment. If the employee’s current salary exceeds the target salary, then the calculations did not
provide any further adjustment. No employee is recommended for any decrease in salary, even if the
current salary substantially exceeds the target salary. TVCC HR does recommend that any employee
whose current salary exceeds the target salary should continue to advance through the ranges until they
reach the range maximum.
No employee should receive any additional salary adjustments once their salary has reached the
maximum of the range. The recommendation is to freeze the salary until there is sufficient market
adjustment to provide an increase. Exhibit 6-1 shows the implementation cost for the option that is the
best fit for the college, the number of employees impacted by the change, the average adjustment for
those receiving adjustments, and the average magnitude of the change on the impacted employees.
EXHIBIT 6-1 Implementation Options and Costs
Option Total
Implementation cost (approx.)
# of Employees Receiving
Adjustments
% of Employees Receiving
Adjustments
Average Salary Adjustment
Average Percentage Adjustment
HYBRID $974,886.16 177 55.5% $5,466.28 Staff - 16.3%
Faculty - 8.6%
The method of moving salaries through the salary schedule and setting new salaries for new hires, skill-
based pay, market adjustments, promotions, and transfers depends largely on an organization’s
compensation philosophy. It is important for the College to have established guidelines for each of these
situations and to ensure that they are followed consistently for all employees. Common practices for
progressing and establishing employee salaries are outlined below.
Salary Progression As outlined above, TVCC HR recommends that the College implement the new salary schedule which
would involve an adjustment of employee salaries to ensure they are properly placed in the proposed
salary schedule. While this major adjustment should be performed when financial feasible, the College

45
should also adjust salaries annually. TVCC HR recommends that the basis of salary adjustment in the
future be done at two distinct levels:
1. Structural: Adjustment to the pay ranges should be done annually, with the aim of adjusting for
the changes in cost-of-living. TVCC HR recommends the College tie the annual compensation
structure movement to the local change in the Consumer-Price-Index (CPI). This annual
adjustment will ensure pay ranges do not rapidly fall out of line with that of market peers.
However, when conducting small-scale surveys, the College should also collect salary schedule
movement and anticipated movement from its peers to gauge if market movement is keeping
pace with CPI movement.
2. Classification: As a result of the market surveys, the College may identify classifications or job
families that are experiencing considerable market movement and, as a result, reassignment of
the pay grades should be considered when this occurs. Alternatively, for any classifications that
have become hard to recruit and retain, pay grade reassignment should also be considered to
ensure the College is competitive for both recruiting new talent and retaining existing
employees.
While it is unlikely that all classifications will need to be analyzed and adjusted for several years, a
small number of classification pay grades may need to be reassigned more frequently. If one or more
classifications are exhibiting high turnover or are having difficulty with recruitment, the College should
collect salary range data from peer organizations to determine whether an adjustment is needed for the
pay grade of the classification(s). If increasing a classification’s pay grade based on market data does not
help with the recruitment and/or retention issues, it may be necessary for the College to offer incentives
to attract employees to the position and/or to encourage employees to remain in the position.
In order to maintain competitiveness between compensation and classification studies, the College
should continue adjusting its salary schedule on an annual basis, as required. In addition to using the
consumer price index (CPI) values for cost of living adjustments, the College would benefit from also
contacting the local peer group and determining the approach to salary schedule adjustments made by
peers. The College may find it struggles to navigate through changing economic conditions and with
organizations competing for the same human resources. For this reason, the College should conduct a
comprehensive classification and compensation study every three years.
An established process allows for assessment of a classification to determine if, internally, it is
compensated equitably in comparison to other like classifications and assists with collecting the data

46
necessary to determine if the classification is titled correctly. A well-established schedule allows for
evaluation of positions— as requested by employees or supervisors—when there is evidence that a
position’s primary duties have changed, when a classification is newly created, and/or at regular
intervals to ensure that slotting relationships are maintained across the organization.
In Closing The objective of this Job Classification and Compensation Study was to improve the internal and
external equity of both the structure by which employees are compensated, as well as the way positions
relate and compare to one another across the institution. This was accomplished by analyzing data
gathered internally and externally, which informed the recommendations made in this report.
Combining the market data with the internal data gathered through the PDQ process, TVCC HR
was able to make recommendations which improve the equity and competitiveness of the College’s pay
structure and the placement of classifications within that structure. Using the market data that was
obtained for the 20-21 fiscal year, by adopting the proposed salary schedule and grade order list for the
21-22 fiscal year, the College’s salary schedule will move to at market for all positions at TVCC. The
recommendation in this report provides a competitive compensation structure— internally aligned with
the classification structure—and system administration practices that will provide TVCC with a
responsive compensation and classification system for years to come. While the upkeep of this
recommended system and associated pay and classification guidelines will require work, the College will
find that having a competitive compensation and classification system that encourages strong
recruitment and employee retention is well worth the effort.