Embed Size (px)
Citation preview
University of Tennessee, KnoxvilleTrace: Tennessee Research and CreativeExchange
Doctoral Dissertations Graduate School
5-2007
Job Satisfaction and Work Ethic among Workers ina Japanese Manufacturing Company Located in theUnited StatesSamuel L. ElkinsUniversity of Tennessee - Knoxville
This Dissertation is brought to you for free and open access by the Graduate School at Trace: Tennessee Research and Creative Exchange. It has beenaccepted for inclusion in Doctoral Dissertations by an authorized administrator of Trace: Tennessee Research and Creative Exchange. For moreinformation, please contact [email protected].
Recommended CitationElkins, Samuel L., "Job Satisfaction and Work Ethic among Workers in a Japanese Manufacturing Company Located in the UnitedStates. " PhD diss., University of Tennessee, 2007.https://trace.tennessee.edu/utk_graddiss/159
brought to you by COREView metadata, citation and similar papers at core.ac.uk
provided by University of Tennessee, Knoxville: Trace
To the Graduate Council:
I am submitting herewith a dissertation written by Samuel L. Elkins entitled "Job Satisfaction and WorkEthic among Workers in a Japanese Manufacturing Company Located in the United States." I haveexamined the final electronic copy of this dissertation for form and content and recommend that it beaccepted in partial fulfillment of the requirements for the degree of Doctor of Philosophy, with a major inEcology and Evolutionary Biology.
Ernest W. Brewer, Major Professor
We have read this dissertation and recommend its acceptance:
Gregory C. Petty, Ralph G. Brockett, Doo Lim
Accepted for the Council:Dixie L. Thompson
Vice Provost and Dean of the Graduate School
(Original signatures are on file with official student records.)
To the Graduate Council: I am submitting herewith a dissertation written by Samuel L. Elkins entitled “Job Satisfaction and Work Ethic among Workers in a Japanese Manufacturing Company Located in the United States.” I have examined the final electronic copy of this dissertation for form and content and recommend that it be accepted in partial fulfillment of the requirements for the degree of Doctor of Philosophy, with a major in Human Ecology. Ernest W. Brewer, Major Professor We have read this dissertation and recommend its acceptance: Gregory C. Petty, Professor Ralph G. Brockett, Professor Doo Lim, Assistant Professor Accepted for the Council: Vice-Provost and Dean of the Graduate School Original signatures on file with official student records.
JOB SATISFACTION AND WORK ETHIC AMONG WORKERS IN A JAPANESE MANUFACTURING COMPANY LOCATED
IN THE UNITED STATES
A Dissertation Presented for the
Doctor of Philosophy Degree The University of Tennessee, Knoxville
Samuel L. Elkins May 2007
ACKNOWLDEGEMENTS
I sincerely wish to thank everyone who provided guidance, support and
encouragement to me while accomplishing this academic endeavor. The following
individuals were my greatest allies in this accomplishment: My dissertation committee,
Dr. Ernest W. Brewer, Professor and Committee Chair, Dr. Ralph Brockett, Professor and
Committee Member, Dr. Gregory Petty, Professor and Committee Member and Dr. Doo
Lim, Assistant Professor and Committee Member, provided me with their expertise and
insight. I also want to thank my editor, Ms. Kristina McCue for her professional help.
Mr. Jim Woroniecki, Senior Vice President of Human Resources, generously allowed me
to gather data at a local manufacturing company, making this study possible. Finally, the
encouragement and help of my dear wife, Elizabeth, and my sons, Joshua and Caleb,
were a constant inspiration. This accomplishment was difficult and required me to lean
on the strength of my Lord and His grace to get through it successfully.
ii
ABSTRACT
This correlational and descriptive study synthesizes previous research regarding
the impact of work ethic on job satisfaction when moderated by demographics, work
dynamics, and occupational choice. Data from a sample of both exempt and non-exempt
workers working at a Japanese-owned manufacturing plant was used to explore the
relationship between the levels of job-satisfaction and work ethic reported by workers in
various job categories and working environments. The sample consisted of 462
individuals who were identified using a stratified sampling of equal size. The study
obtained responses from 328 workers through a respondent and non-respondent survey,
representing 70% response rate. The researcher concluded that the 66 non-respondents
could be included in the statistical analysis without prejudice toward the OWEI
instrument; however, special attention should be given to any findings involving the JSS
subscale Fringe Benefits due to differences between respondents and non-respondents.
Specials examination was also given to the demographic variables of age and country.
The researcher employed two robust tests, Wilks’s Lambda and Pillai’s Trace, to mitigate
differences between respondents and non-respondents. Exempt workers made up 46.6%
of the sample, and non-exempt workers represented 53.4%. The researcher used the
Pearson r and the Multiple Analysis of Variance (MANOVA) in analyzing data. The
OWEI and JSS instruments showed an overall positive, by low though significant
correlation. Differences were identified between exempt and non-exempt workers in
various job categories. This study should be of value to human resource practitioners
interested in improving the level of job satisfaction among varied work groups.
iii
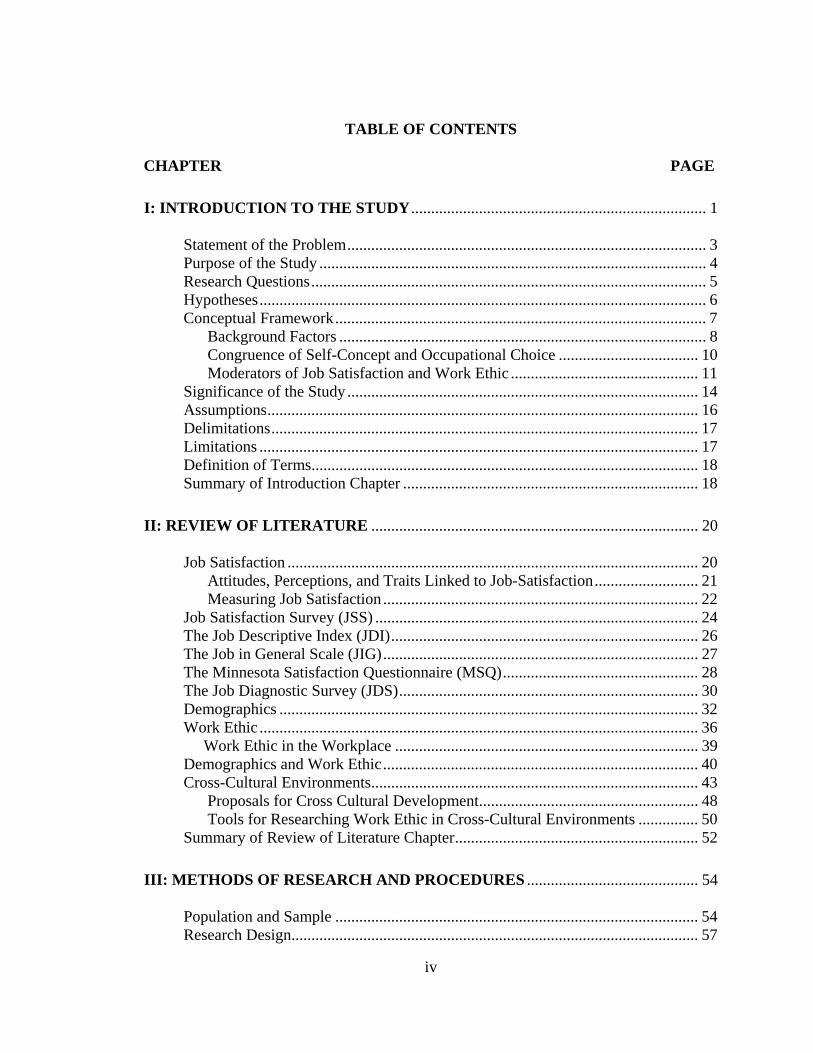
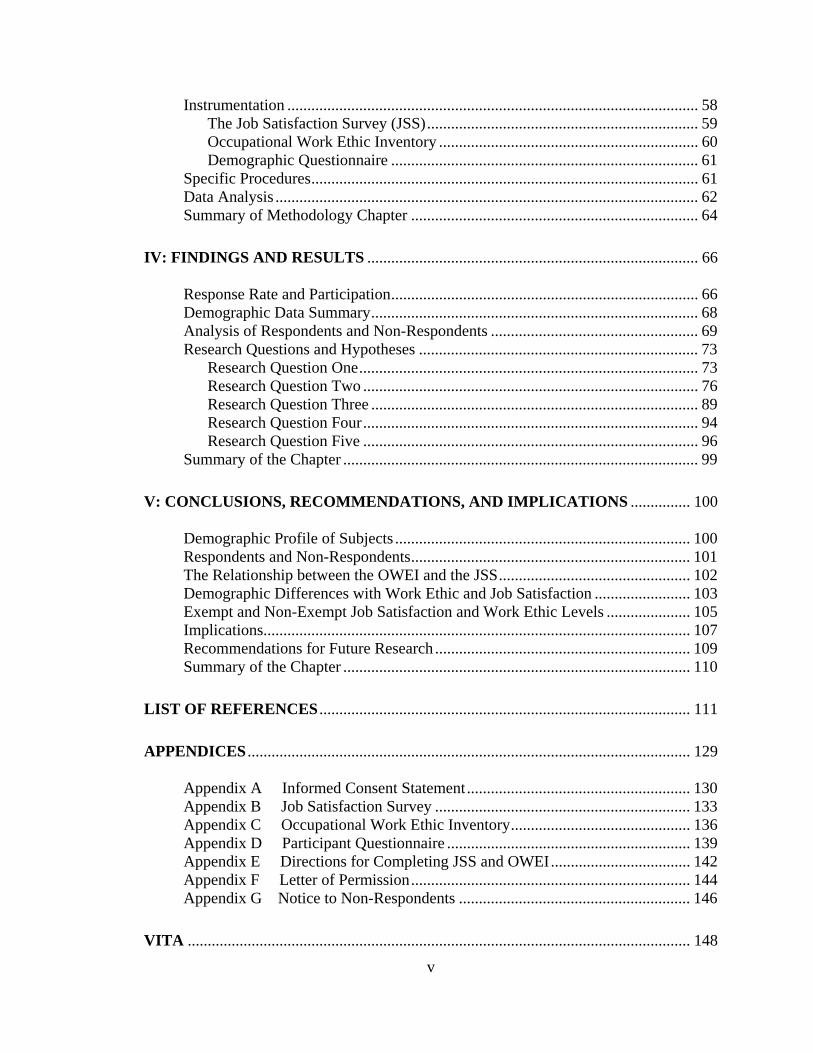
TABLE OF CONTENTS CHAPTER PAGE
I: INTRODUCTION TO THE STUDY.......................................................................... 1 Statement of the Problem.......................................................................................... 3 Purpose of the Study ................................................................................................. 4 Research Questions................................................................................................... 5 Hypotheses................................................................................................................ 6 Conceptual Framework............................................................................................. 7
Background Factors ............................................................................................ 8 Congruence of Self-Concept and Occupational Choice ................................... 10 Moderators of Job Satisfaction and Work Ethic ............................................... 11
Significance of the Study ........................................................................................ 14 Assumptions............................................................................................................ 16 Delimitations........................................................................................................... 17 Limitations .............................................................................................................. 17 Definition of Terms................................................................................................. 18 Summary of Introduction Chapter .......................................................................... 18
II: REVIEW OF LITERATURE .................................................................................. 20 Job Satisfaction ....................................................................................................... 20
Attitudes, Perceptions, and Traits Linked to Job-Satisfaction.......................... 21 Measuring Job Satisfaction ............................................................................... 22 Job Satisfaction Survey (JSS) ................................................................................. 24 The Job Descriptive Index (JDI)............................................................................. 26 The Job in General Scale (JIG)............................................................................... 27 The Minnesota Satisfaction Questionnaire (MSQ)................................................. 28 The Job Diagnostic Survey (JDS)........................................................................... 30 Demographics ......................................................................................................... 32 Work Ethic .............................................................................................................. 36 Work Ethic in the Workplace ............................................................................ 39 Demographics and Work Ethic............................................................................... 40 Cross-Cultural Environments.................................................................................. 43
Proposals for Cross Cultural Development....................................................... 48 Tools for Researching Work Ethic in Cross-Cultural Environments ............... 50
Summary of Review of Literature Chapter............................................................. 52
III: METHODS OF RESEARCH AND PROCEDURES ........................................... 54 Population and Sample ........................................................................................... 54 Research Design...................................................................................................... 57
iv
Instrumentation ....................................................................................................... 58 The Job Satisfaction Survey (JSS).................................................................... 59
Occupational Work Ethic Inventory ................................................................. 60 Demographic Questionnaire ............................................................................. 61 Specific Procedures................................................................................................. 61 Data Analysis .......................................................................................................... 62 Summary of Methodology Chapter ........................................................................ 64
IV: FINDINGS AND RESULTS ................................................................................... 66 Response Rate and Participation............................................................................. 66 Demographic Data Summary.................................................................................. 68 Analysis of Respondents and Non-Respondents .................................................... 69 Research Questions and Hypotheses ...................................................................... 73
Research Question One..................................................................................... 73 Research Question Two .................................................................................... 76 Research Question Three .................................................................................. 89 Research Question Four.................................................................................... 94 Research Question Five .................................................................................... 96
Summary of the Chapter ......................................................................................... 99
V: CONCLUSIONS, RECOMMENDATIONS, AND IMPLICATIONS ............... 100 Demographic Profile of Subjects .......................................................................... 100 Respondents and Non-Respondents...................................................................... 101 The Relationship between the OWEI and the JSS................................................ 102 Demographic Differences with Work Ethic and Job Satisfaction ........................ 103 Exempt and Non-Exempt Job Satisfaction and Work Ethic Levels ..................... 105 Implications........................................................................................................... 107 Recommendations for Future Research ................................................................ 109 Summary of the Chapter ....................................................................................... 110
LIST OF REFERENCES ............................................................................................. 111
APPENDICES ............................................................................................................... 129 Appendix A Informed Consent Statement........................................................ 130 Appendix B Job Satisfaction Survey ................................................................ 133 Appendix C Occupational Work Ethic Inventory............................................. 136 Appendix D Participant Questionnaire ............................................................. 139 Appendix E Directions for Completing JSS and OWEI................................... 142 Appendix F Letter of Permission...................................................................... 144 Appendix G Notice to Non-Respondents .......................................................... 146
VITA .............................................................................................................................. 148
v
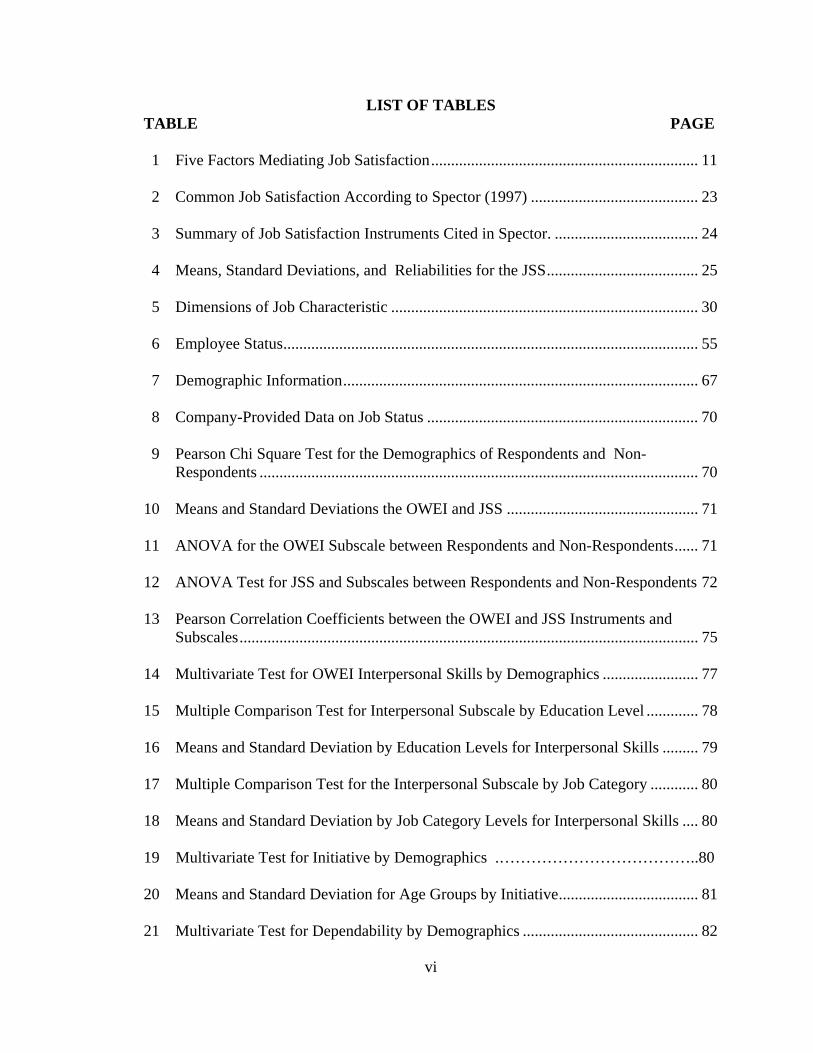
LIST OF TABLES TABLE PAGE 1 Five Factors Mediating Job Satisfaction................................................................... 11 2 Common Job Satisfaction According to Spector (1997) .......................................... 23 3 Summary of Job Satisfaction Instruments Cited in Spector. .................................... 24
4 Means, Standard Deviations, and Reliabilities for the JSS...................................... 25 5 Dimensions of Job Characteristic ............................................................................. 30 6 Employee Status........................................................................................................ 55 7 Demographic Information......................................................................................... 67 8 Company-Provided Data on Job Status .................................................................... 70 9 Pearson Chi Square Test for the Demographics of Respondents and Non-
Respondents .............................................................................................................. 70 10 Means and Standard Deviations the OWEI and JSS ................................................ 71 11 ANOVA for the OWEI Subscale between Respondents and Non-Respondents...... 71 12 ANOVA Test for JSS and Subscales between Respondents and Non-Respondents 72 13 Pearson Correlation Coefficients between the OWEI and JSS Instruments and
Subscales................................................................................................................... 75 14 Multivariate Test for OWEI Interpersonal Skills by Demographics ........................ 77 15 Multiple Comparison Test for Interpersonal Subscale by Education Level ............. 78 16 Means and Standard Deviation by Education Levels for Interpersonal Skills ......... 79 17 Multiple Comparison Test for the Interpersonal Subscale by Job Category ............ 80 18 Means and Standard Deviation by Job Category Levels for Interpersonal Skills .... 80 19 Multivariate Test for Initiative by Demographics .………………………………..80 20 Means and Standard Deviation for Age Groups by Initiative................................... 81 21 Multivariate Test for Dependability by Demographics ............................................ 82
vi
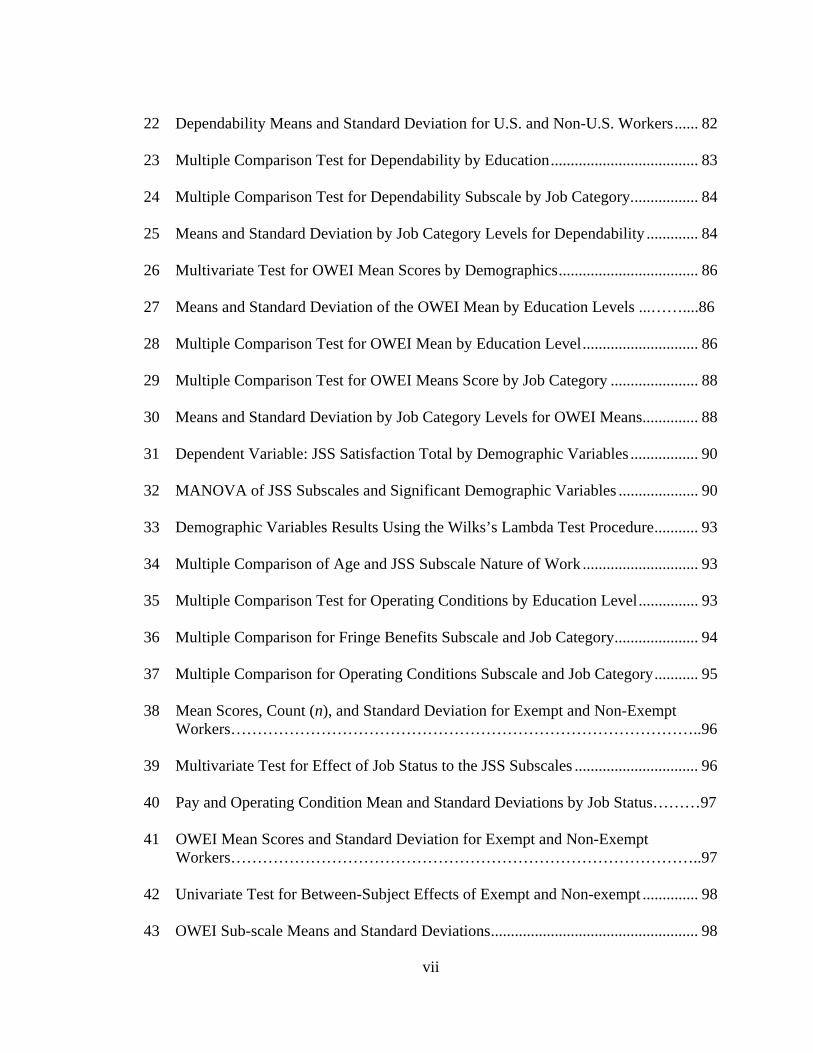
22 Dependability Means and Standard Deviation for U.S. and Non-U.S. Workers...... 82 23 Multiple Comparison Test for Dependability by Education..................................... 83 24 Multiple Comparison Test for Dependability Subscale by Job Category................. 84 25 Means and Standard Deviation by Job Category Levels for Dependability ............. 84 26 Multivariate Test for OWEI Mean Scores by Demographics................................... 86 27 Means and Standard Deviation of the OWEI Mean by Education Levels ...……....86 28 Multiple Comparison Test for OWEI Mean by Education Level............................. 86 29 Multiple Comparison Test for OWEI Means Score by Job Category ...................... 88 30 Means and Standard Deviation by Job Category Levels for OWEI Means.............. 88 31 Dependent Variable: JSS Satisfaction Total by Demographic Variables ................. 90 32 MANOVA of JSS Subscales and Significant Demographic Variables .................... 90 33 Demographic Variables Results Using the Wilks’s Lambda Test Procedure........... 93 34 Multiple Comparison of Age and JSS Subscale Nature of Work ............................. 93 35 Multiple Comparison Test for Operating Conditions by Education Level............... 93 36 Multiple Comparison for Fringe Benefits Subscale and Job Category..................... 94 37 Multiple Comparison for Operating Conditions Subscale and Job Category........... 95 38 Mean Scores, Count (n), and Standard Deviation for Exempt and Non-Exempt Workers……………………………………………………………………………..96 39 Multivariate Test for Effect of Job Status to the JSS Subscales ............................... 96 40 Pay and Operating Condition Mean and Standard Deviations by Job Status………97 41 OWEI Mean Scores and Standard Deviation for Exempt and Non-Exempt Workers……………………………………………………………………………..97 42 Univariate Test for Between-Subject Effects of Exempt and Non-exempt .............. 98 43 OWEI Sub-scale Means and Standard Deviations.................................................... 98
vii
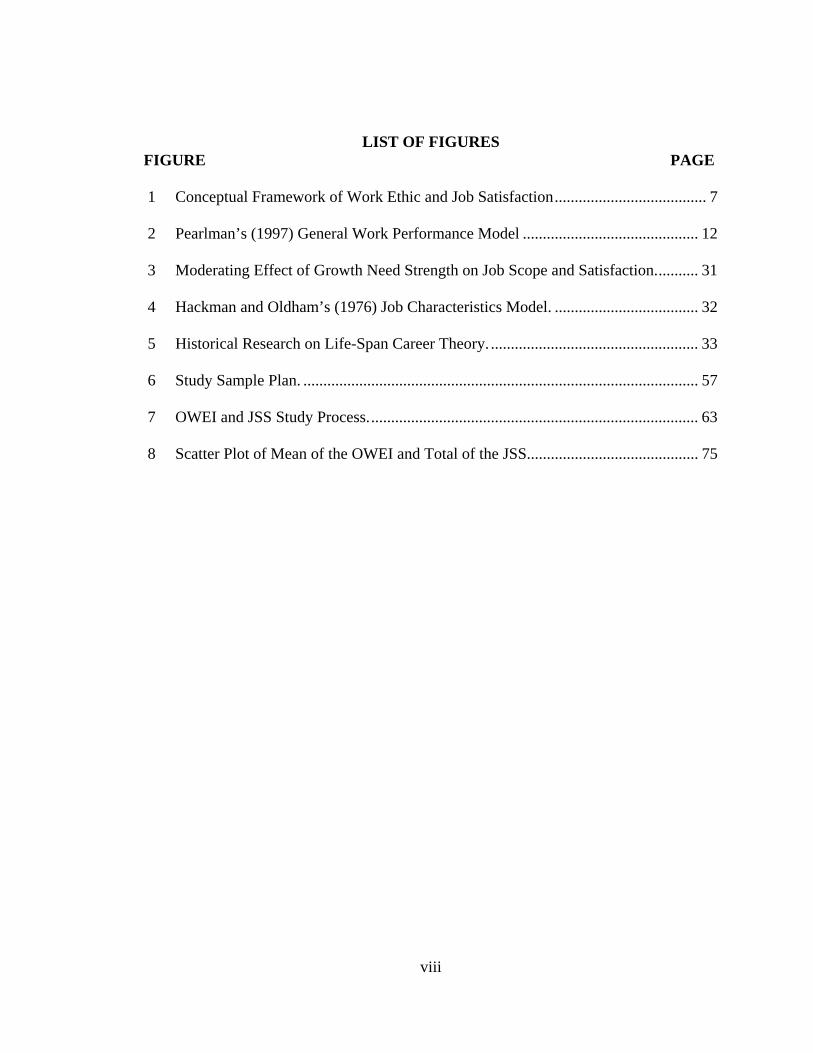
LIST OF FIGURES FIGURE PAGE 1 Conceptual Framework of Work Ethic and Job Satisfaction...................................... 7
2 Pearlman’s (1997) General Work Performance Model ............................................ 12
3 Moderating Effect of Growth Need Strength on Job Scope and Satisfaction........... 31
4 Hackman and Oldham’s (1976) Job Characteristics Model. .................................... 32
5 Historical Research on Life-Span Career Theory. .................................................... 33
6 Study Sample Plan. ................................................................................................... 57
7 OWEI and JSS Study Process................................................................................... 63
8 Scatter Plot of Mean of the OWEI and Total of the JSS........................................... 75
viii
CHAPTER I
INTRODUCTION TO THE STUDY
Human Resource practitioners have consistently emphasized the importance of
paying attention to the workforce of an organization. Recent evidence has suggested that
higher levels of employee satisfaction among the workforce leads to corporate profits and
reduction of costly turnover (Bontis & Fitz-enz, 2002). Research by Verreault and
Hyland (2005) suggests that organizations need to pay more attention to practices that
impact the performance of employees and audit these practices regularly.
The widespread shift in labor patterns and the flexibility of companies in moving
operations around the world, along with the passage of the North American Free Trade
Agreement (NAFTA), will continue to encourage partnerships between countries (Elkins,
2001). The responsibility entailed in managing these new global partnerships will require
that leaders better understand cultural differences (Black & Porter, 1991). Furthermore,
differences in work ethics in various cultures may also impact the satisfaction of workers
in these diverse workforce situations.
One assumption easily made is that those workers with high levels of job
satisfaction are equally inclined to possess positive personal characteristics that moderate
their attitude toward work (Kirkman & Shapiro, 1997). Poling (as cited in Scott,
Swortzel, & Taylor, 2005) also provided additional evidence to support this assumption.
The addition of empirical evidence indicating that satisfied workers are more inclined to
posses qualities that contribute to the accomplishment of organizational goals will add to
the current body of knowledge surrounding this phenomenon.
1
Recent studies examining the connection of demographic variables and work ethic
have been completed (Brauchle & Asam, 2004). More recently, comparisons between the
work ethic of supervisors and the employees they manage have been studied (Petty &
Hill, 2005). Additionally, historical research (Williams & Sandler, 1995) examined the
predictive value of work values to job satisfaction among cross-cultural comparative
sample groups. These studies have added to the understanding of and links between job
satisfaction and work ethic. However, these two constructs have yet to be fully
researched and mined to determine any predictive correlation. A practical assumption is
that one might find a connection between these two constructs in the examination of
organizational human resource programs and actual work performance outcomes.
Therefore, this study includes a review of the existing research regarding these two
constructs as well as considering the impact that cross-cultural work environments might
have on mediating various outcomes such as job satisfaction.
A strategic point for business leaders planning for the future in the new global
economy will no doubt include human resource development (Lim, 2001), which may
include determining how to select employees who will be successful in various work
environments. One may conclude that the work ethic of these employees may also impact
their development and the way in which learning programs should be designed for them.
The complexity of the process used to prepare employees for their work activities may
also impact their job satisfaction.
The literature regarding cross-cultural differences among companies in the United
States and abroad contains several examples of concerns that impact learning new
concepts in cross-cultural settings (Lim, 2001). Furthermore, Black and Porter (1991)
2
found that lack of training and competence in dealing with cross-cultural differences
usually resulted in unfavorable results when expatriates failed to adjust their management
styles to the cultural work ethics of their host country. Understanding the impact of these
practices on job satisfaction and work ethic among employees from different cultures
may help mediate this problem in organizations. Black, Gergersen, and Mendenhall
(1992) suggested that this lack of cross-cultural understanding might lead to significant
failure rates in achieving management goals and objectives.
Therefore, it is incumbent upon companies to begin understanding the variables
that impact worker performance, satisfaction, and individual work ethics. Models for
selecting, managing, and retaining a workforce can then be enhanced to ensure
congruence with the traits of workers and potential employers in order to predict
favorable results for both.
Statement of the Problem
Petty (as cited in Kirkman & Shapiro, 1997) suggested workers’ cultural values
impact their level of satisfaction and organizational commitment. A person’s values may
also impact his/her work ethic. However, characteristics that are correlated to a strong
work ethic have not yet been fully mined to determine their impact on job performance
and possible job satisfaction (Petty & Hill, 2005). The continued addition of research to
help fill in the existing gaps of these phenomena may reduce the confusion that now
exists. Furthermore, the results of more study may benefit both individuals and
organizations interested in making improvements in both work ethic and job satisfaction
among a culturally diverse workforce.
Westwood (as cited in Williams & Sandler, 1995) posited that one’s work ethic
3
impacts the value he or she places on work and creates a positive attitude, which suggests
a certain level of satisfaction with the work in which one is involved. In addition, the
existing work orientations of various cultures are hypothesized to account for differences
in the attitudes of workers (Hofstede, 1980). However, some comparative management
studies have failed to find significant cross-cultural differences in employee work-related
attitudes (Chang, 1985; Elizur, Borg, Hunt, & Magyaribeck, 1991; Woodruffe, 1999).
Others (Yiu & Saner, 2000) have found some congruence in these attitudes that suggests
that the relationship between cultural work values and attitudes may be more complex
than initially theorized. Again, we find dissimilar results that provide researchers
opportunities to add to the body of knowledge in these areas.
This study seeks to answer several questions important to the success of
organizations with different cultural management practices in accomplishing their goals
and objectives. Specifically, the investigation examines whether significant differences
can be found in the work ethic and level of job satisfaction among workers in a Japanese-
owned manufacturing company located in the United States.
Purpose of the Study
The purpose of this study was to explore the relationship between job satisfaction
and work ethic among exempt and non-exempt employees working in a Japanese-owned
manufacturing company. Furthermore, it will add to the comparison of characteristics
among previous studies’ sample groups to help bring more clarity to the impact of
specific demographics on these two constructs (Brewer & McMahan-Landers, 2003;
McCortney & Engles, 2003). The study investigated the occupational work ethics of
exempt and non-exempt employees working in three different plants as measured by the
4
Occupational Work Ethic Inventory ([OWEI], Petty, 1995). Additionally, job satisfaction
levels as measured by the Job Satisfaction Survey ([JSS], Spector, 1985) were also
examined. By examining these issues, the researcher contributed to the body of
knowledge regarding the relationship between job satisfaction and work ethics, and the
differences that may exist in cross-cultural environments. An awareness of such
relationships may enhance the identification and selection of strategies and interventions
to enhance worker commitment and job satisfaction in foreign-owned companies located
in the United States.
Two of the world’s leading manufacturing countries are the United States and
Japan. The differences in management styles among these cultures have created
challenges for human resource practitioners (Linowes, 2001). The relationship between
these two giants seems to be an ideal place to study phenomena related to the
relationships among workplace experiences. Human resource practitioners involved with
these global partners need to understand the key variables impacting the work ethic and
how the work environment contributes to job satisfaction. Understanding these
phenomena may contribute to the retention of workers as well as contribute to improving
the quality of life among workers in a culturally diverse workforce.
Research Questions
In order to examine the problem identified above, the researcher developed
specific research questions related to job satisfaction and work ethic among and between
exempt and non-exempt workers employed in a Japanese-owned manufacturing
company. Research and analysis of the data provided new insights regarding this area of
research. The study will help answer the following questions:
5
1. Is there a significant relationship between the ratings measured using the OWEI and the JSS among individuals working in a Japanese-owned manufacturing company?
2. Can relationships be drawn from the ratings of the OWEI and the
demographic survey conducted in the sample group?
3. Can relationships be drawn from ratings of the JSS and the demographic survey conducted in the sample group?
4. What significant differences exist between exempt and non-exempt employees
working in a Japanese-owned manufacturing company regarding levels of job satisfaction as measured by the JSS?
5. What significant differences exist between exempt and non-exempt employees
working in a Japanese-owned manufacturing company regarding work ethic as measured by the OWEI?
Hypotheses
The hypotheses for this study concentrated on the degree of job satisfaction and
whether significant relationships exist with work ethics among workers employed at a
Japanese-owned manufacturing company located in Tennessee. The relationships among
demographic variables will also be examined. The following null hypotheses were
examined from the research questions posed in the study:
Ho1 There is no significant relationship between job satisfaction and work ethic as measured by the JSS and OWEI when used in a Japanese-owned manufacturing plant.
Ho2 There would be no significant difference between subjects’ age, gender,
position, tenure, and other demographic variables and the scores of work ethic when measured by the JSS and OWEI.
Ho3 There would be no significant difference between subjects’ age, gender,
position, tenure, and other demographic variables and the scores of job satisfaction as measured by the JSS.
Ho4 There would be no significant differences of job satisfaction among
exempt and non-exempt workers as measured on the JSS.
6
Ho5 There would be no significant differences of work ethic among exempt and non-exempt workers as measured on the OWEI.
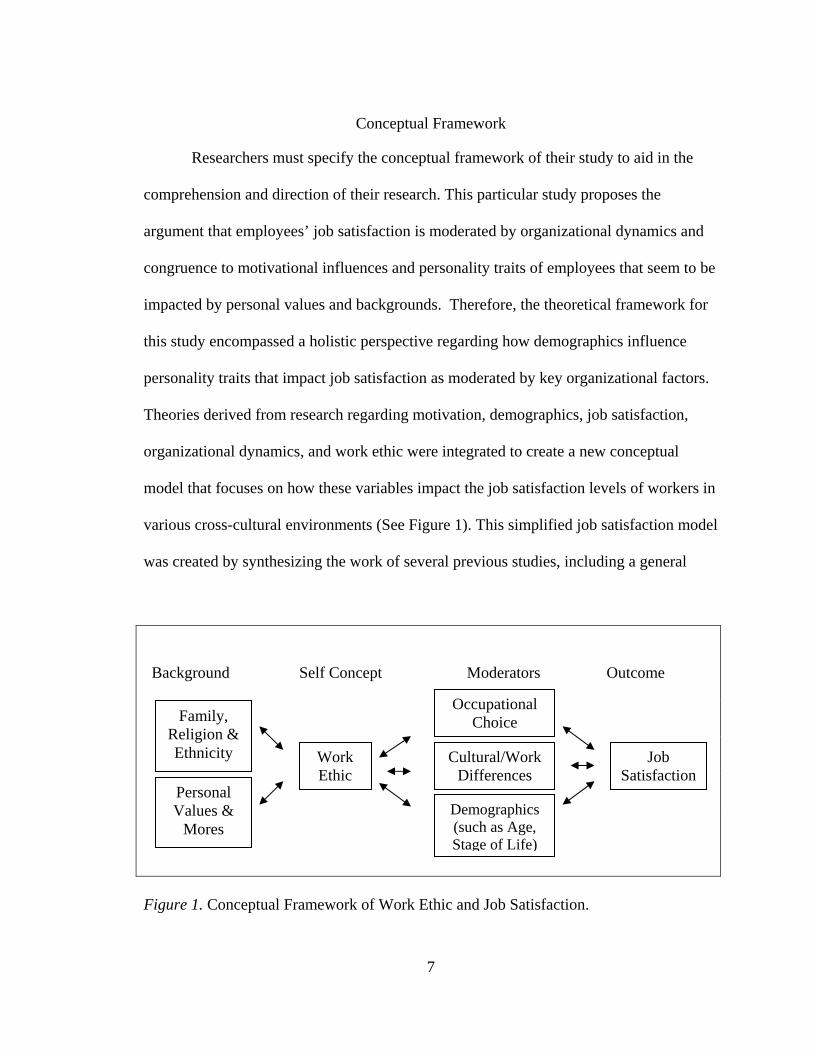
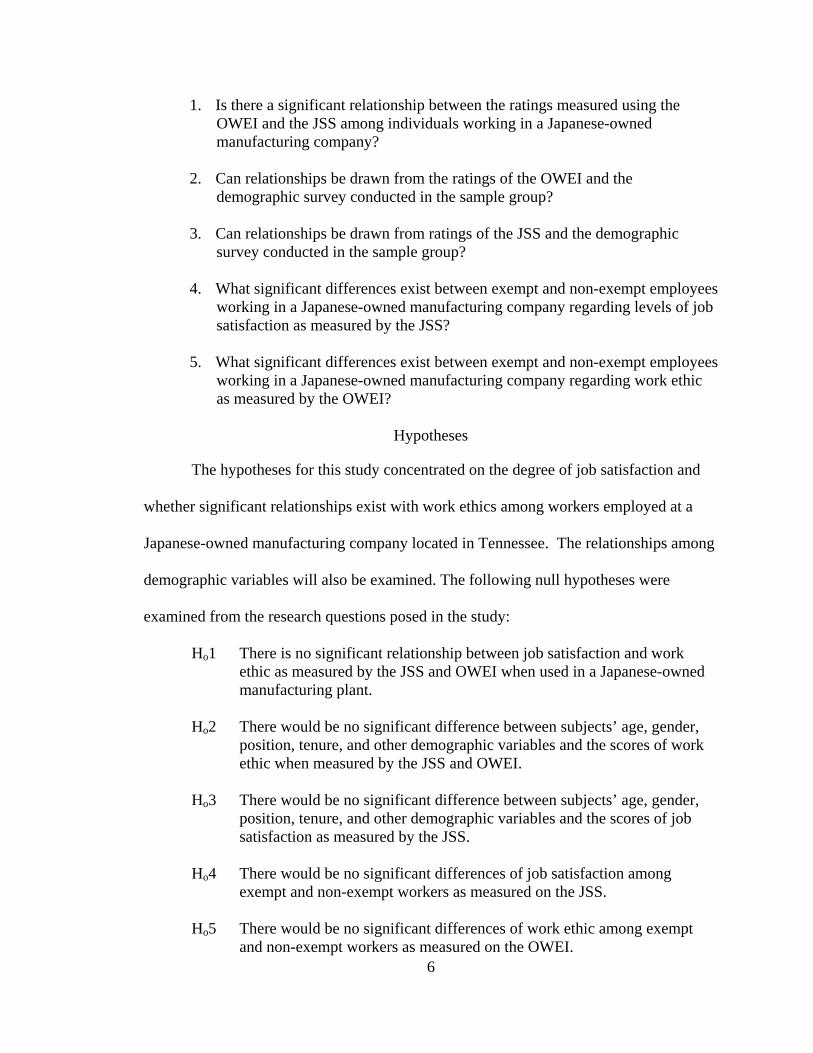
Conceptual Framework
Researchers must specify the conceptual framework of their study to aid in the
comprehension and direction of their research. This particular study proposes the
argument that employees’ job satisfaction is moderated by organizational dynamics and
congruence to motivational influences and personality traits of employees that seem to be
impacted by personal values and backgrounds. Therefore, the theoretical framework for
this study encompassed a holistic perspective regarding how demographics influence
personality traits that impact job satisfaction as moderated by key organizational factors.
Theories derived from research regarding motivation, demographics, job satisfaction,
organizational dynamics, and work ethic were integrated to create a new conceptual
model that focuses on how these variables impact the job satisfaction levels of workers in
various cross-cultural environments (See Figure 1). This simplified job satisfaction model
was created by synthesizing the work of several previous studies, including a general
Background Self Concept Moderators Outcome
7
Personal Values &
Mores
Family, Religion & Ethnicity Work
Ethic
Occupational Choice
Cultural/Work Differences
Demographics (such as Age, Stage of Life)
Job Satisfaction
Figure 1. Conceptual Framework of Work Ethic and Job Satisfaction.
work performance model research of Perlman (1997), Hackman and Oldham’s Job
Characteristics model (1975), and the Occupation Work Ethic research of Petty (1991a).
The model begins by including the research used by Petty to develop the (OWEI)
and then suggests that work ethic may have some congruence with job-satisfaction if the
occupational fit, cultural work differences, and other demographics cited in the work of
Pearlman (1997), along with Hackman and Oldham (1975), are effective moderators. Job
satisfaction is one of the most widely studied constructs in the social sciences (Spector,
1997). However, lack of agreement in the empirical research has led to increasingly
complex interpretations and uncertainty about some of the theoretical meaning of this
phenomenon. In addition, the complexity of work ethic and changes in our contemporary
workforce has created new areas on which to focus research.
Background Factors
Petty and Hill (2005) suggested that work ethic originates from a combination of
family, religion, ethnic beliefs and values, as well as personal values. Erez and Earley
(1993) focused on individual performance analysis and analyzed relationships between
needs, values, and culture to better understand the motivation of work. Culture, shared
meanings, and personal beliefs about self were key determinants of motivation behavior
among workers. Specifically, they found that the success of individual needs versus that
of team goals varied greatly between cultures. This contributed to more emphasis on
diversity in the American workforce as a key factor in work ethic.
8
The research of Spector (as cited in Herzberg, Mausner, & Snyderman, 1959)
suggested that job satisfaction is mediated by both intrinsic and extrinsic needs.
Therefore, the level of job satisfaction in a company is dependent on the linking of
individual needs and the job characteristics of the company to satisfy those needs.
Unfortunately, these theories did not consider how cultural differences impact motivation
toward work.
Maslow (1954) posited a Theory of Human Motivation asserting that human
needs are hierarchical in nature. Individuals begin with very rudimentary physiological
needs such as food, water, and pro-creation. Once these needs are met, motivation turns
to safety and security needs. The third phase of motivational needs have to do with
belonging needs such as love and companionship. Once these are fulfilled, a person
would then find ways to meet needs of esteem and self-confidence. Finally, the pinnacle
of this hierarchy falls into the category of self-actualization, which fits into one’s self-
concept about his or her ultimate calling in life.
Herzberg, Mausner, and Snyderman (1959) developed a theory called the
Motivation and Hygiene Theory. The theory postulates that both satisfiers and
dissatisfiers impact worker motivation. The dissatisfiers are labeled “hygiene factors.”
These are factors that must be met in the environment and job itself before a person will
be motivated to accomplish work. For example, according to this theory people would
not be motivated to work hard if they felt a fair wage was not being paid for their efforts.
Turner and Lawrence (as cited in Scott, Swortzel, & Taylor, 2005) formulated the
Job Characteristics Theory, which recommends that organizations build certain job
characteristics into the jobs of employees. Matching the job with the appropriate
corresponding characteristics should result in higher job satisfaction and enhance
motivation. This match of hygiene factors would then allow an organization to implement
motivational efforts designed to improve performance.
9
Congruence of Self-Concept and Occupational Choice
Super, Savickas, and Super (1996) suggested that an occupational choice is a way
for someone to express or implement his or her own occupational self-concept. Engaging
in work that matches one’s occupational self-concept is likely to provide general job
satisfaction. This process is tied to two key dimensions. The first is the social roles we
occupy in life, and the second is the process of adjustment and choice in these roles.
This self-concept factor is alluded to in the work of Life-Span Career theorists
who view adult career development as “a continuing process of improving the match
between self and situations” (Super et al., 1996, p. 139). The match between self-concept
and work situations is a never-completed project extending across an adult’s working
career. Therefore, it seems practical to suggest that the resources and opportunities
available in an organization to provide for this matching process may have some impact
on retention and improvement of positive work ethic among its workers.
Spector (1997) cited the addition of a personality factor known as Growth Need
Strength (GNS) as a moderator in a model created by Hackman and Oldham (1976). The
theory suggests that only workers with high levels of the moderator (GNS) will be
impacted by basic motivating factors. This researcher found some congruence with GNS
and the personal values and mores that are manifested in the working behaviors of
employees, which were defined by Hill and Petty (1995). These values and mores are
manifested in a person’s occupational work ethic and self-concept.
Hackman and Oldham (as cited in Spector, 1997) suggested that organizations
may be able to experiment with five basic factors of jobs in order to improve satisfaction.
The ability of an organization to manipulate these job characteristics would help ensure a
10
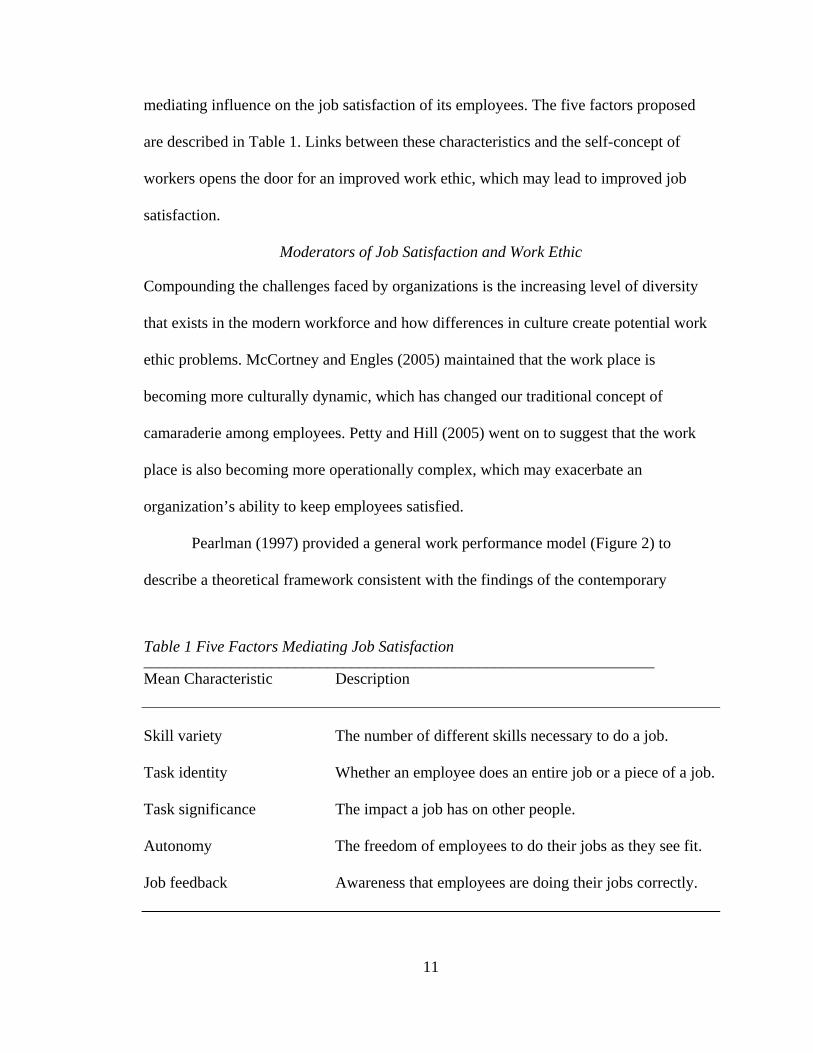
mediating influence on the job satisfaction of its employees. The five factors proposed
are described in Table 1. Links between these characteristics and the self-concept of
workers opens the door for an improved work ethic, which may lead to improved job
satisfaction.
Moderators of Job Satisfaction and Work Ethic
Compounding the challenges faced by organizations is the increasing level of diversity
that exists in the modern workforce and how differences in culture create potential work
ethic problems. McCortney and Engles (2005) maintained that the work place is
becoming more culturally dynamic, which has changed our traditional concept of
camaraderie among employees. Petty and Hill (2005) went on to suggest that the work
place is also becoming more operationally complex, which may exacerbate an
organization’s ability to keep employees satisfied.
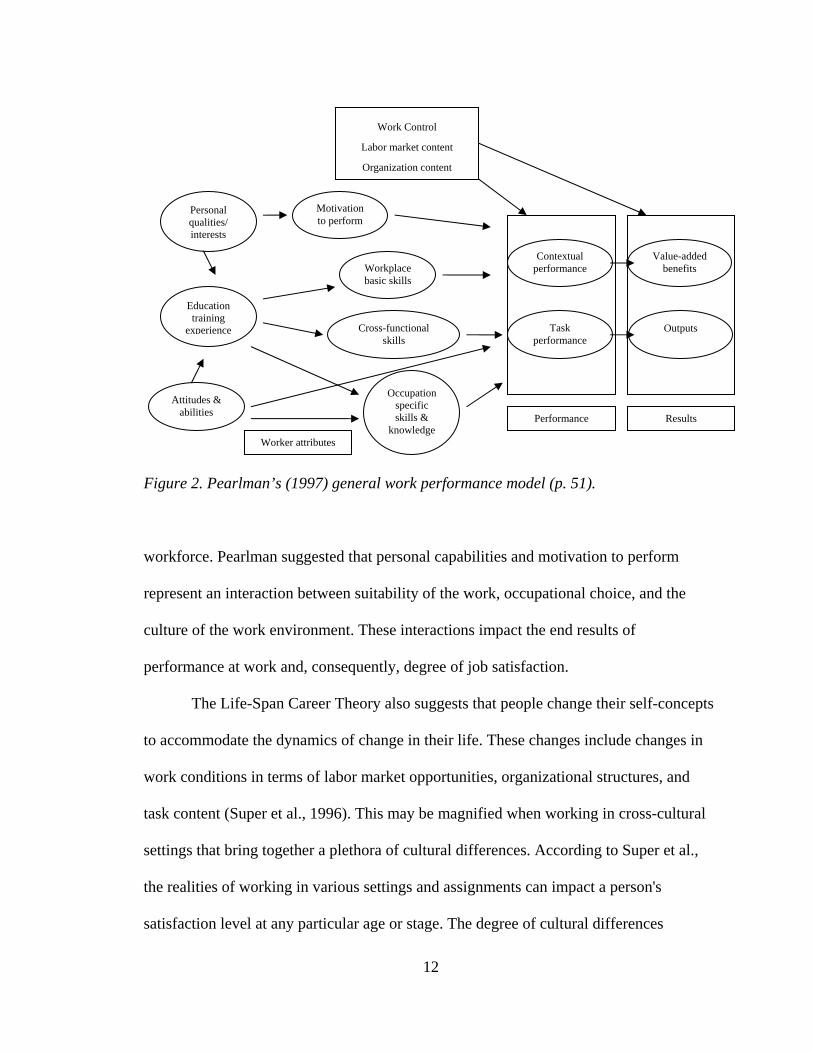
Pearlman (1997) provided a general work performance model (Figure 2) to
describe a theoretical framework consistent with the findings of the contemporary
Table 1 Five Factors Mediating Job Satisfaction ________________________________________________________________ Mean Characteristic Description Skill variety The number of different skills necessary to do a job. Task identity Whether an employee does an entire job or a piece of a job. Task significance The impact a job has on other people. Autonomy The freedom of employees to do their jobs as they see fit. Job feedback Awareness that employees are doing their jobs correctly.
11
Motivation to perform
Work Control
Labor market content
Organization content
Occupation specific skills &
knowledge
Cross-functional skills
Workplace basic skills
Attitudes & abilities
Education training
experience
Personal qualities/ interests
Contextual performance
Task performance
Value-added benefits
Outputs
Worker attributes
Performance Results
Figure 2. Pearlman’s (1997) general work performance model (p. 51).
workforce. Pearlman suggested that personal capabilities and motivation to perform
represent an interaction between suitability of the work, occupational choice, and the
culture of the work environment. These interactions impact the end results of
performance at work and, consequently, degree of job satisfaction.
The Life-Span Career Theory also suggests that people change their self-concepts
to accommodate the dynamics of change in their life. These changes include changes in
work conditions in terms of labor market opportunities, organizational structures, and
task content (Super et al., 1996). This may be magnified when working in cross-cultural
settings that bring together a plethora of cultural differences. According to Super et al.,
the realities of working in various settings and assignments can impact a person's
satisfaction level at any particular age or stage. The degree of cultural differences
12
contributes to performance ambiguity and interferes with understanding the decision-
making processes, work values, and negotiations (Hofstede, 1980).
The factors described above indicate that demographic factors may also impact
some organizations’ satisfaction levels due to the diversity of culture. For example,
Kaizer (2002) found that employee job satisfaction varies considerably from industry to
industry. However, this is not true in all organizations. A study among educators with
various industrial backgrounds found little variation among their individual satisfaction
levels (Brewer & McMahan-Landers, 2003). A follow up study suggested that factors
other than demographics, such as job stress, have more of an impact on job satisfaction
than demographics (Brewer & McMahan-Landers, 2003). Sousa-Poza and Sousa-Poza
(as cited in Kaizer, 2002) used a cross-national analysis in concluding that employees in
21 different countries were quite satisfied. That study research found that Denmark was
ranked highest in job satisfaction and the United States seventh; Japan was ranked
nineteenth. Japanese automotive manufacturing companies have implemented many
innovative techniques for assembly line work. Hulin and Blood (as cited in Spector,
1997) found that many of the jobs on assembly lines can be dissatisfying, thus impacting
motivation.
The present study may help in triangulating the constructs of demographics, work
ethics, and cross-cultural work settings into a simple model that describes the complexity
of these factors in impacting job satisfaction. As shown in Figure 1, the sources of one’s
work ethic are derived from family, religion, and personal values as cited in previous
research (Hill, 1996; Petty, 1995). These attributes, along with self-concept that may
produce a personality with higher or lower levels of work ethic (Super, 1996), may reveal
13
that the end result of job satisfaction is dependent on how well the worker or the
organization can inculcate individual work ethic into the organization’s culture
(Pearlman, 1997). Hopefully the results of this study will create more insights into these
phenomena.
Significance of the Study
Lipset (as cited in Boatwright & Slate, 2003) suggested that many organizations
are beginning to observe problems associated with declining work ethic. Additionally,
these concerns about declining work ethics could lead to higher levels of termination in
various organizations. Also, Petty (1995) suggested that the work force is “demanding
more intrinsic rewards from work than was ever expected” (p. 133). He went on to argue
that “professionals that train and retrain America’s work force must be aware of the
intrinsic and affective needs expressed by these adults” (p.134).
Recent research (Petty & Hill, 2005) has called for more studies to determine
whether workers’ perceptions about work ethic are influenced by cultural or
organizational differences. More specifically, the authors cited the link between job
satisfaction and work ethic as an area needing more study. Furthermore, they considered
that knowledge gained from such studies might have significant implication for assisting
organizations in “developing career and technical education curriculum as well as human
resource development models” (p. 17).
14
McCortney and Engles (as cited in Petty & Hill, 2005) found that work
environments are becoming increasingly more complex and culturally diverse. Cross-
cultural research in the area of work ethic and job satisfaction has the potential to impact
both researchers and practitioners in a plethora of global communities. Our growing
global economy requires more study in the thinking processes and learning systems
regarding these phenomena. Today’s worldwide competition will require organizations
to retain, motivate, and develop workforces that will remain viable and attractive to
investors (Pfau & Kay, 2002).
In a comparison of quality manuals, Kartha (2004) cited information in the
Technical Specification (ISO/TS) 16949 Manual and the Malcolm Baldridge Quality
Program that required organizations to pay attention to and value the motivation and
empowerment of their employees. Furthermore, to demonstrate a commitment to
excellence, these manuals indicate that organizations should value the involvement of
employees, which includes a commitment to the satisfaction, development, and well-
being of employees. Obviously, the standards for excellence in national and international
arenas have concluded that the satisfaction of employees is related to the motivation and
value they provide to the output of products and services offered by an organization.
The findings from the present study may provide insights for designing and
implementing strategies and interventions to enhance job satisfaction and develop work
ethics congruent with the cultural environment in which workers find themselves. As
noted previously, several studies have linked self-concept and work values with job
satisfaction (Super, Savickas, & Super, 1996). However, similar studies have not yet
uncovered strong evidence supporting clear, significant relationships between job
satisfaction and work ethic. McCortney and Engles (2003) suggested that more attention
be paid to the interaction among the work ethics of employees in different position levels.
The findings from this study may spark continued interest in these phenomena and
perhaps influence the measurement of these indicators in more creative ways in cross-
15
cultural and homogeneous environments. Regardless of the outcome, the results will
certainly add to the current body of knowledge of these two constructs.
Hence, more research is necessary to help shed light on the lack of congruence
among these phenomena. The studies of demographic traits that may be predictors of job
satisfaction may also help identify work ethic issues that are valued by organizations.
Moreover, understanding the relationship between work ethic and job satisfaction may
prove valuable to many organizations in determining interventions and strategies for
mitigating factors that reduce job satisfaction. Furthermore, the data may be helpful in
enhancing factors that positively impact work ethic traits considered valuable to various
cultures.
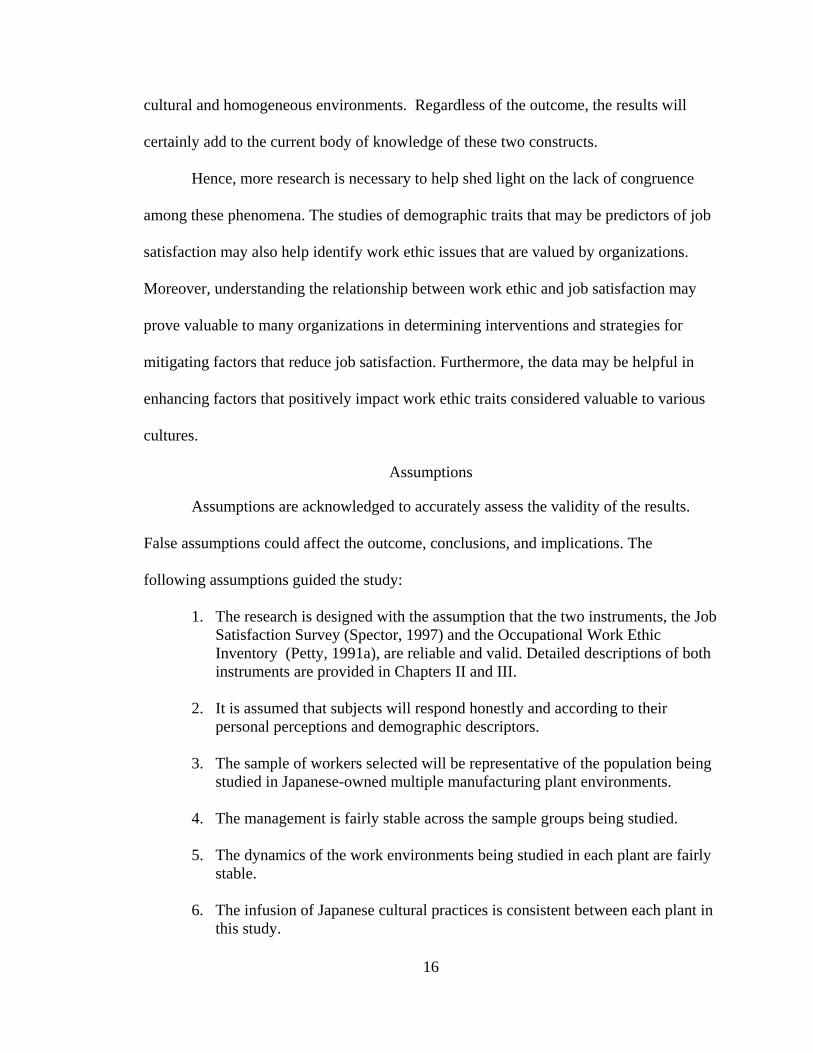
Assumptions
Assumptions are acknowledged to accurately assess the validity of the results.
False assumptions could affect the outcome, conclusions, and implications. The
following assumptions guided the study:
1. The research is designed with the assumption that the two instruments, the Job Satisfaction Survey (Spector, 1997) and the Occupational Work Ethic Inventory (Petty, 1991a), are reliable and valid. Detailed descriptions of both instruments are provided in Chapters II and III.
2. It is assumed that subjects will respond honestly and according to their
personal perceptions and demographic descriptors.
3. The sample of workers selected will be representative of the population being studied in Japanese-owned multiple manufacturing plant environments.
4. The management is fairly stable across the sample groups being studied. 5. The dynamics of the work environments being studied in each plant are fairly
stable. 6. The infusion of Japanese cultural practices is consistent between each plant in
this study.
16
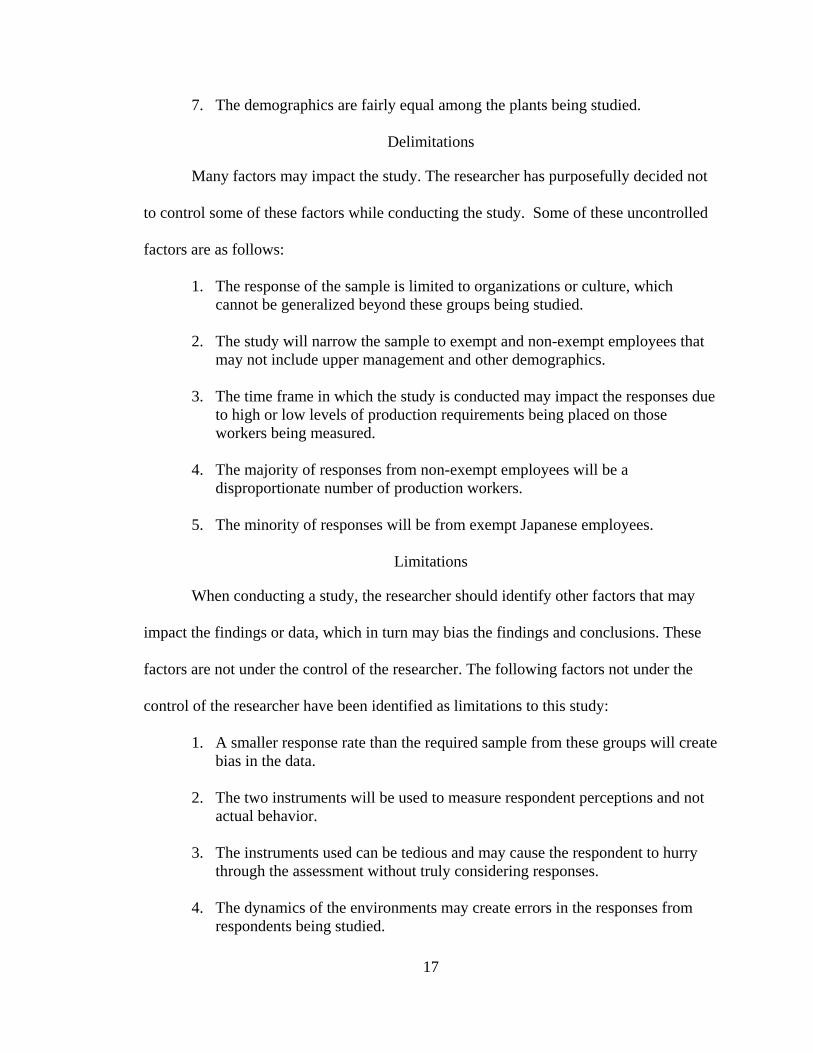
7. The demographics are fairly equal among the plants being studied.
Delimitations
Many factors may impact the study. The researcher has purposefully decided not
to control some of these factors while conducting the study. Some of these uncontrolled
factors are as follows:
1. The response of the sample is limited to organizations or culture, which cannot be generalized beyond these groups being studied.
2. The study will narrow the sample to exempt and non-exempt employees that
may not include upper management and other demographics.
3. The time frame in which the study is conducted may impact the responses due to high or low levels of production requirements being placed on those workers being measured.
4. The majority of responses from non-exempt employees will be a
disproportionate number of production workers.
5. The minority of responses will be from exempt Japanese employees.
Limitations
When conducting a study, the researcher should identify other factors that may
impact the findings or data, which in turn may bias the findings and conclusions. These
factors are not under the control of the researcher. The following factors not under the
control of the researcher have been identified as limitations to this study:
1. A smaller response rate than the required sample from these groups will create bias in the data.
2. The two instruments will be used to measure respondent perceptions and not
actual behavior. 3. The instruments used can be tedious and may cause the respondent to hurry
through the assessment without truly considering responses.
4. The dynamics of the environments may create errors in the responses from respondents being studied.
17
5. Cultural difference may impact the respondents’ and non-respondents’ answers.
Definition of Terms
Enhancing comprehension of the study demands that clarity exist when reading
the data and terminology used in a study. The following terms are defined to enhance
communication and comprehension of the information provided in this study:
1. Culture: Culture is a way of perceiving, thinking, feeling and behaving, which is shared and accepted by a group of people. It is traditionally associated with nations and geographical location, as well as religion, age groups and academic communities (Kelly & Myers, 1992b).
2. Exempt employee: An employee who is on salary and usually holds a professional position within an organization. He or she does not receive additional pay for overtime work.
3. Non-exempt employee: An employee who is paid hourly and receives overtime
pay. He or she is usually engaged in blue-collar type work (i.e. production, maintenance, administration).
4. Occupational work ethic: A culturally developed affective behavior, which is
a combination of family, religious, and ethnic beliefs and values (Colson & Echered, 1991).
5. Job satisfaction: The feeling and/or affective response someone experiences
in a job role.
6. Cultural diversity: A culmination of several factors in demographics, personality, and background that make up the culture of an organization.
7. Expatriates: An employee from a foreign country who moves to a host
country to accomplish key work activities and projects.
Summary of Introduction Chapter
The current global economy has caused many human resource practitioners to
inquire into how to synthesize the cultural work ethic of parent companies into the
American workforce without impacting job satisfaction levels among workers. Hill and
Fouts (2005) cited several studies that continue to suggest that a strong work ethic is an 18
attribute highly desired by employers in many industries (Denka, 1994; Hill & Petty,
1995; Young, 1986). Taylor, Beecher, and Napier (as cited in Lau & Ngo, 2001)
suggested that those organizations that are capable of targeting and developing this
attribute with precision will be able to develop human resource capabilities and a global
approach difficult for their competitors to replicate.
The researcher’s major purpose in this study was to investigate and describe the
relationship between job-satisfaction as it is compared to work ethic among and between
individuals working in cross-cultural environments. A second purpose was to identify
significant differences between these two predictors and variables such as age, type of
job, level of education, job satisfaction level, years of service, and other demographic
factors.
In this chapter, the researcher presented an introduction, statement of the problem,
purpose of the study, research questions, hypothesis, conceptual framework, significance
of the study, assumptions, limitations, delimitations, and definition of terms. The
following chapter will delve into the models and theoretical data presented in this
chapter, as well as additional models and research pertinent to the study’s scope and
focus.
19
CHAPTER II
REVIEW OF LITERATURE
As explained in the first chapter, this study was designed to review the
relationship between job satisfaction, using the Job Satisfaction Survey (Spector, 1985),
and work ethic, using the Occupational Work Ethic Inventory (Petty, 1991a), in cross-
cultural environments. Chapter II will provide a review of the literature relevant to these
constructs. The first section covers job satisfaction, the second covers work ethic, and the
third expounds on the influence of demographics on both constructs. Finally, a review of
how cross-cultural environments may impact these factors will be presented.
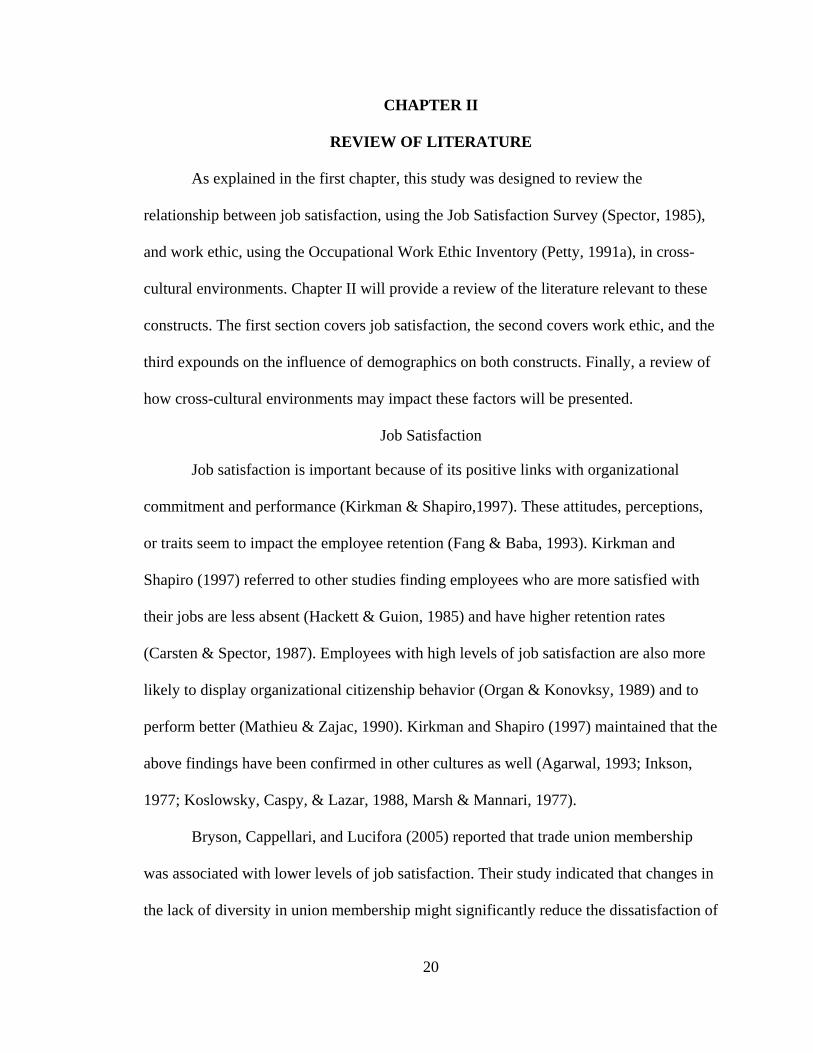
Job Satisfaction
Job satisfaction is important because of its positive links with organizational
commitment and performance (Kirkman & Shapiro,1997). These attitudes, perceptions,
or traits seem to impact the employee retention (Fang & Baba, 1993). Kirkman and
Shapiro (1997) referred to other studies finding employees who are more satisfied with
their jobs are less absent (Hackett & Guion, 1985) and have higher retention rates
(Carsten & Spector, 1987). Employees with high levels of job satisfaction are also more
likely to display organizational citizenship behavior (Organ & Konovksy, 1989) and to
perform better (Mathieu & Zajac, 1990). Kirkman and Shapiro (1997) maintained that the
above findings have been confirmed in other cultures as well (Agarwal, 1993; Inkson,
1977; Koslowsky, Caspy, & Lazar, 1988, Marsh & Mannari, 1977).
Bryson, Cappellari, and Lucifora (2005) reported that trade union membership
was associated with lower levels of job satisfaction. Their study indicated that changes in
the lack of diversity in union membership might significantly reduce the dissatisfaction of
20
union workers. This lack of diversity was noted as an additional mitigator in explaining
why employees quit. The unionization process also appears to mitigate satisfaction.
Ezell (2003) cited Steers’ (1988) research, which found five external factors that
impact job satisfaction: (a) pay, (b) co-workers, (c) promotional opportunity, (d)
supervision, and (e) the work itself. These factors also seem to impact turnover rates.
The findings in her study (Ezell, 2003) demonstrated that lack of organizational support,
organizational commitment, gender, and job satisfaction on the job “accounted for 39.5%
of the variance in turnover intentions” among state government employees (p. 233).
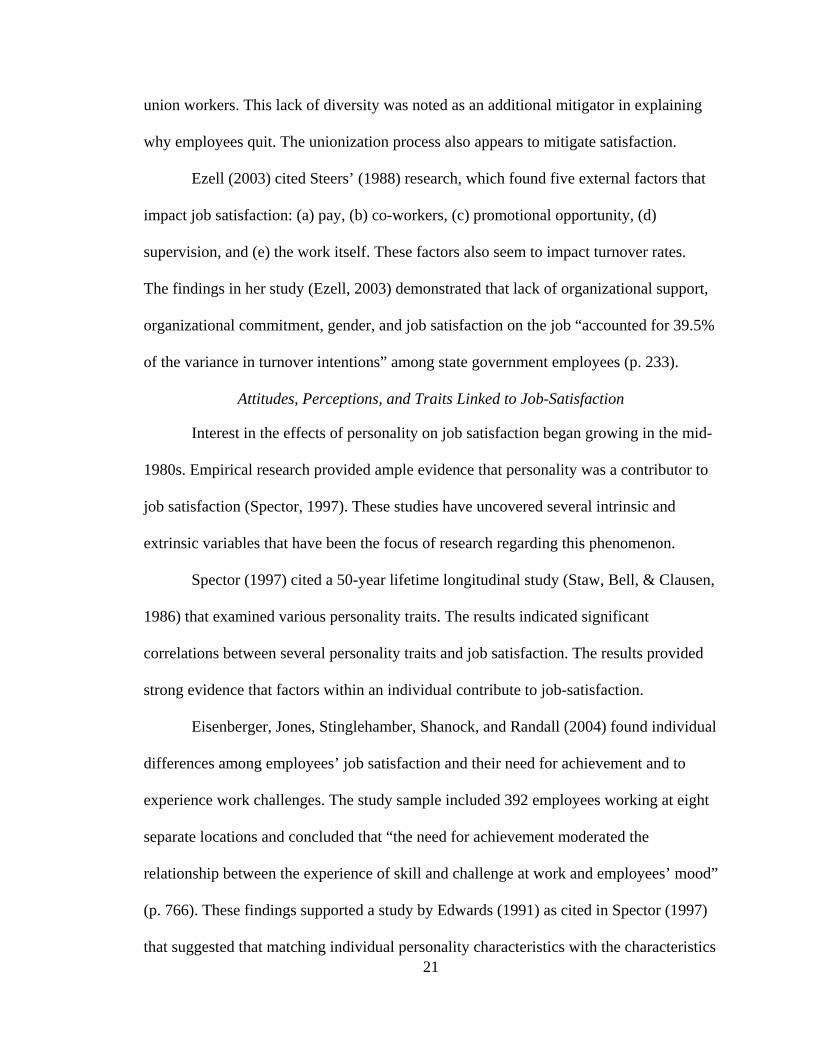
Attitudes, Perceptions, and Traits Linked to Job-Satisfaction
Interest in the effects of personality on job satisfaction began growing in the mid-
1980s. Empirical research provided ample evidence that personality was a contributor to
job satisfaction (Spector, 1997). These studies have uncovered several intrinsic and
extrinsic variables that have been the focus of research regarding this phenomenon.
Spector (1997) cited a 50-year lifetime longitudinal study (Staw, Bell, & Clausen,
1986) that examined various personality traits. The results indicated significant
correlations between several personality traits and job satisfaction. The results provided
strong evidence that factors within an individual contribute to job-satisfaction.
21
Eisenberger, Jones, Stinglehamber, Shanock, and Randall (2004) found individual
differences among employees’ job satisfaction and their need for achievement and to
experience work challenges. The study sample included 392 employees working at eight
separate locations and concluded that “the need for achievement moderated the
relationship between the experience of skill and challenge at work and employees’ mood”
(p. 766). These findings supported a study by Edwards (1991) as cited in Spector (1997)
that suggested that matching individual personality characteristics with the characteristics
of a job impacts job satisfaction. This theory confirmed the work of Hackman and
Oldham (1975), which suggested that the Growth Need Strength (GNS) trait was a
moderator of how job characteristics impact the level of job satisfaction. Those with high
levels of (GNS) were more likely to be impacted by manipulation of job characteristics.
Spector (1997) cited two other studies that also support the links between
personality and job satisfaction. First, a longitudinal study (Spector & O’Connell, 1994)
examined locus of control, which is defined as the belief an individual has about his or
her ability to control positive or negative reinforcements in life. This study concluded that
those with higher levels of locus of control also had higher levels of job satisfaction.
The second, by Schauboeck, Ganster, and Kemmerer (1994), studied a personality
trait termed negative affectivity (NA), which is the tendency to experience negative
emotions such as anxiety and depression. Their findings confirmed previous studies
suggesting that NA correlates negatively with job satisfaction. However, a follow-up
study proposed that the choices made by those with higher levels of NA may contribute
more to job satisfaction than the trait alone (Williams, Gavin, & Williams, 1996).
Coping skills are explained as traits that allow individuals to better adapt to the
environmental demands encountered in their lives (Lazarus & Folkman, 1984). Coping
skills have been linked with mediating stress and burnout (Chan, 1998). Therefore, a
logical assumption is that reduction of stress tends to impact the levels of satisfaction.
Research to identify traits that lead to better coping skill may prove valuable.
Measuring Job Satisfaction
22
Spector (1997) pointed out that job satisfaction can be viewed “as a global feeling
about the job or as related constellations of attitudes about various aspects or facets of the
job” (p. 2). He proposed that organizations should focus on the latter method of “facets”
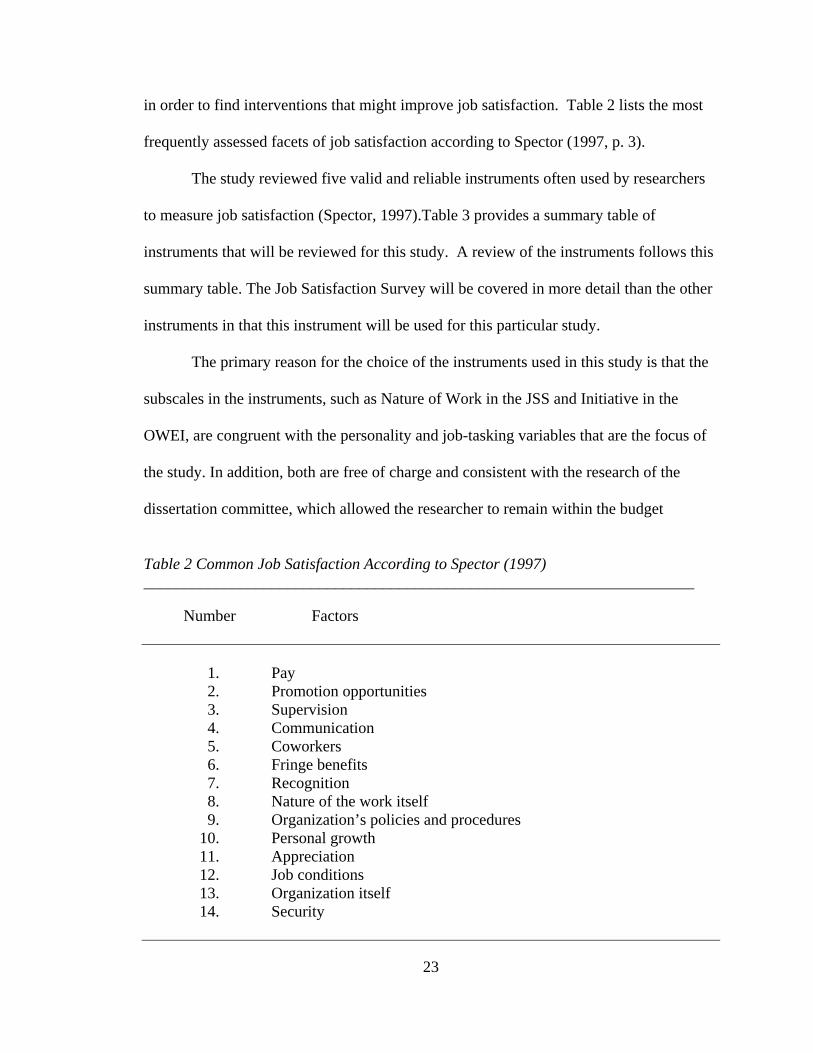
in order to find interventions that might improve job satisfaction. Table 2 lists the most
frequently assessed facets of job satisfaction according to Spector (1997, p. 3).
The study reviewed five valid and reliable instruments often used by researchers
to measure job satisfaction (Spector, 1997).Table 3 provides a summary table of
instruments that will be reviewed for this study. A review of the instruments follows this
summary table. The Job Satisfaction Survey will be covered in more detail than the other
instruments in that this instrument will be used for this particular study.
The primary reason for the choice of the instruments used in this study is that the
subscales in the instruments, such as Nature of Work in the JSS and Initiative in the
OWEI, are congruent with the personality and job-tasking variables that are the focus of
the study. In addition, both are free of charge and consistent with the research of the
dissertation committee, which allowed the researcher to remain within the budget
Table 2 Common Job Satisfaction According to Spector (1997) _____________________________________________________________________ Number Factors
1. Pay 2. Promotion opportunities 3. Supervision 4. Communication 5. Coworkers 6. Fringe benefits 7. Recognition 8. Nature of the work itself 9. Organization’s policies and procedures
10. Personal growth 11. Appreciation 12. Job conditions 13. Organization itself 14. Security
23
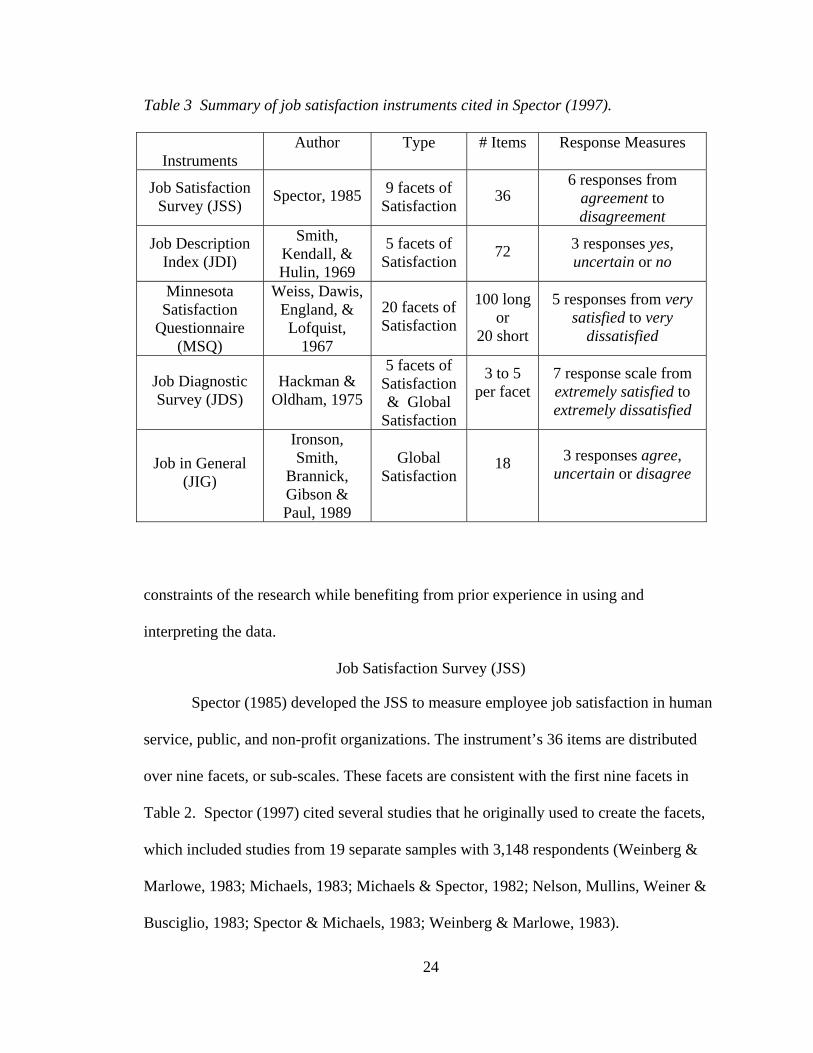
Table 3 Summary of job satisfaction instruments cited in Spector (1997).
Instruments
Author Type # Items Response Measures
Job Satisfaction Survey (JSS) Spector, 1985 9 facets of
Satisfaction 36 6 responses from
agreement to disagreement
Job Description Index (JDI)
Smith, Kendall, & Hulin, 1969
5 facets of Satisfaction 72 3 responses yes,
uncertain or no
Minnesota Satisfaction
Questionnaire (MSQ)
Weiss, Dawis, England, & Lofquist,
1967
20 facets of Satisfaction
100 long or
20 short
5 responses from very satisfied to very
dissatisfied
Job Diagnostic Survey (JDS)
Hackman & Oldham, 1975
5 facets of Satisfaction & Global
Satisfaction
3 to 5 per facet
7 response scale from extremely satisfied to extremely dissatisfied
Job in General (JIG)
Ironson, Smith,
Brannick, Gibson & Paul, 1989
Global
Satisfaction 18 3 responses agree,
uncertain or disagree
constraints of the research while benefiting from prior experience in using and
interpreting the data.
Job Satisfaction Survey (JSS)
Spector (1985) developed the JSS to measure employee job satisfaction in human
service, public, and non-profit organizations. The instrument’s 36 items are distributed
over nine facets, or sub-scales. These facets are consistent with the first nine facets in
Table 2. Spector (1997) cited several studies that he originally used to create the facets,
which included studies from 19 separate samples with 3,148 respondents (Weinberg &
Marlowe, 1983; Michaels, 1983; Michaels & Spector, 1982; Nelson, Mullins, Weiner &
Busciglio, 1983; Spector & Michaels, 1983; Weinberg & Marlowe, 1983).
24
The facets in the previous studies were obtained using several instruments,
including the Organizational Commitment Questionnaire (Mowday, Steers, & Porter,
1979), Job Diagnostic Survey (Hackman & Oldham, 1975), and Leader Behavior
Description Questionnaire (Stogdill, 1963). A review of absenteeism and self-reports on
intention of quitting, age, salary, and position was used to determine other facets. Care
was taken to ensure congruency between the items and the intent of these facets. A total
of 74 items were written for the original versions of the instrument, later reduced to 36
and measured using six scale-response choices: disagree very much, disagree moderately,
disagree slightly, agree slightly, agree moderately, and agree very much (Spector, 1985).
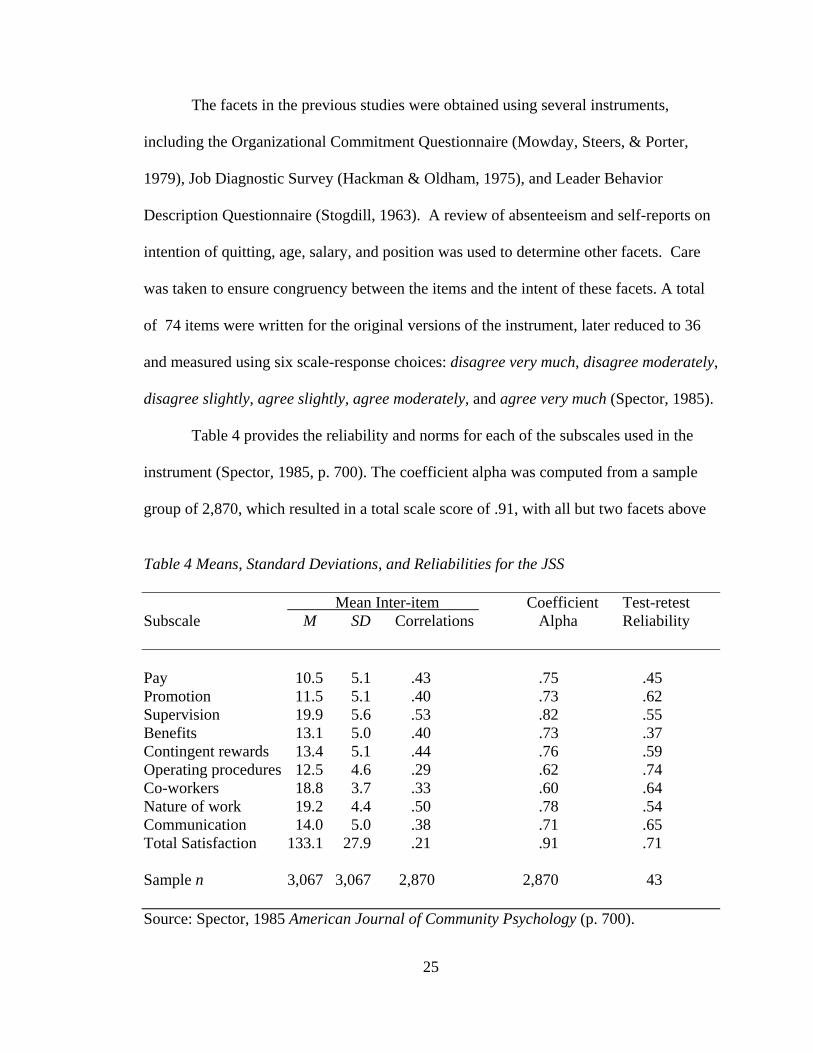
Table 4 provides the reliability and norms for each of the subscales used in the
instrument (Spector, 1985, p. 700). The coefficient alpha was computed from a sample
group of 2,870, which resulted in a total scale score of .91, with all but two facets above
Table 4 Means, Standard Deviations, and Reliabilities for the JSS Mean Inter-item Coefficient Test-retest Subscale M SD Correlations Alpha Reliability Pay 10.5 5.1 .43 .75 .45 Promotion 11.5 5.1 .40 .73 .62 Supervision 19.9 5.6 .53 .82 .55 Benefits 13.1 5.0 .40 .73 .37 Contingent rewards 13.4 5.1 .44 .76 .59 Operating procedures 12.5 4.6 .29 .62 .74 Co-workers 18.8 3.7 .33 .60 .64 Nature of work 19.2 4.4 .50 .78 .54 Communication 14.0 5.0 .38 .71 .65 Total Satisfaction 133.1 27.9 .21 .91 .71 Sample n 3,067 3,067 2,870 2,870 43 Source: Spector, 1985 American Journal of Community Psychology (p. 700).
25
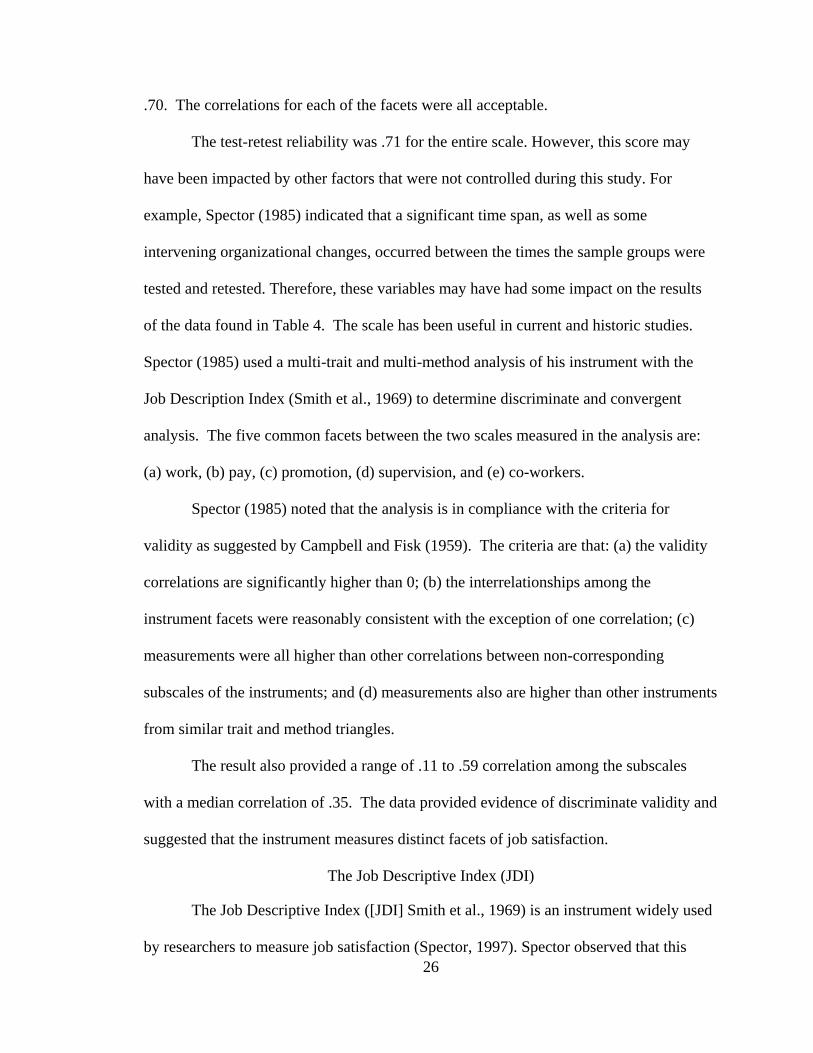
.70. The correlations for each of the facets were all acceptable.
The test-retest reliability was .71 for the entire scale. However, this score may
have been impacted by other factors that were not controlled during this study. For
example, Spector (1985) indicated that a significant time span, as well as some
intervening organizational changes, occurred between the times the sample groups were
tested and retested. Therefore, these variables may have had some impact on the results
of the data found in Table 4. The scale has been useful in current and historic studies.
Spector (1985) used a multi-trait and multi-method analysis of his instrument with the
Job Description Index (Smith et al., 1969) to determine discriminate and convergent
analysis. The five common facets between the two scales measured in the analysis are:
(a) work, (b) pay, (c) promotion, (d) supervision, and (e) co-workers.
Spector (1985) noted that the analysis is in compliance with the criteria for
validity as suggested by Campbell and Fisk (1959). The criteria are that: (a) the validity
correlations are significantly higher than 0; (b) the interrelationships among the
instrument facets were reasonably consistent with the exception of one correlation; (c)
measurements were all higher than other correlations between non-corresponding
subscales of the instruments; and (d) measurements also are higher than other instruments
from similar trait and method triangles.
The result also provided a range of .11 to .59 correlation among the subscales
with a median correlation of .35. The data provided evidence of discriminate validity and
suggested that the instrument measures distinct facets of job satisfaction.
The Job Descriptive Index (JDI)
26
The Job Descriptive Index ([JDI] Smith et al., 1969) is an instrument widely used
by researchers to measure job satisfaction (Spector, 1997). Spector observed that this
instrument is often used in conjunction with the Job in General (JIG) Scale, which will be
covered separately in this review. He also suggested the JDI is simple to administer, read,
and score. Finally, Spector pointed out that the scale has also been summed up to
determine an overall global measure of job satisfaction, although this is not
recommended (Ironson et al., 1989).
The JDI instrument is limited to five facets: (a) work on present job, (b) present
pay, (c) opportunities for promotion, (d) supervision, and (e) co-workers. These facets are
intended to evaluate key aspects of the job. Each of the subscales contains either 9 or 18
items that are short descriptive words or phrases. The complete index contains an overall
total of 72 items; an abridged version (AJDI) contains 5 items for each subscale with a
total of 25 total items. The item responses consist of three options: yes, uncertain, and no.
Spector (1997) referred to a considerable body of research of more than 100
published studies used to determine the instruments’ reliability and validity (Cook,
Hepworth, Wall, & Warr, 1981). These data were reported in a revised manual (Balzer et
al., 1997). Another study designed to improve the validity and reliability was also
conducted (Roznowski, 1989).
Some criticism of the instrument was also cited by Spector (1997). This revolved
around the fact that only five facets are measured. Additionally, some questions have
risen regarding whether some of the items apply to all work groups (Buffum & Konick,
1982). Furthermore, a fee is required to use the instrument, unlike other instruments that
are provided free of charge.
The Job in General Scale (JIG)
27
The Job in General Scale, ([JIG]; Ironson et al., 1989) has been used in
conjunction with the JDI. It measures a global level of job satisfaction rather than
individual facets. Some researchers have summed up the score of individual facets from
other instruments to determine a global score. However, Ironson et al. criticized the
practice. Spector (1997) noted, “It seems unlikely that each facet has the same
importance to every individual; thus, the sum of facets is an approximation of overall job
satisfaction, but it may not exactly match the global satisfaction of individuals” (p. 19).
The authors reported internal consistency coefficients of .91 to .95 across sample
studies (Ironson et. al., 1989). Additionally, the instrument was reported to correlate well
with other instruments used to measure global satisfaction. The instrument includes 18
items that are written descriptors or short phrases that allow for three response choices
that include: (a) yes, (b) not sure, and (c) no.
A structured scale reduction procedure developed by Stanton, Sinar, Balzer, and
Smith (2002) was used to create an abridged version of the JIG. The abridged version of
the instrument was also developed using studies to determine its validity and reliability
(Russell, Spitsmuller, Lin, Stanton, Smith, & Ironson, 2004). The abridged version was
designed to improve the use of the instrument by practitioners using it in their studies of
organizational behavior.
The Minnesota Satisfaction Questionnaire (MSQ)
28
Another instrument is the Minnesota Satisfaction Questionnaire (MSQ), which
was designed by Weiss et al. (1967) to measure worker job satisfaction. It is available in
two different long forms and a shorter version. The MSQ has become useful in the
research of vocational needs by providing feedback and job reinforcement techniques.
The long form consists of 20 facets: (1) ability utilization, (2) achievement, (3)
activity, (4) advancement, (5) authority, (6) company policies, (7) compensation, (8) co-
workers, (9) creativity, (10) independence, (11) security, (12) social service, (13) social
status, (14) moral values, (15) recognition, (16) responsibility, (17) supervision, (18)
human relations, (19) supervision of technical variety, and (20) working conditions.
Each of the facets has five response items for a total of 100 items. Spector (1997) was
concerned that some facets may be evaluating similar but different aspects of the job.
The 1963 version of the long form used five item responses: very satisfied,
satisfied, neither, dissatisfied, and very dissatisfied. The 1967 version adjusted the
response choices to read: not satisfied, somewhat satisfied, satisfied, very satisfied, and
extremely satisfied. The changes to the response choices were made to adjust for a
negative skew in the data that hovered primarily between satisfied and very satisfied. The
adjustment resulted in a more symmetrical distribution around the mid-point of satisfied.
The short form has 20 items chosen from the long form that best represent each of
the 20 facets. Each facet has a single item that uses the same response choices listed on
the 1963 long version. The short form has drawn some criticism regarding the contents
of the extrinsic and intrinsic facets (Schriesheim, Powers, Scandura, Gardiner, & Landau,
1993). The high correlations between the subscales have also suggested lack of
discrimination (Schmitt, Coyle, White, & Rauschenberger, 1978).
The instrument is written at a fifth-grade reading level and requires approximately
20 minutes to complete in its long form; the short form requires approximately 5 minutes.
A fee is required to acquire and use each of the forms.
The Job Diagnostic Survey (JDS)
The Job Characteristics Survey (JCS) introduced by Hackman and Oldham (1975)
is a three-stage model, which suggests that job characteristics have an impact on worker’s
psychological states of mind. Psychological states are “created by the presence of five
29
‘core’ job dimensions” (p. 160). These five cores are provided in Table 5. The
psychological states include (a) meaningfulness, (b) responsibility, and (c) knowledge of
results, and may influence motivational outcomes that are important to an organization.
Spector (1997) explains that this instrument is helpful when studying the effects
of five job characteristics on psychological states and organizational outcomes (p. 33).
The five dimensions are used to compute a Motivation Potential Score (MPS), which
consists of finding the average of the first three job characteristics: (a) skill variety, (b)
task identify, and (c) task significance. This average is then multiplied by both of the
other two characteristics scores: (d) autonomy, and (e) job feedback. The formula can be
described as follows: MPS= [(a)+(b)+(c)/3) x (d) x (e)].
Follow-up studies emphasized only two of the three stages of the model, one
being the impact of job characteristics on organizational outcome, until Viswesvaran and
Ones (1995) addressed the third stage of psychological states. They argued that although
the two-stage model provides cleaner analysis of the data, a better understanding of the
psychological states involved will have more value in both theory and application.
Table 5 Dimensions of Job Characteristics _______________________________________________________________________ Mean Characteristic Description of Characteristic _______________________________________________________________________ Skill variety The number of different skills necessary to do a job.
Task identify Whether or not an employee does an entire job or piece of a job.
Task significance The impact a job has on other people.
Autonomy The freedom employees have to do their jobs as they see fit.
Job feedback The extent to which it is obvious to employees that they are doing their jobs correctly.
30
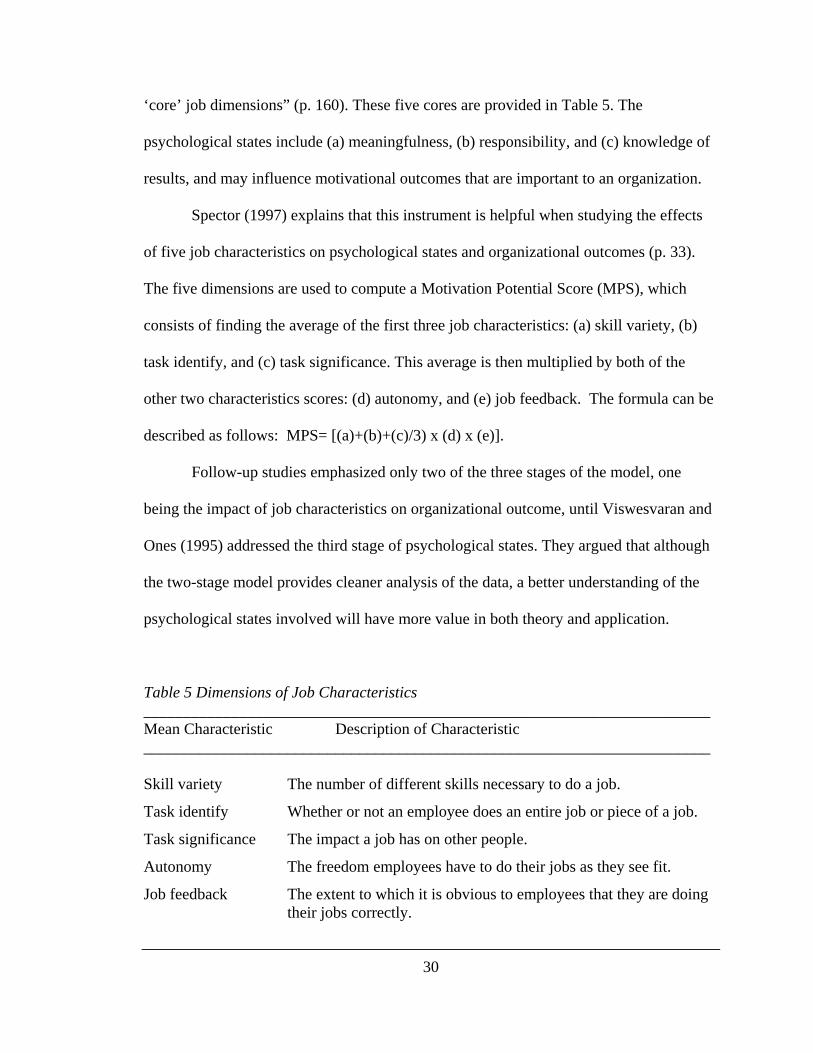
One of the key traits of interest to this researcher is a personality trait labeled Growth
Need Strength (GNS) in the research of Hackman and Oldham (1975). The trait is
hypothesized to have a moderating effect on the core job characteristics. The level of
GNS that exists in the personality of a worker will be reflected in his or her desire for
personal growth and other higher order needs that the job characteristics appear to
measure. As noted in Figure 3, those workers with higher levels of the personality
variable GNS will be impacted by the motivating factors manipulating the job
characteristics, such as job scope, whereas those with low level will not. The factor of
GNS is thus included in the following model as a moderator of the five basic factors
(Hackman & Oldham, 1976). The theory posits that only workers with high levels of the
moderator GNS will be impacted by the five basic motivating factors. Figure 4 provides a
model of the theory.
31
Low GNS
High GNS
Job
Sat
isfa
ctio
n
High Low
Source: Spector (1997) Job Satisfaction (p. 33). Figure 3. Moderating effect of Growth Need Strength on job scope and satisfaction.
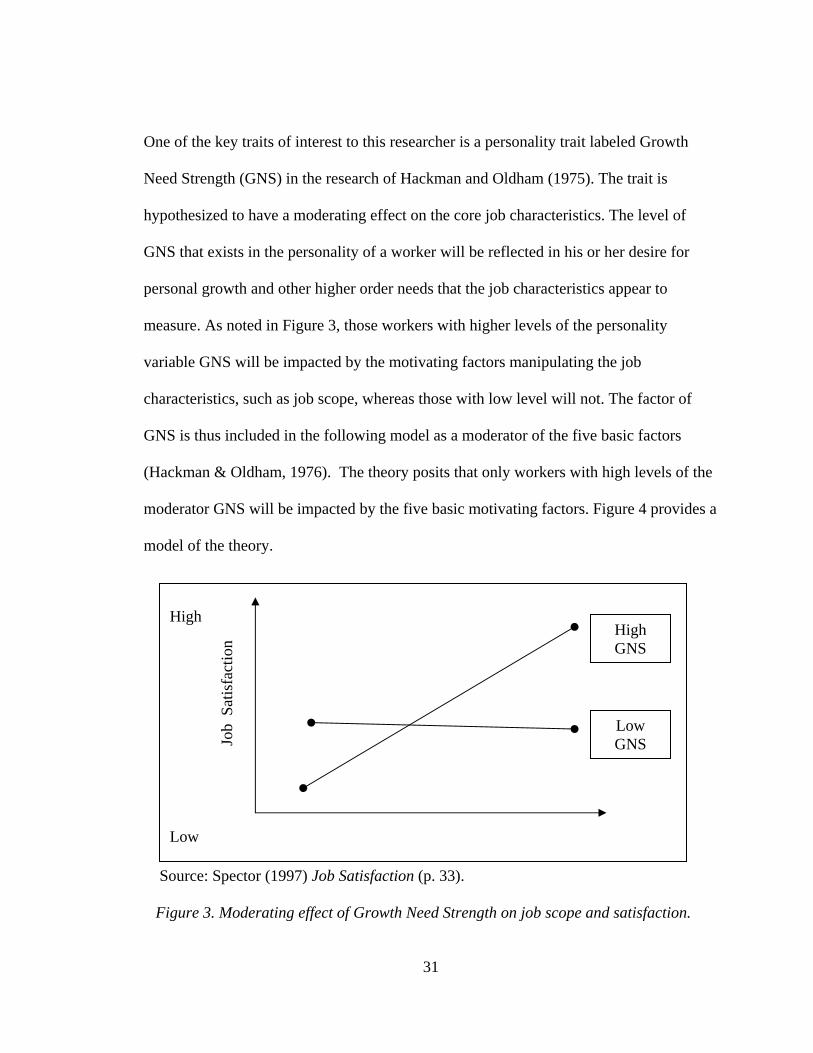
Source: Spector (1977) Job Satisfaction (p. 32).
Work Motivation Job Performance Job Satisfaction
Attendance
Growth Need Strength
Experience Meaningfulness
Experience Meaningfulness
Experience Meaningfulness
Autonomy
Feedback
Skill variety Task identity
Task significance
Core Characteristics Psychological States Outcomes
Figure 4. Hackman and Oldham’s 91976) Job Characteristics Model.
The personality traits reviewed in the aforementioned studies and the facets
included in the instruments covered in this review of literature can be readily assumed to
have some congruence with the traits and facets that are included in the Occupational
Work Ethic Inventory ([OWEI]; Petty, 1991a).
Demographics
Chapter I of this study presented a review of the impact of demographics on job
satisfaction. This was covered sufficiently in the conceptual framework section of
Chapter I; therefore, this study will not repeat the findings of the studies mentioned.
However, additional studies that included the most recent work of D’Addio,
Erikson, and Frijters (2004) will be covered with research associated with the OWEI and
demographics that appear to be correlated with both OWEI and job satisfaction. This will
be enhanced when reviewing the impact of these variables in diverse cultures.
32
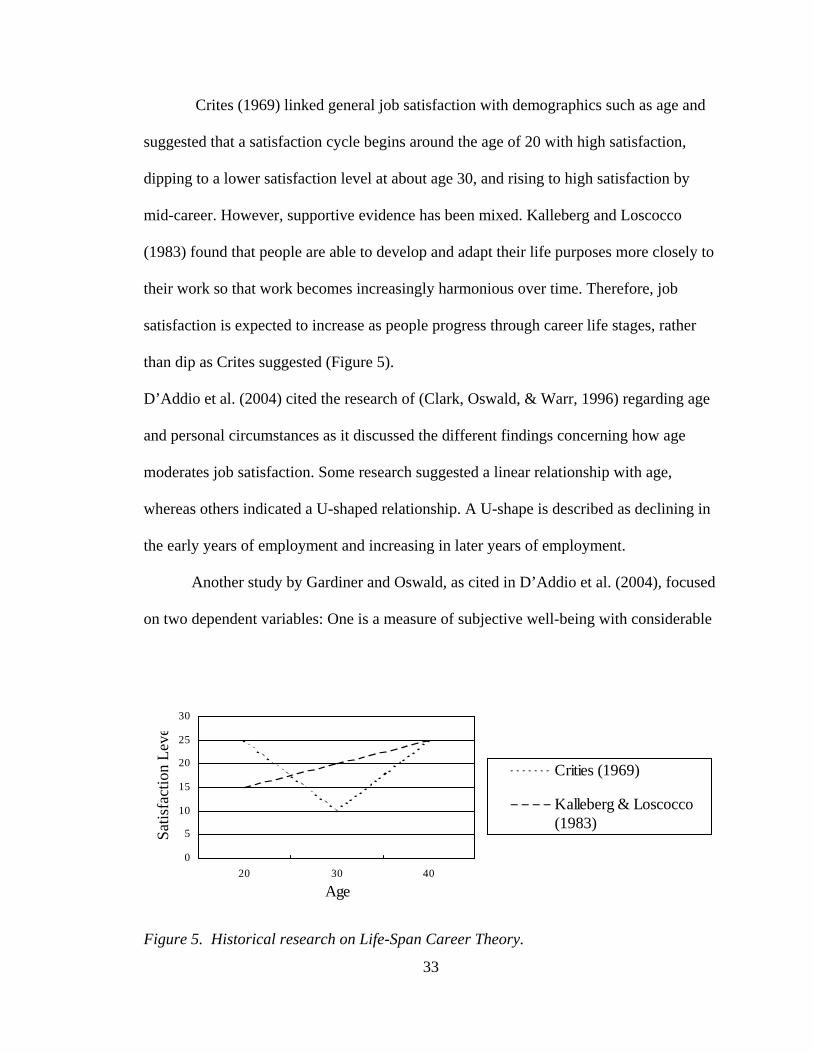
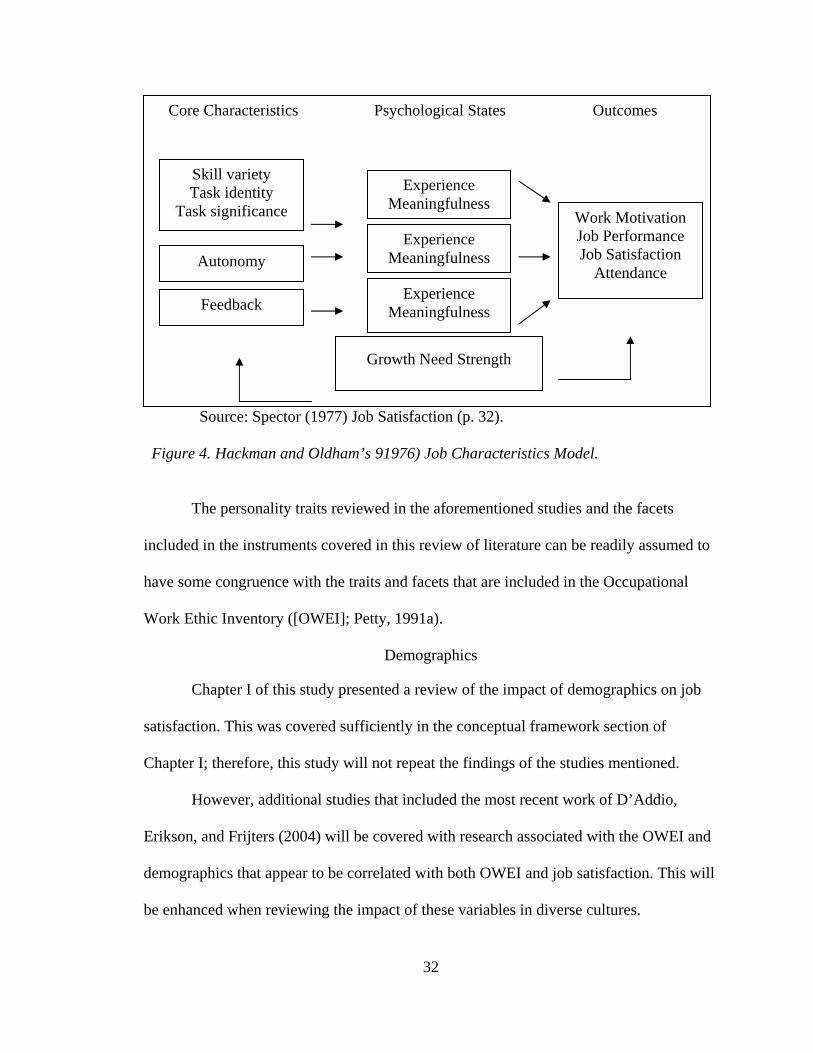
Crites (1969) linked general job satisfaction with demographics such as age and
suggested that a satisfaction cycle begins around the age of 20 with high satisfaction,
dipping to a lower satisfaction level at about age 30, and rising to high satisfaction by
mid-career. However, supportive evidence has been mixed. Kalleberg and Loscocco
(1983) found that people are able to develop and adapt their life purposes more closely to
their work so that work becomes increasingly harmonious over time. Therefore, job
satisfaction is expected to increase as people progress through career life stages, rather
than dip as Crites suggested (Figure 5).
D’Addio et al. (2004) cited the research of (Clark, Oswald, & Warr, 1996) regarding age
and personal circumstances as it discussed the different findings concerning how age
moderates job satisfaction. Some research suggested a linear relationship with age,
whereas others indicated a U-shaped relationship. A U-shape is described as declining in
the early years of employment and increasing in later years of employment.
Another study by Gardiner and Oswald, as cited in D’Addio et al. (2004), focused
on two dependent variables: One is a measure of subjective well-being with considerable
0
5
10
15
20
25
30
20 30 40
Age
Satis
fact
ion
Leve
Crities (1969)
Kalleberg & Loscocco(1983)
Figure 5. Historical research on Life-Span Career Theory.
33
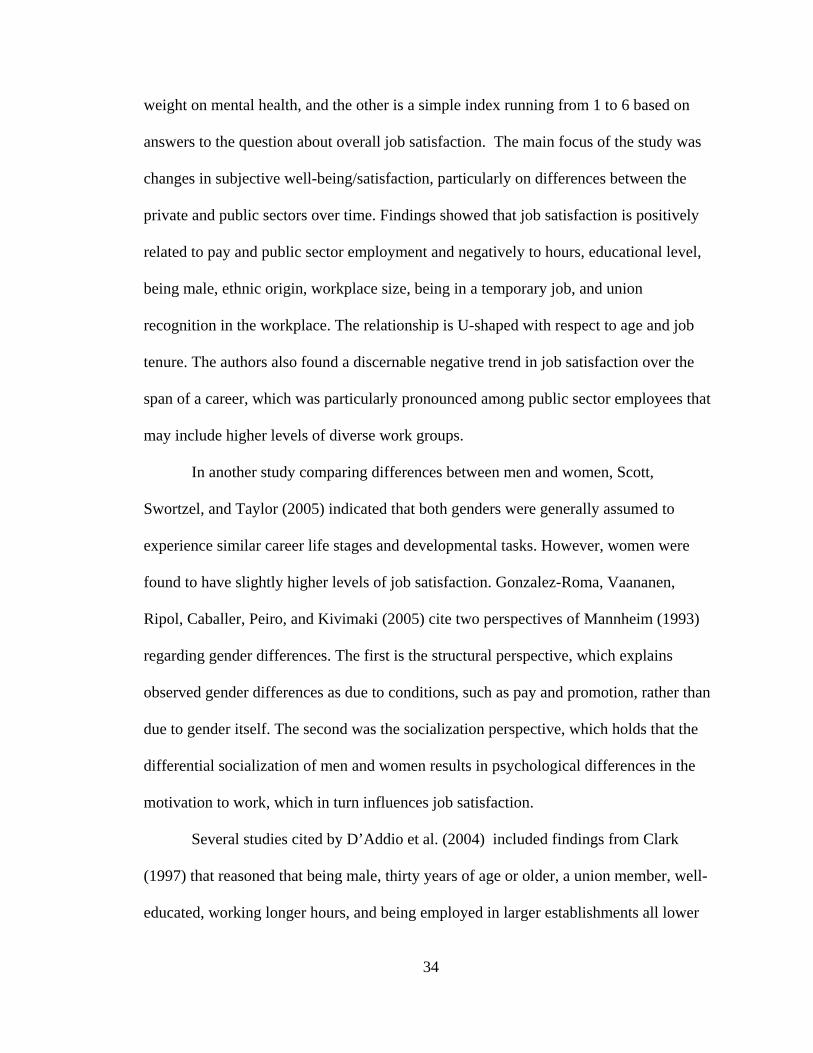
weight on mental health, and the other is a simple index running from 1 to 6 based on
answers to the question about overall job satisfaction. The main focus of the study was
changes in subjective well-being/satisfaction, particularly on differences between the
private and public sectors over time. Findings showed that job satisfaction is positively
related to pay and public sector employment and negatively to hours, educational level,
being male, ethnic origin, workplace size, being in a temporary job, and union
recognition in the workplace. The relationship is U-shaped with respect to age and job
tenure. The authors also found a discernable negative trend in job satisfaction over the
span of a career, which was particularly pronounced among public sector employees that
may include higher levels of diverse work groups.
In another study comparing differences between men and women, Scott,
Swortzel, and Taylor (2005) indicated that both genders were generally assumed to
experience similar career life stages and developmental tasks. However, women were
found to have slightly higher levels of job satisfaction. Gonzalez-Roma, Vaananen,
Ripol, Caballer, Peiro, and Kivimaki (2005) cite two perspectives of Mannheim (1993)
regarding gender differences. The first is the structural perspective, which explains
observed gender differences as due to conditions, such as pay and promotion, rather than
due to gender itself. The second was the socialization perspective, which holds that the
differential socialization of men and women results in psychological differences in the
motivation to work, which in turn influences job satisfaction.
Several studies cited by D’Addio et al. (2004) included findings from Clark
(1997) that reasoned that being male, thirty years of age or older, a union member, well-
educated, working longer hours, and being employed in larger establishments all lower
34
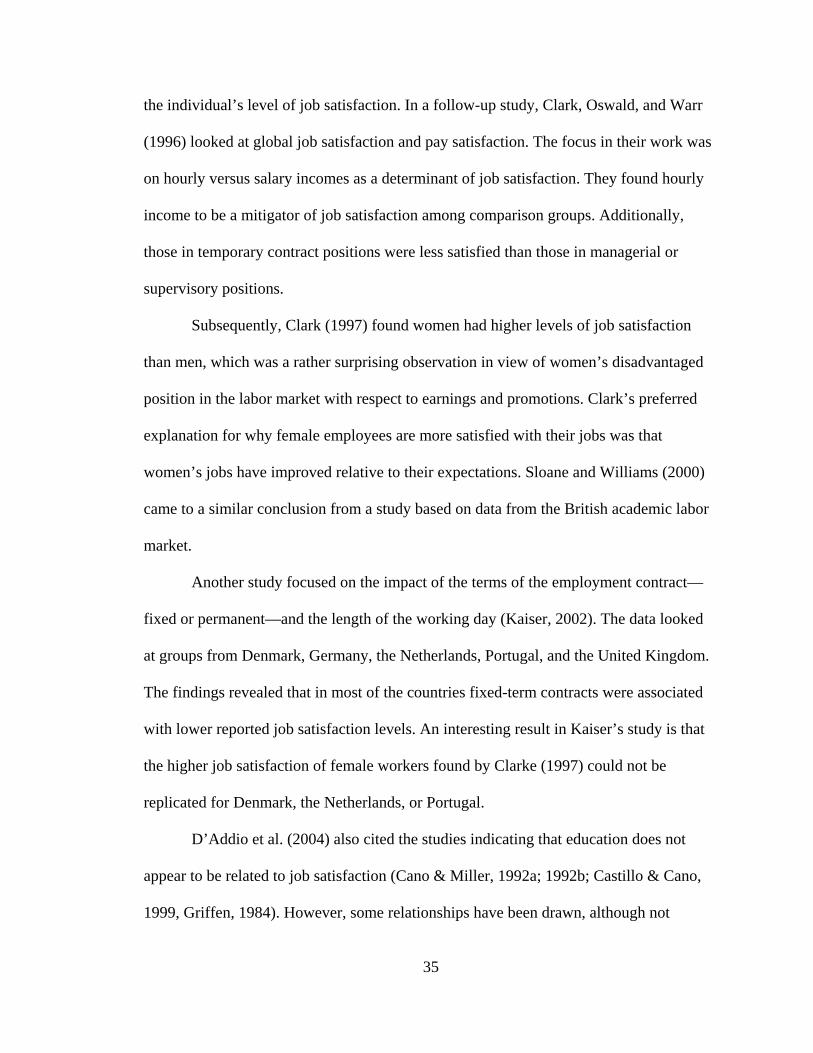
the individual’s level of job satisfaction. In a follow-up study, Clark, Oswald, and Warr
(1996) looked at global job satisfaction and pay satisfaction. The focus in their work was
on hourly versus salary incomes as a determinant of job satisfaction. They found hourly
income to be a mitigator of job satisfaction among comparison groups. Additionally,
those in temporary contract positions were less satisfied than those in managerial or
supervisory positions.
Subsequently, Clark (1997) found women had higher levels of job satisfaction
than men, which was a rather surprising observation in view of women’s disadvantaged
position in the labor market with respect to earnings and promotions. Clark’s preferred
explanation for why female employees are more satisfied with their jobs was that
women’s jobs have improved relative to their expectations. Sloane and Williams (2000)
came to a similar conclusion from a study based on data from the British academic labor
market.
Another study focused on the impact of the terms of the employment contract—
fixed or permanent—and the length of the working day (Kaiser, 2002). The data looked
at groups from Denmark, Germany, the Netherlands, Portugal, and the United Kingdom.
The findings revealed that in most of the countries fixed-term contracts were associated
with lower reported job satisfaction levels. An interesting result in Kaiser’s study is that
the higher job satisfaction of female workers found by Clarke (1997) could not be
replicated for Denmark, the Netherlands, or Portugal.
D’Addio et al. (2004) also cited the studies indicating that education does not
appear to be related to job satisfaction (Cano & Miller, 1992a; 1992b; Castillo & Cano,
1999, Griffen, 1984). However, some relationships have been drawn, although not
35
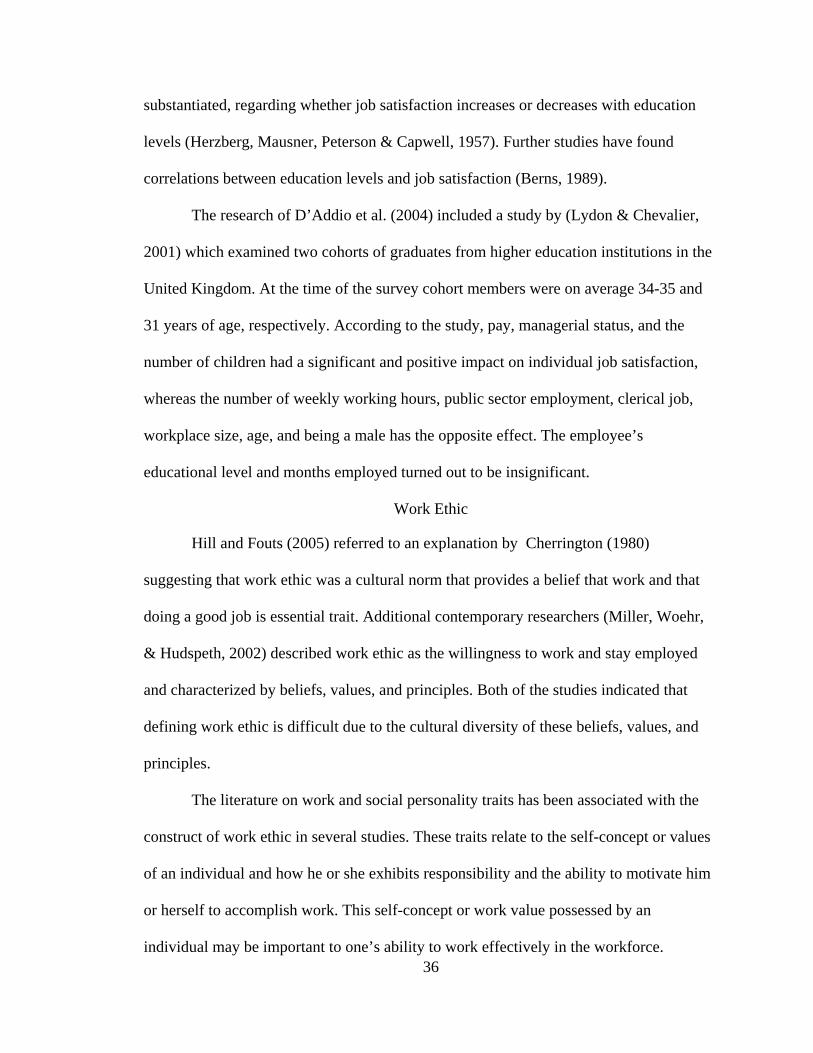
substantiated, regarding whether job satisfaction increases or decreases with education
levels (Herzberg, Mausner, Peterson & Capwell, 1957). Further studies have found
correlations between education levels and job satisfaction (Berns, 1989).
The research of D’Addio et al. (2004) included a study by (Lydon & Chevalier,
2001) which examined two cohorts of graduates from higher education institutions in the
United Kingdom. At the time of the survey cohort members were on average 34-35 and
31 years of age, respectively. According to the study, pay, managerial status, and the
number of children had a significant and positive impact on individual job satisfaction,
whereas the number of weekly working hours, public sector employment, clerical job,
workplace size, age, and being a male has the opposite effect. The employee’s
educational level and months employed turned out to be insignificant.
Work Ethic
Hill and Fouts (2005) referred to an explanation by Cherrington (1980)
suggesting that work ethic was a cultural norm that provides a belief that work and that
doing a good job is essential trait. Additional contemporary researchers (Miller, Woehr,
& Hudspeth, 2002) described work ethic as the willingness to work and stay employed
and characterized by beliefs, values, and principles. Both of the studies indicated that
defining work ethic is difficult due to the cultural diversity of these beliefs, values, and
principles.
The literature on work and social personality traits has been associated with the
36
construct of work ethic in several studies. These traits relate to the self-concept or values
of an individual and how he or she exhibits responsibility and the ability to motivate him
or herself to accomplish work. This self-concept or work value possessed by an
individual may be important to one’s ability to work effectively in the workforce.
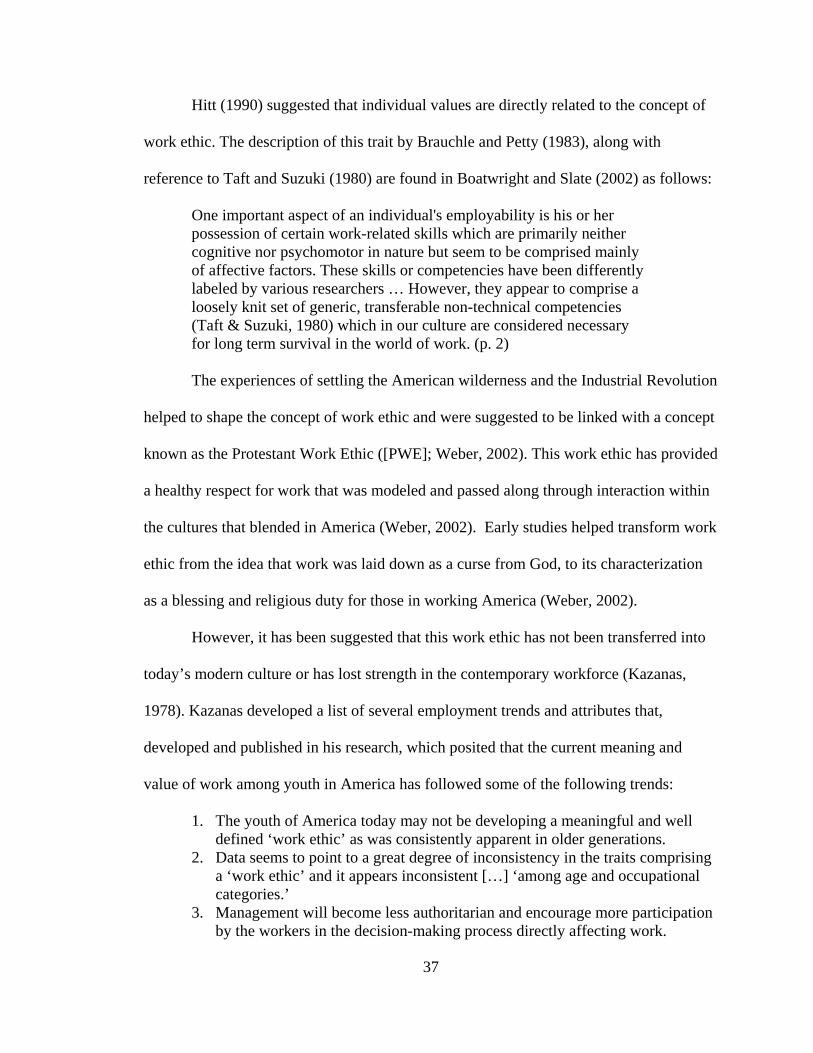
Hitt (1990) suggested that individual values are directly related to the concept of
work ethic. The description of this trait by Brauchle and Petty (1983), along with
reference to Taft and Suzuki (1980) are found in Boatwright and Slate (2002) as follows:
One important aspect of an individual's employability is his or her possession of certain work-related skills which are primarily neither cognitive nor psychomotor in nature but seem to be comprised mainly of affective factors. These skills or competencies have been differently labeled by various researchers … However, they appear to comprise a loosely knit set of generic, transferable non-technical competencies (Taft & Suzuki, 1980) which in our culture are considered necessary for long term survival in the world of work. (p. 2) The experiences of settling the American wilderness and the Industrial Revolution
helped to shape the concept of work ethic and were suggested to be linked with a concept
known as the Protestant Work Ethic ([PWE]; Weber, 2002). This work ethic has provided
a healthy respect for work that was modeled and passed along through interaction within
the cultures that blended in America (Weber, 2002). Early studies helped transform work
ethic from the idea that work was laid down as a curse from God, to its characterization
as a blessing and religious duty for those in working America (Weber, 2002).
However, it has been suggested that this work ethic has not been transferred into
today’s modern culture or has lost strength in the contemporary workforce (Kazanas,
1978). Kazanas developed a list of several employment trends and attributes that,
developed and published in his research, which posited that the current meaning and
value of work among youth in America has followed some of the following trends:
1. The youth of America today may not be developing a meaningful and well defined ‘work ethic’ as was consistently apparent in older generations.
2. Data seems to point to a great degree of inconsistency in the traits comprising a ‘work ethic’ and it appears inconsistent […] ‘among age and occupational categories.’
3. Management will become less authoritarian and encourage more participation by the workers in the decision-making process directly affecting work.
37
4. Feelings of work dissatisfaction are not confined to a particular class or race in the American society, and that increasing dissatisfaction among the younger and better educated workers is evidenced.
5. There will be an earlier obsolescence of specific job skills and knowledge. (Kazanas, 1978, pp. 56-57)
Some studies have explained these trends by suggesting that significant workplace
changes have occurred that may have contributed to the decline in work ethic among the
contemporary workers. For example, Wayne and Chapman, (1992) pointed out that
workers have more control over the work they accomplish. Another finding noted that
the importance of continual learning due to rapid technology changes may greatly impact
employee perceptions of work. Furthermore, their research indicated that employees are
faced with more mental, visual, and emotional stimulation due to these rapid changes.
Life-Span Career theorists have speculated that job satisfaction is correlated to the
degree to which individuals have been able to “implement their self-concepts" (Super,
Savickas, & Super, 1996, p. 125). Therefore, the satisfaction level of an individual's work
depends on the successful translation of “one's idea of oneself into occupational terms"
(Super et al., 1996, p. 139). That dynamic changes and diversity faced in contemporary
work environments may have also impacted the trends observed by Kazanas (1978).
Miller and Coady (1986) linked the term “work ethic” to the values and principles
that guide how one approaches the responsibilities and rights within activities. The
authors theorized that individuals develop an interactive system that helps them adapt to
work situations. This development of adaptation and integration helps sustain “long term
harmony with his or her work environment” (p. 6). This process includes three stages:
1. The environment assumes a dominant position relative to the individual’s approach to ethical conduct.
38
2. Development derives patterns of ethical conduct from habits formed from the behavioral responses of dealing with environmental influences.
3. Individuals can make a decision based on environmental choices; habits
formed from previous decisions, or reach a decision based on their understanding of the principals of conduct in the workplace.
Obviously, the conflicts that occur among different values and beliefs may disrupt
a smooth transition through these steps. More research will help us better understand the
problems existing in our contemporary workforce, especially in the issues surrounding
diversity and adaptation in the workplace.
Work Ethic in the Workplace
Several studies regarding the work ethic of workers have been carried out. For
example, Hill and Petty (1995), citing Hatcher (1994), found significant differences in the
work ethic of apprentices and instructors in a national apprenticeship-training program.
These differences were impacted by occupation and work experiences.
Hollingsworth (1995) conducted research (cited in Petty and Hill, 2005) to
determine if a correlation is present between leadership effectiveness as measured by the
Leadership Orientation Survey (LOS) and work ethic as measured by the revised version
of the OWEI (Petty, 1995b). One of the conclusions from this study was that a positive
work ethic is a good predictor of leadership effectiveness.
DeLeon and Borchers (1998) conducted a study to determine key skills among
manufacturers in Texas. Their findings argued that interpersonal or soft skills such as
group interaction, employability and personal development were valued more than
communication and computational skills. Additional evidence was provided in a Delphi
study in Tennessee, which suggested that employers valued those potential employees
39
with key interpersonal skills that allowed them to operate effectively in work teams
(Dean & West, 1999).
A related study by McDonald and Hite (1999) found differences between women
who were successful in gaining opportunities for development in their careers and those
who did not. The key differences were found in personality traits among those women
willing to participate in leadership development and their initiative in volunteering for
assignments.
Demographics and Work Ethic
Several demographic studies have resulted in interesting findings regarding work
ethic. For example, in a study of gender differences, Petty and Hill (1995) cited earlier
research (Petty & Hill, 1994) that found that women scored higher than men in the
following personality traits: (a) dependability, (b) ambition, (c) consideration, and (d)
cooperation. The research also noted further congruence with previous research regarding
ethic and gender (Hill, 1993).
Petty (1995) analyzed how age might impact work ethic as measured by the
OWEI. A group of workers from various occupations were categorized into five age
groups. The study found that those in the 36-55 age group scored higher than any of the
age groupings on the subscale of ambition.
40
Petty and Hill (2005) cite previous research (Petty, 1995c) in suggesting that the
level of education also seems to influence work ethic. He provided confirmation of this
finding in his study of five levels of education: (a) less than high school, (b) high school
graduate, (c) associate degree, (d) bachelors degree and (e) graduate work. He used the
OWEI and found that more educated individuals scored higher levels of work ethic on all
subscales of the instrument: (a) dependable, (b) ambitious, (c) considerate, and (d)
cooperative). The most pronounced correlation was between dependability and work
ethic variables.
Petty (1995) also found that work ethic differed by occupation. Recommendations
from the study concluded that organizations should be “aware of perceived differences in
work ethic” (p.139). Additionally, the changing expectations of a work force must be
considered in order “to be effective in the 21st century” (p. 139). Petty went on to suggest
more research is needed regarding the concept.
Another key contributor was a finding that indicated that exposure to vocational
training programs produced higher levels of work ethic among high school students
(Crosby & Petrosko, 1990). Finally, the number of hours students worked per week as
they grow up also impacted the level of work ethic among students (Allender, 1993).
Occupational Work Ethic Inventory
Research gained from development of the Affective Work Competency Inventory
([AWCI]; Kazanas, 1978) was used to develop the OWEI. The AWCI was also used to
measure differences in the attitudes between workers, supervisors, and vocational
educators. In another study, the instrument helped researchers categorize 15 separate
clusters of 63 identified affective competencies (Petty & Morgan, 1980). In a follow up
study, Brauchle, Petty, and Morgan (1983) conducted a factor analysis of the AWCI. The
finding indicated that five factors—(a) ambition, (b) self-control, (c) organization, (d)
enthusiasm, and (e) conscientiousness—accounted for 76.3 % of the instrument’s
variance. The reliability measurements ranged from .64 to .89 for the five factors, which
were acceptable ranges for developing instruments. Petty (1991a) then began the
development of the OWEI. He utilized a list of phrases obtained from earlier research
41
(Petty & Morgan, 1980). A group of subject matter experts were then organized to help
establish the content validity of the terms created from the list of phrases. Simple
descriptors were categorized into groups and redundantly re-categorized until the experts
reached a consensus. The following categories resulted from their work: (a) dependable,
(b) ambitious, (c) considerate, and (d) cooperative.
These traits were then used in a pilot study that resulted in a coefficient alpha of
.95 being computed for internal consistency (Petty, 1991b). Therefore, all 50 items used
in the pilot study of the OWEI were considered appropriate. The results and internal
validity were confirmed in a follow up study (Hill, 1992). The follow-up study resulted
in a computed coefficient alpha of .94. Individual subscales calculations resulted in: (a)
cooperative = .72, (b) ambitious = .75, (c) dependable = .86, and (d) considerate = .87.
Further research (Hatcher, 1994) as cited by (Hill & Petty, 1995) found that a
mathematical relationship existed with similar subscales. The data analysis suggested that
the instrument’s 50 items and subscales loaded on single rather than multiple factors.
These findings provided evidence that the OWEI could be considered a one-dimensional
instrument.
Petty (1995) added an anchor and stem phrase to several cluster groups on the
instrument that read: “At work, I can describe myself as.” In addition, the directions
instructed: “For each work ethic descriptor listed below, CIRCLE THE NUMBER that
most accurately describes your standards for that item.” There are seven possible choices
for each item: 1= never, 2 = almost never, 3 = seldom, 4 = sometimes, 5 = usually, 6 =
almost always, and 7 = always. A shorter version was later developed and termed the
Occupational Work Ethic Inventory-Revised. The short version uses a five-choice
42
response scale for 23 items, which were pulled from the original 50-item instrument.
Another factor analysis study was conducted (Hill & Petty, 1995) to determine
key themes characterized from the (OWEI). The results of the analysis suggested that the
following four key factors accounted for approximately 39% of the variance (p. 65): (a)
Interpersonal Skills, which were items related to working and cooperating with others;
(b) Initiative, which incorporated ambition and adhering to difficult job situations; (c)
Dependability, which had to do with fulfilling the expectations of the employer; and (d)
Reverse items, which were items stated in the negative rather than positive to disrupt the
development response patterns by respondents. Hill and Petty (1995) suggested that the
research might be used to guide changes in developmental programs to embed work ethic
within various environments.
Cross-Cultural Environments
Two of the world’s greatest manufacturing economies belong to the United States
and Japan. These two economic giants have benefited from partnerships and will no
doubt continue their collaboration in future initiatives. However, problems with cross-
cultural differences have been encountered among the human resource practitioners
involved with these global partnerships (Ouichi, 1981, Lim, 2001). Understanding the
unique challenges of the various differences in work ethic and job satisfaction will no
doubt provide researchers with many opportunities to add to the body of knowledge
regarding these complex issues.
43
The literature regarding cross-cultural differences among companies in the United
States and abroad contains several examples of problems experienced by expatriates.
Black and Porter (1991) found that lack of training and competence in dealing with cross-
cultural differences usually resulted in expatriates applying management styles that were
successful for them in their home country rather than adjusting to the cultural practices of
their host country. Black, Gergersen, and Mendenhall (1992) reasoned that this lack of
cross-cultural understanding might lead to significant failure rates in achieving goals and
objectives assigned to expatriates.
Lam and Selmer (2005) cited research that has provided evidence that people
living in different cultures for a period of time can develop traits and behaviors that are
different than from those of the culture to which they may have originally been exposed
(Useem, 2001). Experience and common sense also suggest that individuals who
transform their thinking to incorporate what they have learned are more likely to follow
through and try to inculcate different perspectives. Therefore, it would be valuable to
those tasked with development of programs designed to blend work ethics among and
between various cultures to gain a deeper understanding of how these two constructs
impact both these target groups. As organizations increase in cultural diversity, many
individuals need new information in order to effectively communicate in diverse
communities, organizations, workplaces, and societies (Zalcman, 2001). Cultural
diversity in the workplace inherently changes the organizational culture and, as a result,
necessitates a pursuit of varied approaches to understanding different perspectives of
problem solving, different visions, and different expectations. Debates regarding the
merits of one cultural method as compared to another way of doing things are usually
necessary in order to synthesize the differences into the best way of integrating
management and culture in organizations (Noe, 1998).
Linowes (2001) referred to typical impressions that Japanese expatriates have of
both business and environmental culture in the United States as “impression shock” and
44
used the phrase “integration shock” to identify how Americans interpret Japanese
expatriate management style and organizational culture. American and Japanese
companies must comprehend and deal with cultural differences that exist between them
in order to have successful business interactions. Human resource practitioners must
mitigate the problem associated with lack of understanding and enhance the learning
between both groups regarding these differences (Noe, 1998).
Ouchi (1981) formulated what is known as Theory Z, a hybrid of McGregor’s
(1960) work, which leads to the X and Y Theory. Theory Z combined traditional
American management traits with Japanese management styles. However, at the time of
Ouchi’s research, several differences were apparent among American and Japanese
management styles. One of the more obvious areas of difference was the stronger
Japanese commitment to the human side of business, especially in the practice of
consensus-making regarding decisions. Ouchi posited that “involved workers are the key
to increased productivity” (1981, p. 4). This provides some support for the hypothesis
that the satisfaction of workers may impact a strong work ethic. Ouchi went on to note
that these cultural differences may not be appropriate in the work ethic of the United
States, suggesting that different cultures impact work ethic and job satisfaction.
Human resource practitioners must become more aware of cultural differences
and the influences these differences have on attitudes among diverse groups. Noe (1998)
defined culture as a set of assumptions group members share about the world and how it
works, including ideals worth pursuing. Noe cited Hofstede (1980) on cultural
differences among different countries. The dimensions in Hofstede’s study are as follows:
1. Individualism or Collectivism, which is the difference in how workers act as individuals rather than as a group.
45
2. Uncertainty Avoidance refers to the degree to which people prefer structure
rather than unstructured situations. 3. Masculinity or Femininity refers to the extent to which the values behaviors
are considered masculine (competitive) or feminine (helpfulness). 4. Power Distance refers to expectations for the unequal distribution of power in
a hierarchy. 5. Long- or Short Term Orientation refers to the degree to which a culture
focuses on the future rather than the past or present. Research has expounded on Hofstede’s work regarding differences in job
satisfaction and organizational commitment across cultures. Lincoln and Kalleberg
(1985) found that job satisfaction was higher in the United States than in Japan. Luthans,
McCaul, and Dodd (1985) also suggested that organizational commitment is higher
among employees in the United States than among their Japanese counterparts.
Furthermore, some researchers have argued that this organizational commitment is
attributable to job satisfaction (Dorfman & Howell, 1988).
The work ethic regarding how people approach their daily activities and the
impact of work on employee satisfaction varies considerably based on culture. Culture is
defined as “the acquired knowledge that people use to interpret experience and generate
social behavior. This knowledge forms values, creates attitudes, and influences behavior
(Hodgetts & Luthans, 1993, p. 108). This variance makes cross-cultural communication
in the area of work ethic and job satisfaction an important facet in business. Additionally,
lack of attention to these areas may create significant problems in performance among
companies.
Black, Gergersen, and Mendenhall (1992) proposed that although one person may
have the ability to succeed in his or her own country, this does not ensure success in
46
dealings with another culture. Therefore, the importance of designing human resource
development programs that support the adaptation and learning necessary for various
cultures will be essential in the future. Organizations will need to understand the barriers
to motivation and job satisfaction that exist among and between different cultures
Cultural variances can be viewed within the organizational setting through
differences in background, language, customs, rituals, acceptable behaviors, and beliefs
(Tovey, 1997). Research has linked employee attitudes with cultural variance or values.
However, due to the complexity of moderating and intervening variables, the research has
failed to provide an explanation about why this phenomenon exists (Palich, Horn, &
Griffeth, 1995; Sommer, Bae, & Luthans, 1996). Organizations generally have to deal
with elements of cultural variance impacted by the work ethic of their workers. The
cultural variance in companies has been recognized as related to and impacting both
operational process and communication issues (Tovey). Furthermore, Eby, Freeman,
Rush, and Lance (1999) found that intrinsic motivation or psychological mechanisms that
trigger commitment to an organization were related to work attitudes and moderated job
satisfaction. Additionally, they found that this commitment and job satisfaction were
related to turnover and absenteeism.
The impact of cultural variances should also reflect an understanding of how these
variances can impact business. For example, companies must recognize that legal and
ethical obligations apply when customers or other affiliates have problems working with
individuals who are culturally different. If a client expresses discomfort working with
women or persons of color, the implications for the business setting and within the scope
of communications management has both organizational and legal ramifications
47
(Morrison, 1992).
Different management styles can also be demonstrated through cultural variances.
For example, Middle Eastern managers in the United States present a more coercive
management style and more direct communication than native managers (Bakhtari,
1995). Another study (Osman-Gani, 2000) also revealed that there are many distinct
differences between cultural views regarding management training preferences in various
work environments. Perceptions of learning are different and therefore produce different
interpretations and views regarding the concepts taught. These differences in learning
experiences may be attributed to the culture and work ethic of the organization.
Proposals for Cross Cultural Development
Wang and Elkins (2002) cited the work of Mendenhall and Stahl (2000), along
with that of Wright and Nasierowski (1994), for spreading a global mindset among
managers, especially in U.S. firms. This approach includes using repatriates and
conducting integration workshops. Repatriates are employees that have been assigned in
a host country for a period of time and then returned to their home country. Using
repatriates allows better use of the experience and knowledge acquired while on
assignment to be utilized in developing others in the business knowledge, intercultural
skills, and foreign language talent needed to prepare future expatriates and their families
for assignments. Another benefit is that repatriates are able to adjust their professional
and personal lives back to their home country (Wright & Nasierowski, 1994).
Additionally, the use of repatriates to prepare future expatriates may cause repatriates to
feel that the company values their knowledge and skills, which then impacts their job
satisfaction.
48
Several proposals (Yiu & Saner, 2000) have maintained that certain traits of
individual managers may determine their ability to adapt to new settings. In general, the
propositions have great utility in helping companies embed methods for adapting and
adopting the work ethic of various cultures into a coherent system that can mitigate
problems in motivation and job performance. These proposals point us toward solutions
for improving managerial effectiveness in various cross-cultural situations.
Proposition 1
To be effective in cross-cultural situations, expatriate managers need to acquire
and develop strong perceptual, as well as basic, managerial skills (Selmer, 2000). These
perceptual skills may be improved by developing personal (work ethic) values congruent
with perceptual skills. Additionally, reference schemas, which are what people assume to
be true about work situations, need to be understood (Yiu & Saner, 2000).
Proposition 2
Expatriate managers need to be able to develop the perceptual skills mentioned in
Proposition 1. Those managers who rely solely on their cognitive management skills
might ultimately find them misjudged by other cultures. For example, field
independent managers may be seen as arrogant or distant, whereas field dependent
managers may appear to be indecisive and perhaps incompetent. Therefore, expatriates
must develop in-depth knowledge of the new culture and the differences between the new
culture and their own.
Proposition 3
This proposition links the two previous propositions by increasing the importance
of making cultural adaptations in language, demeanor, values, and schemas when
49
considering the significance of cultural distance between two groups.
Proposition 4
Obviously, the stronger the cultural differences, the greater the difficulty in
adjusting to a new culture. Therefore, the ability of an expatriate to integrate field
dependence and field independence skills is more significant in cultures with profound
cultural differences.
Proposition 5
Managers need to be able to master cognitive understandings of other cultures and
also acquire a subjective familiarity of other cultures. The expatriate should be able to
utilize different styles of role expectations based on the environmental context in which
they find themselves. Therefore, they need to be able to understand the appropriateness
of such roles in varying environmental context.
Proposition 6
A hierarchy of learning experiences that expatriate managers progress through is
necessary for developing the perceptual skills alluded to in the previous propositions.
The forms of these learning experiences need to be both structured training courses and
developmental opportunities, such as actual overseas experience.
Tools for Researching Work Ethic in Cross-Cultural Environments
50
Selmer (2000) developed a tool that can aid in researching work ethic in cross-
cultural settings. This projective-needs assessment instrument is a work value
questionnaire that has been thoroughly tested in other cross-cultural comparisons. The
questionnaire has utility for human resource development practitioners by identifying
work values of local employees in order to capture the essential components of the host’s
workplace environment. One of the key goals for using the instrument is to assess
training needs for business expatriates quantitatively in order to facilitate their work
adjustment into a new environment.
The instrument has three separate work value categories: cognitive, affective and
instrumental. The cognitive category deals with motivation, achievement and
responsibility. The affective category deals with interpersonal relations. The instrumental
category measures more practical or monetary values. The differences between the
expatriate managers' perceptions and the actual needs deemed significant by employees
in several studies using this instrument have yielded significant differences. Another
additional utility of this instrument is the ability to capture the general character of
training needed and which of the three work value categories require more attention.
This assessment can also identify those individual work values likely to be misinterpreted
by expatriates.
An alternative tool for effective expatriate manager development is an embedding
mechanism that encourages feedback-seeking behaviors from managers regarding their
performance. Feedback-seeking is defined as a process by which actors purposefully and
actively seek to obtain information to “determine the adequacy of behaviors for attaining
valued end states" (Ashford, 1986, p. 466). Embedding mechanisms for feedback may
include some of the following: job tasks, work systems, job aids, surveys, course
requirements, mentoring, and self-reports that include an individual’s own thoughts about
his or her performance. A recent study (Kuchinke, 2000) indicated that instructors who
encourage managers to seek feedback during and after a training course are more likely to
have the course experience rated as beneficial by a manager. Additionally, the learner
51
perceives the knowledge, skills, and attitudes obtained during training as more valuable
and therefore transfer of learning is also found to be more significant.
The addition of development activities may be perceived by some as an additional
stressor in an already busy work schedule that may impact job satisfaction. This also
leads to questions regarding personality traits among expatriates that mitigate this
perception. For example, we can determine if levels of work ethic possessed by
expatriates impact their perception of development activities and reduce the degree of
stress associated with this development, which may also increase their job satisfaction.
Obviously, the opportunities available to continue mining these three constructs
of work ethic, job satisfaction, and their interaction with cultural differences among a
contemporary workforce are plentiful and provide a plethora of directions for future
research. It is hoped that these ideas, along with the findings from this research, will act
as a catalyst in encouraging more areas of inquiry for those with a passion for research in
the human resource development fields.
Summary of Review of Literature Chapter
The importance of measuring and monitoring the job satisfaction of workers is vital
to organizations that want to maintain a productive workforce. The empirical research
that suggests that several variables might impact job satisfaction is not conclusive but
does provide a broad base for more research. This paper will add to the current body of
knowledge by opening the possibility of job satisfaction to cross-cultural contexts.
52
The identification and development of good work ethic consistent with the culture
in which employees work is also a subject of significant interest. This phenomenon has
yet to be fully mined. Many variables have been studied regarding work ethic from single
culture perspectives. However, the continued growth of our global economy will require

that we begin asking questions regarding the diversity of work ethic as it can be adapted
or adopted by those alien to certain cultures.
53
CHAPTER III
METHODS OF RESEARCH AND PROCEDURES
As explained in Chapter I, this study is an investigation of the relationship
between job satisfaction using the Job Satisfaction Survey (JSS) and work ethic using the
short form of the Occupational Work Ethic Inventory (OWEI). The specific scope of this
study was to examine these variables in cross-cultural settings. Therefore, a Japanese
manufacturing organization was targeted as the data collection point. Chapter III is an
overall description of the population and sample selected for the study. The research
design, instrumentation, data collection procedures, and data analysis are also described.
Population and Sample
The population for this study was comprised of approximately 2,276 exempt and
non-exempt employees working in a Japanese-owned manufacturing company in the
southern United States. These individuals worked in three separate manufacturing plants
with different divisions, chains of command, job assignments, and product lines. Their
availability or accessibility, or both, made it difficult to accomplish a random sampling
method. Additionally, the population size was fairly large and located in different plants.
54
A stratified sampling of equal size was used to represent exempt and non-exempt
population groups from three separate manufacturing plants. Samples were generated
first by defining the population and then determining the desired sample size. Job status,
either exempt or non-exempt, was identified as a variable and listed under the subgroups
of three manufacturing plants. The variable of exempt (salaried employees) and non-
exempt (hourly-paid employees) were then identified as members of the subgroups. An
equal number of employees were randomly chosen for each of these variables for each of
the three manufacturing plants (see Table 6).
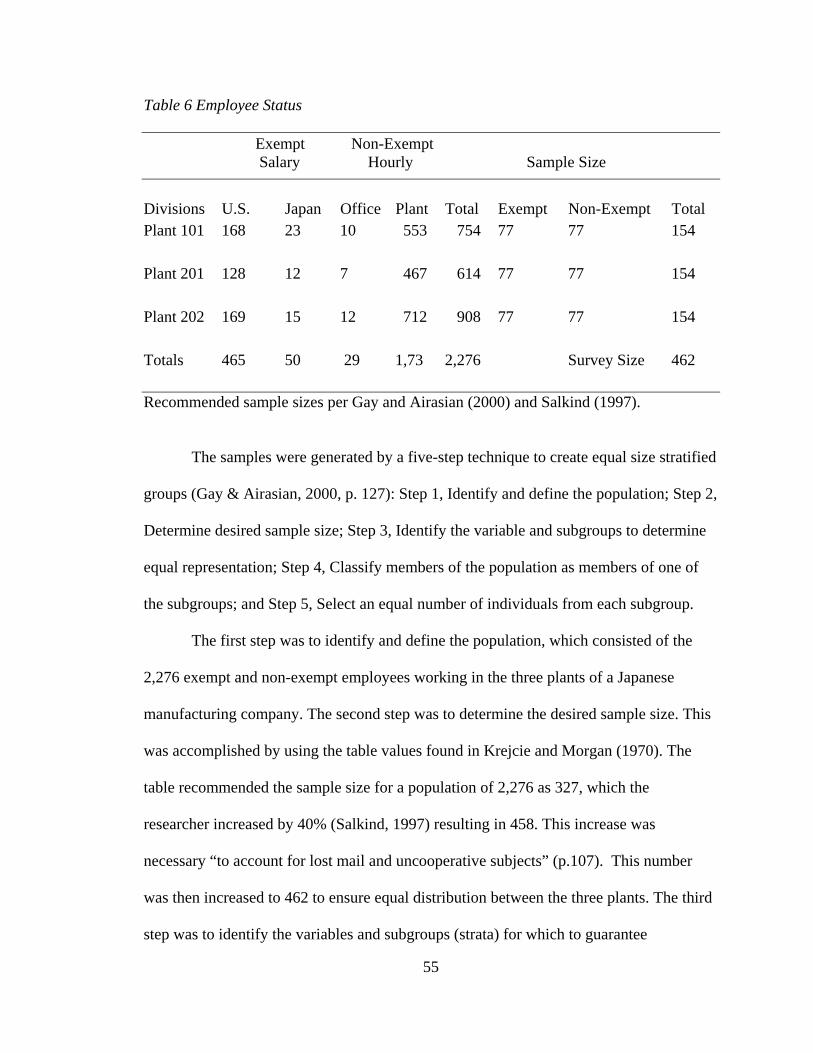
Table 6 Employee Status Exempt Non-Exempt Salary Hourly Sample Size
Divisions U.S. Japan Office Plant Total Exempt Non-Exempt Total Plant 101 168 23 10 553 754 77 77 154
Plant 201 128 12 7 467 614 77 77 154
Plant 202 169 15 12 712 908 77 77 154
Totals 465 50 29 1,73 2,276 Survey Size 462 Recommended sample sizes per Gay and Airasian (2000) and Salkind (1997).
The samples were generated by a five-step technique to create equal size stratified
groups (Gay & Airasian, 2000, p. 127): Step 1, Identify and define the population; Step 2,
Determine desired sample size; Step 3, Identify the variable and subgroups to determine
equal representation; Step 4, Classify members of the population as members of one of
the subgroups; and Step 5, Select an equal number of individuals from each subgroup.
The first step was to identify and define the population, which consisted of the
2,276 exempt and non-exempt employees working in the three plants of a Japanese
manufacturing company. The second step was to determine the desired sample size. This
was accomplished by using the table values found in Krejcie and Morgan (1970). The
table recommended the sample size for a population of 2,276 as 327, which the
researcher increased by 40% (Salkind, 1997) resulting in 458. This increase was
necessary “to account for lost mail and uncooperative subjects” (p.107). This number
was then increased to 462 to ensure equal distribution between the three plants. The third
step was to identify the variables and subgroups (strata) for which to guarantee
55
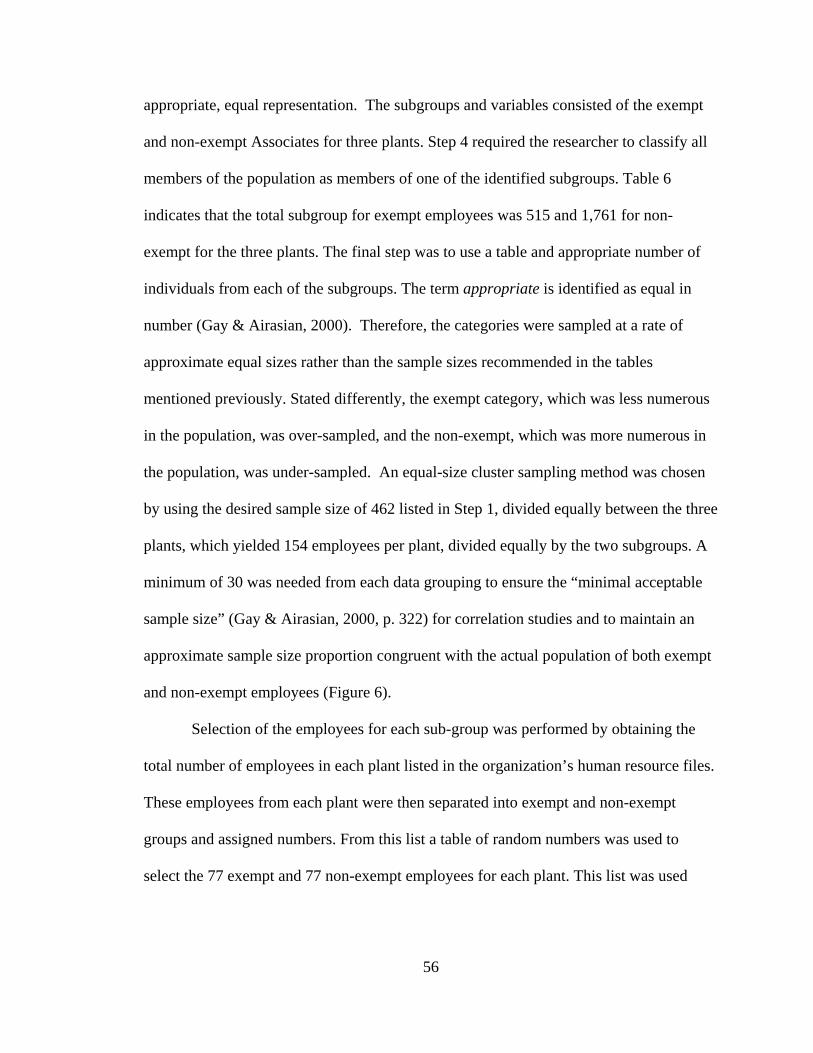
appropriate, equal representation. The subgroups and variables consisted of the exempt
and non-exempt Associates for three plants. Step 4 required the researcher to classify all
members of the population as members of one of the identified subgroups. Table 6
indicates that the total subgroup for exempt employees was 515 and 1,761 for non-
exempt for the three plants. The final step was to use a table and appropriate number of
individuals from each of the subgroups. The term appropriate is identified as equal in
number (Gay & Airasian, 2000). Therefore, the categories were sampled at a rate of
approximate equal sizes rather than the sample sizes recommended in the tables
mentioned previously. Stated differently, the exempt category, which was less numerous
in the population, was over-sampled, and the non-exempt, which was more numerous in
the population, was under-sampled. An equal-size cluster sampling method was chosen
by using the desired sample size of 462 listed in Step 1, divided equally between the three
plants, which yielded 154 employees per plant, divided equally by the two subgroups. A
minimum of 30 was needed from each data grouping to ensure the “minimal acceptable
sample size” (Gay & Airasian, 2000, p. 322) for correlation studies and to maintain an
approximate sample size proportion congruent with the actual population of both exempt
and non-exempt employees (Figure 6).
Selection of the employees for each sub-group was performed by obtaining the
total number of employees in each plant listed in the organization’s human resource files.
These employees from each plant were then separated into exempt and non-exempt
groups and assigned numbers. From this list a table of random numbers was used to
select the 77 exempt and 77 non-exempt employees for each plant. This list was used
56
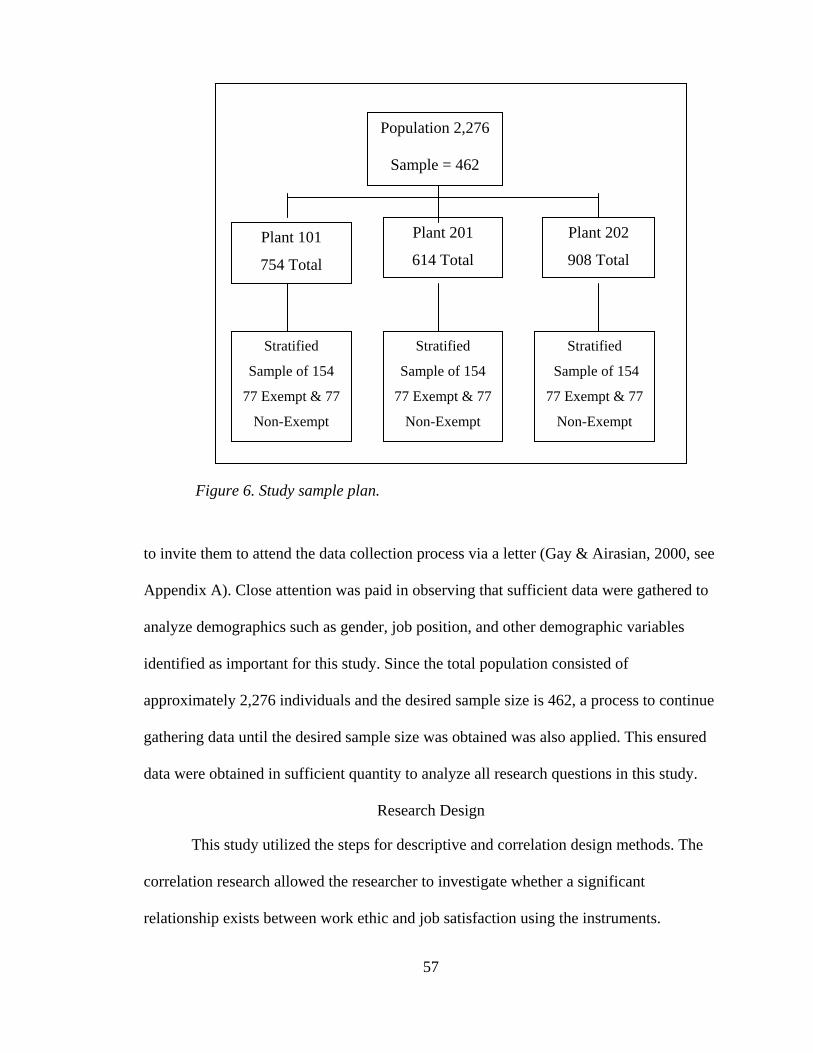
Population 2,276
Sample = 462
57
Plant 201 Plant 202 Plant 101
754 Total 614 Total 908 Total
Stratified
Sample of 154
77 Exempt & 77
Non-Exempt
Stratified
Sample of 154
77 Exempt & 77
Non-Exempt
Stratified
Sample of 154
77 Exempt & 77
Non-Exempt
Figure 6. Study sample plan.
to invite them to attend the data collection process via a letter (Gay & Airasian, 2000, see
Appendix A). Close attention was paid in observing that sufficient data were gathered to
analyze demographics such as gender, job position, and other demographic variables
identified as important for this study. Since the total population consisted of
approximately 2,276 individuals and the desired sample size is 462, a process to continue
gathering data until the desired sample size was obtained was also applied. This ensured
data were obtained in sufficient quantity to analyze all research questions in this study.
Research Design
This study utilized the steps for descriptive and correlation design methods. The
correlation research allowed the researcher to investigate whether a significant
relationship exists between work ethic and job satisfaction using the instruments.
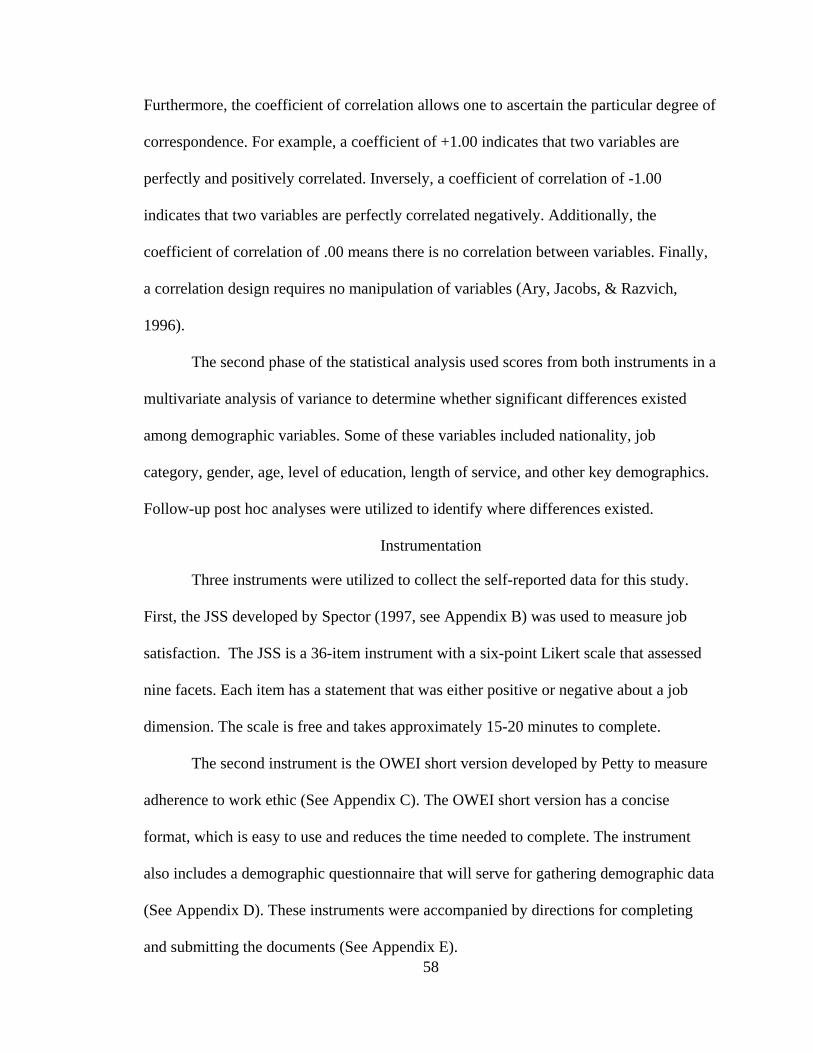
Furthermore, the coefficient of correlation allows one to ascertain the particular degree of
correspondence. For example, a coefficient of +1.00 indicates that two variables are
perfectly and positively correlated. Inversely, a coefficient of correlation of -1.00
indicates that two variables are perfectly correlated negatively. Additionally, the
coefficient of correlation of .00 means there is no correlation between variables. Finally,
a correlation design requires no manipulation of variables (Ary, Jacobs, & Razvich,
1996).
The second phase of the statistical analysis used scores from both instruments in a
multivariate analysis of variance to determine whether significant differences existed
among demographic variables. Some of these variables included nationality, job
category, gender, age, level of education, length of service, and other key demographics.
Follow-up post hoc analyses were utilized to identify where differences existed.
Instrumentation
Three instruments were utilized to collect the self-reported data for this study.
First, the JSS developed by Spector (1997, see Appendix B) was used to measure job
satisfaction. The JSS is a 36-item instrument with a six-point Likert scale that assessed
nine facets. Each item has a statement that was either positive or negative about a job
dimension. The scale is free and takes approximately 15-20 minutes to complete.
58
The second instrument is the OWEI short version developed by Petty to measure
adherence to work ethic (See Appendix C). The OWEI short version has a concise
format, which is easy to use and reduces the time needed to complete. The instrument
also includes a demographic questionnaire that will serve for gathering demographic data
(See Appendix D). These instruments were accompanied by directions for completing
and submitting the documents (See Appendix E).
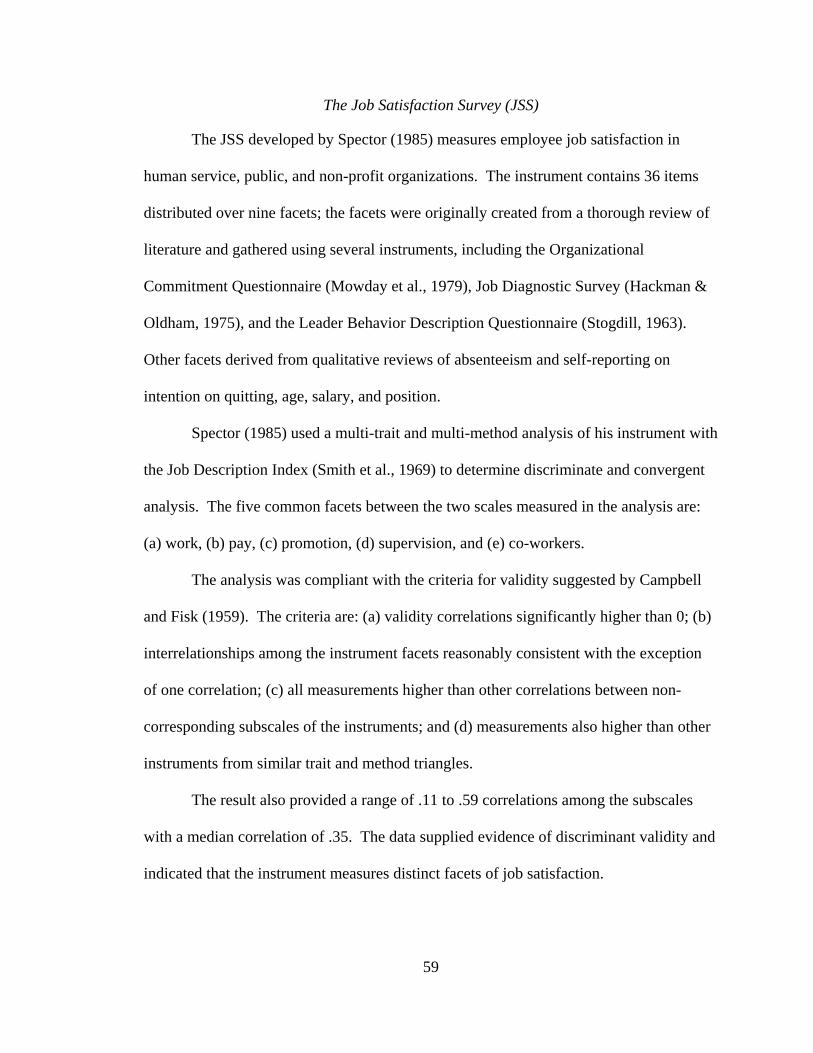
The Job Satisfaction Survey (JSS)
The JSS developed by Spector (1985) measures employee job satisfaction in
human service, public, and non-profit organizations. The instrument contains 36 items
distributed over nine facets; the facets were originally created from a thorough review of
literature and gathered using several instruments, including the Organizational
Commitment Questionnaire (Mowday et al., 1979), Job Diagnostic Survey (Hackman &
Oldham, 1975), and the Leader Behavior Description Questionnaire (Stogdill, 1963).
Other facets derived from qualitative reviews of absenteeism and self-reporting on
intention on quitting, age, salary, and position.
Spector (1985) used a multi-trait and multi-method analysis of his instrument with
the Job Description Index (Smith et al., 1969) to determine discriminate and convergent
analysis. The five common facets between the two scales measured in the analysis are:
(a) work, (b) pay, (c) promotion, (d) supervision, and (e) co-workers.
The analysis was compliant with the criteria for validity suggested by Campbell
and Fisk (1959). The criteria are: (a) validity correlations significantly higher than 0; (b)
interrelationships among the instrument facets reasonably consistent with the exception
of one correlation; (c) all measurements higher than other correlations between non-
corresponding subscales of the instruments; and (d) measurements also higher than other
instruments from similar trait and method triangles.
The result also provided a range of .11 to .59 correlations among the subscales
with a median correlation of .35. The data supplied evidence of discriminant validity and
indicated that the instrument measures distinct facets of job satisfaction.
59
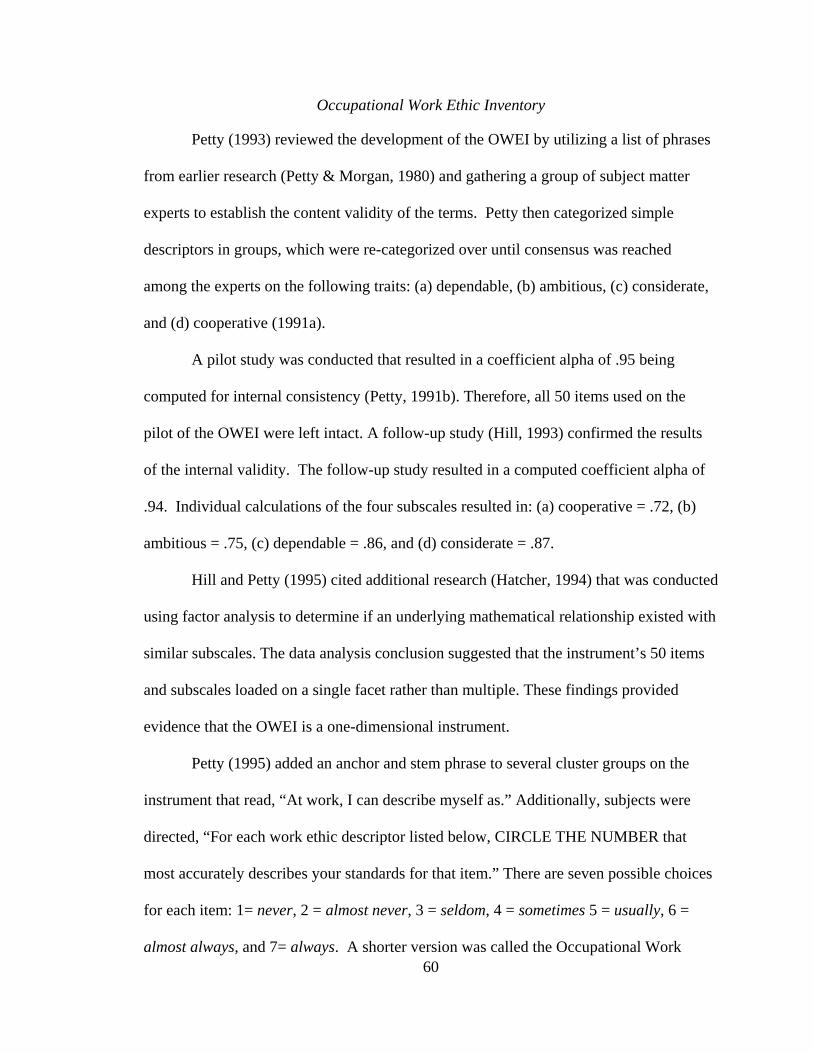
Occupational Work Ethic Inventory
Petty (1993) reviewed the development of the OWEI by utilizing a list of phrases
from earlier research (Petty & Morgan, 1980) and gathering a group of subject matter
experts to establish the content validity of the terms. Petty then categorized simple
descriptors in groups, which were re-categorized over until consensus was reached
among the experts on the following traits: (a) dependable, (b) ambitious, (c) considerate,
and (d) cooperative (1991a).
A pilot study was conducted that resulted in a coefficient alpha of .95 being
computed for internal consistency (Petty, 1991b). Therefore, all 50 items used on the
pilot of the OWEI were left intact. A follow-up study (Hill, 1993) confirmed the results
of the internal validity. The follow-up study resulted in a computed coefficient alpha of
.94. Individual calculations of the four subscales resulted in: (a) cooperative = .72, (b)
ambitious = .75, (c) dependable = .86, and (d) considerate = .87.
60
Hill and Petty (1995) cited additional research (Hatcher, 1994) that was conducted
using factor analysis to determine if an underlying mathematical relationship existed with
similar subscales. The data analysis conclusion suggested that the instrument’s 50 items
and subscales loaded on a single facet rather than multiple. These findings provided
evidence that the OWEI is a one-dimensional instrument.
Petty (1995) added an anchor and stem phrase to several cluster groups on the
instrument that read, “At work, I can describe myself as.” Additionally, subjects were
directed, “For each work ethic descriptor listed below, CIRCLE THE NUMBER that
most accurately describes your standards for that item.” There are seven possible choices
for each item: 1= never, 2 = almost never, 3 = seldom, 4 = sometimes 5 = usually, 6 =
almost always, and 7= always. A shorter version was called the Occupational Work
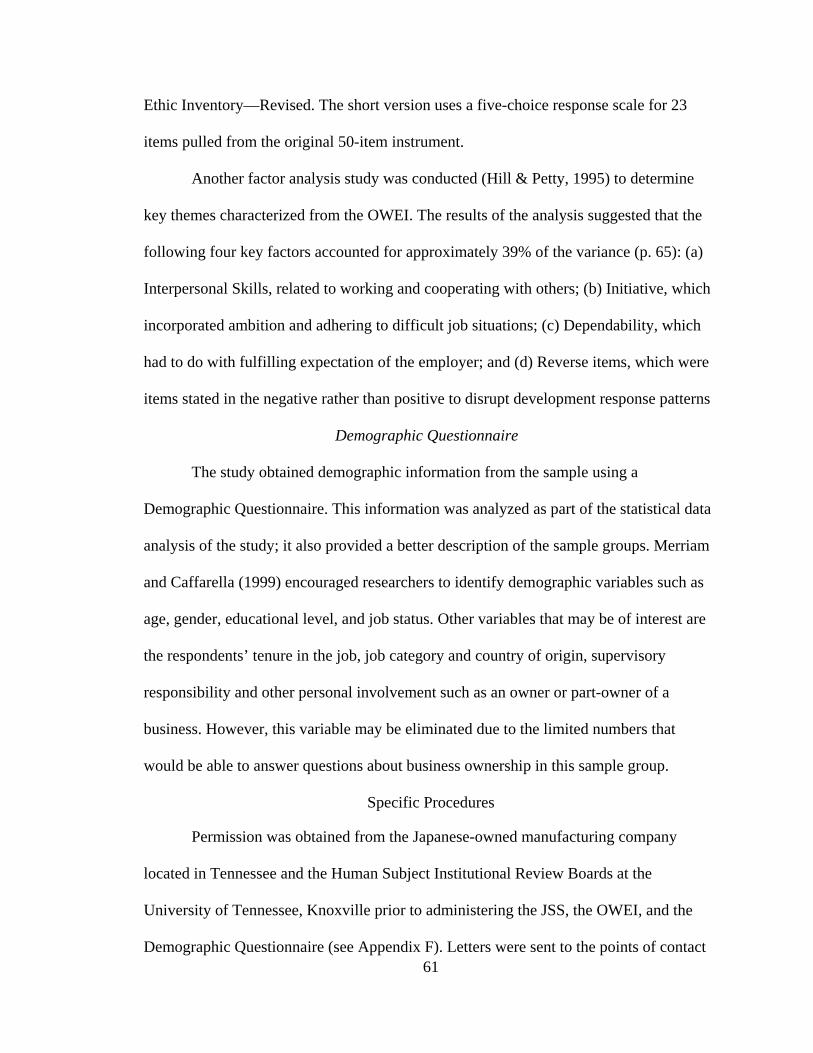
Ethic Inventory—Revised. The short version uses a five-choice response scale for 23
items pulled from the original 50-item instrument.
Another factor analysis study was conducted (Hill & Petty, 1995) to determine
key themes characterized from the OWEI. The results of the analysis suggested that the
following four key factors accounted for approximately 39% of the variance (p. 65): (a)
Interpersonal Skills, related to working and cooperating with others; (b) Initiative, which
incorporated ambition and adhering to difficult job situations; (c) Dependability, which
had to do with fulfilling expectation of the employer; and (d) Reverse items, which were
items stated in the negative rather than positive to disrupt development response patterns
Demographic Questionnaire
The study obtained demographic information from the sample using a
Demographic Questionnaire. This information was analyzed as part of the statistical data
analysis of the study; it also provided a better description of the sample groups. Merriam
and Caffarella (1999) encouraged researchers to identify demographic variables such as
age, gender, educational level, and job status. Other variables that may be of interest are
the respondents’ tenure in the job, job category and country of origin, supervisory
responsibility and other personal involvement such as an owner or part-owner of a
business. However, this variable may be eliminated due to the limited numbers that
would be able to answer questions about business ownership in this sample group.
Specific Procedures
Permission was obtained from the Japanese-owned manufacturing company
61
located in Tennessee and the Human Subject Institutional Review Boards at the
University of Tennessee, Knoxville prior to administering the JSS, the OWEI, and the
Demographic Questionnaire (see Appendix F). Letters were sent to the points of contact
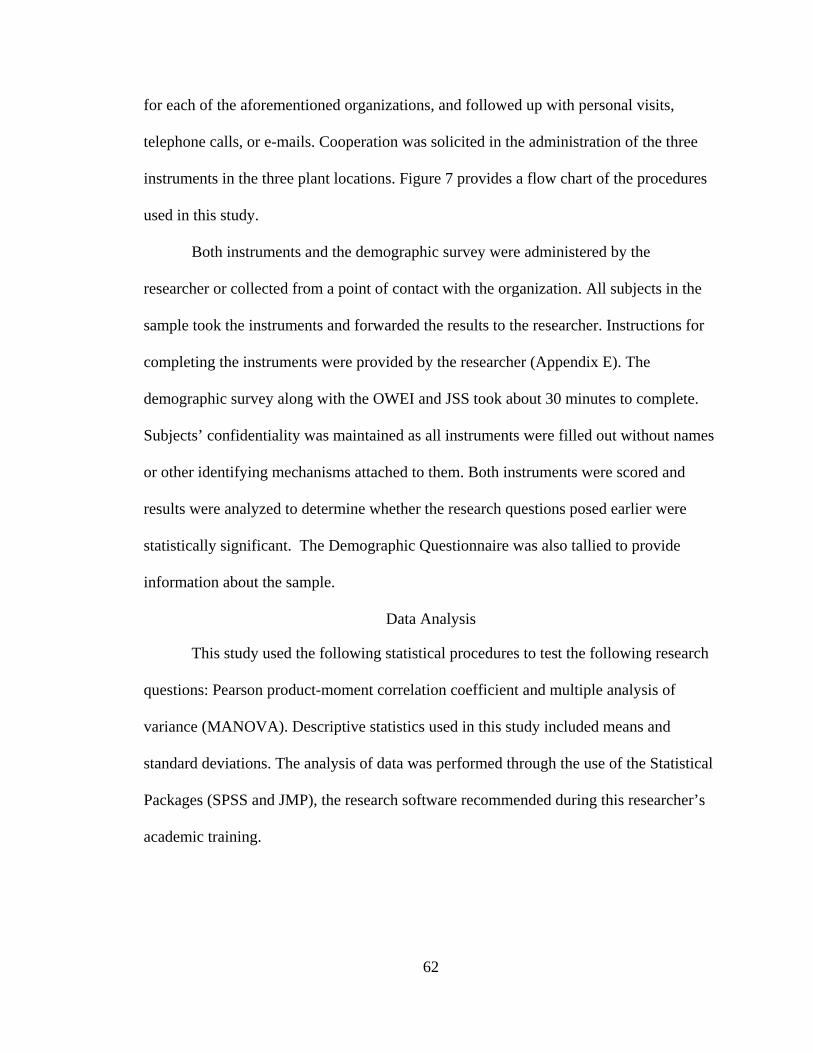
for each of the aforementioned organizations, and followed up with personal visits,
telephone calls, or e-mails. Cooperation was solicited in the administration of the three
instruments in the three plant locations. Figure 7 provides a flow chart of the procedures
used in this study.
Both instruments and the demographic survey were administered by the
researcher or collected from a point of contact with the organization. All subjects in the
sample took the instruments and forwarded the results to the researcher. Instructions for
completing the instruments were provided by the researcher (Appendix E). The
demographic survey along with the OWEI and JSS took about 30 minutes to complete.
Subjects’ confidentiality was maintained as all instruments were filled out without names
or other identifying mechanisms attached to them. Both instruments were scored and
results were analyzed to determine whether the research questions posed earlier were
statistically significant. The Demographic Questionnaire was also tallied to provide
information about the sample.
Data Analysis
This study used the following statistical procedures to test the following research
questions: Pearson product-moment correlation coefficient and multiple analysis of
variance (MANOVA). Descriptive statistics used in this study included means and
standard deviations. The analysis of data was performed through the use of the Statistical
Packages (SPSS and JMP), the research software recommended during this researcher’s
academic training.
62
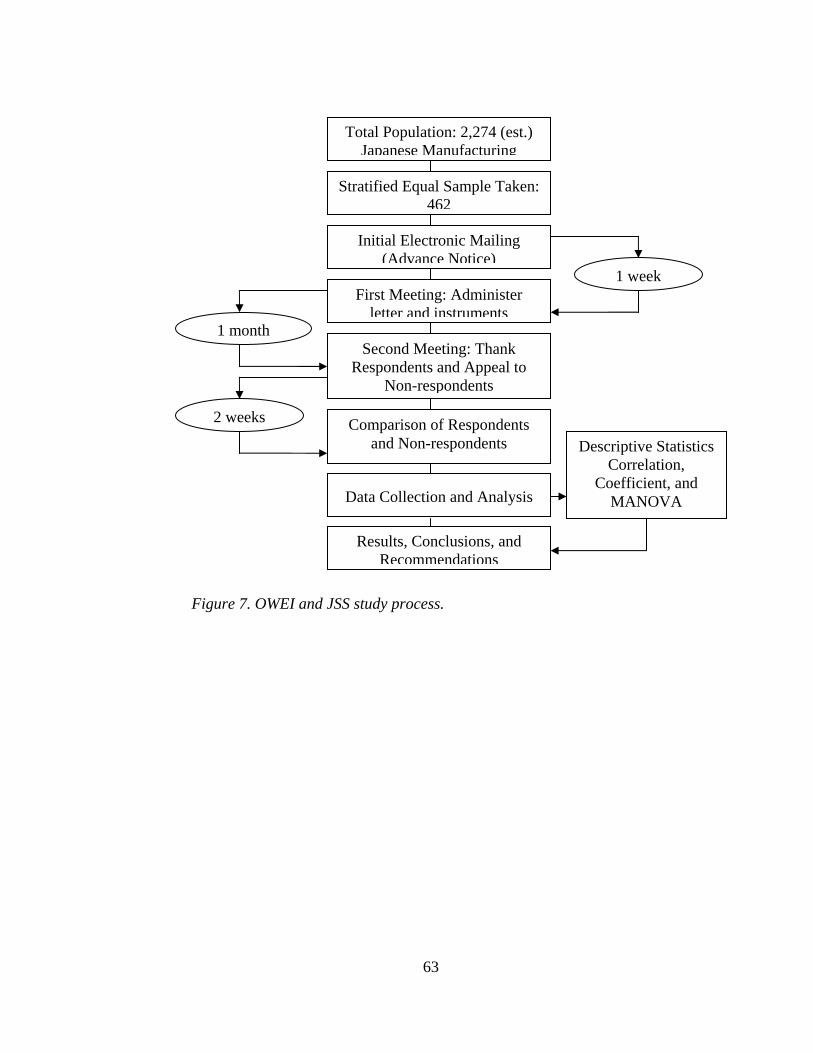
Total Population: 2,274 (est.) Japanese Manufacturing
Stratified Equal Sample Taken: 462
Initial Electronic Mailing (Advance Notice)
First Meeting: Administer letter and instruments
Second Meeting: Thank Respondents and Appeal to
Non-respondents
Comparison of Respondents and Non-respondents
1 week
1 month
2 weeks
Descriptive Statistics Correlation,
Coefficient, and MANOVA Data Collection and Analysis
Results, Conclusions, and Recommendations
Figure 7. OWEI and JSS study process.
63
1. Is there a significant relationship between the ratings measured using the
OWEI and the JSS among individuals working in a Japanese-owned manufacturing company? This will be determined by using a Pearson correlation coefficient and a scatter diagram
2. Can relationships be drawn from ratings of the OWEI and the demographic
survey conducted in the sample group? This question will be answered using inferential statistics. If the F test is determined to be significant, a follow-up calculation using the Tukey’s multiple comparison test will be performed.
3. Can relationships be drawn from rating of the JSS and the demographic
survey conducted in the sample group? This question will utilize the same techniques used to analyze Question 2.
4. What significant differences exist between exempt and non-exempt employees
working in a Japanese-owned manufacturing company regarding levels of job satisfaction as measured by the JSS? Descriptive and Inferential statistics to test for significance will be used as well as Post Hoc multiple comparison tests.
5. What significant differences exist between exempt and non-exempt employees
working in a Japanese-owned manufacturing company regarding work ethic as measured by the OWEI? This question will utilize the same techniques used to analyze Question 4.
Summary of Methodology Chapter
Figure 7 outlines the process of the study. The population for this study, which
fluctuated slightly due to turnover, was 2,276 exempt and non-exempt employees
working at a Japanese-owned manufacturing company in Tennessee. Stratified
convenient samples of equal sizes of these population groups were selected until the
sample size reached a substantive number. Every effort was made to obtain an
appropriate sample size for each sample group in the study. The subjects were asked to
complete the JSS, OWEI, and the Demographic Questionnaire. The actual number of
subjects was 327 after replacements were found for those who had declined to participate,
omitted parts of the surveys, or had not followed directions in marking surveys.
64
The study combined the use of two designs, correlation and descriptive, to
investigate whether a significant relationship exists between job satisfaction and work
ethic. Statistical procedures utilized to test research questions were the correlation
coefficient and other techniques to answer Question 1, an F test and Tukey’s post hoc
multiple comparison to test Questions 2 and 3, and descriptive and inferential statistics
such as Levene’s Test for variability and T-Tests for mean differences to answer
Question 5.
Chapter IV presents an analysis of the data resulting from the scores on the
instruments and questionnaire. Furthermore, the six research questions posed by this
study will be addressed. Conclusions and recommendations can then be asserted based on
the findings and results of the data analysis.
65
CHAPTER IV
FINDINGS AND RESULTS
In this chapter the researcher has presented an analysis of the data for the five
hypotheses concerning the relationship of job satisfaction and work ethic among exempt
and non-exempt employees working at a Japanese-owned manufacturing company. The
study utilized the Job Satisfaction Survey (JSS) and the Occupational Work Ethic
Inventory (OWEI) to measure the two factors. Scores from both instruments compared
exempt and non-exempt workers to reveal any interaction between these instruments.
Additionally, statistical analysis revealed any interaction effect between the instruments
and demographic variables listed in Table 7.
The researcher has also presented the response rate of the survey and the
distribution of the demographic variables. In addition, the analysis of respondents and
non-respondents is reviewed. Results for each of the five research questions are included
in this chapter. Finally, a summary of the analysis is provided to highlight key points.
Response Rate and Participation
66
The data were drawn from 462 surveys sent to exempt and non-exempt employees
working in a Japanese-owned manufacturing company in the southern United States.
These individuals worked in three separate manufacturing plants located in the same
geographical location. Approximately 262 of the 462 surveys sent were returned,
representing a 57% response rate. As a result of subject mortality, the remaining non-
respondents were reduced to 107. From this group of non-respondents the researcher was
able to obtain 66 more responses by e-mail, phone calls, letters, or personal meetings
(See Appendix G). This effort raised the number of responses to 328, which represented
approximately 71% of the 462 surveys sent out by the researcher. This total was one
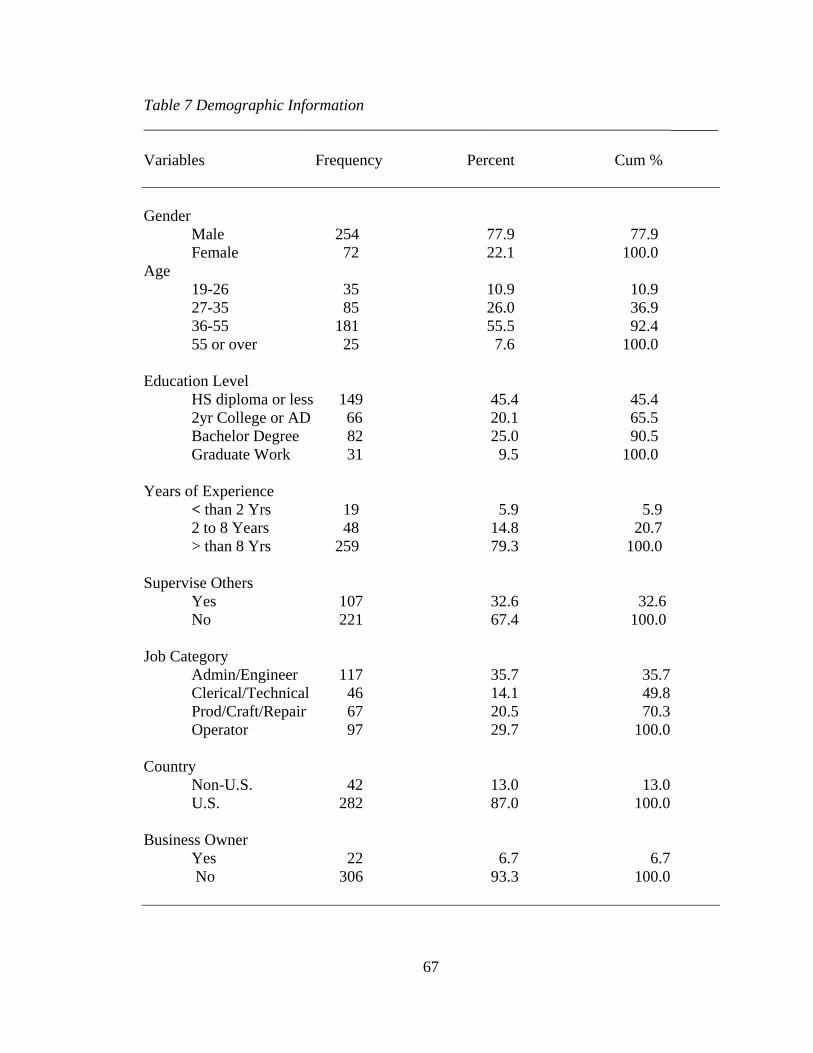
Table 7 Demographic Information __________________________________________________________________ Variables Frequency Percent Cum % Gender
Male 254 77.9 77.9 Female 72 22.1 100.0 Age 19-26 35 10.9 10.9 27-35 85 26.0 36.9 36-55 181 55.5 92.4 55 or over 25 7.6 100.0 Education Level HS diploma or less 149 45.4 45.4 2yr College or AD 66 20.1 65.5 Bachelor Degree 82 25.0 90.5 Graduate Work 31 9.5 100.0 Years of Experience < than 2 Yrs 19 5.9 5.9 2 to 8 Years 48 14.8 20.7 > than 8 Yrs 259 79.3 100.0 Supervise Others Yes 107 32.6 32.6 No 221 67.4 100.0 Job Category Admin/Engineer 117 35.7 35.7 Clerical/Technical 46 14.1 49.8 Prod/Craft/Repair 67 20.5 70.3 Operator 97 29.7 100.0 Country
Non-U.S. 42 13.0 13.0 U.S. 282 87.0 100.0 Business Owner
Yes 22 6.7 6.7 No 306 93.3 100.0
67
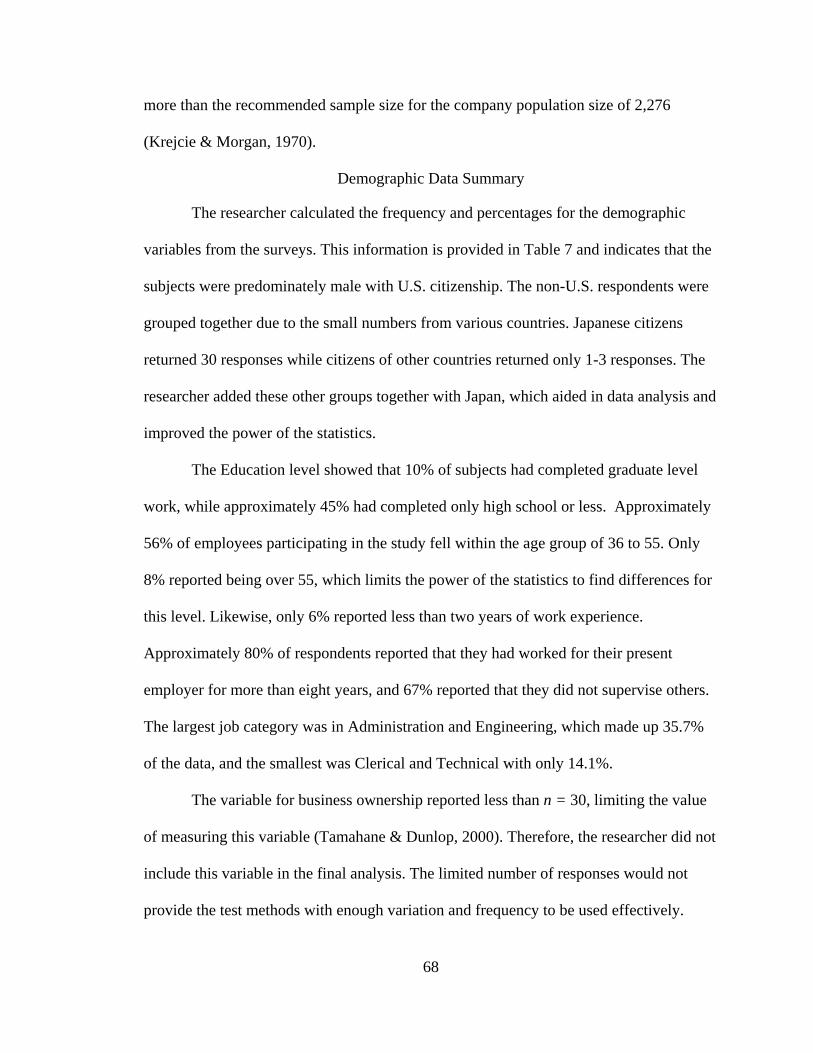
more than the recommended sample size for the company population size of 2,276
(Krejcie & Morgan, 1970).
Demographic Data Summary
The researcher calculated the frequency and percentages for the demographic
variables from the surveys. This information is provided in Table 7 and indicates that the
subjects were predominately male with U.S. citizenship. The non-U.S. respondents were
grouped together due to the small numbers from various countries. Japanese citizens
returned 30 responses while citizens of other countries returned only 1-3 responses. The
researcher added these other groups together with Japan, which aided in data analysis and
improved the power of the statistics.
The Education level showed that 10% of subjects had completed graduate level
work, while approximately 45% had completed only high school or less. Approximately
56% of employees participating in the study fell within the age group of 36 to 55. Only
8% reported being over 55, which limits the power of the statistics to find differences for
this level. Likewise, only 6% reported less than two years of work experience.
Approximately 80% of respondents reported that they had worked for their present
employer for more than eight years, and 67% reported that they did not supervise others.
The largest job category was in Administration and Engineering, which made up 35.7%
of the data, and the smallest was Clerical and Technical with only 14.1%.
The variable for business ownership reported less than n = 30, limiting the value
of measuring this variable (Tamahane & Dunlop, 2000). Therefore, the researcher did not
include this variable in the final analysis. The limited number of responses would not
provide the test methods with enough variation and frequency to be used effectively.
68
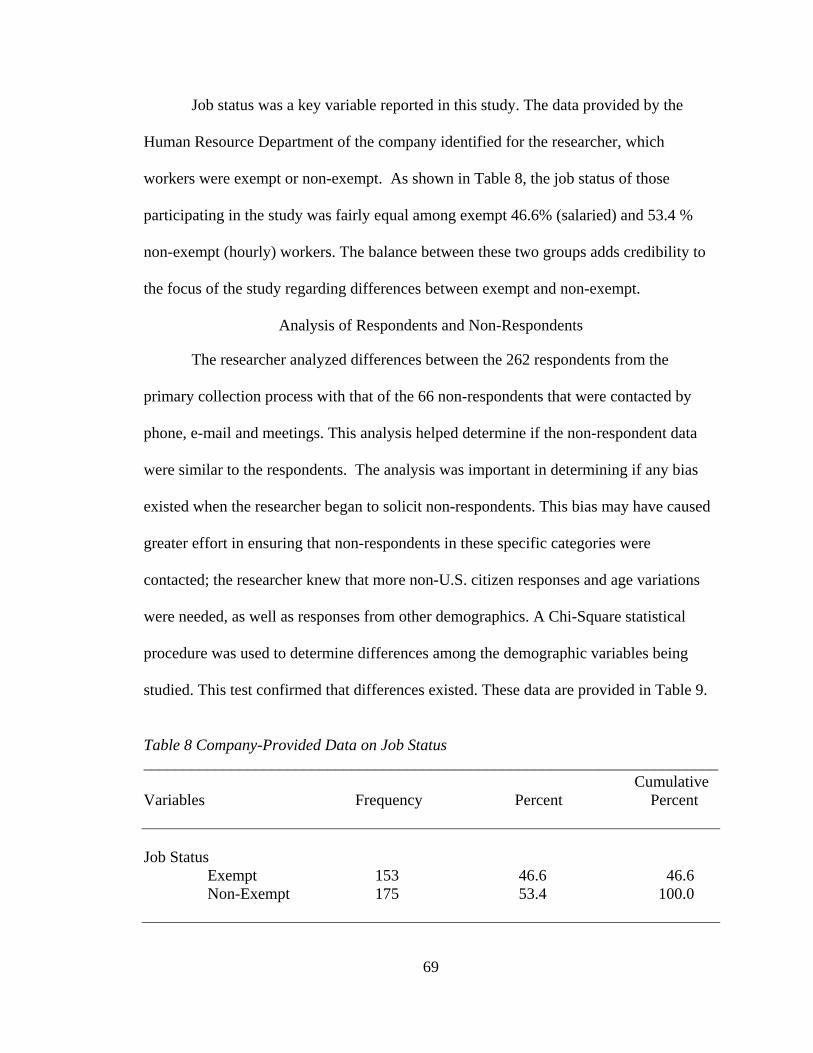
Job status was a key variable reported in this study. The data provided by the
Human Resource Department of the company identified for the researcher, which
workers were exempt or non-exempt. As shown in Table 8, the job status of those
participating in the study was fairly equal among exempt 46.6% (salaried) and 53.4 %
non-exempt (hourly) workers. The balance between these two groups adds credibility to
the focus of the study regarding differences between exempt and non-exempt.
Analysis of Respondents and Non-Respondents
The researcher analyzed differences between the 262 respondents from the
primary collection process with that of the 66 non-respondents that were contacted by
phone, e-mail and meetings. This analysis helped determine if the non-respondent data
were similar to the respondents. The analysis was important in determining if any bias
existed when the researcher began to solicit non-respondents. This bias may have caused
greater effort in ensuring that non-respondents in these specific categories were
contacted; the researcher knew that more non-U.S. citizen responses and age variations
were needed, as well as responses from other demographics. A Chi-Square statistical
procedure was used to determine differences among the demographic variables being
studied. This test confirmed that differences existed. These data are provided in Table 9.
Table 8 Company-Provided Data on Job Status ________________________________________________________________________ Cumulative Variables Frequency Percent Percent Job Status Exempt 153 46.6 46.6 Non-Exempt 175 53.4 100.0
69
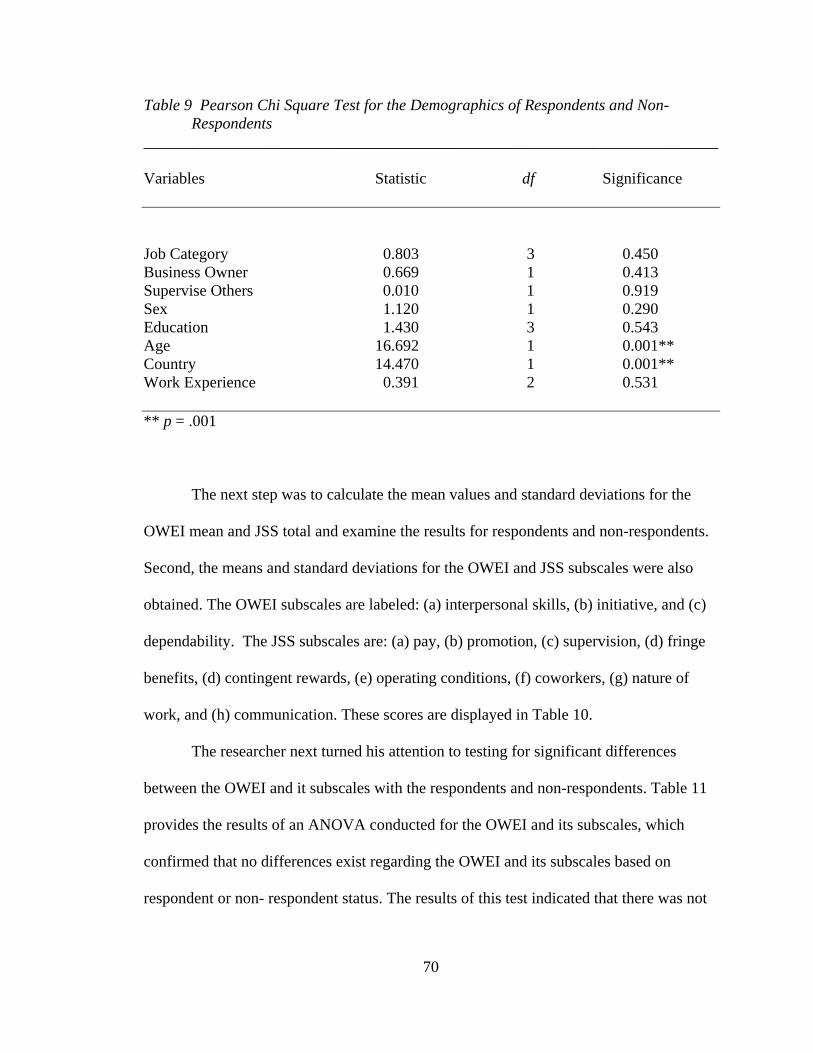
Table 9 Pearson Chi Square Test for the Demographics of Respondents and Non-Respondents
________________________________________________________________________
Variables Statistic df Significance Job Category 0.803 3 0.450 Business Owner 0.669 1 0.413 Supervise Others 0.010 1 0.919 Sex 1.120 1 0.290 Education 1.430 3 0.543 Age 16.692 1 0.001** Country 14.470 1 0.001** Work Experience 0.391 2 0.531 ** p = .001
The next step was to calculate the mean values and standard deviations for the
OWEI mean and JSS total and examine the results for respondents and non-respondents.
Second, the means and standard deviations for the OWEI and JSS subscales were also
obtained. The OWEI subscales are labeled: (a) interpersonal skills, (b) initiative, and (c)
dependability. The JSS subscales are: (a) pay, (b) promotion, (c) supervision, (d) fringe
benefits, (d) contingent rewards, (e) operating conditions, (f) coworkers, (g) nature of
work, and (h) communication. These scores are displayed in Table 10.
The researcher next turned his attention to testing for significant differences
between the OWEI and it subscales with the respondents and non-respondents. Table 11
provides the results of an ANOVA conducted for the OWEI and its subscales, which
confirmed that no differences exist regarding the OWEI and its subscales based on
respondent or non- respondent status. The results of this test indicated that there was not
70
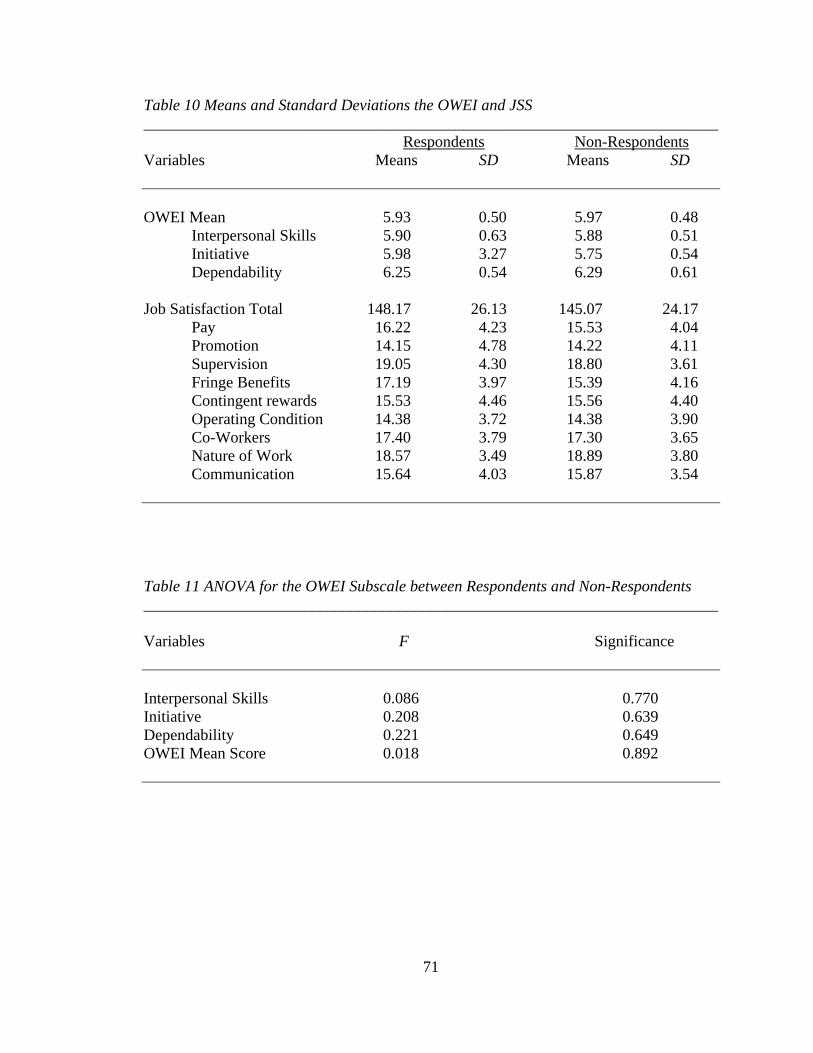
Table 10 Means and Standard Deviations the OWEI and JSS ________________________________________________________________________ Respondents Non-Respondents Variables Means SD Means SD OWEI Mean 5.93 0.50 5.97 0.48 Interpersonal Skills 5.90 0.63 5.88 0.51 Initiative 5.98 3.27 5.75 0.54 Dependability 6.25 0.54 6.29 0.61 Job Satisfaction Total 148.17 26.13 145.07 24.17 Pay 16.22 4.23 15.53 4.04 Promotion 14.15 4.78 14.22 4.11 Supervision 19.05 4.30 18.80 3.61 Fringe Benefits 17.19 3.97 15.39 4.16 Contingent rewards 15.53 4.46 15.56 4.40 Operating Condition 14.38 3.72 14.38 3.90 Co-Workers 17.40 3.79 17.30 3.65 Nature of Work 18.57 3.49 18.89 3.80 Communication 15.64 4.03 15.87 3.54
Table 11 ANOVA for the OWEI Subscale between Respondents and Non-Respondents ________________________________________________________________________
Variables F Significance Interpersonal Skills 0.086 0.770 Initiative 0.208 0.639 Dependability 0.221 0.649 OWEI Mean Score 0.018 0.892
71
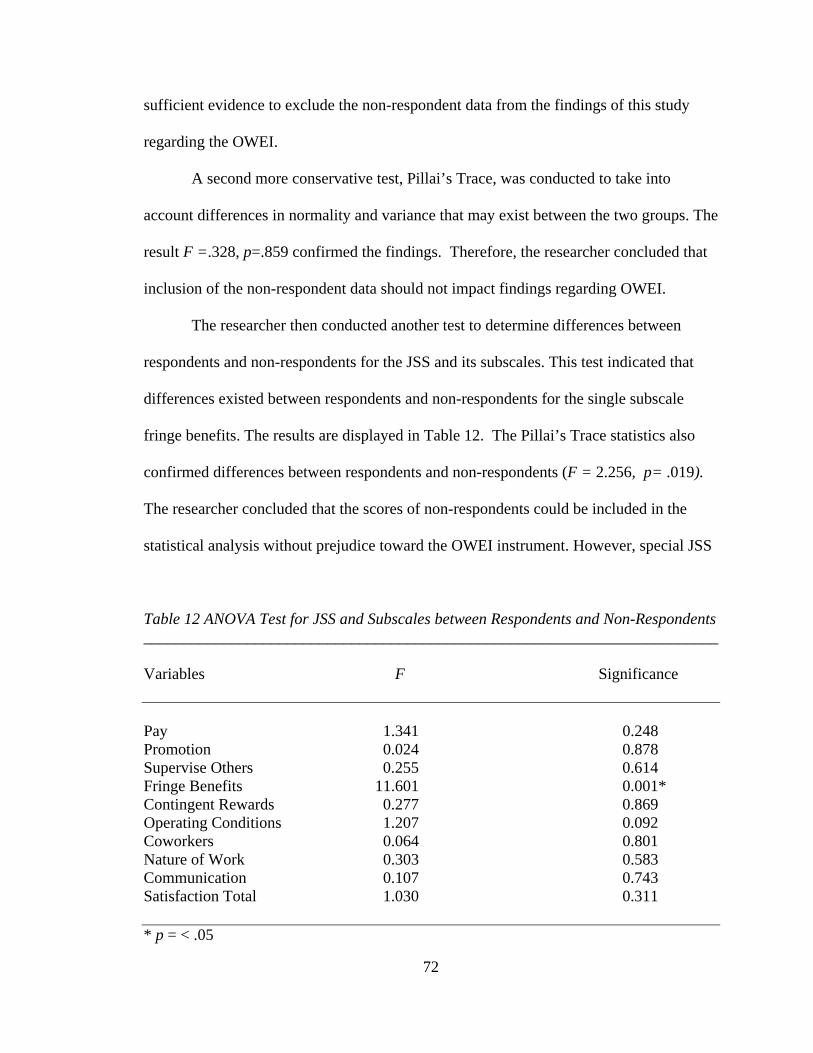
sufficient evidence to exclude the non-respondent data from the findings of this study
regarding the OWEI.
A second more conservative test, Pillai’s Trace, was conducted to take into
account differences in normality and variance that may exist between the two groups. The
result F =.328, p=.859 confirmed the findings. Therefore, the researcher concluded that
inclusion of the non-respondent data should not impact findings regarding OWEI.
The researcher then conducted another test to determine differences between
respondents and non-respondents for the JSS and its subscales. This test indicated that
differences existed between respondents and non-respondents for the single subscale
fringe benefits. The results are displayed in Table 12. The Pillai’s Trace statistics also
confirmed differences between respondents and non-respondents (F = 2.256, p= .019).
The researcher concluded that the scores of non-respondents could be included in the
statistical analysis without prejudice toward the OWEI instrument. However, special JSS
Table 12 ANOVA Test for JSS and Subscales between Respondents and Non-Respondents ________________________________________________________________________
Variables F Significance Pay 1.341 0.248 Promotion 0.024 0.878 Supervise Others 0.255 0.614 Fringe Benefits 11.601 0.001* Contingent Rewards 0.277 0.869 Operating Conditions 1.207 0.092 Coworkers 0.064 0.801 Nature of Work 0.303 0.583 Communication 0.107 0.743 Satisfaction Total 1.030 0.311 * p = < .05
72
attention should be given to any conclusions and findings involving the Fringe Benefit
subscale and its effect on the data. The researcher’s effort to ensure representation by
workers from other countries and various age groups may have impacted this Fringe
Benefit subscale. However, due to the relationship of the research to a Japanese-owned
company in the United States, a decision was made to include the non-respondent data.
Therefore, from this point forward, statistical analyses considered cases that included
non-respondents.
Research Questions and Hypotheses
The five hypotheses for this study are identified in Chapter I. The results for each
of the hypotheses will be reported by first stating the research questions associated with
the hypotheses. Second, the results of each analysis will be reported via graphs and tables
or both. Finally, a summary of the analysis will be presented for each question.
The analysis was completed using the SPSS and JMP software. An alpha of less
than (p < .05) was used throughout this study to determine the level of significance for all
pertinent research questions. The data were reviewed with a statistical consultant to
reduce errors in the analysis.
Research Question One
Research Question One asked if there are significant relationships between the
ratings measured using the OWEI and the JSS among individuals working in a Japanese-
owned manufacturing company. Null hypothesis one will be tested to answer this
research question:
Ho1 There is no significant relationship between job satisfaction and work ethic as measured by the JSS and OWEI when used in a Japanese-owned manufacturing plant.
73
This first hypothesis was tested using a Pearson correlation. This option computes
correlation values for all the paired values. The overall scores of the JSS and OWEI and
correlations between subscales were computed.
Figure 8 presents a scatter diagram depicting the relationship between the mean
scores of the OWEI and the total scores of the JSS. The scatter diagram shows a positive
relationship (Gay & Ariasian, 2000, p. 325). The relationship was low, although
significant, (r = .04, p < .001). More analysis was then undertaken.
Table 13 presents correlations that show positive relationships between the mean score of
the OWEI and the total score of the JSS. A correlation coefficient of (.210) existed
between these two instruments in the sample group of 328 employees. Additional
correlations existed between the JSS and all the subscales of the OWEI. Furthermore,
several subscale correlations also existed between the instruments. The largest existed
between the JSS subscale Nature of Work and the OWEI Initiative subscale (.368). The
subscales of Operating Conditions (.229) and Supervision (.183) also indicated
significant correlations with the OWEI mean and its subscales. Contingent Rewards
(.130), Co-workers (.163), and Communication (.143) also correlated with the OWEI.
Analysis indicated that the JSS subscale of Supervision is correlated with OWEI
subscales: Interpersonal Skills (.181), Initiative (.137), and Dependability (.154) The JSS
subscale of Fringe Benefits is correlated with the OWEI subscale of Interpersonal Skills
(.125). The JSS subscale of Contingent Reward correlated with Interpersonal Skills
(.168). The JSS subscale of Operating Conditions correlated with all three of the OWEI
subscales: Interpersonal Skills (.246), Initiative (.181), and Dependability (.157). Nature
of Work correlated with the subscales Interpersonal Skills (.348), Initiative (.368), and
74
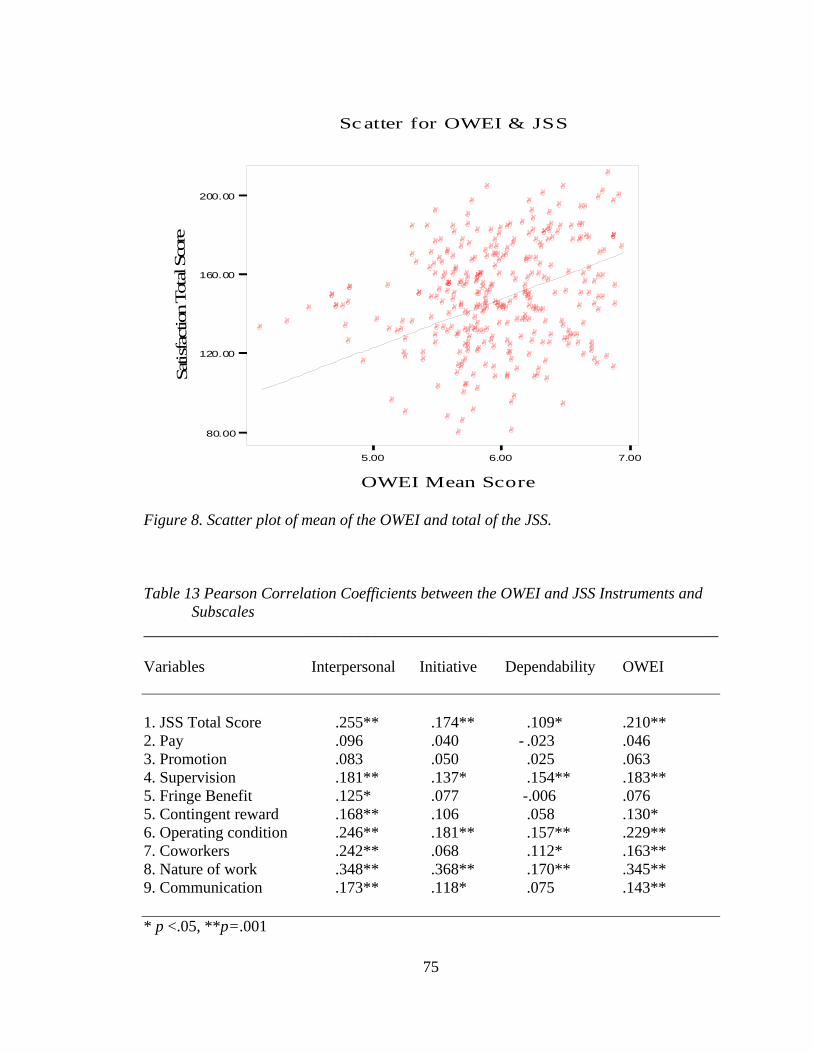
5.00 6.00 7.00
OWEI Mean Score
80.00
120.00
160.00
200.00Sa
tisfa
ctio
n To
tal S
core
Scatter for OWEI & JSS
Figure 8. Scatter plot of mean of the OWEI and total of the JSS. Table 13 Pearson Correlation Coefficients between the OWEI and JSS Instruments and
Subscales ________________________________________________________________________ Variables Interpersonal Initiative Dependability OWEI 1. JSS Total Score .255** .174** .109* .210** 2. Pay .096 .040 - .023 .046 3. Promotion .083 .050 .025 .063 4. Supervision .181** .137* .154** .183** 5. Fringe Benefit .125* .077 -.006 .076 5. Contingent reward .168** .106 .058 .130* 6. Operating condition .246** .181** .157** .229** 7. Coworkers .242** .068 .112* .163** 8. Nature of work .348** .368** .170** .345** 9. Communication .173** .118* .075 .143** * p <.05, **p=.001
75
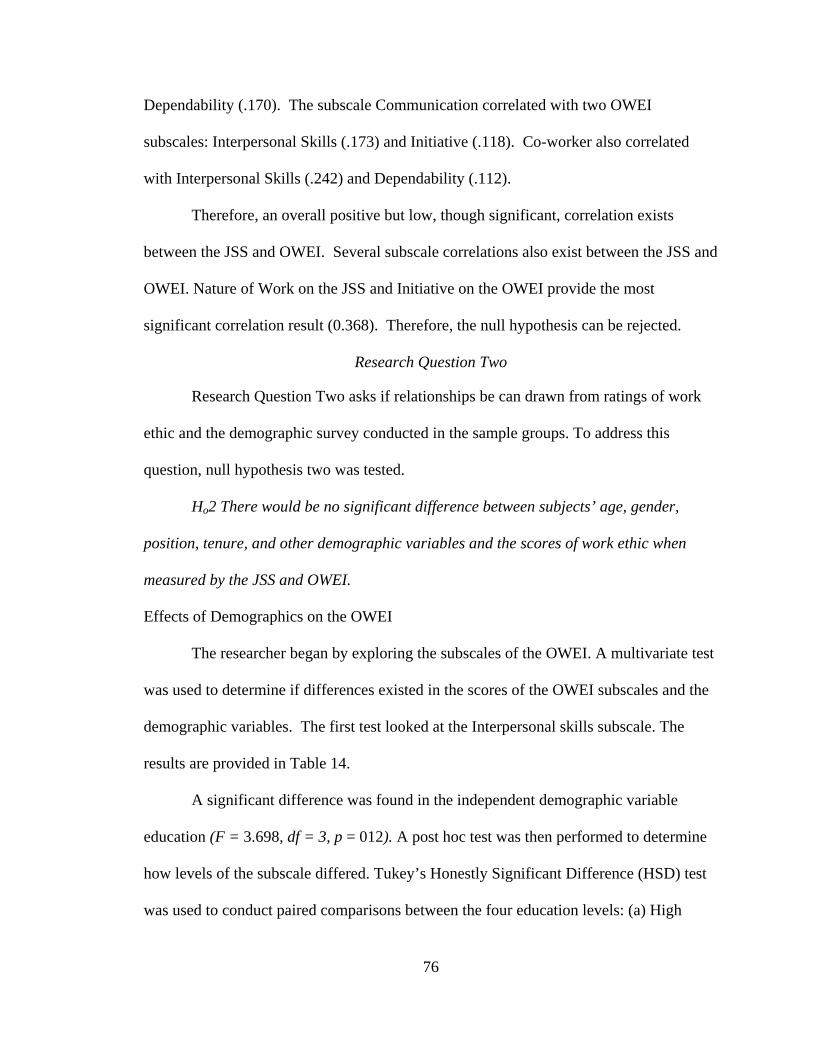
Dependability (.170). The subscale Communication correlated with two OWEI
subscales: Interpersonal Skills (.173) and Initiative (.118). Co-worker also correlated
with Interpersonal Skills (.242) and Dependability (.112).
Therefore, an overall positive but low, though significant, correlation exists
between the JSS and OWEI. Several subscale correlations also exist between the JSS and
OWEI. Nature of Work on the JSS and Initiative on the OWEI provide the most
significant correlation result (0.368). Therefore, the null hypothesis can be rejected.
Research Question Two
Research Question Two asks if relationships be can drawn from ratings of work ethic and the demographic survey conducted in the sample groups. To address this question, null hypothesis two was tested.
Ho2 There would be no significant difference between subjects’ age, gender,
position, tenure, and other demographic variables and the scores of work ethic when
measured by the JSS and OWEI.
Effects of Demographics on the OWEI
The researcher began by exploring the subscales of the OWEI. A multivariate test
was used to determine if differences existed in the scores of the OWEI subscales and the
demographic variables. The first test looked at the Interpersonal skills subscale. The
results are provided in Table 14.
A significant difference was found in the independent demographic variable
education (F = 3.698, df = 3, p = 012). A post hoc test was then performed to determine
how levels of the subscale differed. Tukey’s Honestly Significant Difference (HSD) test
was used to conduct paired comparisons between the four education levels: (a) High
76
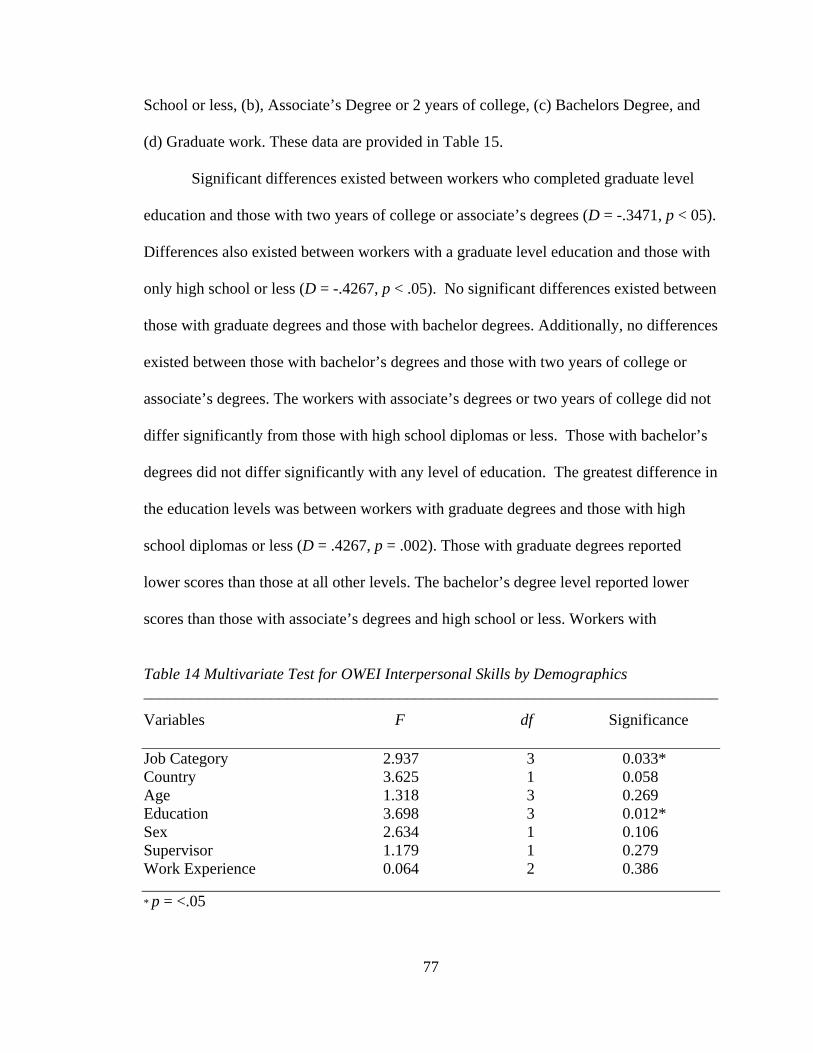
School or less, (b), Associate’s Degree or 2 years of college, (c) Bachelors Degree, and
(d) Graduate work. These data are provided in Table 15.
Significant differences existed between workers who completed graduate level
education and those with two years of college or associate’s degrees (D = -.3471, p < 05).
Differences also existed between workers with a graduate level education and those with
only high school or less (D = -.4267, p < .05). No significant differences existed between
those with graduate degrees and those with bachelor degrees. Additionally, no differences
existed between those with bachelor’s degrees and those with two years of college or
associate’s degrees. The workers with associate’s degrees or two years of college did not
differ significantly from those with high school diplomas or less. Those with bachelor’s
degrees did not differ significantly with any level of education. The greatest difference in
the education levels was between workers with graduate degrees and those with high
school diplomas or less (D = .4267, p = .002). Those with graduate degrees reported
lower scores than those at all other levels. The bachelor’s degree level reported lower
scores than those with associate’s degrees and high school or less. Workers with
Table 14 Multivariate Test for OWEI Interpersonal Skills by Demographics ________________________________________________________________________
Variables F df Significance Job Category 2.937 3 0.033* Country 3.625 1 0.058 Age 1.318 3 0.269 Education 3.698 3 0.012* Sex 2.634 1 0.106 Supervisor 1.179 1 0.279 Work Experience 0.064 2 0.386
* p = <.05
77
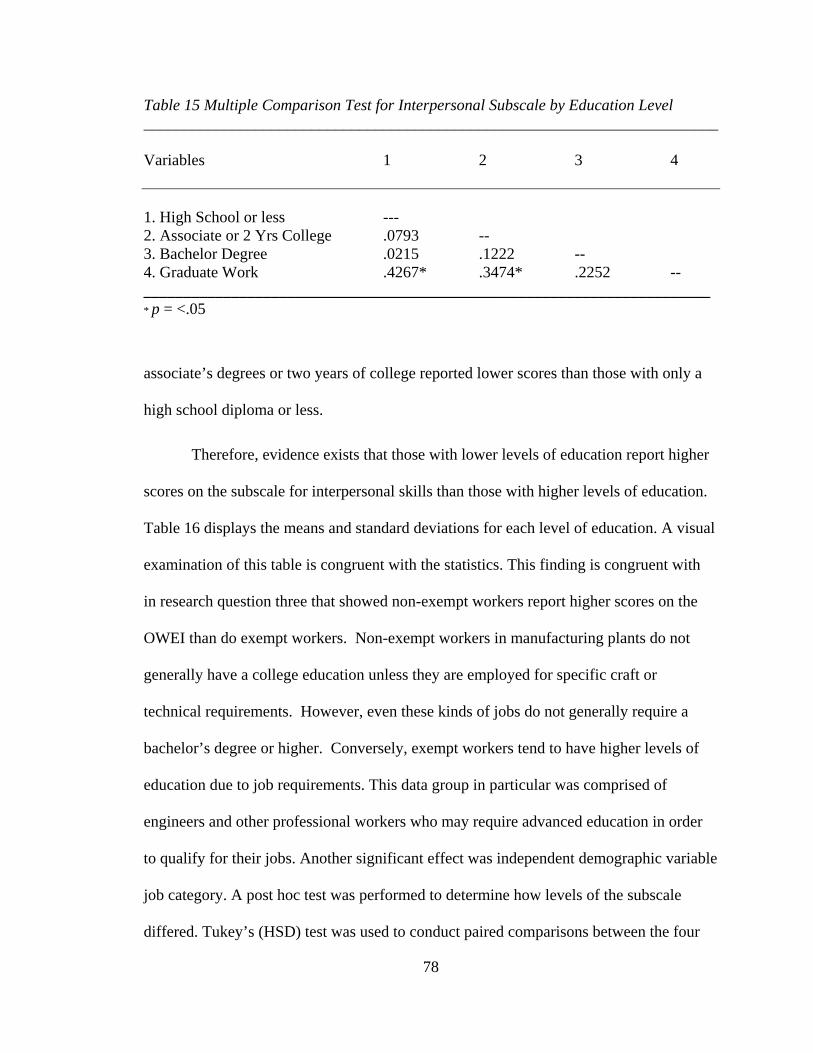
Table 15 Multiple Comparison Test for Interpersonal Subscale by Education Level ________________________________________________________________________ Variables 1 2 3 4 1. High School or less --- 2. Associate or 2 Yrs College .0793 -- 3. Bachelor Degree .0215 .1222 -- 4. Graduate Work .4267* .3474* .2252 -- _______________________________________________________________________ * p = <.05
associate’s degrees or two years of college reported lower scores than those with only a
high school diploma or less.
Therefore, evidence exists that those with lower levels of education report higher
scores on the subscale for interpersonal skills than those with higher levels of education.
Table 16 displays the means and standard deviations for each level of education. A visual
examination of this table is congruent with the statistics. This finding is congruent with
in research question three that showed non-exempt workers report higher scores on the
OWEI than do exempt workers. Non-exempt workers in manufacturing plants do not
generally have a college education unless they are employed for specific craft or
technical requirements. However, even these kinds of jobs do not generally require a
bachelor’s degree or higher. Conversely, exempt workers tend to have higher levels of
education due to job requirements. This data group in particular was comprised of
engineers and other professional workers who may require advanced education in order
to qualify for their jobs. Another significant effect was independent demographic variable
job category. A post hoc test was performed to determine how levels of the subscale
differed. Tukey’s (HSD) test was used to conduct paired comparisons between the four
78
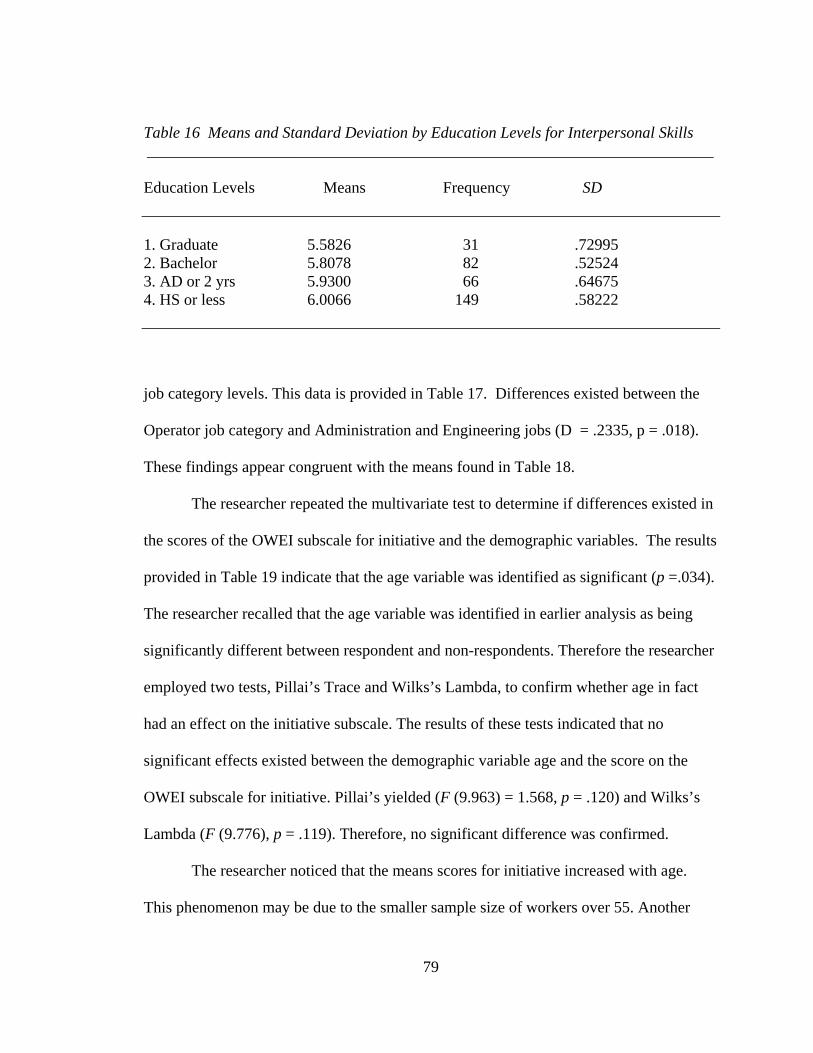
Table 16 Means and Standard Deviation by Education Levels for Interpersonal Skills _______________________________________________________________________ Education Levels Means Frequency SD 1. Graduate 5.5826 31 .72995 2. Bachelor 5.8078 82 .52524 3. AD or 2 yrs 5.9300 66 .64675 4. HS or less 6.0066 149 .58222
job category levels. This data is provided in Table 17. Differences existed between the
Operator job category and Administration and Engineering jobs (D = .2335, p = .018).
These findings appear congruent with the means found in Table 18.
The researcher repeated the multivariate test to determine if differences existed in
the scores of the OWEI subscale for initiative and the demographic variables. The results
provided in Table 19 indicate that the age variable was identified as significant (p =.034).
The researcher recalled that the age variable was identified in earlier analysis as being
significantly different between respondent and non-respondents. Therefore the researcher
employed two tests, Pillai’s Trace and Wilks’s Lambda, to confirm whether age in fact
had an effect on the initiative subscale. The results of these tests indicated that no
significant effects existed between the demographic variable age and the score on the
OWEI subscale for initiative. Pillai’s yielded (F (9.963) = 1.568, p = .120) and Wilks’s
Lambda (F (9.776), p = .119). Therefore, no significant difference was confirmed.
The researcher noticed that the means scores for initiative increased with age.
This phenomenon may be due to the smaller sample size of workers over 55. Another
79
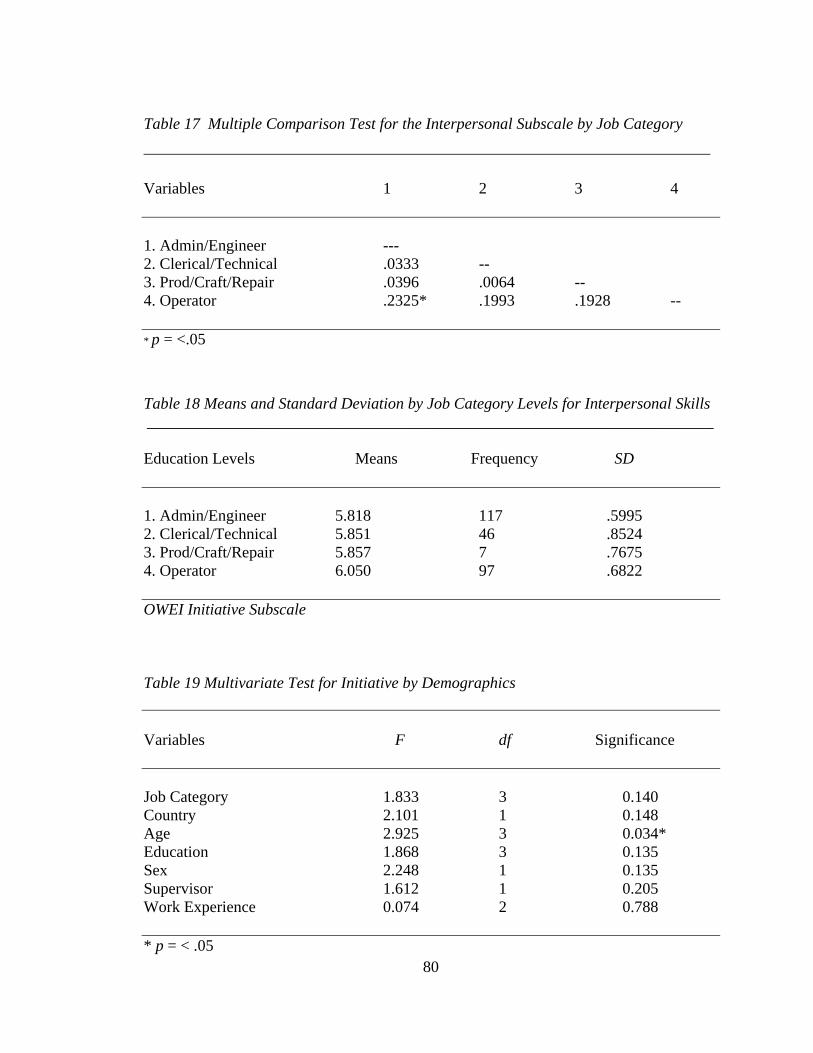
Table 17 Multiple Comparison Test for the Interpersonal Subscale by Job Category _______________________________________________________________________
Variables 1 2 3 4 1. Admin/Engineer --- 2. Clerical/Technical .0333 -- 3. Prod/Craft/Repair .0396 .0064 -- 4. Operator .2325* .1993 .1928 -- * p = <.05
Table 18 Means and Standard Deviation by Job Category Levels for Interpersonal Skills _______________________________________________________________________ Education Levels Means Frequency SD 1. Admin/Engineer 5.818 117 .5995 2. Clerical/Technical 5.851 46 .8524 3. Prod/Craft/Repair 5.857 7 .7675 4. Operator 6.050 97 .6822 OWEI Initiative Subscale
Table 19 Multivariate Test for Initiative by Demographics Variables F df Significance Job Category 1.833 3 0.140 Country 2.101 1 0.148 Age 2.925 3 0.034* Education 1.868 3 0.135 Sex 2.248 1 0.135 Supervisor 1.612 1 0.205 Work Experience 0.074 2 0.788 * p = < .05
80
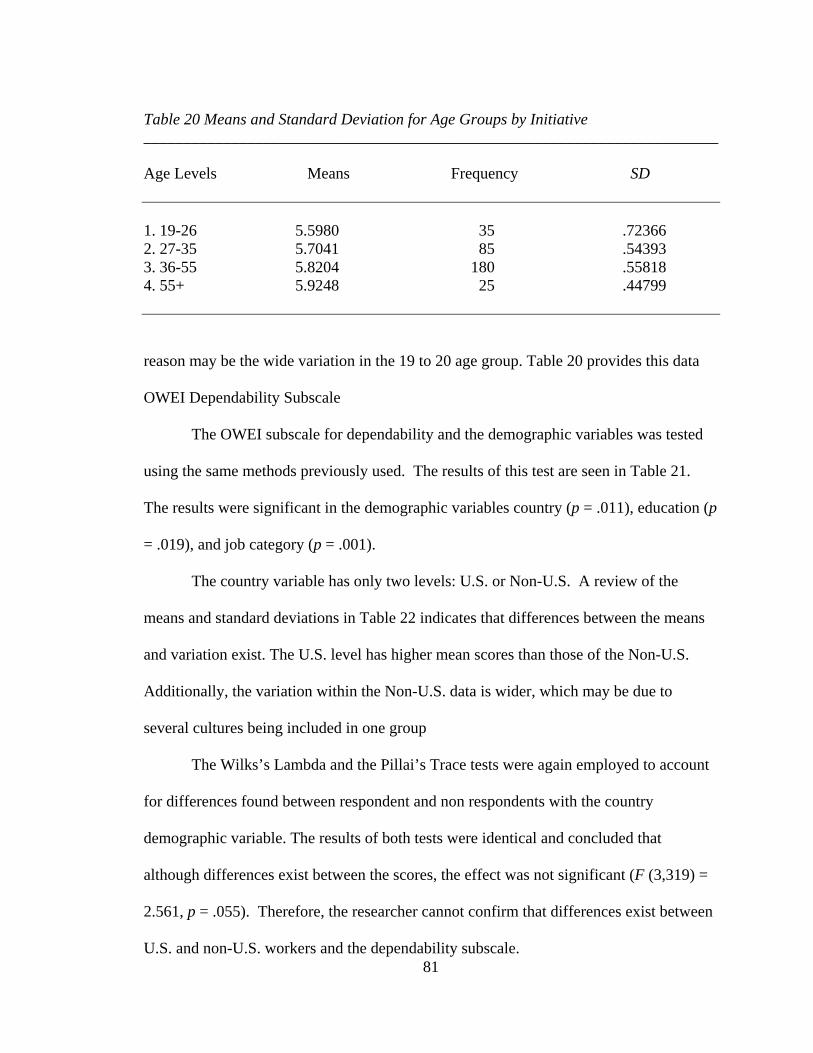
Table 20 Means and Standard Deviation for Age Groups by Initiative ________________________________________________________________________ Age Levels Means Frequency SD 1. 19-26 5.5980 35 .72366 2. 27-35 5.7041 85 .54393 3. 36-55 5.8204 180 .55818 4. 55+ 5.9248 25 .44799
reason may be the wide variation in the 19 to 20 age group. Table 20 provides this data
OWEI Dependability Subscale
The OWEI subscale for dependability and the demographic variables was tested
using the same methods previously used. The results of this test are seen in Table 21.
The results were significant in the demographic variables country (p = .011), education (p
= .019), and job category (p = .001).
The country variable has only two levels: U.S. or Non-U.S. A review of the
means and standard deviations in Table 22 indicates that differences between the means
and variation exist. The U.S. level has higher mean scores than those of the Non-U.S.
Additionally, the variation within the Non-U.S. data is wider, which may be due to
several cultures being included in one group
81
The Wilks’s Lambda and the Pillai’s Trace tests were again employed to account
for differences found between respondent and non respondents with the country
demographic variable. The results of both tests were identical and concluded that
although differences exist between the scores, the effect was not significant (F (3,319) =
2.561, p = .055). Therefore, the researcher cannot confirm that differences exist between
U.S. and non-U.S. workers and the dependability subscale.
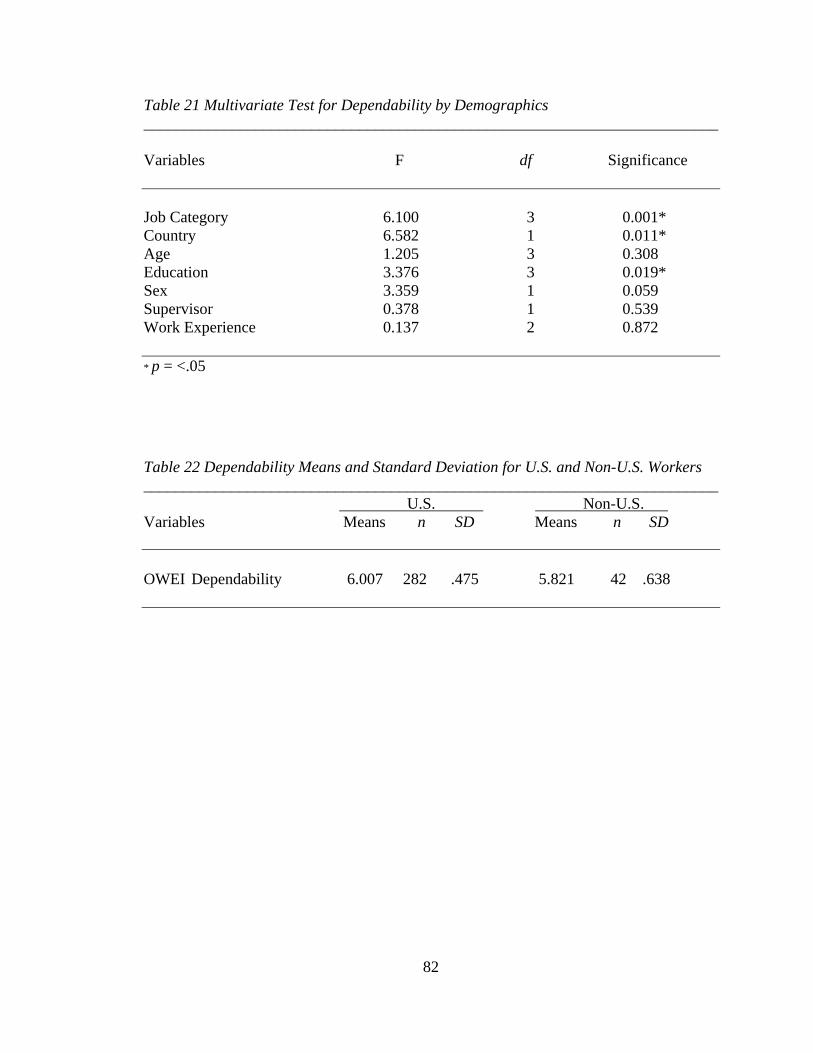
Table 21 Multivariate Test for Dependability by Demographics ________________________________________________________________________
Variables F df Significance Job Category 6.100 3 0.001* Country 6.582 1 0.011* Age 1.205 3 0.308 Education 3.376 3 0.019* Sex 3.359 1 0.059 Supervisor 0.378 1 0.539 Work Experience 0.137 2 0.872 * p = <.05
Table 22 Dependability Means and Standard Deviation for U.S. and Non-U.S. Workers ________________________________________________________________________ U.S. Non-U.S. . Variables Means n SD Means n SD OWEI Dependability 6.007 282 .475 5.821 42 .638
82
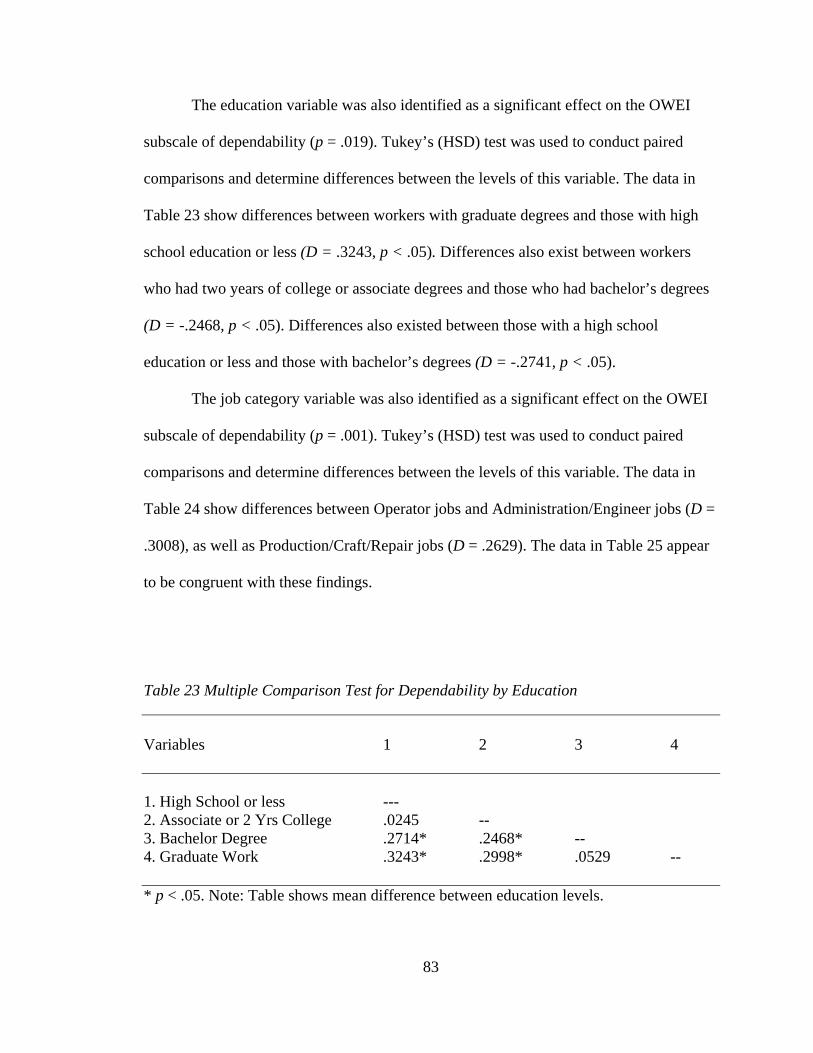
The education variable was also identified as a significant effect on the OWEI
subscale of dependability (p = .019). Tukey’s (HSD) test was used to conduct paired
comparisons and determine differences between the levels of this variable. The data in
Table 23 show differences between workers with graduate degrees and those with high
school education or less (D = .3243, p < .05). Differences also exist between workers
who had two years of college or associate degrees and those who had bachelor’s degrees
(D = -.2468, p < .05). Differences also existed between those with a high school
education or less and those with bachelor’s degrees (D = -.2741, p < .05).
The job category variable was also identified as a significant effect on the OWEI
subscale of dependability (p = .001). Tukey’s (HSD) test was used to conduct paired
comparisons and determine differences between the levels of this variable. The data in
Table 24 show differences between Operator jobs and Administration/Engineer jobs (D =
.3008), as well as Production/Craft/Repair jobs (D = .2629). The data in Table 25 appear
to be congruent with these findings.
Table 23 Multiple Comparison Test for Dependability by Education Variables 1 2 3 4 1. High School or less --- 2. Associate or 2 Yrs College .0245 -- 3. Bachelor Degree .2714* .2468* -- 4. Graduate Work .3243* .2998* .0529 -- * p < .05. Note: Table shows mean difference between education levels.
83
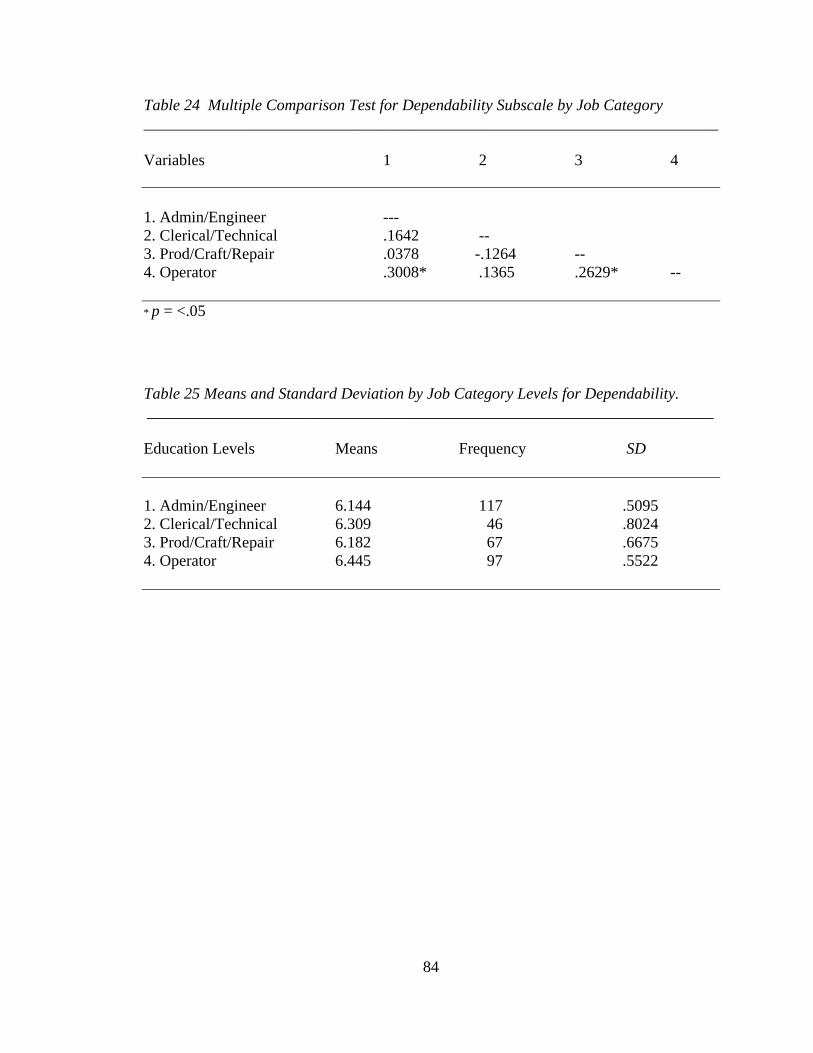
Table 24 Multiple Comparison Test for Dependability Subscale by Job Category ________________________________________________________________________ Variables 1 2 3 4 1. Admin/Engineer --- 2. Clerical/Technical .1642 -- 3. Prod/Craft/Repair .0378 -.1264 -- 4. Operator .3008* .1365 .2629* -- * p = <.05
Table 25 Means and Standard Deviation by Job Category Levels for Dependability. _______________________________________________________________________ Education Levels Means Frequency SD 1. Admin/Engineer 6.144 117 .5095 2. Clerical/Technical 6.309 46 .8024 3. Prod/Craft/Repair 6.182 67 .6675 4. Operator 6.445 97 .5522
84
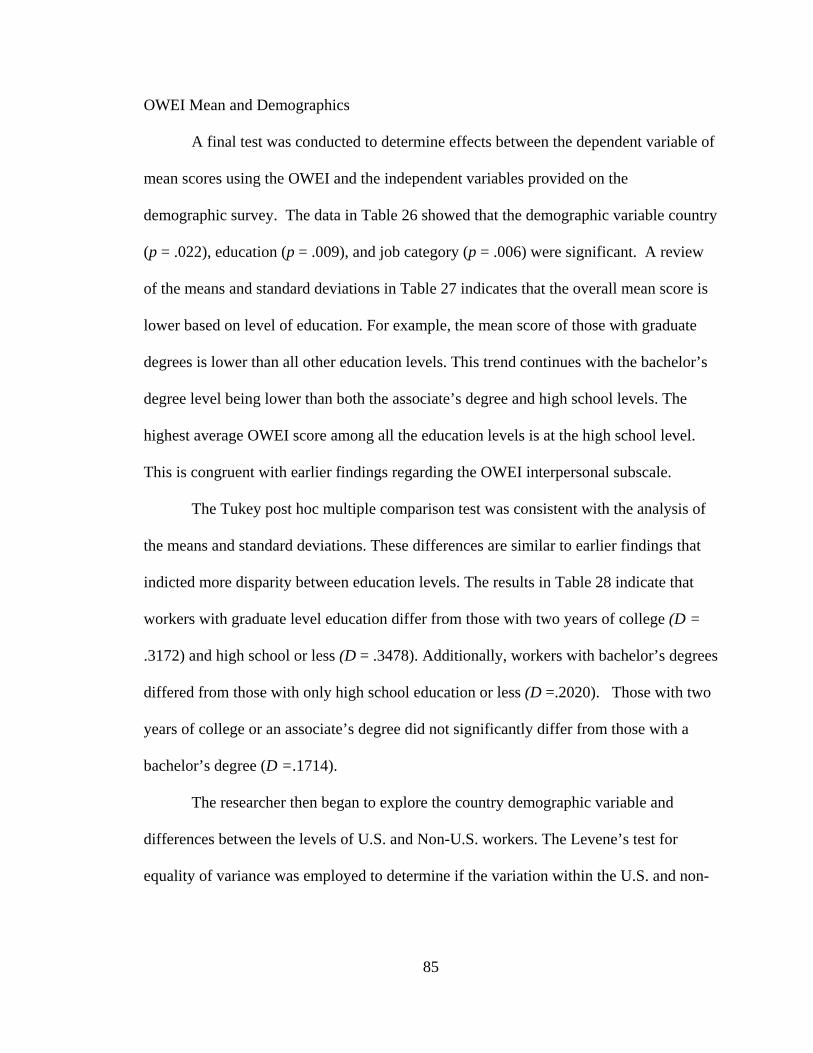
OWEI Mean and Demographics
A final test was conducted to determine effects between the dependent variable of
mean scores using the OWEI and the independent variables provided on the
demographic survey. The data in Table 26 showed that the demographic variable country
(p = .022), education (p = .009), and job category (p = .006) were significant. A review
of the means and standard deviations in Table 27 indicates that the overall mean score is
lower based on level of education. For example, the mean score of those with graduate
degrees is lower than all other education levels. This trend continues with the bachelor’s
degree level being lower than both the associate’s degree and high school levels. The
highest average OWEI score among all the education levels is at the high school level.
This is congruent with earlier findings regarding the OWEI interpersonal subscale.
The Tukey post hoc multiple comparison test was consistent with the analysis of
the means and standard deviations. These differences are similar to earlier findings that
indicted more disparity between education levels. The results in Table 28 indicate that
workers with graduate level education differ from those with two years of college (D =
.3172) and high school or less (D = .3478). Additionally, workers with bachelor’s degrees
differed from those with only high school education or less (D =.2020). Those with two
years of college or an associate’s degree did not significantly differ from those with a
bachelor’s degree (D =.1714).
The researcher then began to explore the country demographic variable and
differences between the levels of U.S. and Non-U.S. workers. The Levene’s test for
equality of variance was employed to determine if the variation within the U.S. and non-
85
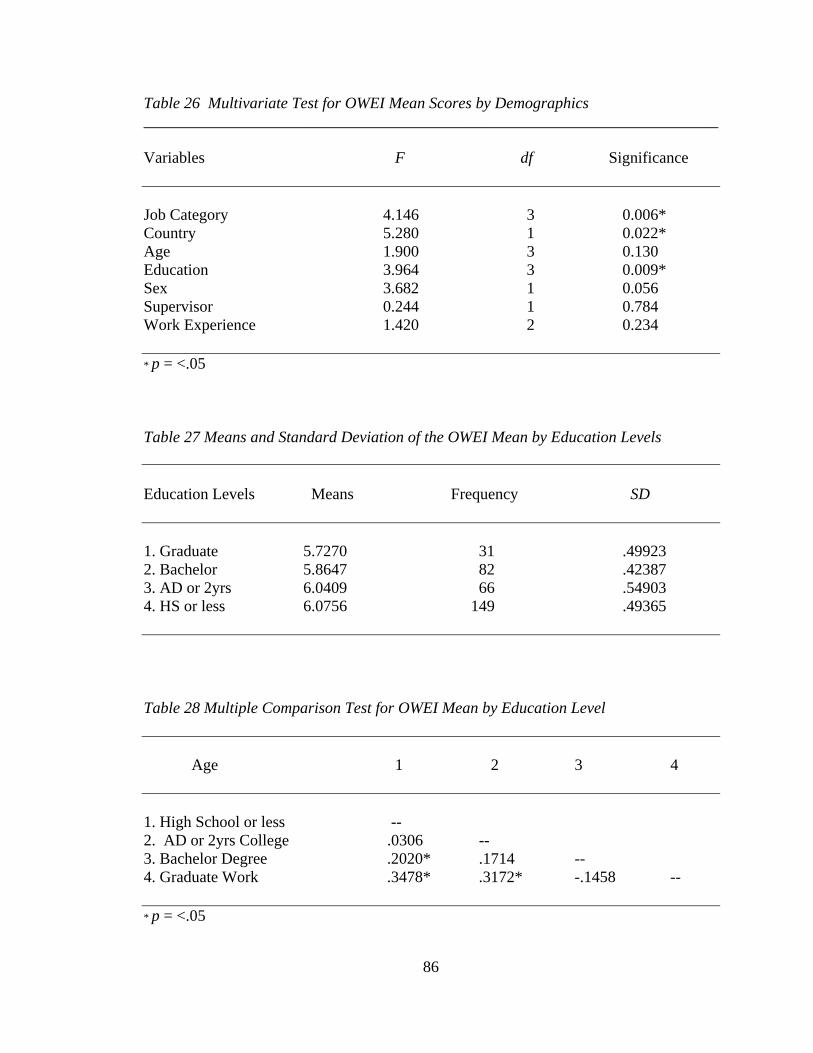
Table 26 Multivariate Test for OWEI Mean Scores by Demographics ________________________________________________________________________
Variables F df Significance Job Category 4.146 3 0.006* Country 5.280 1 0.022* Age 1.900 3 0.130 Education 3.964 3 0.009* Sex 3.682 1 0.056 Supervisor 0.244 1 0.784 Work Experience 1.420 2 0.234 * p = <.05 Table 27 Means and Standard Deviation of the OWEI Mean by Education Levels Education Levels Means Frequency SD 1. Graduate 5.7270 31 .49923 2. Bachelor 5.8647 82 .42387 3. AD or 2yrs 6.0409 66 .54903 4. HS or less 6.0756 149 .49365
Table 28 Multiple Comparison Test for OWEI Mean by Education Level Age 1 2 3 4 1. High School or less -- 2. AD or 2yrs College .0306 -- 3. Bachelor Degree .2020* .1714 -- 4. Graduate Work .3478* .3172* -.1458 -- * p = <.05
86
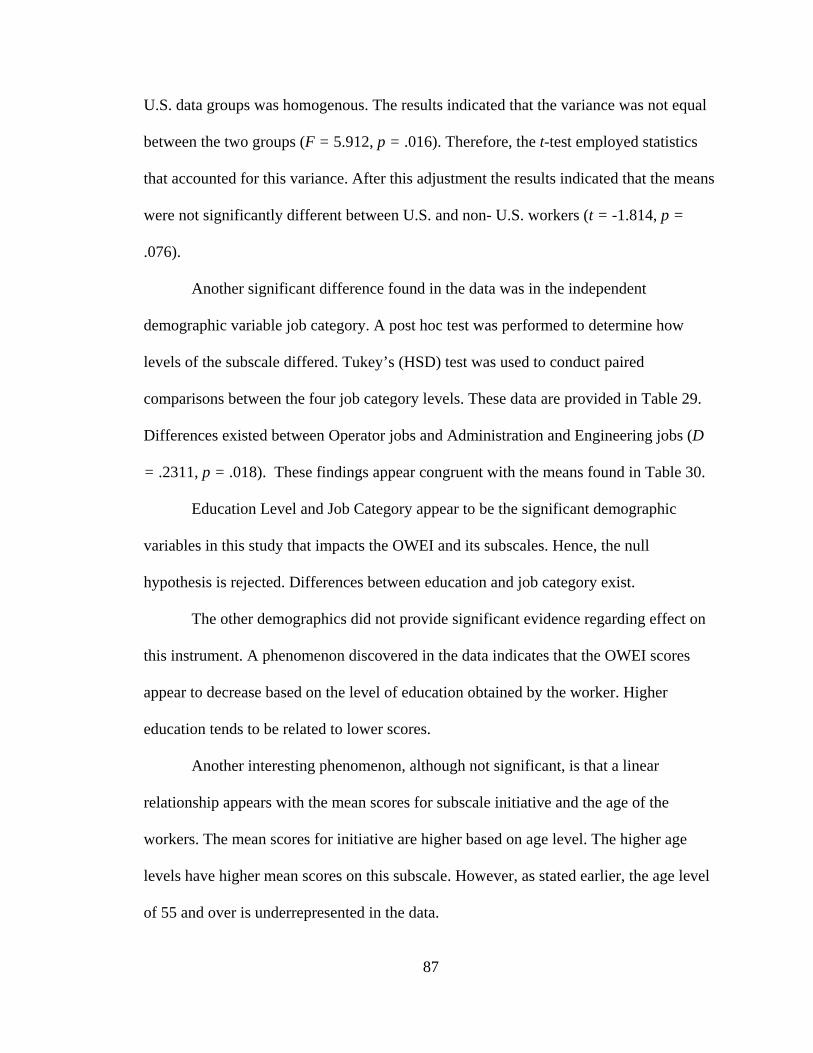
U.S. data groups was homogenous. The results indicated that the variance was not equal
between the two groups (F = 5.912, p = .016). Therefore, the t-test employed statistics
that accounted for this variance. After this adjustment the results indicated that the means
were not significantly different between U.S. and non- U.S. workers (t = -1.814, p =
.076).
Another significant difference found in the data was in the independent
demographic variable job category. A post hoc test was performed to determine how
levels of the subscale differed. Tukey’s (HSD) test was used to conduct paired
comparisons between the four job category levels. These data are provided in Table 29.
Differences existed between Operator jobs and Administration and Engineering jobs (D
= .2311, p = .018). These findings appear congruent with the means found in Table 30.
Education Level and Job Category appear to be the significant demographic
variables in this study that impacts the OWEI and its subscales. Hence, the null
hypothesis is rejected. Differences between education and job category exist.
The other demographics did not provide significant evidence regarding effect on
this instrument. A phenomenon discovered in the data indicates that the OWEI scores
appear to decrease based on the level of education obtained by the worker. Higher
education tends to be related to lower scores.
Another interesting phenomenon, although not significant, is that a linear
relationship appears with the mean scores for subscale initiative and the age of the
workers. The mean scores for initiative are higher based on age level. The higher age
levels have higher mean scores on this subscale. However, as stated earlier, the age level
of 55 and over is underrepresented in the data.
87
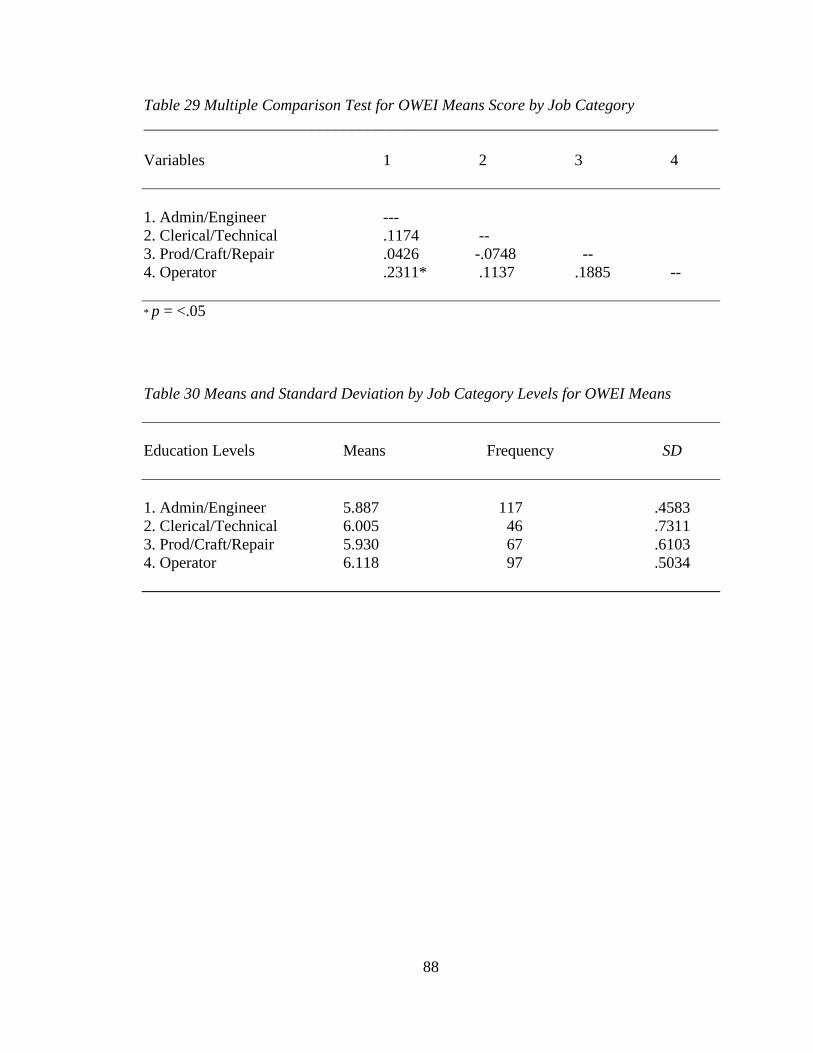
Table 29 Multiple Comparison Test for OWEI Means Score by Job Category ________________________________________________________________________ Variables 1 2 3 4 1. Admin/Engineer --- 2. Clerical/Technical .1174 -- 3. Prod/Craft/Repair .0426 -.0748 -- 4. Operator .2311* .1137 .1885 -- * p = <.05
Table 30 Means and Standard Deviation by Job Category Levels for OWEI Means Education Levels Means Frequency SD 1. Admin/Engineer 5.887 117 .4583 2. Clerical/Technical 6.005 46 .7311 3. Prod/Craft/Repair 5.930 67 .6103 4. Operator 6.118 97 .5034
88
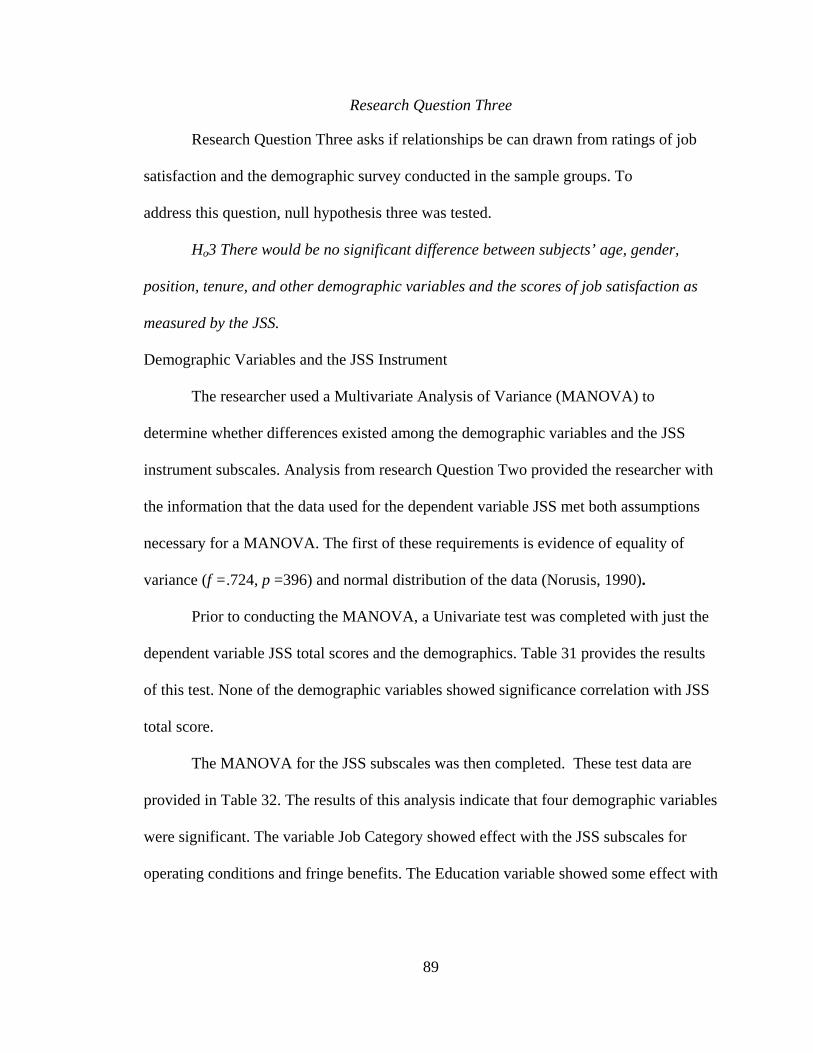
Research Question Three
Research Question Three asks if relationships be can drawn from ratings of job satisfaction and the demographic survey conducted in the sample groups. To address this question, null hypothesis three was tested.
Ho3 There would be no significant difference between subjects’ age, gender,
position, tenure, and other demographic variables and the scores of job satisfaction as
measured by the JSS.
Demographic Variables and the JSS Instrument
The researcher used a Multivariate Analysis of Variance (MANOVA) to
determine whether differences existed among the demographic variables and the JSS
instrument subscales. Analysis from research Question Two provided the researcher with
the information that the data used for the dependent variable JSS met both assumptions
necessary for a MANOVA. The first of these requirements is evidence of equality of
variance (f =.724, p =396) and normal distribution of the data (Norusis, 1990).
Prior to conducting the MANOVA, a Univariate test was completed with just the
dependent variable JSS total scores and the demographics. Table 31 provides the results
of this test. None of the demographic variables showed significance correlation with JSS
total score.
The MANOVA for the JSS subscales was then completed. These test data are provided in Table 32. The results of this analysis indicate that four demographic variables
were significant. The variable Job Category showed effect with the JSS subscales for
operating conditions and fringe benefits. The Education variable showed some effect with
89
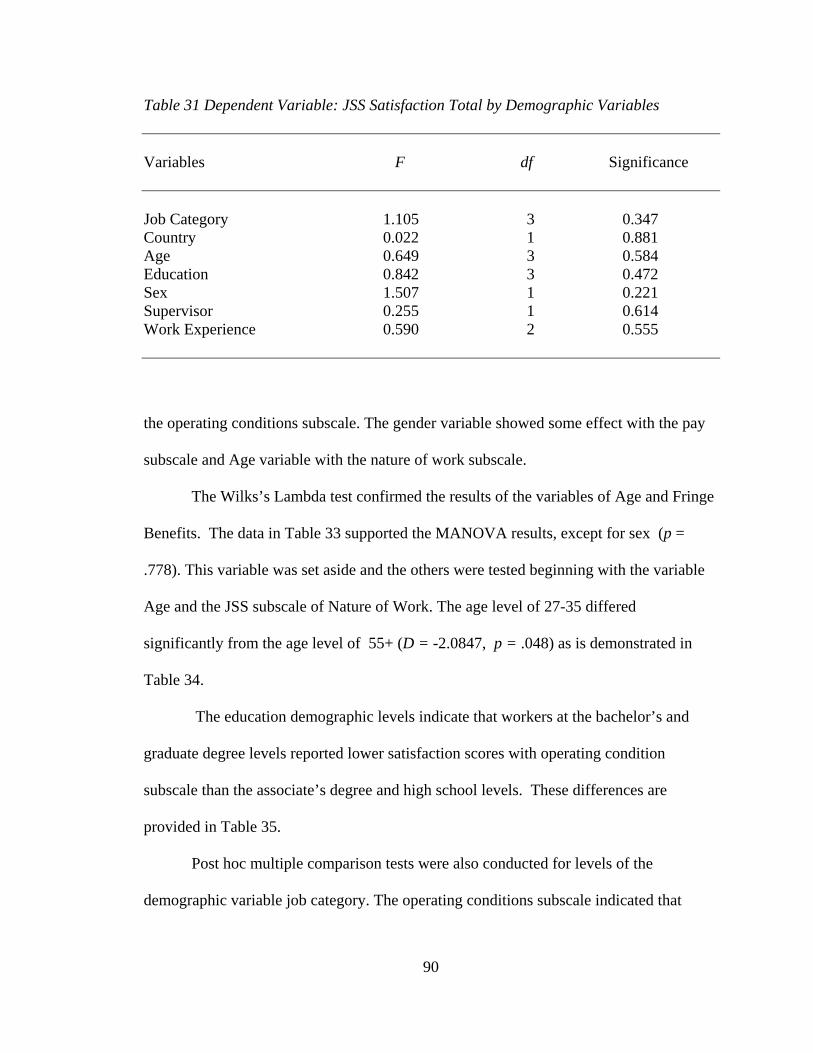
Table 31 Dependent Variable: JSS Satisfaction Total by Demographic Variables Variables F df Significance Job Category 1.105 3 0.347 Country 0.022 1 0.881 Age 0.649 3 0.584 Education 0.842 3 0.472 Sex 1.507 1 0.221 Supervisor 0.255 1 0.614 Work Experience 0.590 2 0.555 the operating conditions subscale. The gender variable showed some effect with the pay
subscale and Age variable with the nature of work subscale.
The Wilks’s Lambda test confirmed the results of the variables of Age and Fringe
Benefits. The data in Table 33 supported the MANOVA results, except for sex (p =
.778). This variable was set aside and the others were tested beginning with the variable
Age and the JSS subscale of Nature of Work. The age level of 27-35 differed
significantly from the age level of 55+ (D = -2.0847, p = .048) as is demonstrated in
Table 34.
The education demographic levels indicate that workers at the bachelor’s and
graduate degree levels reported lower satisfaction scores with operating condition
subscale than the associate’s degree and high school levels. These differences are
provided in Table 35.
Post hoc multiple comparison tests were also conducted for levels of the
demographic variable job category. The operating conditions subscale indicated that
90
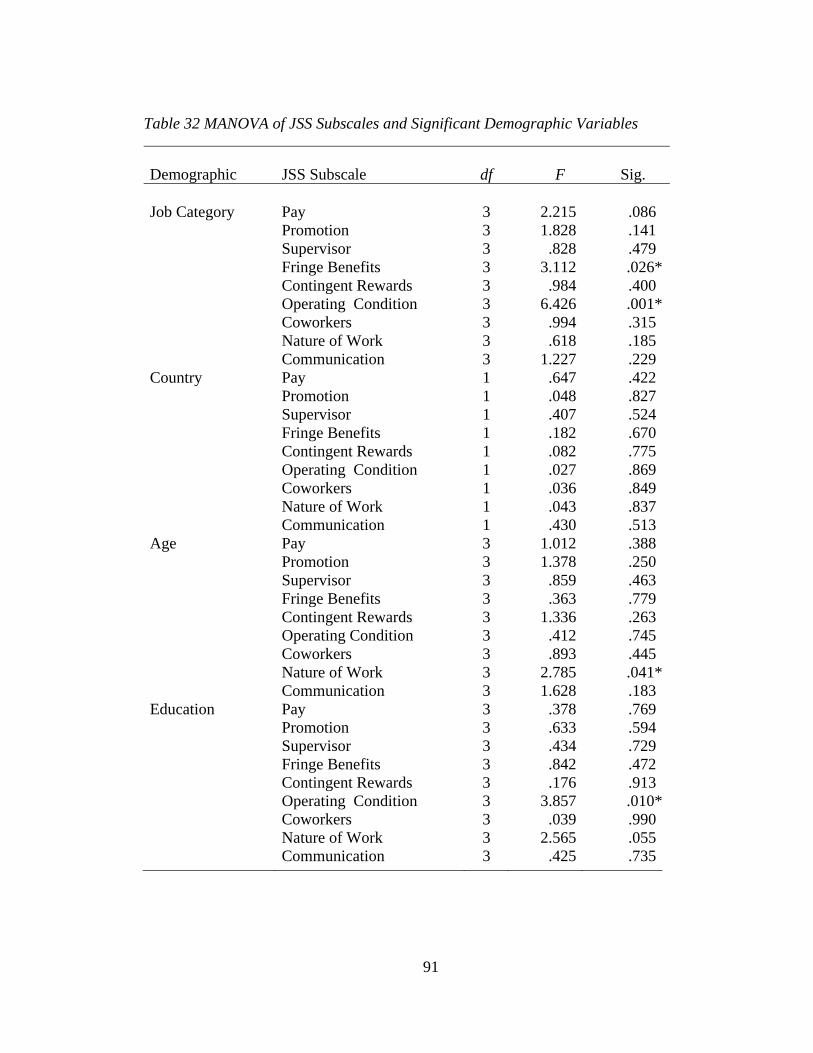
Table 32 MANOVA of JSS Subscales and Significant Demographic Variables Demographic JSS Subscale
df F Sig.
Job Category
Pay
3
2.215
.086
Promotion 3 1.828 .141 Supervisor 3 .828 .479 Fringe Benefits 3 3.112 .026* Contingent Rewards 3 .984 .400 Operating Condition 3 6.426 .001* Coworkers 3 .994 .315 Nature of Work 3 .618 .185 Communication 3 1.227 .229Country Pay 1 .647 .422 Promotion 1 .048 .827 Supervisor 1 .407 .524 Fringe Benefits 1 .182 .670 Contingent Rewards 1 .082 .775 Operating Condition 1 .027 .869 Coworkers 1 .036 .849 Nature of Work 1 .043 .837 Communication 1 .430 .513Age Pay 3 1.012 .388 Promotion 3 1.378 .250 Supervisor 3 .859 .463 Fringe Benefits 3 .363 .779 Contingent Rewards 3 1.336 .263 Operating Condition 3 .412 .745 Coworkers 3 .893 .445 Nature of Work 3 2.785 .041* Communication 3 1.628 .183Education Pay 3 .378 .769 Promotion 3 .633 .594 Supervisor 3 .434 .729 Fringe Benefits 3 .842 .472 Contingent Rewards 3 .176 .913 Operating Condition 3 3.857 .010* Coworkers 3 .039 .990 Nature of Work 3 2.565 .055 Communication 3 .425 .735
91
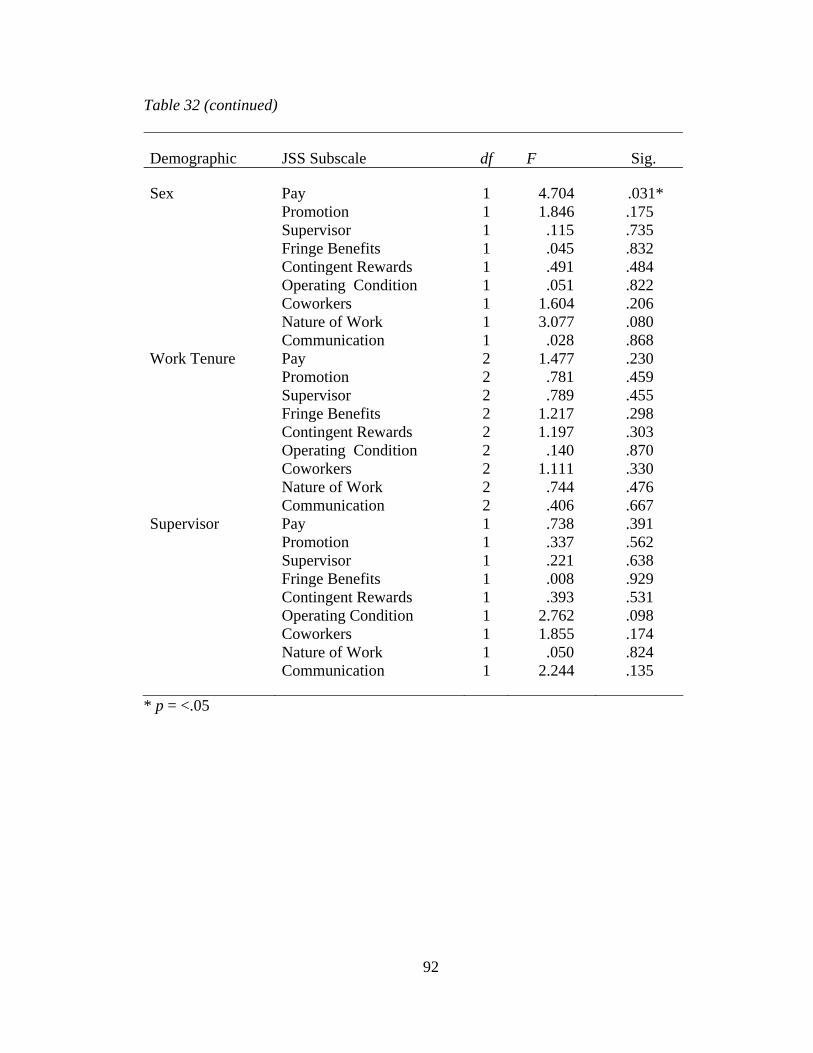
Table 32 (continued)
Demographic JSS Subscale df F Sig.
Sex Pay 1 4.704 .031* Promotion 1 1.846 .175 Supervisor 1 .115 .735 Fringe Benefits 1 .045 .832 Contingent Rewards 1 .491 .484 Operating Condition 1 .051 .822 Coworkers 1 1.604 .206 Nature of Work 1 3.077 .080 Communication 1 .028 .868 Work Tenure Pay 2 1.477 .230 Promotion 2 .781 .459 Supervisor 2 .789 .455 Fringe Benefits 2 1.217 .298 Contingent Rewards 2 1.197 .303 Operating Condition 2 .140 .870 Coworkers 2 1.111 .330 Nature of Work 2 .744 .476 Communication 2 .406 .667 Supervisor Pay 1 .738 .391 Promotion 1 .337 .562 Supervisor 1 .221 .638 Fringe Benefits 1 .008 .929 Contingent Rewards 1 .393 .531 Operating Condition 1 2.762 .098 Coworkers 1 1.855 .174 Nature of Work 1 .050 .824 Communication 1 2.244 .135
* p = <.05
92
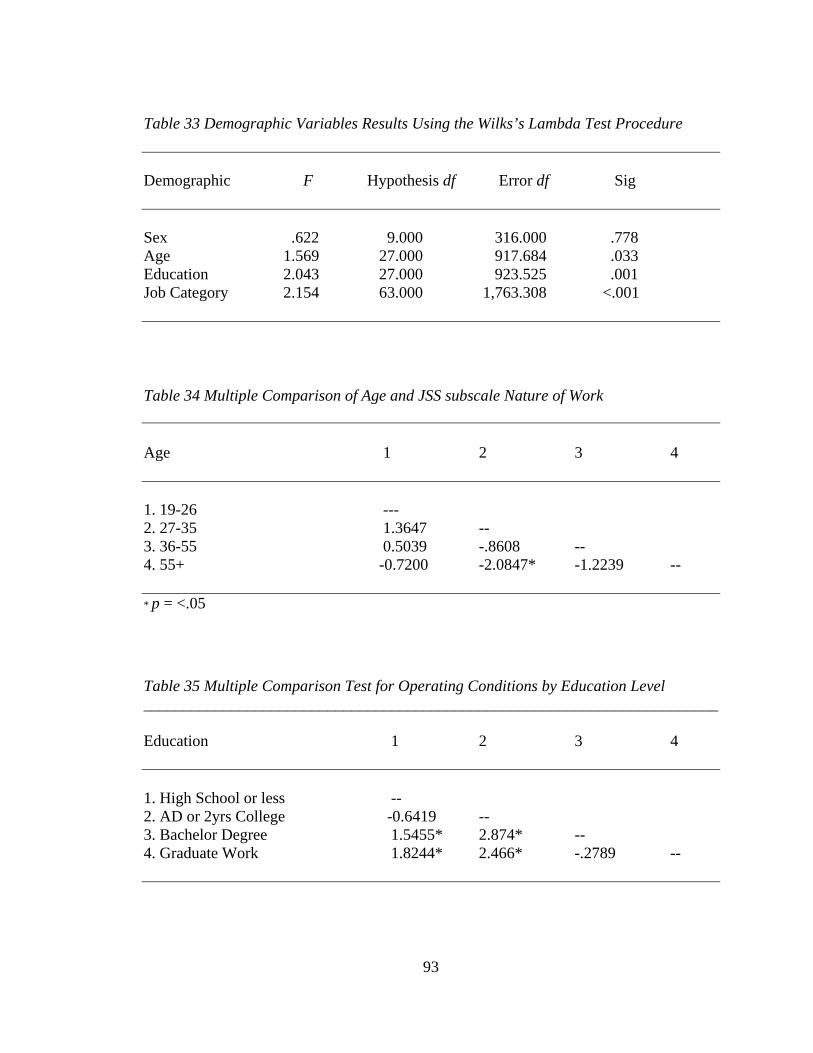
Table 33 Demographic Variables Results Using the Wilks’s Lambda Test Procedure Demographic F Hypothesis df Error df Sig Sex .622 9.000 316.000 .778 Age 1.569 27.000 917.684 .033 Education 2.043 27.000 923.525 .001 Job Category 2.154 63.000 1,763.308 <.001
Table 34 Multiple Comparison of Age and JSS subscale Nature of Work
Age 1 2 3 4 1. 19-26 --- 2. 27-35 1.3647 -- 3. 36-55 0.5039 -.8608 -- 4. 55+ -0.7200 -2.0847* -1.2239 -- * p = <.05
Table 35 Multiple Comparison Test for Operating Conditions by Education Level ________________________________________________________________________ Education 1 2 3 4 1. High School or less -- 2. AD or 2yrs College -0.6419 -- 3. Bachelor Degree 1.5455* 2.874* -- 4. Graduate Work 1.8244* 2.466* -.2789 --
93
differences existed between the job category Operator and all the other job categories,
which included: (a) Administration/Engineering jobs (D = 2.006), (b) Technical/Clerical
(D = 2.123), (c) Production/ Craft (D = 1.640). The subscale called fringe benefits
subscale also revealed differences between Technical/Clerical job category and the
Administration/Engineer job category (D = -1.818). Tables 36 and 37 provide this data.
Research Question Four
Research question Four asks what significant differences exist between exempt
and non-exempt employees working in a Japanese-owned manufacturing company
regarding levels of job satisfaction as measured by the JSS. To address this question, null
hypothesis four was tested.
Ho4 There would be no significant differences of job satisfaction among exempt
and non-exempt workers as measured on the JSS.
To answer this question the researcher calculated and visually reviewed the means
and standard deviations for both exempt and non-exempt workers for the total overall
score of the JSS. The data in Table 38 showed that the mean score and variation data
between exempt and non-exempt were very similar. A t-test for equality of means was
then accomplished. This test indicated that no significant differences existed between
these two groups (t = .258, df = 326, p = .797). The Levene’s Test provided evidence
that homogeneity of variance also exists (f = .724, p > .396). Therefore, the researcher
concluded that no significant difference existed between exempt and non-exempt worker
when looking at the overall total score of the JSS.
The researcher then tested the JSS subscales by conducting a multivariate test.
The results in Table 39 indicated that the JSS subscales of pay and operating
94
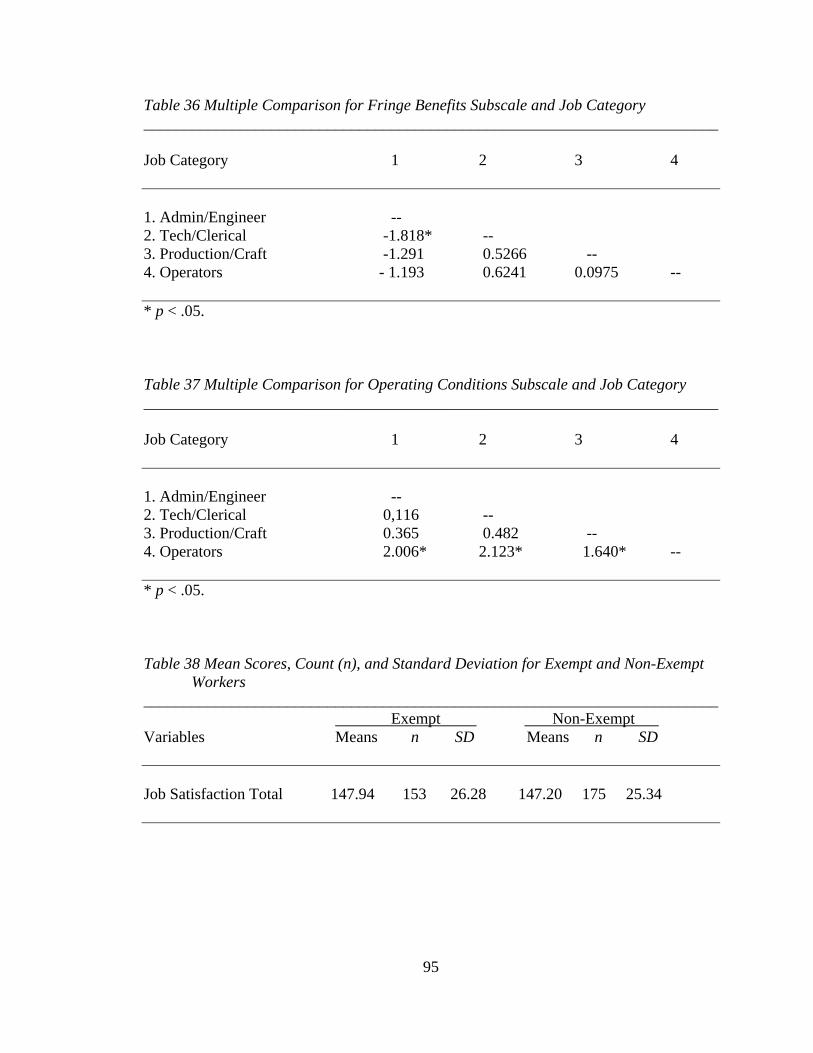
Table 36 Multiple Comparison for Fringe Benefits Subscale and Job Category ________________________________________________________________________ Job Category 1 2 3 4 1. Admin/Engineer -- 2. Tech/Clerical -1.818* -- 3. Production/Craft -1.291 0.5266 -- 4. Operators - 1.193 0.6241 0.0975 -- * p < .05. Table 37 Multiple Comparison for Operating Conditions Subscale and Job Category ________________________________________________________________________ Job Category 1 2 3 4 1. Admin/Engineer -- 2. Tech/Clerical 0,116 -- 3. Production/Craft 0.365 0.482 -- 4. Operators 2.006* 2.123* 1.640* -- * p < .05.
Table 38 Mean Scores, Count (n), and Standard Deviation for Exempt and Non-Exempt
Workers ________________________________________________________________________ Exempt Non-Exempt . Variables Means n SD Means n SD Job Satisfaction Total 147.94 153 26.28 147.20 175 25.34
95
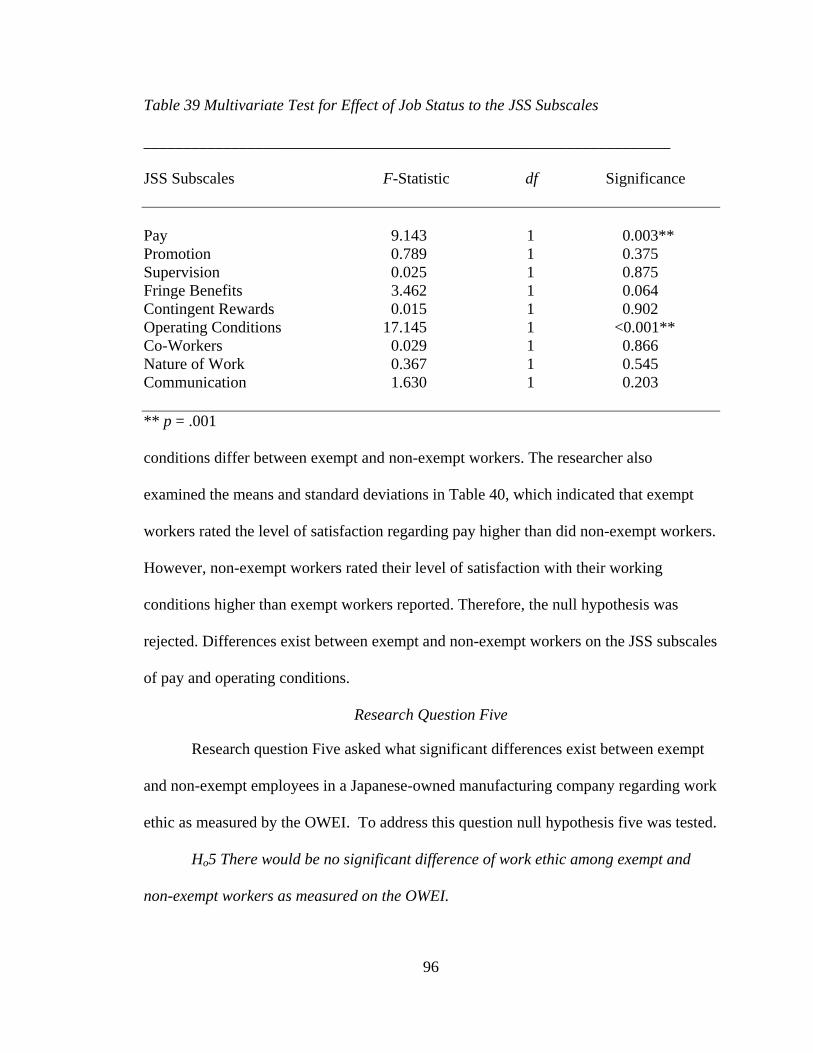
Table 39 Multivariate Test for Effect of Job Status to the JSS Subscales
__________________________________________________________________
JSS Subscales F-Statistic df Significance Pay 9.143 1 0.003** Promotion 0.789 1 0.375 Supervision 0.025 1 0.875 Fringe Benefits 3.462 1 0.064 Contingent Rewards 0.015 1 0.902 Operating Conditions 17.145 1 <0.001** Co-Workers 0.029 1 0.866 Nature of Work 0.367 1 0.545 Communication 1.630 1 0.203 ** p = .001
conditions differ between exempt and non-exempt workers. The researcher also
examined the means and standard deviations in Table 40, which indicated that exempt
workers rated the level of satisfaction regarding pay higher than did non-exempt workers.
However, non-exempt workers rated their level of satisfaction with their working
conditions higher than exempt workers reported. Therefore, the null hypothesis was
rejected. Differences exist between exempt and non-exempt workers on the JSS subscales
of pay and operating conditions.
Research Question Five
Research question Five asked what significant differences exist between exempt
and non-exempt employees in a Japanese-owned manufacturing company regarding work
ethic as measured by the OWEI. To address this question null hypothesis five was tested.
Ho5 There would be no significant difference of work ethic among exempt and
non-exempt workers as measured on the OWEI.
96
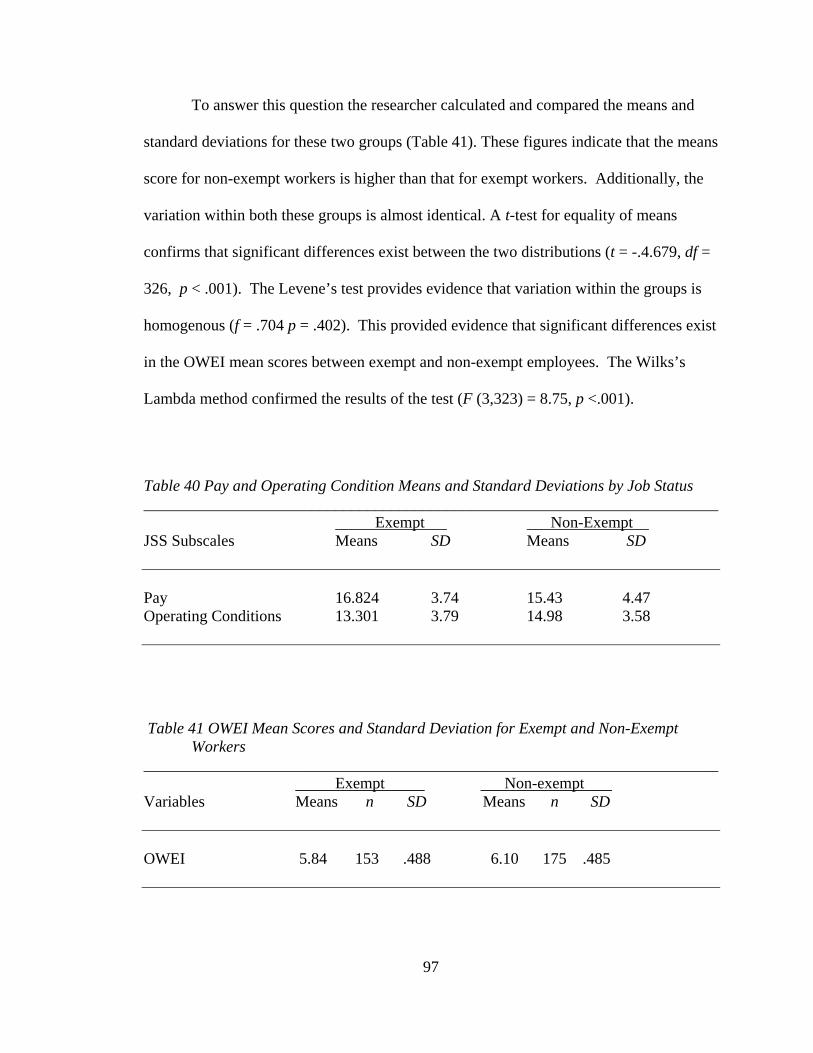
To answer this question the researcher calculated and compared the means and
standard deviations for these two groups (Table 41). These figures indicate that the means
score for non-exempt workers is higher than that for exempt workers. Additionally, the
variation within both these groups is almost identical. A t-test for equality of means
confirms that significant differences exist between the two distributions (t = -.4.679, df =
326, p < .001). The Levene’s test provides evidence that variation within the groups is
homogenous (f = .704 p = .402). This provided evidence that significant differences exist
in the OWEI mean scores between exempt and non-exempt employees. The Wilks’s
Lambda method confirmed the results of the test (F (3,323) = 8.75, p <.001).
Table 40 Pay and Operating Condition Means and Standard Deviations by Job Status ________________________________________________________________________ Exempt Non-Exempt . JSS Subscales Means SD Means SD Pay 16.824 3.74 15.43 4.47 Operating Conditions 13.301 3.79 14.98 3.58
Table 41 OWEI Mean Scores and Standard Deviation for Exempt and Non-Exempt Workers
________________________________________________________________________ Exempt Non-exempt . Variables Means n SD Means n SD OWEI 5.84 153 .488 6.10 175 .485
97
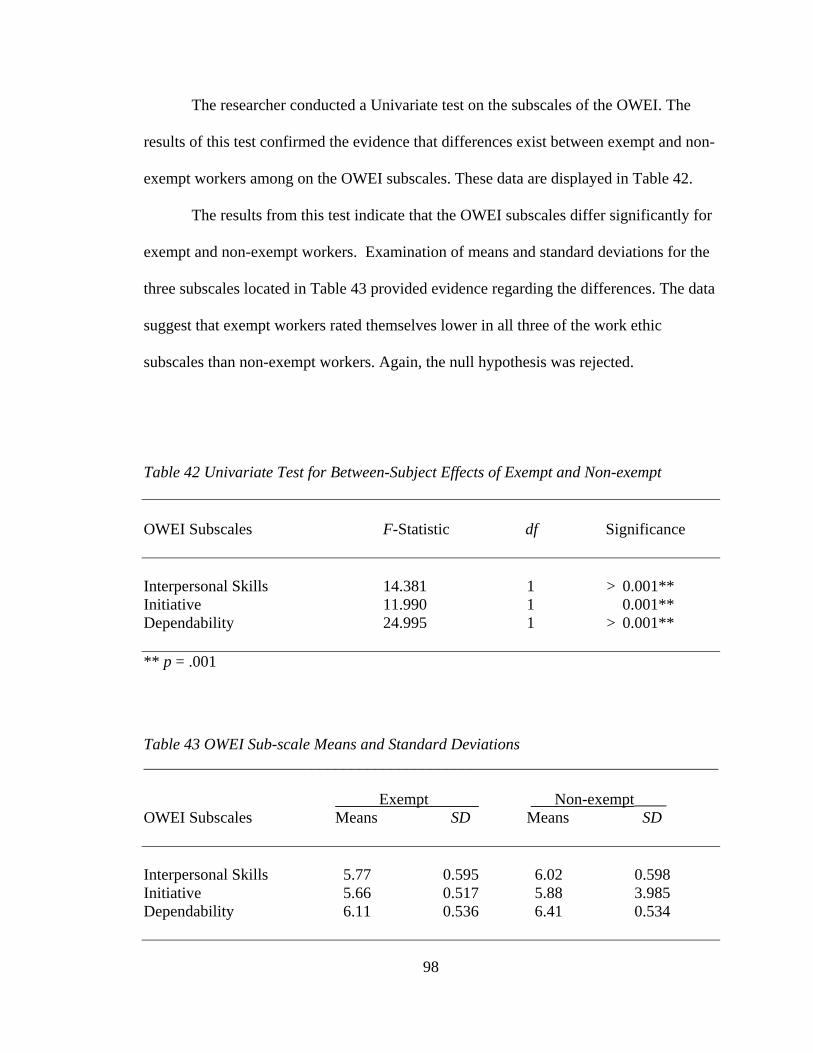
The researcher conducted a Univariate test on the subscales of the OWEI. The
results of this test confirmed the evidence that differences exist between exempt and non-
exempt workers among on the OWEI subscales. These data are displayed in Table 42.
The results from this test indicate that the OWEI subscales differ significantly for
exempt and non-exempt workers. Examination of means and standard deviations for the
three subscales located in Table 43 provided evidence regarding the differences. The data
suggest that exempt workers rated themselves lower in all three of the work ethic
subscales than non-exempt workers. Again, the null hypothesis was rejected.
Table 42 Univariate Test for Between-Subject Effects of Exempt and Non-exempt OWEI Subscales F-Statistic df Significance Interpersonal Skills 14.381 1 > 0.001** Initiative 11.990 1 0.001** Dependability 24.995 1 > 0.001** ** p = .001
Table 43 OWEI Sub-scale Means and Standard Deviations ________________________________________________________________________
Exempt Non-exempt____ OWEI Subscales Means SD Means SD Interpersonal Skills 5.77 0.595 6.02 0.598 Initiative 5.66 0.517 5.88 3.985 Dependability 6.11 0.536 6.41 0.534
98
Summary of the Chapter
This chapter introduced the results from the analysis of the study. Key finding
suggest that differences exist between exempt and non-exempt in both job satisfaction
levels and work ethic levels. Additionally, the JSS and OWEI instrument showed
significant correlations. A summary of the results are addressed below:
1. The study obtained responses from 262 workers, representing a 57% response rate. The researcher contacted another 66 of the non-respondents to increase this number to 328, which is the recommended sample size for a population of 2,276 (Krejcie & Morgan, 1970). Exempt workers made up 46.6 % of the sample and non-exempt represented 53.4%.
2. The researcher concluded that the scores of non-respondents could be
included in the statistical analysis without prejudice toward the OWEI instrument. However, special attention should be given to any conclusions and findings involving the JSS subscale of fringe benefits due to differences that existed between respondents and non-respondents. Special attention was also given to the demographics of age and country. The researcher employed two robust tests, the Wilks’s Lambda and Pillai’s Trace, to mitigate differences between respondents and non-respondents.
3. The OWEI and the JSS instruments showed an overall positive, but low
though significant, correlation. Additionally, correlations exist between the JSS and the subscales of the OWEI. Several subscale correlations also exist. The most significant correlation was with the subscale of nature of work on the JSS and the subscale of initiative on the OWEI.
4. No significant differences were found in the overall job satisfaction levels
reported between exempt and non-exempt workers. However, exempt workers had significantly higher mean scores for their level of satisfaction regarding their pay while non-exempt workers reported significantly higher mean score regarding their levels of satisfaction with their working conditions. Additionally, non-exempt workers reported significantly higher levels of work ethic scores than exempt workers. This was true in the overall score as well as each of the OWEI subscales.
5. The demographic variables of education levels and job categories showed
significant effects in the scores reported on the OWEI and its subscales. Additionally, job category showed effect with the fringe benefit and operating condition JSS subscales. The demographic variable Education showed effect with the operating conditions subscale. Finally the Age demographic variable showed effect with the nature of work subscale.
99
CHAPTER V
CONCLUSIONS, RECOMMENDATIONS, AND IMPLICATIONS
The researcher conducted this study in order to understand the relationships
between job satisfaction and work ethic among exempt and non-exempt employees
working in a Japanese-owned manufacturing company. The study investigated the
occupational work ethics and job satisfaction of employees working in three different
plants in the southern region of the United States. The study also investigated whether
the scores from the JSS (Spector, 1985) and OWEI (Petty, 1995) were influenced by
demographic differences among exempt and non-exempt workers. This chapter presents
results of the demographic profile of subjects and draws conclusions from the findings.
Implications and recommendations for future study are addressed in this chapter as well.
Demographic Profile of Subjects
The subjects consisted of 153 exempt and 175 non-exempt employees. These
individuals worked in three manufacturing plants in the same geographical location,
although they worked in different job assignments, with different product lines, and under
different chains of command. Subjects were assigned job status groups that were fairly
equally divided into exempt 46.6% (salary) and 53.4 % non-exempt (hourly) workers.
This equality added credibility to the focus of the study regarding differences.
The majority of subjects were male with U.S. citizenship. The non-U.S.
respondents were grouped together due to the small numbers from various countries.
Japan accounted for 30 of the 42 subjects; the remaining non-U.S. citizens were from
Mexico (3), China (2), Russia (2), and Argentina, Bulgaria, Cambodia, Great Britain, and
Portugal (one each).
100
The age range of employees participating in the study fell, for the most part,
within the 36 to 55 range. Of the remainder, 26% of workers were 27 to 35 years old; 8%
reported being over 55, 11% under the age of 26.
Approximately 55% of the respondents had some form of higher education,
ranging from two years college to graduate work. The remaining 45% had a high school
diploma or less. The majority of subjects reported that they had worked for the present
employer for more than 8 years, and only 6% reported having only two years or less of
work experience. Almost 70% of subjects reported that they did not supervise others. The
largest job category reported by subjects was identified as administration and
engineering, which made up about 36% of the sample. The second largest was operators
(30%), and the repair or craft category made up approximately 20%. Technical and
clerical jobs had the least representation (14%).
Respondents and Non-Respondents
An analysis of respondents and non-respondents revealed whether differences
existed between these two groups as measured by the dependent variable JSS and OWEI
instruments. This was a concern to the researcher because of his effort to reach non-
respondents from underrepresented demographic variables via phone calls, e-mails,
letters, and meetings. More specifically, the researcher targeted non-respondents who
varied by age, country, and gender. A chi square analysis revealed that in fact differences
existed between respondents and non-respondents in the demographic variable country (p
= .001) and age (p = .001). However, it was the researcher’s intention to ensure more
representation of these demographics in order to improve comparison of the data.
101
Analysis showed no significant differences existed between the OWEI and its
subscales for respondents and non-respondents. Unfortunately, a single subscale,
designated as fringe benefits on the JSS, did show differences between the two groups.
Consequently, a simple precaution was implemented to conduct additional analysis with
more robust tests when this dependent variable or the demographics of age and country,
or both, were found to be significant. Fortunately, the added rigor of Wilks’s Lambda or
Pillai’s Trace test, or both, which are designed to mitigate problems due to lack of
homogeneity and normality between data sets (Norusis, 1990), provided more credibility
in the study. The researcher concluded that with these precautions in place the answers by
non-respondents would not significantly impact the results and in all probability
represented a similar trend with those of the respondents. Therefore, the respondent and
non-respondent data were merged and used in the analysis.
The Relationship between the OWEI and the JSS
Research question One asked if there are significant relationships between the
ratings measured using the OWEI and the JSS among individuals working in a Japanese-
owned manufacturing company. This question was addressed due to the gaps in previous
research regarding the ability to predict job satisfaction by the level of personal work
ethic (Williams & Sandler, 1995). More recent research (Petty & Hill, 2005) has called
for more studies regarding the link between job-satisfaction and work ethic. Moreover,
these findings added credibility to the synthesized conceptual model proposed by the
researcher in Chapter I.
102
This model is a synthesis of several concepts regarding job satisfaction using the
work ethic research (Petty, 1991a), the General Work Performance Model (Pearlman,
1997), and the Job Characteristic Model (Hackman & Oldham, 1975). The concept
suggests that the effect of work ethic on job satisfaction is moderated by occupational
choice, the cultural work dynamics of the job, and individual demographics.
Results from the study of this research question provided evidence that the OWEI
is significantly correlated (p = .001) with the JSS. This finding suggests that job
satisfaction may be impacted by work ethic among individuals who choose occupations
in the manufacturing industry. More specifically, the JSS subscale designated as Nature
of Work showed correlation (.345) with the OWEI and its subscales. This might indicate
that the nature of the work chosen by subjects may moderate their job-satisfaction.
Therefore, the OWEI did prove significant relationships with the JSS.
Demographic Differences with Work Ethic and Job Satisfaction
Research questions Two and Three consider whether relationships can be detected
in ratings of both the JSS and OWEI instruments and key demographics variables. The
purpose of exploring this was to add to the body of knowledge surrounding the links
between individual traits and varied levels of work ethic and job satisfaction (Williams &
Sandler, 1995; Kirkman & Shapiro, 1997; Spector, 1997; Brauchle & Asam, 2004, Petty
& Hill, 2005). More specifically, the researcher targeted a Japanese-owned company
with different management techniques to discover whether significant cross-cultural
differences in employee-related attitudes might exist (Yiu & Saner, 2000).
The findings of this study conclude that education level and job category appeared
to be the only significant demographic variables in this study that impact the OWEI and
its subscales. This finding is congruent with previous research regarding the effect of
education on work ethic (Petty, 1995). One phenomenon revealed by the data indicates
that the scores appear to decrease based on the level of education obtained by the worker.
More education tends to be related to lower scores on the OWEI as well as on the OWEI
Interpersonal and Dependability subscales.
103
Another interesting phenomenon consistent with earlier research (Clark, Oswald
& Warr, 1996) is the linear relationship that appears in the mean scores for the OWEI
subscale initiative and age of the workers. The means score for initiative is higher in
proportion to the age level. The higher age levels have higher mean scores on this
subscale. Although not significant in this study, the data is congruent with research
regarding declining work ethic in America (Wayne & Chapman, 1992)
The effect of being a U.S. or non-U.S. worker was originally found to be a
significant effect in the OWEI dependability subscale. However, this effect did not prove
significant after conducting more rigorous testing using Wilks’s Lambda and Pillai’s
Trace to mitigate the respondent and non-respondent concerns noted above. Therefore,
the researcher is reluctant to consider that any difference exists for this variable.
When looking at job-satisfaction levels, the demographic variable of age showed
significant effect on the JSS subscale Nature of Work. This finding is congruent with
earlier research conducted on age (Super et al., 1996). Multiple comparisons revealed
significant differences among age levels. The 27 to 35 year age level reported
significantly lower satisfaction ratings with the Nature of Work subscale than workers 55
years of age or older. However, the age level of 55 or older was underrepresented in the
data. Nevertheless, the Pillai’s Trace (p = .034) and Wilks’s Lambda (p = .033) tests
confirmed that significant differences exist.
The education demographic showed significant effect for the subscale operating
conditions. Findings indicate that workers at the bachelor and graduate degree levels
reported lower satisfaction scores regarding operating conditions than those at the
associate degree and high school levels. However, the levels of education may be
104
confounded with the job status of the worker. Exempt workers tend to require higher
levels of education to qualify for their jobs.
The job category demographic also showed significant effect on the JSS
subscales. This finding is congruent with earlier research (Pearlman, 1997). The JSS
subscales for operating conditions and fringe benefits were found to have significant
effects on job satisfaction between different job categories. The fringe benefits subscale
revealed differences between the Administration/Engineering job category, which
consists primarily of professional exempt positions, and the Clerical/Technical category,
which includes non-exempt positions such as secretaries and machinists. The Operator
job category, which is primarily non-exempt, showed differences with all the other job
categories on the subscale of operating conditions. It should be noted of this finding that
Operators primarily work in the plant while employees in other categories have office
space available to them to accomplish their job requirements. These work space
differences may contribute to the disparity between the Operator job category and other
job categories that have office space such as Engineers, Administrators, and so on.
Exempt and Non-Exempt Job Satisfaction and Work Ethic Levels
Research questions Four and Five inquired into the effect exempt and non-exempt
status has on the job satisfaction and work ethic levels in a Japanese-owned
manufacturing company. These questions were intended to address the call for more
research on the work ethic of different position levels (McCortney & Engles, 2003) and
confirm findings regarding the level of job satisfaction among workers in manufacturing
environments (Sousa-Posa & Sousa-Posa, 2000).
105
The findings from this study are mixed. The results revealed that those with
salaried positions (exempt) reported lower work ethic levels than hourly workers (non-
exempt). Conversely, exempt workers reported higher levels of satisfaction with their pay
than did non-exempt, while non-exempt workers reported higher levels of satisfaction
with their operating conditions.
The results indicated that the variation of overall job satisfaction (total score) is
not significantly different between exempt or non-exempt workers. These findings are
congruent with the findings of other researchers. For example, Brewer and McMahan-
Landers (2003) found little variation among educators with various industrial
backgrounds. Sousa-Poza and Sousa-Poza (2000) found that employees from various
countries, including those working in Japanese-owned manufacturing companies, were
quite satisfied.
However, when looking at the subscales of the JSS, the data suggest that exempt
workers rated the level of satisfaction regarding their pay higher than did non-exempt
workers. However, non-exempt workers rated their level of satisfaction with their
working conditions higher than that reported by exempt workers. The remaining
subscales did not appear to be significantly different between exempt and non-exempt
workers.
The researcher also found evidence that suggests that work ethic levels tend to be
mitigated by job status levels. Work ethic levels tended to be reported significantly higher
by non-exempt workers than those reported by exempt workers. This result appears to
confirm earlier research that found work ethic differences among apprentices and their
instructors (Hatcher, 1994). Petty (1995) also found that work ethic differed by
occupation, which can be linked to job status and job category.
106
Non-exempt workers scored higher on the OWEI than did exempt workers.
Additionally, all the subscales differed significantly between exempt and non-exempt
workers. Exempt workers rated themselves lower than non-exempt workers in all three of
the work ethic subscales.
Implications
The major finding of the study is that there are significant relationships between
the Occupational Work Ethic Inventory and Job Satisfaction Survey scores. Therefore,
evidence exists that work ethic level may be a contributor to the level of job satisfaction
an individual experiences in certain manufacturing occupations. More specifically,
subscales on the JSS, such as Nature of Work, were correlated with other OWEI
subscales such as Initiative. This suggests that consideration should be given to the nature
of the work assigned to workers with high initiative. A change in the nature of the work
might mitigate the initiative levels of workers or enhance initiative among those with low
levels.
Another key finding is the impact of job category and education on work ethic
levels. An argument might be made that the job-status of being exempt or non-exempt
may be confounded with these two demographic variables. For example, education levels
are most likely higher among exempt than non-exempt workers. Additionally, some job
categories are filled primarily with exempt workers, while others are filled with non-
exempt workers.
107
The researcher did not attempt to determine the percentages of exempt and non-
exempt workers in these various demographic variables. However, a cursory observation
of the data and understanding of the work requirements suggests that some these
assumptions are credible. Therefore, differences found between demographics and work
ethic might better be explained by whether that the job is hourly or salary rather than by
the education level of the worker in a particular job.
Other findings in the study had some practical implications. One is how the level
of job satisfaction may be moderated by certain demographics or the job status of
workers. Therefore, conducting thorough analyses of the fit between potential employees
and work assignments should be encouraged.
The demographics of age, education and job category all appear to moderate
levels of satisfaction. Therefore, human resource departments may need to consider how
changes to the work requirements might improve satisfaction in these demographic
groups. For example, the study suggested that those in younger age groups were less
satisfied with the nature of the work they accomplished. Hence, methods to enhance the
nature of work may be of some value. Shifting responsibilities and jobs periodically and
providing opportunities for younger workers to provide feedback on how their work can
be improved might increase satisfaction levels.
Another example would include methods to mitigate dissatisfaction among those
with higher education levels with their operating conditions. Management may need to
consider the importance of continually improving the operating conditions in departments
that tend to employ workers with higher levels of education. Providing sessions to discuss
problems with operating conditions may also be of value
Further job categories may need to be reviewed to address key concerns with job
benefits. For example, the study provided data suggesting that workers in occupations
that are designated as clerical and technical were less satisfied with their fringe benefits
than those in administration and engineering occupations. Understanding this disparity of
108
satisfaction in job categories may help human resource practitioners more successfully
mitigate employee grievances.
Recommendations for Future Research
This study unquestionably lends itself to further research. A replicate study could
be conducted in another manufacturing plant or in other governmental, service, or
religious institutions. Additionally, more cross-cultural data would contribute more to
the body of knowledge if studies could be accomplished in other countries or other
international companies.
Longitudinal studies that determine if work ethic levels change by age and
educational attainment may help clarify the ambiguity that exists with these
demographics. Additional studies could examine the correlations between work ethic and
job satisfaction in more depth. For example, do correlations exist between the JSS scores
and OWEI score between U.S. and non-U.S. workers in countries outside the .U.S or in
other regions in the U.S.? What contributes to the strong correlation between the JSS
subscale nature of the job and the OWEI subscale initiative? Do environmental changes
or workspace improvements influence the work ethic or satisfaction levels of workers?
Finally, how do different management techniques moderate the differences found
between exempt and non-exempt workers?
In closing, this research added to the body of knowledge regarding the
relationship between job-satisfaction and work ethic. It also enlarged understanding of
the variables that moderate the impact of work ethic on job-satisfaction in manufacturing
environments. Organizations and researchers should continue to establish the best
practices for sustaining a strong work ethic within the work force. The same effort should
109
include methods for enhancing the satisfaction levels in order to retain these valuable
human resources.
Summary of the Chapter
In this chapter, the researcher discussed the conclusions, implications, and
recommendations generated by this study. Additionally, the overall findings and key
issues regarding this topic were reviewed. A description of how the research added to the
body of knowledge regarding the relationship between work ethic and job-satisfaction
was also included. The researcher offered various suggestions for future research and
raised various questions regarding this topic. In conclusion, evidence has been gained to
support the effort to better understand the link between work ethic and job satisfaction.
Furthermore, evidence is available to support conceptual thinking regarding a new
modified job satisfaction model proposed in the conceptual framework of Chapter I.
110

LIST OF REFERENCES
111
REFERENCES
Allender, B. R. (1993). The occupational work ethic of vocational students in East
Tennessee. Abstracts International, 54, 2127.
Agarwal, S. (1993). Influence of formalization on role stress, organizational commitment,
and work alienation of salespersons: A cross-national comparative study. Journal of International Business Studies, 24, 715-739.
Ary, D., Jacobs, L. C., & Razvich, A. (1996). Introduction to research in education
(5th ed.) New York: Harcourt Brace College Publishers. Ashford, A. J. (1986). Feedback-seeking in individual adaptation: A resource perspective.
Academy of Management Journal, 29(3), 465-487. Bakhtari, H. (1995). Cultural effects on Management style: a comparative study of
American and Middle Eastern management styles. International Studies of Management and Organization, 25(3) 97-108.
Balzer, W. K., Kihm, J. A., Smith, P. C., Irwin, J. L., Bachiochi, P. D., Robie, C., Sinar,
E. F., & Parra, L. F. (1997). Users’ manual for the Job Descriptive Index (1997 Revision) and the Job in General Scales. Retrieved from Bowling Green State University Web site: http://www.bgsu.edu/department/pshyc/JDI/
Berns, R. G. (1989). Job satisfaction of vocation education teachers in Northwest Ohio.
Bowling Green, OH: Bowling Green State University, Northwest Ohio Vocational Education Personnel Development Regional Center.
Black, J. S., & Porter, L. W. (1991). Managerial behaviors and job performance: A
successful manager in Los Angeles may not succeed in Hong Kong. Journal of
International Business Studies, 22(1), 99-113.
112
Black, J. S., Gergersen, H., & Mendenhall, M. E. (1992). Global assignments. San
Francisco: Jossey-Bass.
Boatwright, J. R., & Slate, J. R. (2002). Development of an instrument to assess work
ethics. Journal of Industrial Teacher Education, 39 (4). Retrieved August 10,
2006, from http://scholar.lib.vt.edu/ejournals/JTE/v39n4/boatwright.html
Bontis, N., & Fitz-enz, J. (2002), Intellectual capital ROI: a causal map of human capital
antecedents and consequences, Journal of Intellectual Capital, 3(3) pp. 223-247.
Brauchle, P. E., & Asam, M. S. (2004, July). Relationship between selected
demographic variables and employee work ethics as perceived by supervisors [Electronic version]. Journal of Industrial Teacher Education, 41(1).
Brauchle, P., & Petty, G. (1983). Identifying student perceptions of non-technical
work skills. Paper presented at the annual conference of the American Vocational Association, Anaheim, CA.
Brauchle, P. E., Petty, G. C., & Morgan, K. R. (1983). The factorial validity of the
affective work competency inventory. Educational and Psychological Measurement, 43(2), 603-609.
Brewer, E. W., & McMahan-Landers, J. (2003). Job satisfaction among industrial and
technical educators. Journal of Industrial Teacher Education, 40(2), 65- 85.
Brewer, E. W., & McMahan-Landers, J. (2003). The relationship between job stress and
job satisfaction among industrial and technical teacher educators. Journal of Career and Technical Education, 20(1). Retrieved August 17, 2006, from http:scholar.lib.vt.edu/ejournals/JCTE/v20n1/brewer.html.
113
Bryson A., Cappellari, L., & Lucifora, C. (2005, March). Why so unhappy? The effect of
union membership on job satisfaction. CESIFO Working Paper No. 1419.
Retrieved August 1, 2006, from http:www.SSRN.com
Buffum, W. E., & Konick, A. (1982). Employees’ job satisfaction, residents’ functioning,
and treatment progress in psychiatric institutions. Health & Social Work, 7, 320- 327.
Campbell, D. T., & Fiske, D. W. (1959). Convergent and discriminate validation by the
multi-trait, multi-method matrix. Psychological Bulletin, 56, 81-105. Cano, J., & Miller, G. (1992a). An analysis of job satisfaction and job satisfier factors
among six taxonomies of agricultural education teachers. Journal of Agricultural Education, 33(4), 9-16. (ERIC Documentation Reproduction Service No. EJ452518)
Cano, J., & Miller, G. (1992b). A gender analysis of job satisfaction and job satisfier
factors of agricultural education teachers. Journal of Agricultural Education, 33(3), 40-46.
Castillo, J. X., & Cano, J. (1999). A comparative analysis of Ohio agriculture education
teachers. Journal of Agricultural Education, 40(4), 67-76. Carsten, J. M., & Spector, P. E. (1987). Unemployment, job satisfaction, and employee
turnover: A meta-analytic test of the Muchinsky model. Journal of Applied Psychology, 72, 374-381.
Chan, D. W. (1998). Stress, coping strategies, and psychological distress among
secondary school teachers in Hong Kong. American Educational Research Journal, 35, 145-163. (ERIC Document Reproduction Service No. EJ569617)
114
Chang, S. K. C. (1985). American and Chinese managers in U.S. companies in Taiwan:
A comparison. California Management Review, 27, 144-156. Cherrington, D. J. (1980). The work ethic: Working values and values that work. New
York: AMACOM. Clark, A. (1997). Job satisfaction and gender: Why are women so happy at work? Labor
Economics 4, 341-372 Clark, A., Oswald, A., & Warr, P. (1996). Is job satisfaction U–shaped in age? Journal of
Occupational and Organizational Psychology, 69, 57-81. Colson, C. W., & Echered, J. M. (1991). Why America doesn’t work. Dallas: Word. Cook, J. D., Hepworth, S. J., Wall, T. D., & Warr, P. B. (1981). The experience of work.
New York: Academic Press. Crites, J. O. (1969). Vocational psychology. New York: McGraw-Hill. Crosby, R. K., & Petrosko, J. M. (1990). Teacher and student perceptions of work
attitudes in trade and industrial education. Journal of Industrial Teacher Education, 28(1), 41-51.
D’Addio C. A., Ericksson, T., & Frijters, P. (2004, January). An analysis of the
determinants of job satisfaction when individuals’ baseline satisfaction levels may
differ. Retrieved July 24, 2006, from http://www.eale.nl/conference
Dean, B., & West, R. (1999, November). Characteristics of viable and sustainable
workers for the year 2015. Paper presented at the annual meeting of the Mid- South Educational Research Association, Point Clear, AL. (ERIC Document reproduction Service No. ED435838)
DeLeon, J., & Borchers, R. (1998). High school graduate employment trends and the
115
skills graduates need to enter Texas manufacturing industries. Journal of Vocational and Technical Education, 15(1) 28-41.
Denka, A. (1994). Work ethic top job skill. CPA Journal, 64(9), 9-10. Dorfman, P. W., & Howell, J. P. (1988). Dimensions of national culture and effective
leadership patterns: Hofstede revisited. Advances in International Comparative Management, 3, 127-150.
Eby, L. T., Freeman, D.,M., Rush, M.,C., & Lance, C. E. (1999). Motivational bases of
affective organizational commitment: A partial test of an integrative theoretical model. Journal of Occupational and Organizational Psychology, 73, 463-483.
Edwards, J. R. (1991). Person job-fit: A conceptual integration, literature review, and
methodological critiques. In C. L. Cooper & I. T. Robertson (Eds.), International review of industrial and organizational psychology, 238-357. Chinchester, UK: Wiley.
Eisenberger, R., Jones, J. R., Stinglhamber, F., Shanock, L., & Randall, A. T. (2004) Flow experiences at work: For high need achievers alone? Journal of
Organizational Behavior, 26, 754-775. Retrieved July 27, 2006, from http://interscience.wiley.com
Elizur, D. I., Borg, I., Hunt, R., & Magyaribeck, I. (1991). The structure of work values:
A cross-cultural comparison. Journal of Organizational Behavior, 12, 21-38. Elkins, S. L. (2001). Expatriate Management Development, International Society for
Performance Improvement, 40(10), 6-8. Erez, M., & Earley, P. (1993). Culture, self-identify, and work. New York: Oxford
University Press.
116
Ezell, P. A., (2003) Job stress and turnover intentions among Tennessee cooperative
extension system employees (Doctoral dissertation, Library The University of Tennessee, Knoxville, 2003).
Fang, Y., & Baba, V. V. (1993). Stress and turnover intention: A comparative study
among nurses. International Journal of Comparative Sociology, 34(1-2), 24-38. Gay, L. R., & Airasian, P. (2000). Educational research: Competencies for analysis and application (6th ed.). Upper Saddle River, NJ: Prentice-Hall.
Gonzalez-Roma, V., Vaananen, A., Ripoll, P., Caballer, A., Peiro, J. M. & Kivimaki, M.
(2005). Psychological climate, sickness absence and gender. Psicothema, 17(1) 169-174.
Hackett, R. D., & Guion, R.,M. (1985). A reevaluation of the absenteeism-job
satisfaction relationship. Organizational Behavior and Human Decision Processes, 35, 340-381.
Hackman, J. R., & Oldham, G. R. (1975). Development of the Job Diagnostic Survey.
Journal of Applied Psychology, 60, 159-170.
Hackman, J. R., & Oldham, G. R. (1976). Motivation through the design of work: Test of
a theory. Organizational Behavior and Human Performance, 16, 250- 279. Hackman, J. R., & Oldham, G. R. (1980). Work redesign. Reading, MA: Addison-
Wesley.
Hatcher, T. (1993). The work ethic of apprentices and instructors in a trade union
apprenticeship training program. (Doctor of Philosophy dissertation,
University of Tennessee, Knoxville, 1992). UMI / Dissertation Abstracts.
117
Herzberg, F., Mausner, B., & Snyderman, B. B. (1959). The motivation to work (2nd ed.)
New York: John Wiley & Sons.
Herzberg, F., Mausner, B., Peterson, R. O., & Capwell, D. F. (1957). Job attitudes:
Review of research and opinion. Pittsburgh, PA: Psychological Services of
Pittsburgh.
Hill, R. B. (1992). The work ethic as determined by occupation, education, age,
gender, work experience and empowerment. (Doctoral dissertation, University of Tennessee, Knoxville, 1992). Dissertation Abstracts International, 23, 2343.
Hill, R. B. (1992, 1996). Historical context of the Work Ethic. Retrieved July 5,. 2006, from the University of Georgia College of Education Web site: http://www.coe. uga.edu/~hill/workethic.hist.htm
Hill, R. B. (1996). Work ethic differences in vocational education students and fulltime
employed workers. Journal of Vocational Education Research, 21(3), 13-29.
Hill, R. B., & Fouts, S. (2005). Work ethic and employment status: a study of
jobseekers: Journal of Industrial Teacher Education, 42(3). Hill, R. B., & Petty, G.C. (1995). A new look at employability skills: A factor analysis of
the occupational work ethic inventory: Journal of Vocational Education Research, 20(4), 59-71.
Hitt, W. D. (1990). Ethics and leadership: Putting theory into practice. Columbus: Battle
Memorial Institute. Hodgetts, R. M., & Luthans, F. (2000). International management: Cultures, strategy,
and behavior (4th ed.). New York: McGraw-Hill.
118
Hofstede, G. (1980). Culture’s consequences: International differences in work related
values. Beverly Hill: Sage Publications. Huit, W. (2004). Maslow’ hierarchy of needs. Educational Psychology Interactive.
Valdosta, GA: Valdosta State University. Retrieved July 28, 2006, from http://chiron.valdosta.edu/whuitt/col/regsys/msalow.html
Hulin , C. L., & Blood, M.R. (1968). Job enlargement, individual differences and worker
responses. Psychological Bulletin, 69, 41-55. Inkson, J. H. K. (1977). The man on the disassembly line: New Zealand freezing workers.
Australian and New Zealand Journal of Sociology, 13, 1-11. Ironson, G. H., Smith, P. C., Brannick, M. T., Gibson,W. M., & Paul, K. B. (1989).
Constitutions of a Job in General Scale: A comparison of global, composite, and specific measure. Journal of Applied Psychology, 74, 193-200.
Kaiser L. (2002, February). Job satisfaction: A comparison of standard, non-standard,
and self-employment patterns across Europe with a special note to the gender/job satisfaction paradox. EPAG Working Paper No.27, University of Essex. Retrieved from http://www.diaw.de
Kalleberg, A. L., & Loscocco, K. A. (1983). Aging, values and rewards: Explaining age
differences in job satisfaction. American Sociological Review, 48, 78-90. Kartha, C. P. (2004). A comparison of ISO 9000: 2000 quality system standards, QS-
9000, ISO/TS 16949 and Baldridge criteria. The TQM Magazine, 16(5) 331-340.
Kazanas, H. C. (1978). Affective work competencies for vocational education. Columbus,
Ohio: ERIC Clearinghouse on Vocational and Technical Education.
119
Kelly C., & Meyers, J. (1992). The cross-cultural adaptability inventory. Minneapolis:
NCS Assessments.
Kirkman, B. L., & Shapiro, D. L. (1997). The impact of cultural values on job
satisfaction and organizational commitment in self-managing work teams: The
mediating role of employee resistance. Academy of Management Journal, 22,
730-757.
Krejcie, R. V., & Morgan, D. W. (1970). Determining sample size for research activities.
Educational and Psychological Measurement, 30, 607-610. Koslowsky, M., Caspy, T., & Lazar, M. (1988). Are volunteers more committed than
non-volunteers? Journal of Applied Social Psychology, 18, 985-991. Kuchinke, P. K. (2000). The role of feedback in management training settings. Human
Resources Development Quarterly, 11(4), 381- 401.
Lau, C., & Ngo H. (2001). Organization development and firm performance: A
comparison of multinational and local firms. [Abstract in Questia.com]. Journal
of International Business Studies, 32.
Lazarus, R. S., & Folkman, S. (1984). Stress, appraisal, and coping. New York:
Springer. Levison, D. J. (1996). The season of a woman’s life. New York: Knopf. Lim, D. H. (2001). The effect of work experience and job position on international
learning transfer. International Journal of Vocational Education and Training, 9 (2), 59-74.
Lincoln, J. R., & Kalleberg, A .L. (1985). Work organization and workforce
commitment: A study of plants and employees in the U.S. and Japan. American Sociological Review, 50, 738-760.
120
Linowes, R. G. (2001). When cultural differences become management problems.
Intercultural Management Quarterly, 2(2), 6-7. Luthans, F., McCaul, H. S., & Dodd, N. G. (1985). Organizational commitment: A
comparison of American, Japanese and Korean employees. Academy of
Management Journal, 28, 213-219.
Mannheim, B. (1993). Gender and the effects of demographics, status and values on
work centrality. Work & Occupations, 20, 3-22.
Marsh, R. M., & Mannari, H. (1977). Organizational commitment and turnover: A prediction study. Administrative Science Quarterly, 22, 57-75.
Maslow, A. (1954). Motivation and Personality. New York: Harper. Mathieu, J. E., & Zajac, D. M. (1990). A review and meta-analysis of the antecedents,
correlates, and consequences or organizational commitment. Psychological Bulletin, 108, 171-194.
McCortney, A. I., & Engles, D. W. (2003). Revisiting the work ethic in America. The
Career Development Quarterly, 52(2), 132-140. McDonald, K., & Hite, L.M. (1999). HRD initiatives contributing to women’s career
progress. Performance Improvement, 38(9), 35-41. McGregor, D. M. (1960). The human side of enterprise, New York, McGraw Hill.
Mendenhall, M. E., & Stahl, G. K. (2000). Expatriate training and development:
Where do we go from here? Human Resource Management, 39, 251-265.
Merriam, S. B., & Caffarella, R. S. (1999) Learning in Adulthood, 2nd Ed. San
Francisco, CA: Jossey-Bass Publishers.
121
Michaels, C. E. (1983). Dimensionality of job satisfaction. Unpublished doctoral
dissertation, University of South Florida, Tampa. Michaels, C. E., & Spector, P. E. (1982). Causes of employee turnover: A test of the
Mobley, Griffeth, Hand, and Meglinon Model. Journal of Applied Psychology, 67, 53-59.
Miller, M. J., Woehr, D. J., & Hudspeth, N. (2002). The meaning and measurement of
work ethic: Construction and Initial Validation of a Multidimensional Inventory.
Journal of Vocational Behavior, 60, 451-489.
Miller, P., & Coady, W.T. (1986). Vocational ethics: Toward the development of an
enabling work ethic. (as cited in Allender, B. R., (1993) The occupational work
ethic of vocational students in east Tennessee (Doctoral dissertation, Library,
University of Tennessee, Knoxville, 1993).
Morrison, A., (1992). The new leaders: guidelines on leadership diversity in America.
San Francisco: Jossey Bass.
Mowday, R. T., Steers, R. M., & Porter, L. W. (1979). The measurement of
organizational commitment. Journal of Vocational Behavior, 14, 224-247.
Noe, R. A. (1998). Employee training and development. New York: Irwin McGraw Hill. Norusis, M.J. (1990). SPSS introductory statistics student guide. Chicago, IL: SPSS
Organ, D. W., & Konovsky, M. (1989). Cognitive versus affective determinants of
organizational citizenship behaviors. Journal of Applied Psychology, 74, 157-164.
Osman-Gani, A. M. (2000). Developing expatriates for the Asia-Pacific region: A
comparative analysis of multinational enterprise managers from five countries
across three continents. Human Resource Development Quarterly, 11, 213-235.
122
Ouchi, W. (1981). Theory Z. Reading, MA: Addison-Wesley Publishing Company.
Palich, L. E., Horn, P. W., & Griffeth, R. W. (1995). Managing in the international
context: Testing the cultural generality of sources of commitment to multinational
enterprises. Journal of Management, 21, 671-690.
Pearlman, K. (1997). Twenty first century measure for twenty first century work. In A.
Lesgold, M. Reur, & A. Black (Eds.), Transitions in work and learning (136-
179). Washington, DC: National Academy Press.
Petty, G. C. (1991a). Development of the Occupational Work Ethic Inventory.
Unpublished manuscript, University of Tennessee, Knoxville. Petty, G. C. (1991b, October). Technology education and the work ethic: Teaching the
forgotten competencies. Paper presented at the Southeastern Technology Education Conference, Blacksburg, VA.
Petty, G.C. (1993), Development of the occupational work ethic inventory. Paper
presented at the 1993 annual American Vocational Association meeting, Nashville, Tennessee.
Petty, G. C. (1995). Adults in the work force and the occupational work ethic. Journal of
Studies in Technical Careers, 25(3), 122-140.
Petty, G. C. (1995d). Vocational-technical education and the occupational work ethic.
Journal of Industrial Teacher Education, 32(3), 45-48. Petty, G. C., & Hill, R. B. (1994). Are men and women different? A study of the
occupational work ethic. Journal of Vocational Education Research, 19(1), 71-89.
Petty, G. C., & Hill, R. B. (2005). Work ethic: Characteristics perceived work ethics of supervisors and workers. Journal of Industrial Teacher Education, 42(2) 5-20.
123
Petty, G. C., & Morgan, K. R. (1980). Teaching strategies to facilitate students
acquisition of affective work competencies (Project No. 80-131-600-7). Columbus, MO: University of Missouri-Columbia, Department of Education.
Pfau, B., & Kay, I. (2002). The human capital edge; 21 people management practices
your company must implement (or avoid) to maximize share holder value. New York: McGraw Hill.
Roznowski, M. (1989). Examination of measurement properties of the job descriptive
index with experimental items. Journal of Applied Psychology, 74, 805-814. Russell, S. S., Spitzmuller, C., Lin, L. F., Stanton, J. M., Smith, P. C., & Ironson, G. H.
(2004). Shorter can also be better: The abridged job in general scale. Educational Psychological Measurement, 64, 878-893.
Salkind, N. J., (1997). Exploring research. Upper Saddle River, NJ : Prentice Hall
Schauboeck, J., Ganster, D. C., & Kemmerer, B. E. (1994). Job complexity, type “A”
behaviors, and cardiovascular disorder: A prospective study. Academy of Management Journal, 37, 426-439.
Schmitt, N., Coyle, B. W., White, J. K. & Rauschenberger, J. (1978). Background needs,
job perceptions, and job satisfaction: A causal model. Personnel Psychology, 31, 889-901.
Schriesheim, C. A., Powers, K. J., Scandura, T. A., Gardiner, C. C., & Landau, M. J.
(1993). Improving construct measurement in management research: Comments and a quantitative approach for assessing the theoretical content adequacy of paper and pencil survey type instruments. Journal of Management, 19, 385-417.
124
Scott, M., Swortzel, K. A., & Taylor, W. N. (2005) The relationship between selected
demographic factors and the level of job satisfaction of extension agents. Journal of Southern Agricultural Research 55 (1), 102-115.
Selmer, J. (2000). A quantitative needs assessment technique for cross-cultural work
adjustment training. Human Resources Development Quarterly, 11(3), 269-280.
Sloane, P., & Williams, H. (2000). Job satisfaction, comparison earnings and gender.
Labor 14, 473-501.
Smith, P. C., Kendall, L. M., & Hulin, C. L. (1969). Measurement of satisfaction in work
and retirement. Chicago: Rand McNally. Sommer, S. M., Bae, S., & Luthans, F. (1996). Organizational commitment across
cultures: The impact of antecedents on Korean employees. Human Relations, 49, 977-993.
Sousa-Poza, A., & Sousa-Poza, A. A. (2000). Well being at work: a cross-national
analysis of the levels and determinants of job satisfaction. Journal of Socio- Economics, 2, 517-538.
Spector, P. E. (1985). Measurement of human service staff satisfaction: Development of
the job satisfaction survey. American Journal of Community Psychology, 13 (5). 693-713. Retrieved February 2, 2006, from http://chuma.cas.usf.edu/~spector/ Scales/jssovr.html
Spector, P. E. (1997). Job satisfaction: Application, assessment, causes, and
consequences. Thousand Oaks, CA: Sage. Spector, P. E., & Michaels, C. E. (1983). Personality and turnover: The role of locus of
control in the employee withdrawal process. Manuscript submitted for
125
publication.
Spector, P. E., & O’Connell, B. J. (1994).The contribution of personality traits, negative
affectivity, locus of control and Type A to the subsequent reports of job stressors and job strains. Journal of Occupational and Organizational Psychology, 67, 1- 11.
Stanton, J. M., Sinar, E. F., Balzer, W. K., & Smith, P. C. (2002). Issues and strategies
for reducing the length of self-report scales. Personnel Psychology, 55(1), 167- 193.
Staw, B. M., Bell, N. E., & Clausen, J. A. (1986). The dispositional approach to job
attitudes. A lifetime longitudinal test. Administrative Science Quarterly, 31, 56- 77.
Steers, R. M. (1988). Organizational behavior. Glenview, IL: Scot, Foresman. Stogdill, R. M. (1963). Manual for the Leader Behavior Description Questionnaire form
XII. Columbus: Ohio University. Super, D. E., Savickas, M. L., & Super, C. M. (1996). The life span, life-space approach
to careers. In D. Brown, L. Brooks, & Associates (Eds.), Career choice and development (3rd ed., pp. 121-178). San Francisco: Jossey-Bass.
Tamhane, A.C., & Dunlop, D.D. (2000). Statistics and Data Analysis from Elementary to Intermediate. Upper Saddle River, NJ: Prentice Hall. Tovey, J. (1997). Addressing issues of cultural diversity in business communication.
Business Communication Quarterly, 60(1), 19-31. Turner, A. N., & Lawrence, P. R. (1965). Industrial jobs and the worker. Boston:
Harvard Graduate School of Business Administration.
126
Useem, R. (2001). Third culture kids: Focus of major study [online]. International
Schools services. Retrieved July 28, 2006, from www.iss.edu/pages/kids.html Verreault, D. A., & Hyland, M. (2005) Evidence for increasing the focus on strategic risk
in HRM audits. Managerial Auditing Journal, 20 (5) 524-543. Viswesvaran, C., & Ones, D. S. (1995). Theory testing: Combining psychometric meta-
analysis and structural equations modeling. Personnel Psychology, 48, 865-885. Wang, X. J., & Elkins, S. L. (2002). Approaches and Tools for Training Expatriates.
International Journal of Vocational Education and Training, 10(1) 73-84. Wayne, F., & Chapman, P. (1992). The need to incorporate the work ethic and ethics into
business education curricula. In A. Burford, The hidden curriculum (pp 127-144). Reston, VA: National Business Education Association.
Weber, M. (2002) The protestant ethic and the spirit of capitalism. (S. Kalberg,
Trans.) 3rd Ed.., Los Angles CA: Roxbury. (Original work published in 1905). Weiss, D. J., Dawis, R. V., England, G. W., & Lofquist, L. H. (1967). Manual for the
Minnesota Satisfaction Questionnaire. Industrial Relations Center, University of Minnesota.
Westwood, R. I. (1992). Culture, cultural differences, and organizational behavior. In
Westwood, R. I. (Ed.), Organisational behavior: Southeast Asian perspectives (pp. 27-62). Hong Kong: Longman.
Williams, L. J., Gavin, M .B., & Williams, M. L. (1996). Measurement and non-
measurement processes with negative affectivity and employee attitudes. Journal of Applied Psychology, 81, 88-101.
Williams, S., & Sandler, R. L. (1995). Work values and attitudes: Protestant and
127
Confucian ethics as predictors of satisfaction and commitment. Research and Practice in Human Resource Management, 3(1), 1-13.
Woodruffe, C. (1999). Winning the talent war: A strategic approach to attracting,
developing and retaining the best people. Chichester, UK: John Wiley & Sons. Wright, P. C., & Nasierowski, W. (1994). The expatriate family firm and cross-cultural
management training: A conceptual framework. Human Resource Development Quarterly 5, 153-167.
Yiu, L., & Saner, R. (2000). Determining the impact of cognitive styles on the
effectiveness of global managers: Propositions for further research. Human Resources Development Quarterly, 11(3), 319-324.
Young, J. L. (1986). What competencies do employees really need? A review of three
studies. Journal of Career Development, 12(3), 240-249. Zalcman, T. (2001). A strategic role for IHR professionals. Intercultural Management Quarterly. 2(2) 1-5.
128
APPENDICES
129
130
Appendix A
Informed Consent Statement
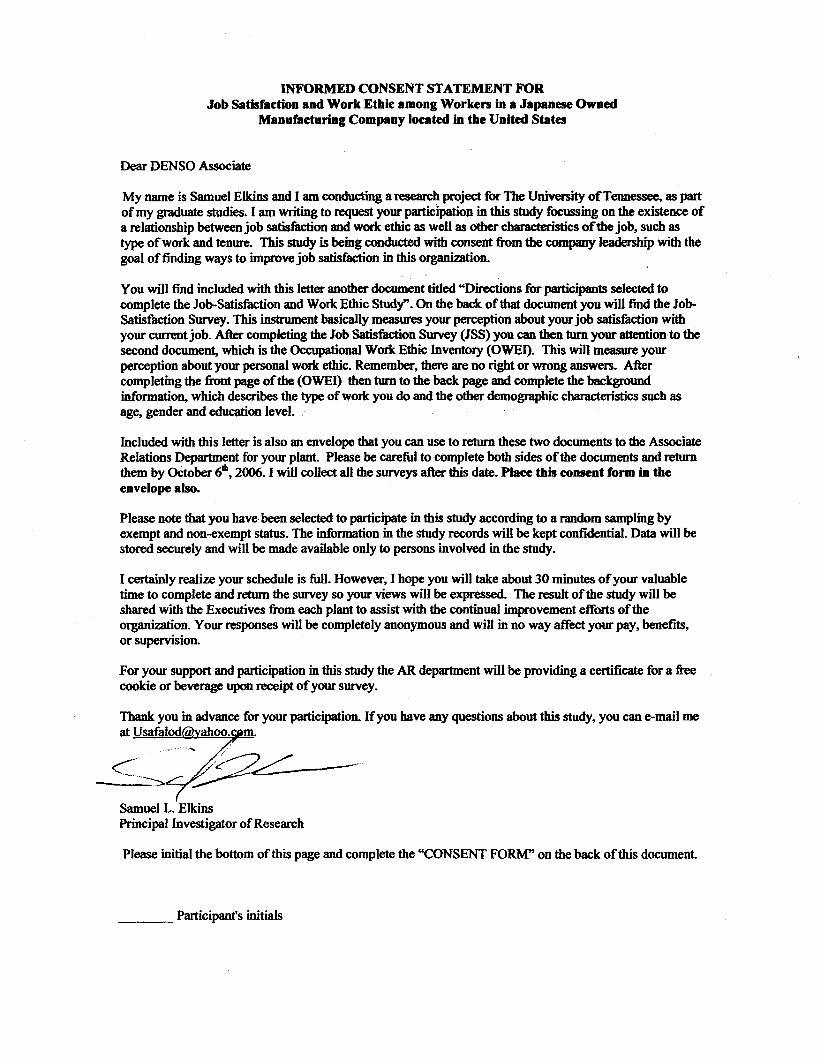
133
Appendix B
Job Satisfaction Survey
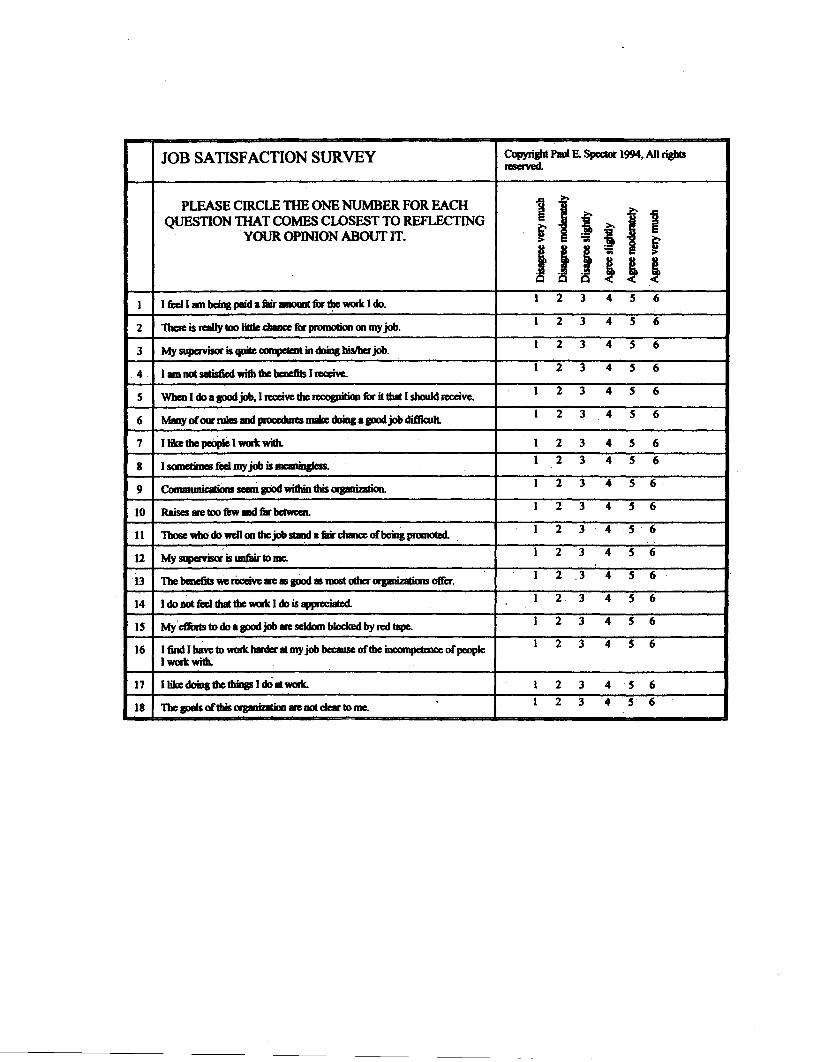
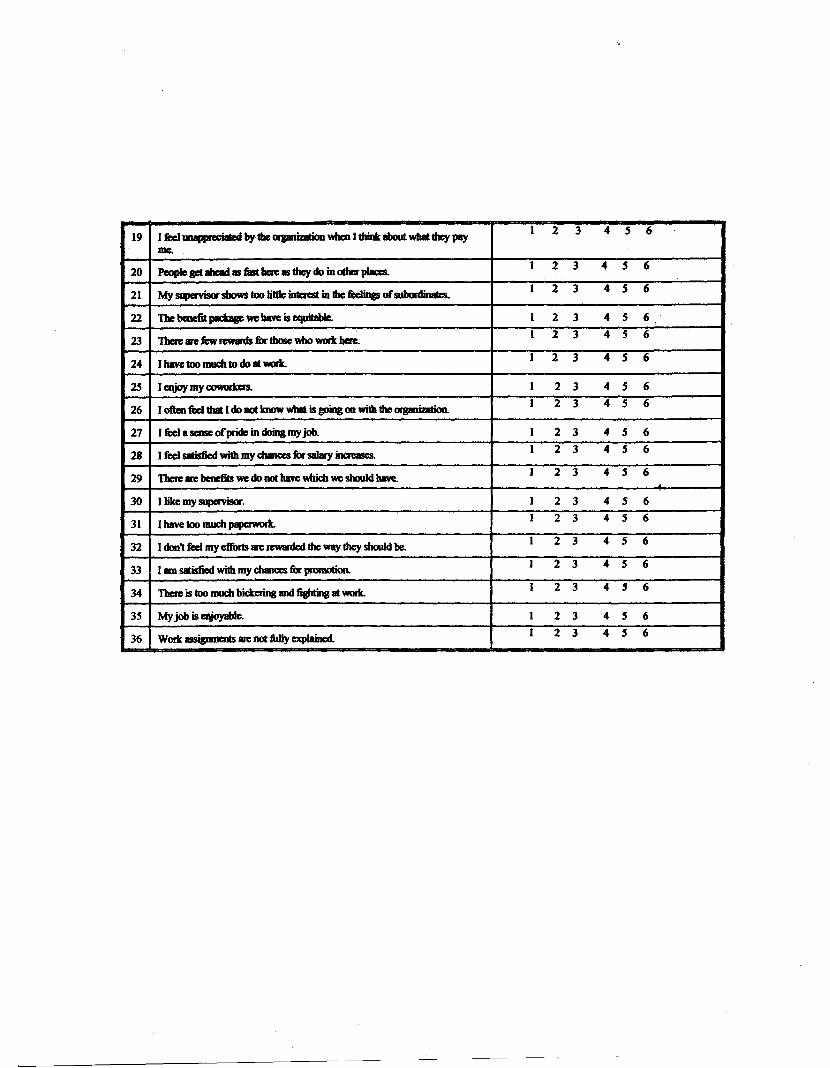
136
Appendix C
Occupational Work Ethic Inventory
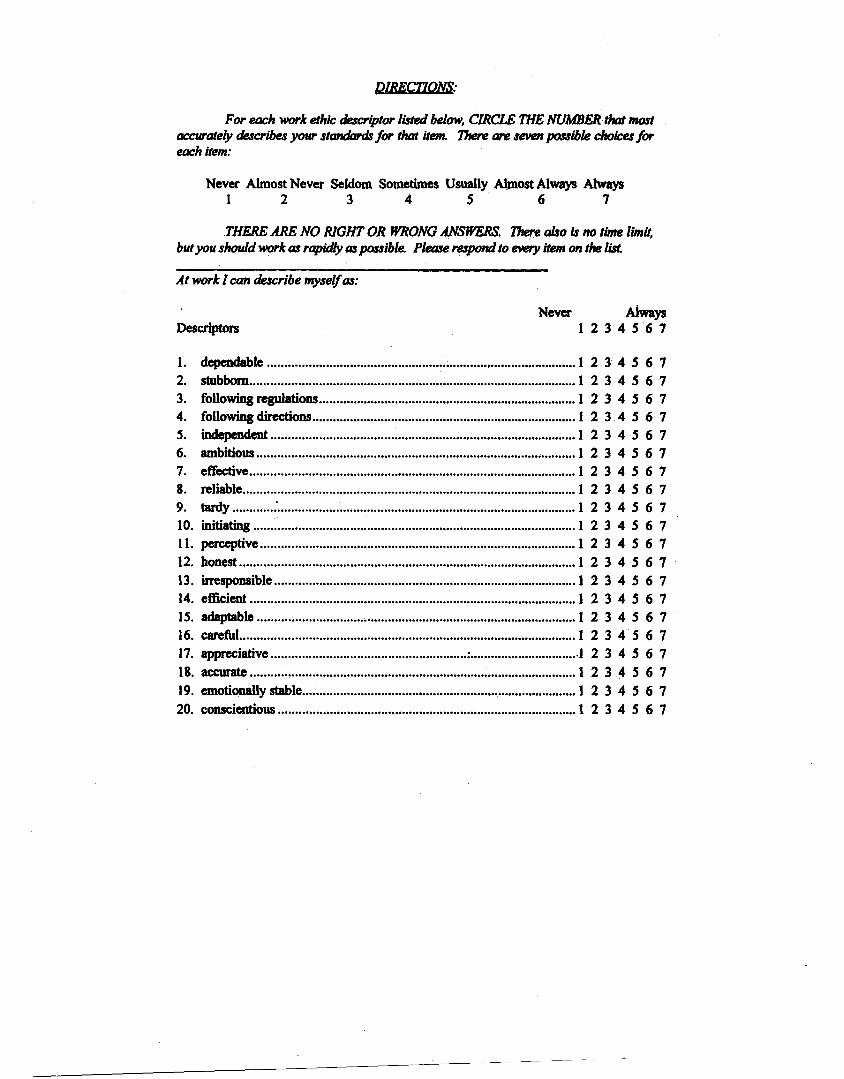
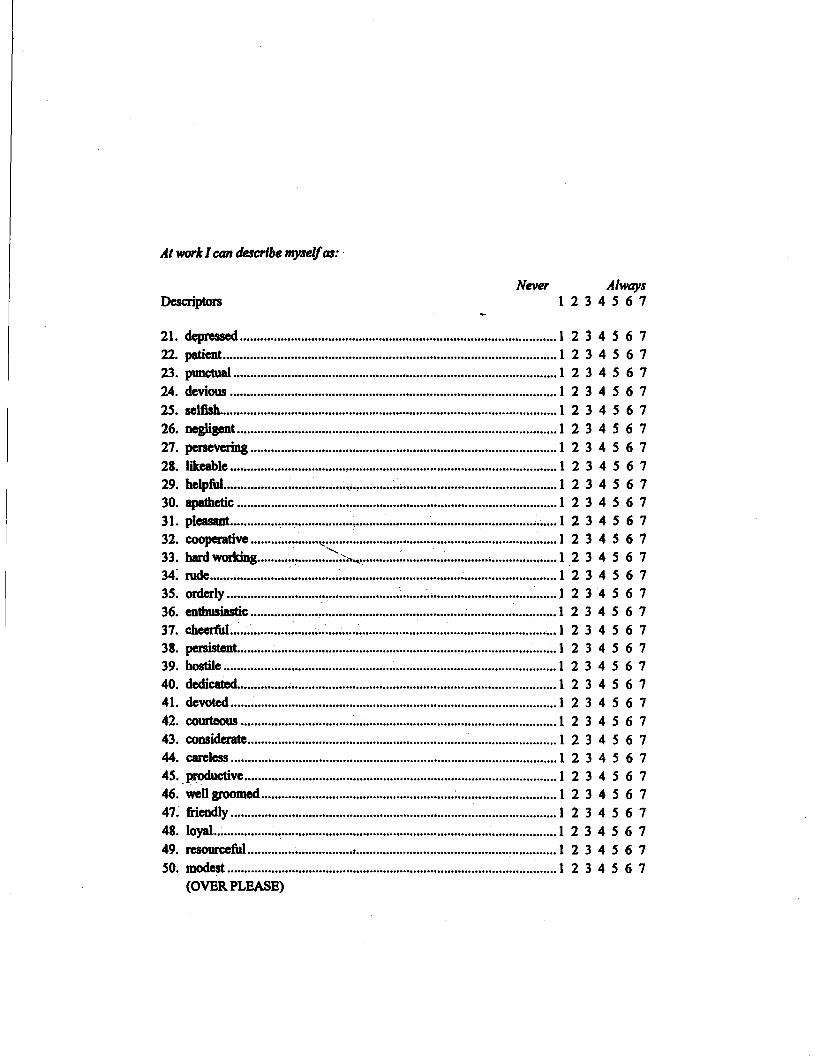
139
Appendix D
Participant Questionnaire
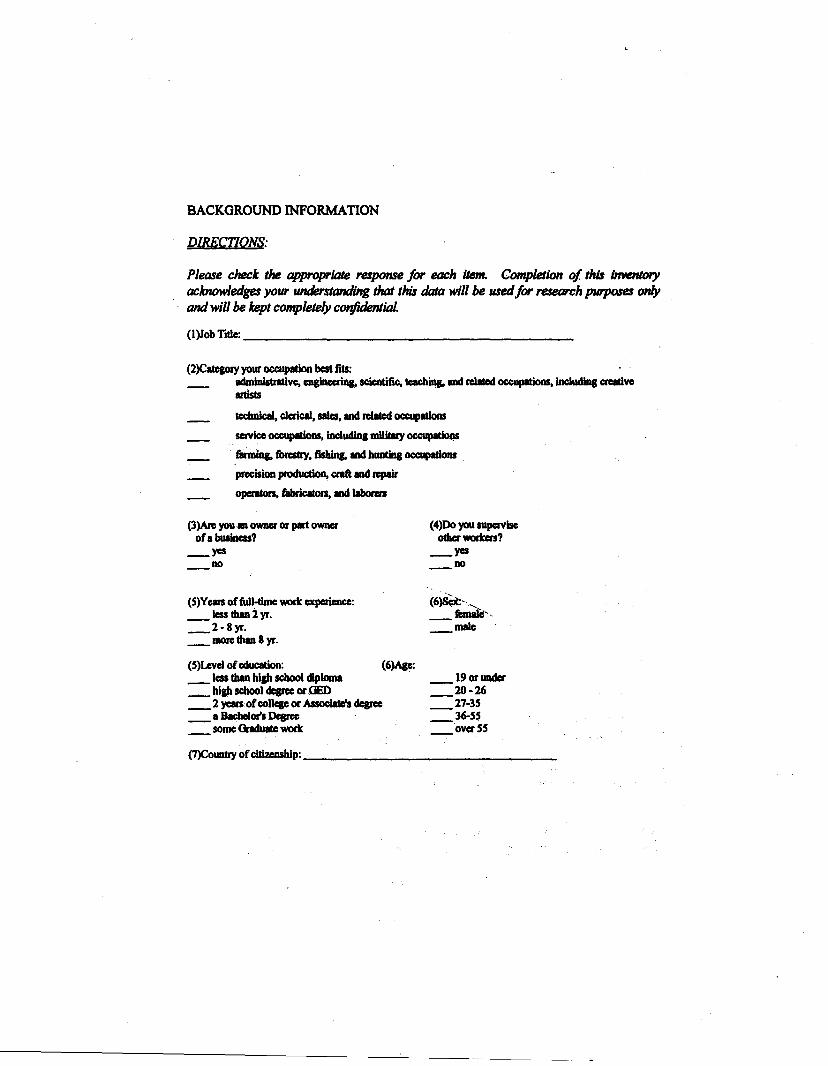
142
Appendix E
Directions for Completing JSS and OWEI
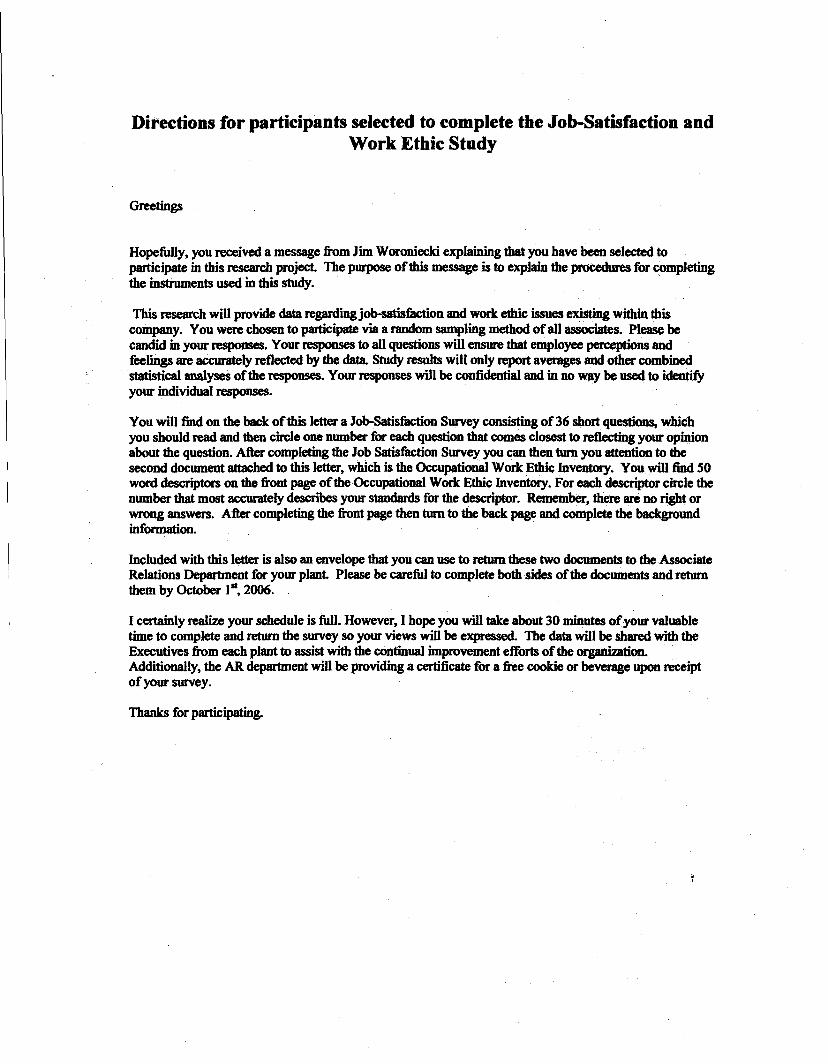

144
Appendix F
Letter of Permission
146
Appendix G
Notice to Non-Respondents
148
VITA
Samuel Elkins has lived in Maryville, Tennessee since 991. He is married to the
former Elizabeth Ann Hart. He has two sons, Joshua and Caleb.
Sam attended the University of South Carolina where he received a Bachelor’s
Degree in Criminal Justice. He earned a Master’s Degree in Educational Administration
and Supervision from Lincoln Memorial University. Currently, he is a Ph.D. Candidate at
the University of Tennessee.
His professional career has included 14 years in the area of managing human
resources development programs in both governmental and public sector jobs. He is also
a Lieutenant Colonel in the Air Force Reserve. In both the military and civilian sectors,
his work assignments have included Director of Recruiting, Staff Officer, Commander,
Curriculum Developer, Faculty Advisor, Instructor, and Quality Improvement
Consultant.
Among his credentials is a “Six Sigma, Black Belt” Certification from the College
of Business Administration of the University of Tennessee. He is also a TS-16949 Lead
Auditor and a Certified Meeting Facilitator. These skills have allowed him to conduct
over 1,000 hours of training in areas such as Statistical Process Control, experimental
Design, Quality Improvement, and Production Management techniques.
As part of his scholarly pursuits he has written and received three separate grants
totaling over $500,000 from the Department of Labor and the Department of Community
and Economic Development. He has also been published in three different journals: The
Human Resource Development Quarterly (2003), International Journal of Vocational
Education and Training (2002), and Performance Improvement Journal (2001).