Embed Size (px)
Citation preview


ALFRED P. SLOAN SCHOOL OF MANAGEMENT
JOB -SHOP SCHEDULING IN TEXTILEMANUFACTURIN(
A STUDY OF DECISION MAKING
Paper Number 163 - 66
ERNEST G. HURST JR. and AIDAN B. MC NAMARA
MASSACHUSETTSINSTITUTE OF TECHNOLOGY
50 MEMORIAL DRIVE
CAMBRIDGE, MASSACHUSETTS 02139

JOB -SHOP SCHEDULING IN TEXTILE MANUFACTURING
A STUDY OF DECISION MAKING
Paper Number 163 - 66
ERNEST G. HURST JR. and AIDAN B. MC NAMARA
This paper was originally presented at the 36th Annual Meeting of
the Textile Research Institute, New York City, March 30 , 1966.
It is not to be cited, quoted, or reproduced prior to publication.

1. T. LIBKAKlES
ABSTRACT
The scheduling procedure of a particular production planner in
a woolen nnill is investigated, A model is developed which attempts
to describe the planner's average behavior. Schedules are
generated by this model and are compared with the corresponding
schedules of the planner. Discrepancies between the planner's and the
model's schedules are interpreted with respect to both the adequacy
of the nnodel and the consistency of the planner. Suggestions are
made for application of the technique to real-time scheduling.

INTRODUCTION: The operation of planning production and of deciding
on production schedules in manufacturing is one which the management
of manufacturing organizations regards and accepts as being a part of
its everyday and continuing responsibility. The ability of a company to
deliver to its customers goods of acceptable quality on a specified date
is held to be a prerequisite of doing business in a competitive situation
and the resources of manufacturing companies are directed towards
fulfilling this requirement. Among the various nnanufacturing industries
a great diversity of techniques has evolved and been devised to control
the flow of goods through the plant. In general, these variations in
production technique reflect the character of individual industries or of
individual companies within one industry; the nature of the products they
produce; and the market situation which they face.
The involvement of company management on a day-to-day basis in
the production scheduling process and the importance it attributes to its
function in this regard is reflected in the extensive coverage of the topic
in the management literature. The production scheduling problem has
attracted the attention and has engaged the interest of many
investigators in this field and very many studies of the topic have been
reported. The early work on the subject was frequently concerned with
finding exact or optimal solutions to simplified versions of the problems
being investigated. More recent studies have attempted to discover

approximate methods for solving real, full-scale problems which have
proved to be insoluble by exact methods even with the aid of high speed
computers. These latter developments have recently been discussed
by Carroll [2] in a comprehensive review which provides a particularly
appropriate context for the investigation reported here.
A typical job-shop production scheduling problem was investigated
in the present study. The simplest statement of the problem with
which the job-shop scheduling decision is involved is as follows: given
a plant where the number of machines engaged on different stages of
the process is fixed and given a job file of firm orders where each
order has an associated due delivery date; then in what sequence or on
which machines should each order be processed to satisfy somie
performance criterion. This statement describes the job-shop
scheduling decision problem in a general manufacturing context. The
purpose of the study reported here was to consider the question with
regard to the unique character of wool textile manufacture.
The study was concerned specifically with the problem of scheduling
production in a mill producing good quality woolen fabrics for the ladies
dress trade. This is a fashion-sensitive segment of the textile market
where goods are manufactured to order rather than for inventory and
where production lots are typically small. By virtue of the market
situation, an individual mill is obliged to carry very many fabric styles

in the course of a single season. In such a context, the planning of raw
material requirements; the control of in-process inventory; the
preservation of production flexibility; and the requirement of meeting
due delivery dates, all of which bear on the production scheduling
decision under consideration, require particular attention.
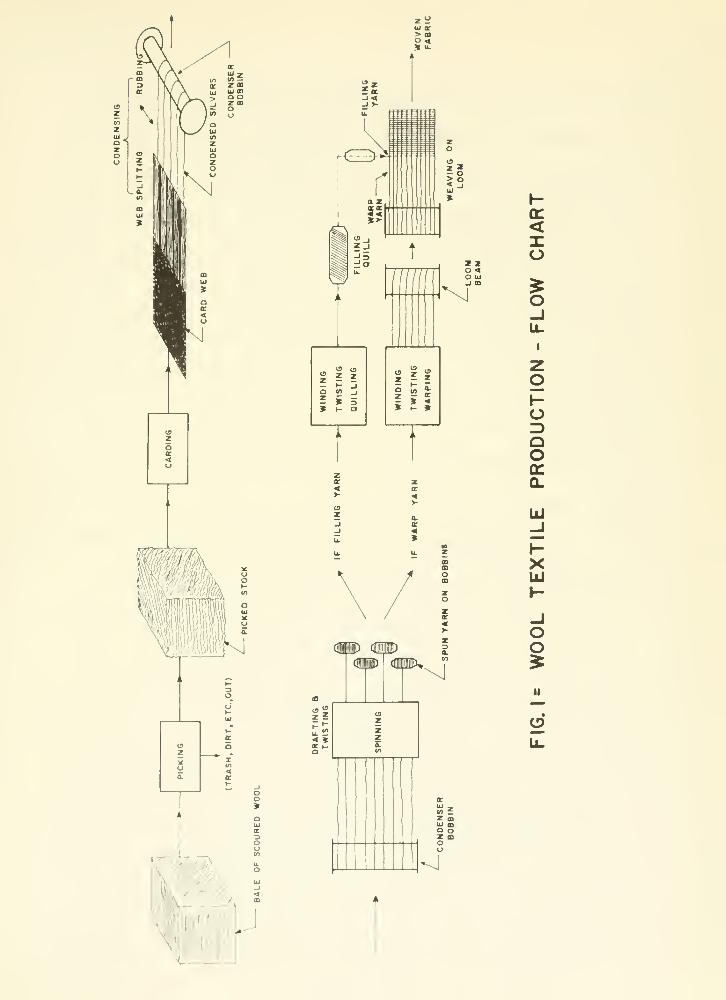
From a scheduling point of view, wool textile manufacture is regarded
as a batch process in which more than one operation is performed on
material from each batch, but in which the sequence of operations on
material from successive batches is determined. The sequence of key
operations in a typical wool textile process is shown schematically in
Figure 1. The raw wool (or stock) as received at the mill is first washed
(or scoured) and is then submitted to a picking operation to break up
entanglements and remove any remaining dirt, trash, etc. The picked
stock is then put through a carding operation to further subdivide the
groups of fibers, produce a homogeneous mix and convert from a three-
dimensional bale to a continuous, two-dimensional, thin web of fibers.
This web is then split longitudinally into thin, continuous, one
dimensional strands (or slivers) which are given a transverse,
reciprocating rub to give the cohesion necessary to wind them onto a
wide bobbin. This bobbin (the condenser bobbin) is next transferred to
the input end of the spinning frame on which the slivers are drawn our
(or drafted) to a weight per unit length (or count) appropriate to the yarn

>so-
\
is< Ju
t

4
being produced and are also twisted to give them a strength sufficient
to withstand the tensions which they will experience in later operations.
The output from the spinning operation is designated as yarn and each
spun yarn is wound onto a separate bobbin. The processes to which a
particular yarn is subjected following spinning depend on whether it is
destined for use as warp yarn (longitudinal) or filling yarn (transverse)
in the woven fabric. Warp yarns are wound onto a large drum (or beam)
which supplies a "sheet" of yarns to the loom. Filling yarns are wound
onto a small bobbin (or quill) which in the loom is carried by the shuttle
across the full width of the sheet of warp yarns interlacing with each
of the warp elements in a pattern dictated by the fabric design. In this
manner the two-dimensional woven fabric is produced.
The machinery used to handle these fibers and yarns is somewhat
cumbersome and before a new lot of material is processed extensive
cleaning and readjustment of the equipment is required. Thus,
characteristically, a long stoppage time or down time is involved in
changing over from one batch of material to the next. For this reason,
a desirable objective in scheduling production is to effect a smooth
batch-to-batch transition while recognizing the cost considerations
involved and the need to meet due date requirements for each batch.
Scheduling of production in the mill under investigation is done by a
production planner who draws up a schedule for the plant each week.

Although orders for goods are being received by the mill each day, the
planner assumes a fixed job file on the day on which the schedule is
prepared. He plans a week's production on the basis of this file and any
orders which he receives within the week thus planned, but subsequent
to preparing his schedule, are considered when the following week's
schedule is being drawn up.
In this mill the planner prepares a formal carding schedule, copies
of which are distributed to key points in the production line. The flow
of goods through the other stages of the process (picking, spinning,
twisting, winding, weaving, etc. ) is dictated by the card schedule and
the operations other than carding are not formally scheduled. Once the
weekly card schedule is prepared, the planner devotes a major portion
of his time to implementing this schedule with respect to these other
operations.
In general, the scheduling procedure devised by this particular
production planner is very satisfactory. Due dates on finished piece
goods are invariably met; the quality of the goods produced is excellent;
little overtime working is required and scheduling efficiency, as measured
qualitatively by in-process inventory, is high. This describes the
context in which the investigation was conducted. In the following
sections we shall describe the specific approach which was taken in
studying the problem.

OPTIMAL, SATISFACTORY AND CONSISTENT DECISION MAKING: As
has been suggested earlier, many scheduling decision studies reported
in the literature have been concerned with finding an optimal solution to
the problem (See for example Manne [5], Smith [8] ). In the present
case, the generation of an optimum schedule for a set of jobs on a group
of machines resolves to the problem of choosing among alternatives,
where each alternative represents a set of job-machine combinations.
For any real problem the number of possible job-machine alternatives
will be very large. If now some criterion of comparative efficiency
annong alternatives can be obtained and if the functional relationship of
this criterion to the relevant characteristics of each job-machine
combination can be determined; then that alternative is optimal which is
preferred in terms of this criterion to all other alternatives.
This optimization procedure appears to be straightforward in principle
but serious difficulties arise when one attempts to apply it in practice.
Firstly, the size of real problems renders them inherently complex from
a practical point of view. However, this very aspect of size which makes
an optimal solution elusive frequently provides an abundance of acceptable
solutions. Among the very many alternate possibilities there are
generally a sizeable number which provide efficiencies close to the
optimum or which at least provide acceptable solutions to real problems.
Furthermore, these acceptable solutions are in general also more


accessible.
March and Simon [6] suggest that "most hunnan decision making,
whether individual or organizational, is concerned with the discovery
and selection of satisfactory alternatives; only in exceptional cases is
it concerned with the discovery and selection of optimal alternatives.
To optimize requires processes several orders of magnitude more
complex than those required to satisfice (sic). An example is the
difference between searching a haystack to find the sharpest needle in
it, and searching the haystack to find a needle sharp enough to sew
1
with".
Having accepted the desirability of seeking out satisfactory
solutions, Simon and his co-workers further assert that the discovery
of such solutions is at the present time most efficiently done by human
decision makers. Simon [7] proposes "several conceivable ways in
which the limitations of the new approaches to programmed decision
making might be transcended. One of these would be to discover how
to increase substantially the problem -solving capabilities of humans in
nonprogrammed situations. Another way would be to discover how to
use computers to aid humans in problenn solving without first reducing
the problems to mathematical or numerical form. Both of these
possibilities hinge on our deepening our understanding of human
2
problem- solving processes".


This acknowledgement of the decision making skills of human
managers has prompted several workers to investigate the structure
of human decision rules by naodeling the decision process of a
particular manager in detail. In an extensive study of this kind
Clarkson [3] has constructed a model which simulates the decision
making process of a trust investment officer. Having distilled the
behavior patterns of the trust officer while the latter was choosing
several portfolios and having incorporated these patterns in the
simulation, Clarkson then uses the model to select portfolios. His
choices via the model are in remarkably good agreement with those
portfolios selected by the officer. Statistical tests of the selected
portfolios against a selection chosen at random provide highly
significant indications that the trust officer's behavior has been
duplicated. Furthermore, examination of the detailed procedure of
selecting portfolios establishes that the decision process itself is
duplicated in the simulation.
No attempt is made in Clarkson' s study to compare the relative
efficiencies of the model and of the trust officer in terms of some
objective criterion; the goodness of fit between the nnodel's prediction
and the trust officer's practice is accepted as an appropriate yardstick
of performance. In fact, an objective function was not required for the
purposes of this study, which attempted only to describe the trust

officer's behavior. To prescribe behavior, as is required of an optimal
solution, it is necessary to propose an objective function in terms of
which a comparison can be made among alternatives.
The appropriate objective function is not always readily obtained.
This is a further difficulty which must be faced in seeking optimal
solutions. It may be that no simple criterion (such as a minimum
percentage of late deliveries or a minimum completion time) is suitable
in the particular situation and moreover a simple combination of
objectives may not be appropriate. Even if some criterion is
recognizable, its relationship to a particular process may not be easily
separable from the larger context in which the decision situation is
embedded. For example, for a given production line in a plant within
a larger company it may not be possible to select that criterion which
when applied to the scheduling decision on that line ranks the
alternatives in an order which reflects their economic desirability to
the company as a whole. The difficulty is that of defining such intangible
costs as run-out and delay penalties. With respect to these costs,
assumptions must frequently be made on an intuitive basis and the
validity or invalidity of these assumptions can have a very significant
influence on the outcome.
Bowman [1] proposes a method of investigation which circumvents
this difficulty. He recognizes that the method "is pragmatic rather than

10
Utopian in that it offers one way of starting with the nnanager's actual
3
decisions and building on them to reach a better system, " Bowman
submits that experienced managers in an actual decision situation are
aware of and sensitive to the criteria and the variables which affect
their performance. They are also sensitive to the implicit values of
the parameters which relate the variables to the decision consequences.
The problem is that in operating intuitively they relate the variables to
the criteria imperfectly. They tend on occasions to overrespond to
certain stimuli which is reflected in their inconsistency when faced with
comparable decisions at different points in time. Bowman therefore
suggests that the average decision performance of experienced
managers is close to the optimum but that they are erratic about this
mean. Assuming that the criteria surface in the region of the optimum
is rather flat, a slight bias in their judgements is not particularly
harmful. Erratic decisions on the other hand may prove considerably
more expensive by placing the particular decision point on the curved
portion of the criteria surface.
To take advantage of the experienced manager's grasp of the
overall context while not being comnnitted to the erratic nature of his
particular decisions, Bowman proposes the derivation of decision rules
from the average behavior of the manager. He studied various
decision contexts, having assumed a structure for his decision rule


11
with the appropriate variables incorporated. This decision rule was
investigated relative to actual performance using an assumed objective
function. A comparison between the economic consequences of actual
decisions made by a manager and those decisions made using a rule
based on the manager's average behavior over the sanne time period
revealed that with one exception the decision rule provided a better
performance than the manager's aggregate behavior.
The study reported in the present paper presents a technique which
is in a sense a marriage of the Clarkson and Bowman approaches, A
rather simple decision function is derived which is in fact a priority
rule for sequencing jobs on machines. This function is fit to the
manager's actual behavior as represented by scheduling information
generated by him over a six month tinne period. However, the
independent variables in the decision rule and the heuristic with which
the priority function is applied are derived from qualitative verbal
interaction with the manager during the course of the investigation.
In describing the manager's behavior simplifications are made in the
interests of averaging rather than duplicating his behavior. However,
the heuristic is faithful in a simple way to the procedures he adopted
when planning his schedules.
No specific economic criterion is used to compare the manager's
decisions in this case with those proposed by the model, as no such

12
criterion was available. In its place, the discrepancies between the
manager's practice and the model's predictions are discussed in
detail with a view to evaluating the procedure and its assumptions.
MODELING THE PRODUCTION PLANNER'S AVERAGE BEHAVIOR:
Five phases can be distinguished in the development of the scheduling
decision model:
1. Structuring the planner's decision process.
2. Determining the variables which enter into this decision
process.
3. Relating the dependent variable(s) of the decision process
to the independent variables in a functional form.
4. Fitting this function to the planner's actual behavior thus
evaluating the weighting coefficients of the decision
variables
.
5. Validation and refinement of the model.
The five phases of this development proceeded more or less
simultaneously. For example, the functional form of the decision
rule was not selected independently of the structure in which it was
embedded, nor were the relevant variables selected without regard to
both the decision function and its structure. However, for obvious
reasons the phases of developnnent are reported sequentially.

13
1. THE DECISION STRUCTURE:
In deciding on both the decision structure and the decision
variables which influenced the planner's decision behavior, it was
necessary to obtain information from conversations with him and from
close inspection of his card schedules as to why he scheduled particular
batches of material in a given sequence and on particular machines.
Thus, the early stages of the study involved extensive discussions with
the production planner on the scheduling process; detailed examination
of his card schedules while they were being prepared and subsequently;
and continual probing by the study group to discover the reasoning
behind specific decisions.
Considering the complex nature of human decision making it
seems unlikely that preliminary investigation of this type will reveal
all the pertinent parameters which influence the planner's decision
process. The planner himself will undoubtedly be unaware of all the
factors which influenced his behavior at the point of decision and his
response to requests for justification of his procedures might variously
be cautious, defensive or even erratic.
The purpose of this prelinninary inquisition was to establish the
major determinants of the planner's decisions. If rules or variables
other than those brought to light by discussion proved to be significant,
it was felt that these would be revealed by the validation phase of the

14
study. Discrepancies between the model's predictions and the planner's
practice determined by validation would provide the basis for further
diagnosis and discussion with the planner. The nnodel could then be
refined by feedback fronn that phase.
It was quickly established that the planner responded to different
scheduling situations in somewhat different ways depending on the
values of the independent factors in the decision. However, in spite
of slight variations observed two main modes of decision making were
distinguished:
First Decision Mode: In this mode the planner inspects his
job file per se without reference to the machine openings occuring in
the week under consideration and selects a job which ought to be
scheduled in that week on the basis of due date and process time. From
among the machine openings which occur during the week under
consideration an appropriate match is made with the selected job. Thus,
in this nnode a machine is chosen for a selected job.
Second Decision Mode: In this mode the planner examines the
schedule and recognizes the next available machine opening. From
among the jobs on the job file an appropriate selection is made to fill the
available machine opening. Thus, in this mode a job is chosen for a
selected machine opening.
From observation of the production planner when drafting his

15
schedule and from subsequent discussions with him, it was evident
that he actually operated with some combination of these decision modes.
He preselected some jobs from the file which he considered ought to be
scheduled without explicit reference to compatibility; he attempted to
get the best job-nriachine fit for the jobs so selected; he proceeded to
identify remaining machine openings scanning the other jobs on his file
for suitable jobs for these openings; and he then repeated the cycle where
necessary.
The possibility of modeling this observed scheduling behavior in
detail was considered during the study and was rejected. The main
reason for its rejection was the apparent complexity of the criterion by
which the planner selected the proper decision mode for the next decision
in sequence. Even if the choice of mode was based simply on the
magnitude (in days) of due date less process time, this would involve
the concept of a cut-off point on the planner's job file above which all
jobs must be scheduled and below which jobs from the file would only be
scheduled, depending both on their urgency and their compatibility with
any machine openings remaining. The planner was not aware of any
such dividing line in his procedure; the cut-off point established by his
schedules varied between wide limits; and the selection of an average
or upper limit for the division would have had to be done on an
arbitrary basis not necessarily related to his criteria. Moreover, it

16
was difficult to establish that the production planner's preselection of
jobs from the file did not relate in some way to his machine
configuration, as he was familiar with the state of his machines when
drafting his schedules. It even appeared that the planner's choice of
decision mode in particular instances depended on what jobs had
already been scheduled. For example, if the warp yarn for a particular
fabric was completed this placed an urgency on completion of the
complementary filling yarn. This question will be discussed in more
detail in a later section.
All the foregoing considerations imply that a very complex
criterion would need to be established to represent the planner's
selection of particular decision modes. Because of the desire to
utilize a simple decision rule, at least for the initial cycle of the
model, the study group decided to base the quantitative analysis and
the scheduling heuristic on one decision mode or the other rather than
on a complex combination of the two. The choice bet'ween the two was
influenced by the form of the data as is discussed in a later section.
In the following sections the choice of the decision variables and of
the priority function are discussed.
2. THE DECISION VARIABLES:
The relevant decision variables established in the preliminary
discussions with the production planner are as follows;

17
(a) Slack Time: The slack time measure is defined as:
Slack Time = Due Date for the Condensed Slivers — Process
Time for Carding — Date on which a Card becomes
available.
This measure, to which the production planner is sensitive, establishes
the time urgency on individual jobs. Jobs with high slack times can be
deferred; jobs with zero slack time must be scheduled now, if a card
is available; and jobs with negative slack time will not meet due date
requirements.
To establish due date for the condensed slivers, or the
completion of carding, the planner operates to a rule of thumb:
Due Date of the Condensed Slivers = Due Date of the Finished
Goods — Constant Time period.
The constant time period is intended to provide for processes subsequent
to carding. The slack time measure was incorporated in the functional
relationship as a continuous variable .
(b) Count Difference: The count system used in the mill
is American Run (defined as the nunnber of hanks of length I6OO yards
in one pound weight). The planner attempts wherever possible to
maintain a constant condensed count on each card thus minimizing
machine adjustments. He therefore favors scheduling a particular job
on a machine which has just connpleted a job of equal or connparable

18
count. Thus, the difference in count (or A count) between a job on his
file and the job just connpleted on an available card was recognized as
a decision variable. Since it appeared that he responded only to the
size and not to the direction of the count change, the absolute value of
count difference was used in the analysis.
(c) Blend Change: The production planner attempts to
minimize blend changes on any card to reduce the possibility of
contamination and to avoid having to strip the cards after each job.
The classification of blends was a difficult problem in a mill which
processes a wide variety of blends. For simplicity, four blend
categories were enaployed:
1. All Wool (including virgin wool, comb noils, worsted
wool, waste wool)
Z. Wool-Mohair
3. Wool-Rabbit
4. Wool-Other
Blend change was treated as a dichotomous variable in the analysis.
These four blend categories therefore provide 16 different, mutually
exclusive, binary variables.
(d) Color: The mill in which the study was conducted
produces stock dyed and piece dyed fabrics and therefore processes
white and colored stock. The production planner regards color changes


19
on a particular card in the same light as blend changes. However,
certain cards in the mill are reserved exclusively for stock dyed
material and the planner drafts a separate schedule for those cards.
This study concerned itself only with the cards processing white stock
and thus color was eliminated as a variable of the analysis.
(e) Geography of the Card Room: The question of card
room geography arose in the initial discussions with the planner in
connection with the possibility of contamination by fibers flying
between adjacent cards. However, before the collection of data
commenced, shields were erected between cards to avoid possible
fly contamination. A trial run of the model on five weeks of
production data suggested that the planner occasionally scheduled two
jobs of identical blend on adjacent cards to facilitate feeding.
Discussion of this point between the production planner and the study
group revealed that this factor was of marginal significance to his
decision process. Because of this as well as the difficulty of
incorporating card room geography in the analysis, this variable was
not included.
(f) End Use -- Yarns for Warp or Filling: To avoid a
possible build-up of in-process inventory, the planner attempts to
move warp and filling yarns, intended for the same fabric, through
the process in phase. Thus, the completion of a particular warp yarn

20
(at the carding stage) places an urgency on completion of the
complementary filling.
The significance of this variable to the production planner's decision
process came to light only upon completion of a five-week trial analysis
which excluded this variable. A comparison was made on the basis of
these trial data between the model's prediction of a carding schedule
when presented with the actual weekly job file and the planner's
corresponding card schedule for that week. Discrepancies were
observed. Discussion of these discrepancies with the planner revealed
that he was in fact sensitive to this end use variable.
This finding reinforced the view that significant refinements to the
model could be derived from feedback at the validation stage. However,
it also suggested the need to obtain detailed information on fabric
constructions for those fabrics produced during the six months data
period of the study. For proprietary reasons, information on these
fabrics could not be released at the time the data were collected. After
a suitable time had elapsed, a partially successful attempt was made to
reconstruct this information; however, there were still significant gaps
in most of the job files within the data period and the end use variable
could not be incorporated quantitatively in the analysis.
The variables of slack time, count difference and blend change were
therefore selected for use in the analysis. In eliciting information on

21
the significance of particular variables, the study group attempted to
assume a passive role. The object of the investigation was to model
the planner's actual decision process. The group therefore refrained
as far as possible from suggesting variables which they considered
might or ought to be a determinant of his decisions. However, this
restraint was not always easy to maintain. For example, the
classification of blends used in the analysis, as outlined above, was
not regarded by the study group as being entirely satisfactory. They
therefore suggested to the production planner that an alternative
classification based on a combination of fiber type and fiber length
might be more suitable. However, the planner was not provided with
nor did he seek information on the fiber length or the fiber length
distribution of the blends processed and this suggestion by the group
was not adopted in developing the model.
3. THE FUNCTIONAL FORM OF THE DECISION:
The selection of a function by which to relate the independent
variables, slack time, count difference and blend change to the
dependent, dichotomous (yes -no) variable was the next step in the
procedure. As in the choice of decision structure, the study group
was predisposed to select a simple functional relationship as well as
one which seemed to fit the planner's behavior. Three functional
relationships were considered:

22
(a) Product: the priority index is the product of the
independent variables raised to exponents obtained from
data.
(b) Sum: the priority index is the sum of the independent
variables weighted by coefficients obtained fronn data.
(c) Mixed Product and Sum: the priority index is the product
of some of the independent variables times the weighted
sum of the others, with the exponents and weightings
obtained from data.
The product form was discarded immediately since 15 of the 18
independent variables will always be zero and the priority indices
obtained would be indistinguishable. The third choice, the mixed
product and sum, could have been used to circumvent this difficulty
but it is a very difficult form to manipulate in a linear regression.
Furthernnore, it could lead to wrong answers. For example, if the
values of two independent variables suggested that a negative
(scheduling) decision would be made, their product could yield a
positive priority.
The fornn which was selected for the priority function was thus
a simple weighted sum of the independent variables. In addition to
its simplicity both in the fitting of the coefficients and in its use in
scheduling, this function seemed to be a reasonable description of the

23
way the planner combined the independent variables. For exannple, he
was asked to vary one or two independent variables while holding the
others constant, and the preferences he expressed in such
hypothetical situations indicated that the linear function was a good
representation of these preferences.
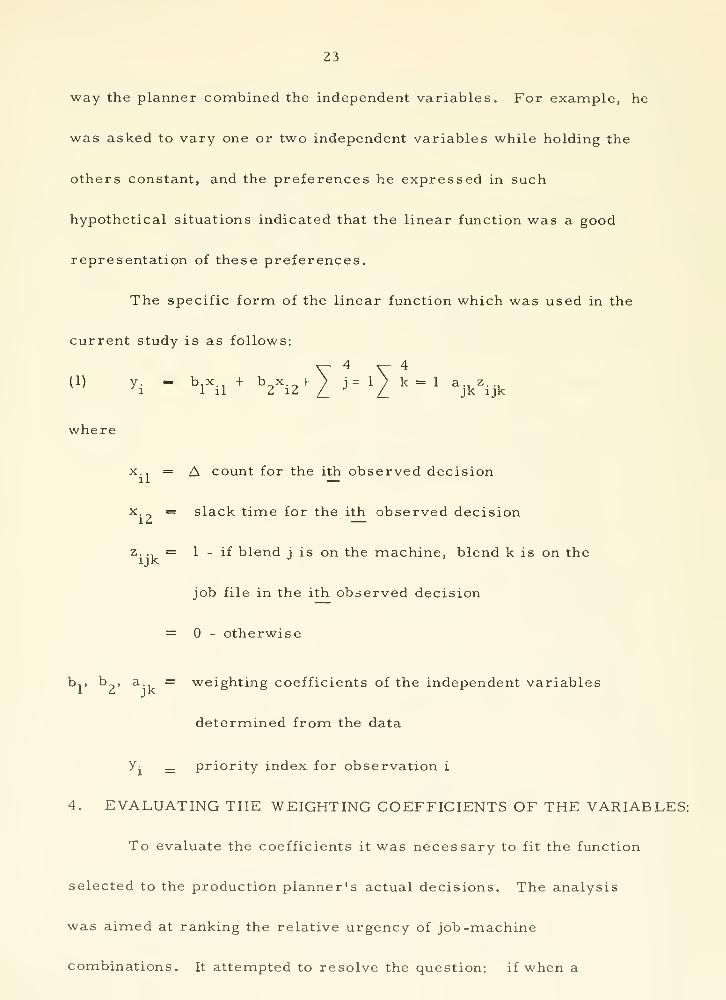
The specific form of the linear function which was used in the
current study is as follows:
(1) y. - b.x., + b.x + ) j= 1 ) k = 1 a., z..,'i 1 il ^ ^^ /_ /_ jk ijk
where
X., = A count for the ith observed decisionil —
X = slack time for the ith observed decisioniZ —
z. ., = 1 - if blend i is on the machine, blend k is on theijk -'
job file in the ith observed decision
= - otherwise
esb,, b , a = weighting coefficients of the independent variabl
determined fronn the data
Yj _ priority index for observation i
4. EVALUATING THE WEIGHTING COEFFICIENTS OF THE VARIABLES:
To evaluate the coefficients it was necessary to fit the function
selected to the production planner's actual decisions. The analysis
was aimed at ranking the relative urgency of job-machine
combinations. It attempted to resolve the question: if when a

24
particular card becomes available , the production planner is
required to select a job fronn his file, then which job will he select
as having the highest priority for that card.
If the relative costs associated with alternative actions could
be determined from plant data, it would be more reasonable to rank
job priorities on a cost basis. For reasons already discussed this
was not attempted. In principle, the Bowman approach assunnes that
the production planner is implicitly sensitive to cost considerations
and ranks his job-machine priorities to reflect them. The weighting
coefficients of the decision variables are in essence the visible
evidence of his implicit cost criteria. Thus, for exannple, in the
priority function selected above, where it is assumed that a high
positive value of the dependent variable indicates that the job ought to
be scheduled, a negative slack time coefficient (b ) would imply that
the production planner resists the possibility of jobs running overdue
and of incurring the associated delay penalties. Similarly, a negative
count difference coefficient (b ) would suggest a resistance on the part
of the planner to machine adjustments required for a change of count,
with the associated down time. In principle the objective in fitting to
his behavior is to infer the relative costs which on average he
attributes to alternative actions.
The various possible decision nnodes of the planner have been


25
discussed in a previous section. It was now necessary to consider
these different decision modes, as different modes of decision making
require different treatments in analysis. The first decision mode
outlined earlier was used in a trial analysis of five weeks of data.
This trial cycle of the model was undertaken to evaluate the whole
approach; to obtain feedback on variables other than those
incorporated in the priority function which might prove to be
significant; and to examine the decision mode used. The data
consisted of 189 yes and no decisions. In this case the jobs actually
scheduled within any week constituted the working job file for that
week. The yes decisions referred to the fact that the planner scheduled
job A on card 1; job F on card 2; job C on card 3, etc. The no
decisions referred to the fact that he did not schedule job A on cards
2. through 9; he did not schedule job F on cards 1 or 3 through 9, etc.
The coefficients of the priority function were obtained in this
trial cycle using a standard linear regression computer code with a
dependent value of 1 for the yes decisions, for the no decisions. The
priority function thus obtained was inserted in a heuristic based on the
first decision mode. The resulting decision rule was used to schedule
jobs on machines for a sixth week outside the data period and the
schedule so obtained was compared with the planner' s actual schedule
for that week. Four out of nine correct job-machine combinations

26
were chosen by the model and a fifth correct job was selected but was
scheduled on the wrong nnachine.
As a result of this trial analysis several changes were made in
the model. Following discussion of the results with the planner, the
significance of the end use variable came to light. This has been
discussed in a previous section. The trial run also suggested that the
blend classification w^as satisfactory provided that a sufficiently
representative body of data was investigated. Because there were
only 189 data points in the trial, some of the rarer blend changes
occurred only a few times, which led to unreliable values for the
corresponding blend change coefficients. A decision was nnade to
analyse a larger body of data for the main study and data for six
months of scheduling were accumulated.
It was difficult to infer anything about the suitability of the first
decision nnode on the basis of the trial analysis since other
recognizable influences led to discrepancies between the model's
prediction and the planner's practice. This mode was investigated
primarily because of a lack of connplete information on the planner's
job file within the five week trial period. As a result of the trial, the
group was able to specify the additional job file information which would
be required for the main study.
The second decision mode was used in analysis of the main body

27
of the data. The yes decisions in this case were analyzed on the sanne
basis (what he actually scheduled on which card) as in the first
decision mode. However, the no decisions in this case referred to the
fact that because he scheduled job A on card 1 when it became
available, he rejected all the other jobs (F, C through Z) on his job
file for this particular machine opening.
It appeared that this mode was a better approximation to his
actual scheduling procedure. Its principle defect appeared to be that
for each job scheduled on a machine, on average some 50 other jobs on
the file were rejected for that machine. It was felt that this imbalance
between the number of yes and no decisions might significantly influence
the weighting coefficients derived from analysis. However, the analysis
was done using this mode as it was concluded that, again, any such
deficiency would be evident at validation.
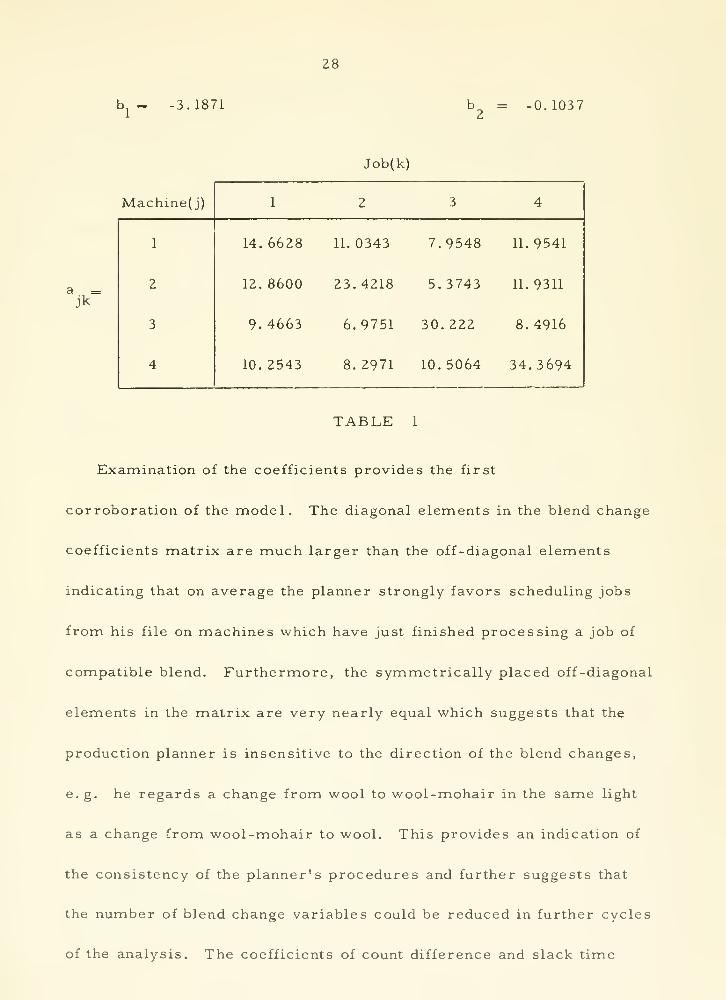
Because some 25,000 decisions were involved, special
computer programs were written to facilitate preparation and analysis
of the data. The values of the independent variables (blend change,
count difference and slack time) were generated fromi the job file and
machine opening data, and a discriminant analysis [4] was performed
directly to avoid the need for generating the dependent variables. The
weighting coefficients of the decision variables which were obtained
from this analysis are shown in Table 1.

28
b^ - -3.1871 0. 1037
Job(k)
a =Jk
Machine{j)


29
seem compatible with what one would expect of the planner's behavior
since they indicate that he resists job-machine combinations which
entail either changes in count or large slack times. Considering the
magnitude of typical count changes and slack times which occur in
the data the coefficients imply that the planner's discrimination is
heavily weighted in favor of avoiding changes of blend.
Using these coefficients in the priority function, tables of
priority indices were prepared for two weeks of job file and nnachine
information falling outside the six month data period of the
investigation. For practical reasons these extensive tables are not
presented here, but for purposes of illustration a typical selection
of the indices is shown in Table 2.


30
Machine No.
Job No.
10
12. 38
11. 21
2.15
13. 67
12. 25
12. 28
8.11
11.97
4. 64
1. 53
10. 69
9. 52
0.46
14. 56
13.11
10. 59
6. 42
10. 28
2. 95
0. 16
2. 63
4. 01
28.15
3.95
2.49
2. 52
0. 77
2. 21
3.17
27. 52
11. 00
9. 83
0. 77
14. 87
13.42
10.90
6. 74
11. 59
3. 25
0. 15
(Recomputed)|
10. 89
9.43
0.63
Eliminated
12. 21
9.10
5. 33
11. 01
2.79
0.10
TABLE 2 -- PRIORITY INDICES

31
5. VALIDATION
Predicting the Schedule: The priority indices shown in Table 2
rank the desirability of scheduling particular jobs on particular
machines and thus provide the basis for predicting the planner's card
schedule via the nnodel. The higher the index, the more desirable it
is to schedule that job on that machine. At this point it was necessary
to devise a suitable scheduling heuristic using these priority indices.
The use of the second decision mode in analyzing the production data
implied that the planner first identified machine openings and then
inspected his job file for suitable jobs for these openings. It seemed
therefore desirable that the scheduling heuristic selected should
conform as far as possible with this procedure.
In Table 2, for any machine the higher the priority index among
jobs, the more desirable it is to schedule that job on that machine.
On the other hand for any job the higher the index across machines,
the more desirable it is to schedule that job on that machine.
On these grounds the use of what might be called a max -max
heuristic appeared to be most compatible with the planner's decision
process. With this heuristic all jobs are examined in relation to the
first machine which becomes available. From these jobs is selected
that one which has the maximum priority index for that machine.
However, the job thus singled out may be even more compatible with


32
another machine. Thus, the priority indices for that job in relation
to all the machines are examined. By this means the maximum index
across machines is determined for that job. It is scheduled on that
machine; it is elinninated fronn the job file; the machine thus scheduled
assumes a new position in the machine opening sequence; the priority
indices for this machine are recomputed in relation to all the
remaining jobs; and the cycle of the heuristic is repeated until all
machine openings for the week under consideration are filled.
The use of this heuristic will be illustrated with reference to
Table 2. The machines in this Table are numbered in the sequence in
which they become available. For the first machine opening (card 1)
the job with the highest priority index is job 4(with an index of 13. 67).
However, on looking across machines, this job should preferably be
scheduled on card 4. Thus, job 4 is scheduled on card 4 and is eliminated
from the job file. The priority indices for all the remaining jobs, with
respect to card 4, now change. The indices are therefore recomputed
for this card. With job 4 scheduled the highest remaining priority
index on card 1 is 12. 38 for job 1. This is also the max-max index for
this job (maximum between jobs -- maxinnunn across machines). Job 1
is scheduled on card 1 and is eliminated from the job file. The indices
of all remaining jobs on the file change with respect to card 1 and are
recomputed. The other machines are scheduled in a similar fashion.

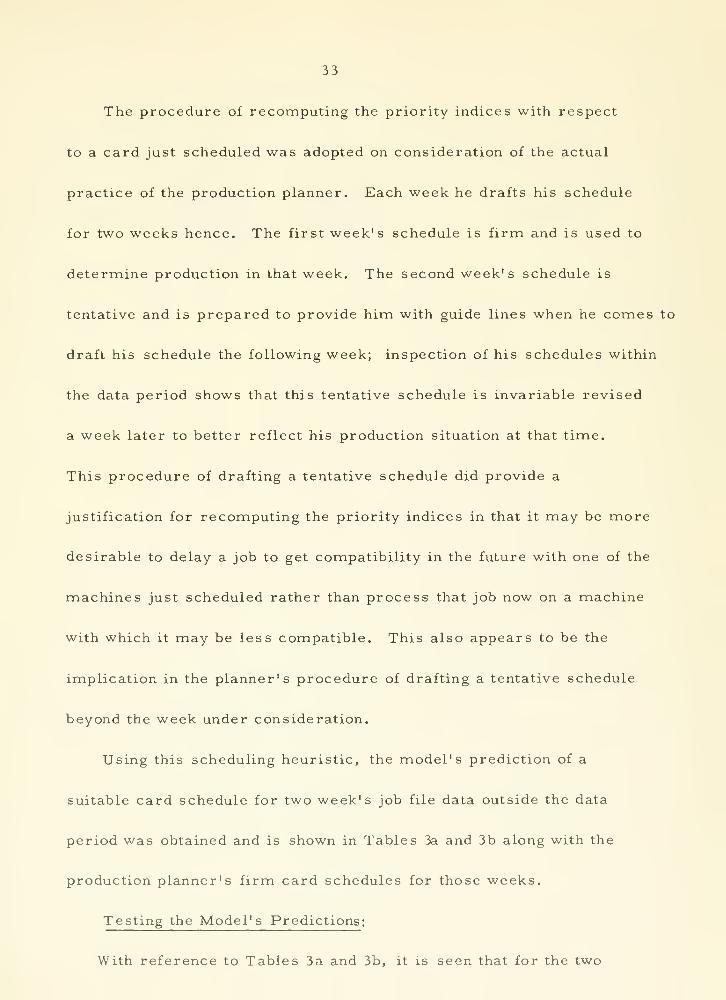
33
The procedure of recomputing the priority indices with respect
to a card just scheduled was adopted on consideration of the actual
practice of the production planner. Each week he drafts his schedule
for two weeks hence. The first week's schedule is firm and is used to
determine production in that week. The second week's schedule is
tentative and is prepared to provide him with guide lines when he comes to
draft his schedule the following week; inspection of his schedules within
the data period shows that this tentative schedule is invariable revised
a week later to better reflect his production situation at that tinne.
This procedure of drafting a tentative schedule did provide a
justification for recomputing the priority indices in that it may be more
desirable to delay a job to get compatibility in the future with one of the
machines just scheduled rather than process that job now on a machine
with which it may be less compatible. This also appears to be the
implication in the planner's procedure of drafting a tentative schedule
beyond the week under consideration.
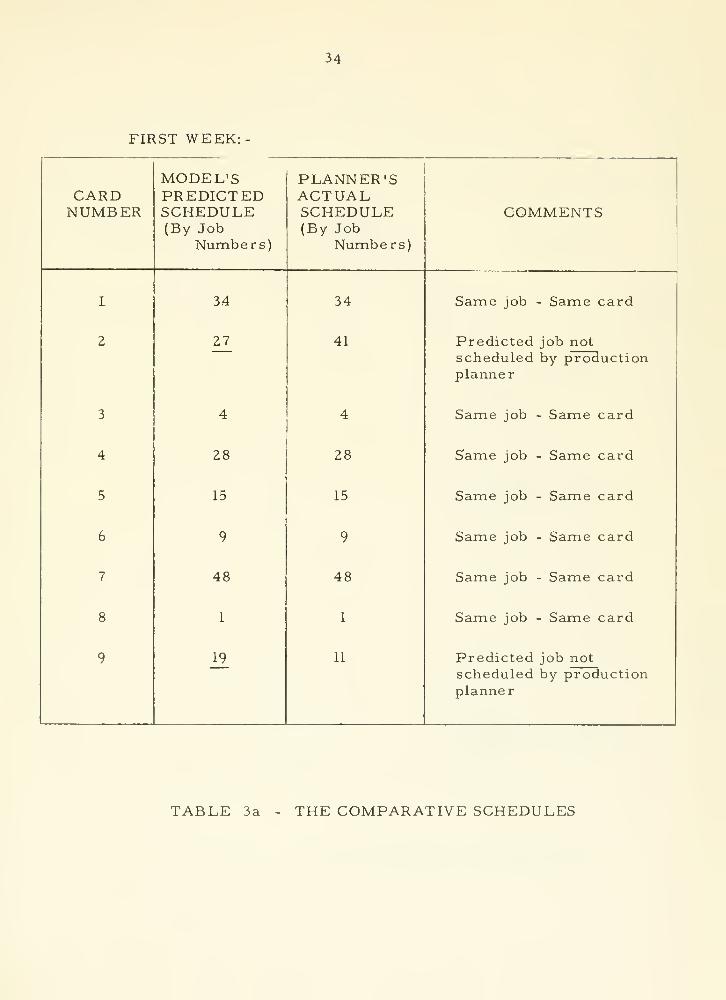
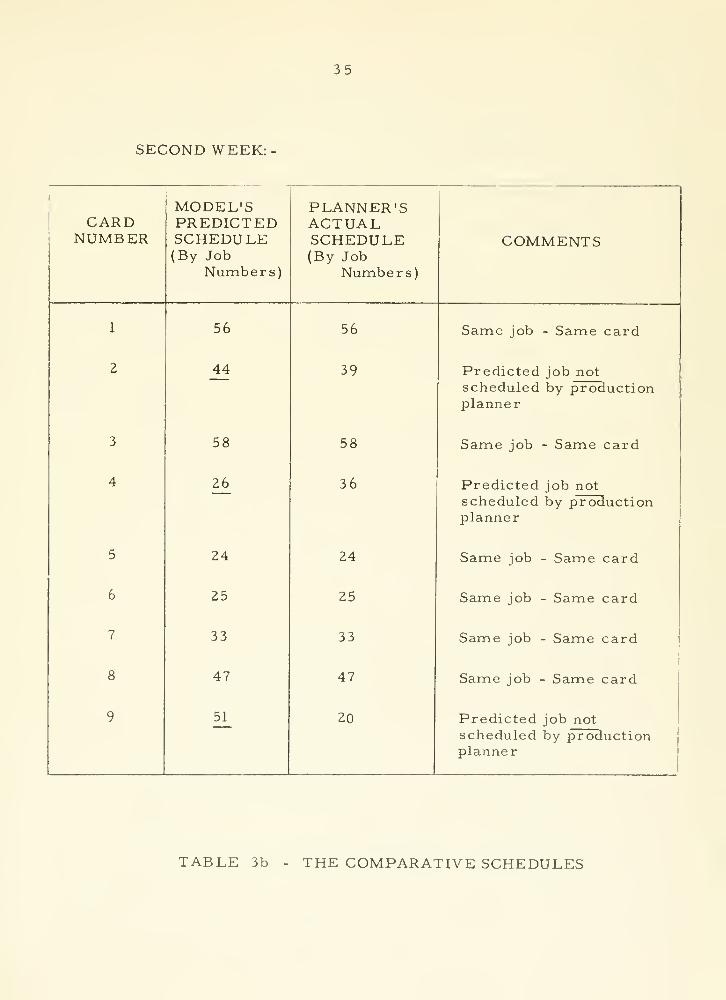
Using this scheduling heuristic, the model's prediction of a
suitable card schedule for two week's job file data outside the data
period was obtained and is shown in Tables 3a and 3b along with the
production planner's firm card schedules for those weeks.
Testing the Model's Predictions:
With reference to Tables 3a and 3b, it is seen that for the two

34
FIRST WEEK:-

SECOND WEEK:
35
CARDNUMBER

36
weeks' trial period, the model's prediction of an appropriate carding
schedule differs from that actually decided on by the production
planner. The purpose of the validation step of the procedure was to
assess the model's predictive power in specific instances and to expose
any deficiencies in the model's understanding which could be refined in
further cycles of the analysis. However, proposals for refinement of
the model by feedback from validation must relate to some definition
of what constitutes a deficiency.
In the absence of an objective criterion of efficiency in ternns of
which the model's prediction and the planner's schedules could be
compared, a suitable definition of a deficiency is not readily obtained.
In the first trial week the model correctly predicted what the production
planner would do in 7 out of 9 instances; in the second trial week, 6
out of 9 corresponding decisions were made. Had the model made 9
correct decisions in both weeks, it could either be concluded (a) that
the model duplicated the planner's decisions, which in terms of the
Bowman theory would not necessarily be desirable, or (b) that the
planner was consistent in his behavior, which seems unlikely and which
would further be at variance with the hypothesis of the Bowman theory.
Any recommendation which is made for repairing deficiencies in the
model must be made with regard to both of these possible
interpretations of a discrepancy.

37
It first seems desirable to establish that the schedules predicted
by the model provide a greater number of correspondences with the
planner's decisions than those which would be generated by a random
selection of jobs and machines. This test of the model is conducted
by connputing the probability that a random selection would provide
7 (out of 9) job-machine matches in the first trial week and 6 matches
in the second trial week. It is assumed for this test that there are 50 jobs
on the job file at the time the schedule is generated and that only one
job is scheduled on each machine for the week in question. The
random selection of job-machine combinations must not only select
the correct jobs fronn the file, but these must also be scheduled on the
correct or corresponding machines. For any week, the probability
that n or more matches are made at random is the probability that an
ordered sample of nine taken from fifty contains n or more itenms in the
correct order. This probability as computed for the present case is:
Probability of 7 or more matches out of 9 given 50 choices
= 6.87 X 10"^^
Probability of 6 or more matches out of 9 given 50 choices
= 6.92 X 10"*^
Thus, the probability that the decisions predicted by the model could
have been generated at random is very low.
This test is very severe in that it assumes no knowledge at all

38
about either the jobs or the machines. A less stringent test can be
applied in which clairvoyance about the selection of jobs from the file
is assumed. That is, it is assumed that the nine correct jobs have
been selected from the fifty jobs on the file and the probability is
computed that these jobs are put on the matching machines. This
computation gives:
Probability of 7 or more matches out of 9 given 9 choices
= 1. 02 X 10'^
Probability of 6 or more matches out of 9 given 9 choices
- 5. 65 X 10'"^
These probabilities are again low which further supports the
contention that the model performs in better than a random way in
duplicating the production planner's behavior.
These two tests correspond to those applied by Clarkson in the
portfolio selection study discussed earlier. Clarkson applies a
further test which provides an additional criterion for the study
reported here. In this case, a schedule is generated using a naive
decision rule and this schedule is compared with the model's
predictions. Several decision rules of this kind could be proposed,
but the one used for the purposes of this test was as follows:
select that job fronn the file which has the lowest slack time for a
given machine and schedule that job on that nriachine. In the event

39
of a tie between jobs, schedule that job which is more compatible on a
blend basis. If the tie is still unresolved, schedule the job which
involves the smallest count adjustment on a machine. The resolution
of ties by this means was done on consideration of the relative
weightings of the blend change and count difference variables as
determined by the discriminant analysis of this study.
This naive decision nnodel was applied to the job file data for the
sanne two-week trial period of the model's prediction. Despite the
application of the three decision variables, a few ties remained
unresolved. Wherever this occurred that job -machine combination
was selected which was most sympathetic to the planner's actual
decision, this being regarded as a conservative procedure for
testing the model's predictions. The naive decision rule thus applied
made 4 (out of 9) correct decisions in both of the trial weeks, though
in two cases (the first week) it scheduled jobs on different machines
to those selected by the production planner.
The principle difficulty in applying this naive decision rule proved
to be the resolution of ties. The procedure adopted for their
resolution was an arbitrary one, but in four cases (in the two-week
period) the correct decision was made on the basis of slack time alone;
in one case, the blend variable provided the basis for discrimination;
in an additional case, a correct decision was made on the basis of

40
count difference; and two ties were unresolved. It is interesting to note
that 8 correct decisions (out of a total of 18) were made using this simple
decision rule, whereas the model made 13 correct decisions in the
same period. However, inspection of the job file for any week reveals
that by any simple criterion of discrimination certain jobs would almost
certainly be scheduled correctly. A more subtle decision process is
required for resolution of the majority of cases.
A final test was conducted to evaluate the max-max heuristic derived
fronn the planner's actual behavior. In this case, the priority function
itself is used to choose the schedule without reference to the production
planner's procedure. The job with the nnaximum overall priority index
is scheduled. The chosen job is elinninated from the job file and the
priority indices are recomputed for all the remaining jobs with
respect to the chosen machine; the maximum priority index is again
determined and the process is repeated until all machines are thus
scheduled. With these procedures only two exact matches were
obtained for the first week, but three other jobs were correct but were
scheduled on the wrong machines. For the second week, three exact
matches were made but, again, three correct jobs were scheduled on
the wrong machines. Thus, the virtue of the max-max heuristic
appears to be that of scheduling the jobs in the correct order on
machines rather than in the selection of the jobs to be scheduled.

41
Discussion of the Scheduling Discrepancies:
Before proceeding to a detailed discussion of individual
discrepancies, it nnay be appropriate to consider how in fact the
discrepancies might be expected to arise. As has been suggested
earlier, it seems reasonable to assume that the planner's schedule will
differ from that predicted by the model either because the model is not
an accurate description of the production planner's average behavior
and/or because the planner is not consistent in his behavior. The
model which is proposed here claims to describe the production planner's
average behavior. This average has been determined from observation
of his scheduling practice over a finite time period. In extrapolating
the model outside the data period covered by the analysis, it seems
almost inevitable that inconsistencies from this computed average
pattern will be observed. That these inconsistencies represent actual
deviations from his average behavior is not necessarily established as
the model may have failed to comprehend all possible decision
situations because of the limited data analysed. Furthermore, in the
developnnent of the model and in its application, various simplifications
of structure and procedure were introduced in the interests of
practicality. These sinmplifications have been discussed at the
appropriate points in the text. In evaluating the discrepancies between
the model's and the planner's schedules, it seems desirable to consider

42
the possible consequences of these simplifications and how these
consequences might relate to the discrepancies observed.
It also seenris reasonable to suppose that the production planner will
not be consistent in his behavior considering the complexity of the
process which he is regulating and considering the changing
circumstances under which his schedule is prepared from one week to
the next. However, as has already been implied, without the benefit of
an objective criterion of efficiency which could be applied to the
respective schedules, the interpretation of the discrepancies must tend
to give the planner the benefit of the doubt.
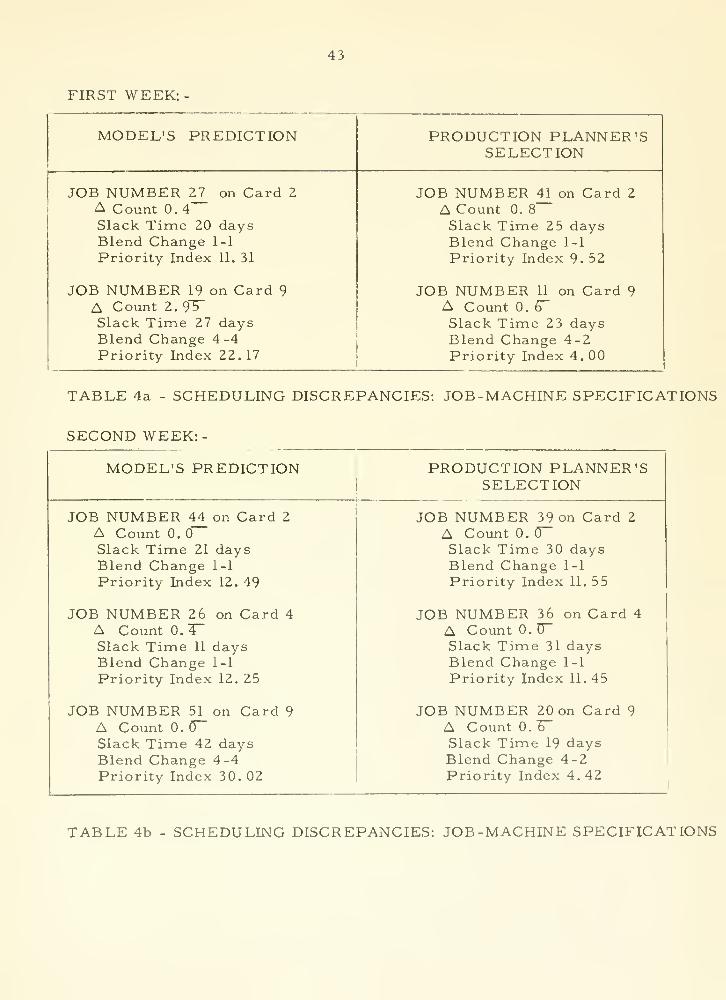
The values of the variables and of the priority indices corresponding
to the discrepancies observed in the comparative schedules are shown
in Tables 4a and 4b. The following explanation of individual
discrepancies is proposed.
FIRST WEEK:
Card 2; The model predicted job 27 with priority index 11. 31
The planner scheduled job 41 with priority index 9.52
The model's prediction in this case appears to be the more
suitable choice since job 27 is nnore urgent and the change
in count required is smaller. However, job 27 was not
actually scheduled by the production planner until 3 weeks
later at which point it was running overdue, according to

43
FIRST WEEK:
MODEL'S PREDICTION

44
the job file information on due date for this job. This
suggests that the planner was possibly aware of some
circumstance relating to this job which was not identified
in the job file or in the mennoranda written by the production
planner to advise the study group of special situations.
Card 9; The model predicted job 19 with priority index 2Z. 16
The planner scheduled job 11 with priority index 4. 00
The model's decision in this case was heavily weighted in
favor of putting a compatible blend on this card. The planner
decided to change blends apparently weighting his decision
in favor of a smaller change of count. This discrepancy
points to a possible deficiency of the model. Restrospective
inspection of the data revealed that blends 3 (wool-rabbit) and 4 (wool-
other) were frequently very short runs involving but 0.5- 1.0
days of carding. Thus, the production planner could take or
defer action on these jobs without incurring a serious risk of
their running overdue depending on his expectation of the
overall blend changes which would be required. Had he
scheduled job 19 for the week as predicted by the model, it
would imply that he did not anticipate getting blend
compatibility with that job at a later point. He actually
scheduled job 19 two weeks later and did get blend connpatibility

45
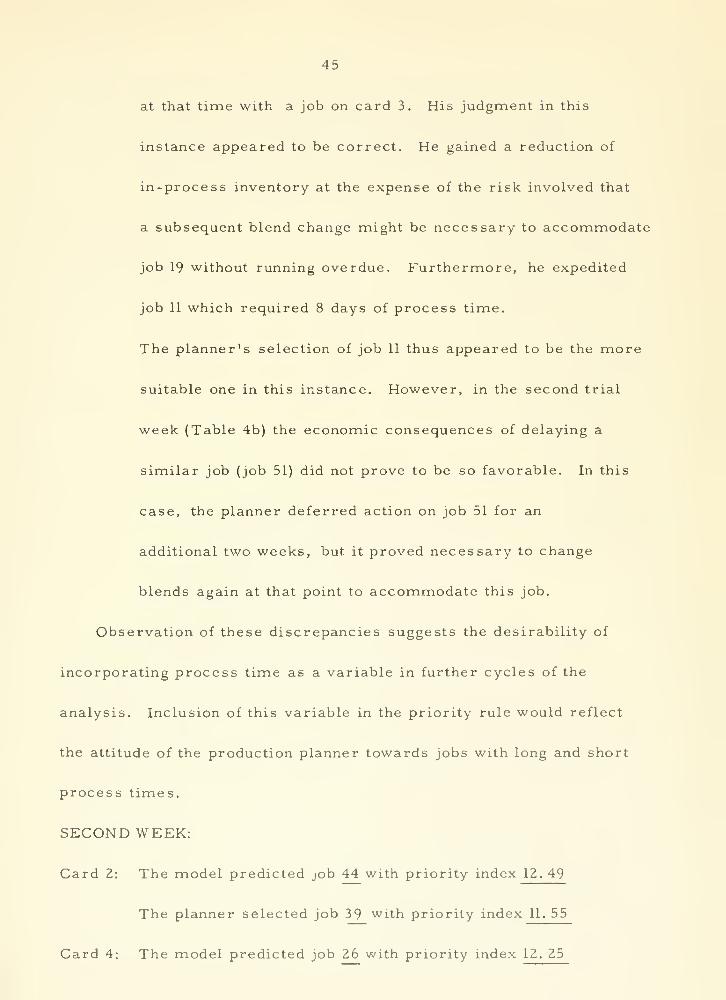
at that time with a job on card 3. His judgment in this
instance appeared to be correct. He gained a reduction of
in-process inventory at the expense of the risk involved that
a subsequent blend change might be necessary to accommodate
job 19 without running overdue. Furthermore, he expedited
job 11 which required 8 days of process time.
The planner's selection of job 11 thus appeared to be the more
suitable one in this instance. However, in the second trial
week (Table 4b) the economic consequences of delaying a
similar job (job 51) did not prove to be so favorable. In this
case, the planner deferred action on job 51 for an
additional two weeks, but it proved necessary to change
blends again at that point to accommodate this job.
Observation of these discrepancies suggests the desirability of
incorporating process time as a variable in further cycles of the
analysis. Inclusion of this variable in the priority rule would reflect
the attitude of the production planner towards jobs with long and short
process times.
SECOND WEEK:
Card 2: The model predicted job 44 with priority index 12. 49
The planner selected job 39 with priority index 11. 55
Card 4: The model predicted job 26 with priority index 12. 25

46
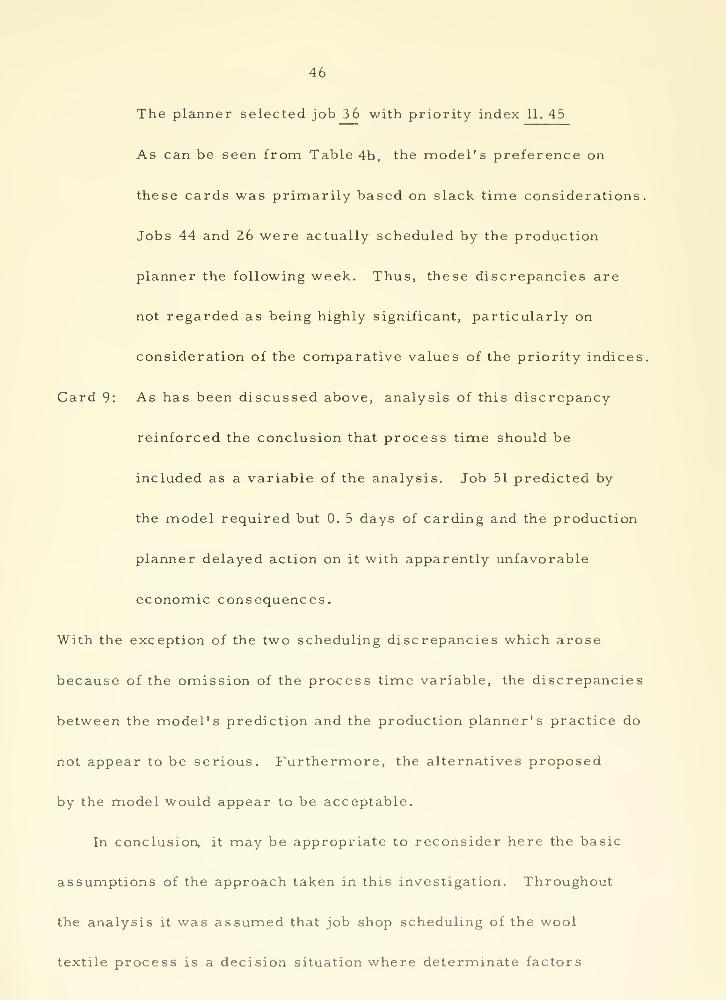
The planner selected job 36 with priority index 11. 45
As can be seen fronn Table 4b, the model's preference on
these cards was primarily based on slack time considerations.
Jobs 44 and 26 were actually scheduled by the production
planner the following week. Thus, these discrepancies are
not regarded as being highly significant, particularly on
consideration of the comparative values of the priority indices.
Card 9: As has been discussed above, analysis of this discrepancy
reinforced the conclusion that process time should be
included as a variable of the analysis. Job 51 predicted by
the miodel required but 0. 5 days of carding and the production
planner delayed action on it with apparently unfavorable
economic consequences.
With the exception of the two scheduling discrepancies which arose
because of the omission of the process time variable, the discrepancies
between the nnodel's prediction and the production planner's practice do
not appear to be serious. Furthermore, the alternatives proposed
by the model would appear to be acceptable.
In conclusion, it may be appropriate to reconsider here the basic
assumptions of the approach taken in this investigation. Throughout
the analysis it was assumed that job shop scheduling of the wool
textile process is a decision situation where determinate factors

47
such as slack time, blend, etc., play a significant part in their
influence on a particular planner performing this operation. It was
further assumed that the interaction between these decision variables
is in some way predictable. The results of the investigation bear
out these assumptions to some extent, though discrepancies have
been noted and discussed. It is possible, on the other hand, that
each scheduling decision is unique and that the activity does not
lend itself to a descriptive model of the kind proposed here. However,
discussions between the production planner and the study group over
a period of two years led the group to conclude that the planner
operated to some set of relatively consistent criteria, not
necessarily well defined by the analysis.
It seems justifiable to propose that if, on the basis of data
obtained over a significant period of time, a model can be outlined
which describes the pattern of job shop scheduling for that period,
then that model might be ennployed to prescribe the planning of future
schedules. The time period selected for generation of the model
would need to incorporate all the conditions which are likely to be
encountered in future time periods. If, at some later date, a
condition arises which is foreign to the model's experience, it could
be dealt with outside the framework of the model; and in the light
of these exceptions the model's understanding could be enlarged.

48
While such a prescriptive model might be deficient in flexibility, it
could perhaps make amends by its consistency.
The model could be used prescriptively in several ways. It could
be operated in parallel with the manager, yielding no production decisions
but providing a check on his actions. At this level it could provide him
with new insights into his own decision process and provide him with
the basis for a critical evaluation of his procedures. The model could
further be operated as an integral part of the planner's decision process.
That is, it could provide him with the guide lines on which to base his
weekly schedule; relieve him of the need to make routine decisions; and
allow him to concentrate on those decisions which might be expected to
have a more significant influence on his scheduling efficiency.
Finally, the decision rule could be used to generate the schedule
with only sporadic review by the manager. This would enable the
manager to concentrate on some higher level non-programmed decisions
for which time was not available before.
ACKNOW LEDGEMENTS
The authors would like to acknowledge the participation in this
study by William E. Morgan, Jr. , who developed the connputer
programs required for the analysis and who assisted in analyzing
the data. They are also indebted to Professor Edward H. Bowman
who inspired their interest in the problem and who made many valuable

49
suggestions during the course of the work; and to Professor Stanley
Backer for helpful comments in the final stages of preparation of
the manuscript. The computations for this study were done in part at
the M.I.T. Computation Center, Cambridge, Massachusetts.
REFERENCES
1. Bowman, Edward H. , "Consistency and Optimality in ManagementDecision Making, " Management Science, Vol. 9, No. Z,
January 1963, pp. 310-3Z1
Z. Carroll, Donald C. , "Heuristic Sequencing of Single andMultiple Component Jobs, " Ph. D. Thesis, Alfred P. SloanSchool of Management, M. I. T. , June 1965
3. Clarkson, Geoffrey P. E. , Portfolio Selection: A Simulationof Trust Investment, Prentice -Hall, New YorkT 196Z
4. Hoel, Paul G. , Introduction to Mathennatical Statistics,
3rd ed. , John Wiley, New YorTc, 196Z
5. Manne, Alan S. "On the Job Shop Scheduling Problem, "
Operations Research , Vol. 8, No. Z , October I960, pp. Z19-ZZ3
6. March, James G. and Simon, Herbert A. , Organizations,John Wiley, New York, 1958
7. Simon, Herbert A. , The New Science of Management Decision,Harper, New York, ITHTT
8. Smith, Wayne E. , "Various Optimizers for Single Stage Production,"Naval Research Logistics Quarterly, Vol. 3, No. 1, March 1956,
pp. 59-"^

50
FOOTNOTES
March and Simon, p. 40
2Simon, pp. 21-Z2
3 Bowman, p. 310


![Limited Discrepancy Search for flexible shop scheduling · Limited Discrepancy Search for flexible shop scheduling ... [Carlier & Néron, 2000]; [Lin & Liao, 2003] – Lower ... –](https://img.pdfslide.net/doc/110x75/5b0b1fbc7f8b9ac7678d9661/limited-discrepancy-search-for-flexible-shop-discrepancy-search-for-flexible-shop.jpg)