Embed Size (px)
Citation preview
John P. Wilson, P.E. Arn G. Coombs, P.E. Jay L. Swift, P.E.
Pete Tjemsland, Water and Sewer Utilities ManagerAl Chrisman, Water Reclamation Facility SupervisorJim McBride, Water Reclamation Facility OperatorTyler White, Water Reclamation Facility OperatorNathan Gaul, Water Reclamation Facility OperatorHank Arnold, Water Reclamation Facility Operator
Presentation Outline
Introduction/Project LocationExisting WRFProject HistoryProject ObjectivesExpansion Plan OptionsDescription of WRF Expansion ImprovementsExpanded WRF PerformanceThoughts and Observations
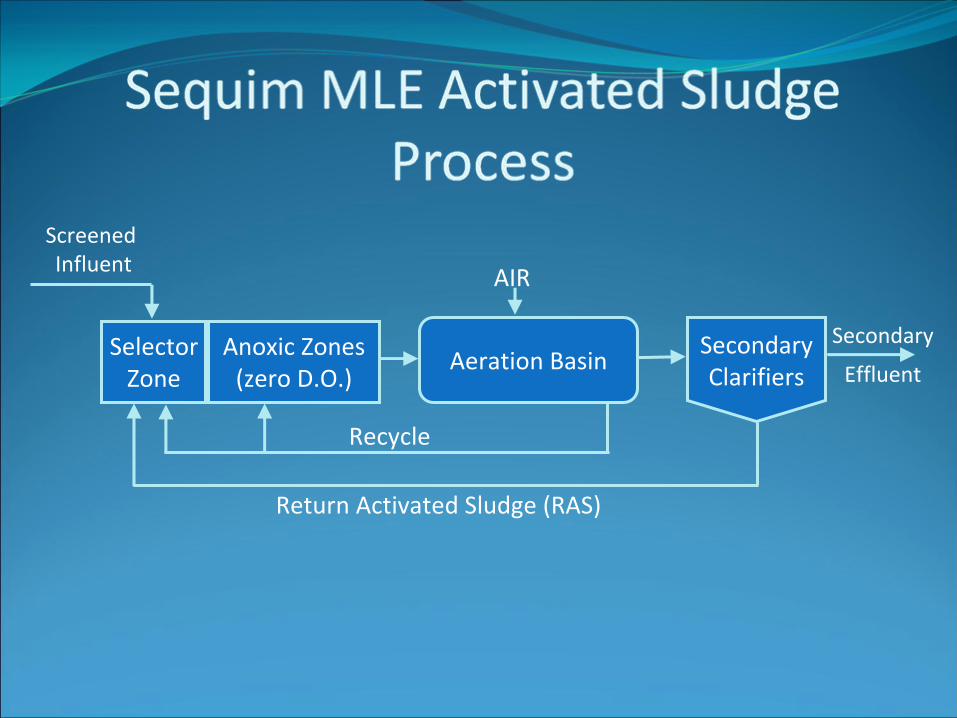
SecondaryClarifiers
Anoxic Zones
(zero D.O.)Aeration BasinSelector
Zone
Screened
Influent AIR
Return Activated Sludge (RAS)
Secondary
Effluent
Recycle
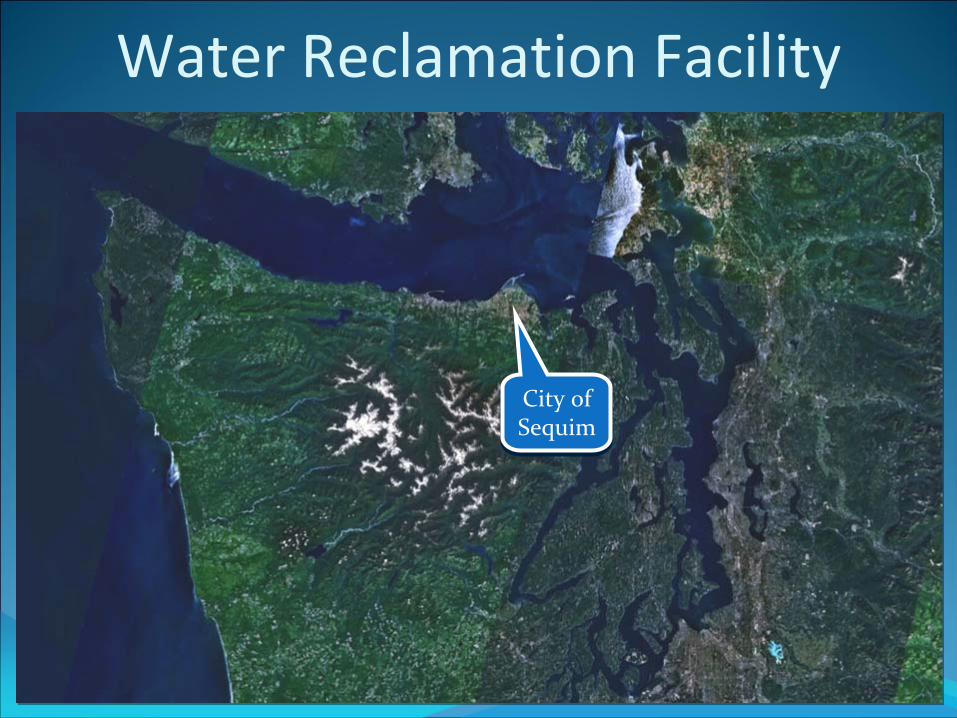
Water Reclamation Facility Location
City of
Sequim
City of
Sequim
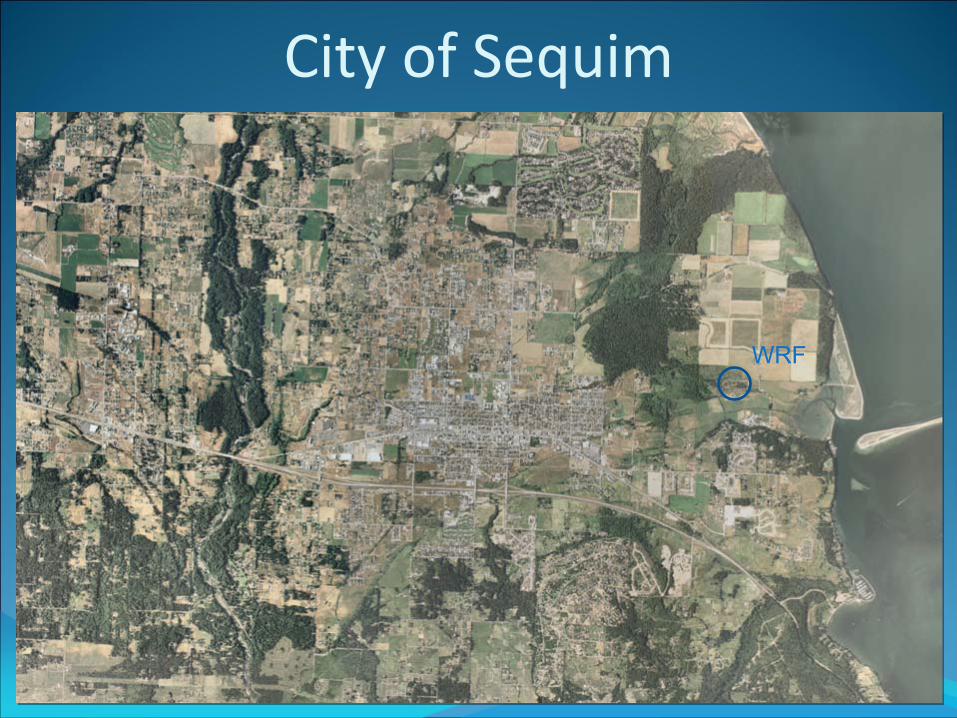
City of Sequim
WRF
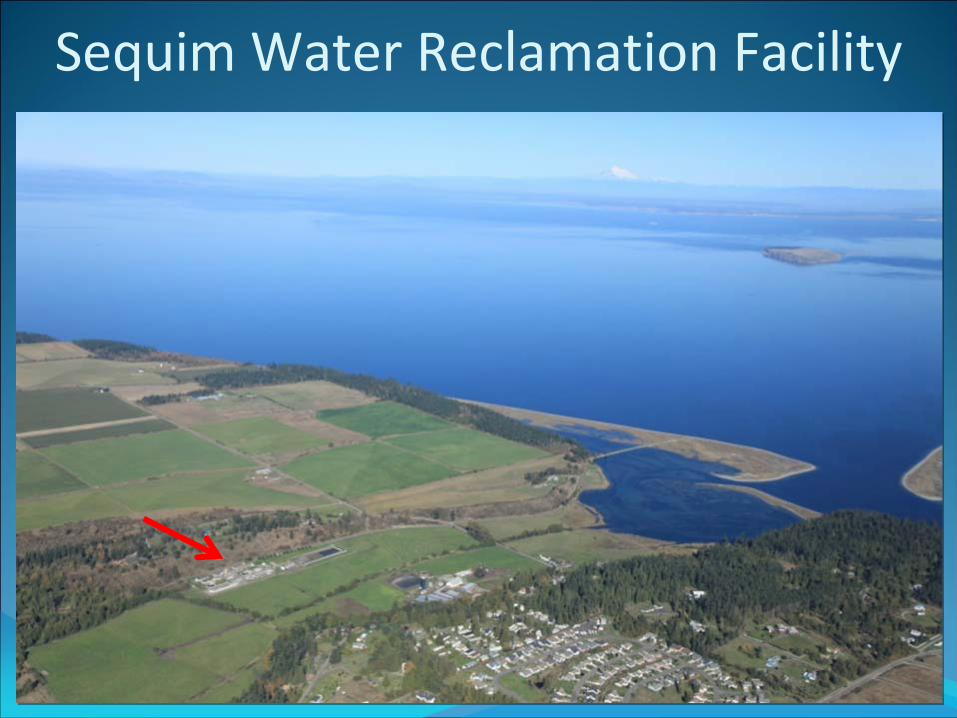
Sequim Water Reclamation Facility
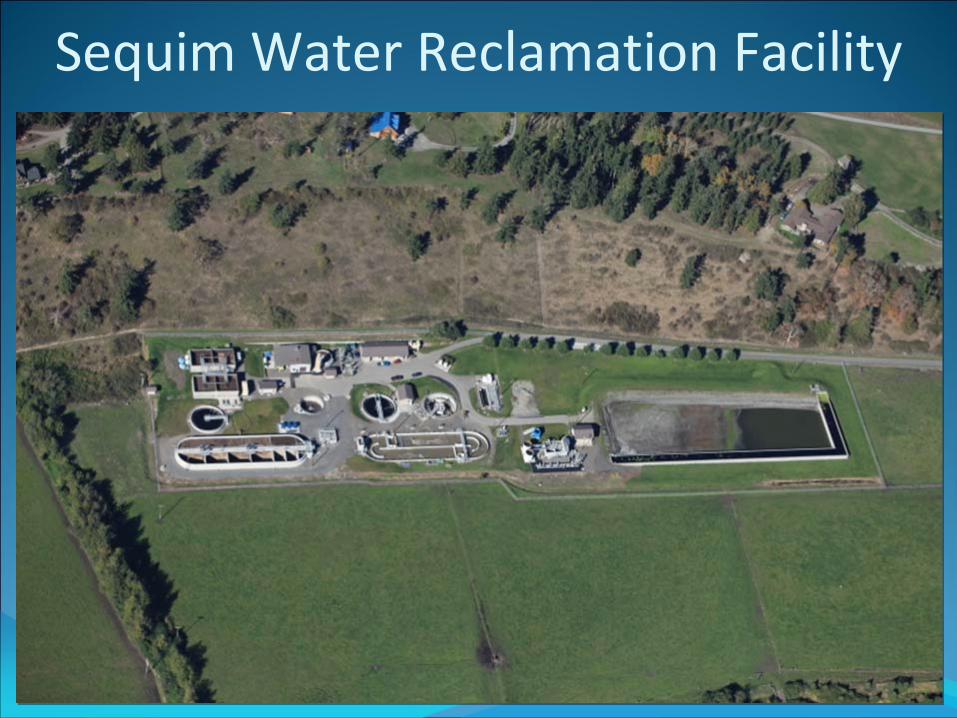
Sequim Water Reclamation Facility
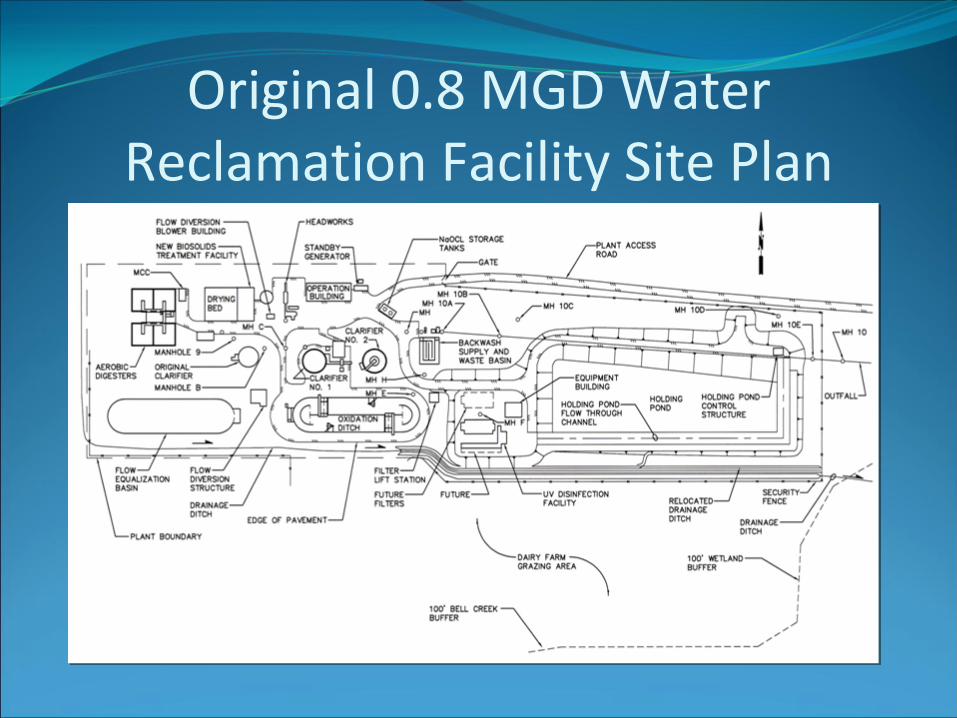
Original 0.8 MGD Water Reclamation Facility Site Plan
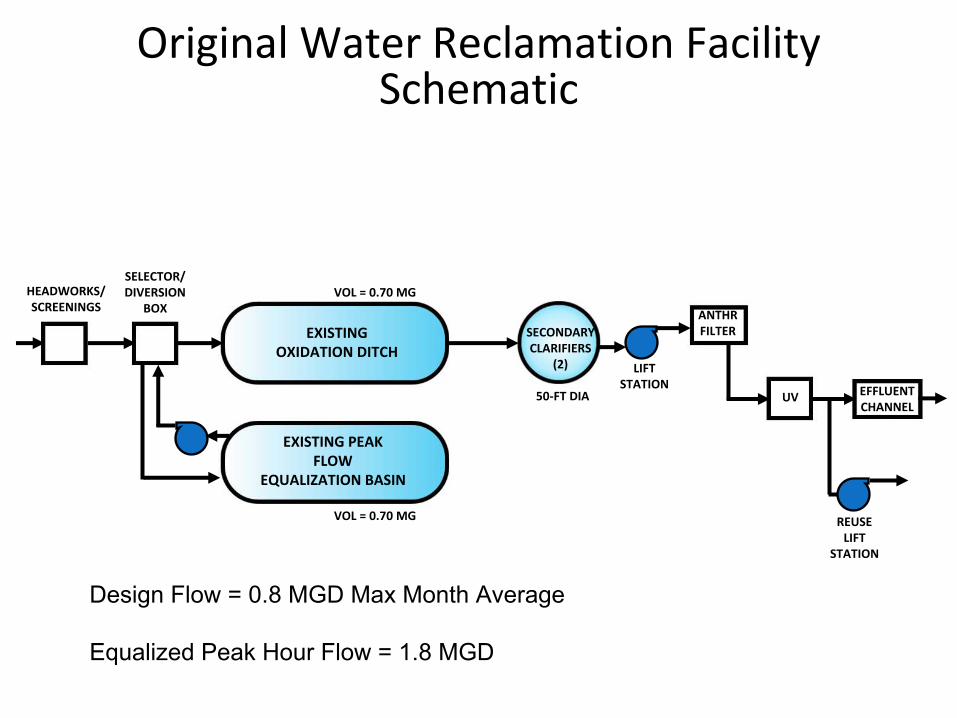
Original Water Reclamation Facility Schematic
EXISTINGOXIDATION DITCH
EXISTING PEAKFLOW
EQUALIZATION BASIN
SECONDARYCLARIFIERS
(2)
SELECTOR/DIVERSION
BOX ANTHRFILTER
UV EFFLUENTCHANNEL
LIFTSTATION
HEADWORKS/SCREENINGS
REUSELIFT
STATION
VOL = 0.70 MG
VOL = 0.70 MG
50‐FT DIA
Design Flow = 0.8 MGD Max Month Average
Equalized Peak Hour Flow = 1.8 MGD
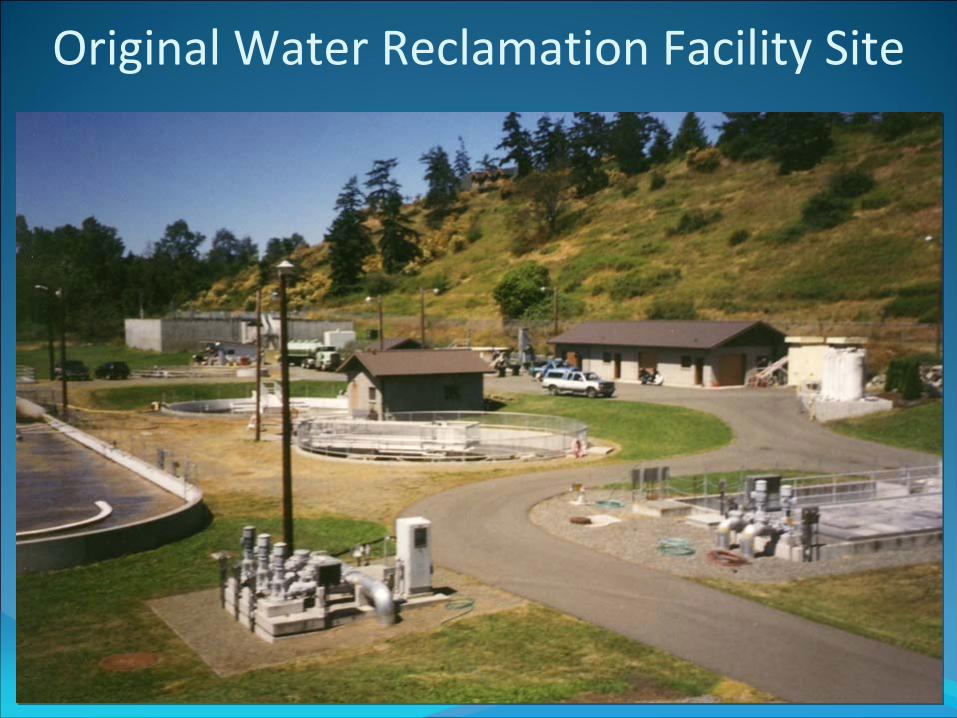
Original Water Reclamation Facility Site
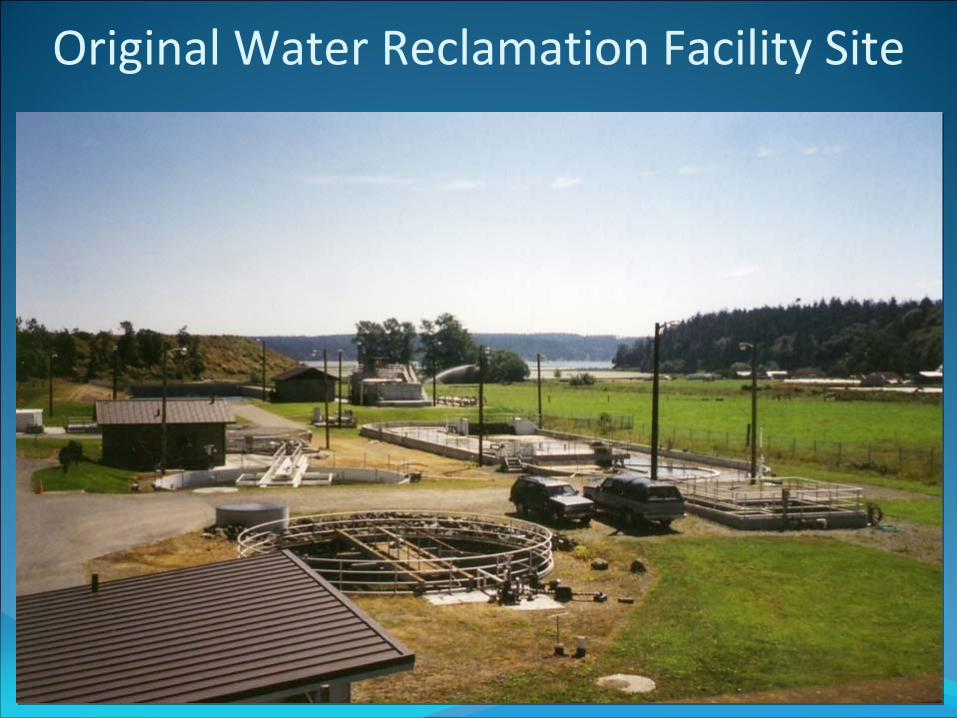
Original Water Reclamation Facility Site
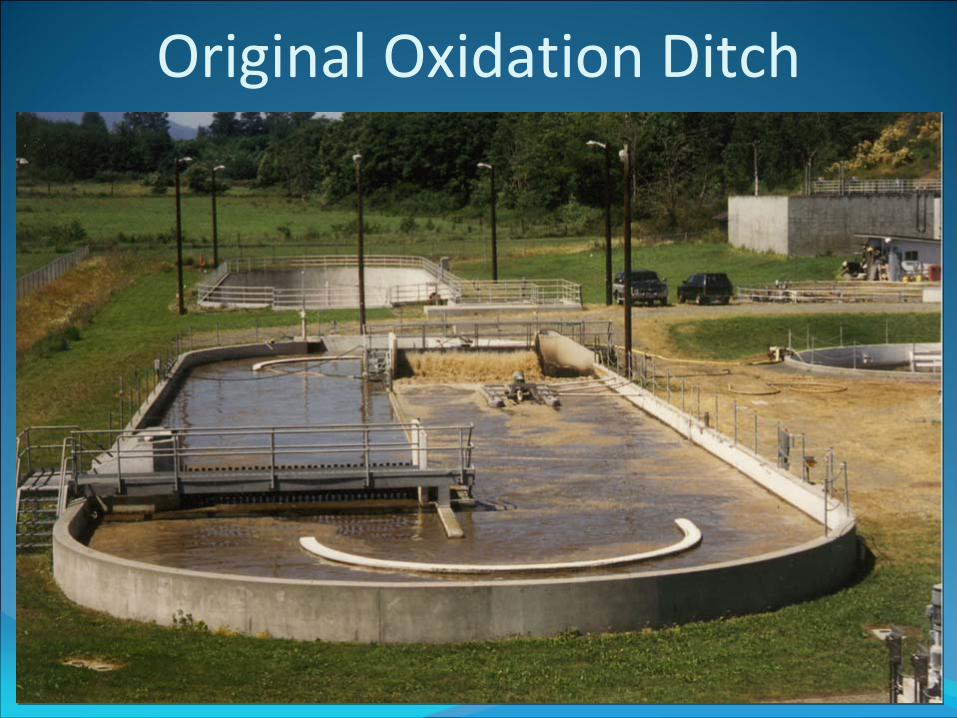
Original Oxidation Ditch
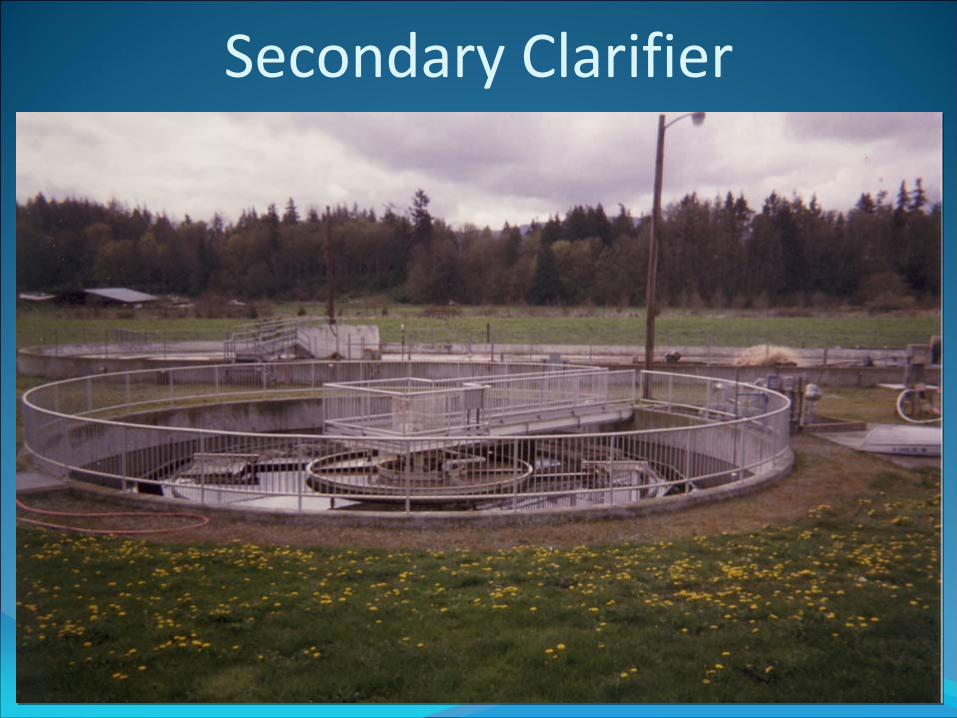
Secondary Clarifier
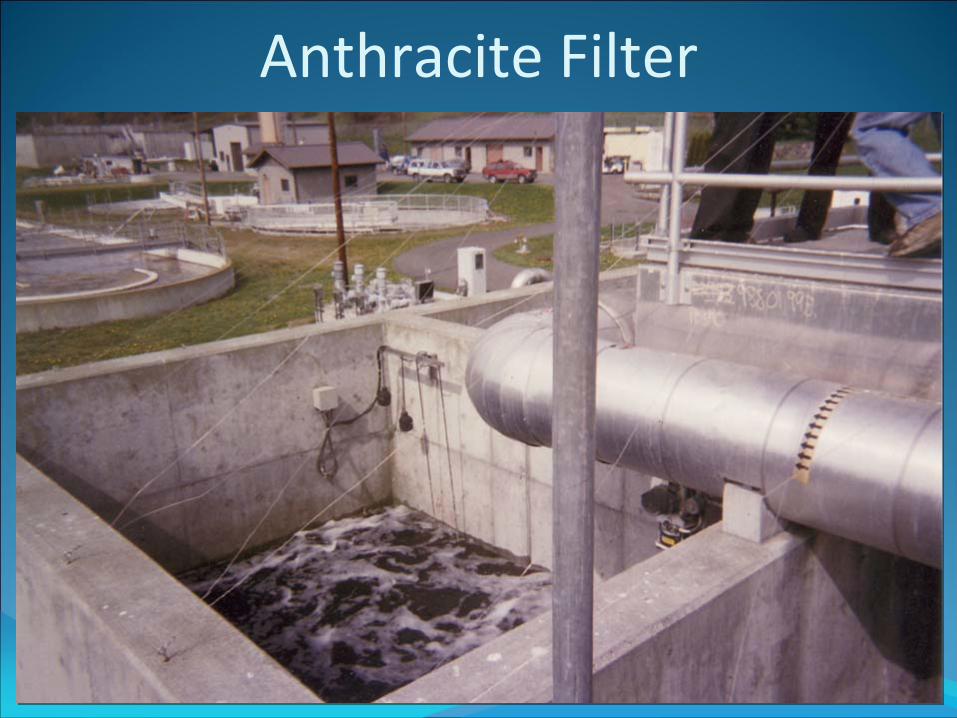
Anthracite Filter
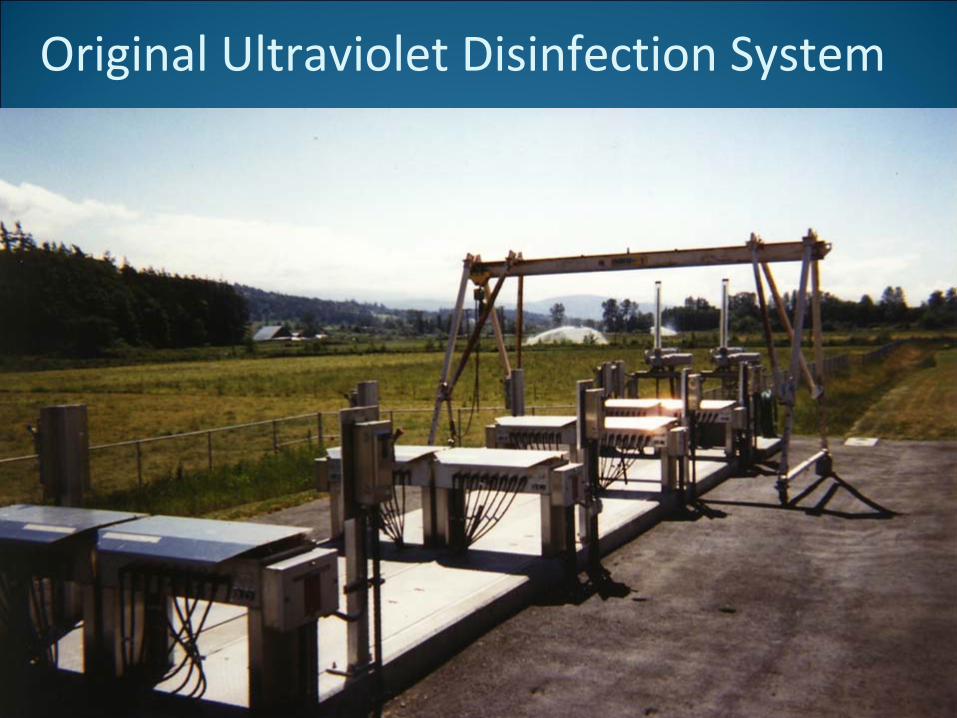
Original Ultraviolet Disinfection System
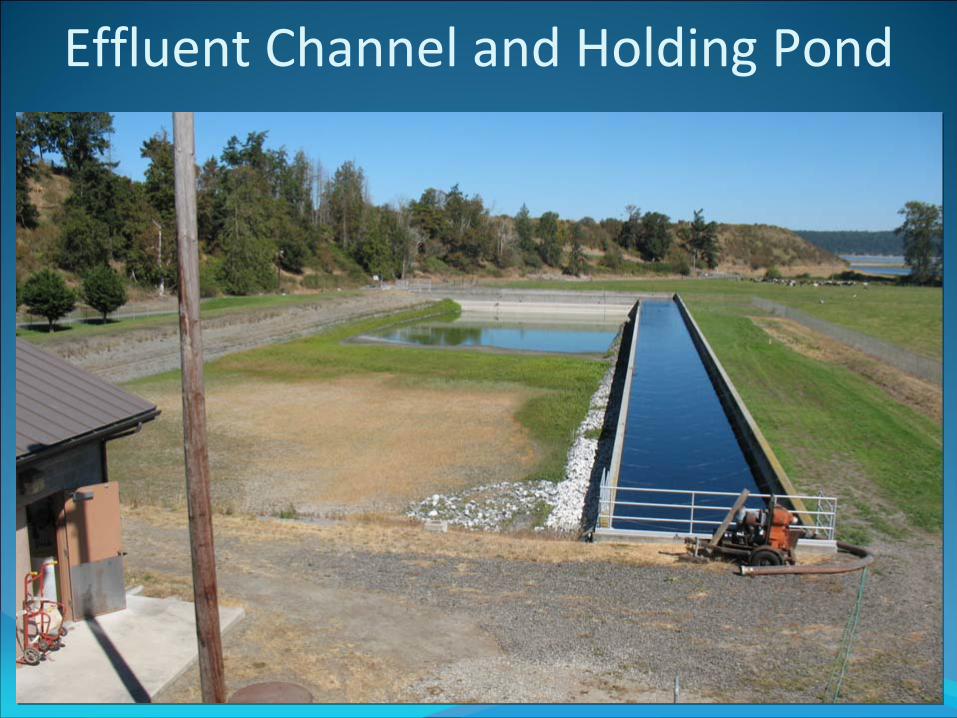
Effluent Channel and Holding Pond
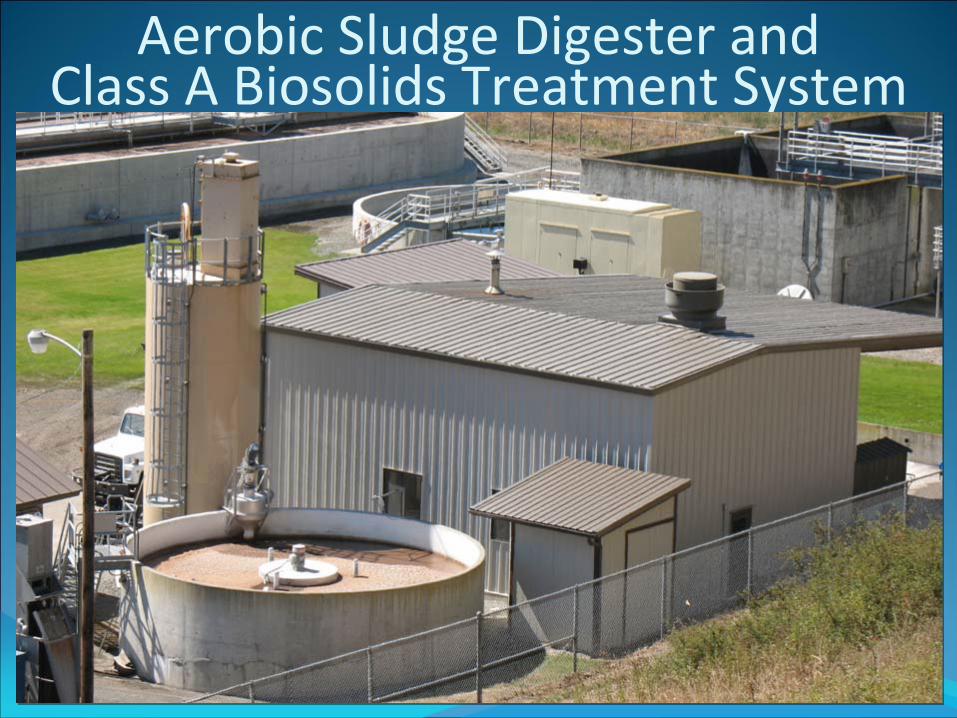
Aerobic Sludge Digester and Class A Biosolids Treatment System
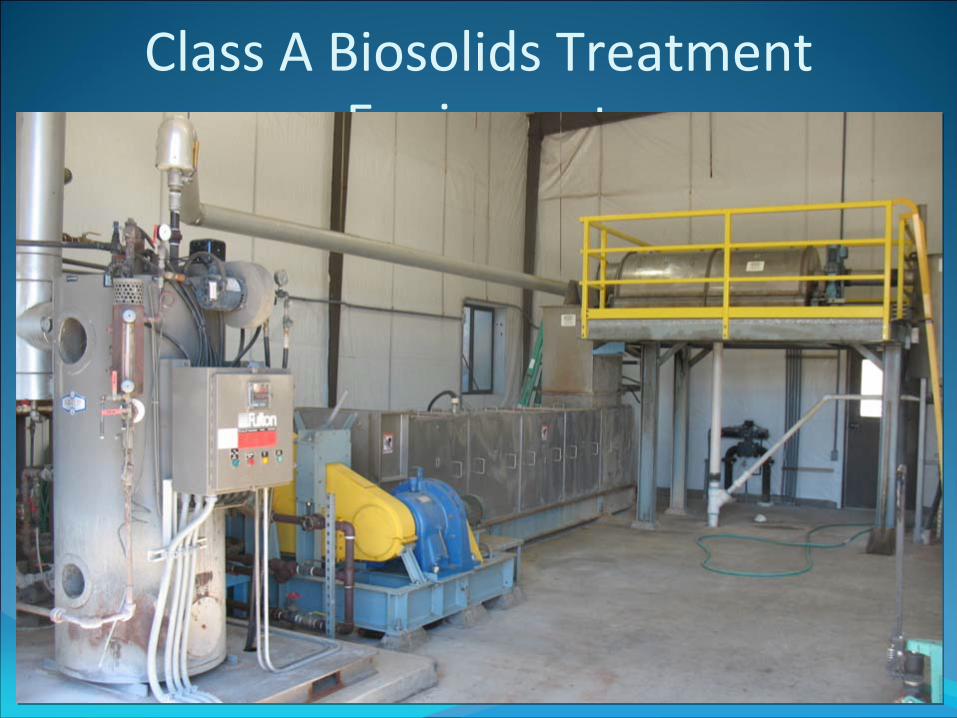
Class A Biosolids Treatment Equipment
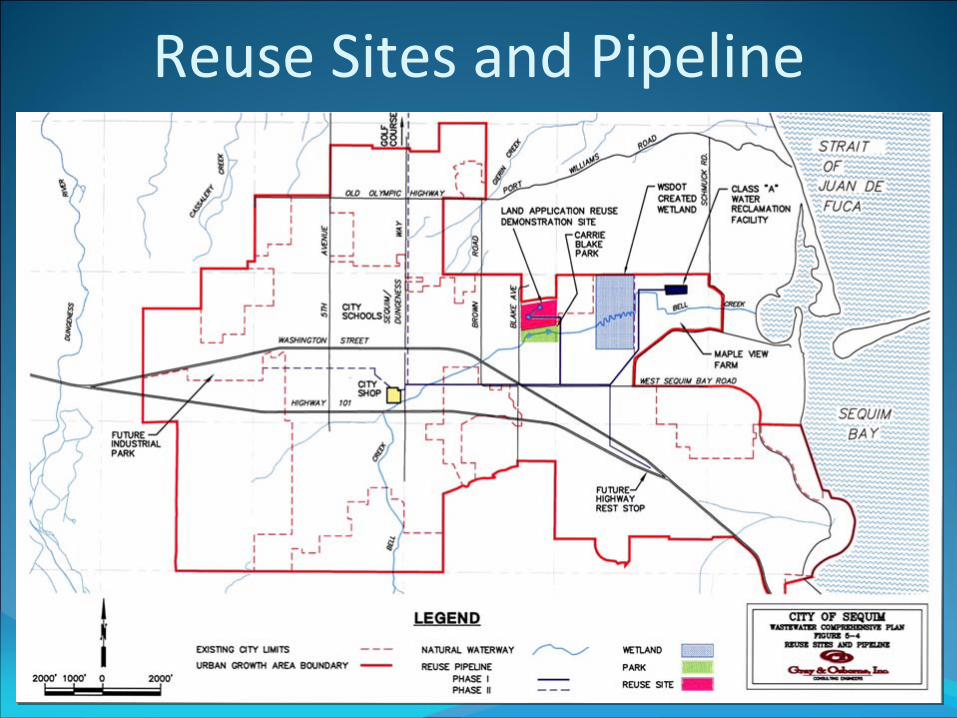
Reuse Sites and Pipeline
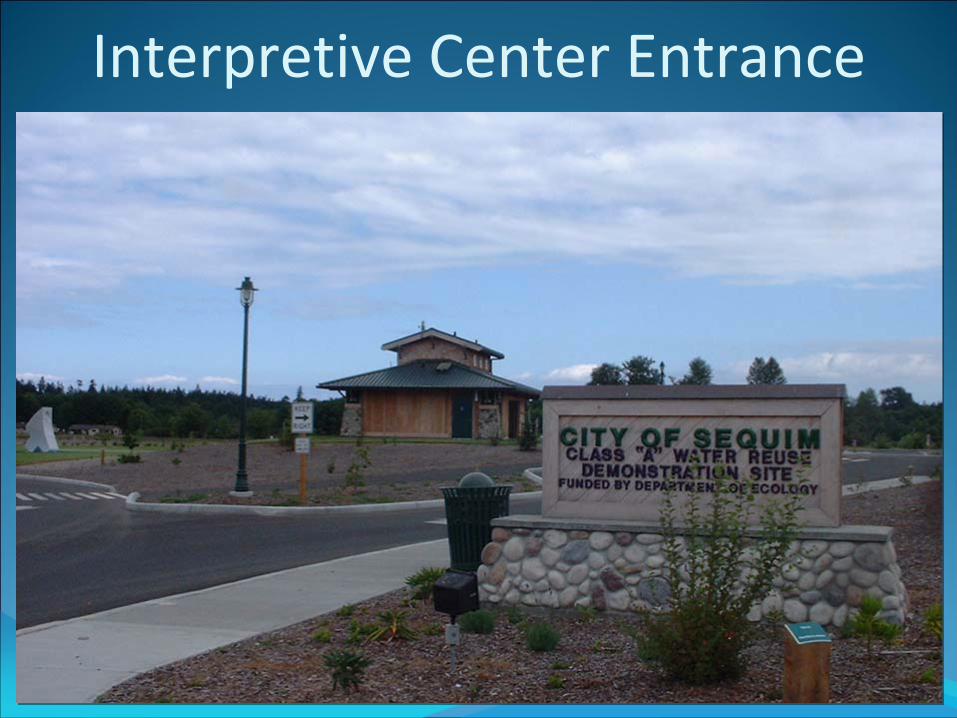
Interpretive Center Entrance
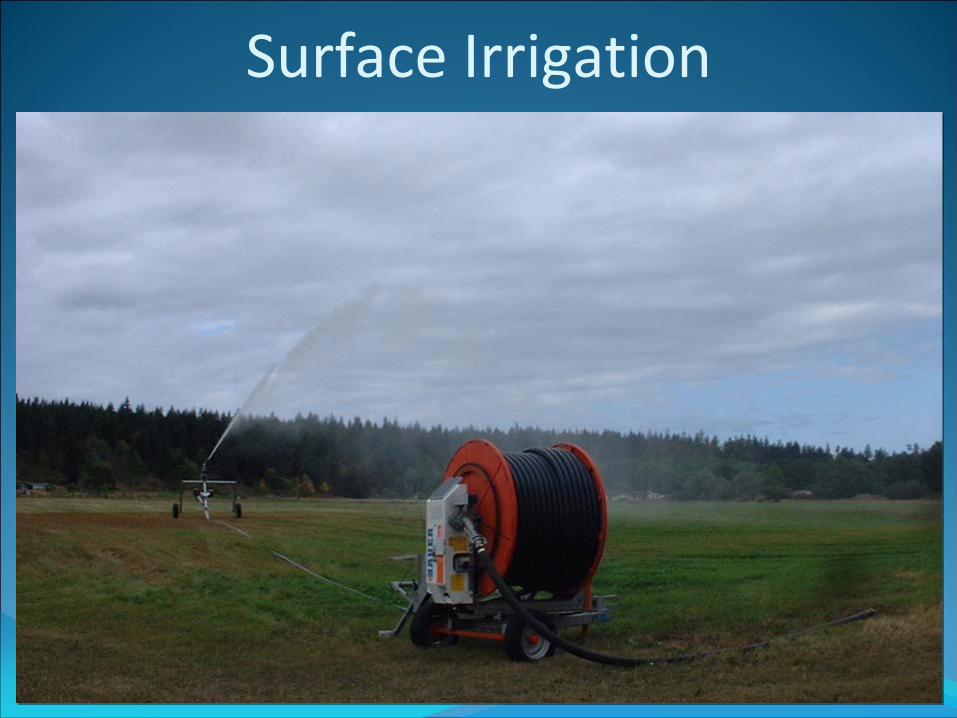
Surface Irrigation
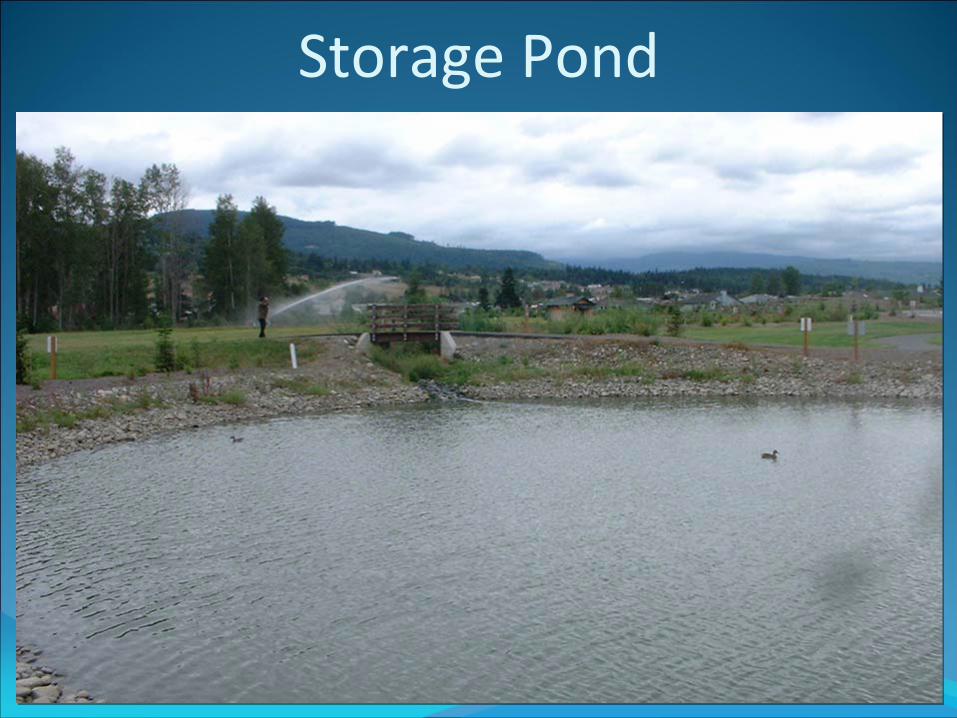
Storage Pond
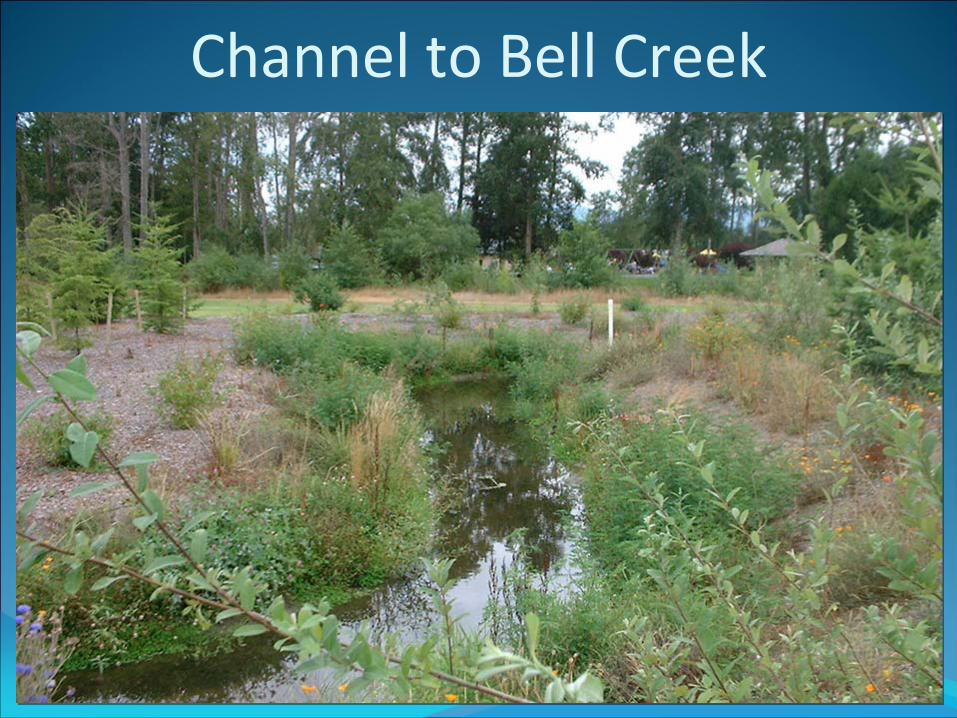
Channel to Bell Creek
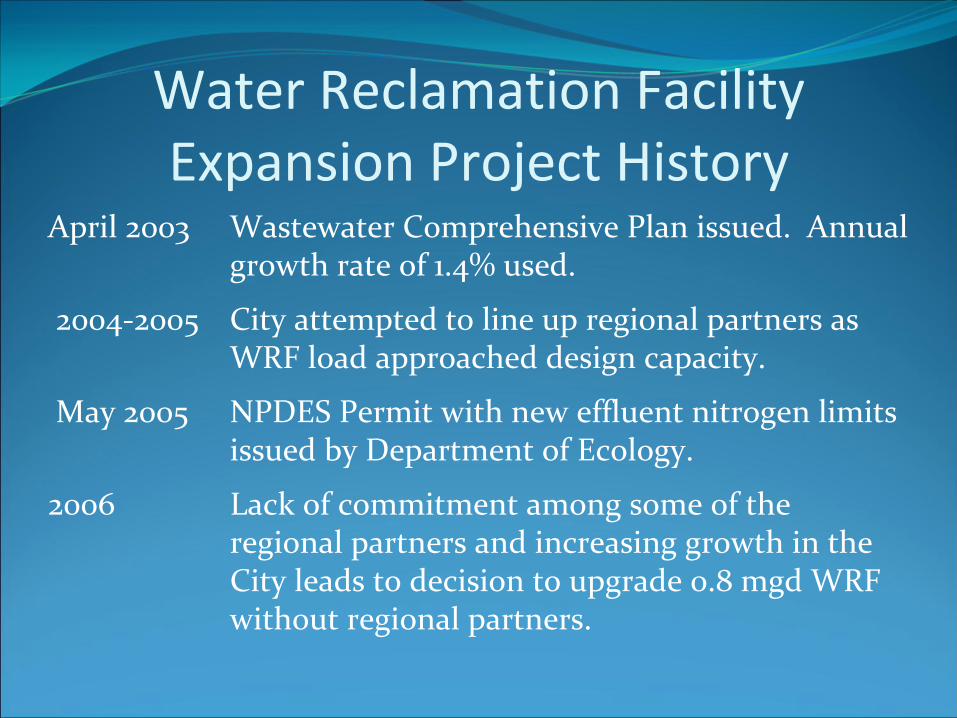
Water Reclamation Facility Expansion Project History
April 2003
Wastewater Comprehensive Plan issued. Annual growth rate of 1.4% used.
2004‐2005
City attempted to line up regional partners as WRF load approached design capacity.
May 2005 NPDES Permit with new effluent nitrogen limits
issued by Department of Ecology.
2006
Lack of commitment among some of the regional partners and increasing growth in the
City leads to decision to upgrade 0.8 mgd WRF without regional partners.
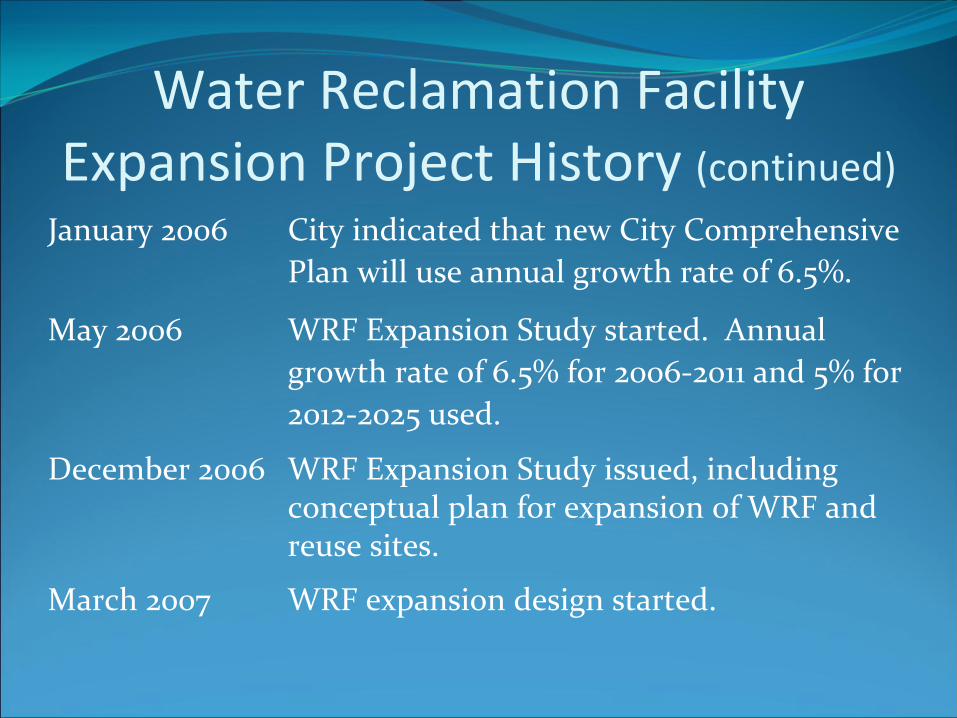
Water Reclamation Facility Expansion Project History (continued)
January 2006 City indicated that new City Comprehensive
Plan will use annual growth rate of 6.5%.
May 2006
WRF Expansion Study started. Annual growth rate of 6.5% for 2006‐2011 and 5% for
2012‐2025 used.
December 2006
WRF Expansion Study issued, including conceptual plan for expansion of WRF and
reuse sites.
March 2007 WRF expansion design started.
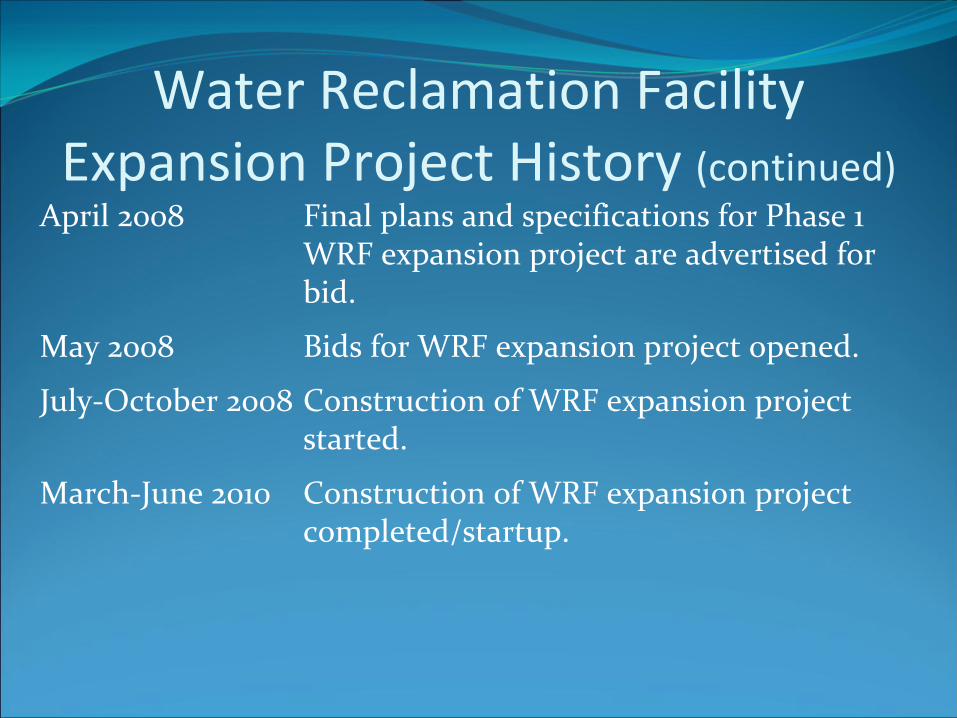
Water Reclamation Facility Expansion Project History (continued)
April 2008
Final plans and specifications for Phase 1 WRF expansion project are advertised for bid.
May 2008
Bids for WRF expansion project opened.
July‐October 2008
Construction of WRF expansion project started.
March‐June 2010
Construction of WRF expansion project completed/startup.
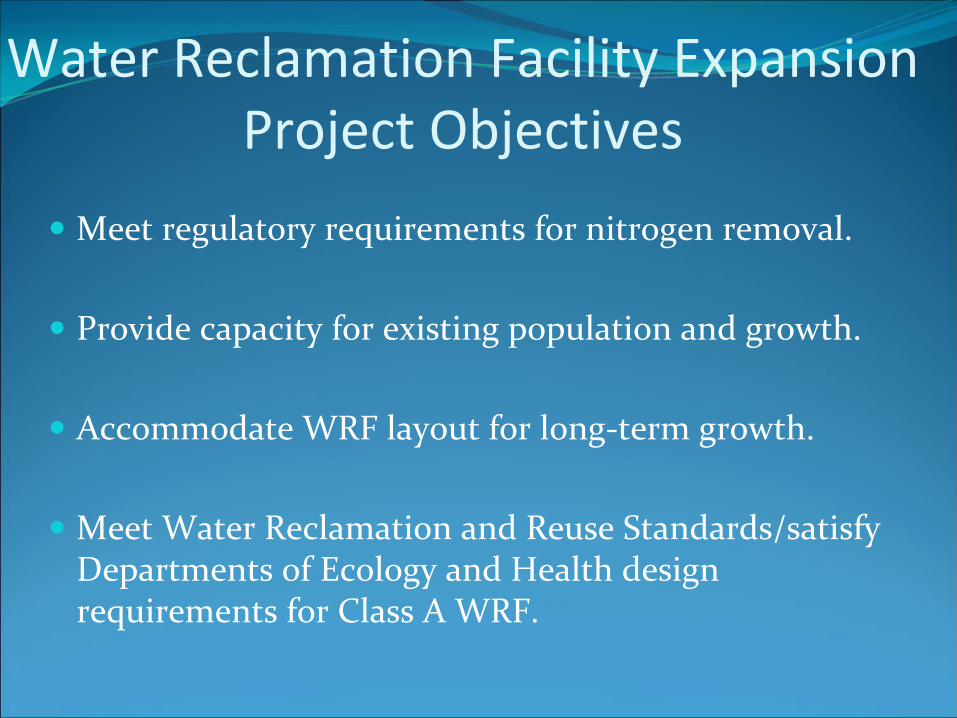
Water Reclamation Facility Expansion Project Objectives
Meet regulatory requirements for nitrogen removal.
Provide capacity for existing population and growth.
Accommodate WRF layout for long‐term growth.
Meet Water Reclamation and Reuse Standards/satisfy Departments of Ecology and Health design requirements for Class A WRF.
Water Reclamation Facility Expansion Project Objectives (Continued)
Remain on the existing WRF site.
Provide cost‐effective design (limited budget).
Allow construction phasing for future expansion.
Incorporate flow equalization.
Expand existing Class A biosolids treatment system.
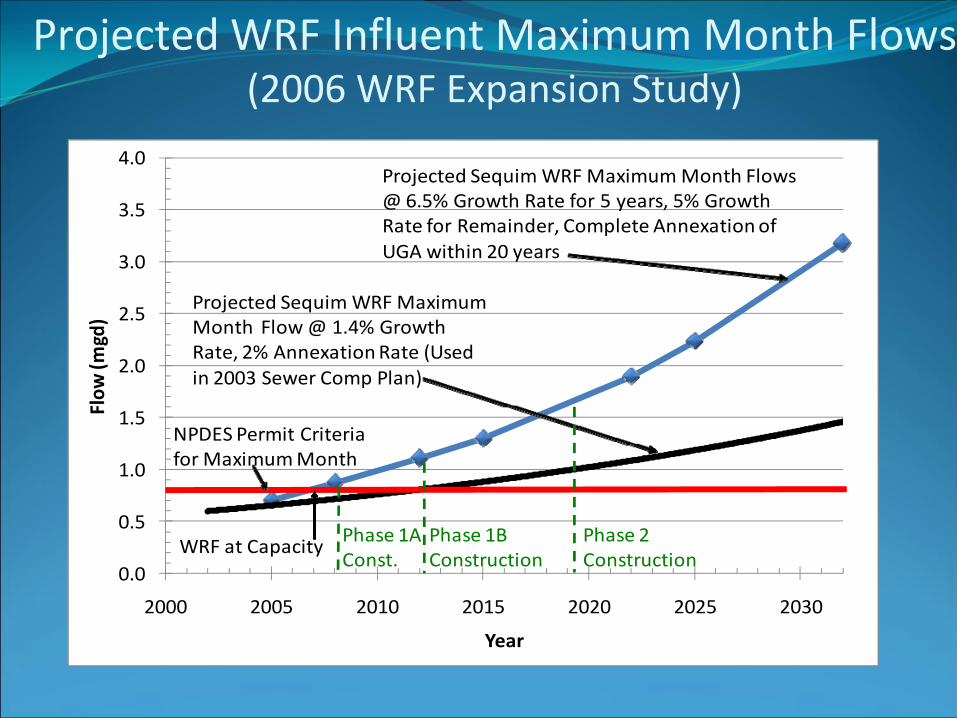
Projected WRF Influent Maximum Month Flows (2006 WRF Expansion Study)
0.0
0.5
1.0
1.5
2.0
2.5
3.0
3.5
4.0
2000 2005 2010 2015 2020 2025 2030
Flow
(mgd)
Year
NPDES Permit Criteria for Maximum Month
Projected Sequim WRF Maximum Month Flow @ 1.4% Growth Rate, 2% Annexation Rate (Used in 2003 Sewer Comp Plan)
Projected Sequim WRF Maximum Month Flows @ 6.5% Growth Rate for 5 years, 5% Growth Rate for Remainder, Complete Annexation of UGA within 20 years
WRF at Capacity Phase 1A Const.
Phase 1B Construction
Phase 2 Construction
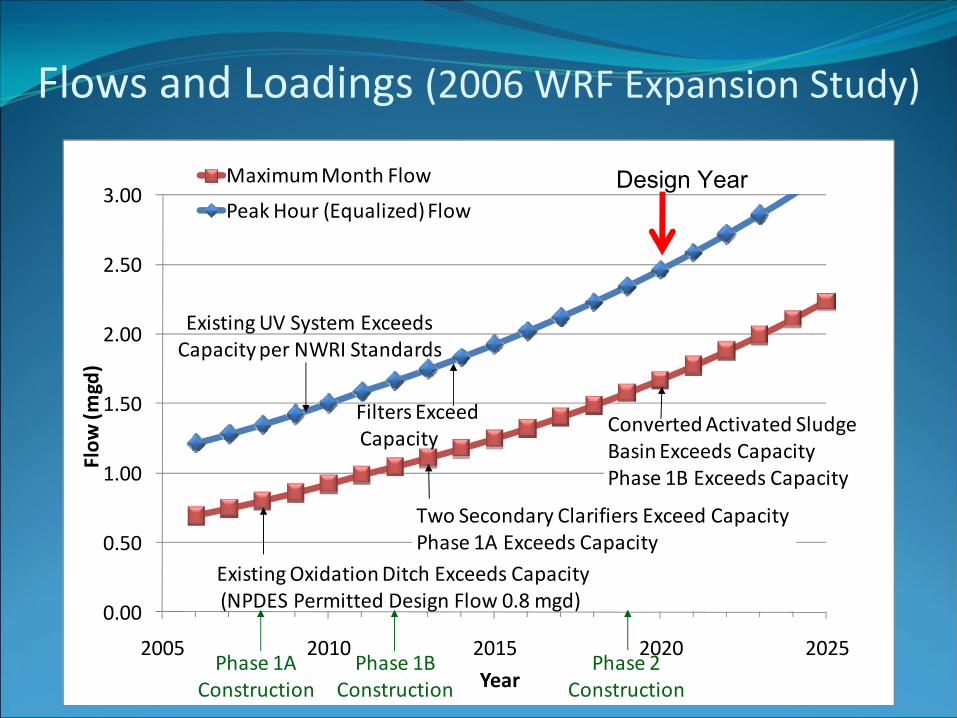
Flows and Loadings (2006 WRF Expansion Study)
0.00
0.50
1.00
1.50
2.00
2.50
3.00
2005 2010 2015 2020 2025
Flow
(mgd)
Year
Maximum Month Flow
Peak Hour (Equalized) Flow
Two Secondary Clarifiers Exceed CapacityPhase 1A Exceeds Capacity
Filters ExceedCapacity
Existing Oxidation Ditch Exceeds Capacity(NPDES Permitted Design Flow 0.8 mgd)
Existing UV System Exceeds Capacity per NWRI Standards
Converted Activated Sludge Basin Exceeds Capacity Phase 1B Exceeds Capacity
Phase 1A Construction
Phase 1B Construction
Phase 2 Construction
Design Year
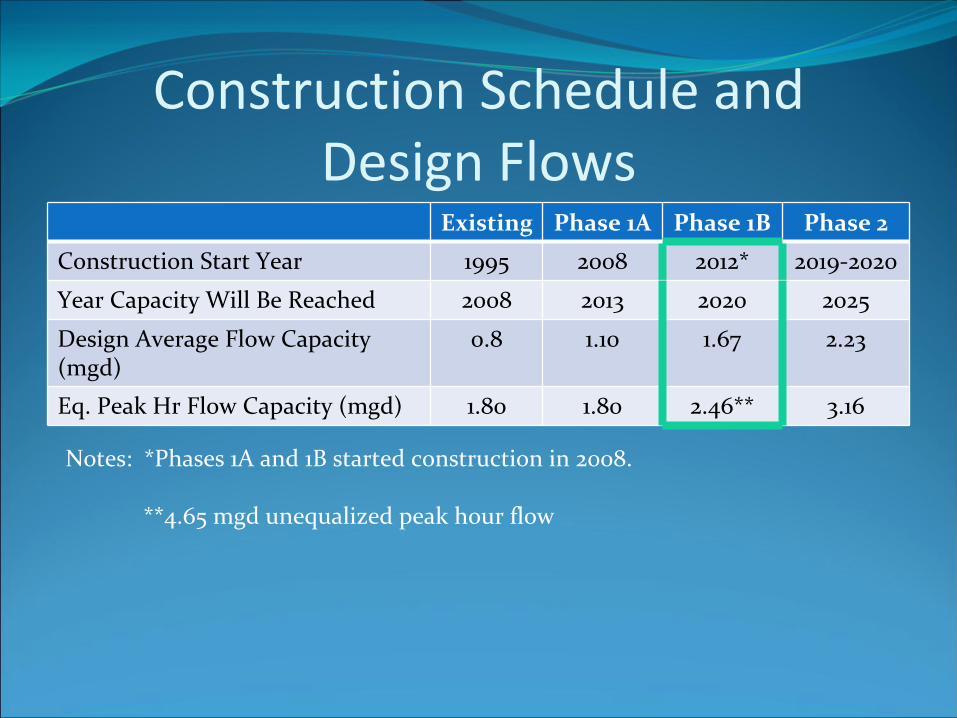
Construction Schedule and Design Flows
Existing Phase 1A Phase 1B Phase 2
Construction Start Year 1995 2008 2012* 2019‐2020
Year Capacity Will Be Reached 2008 2013 2020 2025
Design Average Flow Capacity
(mgd)
0.8 1.10 1.67 2.23
Eq. Peak Hr Flow Capacity (mgd) 1.80 1.80 2.46** 3.16
Notes: *Phases 1A and 1B started construction in 2008.
**4.65 mgd unequalized peak hour flow
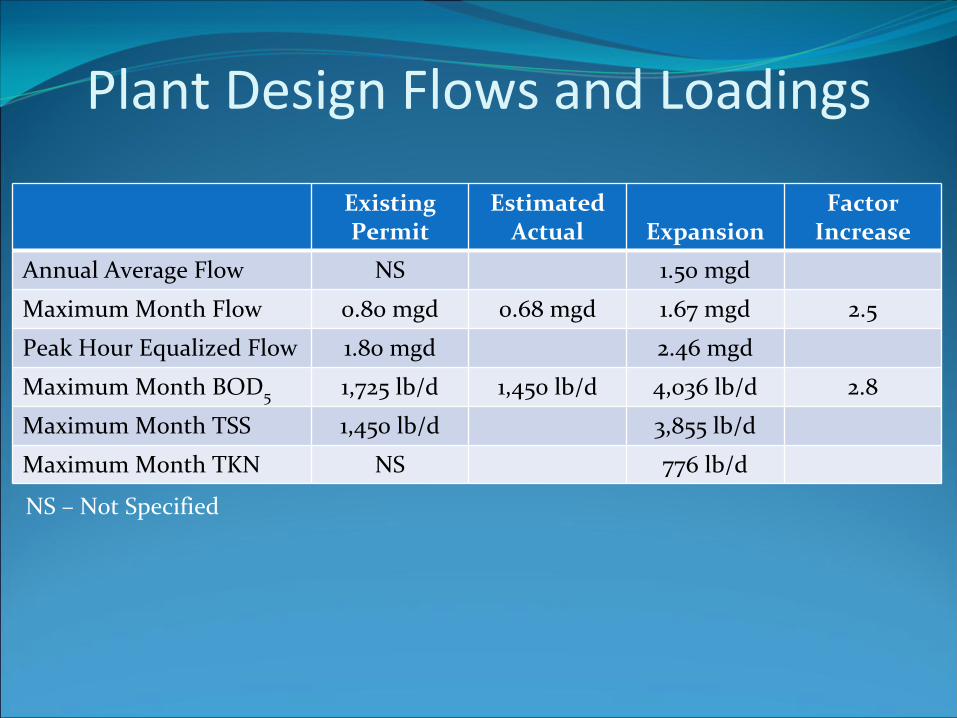
Plant Design Flows and Loadings
Existing
Permit
Estimated
Actual Expansion
Factor
Increase
Annual Average Flow NS 1.50 mgd
Maximum Month Flow 0.80 mgd 0.68 mgd 1.67 mgd 2.5
Peak Hour Equalized Flow 1.80 mgd 2.46 mgd
Maximum Month BOD5 1,725 lb/d 1,450 lb/d 4,036 lb/d 2.8
Maximum Month TSS 1,450 lb/d 3,855 lb/d
Maximum Month TKN NS 776 lb/d
NS – Not Specified
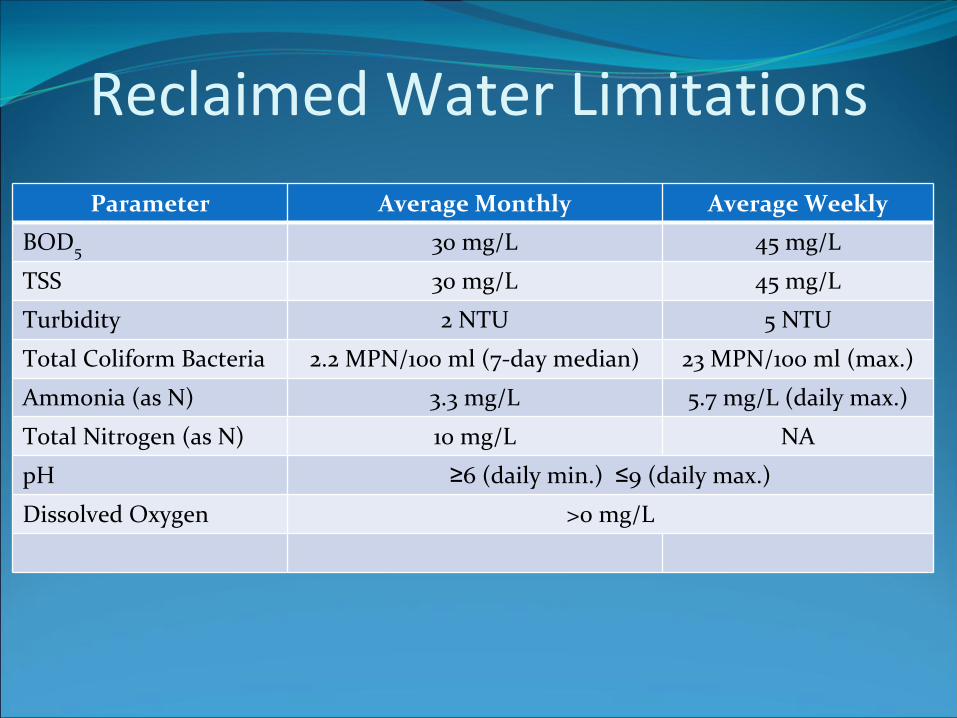
Reclaimed Water Limitations
Parameter Average Monthly Average Weekly
BOD5 30 mg/L 45 mg/L
TSS 30 mg/L 45 mg/L
Turbidity 2 NTU 5 NTU
Total Coliform Bacteria 2.2 MPN/100 ml (7‐day median) 23 MPN/100 ml (max.)
Ammonia (as N) 3.3 mg/L 5.7 mg/L (daily max.)
Total Nitrogen (as N) 10 mg/L NA
pH ≥6 (daily min.) ≤9 (daily max.)
Dissolved Oxygen >0 mg/L
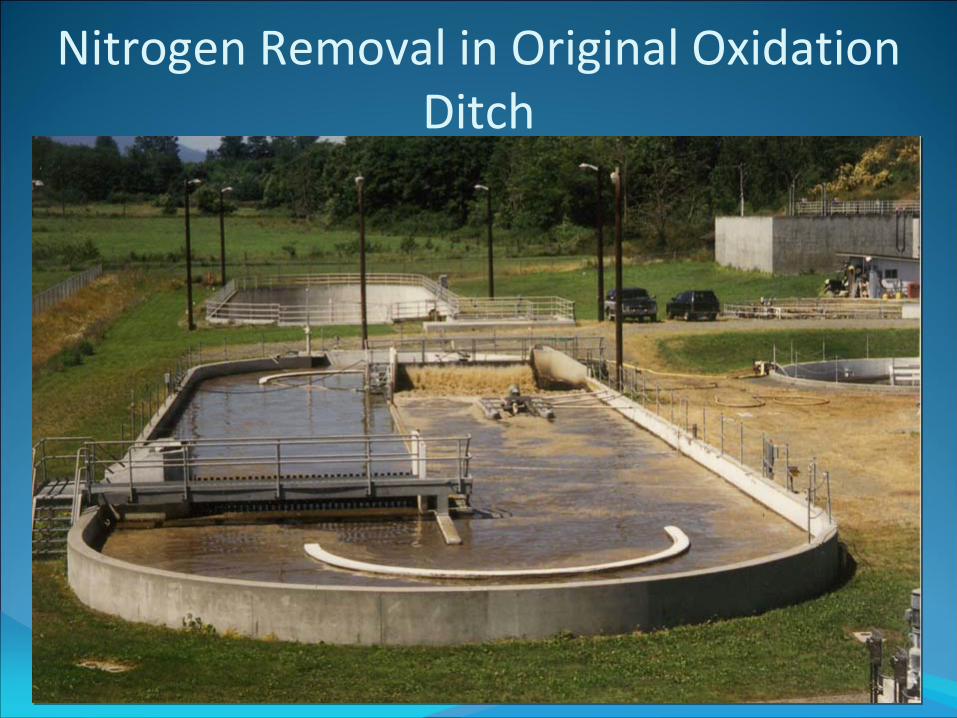
Nitrogen Removal in Original Oxidation Ditch
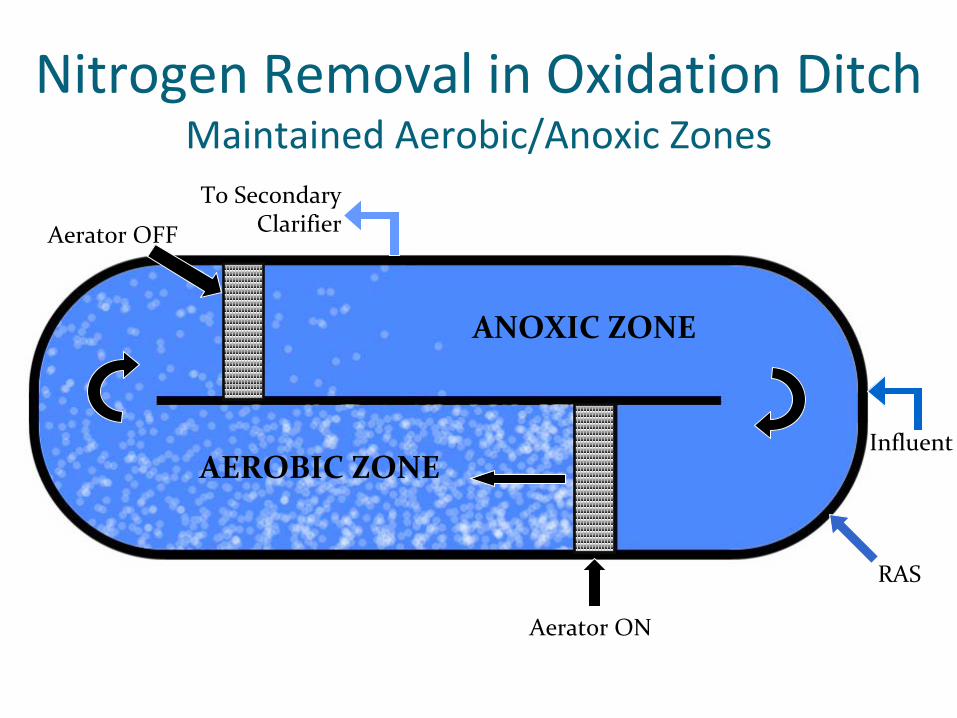
Nitrogen Removal in Oxidation Ditch Maintained Aerobic/Anoxic Zones
To SecondaryClarifier
Influent
RAS
Aerator ON
AEROBIC ZONE
ANOXIC ZONE
Aerator OFF
WRF Expansion Options Evaluated
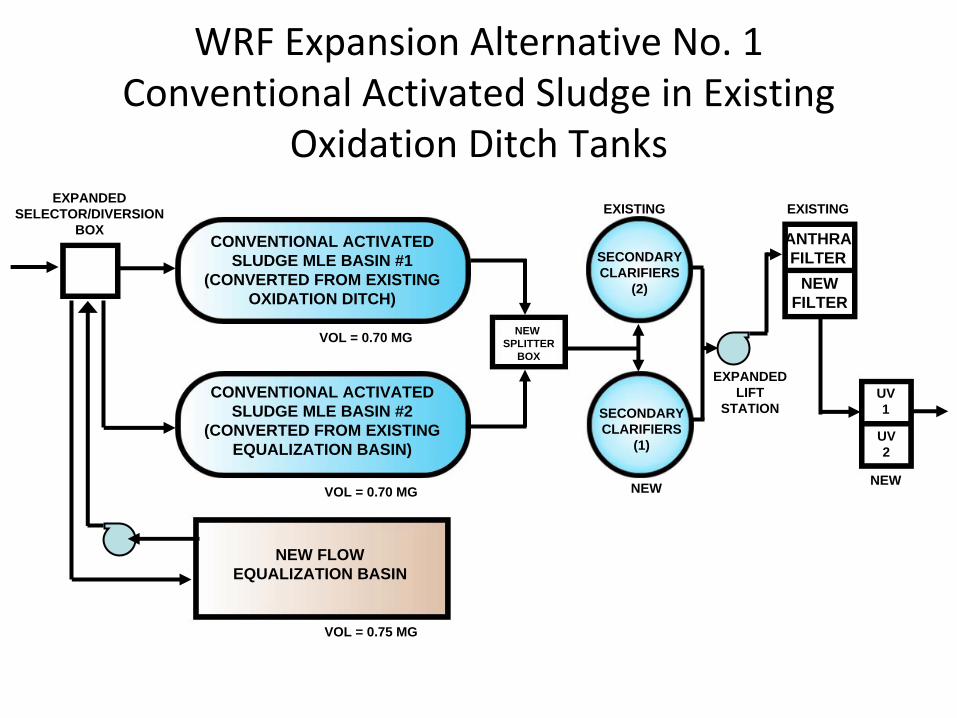
NEW FLOWEQUALIZATION BASIN
CONVENTIONAL ACTIVATEDSLUDGE MLE BASIN #1
(CONVERTED FROM EXISTINGOXIDATION DITCH)
CONVENTIONAL ACTIVATEDSLUDGE MLE BASIN #2
(CONVERTED FROM EXISTINGEQUALIZATION BASIN)
SECONDARYCLARIFIERS
(2)
SECONDARYCLARIFIERS
(1)
EXPANDEDSELECTOR/DIVERSION
BOX
NEW SPLITTER
BOX
ANTHRAFILTER
NEWFILTER
UV1
UV2
EXISTING
NEW
EXISTING
NEW
VOL = 0.75 MG
EXPANDED LIFT
STATION
WRF Expansion Alternative No. 1 Conventional Activated Sludge in Existing
Oxidation Ditch Tanks
VOL = 0.70 MG
VOL = 0.70 MG
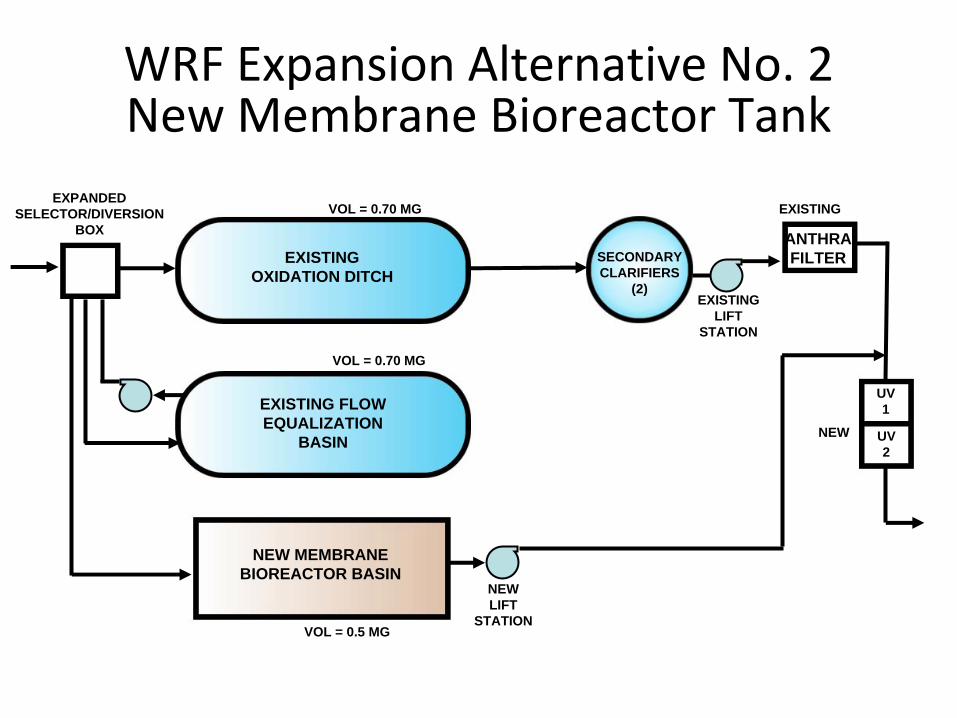
NEW MEMBRANEBIOREACTOR BASIN
EXISTINGOXIDATION DITCH
EXISTING FLOWEQUALIZATION
BASIN
SECONDARYCLARIFIERS
(2)
EXPANDEDSELECTOR/DIVERSION
BOX ANTHRAFILTER
UV1
UV2
EXISTINGLIFT
STATION
NEWLIFT
STATION
NEW
EXISTING
VOL = 0.5 MG
VOL = 0.70 MG
VOL = 0.70 MG
WRF Expansion Alternative No. 2 New Membrane Bioreactor Tank
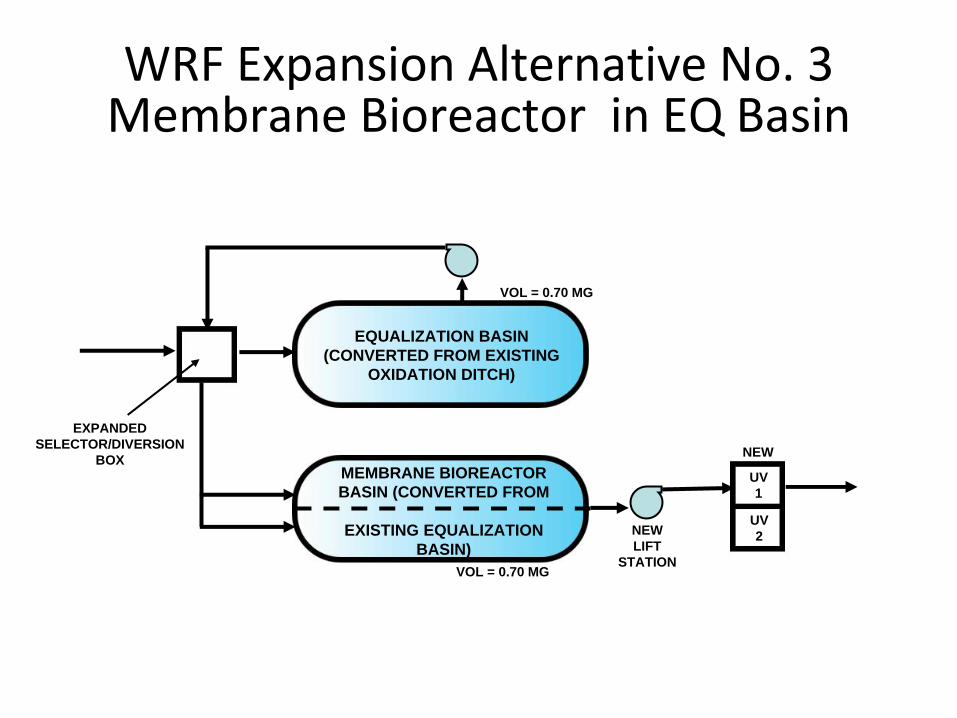
EQUALIZATION BASIN(CONVERTED FROM EXISTING
OXIDATION DITCH)
MEMBRANE BIOREACTORBASIN (CONVERTED FROM
EXISTING EQUALIZATIONBASIN)
EXPANDEDSELECTOR/DIVERSION
BOXUV1
UV2NEW
LIFTSTATION
VOL = 0.70 MG
VOL = 0.70 MG
NEW
WRF Expansion Alternative No. 3 Membrane Bioreactor in EQ Basin
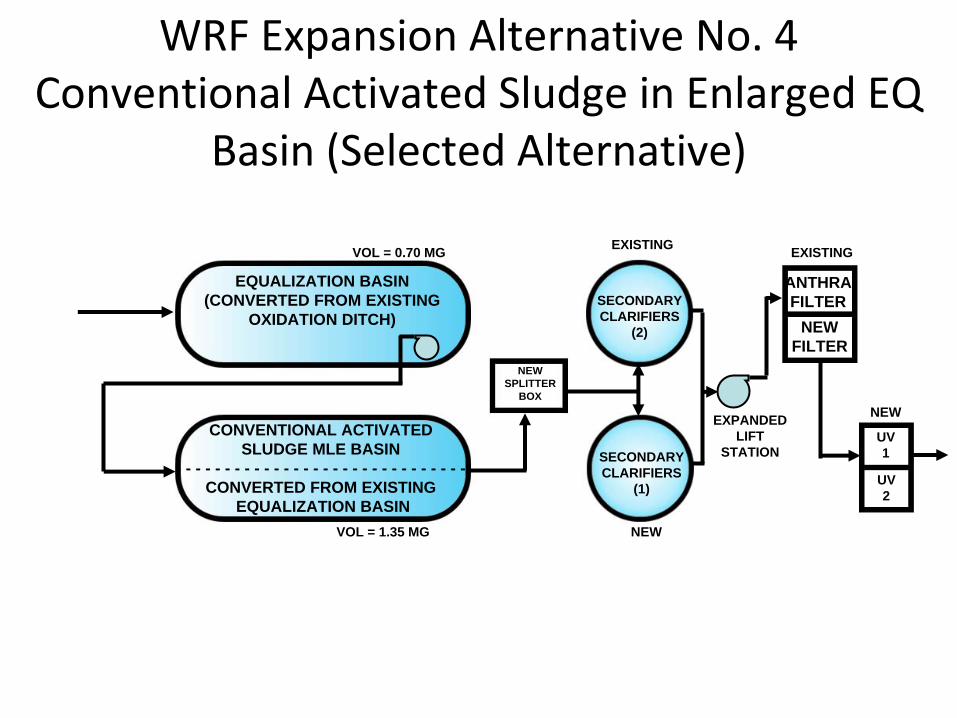
EQUALIZATION BASIN(CONVERTED FROM EXISTING
OXIDATION DITCH)
CONVENTIONAL ACTIVATEDSLUDGE MLE BASIN
- - - - - - - - - - - - - - - - - - - - - - - - - - - - - -CONVERTED FROM EXISTING
EQUALIZATION BASIN
SECONDARYCLARIFIERS
(2)
SECONDARYCLARIFIERS
(1)
NEW SPLITTER
BOX
ANTHRAFILTER
NEWFILTER
UV1
UV2
EXISTING
NEW
EXISTING
NEWEXPANDED LIFT
STATION
VOL = 0.70 MG
VOL = 1.35 MG
WRF Expansion Alternative No. 4 Conventional Activated Sludge in Enlarged EQ
Basin (Selected Alternative)
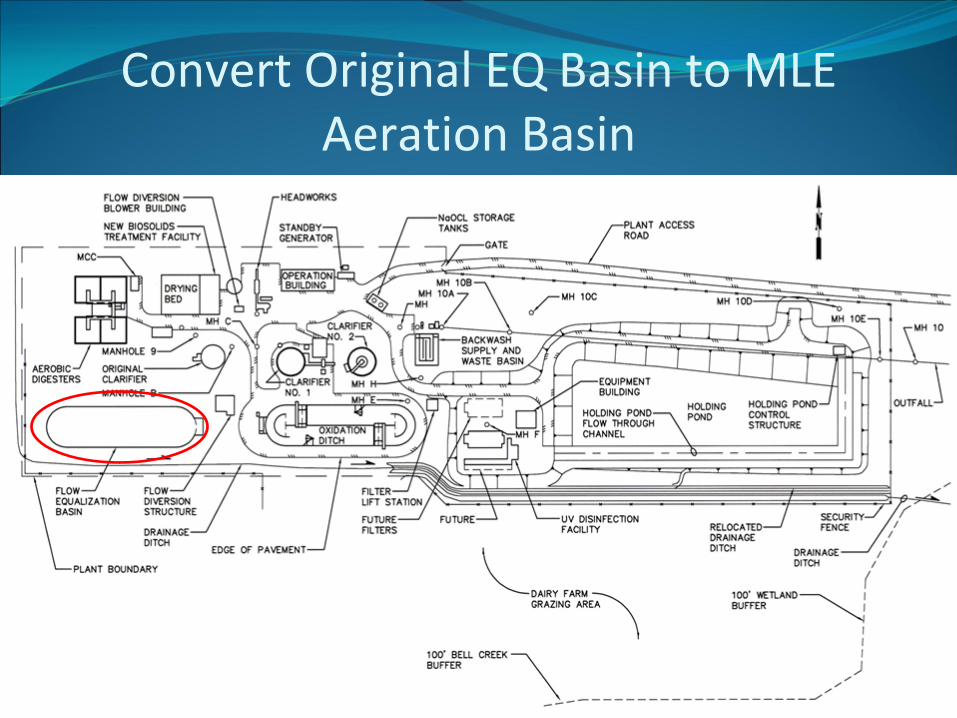
Convert Original EQ Basin to MLE Aeration Basin
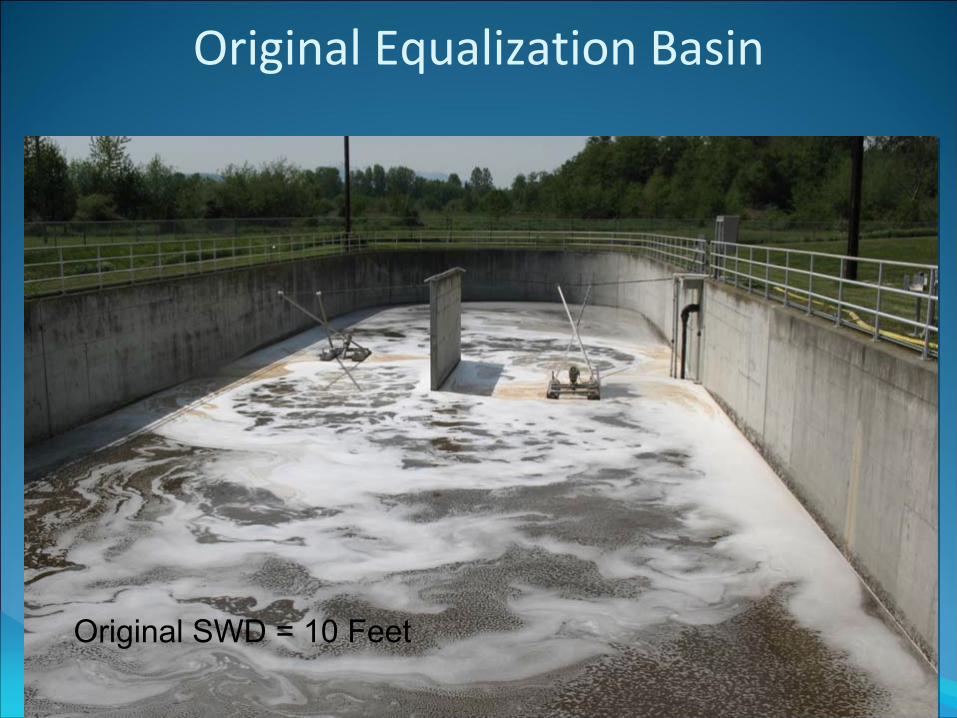
Original Equalization Basin
Original SWD = 10 Feet
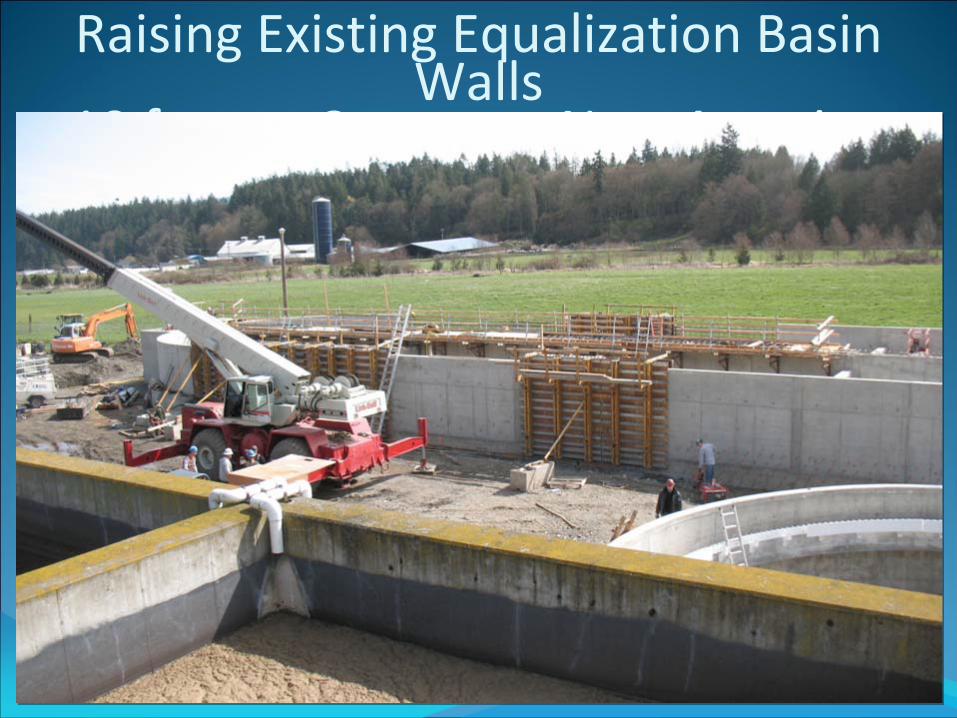
Raising Existing Equalization Basin Walls
10 feet to Construct New Aeration Basin
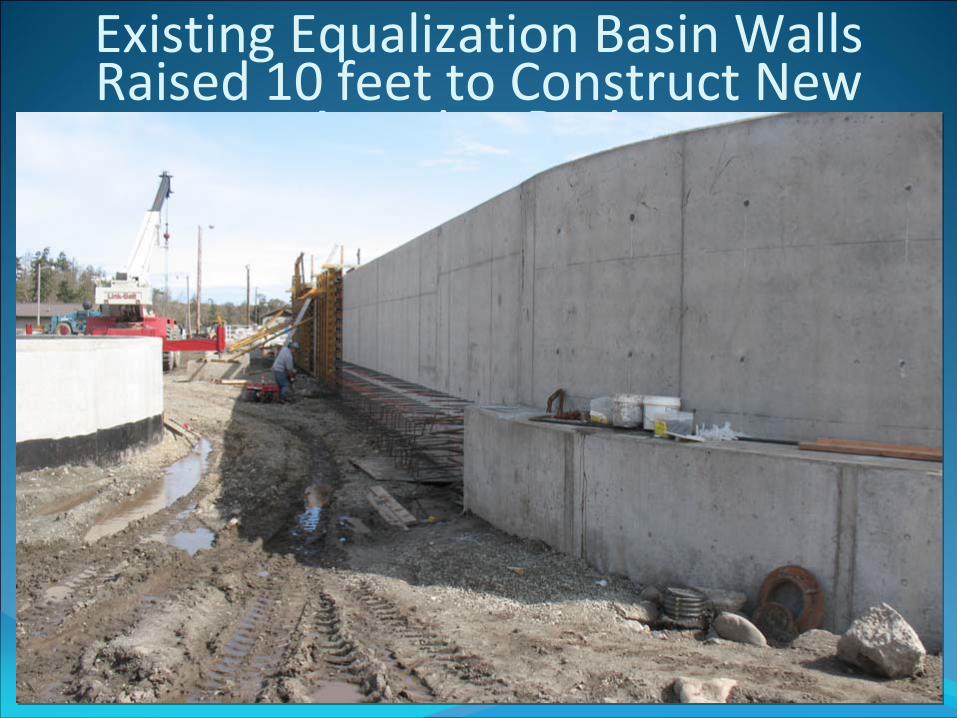
Existing Equalization Basin Walls Raised 10 feet to Construct New Aeration Basin
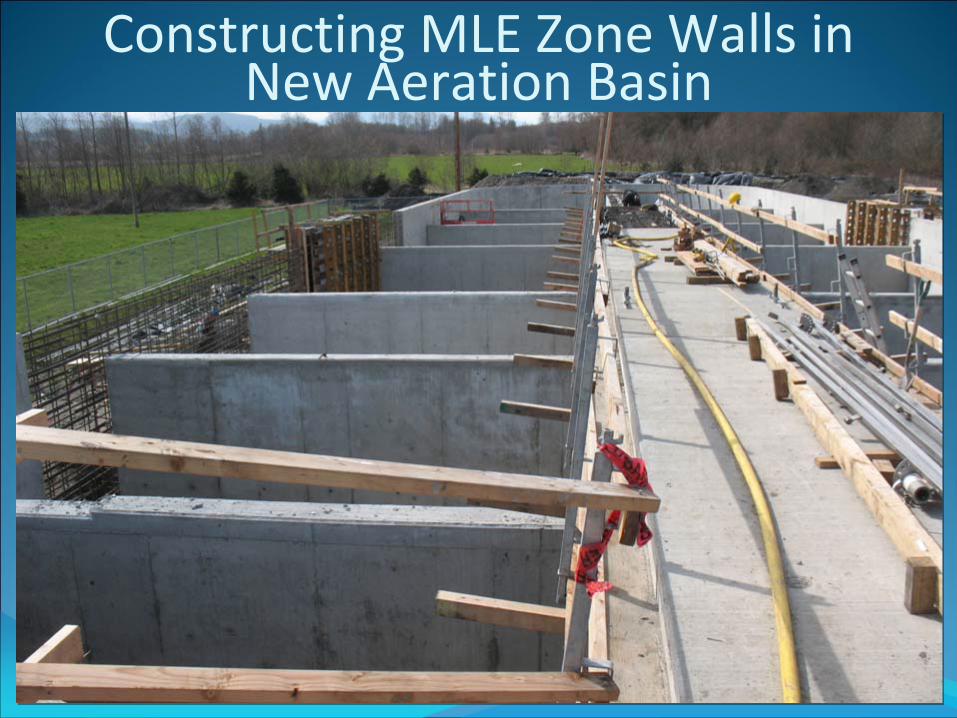
Constructing MLE Zone Walls in New Aeration Basin
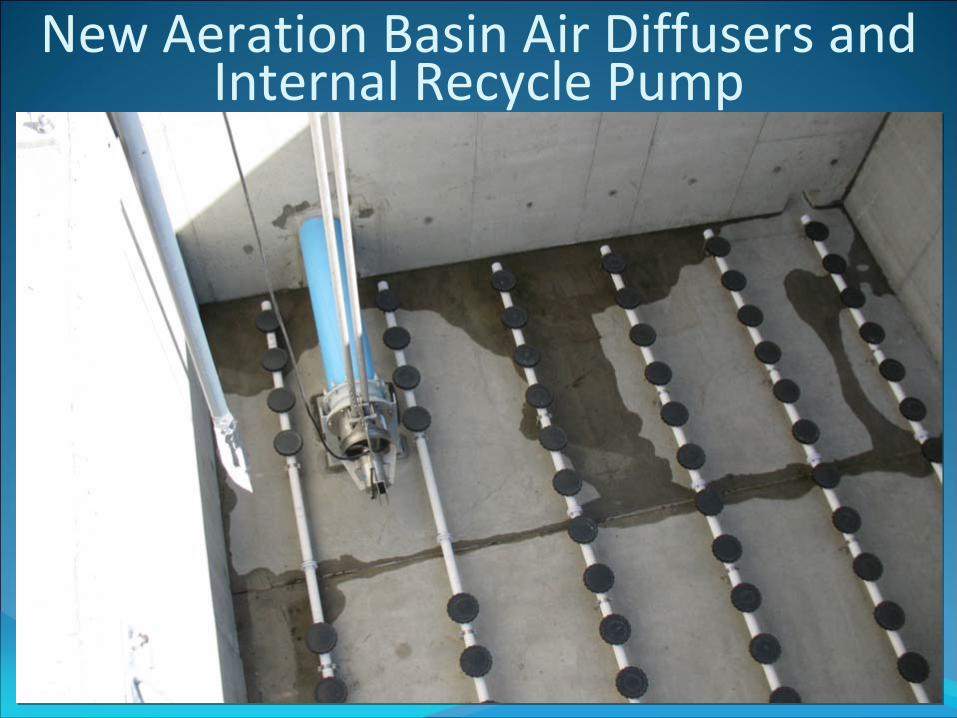
New Aeration Basin Air Diffusers and Internal Recycle Pump
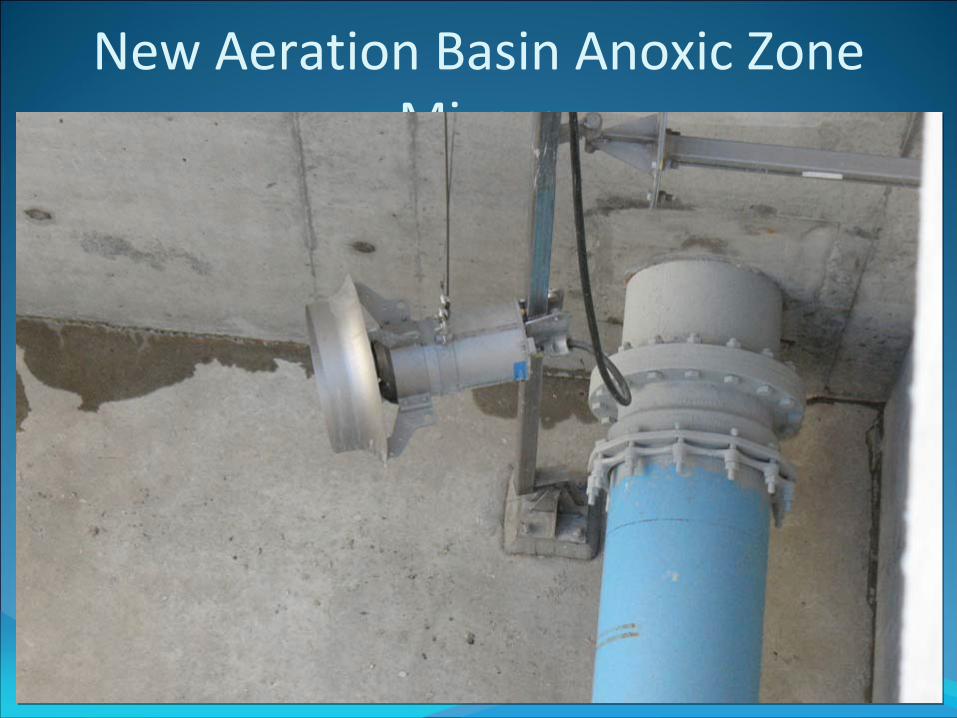
New Aeration Basin Anoxic Zone Mixers
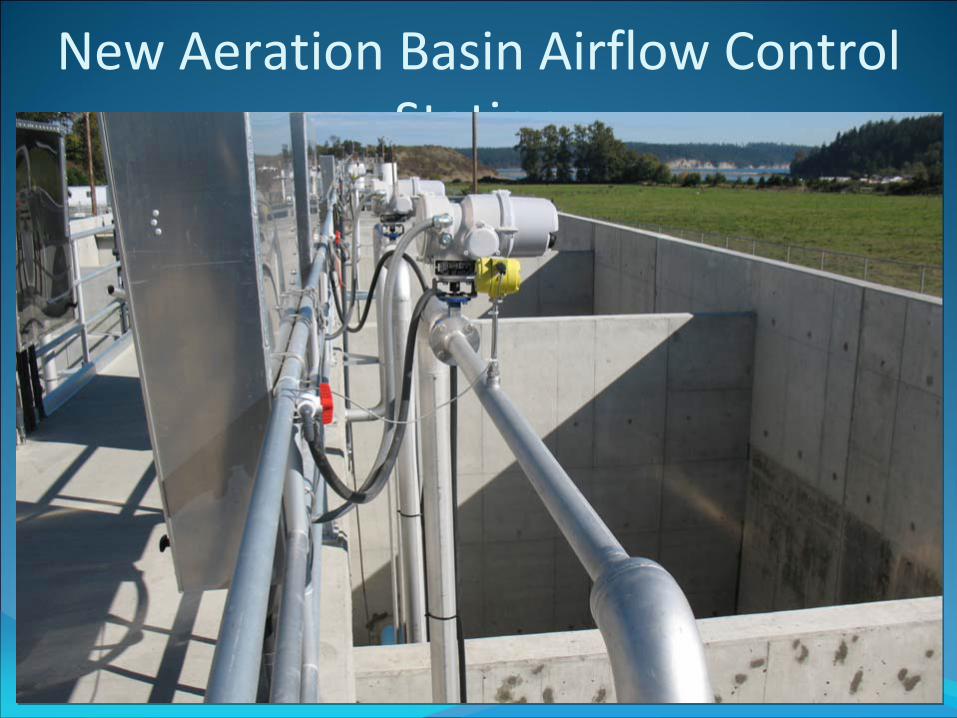
New Aeration Basin Airflow Control Station
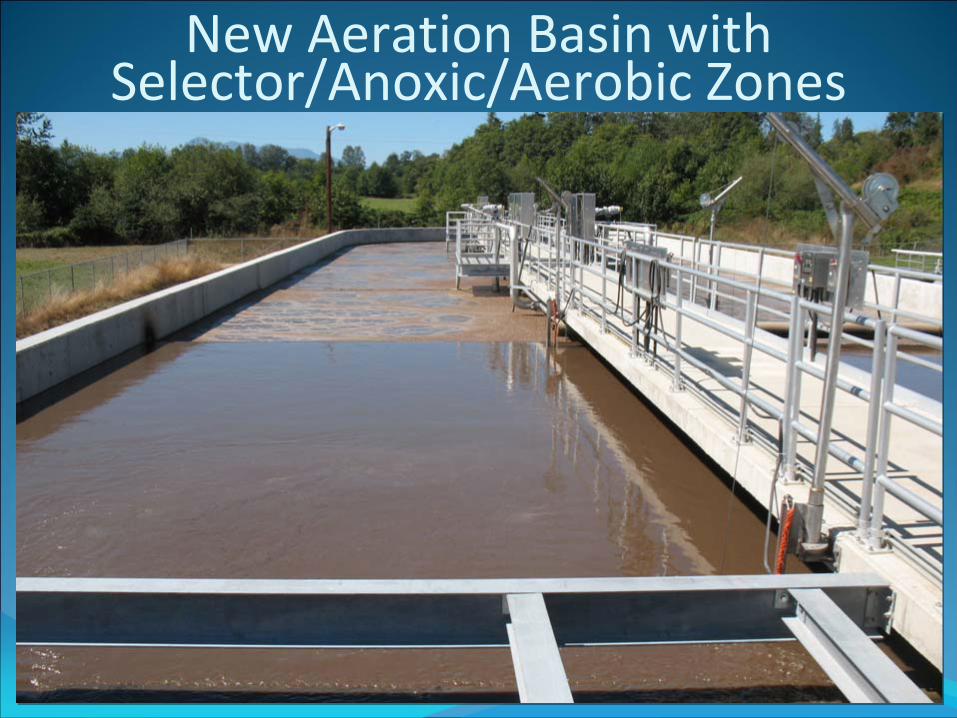
New Aeration Basin with Selector/Anoxic/Aerobic Zones
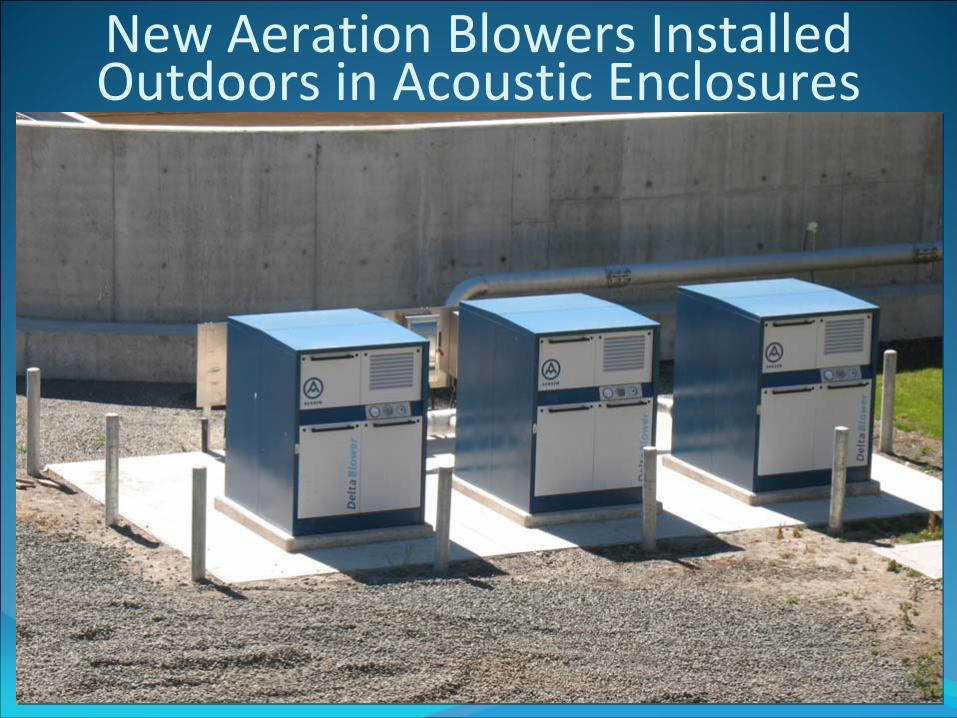
New Aeration Blowers Installed Outdoors in Acoustic Enclosures
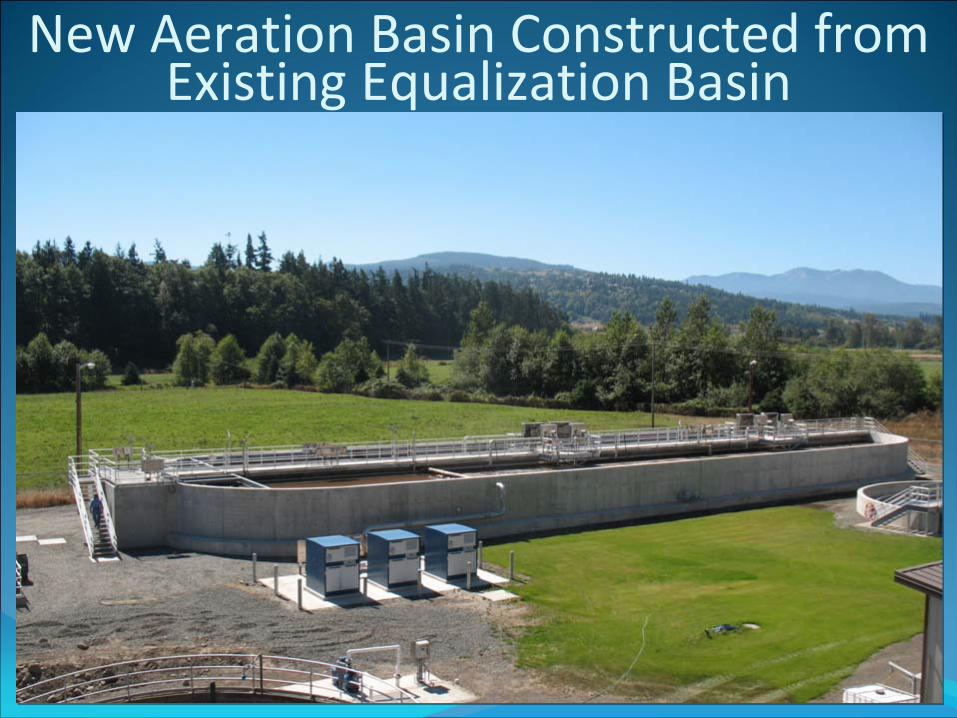
New Aeration Basin Constructed from Existing Equalization Basin
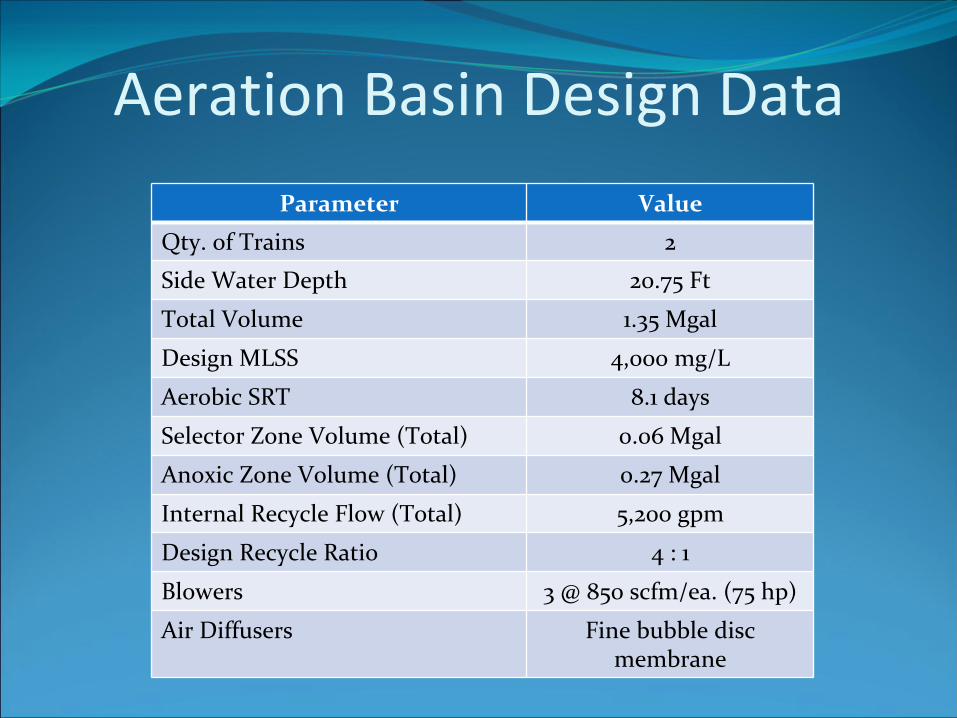
Aeration Basin Design Data
Parameter Value
Qty. of Trains 2
Side Water Depth 20.75 Ft
Total Volume 1.35 Mgal
Design MLSS 4,000 mg/L
Aerobic SRT 8.1 days
Selector Zone Volume (Total) 0.06 Mgal
Anoxic Zone Volume (Total) 0.27 Mgal
Internal Recycle Flow (Total) 5,200 gpm
Design Recycle Ratio 4 : 1
Blowers 3 @ 850 scfm/ea. (75 hp)
Air Diffusers Fine bubble disc
membrane
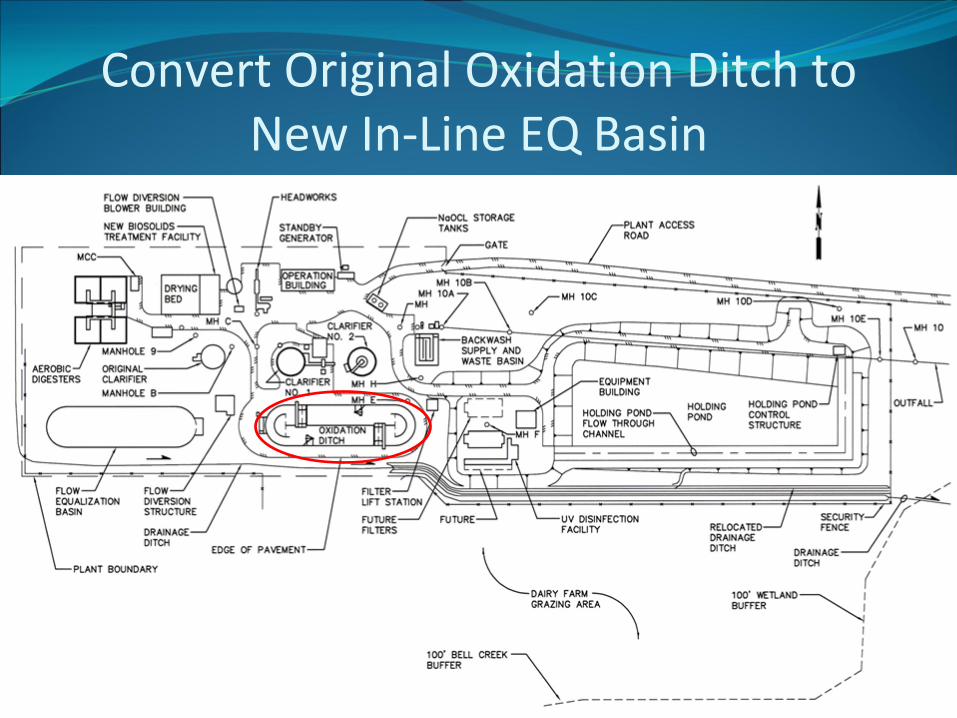
Convert Original Oxidation Ditch to New In‐Line EQ Basin
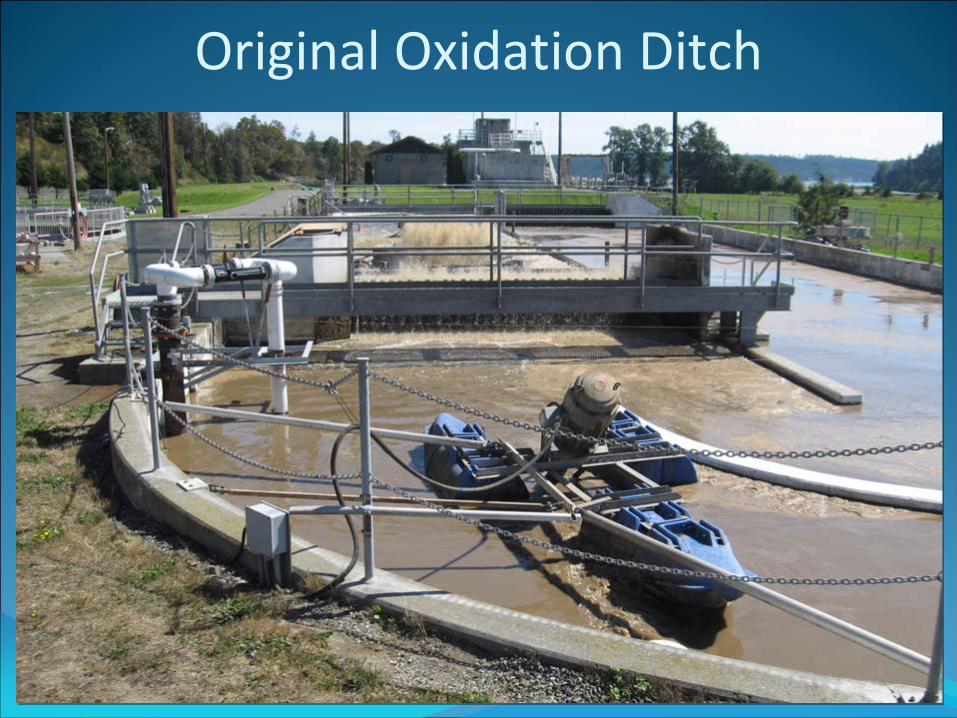
Original Oxidation Ditch
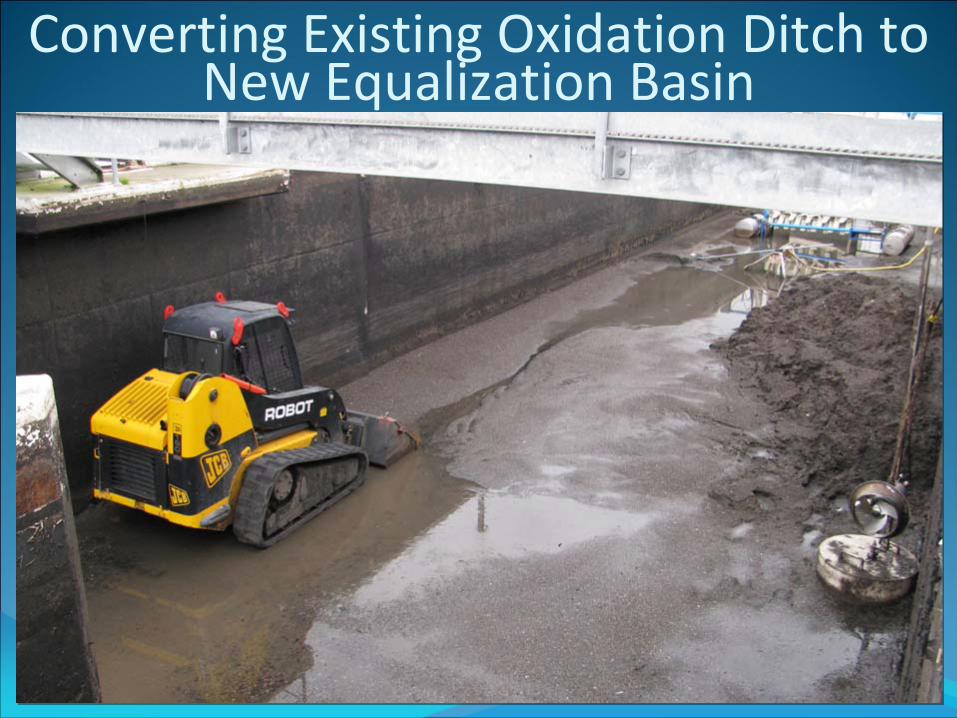
Converting Existing Oxidation Ditch to New Equalization Basin
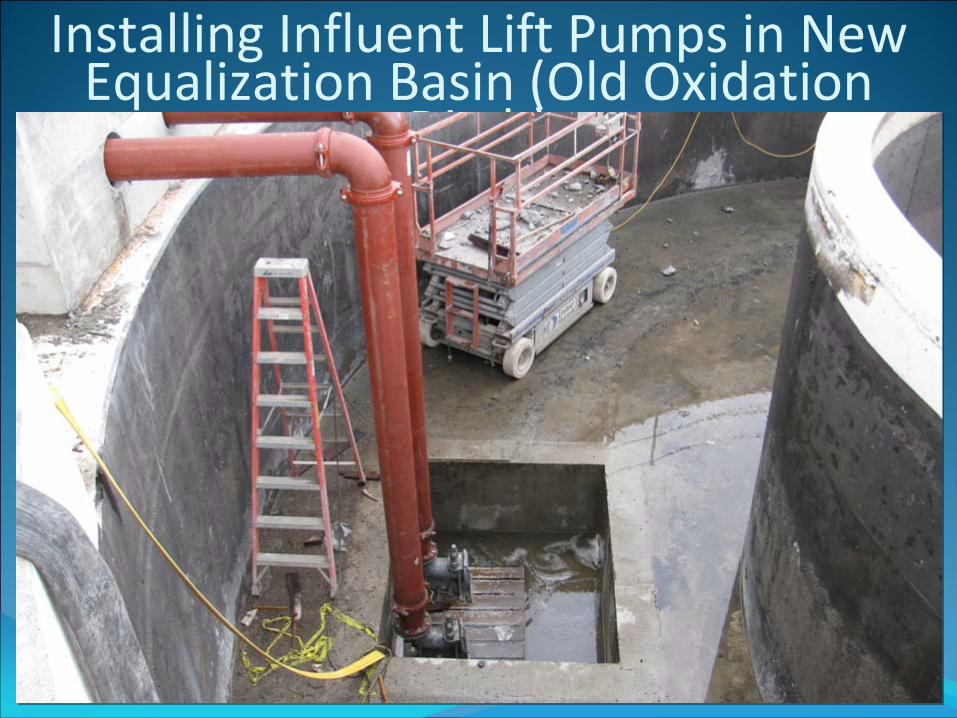
Installing Influent Lift Pumps in New Equalization Basin (Old Oxidation
Ditch)
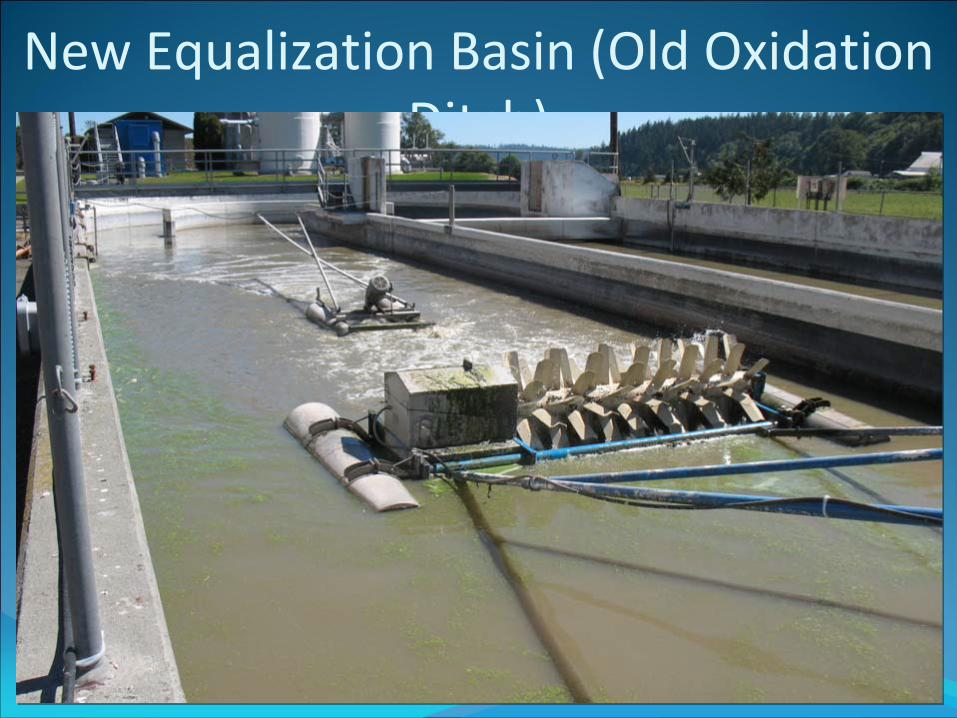
New Equalization Basin (Old Oxidation Ditch)
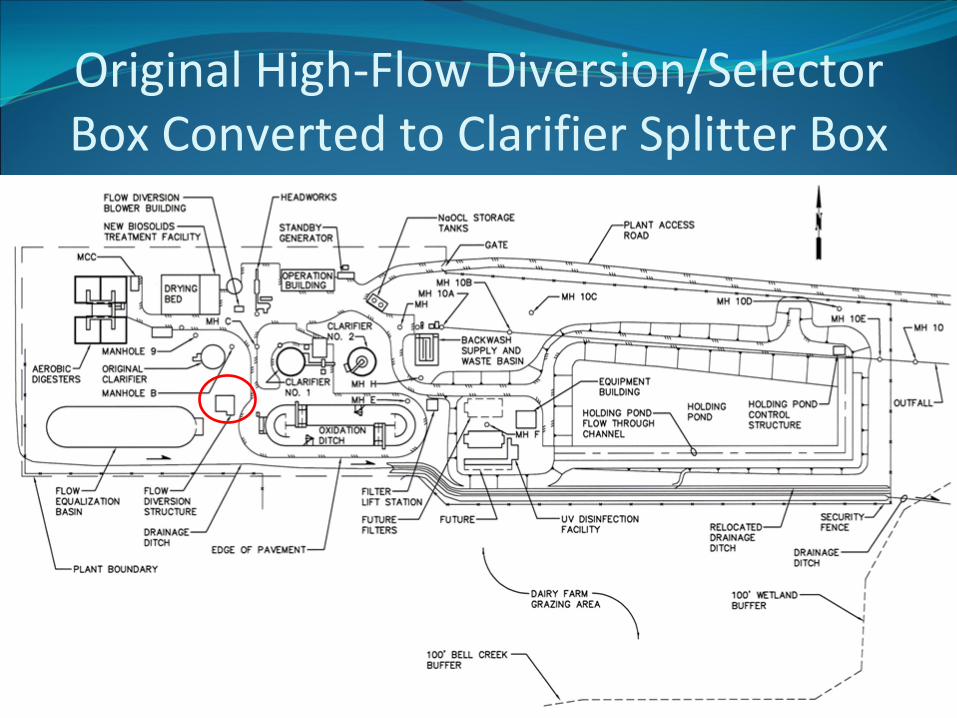
Original High‐Flow Diversion/Selector Box Converted to Clarifier Splitter Box
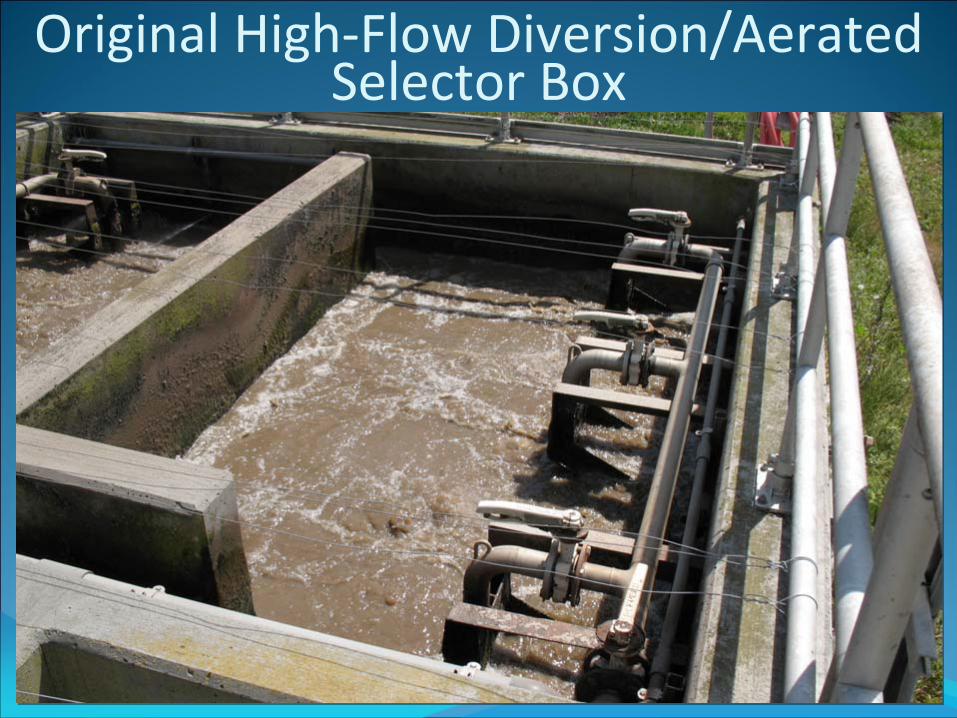
Original High‐Flow Diversion/Aerated Selector Box
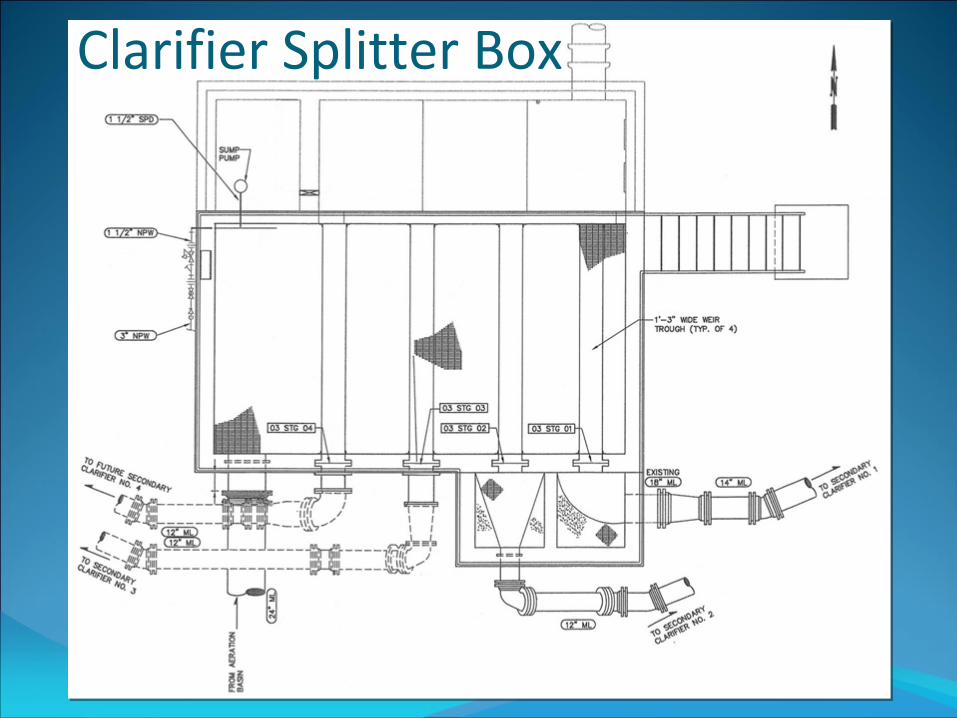
Clarifier Splitter Box
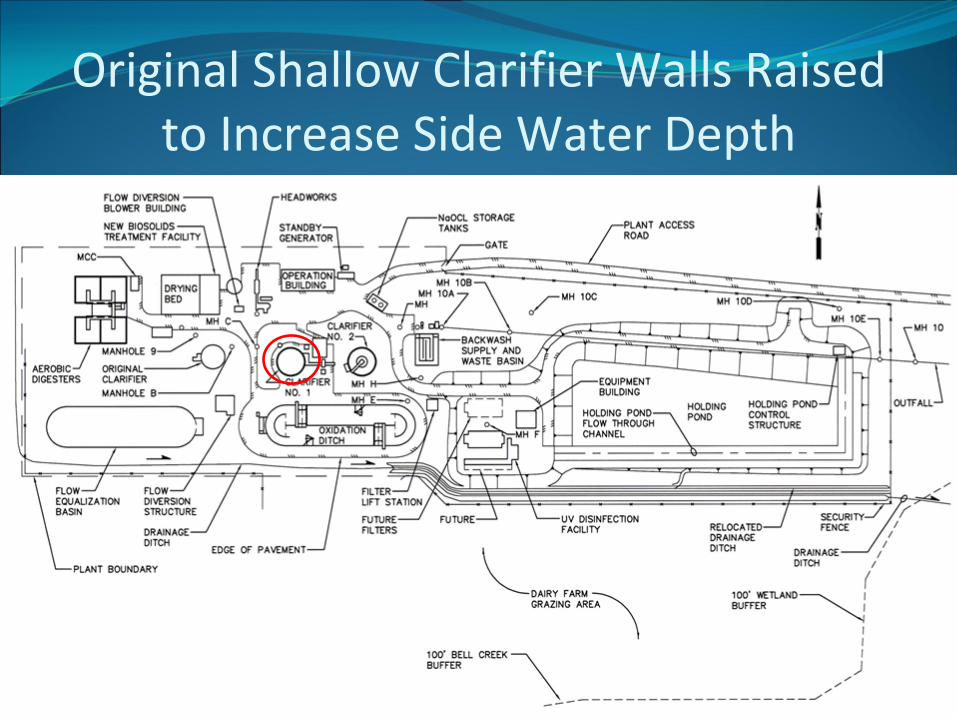
Original Shallow Clarifier Walls Raised to Increase Side Water Depth
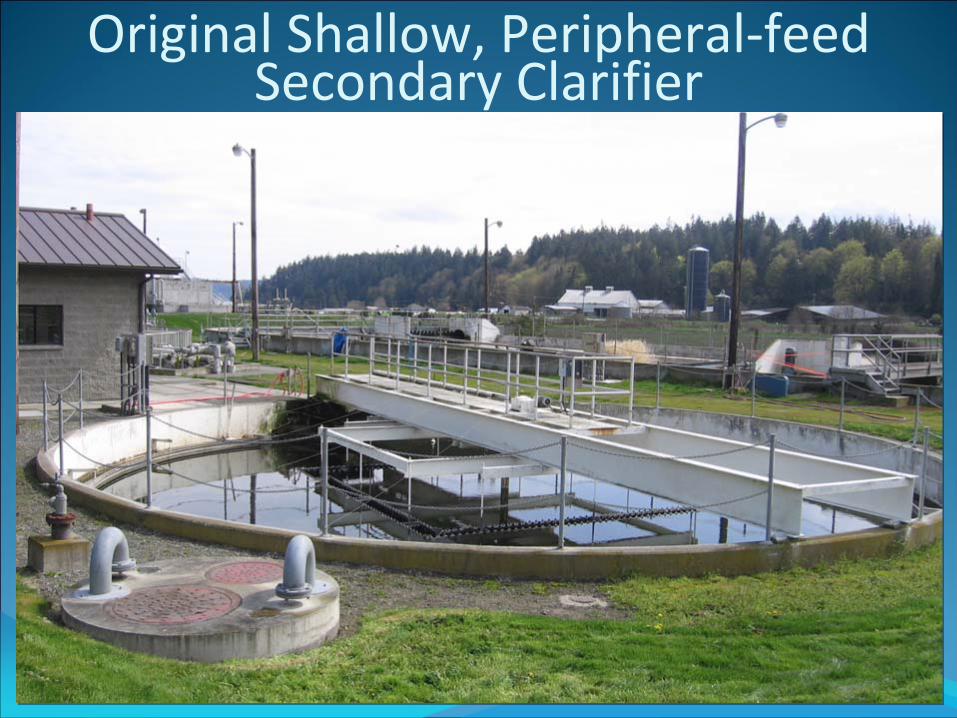
Original Shallow, Peripheral‐feed Secondary Clarifier
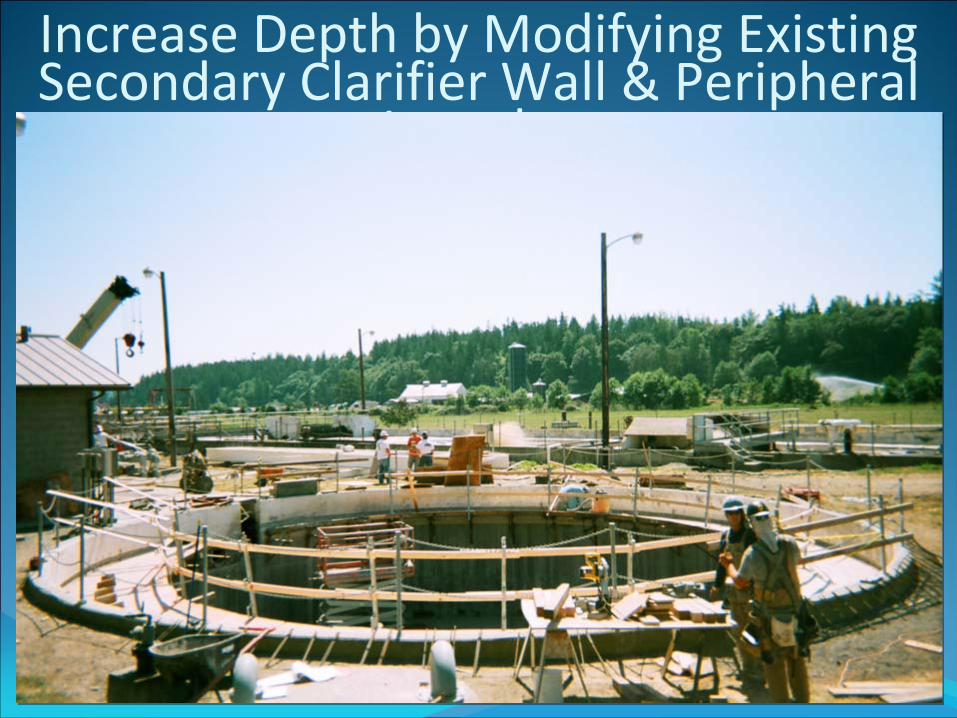
Increase Depth by Modifying Existing Secondary Clarifier Wall & Peripheral Launder
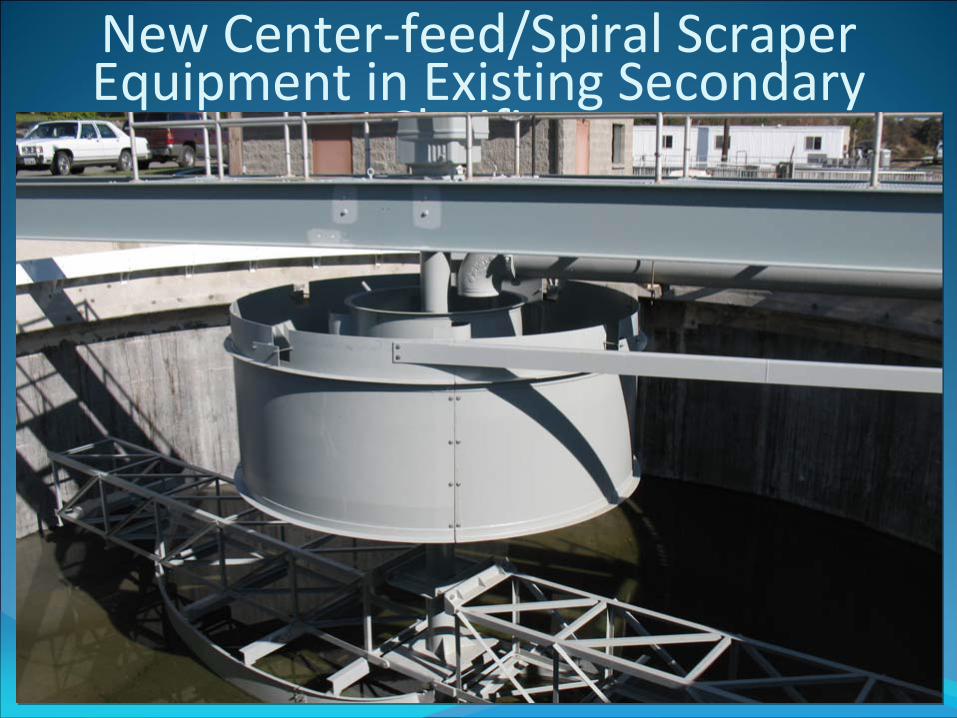
New Center‐feed/Spiral Scraper Equipment in Existing Secondary Clarifier
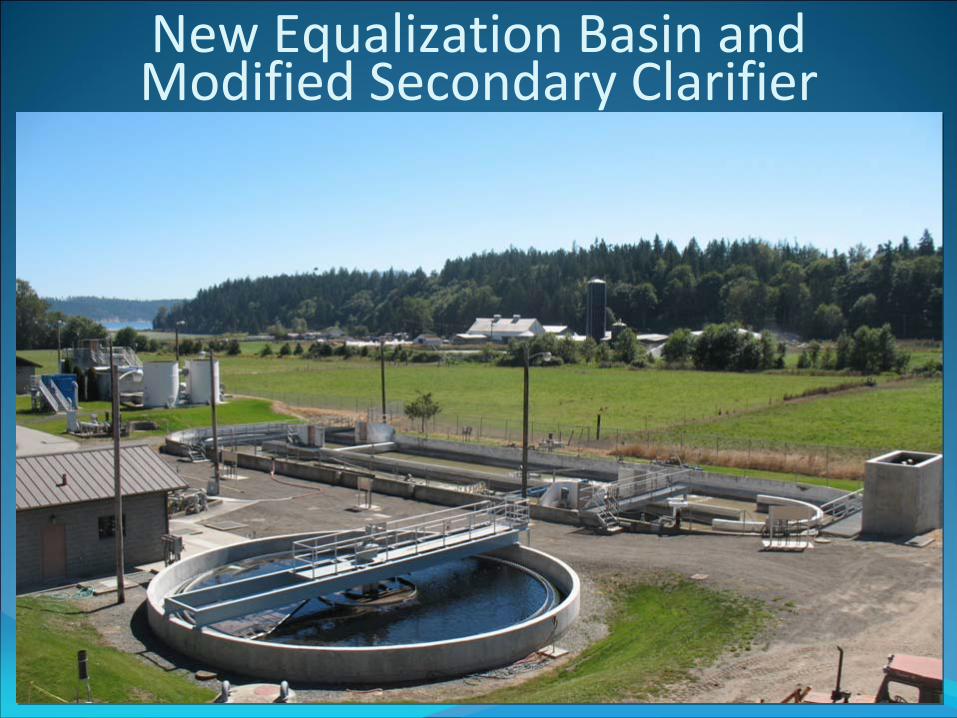
New Equalization Basin and Modified Secondary Clarifier
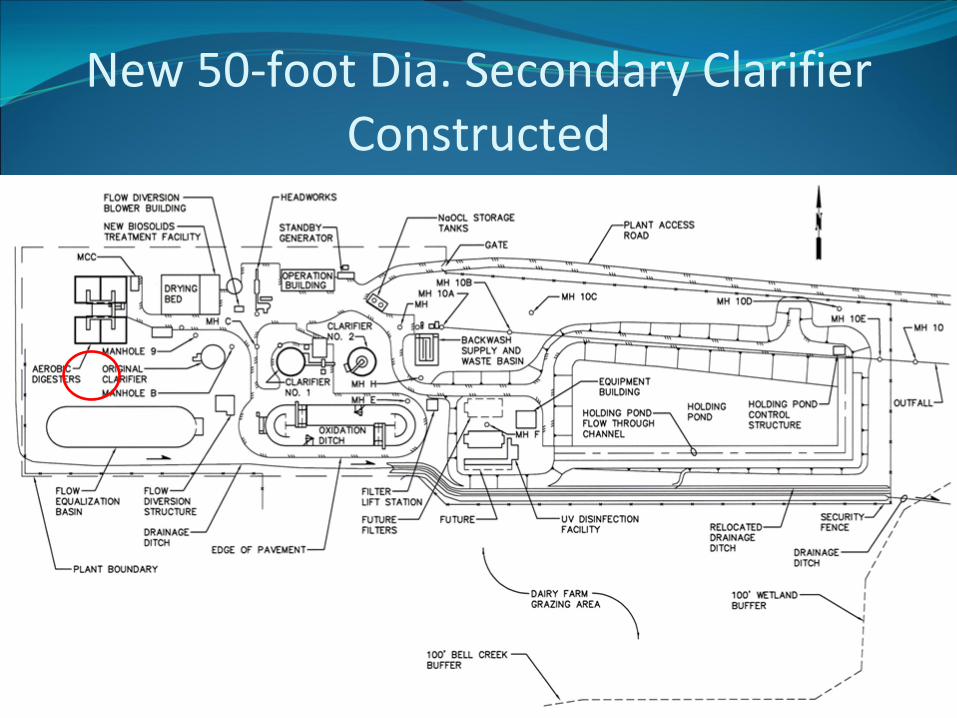
New 50‐foot Dia. Secondary Clarifier Constructed
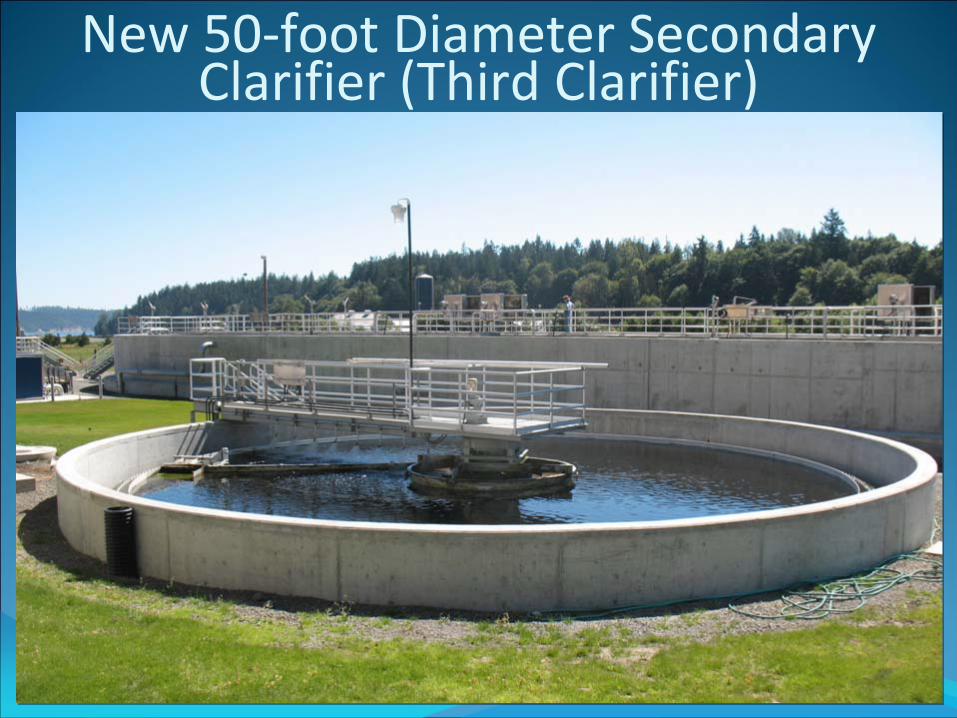
New 50‐foot Diameter Secondary Clarifier (Third Clarifier)
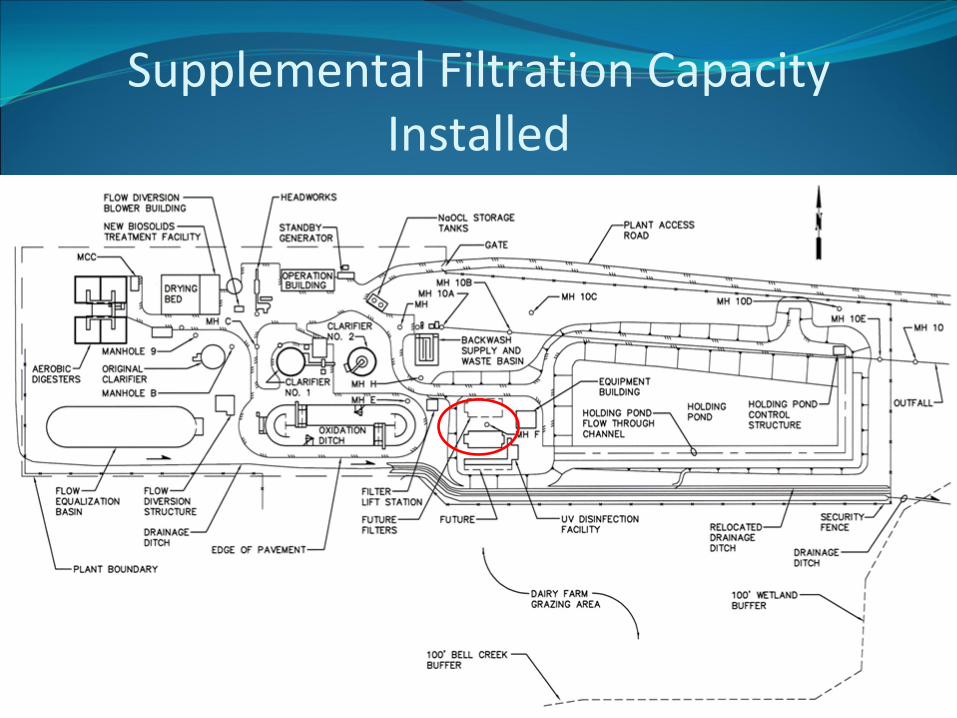
Supplemental Filtration Capacity Installed
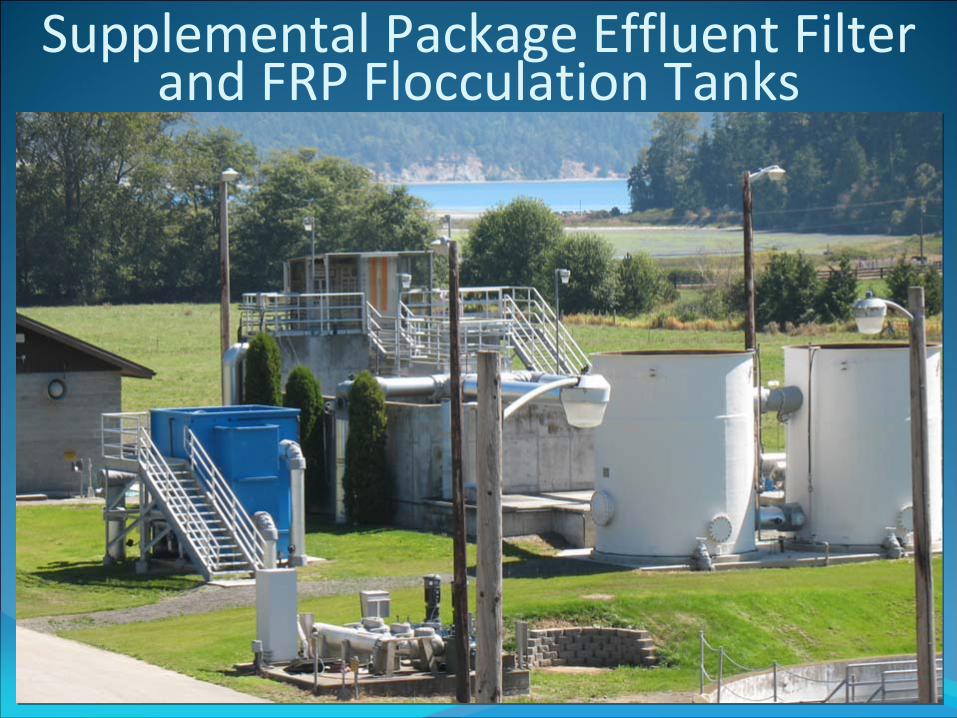
Supplemental Package Effluent Filter and FRP Flocculation Tanks
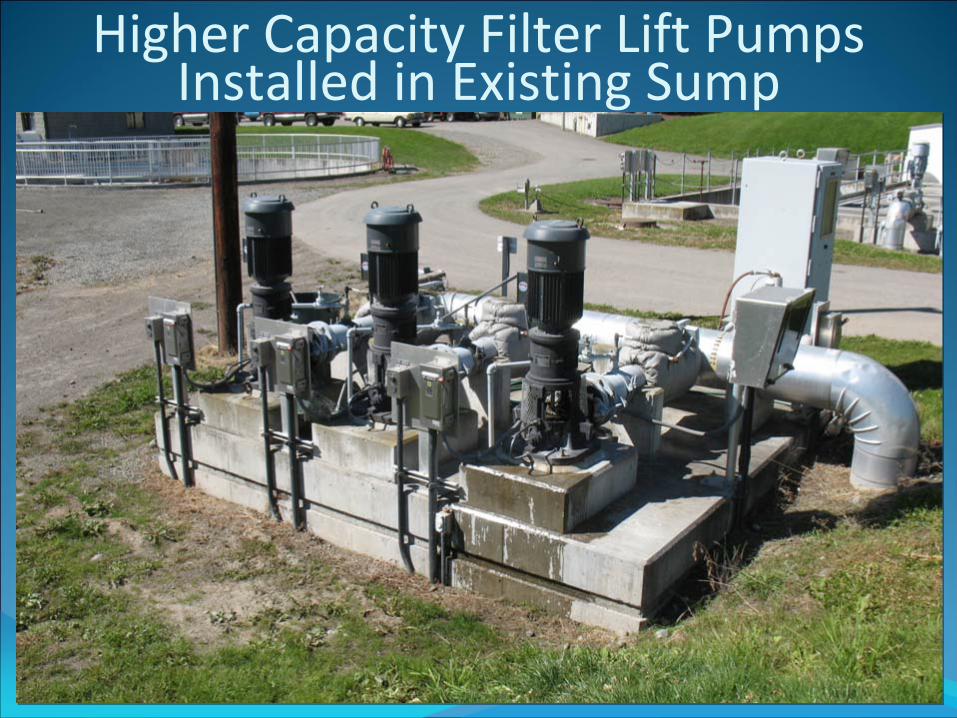
Higher Capacity Filter Lift Pumps Installed in Existing Sump
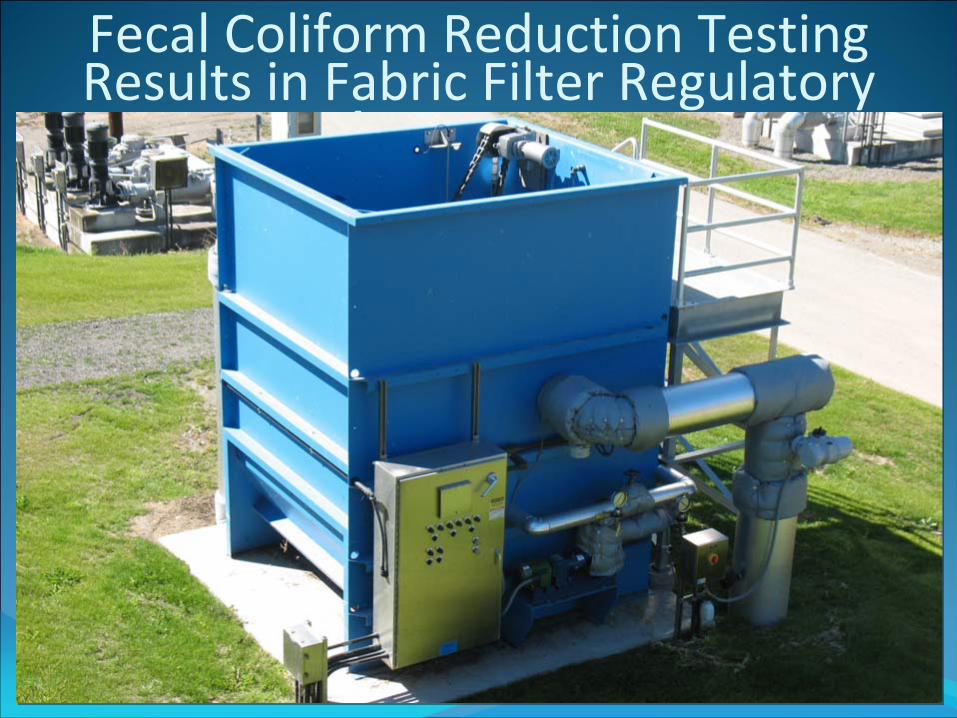
Fecal Coliform Reduction Testing Results in Fabric Filter Regulatory Acceptance
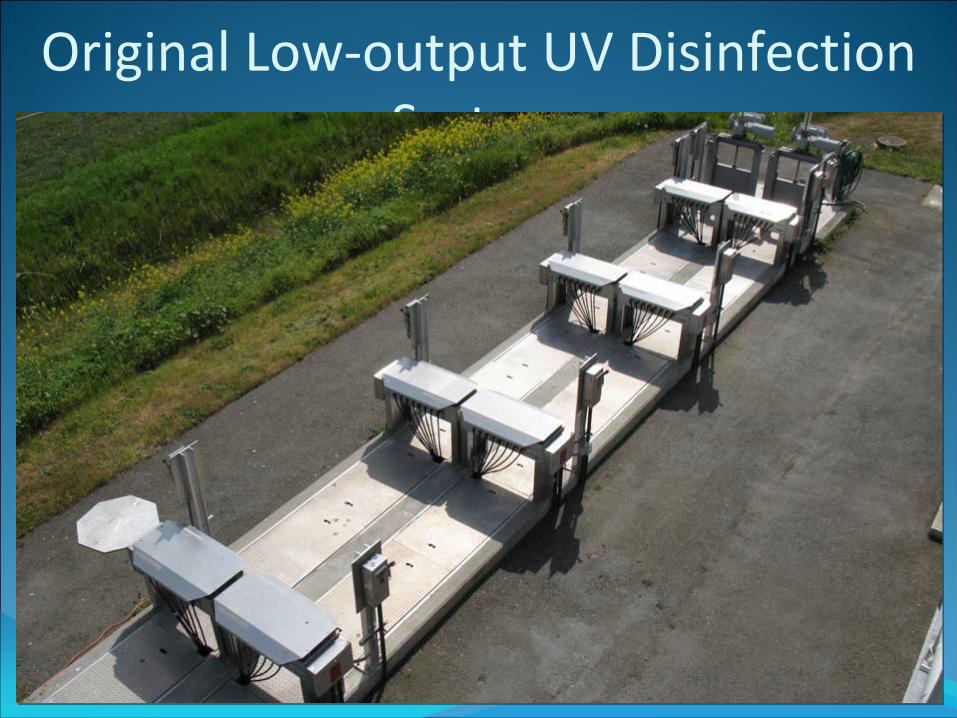
Original Low‐output UV Disinfection System
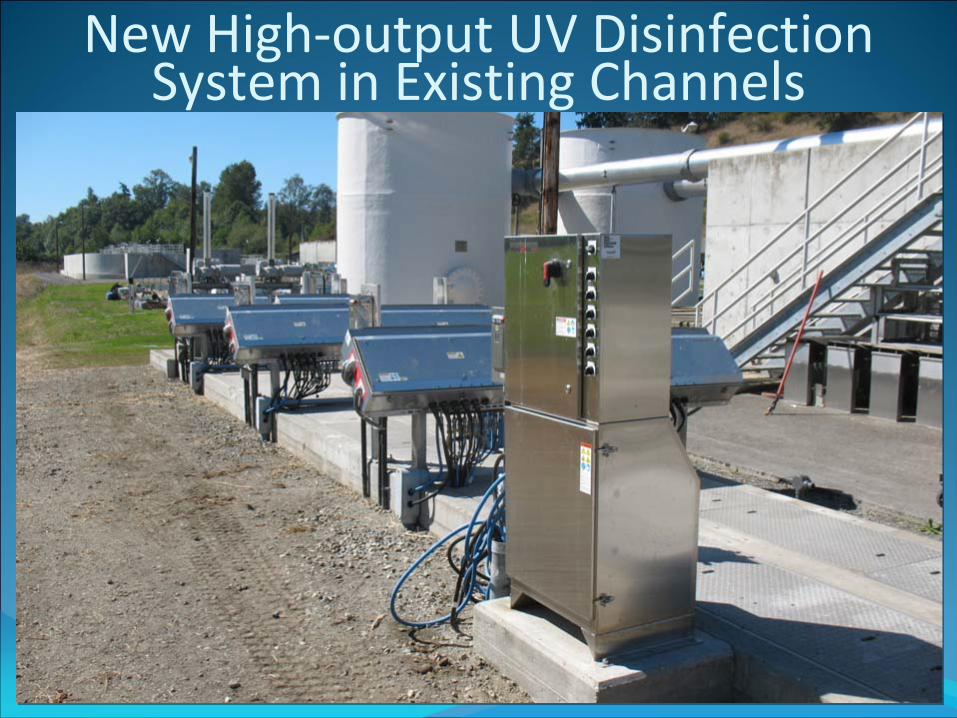
New High‐output UV Disinfection System in Existing Channels
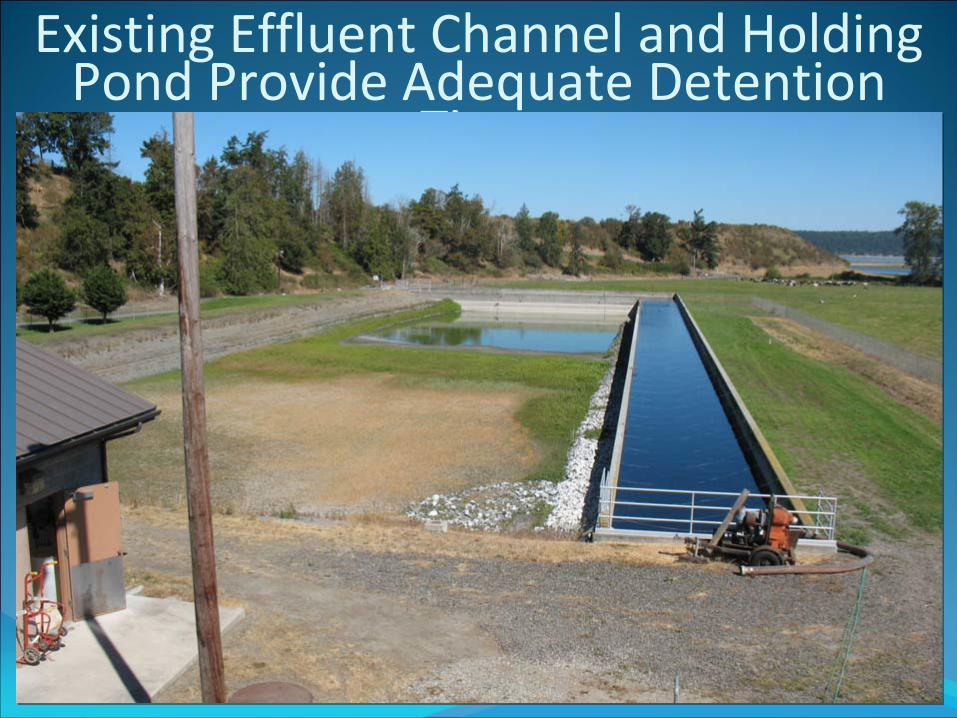
Existing Effluent Channel and Holding Pond Provide Adequate Detention
Time
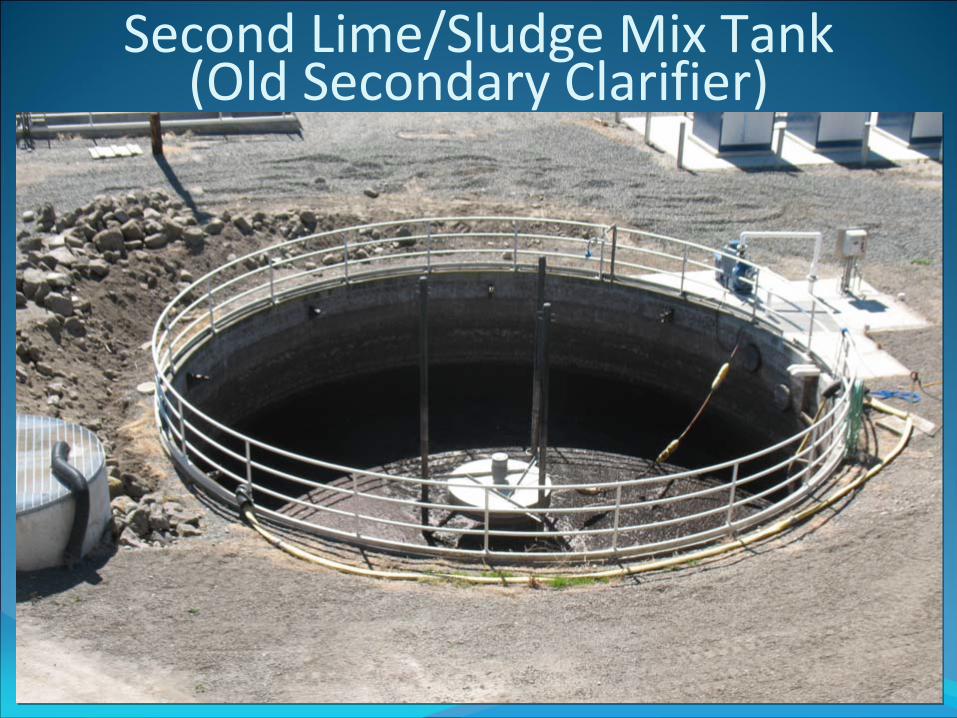
Second Lime/Sludge Mix Tank (Old Secondary Clarifier)
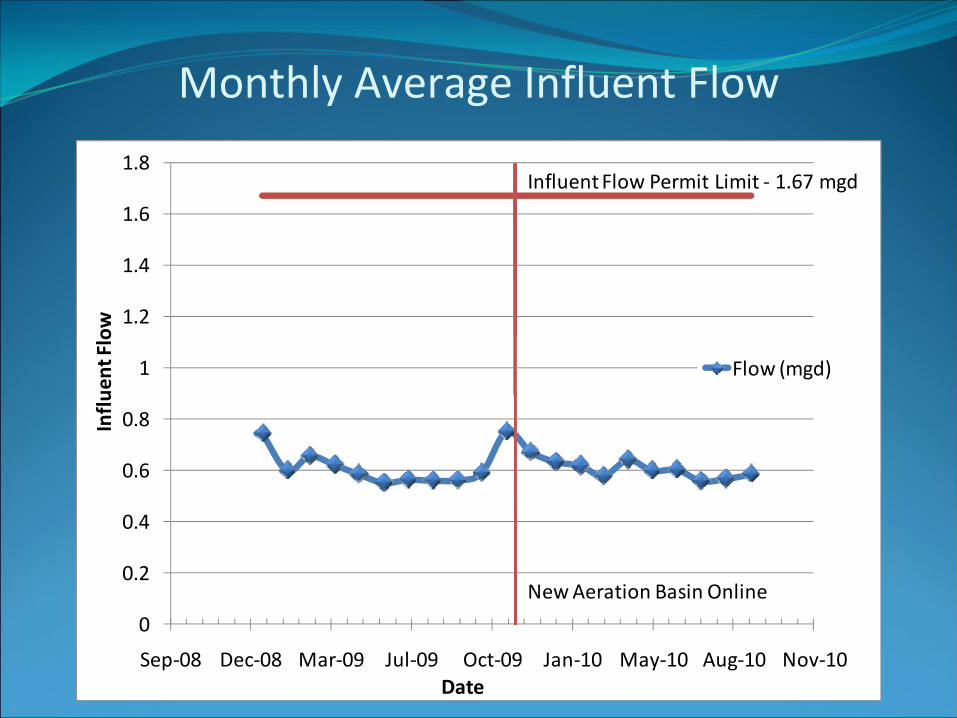
Monthly Average Influent Flow
0
0.2
0.4
0.6
0.8
1
1.2
1.4
1.6
1.8
Sep‐08 Dec‐08 Mar‐09 Jul‐09 Oct‐09 Jan‐10 May‐10 Aug‐10 Nov‐10
Influe
nt Flow
Date
Flow (mgd)
Influent Flow Permit Limit ‐ 1.67 mgd
New Aeration Basin Online
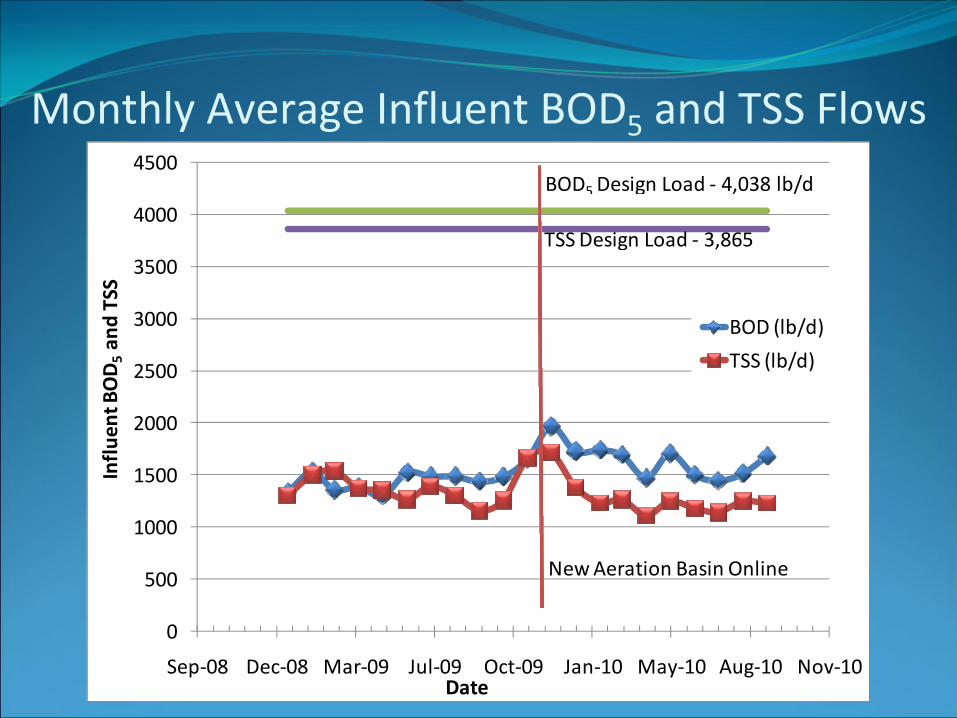
Monthly Average Influent BOD5
and TSS Flows
0
500
1000
1500
2000
2500
3000
3500
4000
4500
Sep‐08 Dec‐08 Mar‐09 Jul‐09 Oct‐09 Jan‐10 May‐10 Aug‐10 Nov‐10
Influe
nt BOD5an
d TSS
Date
BOD (lb/d)
TSS (lb/d)
BOD5 Design Load ‐ 4,038 lb/d
TSS Design Load ‐ 3,865
New Aeration Basin Online
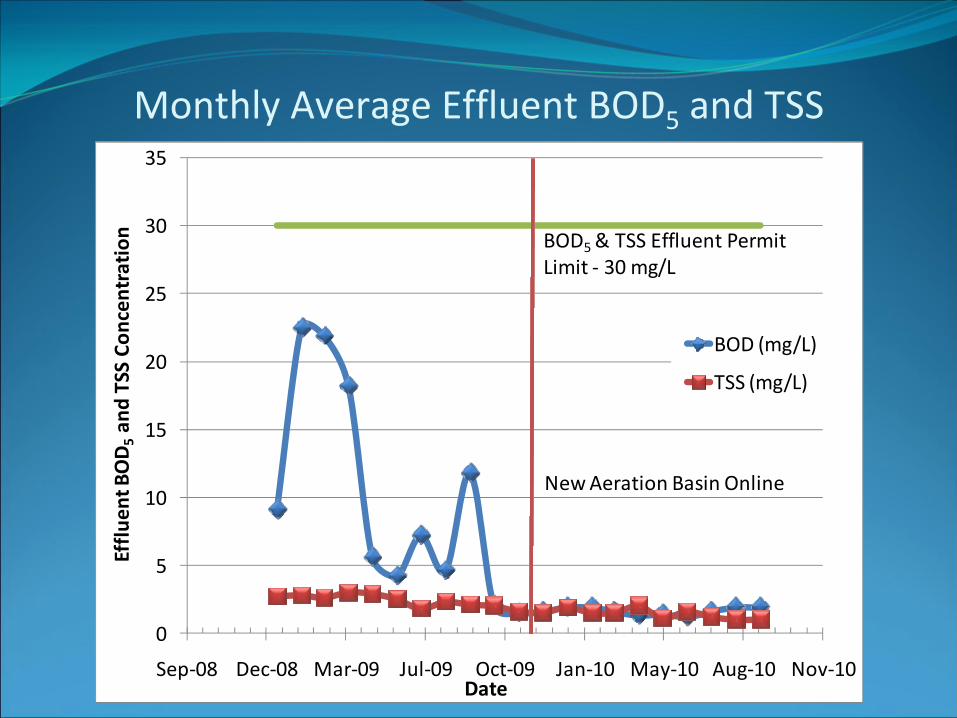
Monthly Average Effluent BOD5
and TSS Concentrations
0
5
10
15
20
25
30
35
Sep‐08 Dec‐08 Mar‐09 Jul‐09 Oct‐09 Jan‐10 May‐10 Aug‐10 Nov‐10
Efflue
nt BOD5an
d TSS Co
ncen
tration
Date
BOD (mg/L)
TSS (mg/L)
BOD5& TSS Effluent PermitLimit ‐ 30 mg/L
New Aeration Basin Online
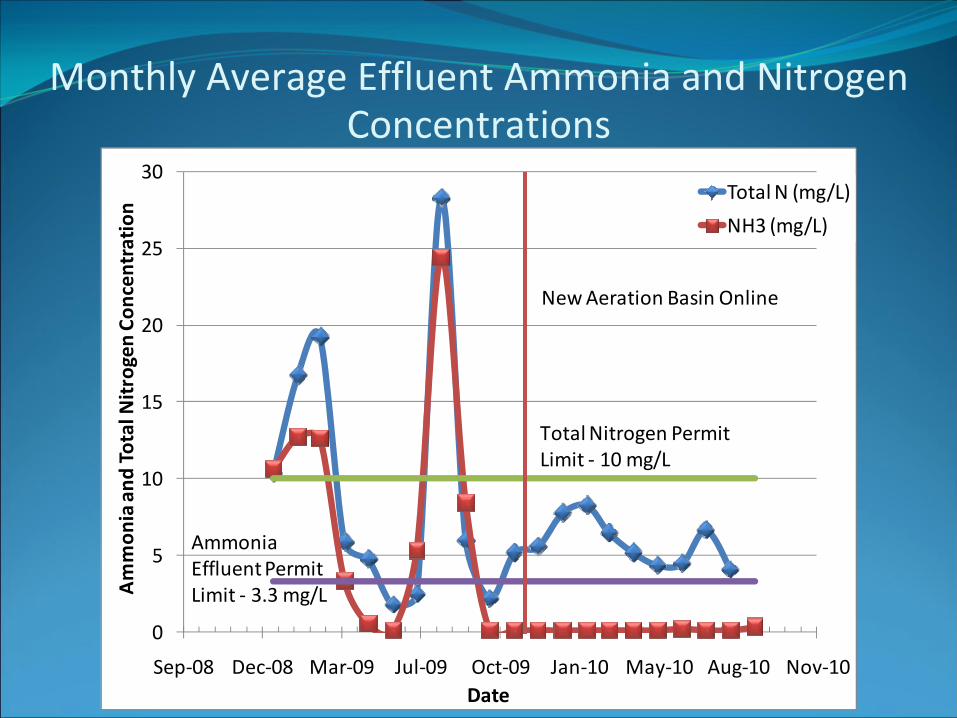
Monthly Average Effluent Ammonia and Nitrogen Concentrations
0
5
10
15
20
25
30
Sep‐08 Dec‐08 Mar‐09 Jul‐09 Oct‐09 Jan‐10 May‐10 Aug‐10 Nov‐10
Ammon
ia and
Total Nitrogen Co
ncen
tration
Date
Total N (mg/L)
NH3 (mg/L)
Total Nitrogen Permit Limit ‐ 10 mg/L
New Aeration Basin Online
Ammonia Effluent Permit Limit ‐ 3.3 mg/L
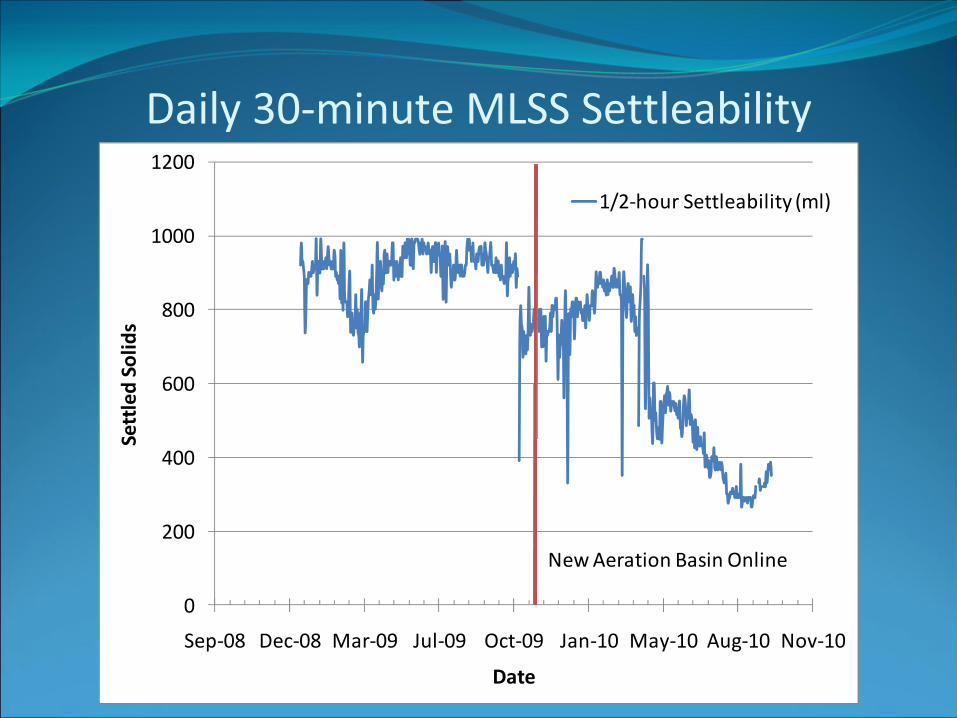
Daily 30‐minute MLSS Settleability
0
200
400
600
800
1000
1200
Sep‐08 Dec‐08 Mar‐09 Jul‐09 Oct‐09 Jan‐10 May‐10 Aug‐10 Nov‐10
Settled Solid
s
Date
1/2‐hour Settleability (ml)
New Aeration Basin Online
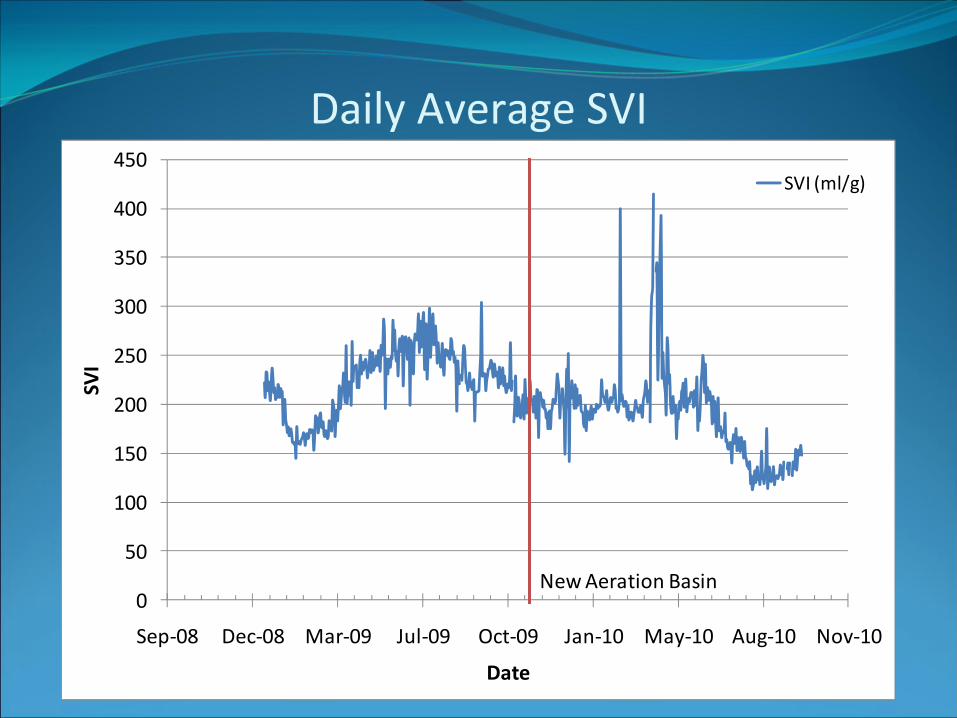
Daily Average SVI
0
50
100
150
200
250
300
350
400
450
Sep‐08 Dec‐08 Mar‐09 Jul‐09 Oct‐09 Jan‐10 May‐10 Aug‐10 Nov‐10
SVI
Date
SVI (ml/g)
New Aeration Basin
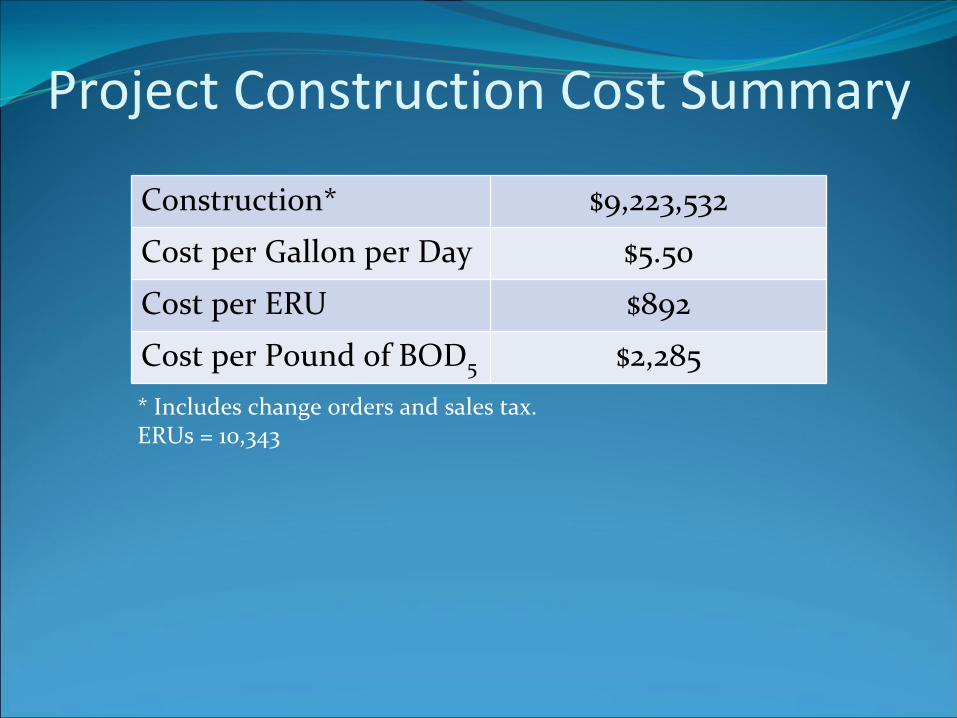
Project Construction Cost Summary
Construction* $9,223,532
Cost per Gallon per Day $5.50
Cost per ERU $892
Cost per Pound of BOD5 $2,285* Includes change orders and sales tax.ERUs = 10,343
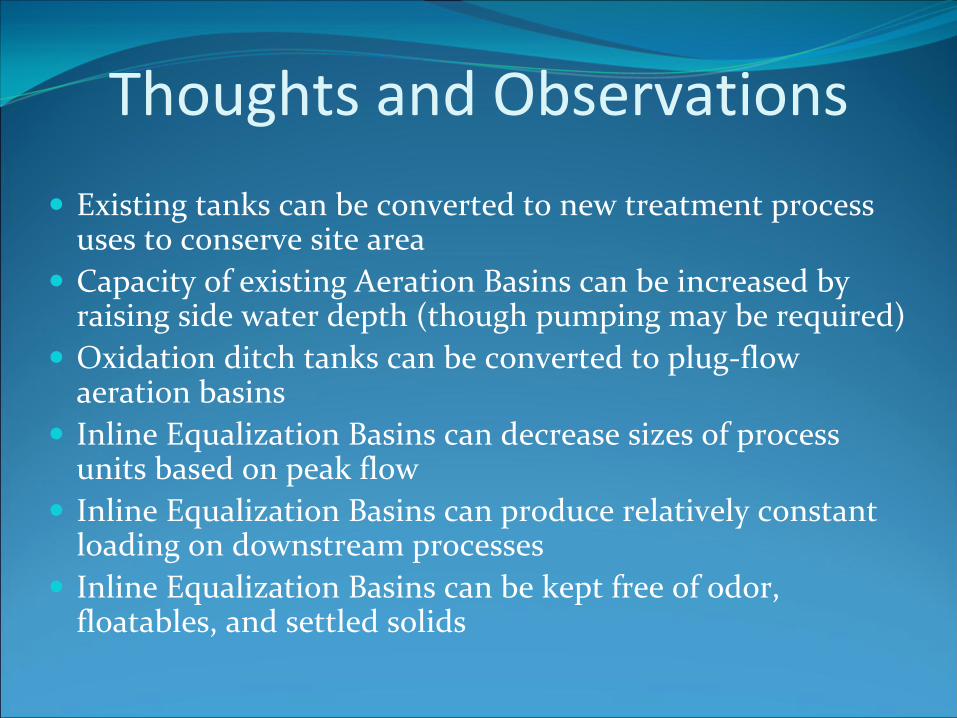
Thoughts and Observations
Existing tanks can be converted to new treatment process uses to conserve site areaCapacity of existing Aeration Basins can be increased by raising side water depth (though pumping may be required)Oxidation ditch tanks can be converted to plug‐flow aeration basinsInline Equalization Basins can decrease sizes of process units based on peak flowInline Equalization Basins can produce relatively constant loading on downstream processesInline Equalization Basins can be kept free of odor, floatables, and settled solids
Thoughts and Observations (continued)
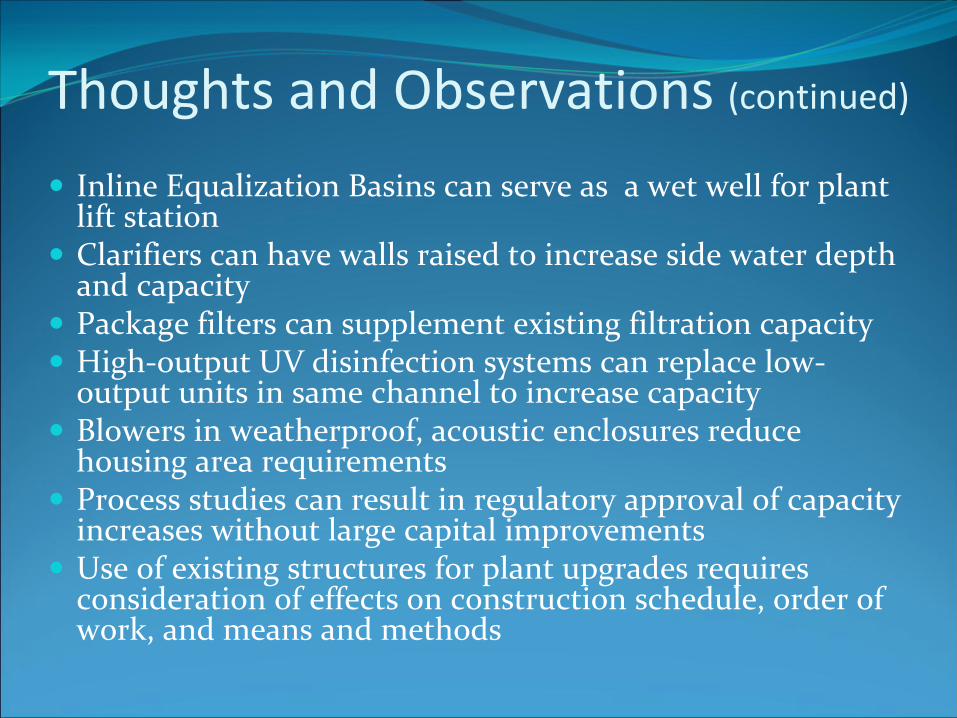
Inline Equalization Basins can serve as a wet well for plant lift stationClarifiers can have walls raised to increase side water depth and capacityPackage filters can supplement existing filtration capacityHigh‐output UV disinfection systems can replace low‐output units in same channel to increase capacityBlowers in weatherproof, acoustic enclosures reduce housing area requirementsProcess studies can result in regulatory approval of capacity increases without large capital improvementsUse of existing structures for plant upgrades requires consideration of effects on construction schedule, order of work, and means and methods
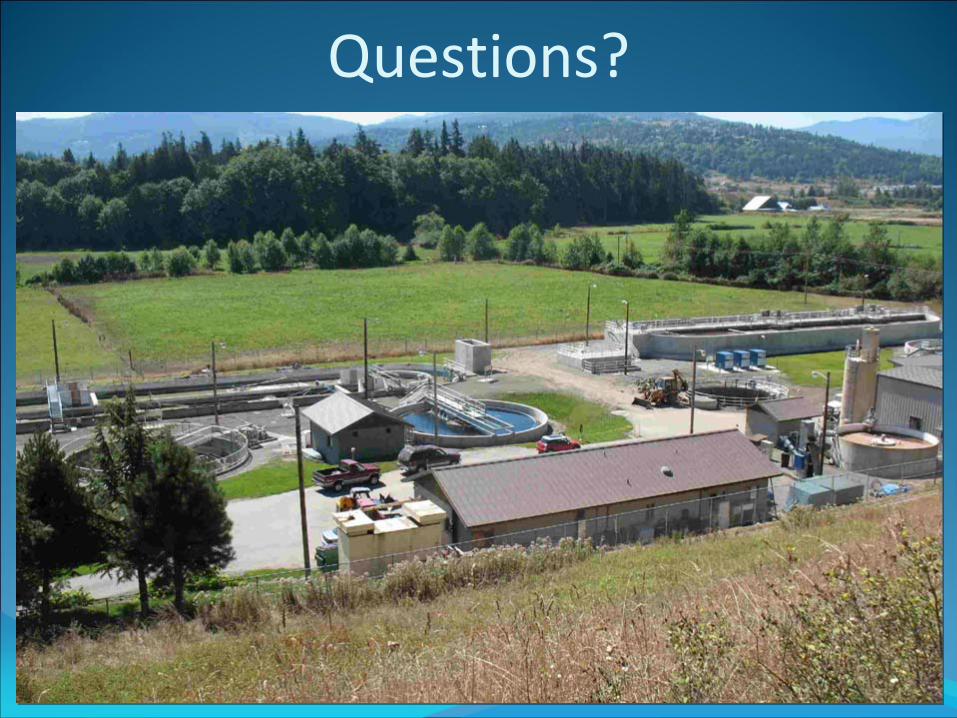
Questions?
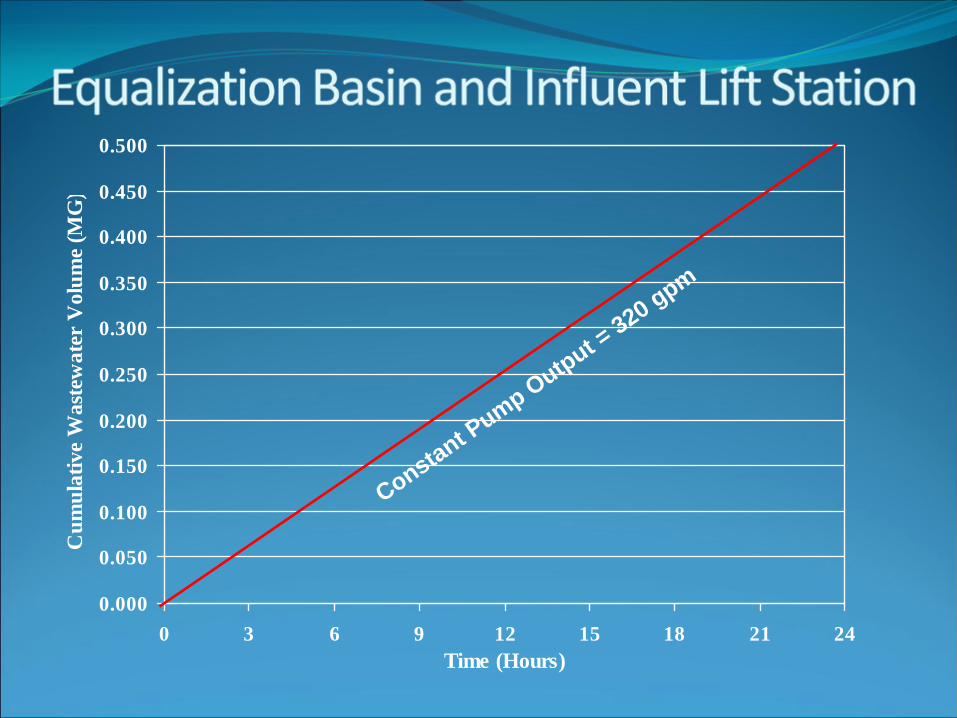
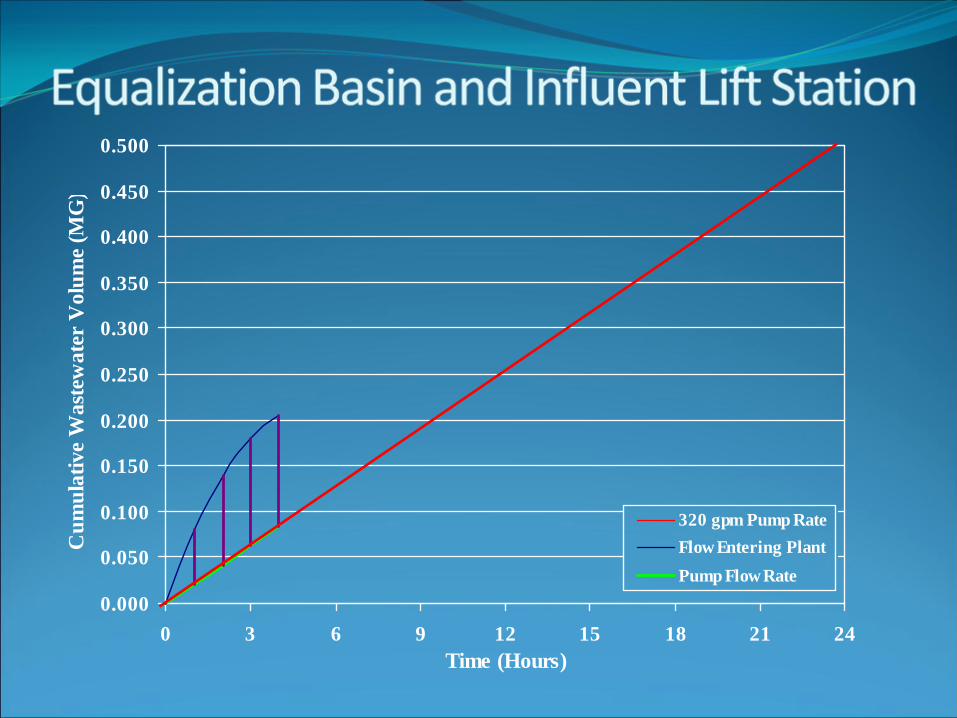
0.000
0.050
0.100
0.150
0.200
0.250
0.300
0.350
0.400
0.450
0.500
0 3 6 9 12 15 18 21 24Time (Hours)
Cum
ulat
ive
Was
tew
ater
Vol
ume
(MG
)
Constant Pump Output =
320 gpm
0.000
0.050
0.100
0.150
0.200
0.250
0.300
0.350
0.400
0.450
0.500
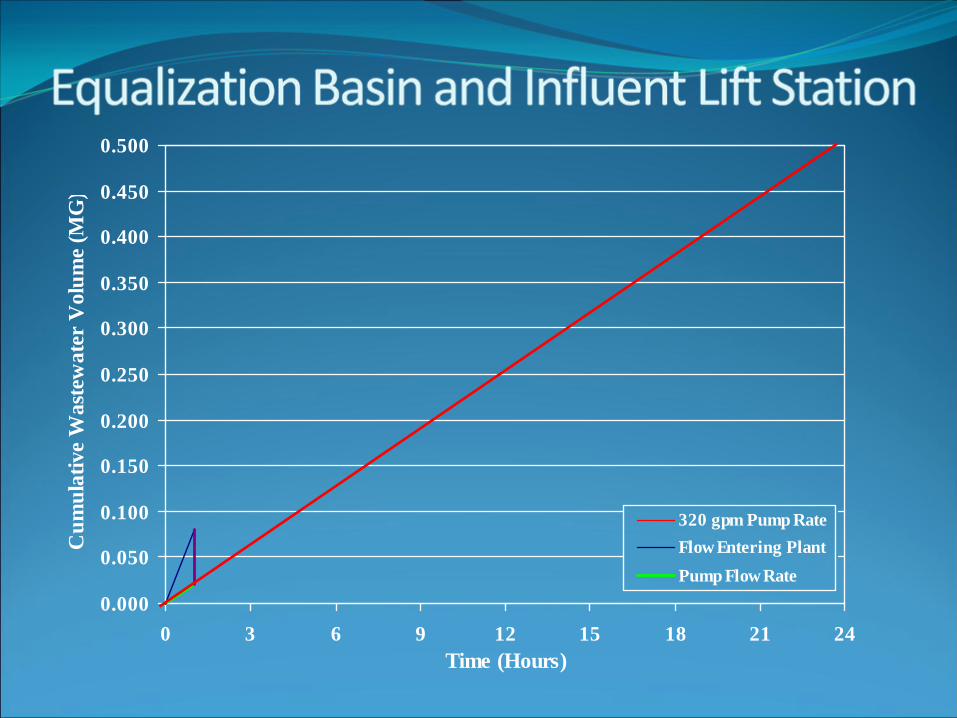
0 3 6 9 12 15 18 21 24Time (Hours)
Cum
ulat
ive
Was
tew
ater
Vol
ume
(MG
)
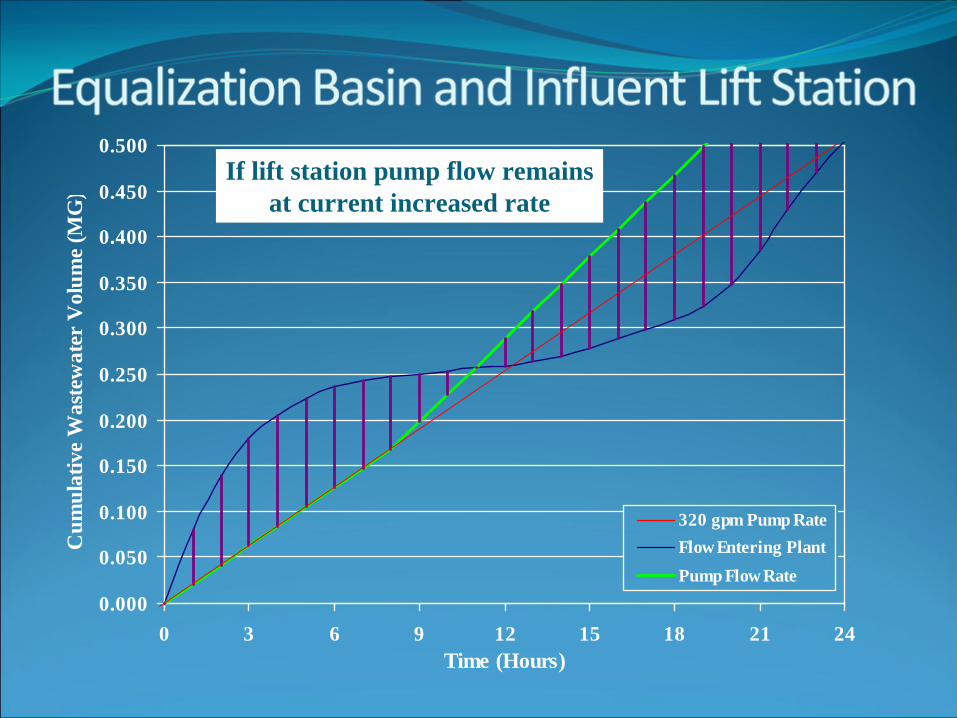
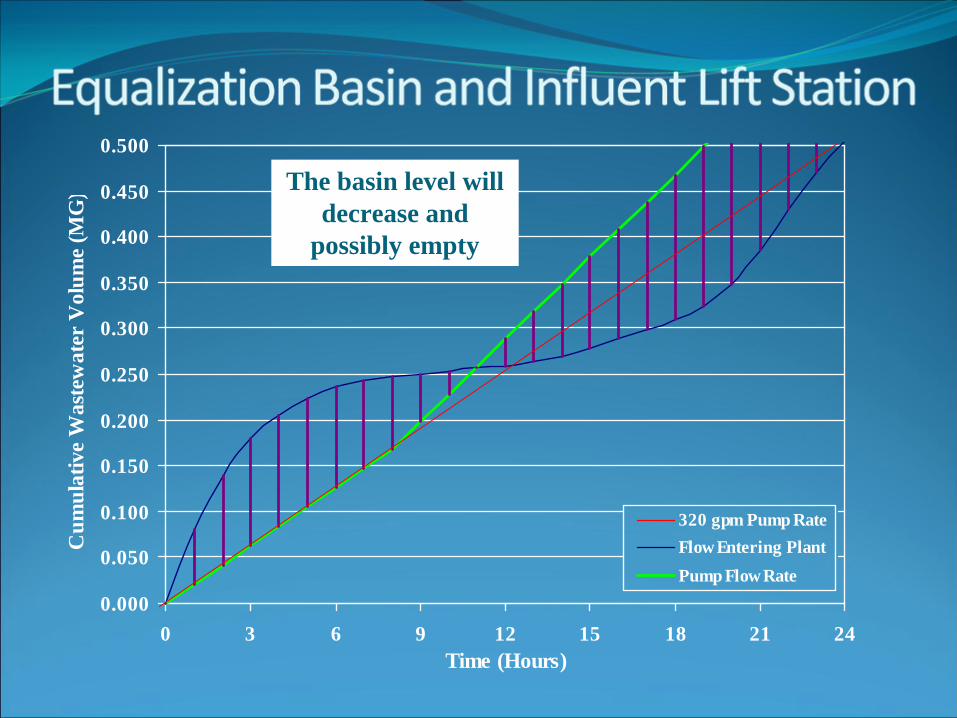
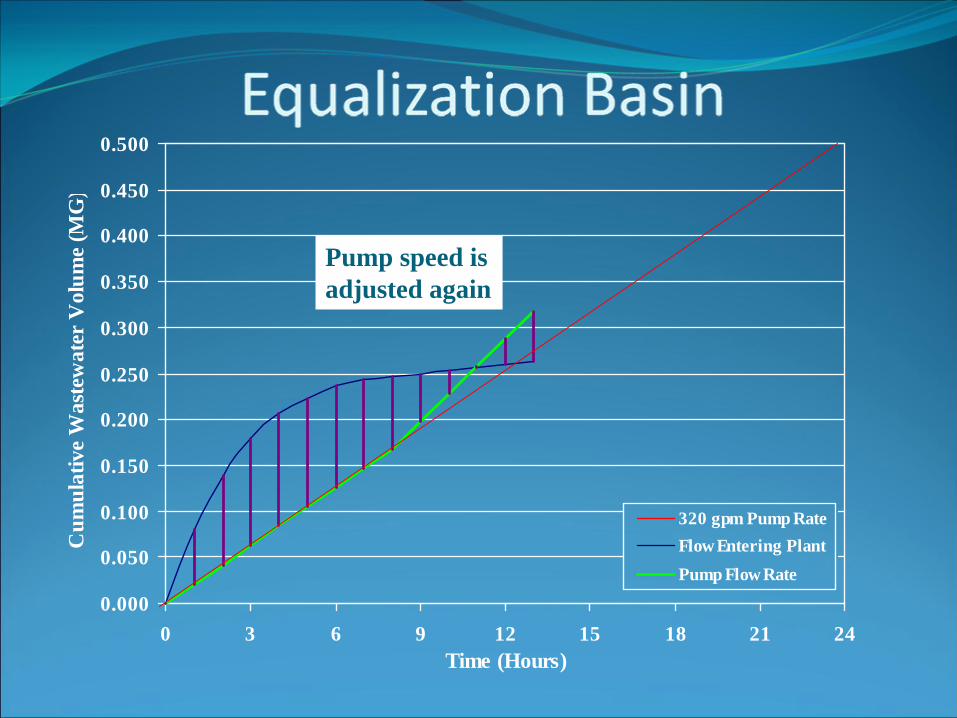
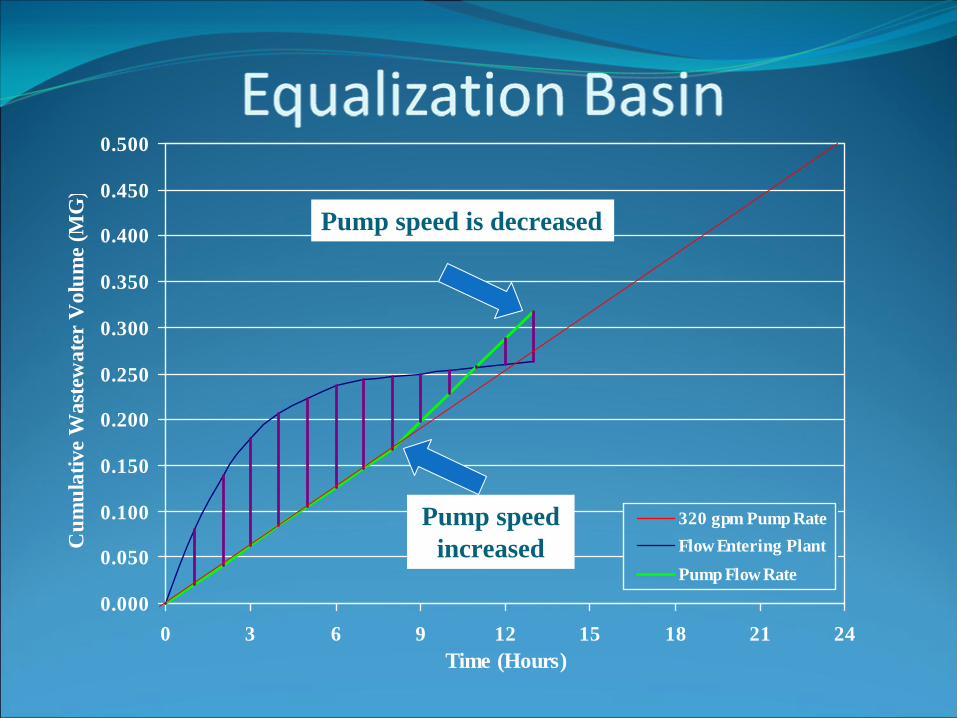
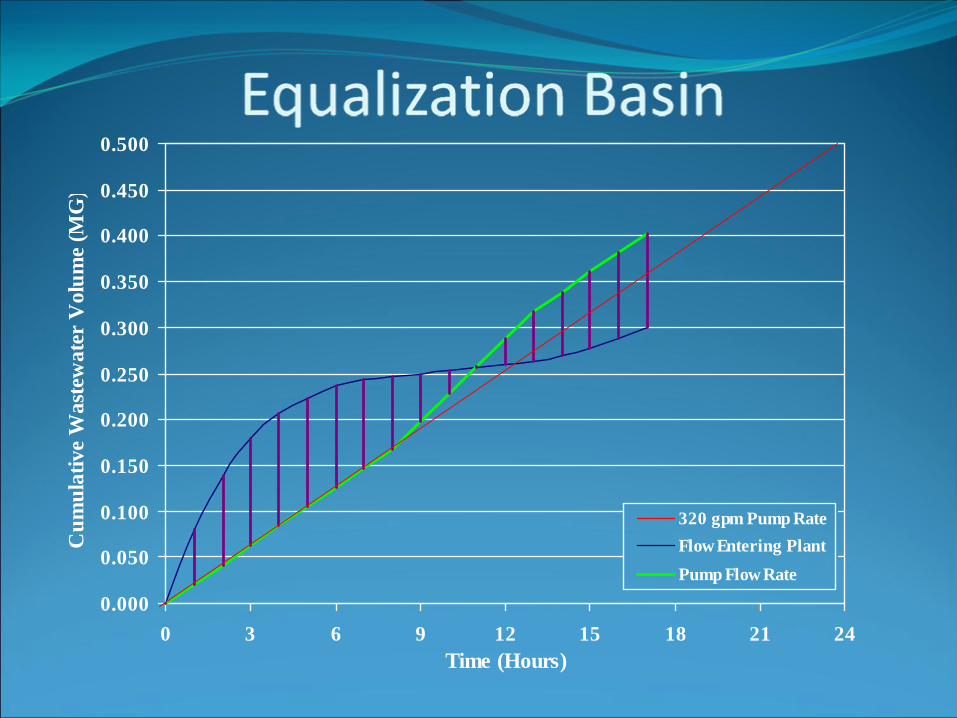
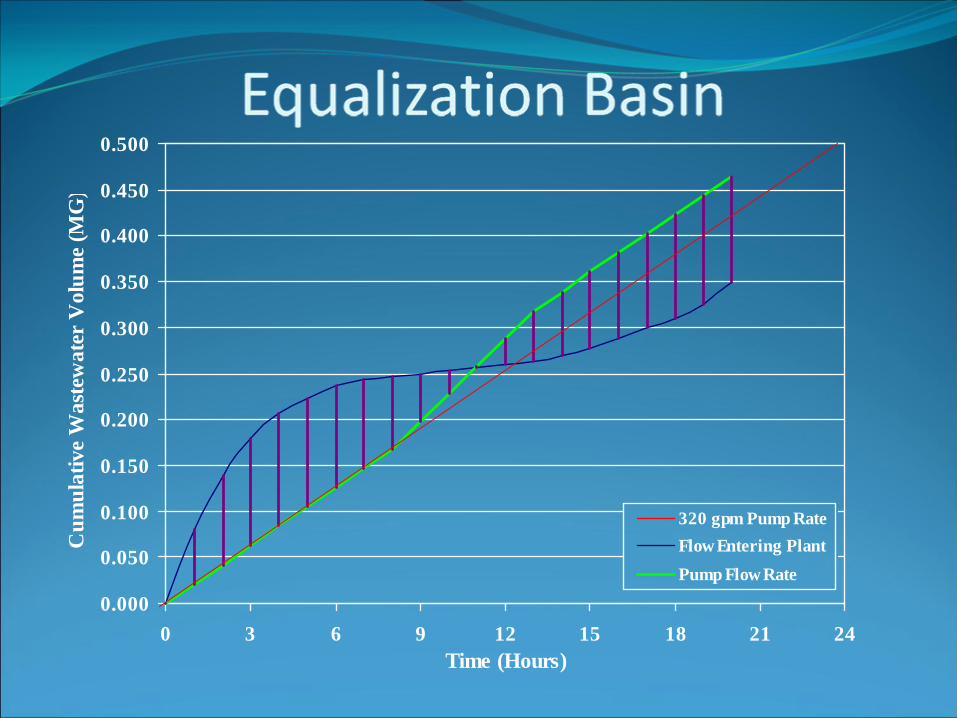
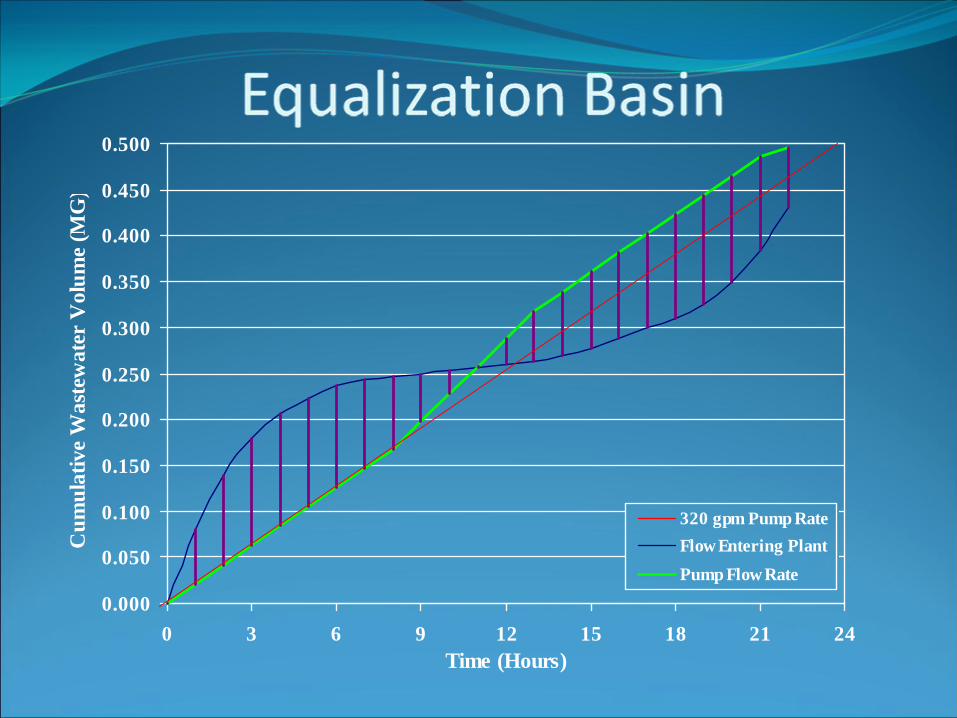
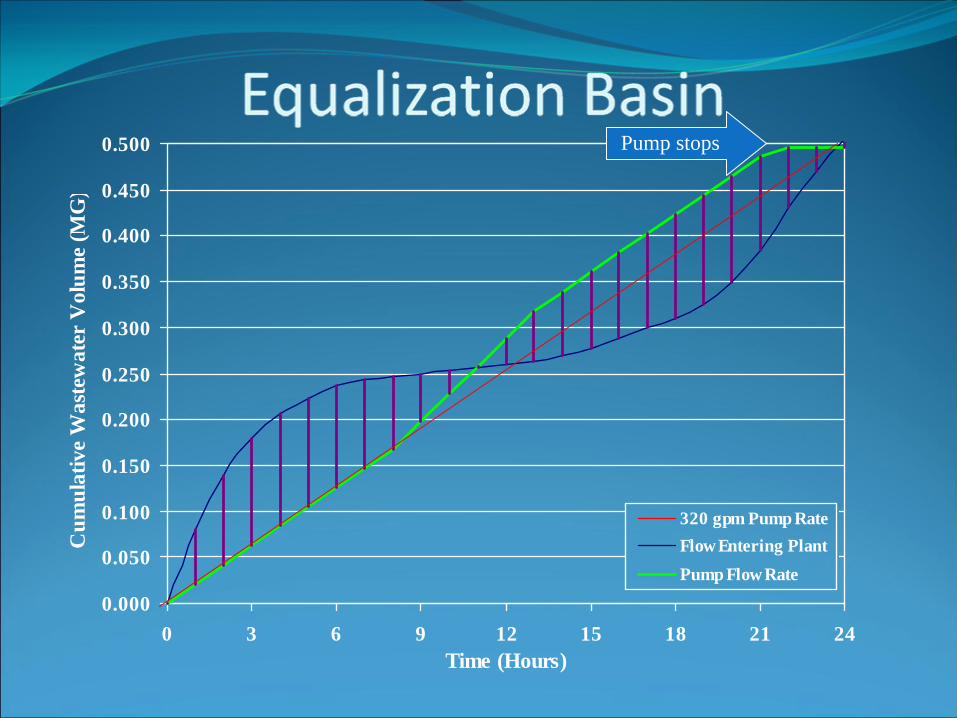
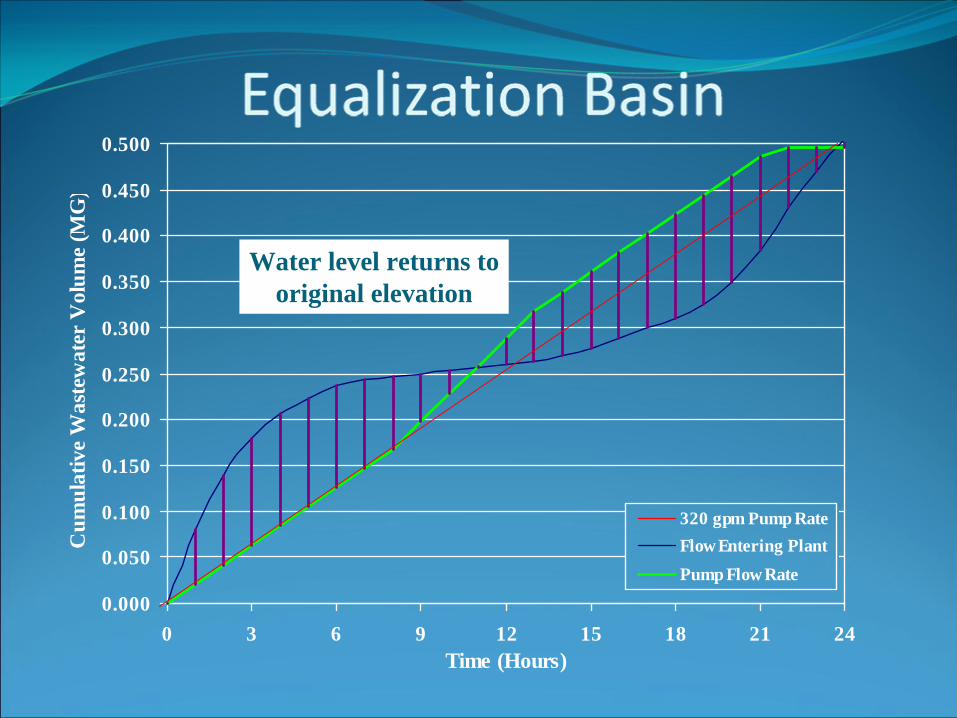
320 gpm Pump RateFlow Entering PlantPump Flow Rate

0.000
0.050
0.100
0.150
0.200
0.250
0.300
0.350
0.400
0.450
0.500
0 3 6 9 12 15 18 21 24Time (Hours)
Cum
ulat
ive
Was
tew
ater
Vol
ume
(MG
)
320 gpm Pump RateFlow Entering PlantPump Flow Rate

0.000
0.050
0.100
0.150
0.200
0.250
0.300
0.350
0.400
0.450
0.500
0 3 6 9 12 15 18 21 24Time (Hours)
Cum
ulat
ive
Was
tew
ater
Vol
ume
(MG
)
320 gpm Pump RateFlow Entering PlantPump Flow Rate
0.000
0.050
0.100
0.150
0.200
0.250
0.300
0.350
0.400
0.450
0.500
0 3 6 9 12 15 18 21 24Time (Hours)
Cum
ulat
ive
Was
tew
ater
Vol
ume
(MG
)
320 gpm Pump RateFlow Entering PlantPump Flow Rate
0.000
0.050
0.100
0.150
0.200
0.250
0.300
0.350
0.400
0.450
0.500
0 3 6 9 12 15 18 21 24Time (Hours)
Cum
ulat
ive
Was
tew
ater
Vol
ume
(MG
)
320 gpm Pump RateFlow Entering PlantPump Flow Rate
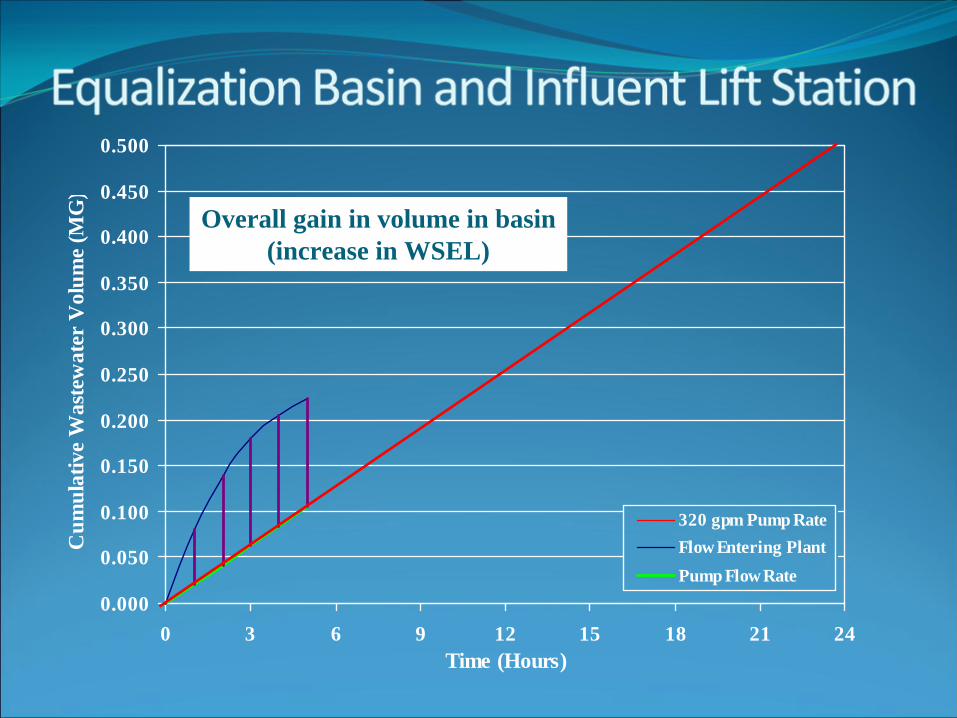
Overall gain in volume in basin(increase in WSEL)
0.000
0.050
0.100
0.150
0.200
0.250
0.300
0.350
0.400
0.450
0.500
0 3 6 9 12 15 18 21 24Time (Hours)
Cum
ulat
ive
Was
tew
ater
Vol
ume
(MG
)
320 gpm Pump RateFlow Entering PlantPump Flow Rate
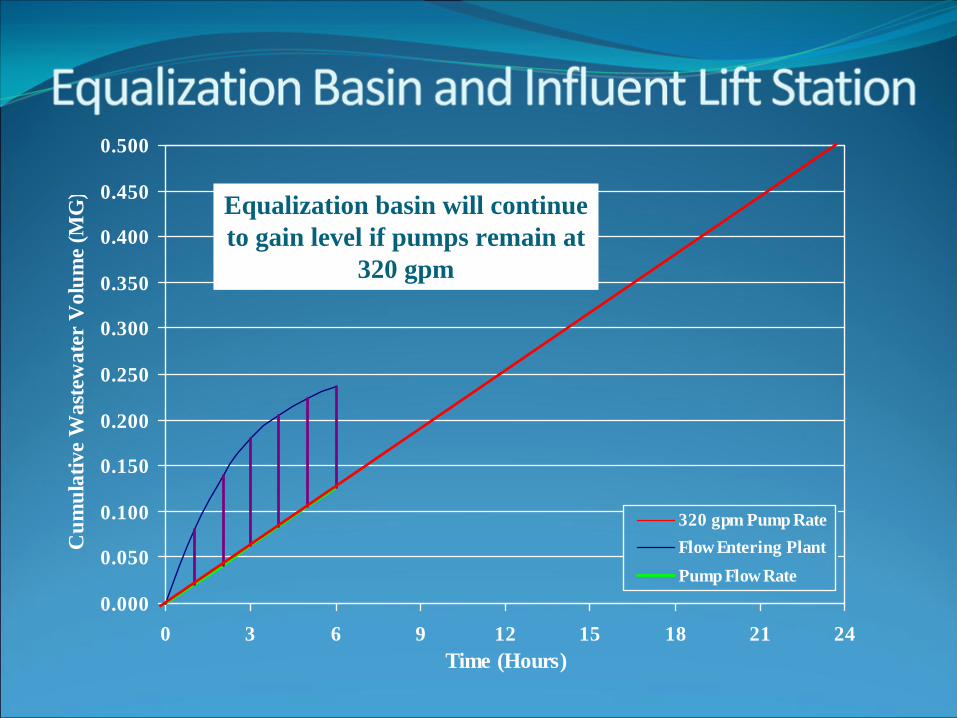
Equalization basin will continue to gain level if pumps remain at
320 gpm

0.000
0.050
0.100
0.150
0.200
0.250
0.300
0.350
0.400
0.450
0.500
0 3 6 9 12 15 18 21 24Time (Hours)
Cum
ulat
ive
Was
tew
ater
Vol
ume
(MG
)
320 gpm Pump RateFlow Entering PlantPump Flow Rate
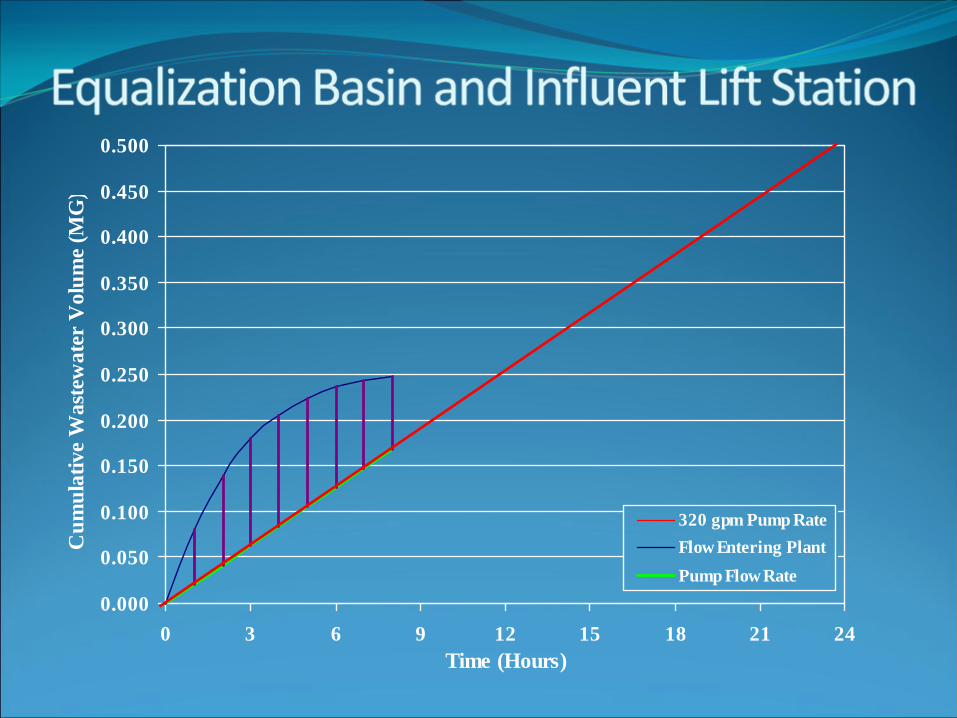
0.000
0.050
0.100
0.150
0.200
0.250
0.300
0.350
0.400
0.450
0.500
0 3 6 9 12 15 18 21 24Time (Hours)
Cum
ulat
ive
Was
tew
ater
Vol
ume
(MG
)
320 gpm Pump RateFlow Entering PlantPump Flow Rate
0.000
0.050
0.100
0.150
0.200
0.250
0.300
0.350
0.400
0.450
0.500
0 3 6 9 12 15 18 21 24Time (Hours)
Cum
ulat
ive
Was
tew
ater
Vol
ume
(MG
)
320 gpm Pump RateFlow Entering PlantPump Flow Rate
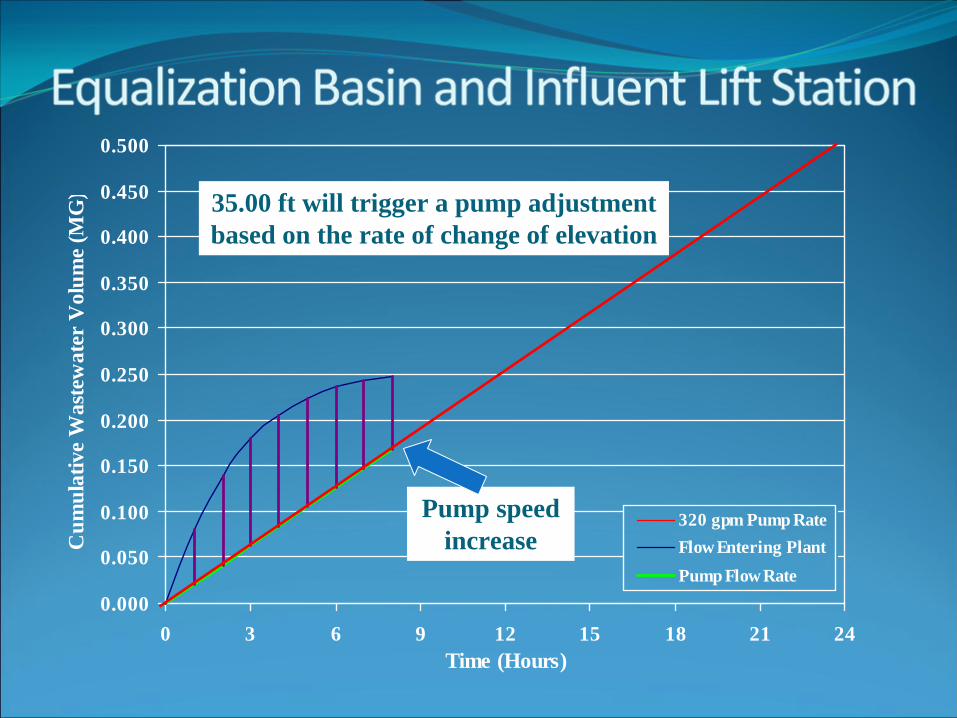
Pump speed increase
35.00 ft will trigger a pump adjustmentbased on the rate of change of elevation

0.000
0.050
0.100
0.150
0.200
0.250
0.300
0.350
0.400
0.450
0.500
0 3 6 9 12 15 18 21 24Time (Hours)
Cum
ulat
ive
Was
tew
ater
Vol
ume
(MG
)
320 gpm Pump RateFlow Entering PlantPump Flow Rate
0.000
0.050
0.100
0.150
0.200
0.250
0.300
0.350
0.400
0.450
0.500
0 3 6 9 12 15 18 21 24Time (Hours)
Cum
ulat
ive
Was
tew
ater
Vol
ume
(MG
)
320 gpm Pump RateFlow Entering PlantPump Flow Rate
0.000
0.050
0.100
0.150
0.200
0.250
0.300
0.350
0.400
0.450
0.500
0 3 6 9 12 15 18 21 24Time (Hours)
Cum
ulat
ive
Was
tew
ater
Vol
ume
(MG
)
320 gpm Pump RateFlow Entering PlantPump Flow Rate

0.000
0.050
0.100
0.150
0.200
0.250
0.300
0.350
0.400
0.450
0.500
0 3 6 9 12 15 18 21 24Time (Hours)
Cum
ulat
ive
Was
tew
ater
Vol
ume
(MG
)
320 gpm Pump RateFlow Entering PlantPump Flow Rate

0.000
0.050
0.100
0.150
0.200
0.250
0.300
0.350
0.400
0.450
0.500
0 3 6 9 12 15 18 21 24Time (Hours)
Cum
ulat
ive
Was
tew
ater
Vol
ume
(MG
)
320 gpm Pump RateFlow Entering PlantPump Flow Rate
0.000
0.050
0.100
0.150
0.200
0.250
0.300
0.350
0.400
0.450
0.500
0 3 6 9 12 15 18 21 24Time (Hours)
Cum
ulat
ive
Was
tew
ater
Vol
ume
(MG
)
320 gpm Pump RateFlow Entering PlantPump Flow Rate
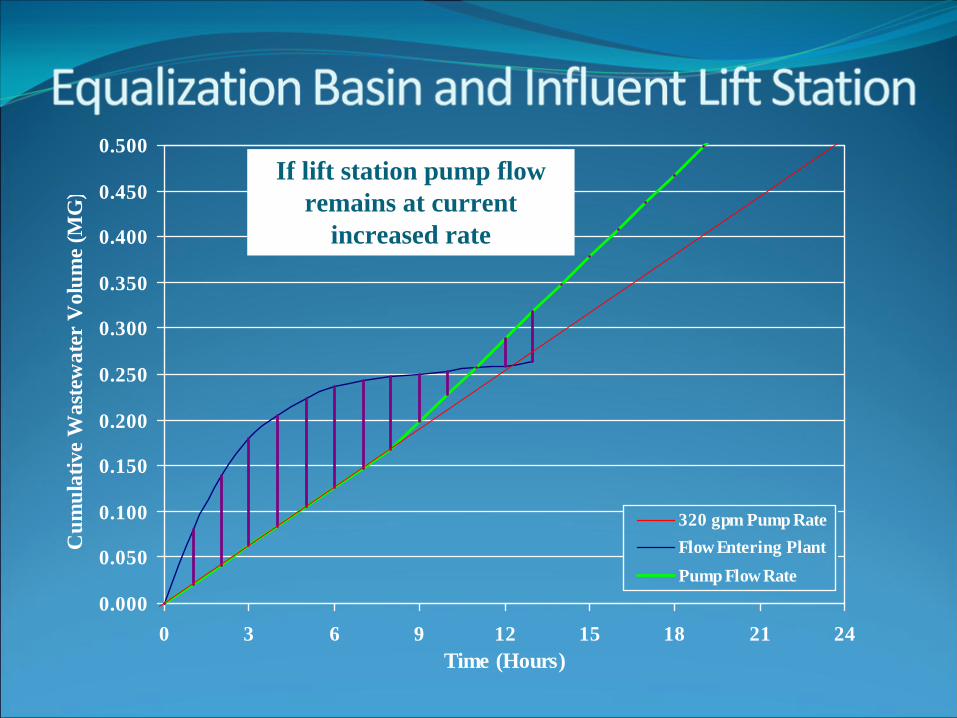
If lift station pump flow remains at current
increased rate
0.000
0.050
0.100
0.150
0.200
0.250
0.300
0.350
0.400
0.450
0.500
0 3 6 9 12 15 18 21 24Time (Hours)
Cum
ulat
ive
Was
tew
ater
Vol
ume
(MG
)
320 gpm Pump RateFlow Entering PlantPump Flow Rate
If lift station pump flow remainsat current increased rate
0.000
0.050
0.100
0.150
0.200
0.250
0.300
0.350
0.400
0.450
0.500
0 3 6 9 12 15 18 21 24Time (Hours)
Cum
ulat
ive
Was
tew
ater
Vol
ume
(MG
)
320 gpm Pump RateFlow Entering PlantPump Flow Rate
The basin level will decrease and
possibly empty
0.000
0.050
0.100
0.150
0.200
0.250
0.300
0.350
0.400
0.450
0.500
0 3 6 9 12 15 18 21 24Time (Hours)
Cum
ulat
ive
Was
tew
ater
Vol
ume
(MG
)
320 gpm Pump RateFlow Entering PlantPump Flow Rate
Pump speed isadjusted again
0.000
0.050
0.100
0.150
0.200
0.250
0.300
0.350
0.400
0.450
0.500
0 3 6 9 12 15 18 21 24Time (Hours)
Cum
ulat
ive
Was
tew
ater
Vol
ume
(MG
)
320 gpm Pump RateFlow Entering PlantPump Flow Rate
Pump speed increased
Pump speed is decreased

0.000
0.050
0.100
0.150
0.200
0.250
0.300
0.350
0.400
0.450
0.500
0 3 6 9 12 15 18 21 24Time (Hours)
Cum
ulat
ive
Was
tew
ater
Vol
ume
(MG
)
320 gpm Pump RateFlow Entering PlantPump Flow Rate

0.000
0.050
0.100
0.150
0.200
0.250
0.300
0.350
0.400
0.450
0.500
0 3 6 9 12 15 18 21 24Time (Hours)
Cum
ulat
ive
Was
tew
ater
Vol
ume
(MG
)
320 gpm Pump RateFlow Entering PlantPump Flow Rate

0.000
0.050
0.100
0.150
0.200
0.250
0.300
0.350
0.400
0.450
0.500
0 3 6 9 12 15 18 21 24Time (Hours)
Cum
ulat
ive
Was
tew
ater
Vol
ume
(MG
)
320 gpm Pump RateFlow Entering PlantPump Flow Rate
0.000
0.050
0.100
0.150
0.200
0.250
0.300
0.350
0.400
0.450
0.500
0 3 6 9 12 15 18 21 24Time (Hours)
Cum
ulat
ive
Was
tew
ater
Vol
ume
(MG
)
320 gpm Pump RateFlow Entering PlantPump Flow Rate

0.000
0.050
0.100
0.150
0.200
0.250
0.300
0.350
0.400
0.450
0.500
0 3 6 9 12 15 18 21 24Time (Hours)
Cum
ulat
ive
Was
tew
ater
Vol
ume
(MG
)
320 gpm Pump RateFlow Entering PlantPump Flow Rate

0.000
0.050
0.100
0.150
0.200
0.250
0.300
0.350
0.400
0.450
0.500
0 3 6 9 12 15 18 21 24Time (Hours)
Cum
ulat
ive
Was
tew
ater
Vol
ume
(MG
)
320 gpm Pump RateFlow Entering PlantPump Flow Rate
0.000
0.050
0.100
0.150
0.200
0.250
0.300
0.350
0.400
0.450
0.500
0 3 6 9 12 15 18 21 24Time (Hours)
Cum
ulat
ive
Was
tew
ater
Vol
ume
(MG
)
320 gpm Pump RateFlow Entering PlantPump Flow Rate

0.000
0.050
0.100
0.150
0.200
0.250
0.300
0.350
0.400
0.450
0.500
0 3 6 9 12 15 18 21 24Time (Hours)
Cum
ulat
ive
Was
tew
ater
Vol
ume
(MG
)
320 gpm Pump RateFlow Entering PlantPump Flow Rate

0.000
0.050
0.100
0.150
0.200
0.250
0.300
0.350
0.400
0.450
0.500
0 3 6 9 12 15 18 21 24Time (Hours)
Cum
ulat
ive
Was
tew
ater
Vol
ume
(MG
)
320 gpm Pump RateFlow Entering PlantPump Flow Rate
0.000
0.050
0.100
0.150
0.200
0.250
0.300
0.350
0.400
0.450
0.500
0 3 6 9 12 15 18 21 24Time (Hours)
Cum
ulat
ive
Was
tew
ater
Vol
ume
(MG
)
320 gpm Pump RateFlow Entering PlantPump Flow Rate
0.000
0.050
0.100
0.150
0.200
0.250
0.300
0.350
0.400
0.450
0.500
0 3 6 9 12 15 18 21 24Time (Hours)
Cum
ulat
ive
Was
tew
ater
Vol
ume
(MG
)
320 gpm Pump RateFlow Entering PlantPump Flow Rate
Pump stops
0.000
0.050
0.100
0.150
0.200
0.250
0.300
0.350
0.400
0.450
0.500
0 3 6 9 12 15 18 21 24Time (Hours)
Cum
ulat
ive
Was
tew
ater
Vol
ume
(MG
)
320 gpm Pump RateFlow Entering PlantPump Flow Rate
Water level returns tooriginal elevation