Embed Size (px)
Citation preview

The European Commission’s
science and knowledge service
Joint Research Centre
Changes to LPIS QA:
Analysis of the
sampling
representativeness
and impact
on 2017
W. DEVOS and D. FASBENDER
2
PART1: Sampling --- Trigger
ECA Special report (25/2016) to “assess the reliability, effectiveness
and impact of LPIS/GIS across the EU”
Recommendation 5:
“The Commission should, before the start of the QA exercise 2017, carry
out a cost-benefit analysis to determine whether the representativeness
of QA samples could be improved so that a better coverage of the
population of parcels in
the LPIS can be achieved.”
EC (DG JRC) acknowledged the recommendation since
“The monitoring of sample representativeness is part of a continuous
process.”
2017: Experience of 2 years dedicated LPIS QA image provision
Image allocations unchanged in 2016
update with latest population data

3
A. A new statistic

4
What is representativeness ?
Short definition:A representative sample is a sample that shows
similar characteristics compared to the population
from which it has been issued.
Representative of what ?In LPIS QA context: representative of the system’s
quality (i.e. presence of non-conformities, MEA correctly recorded…)
How to proceed with analysis?
For this analysis, reference area is the only
observable parameter (i.e. proxy parameter) !
Note: larger RP may behave different than smaller RP
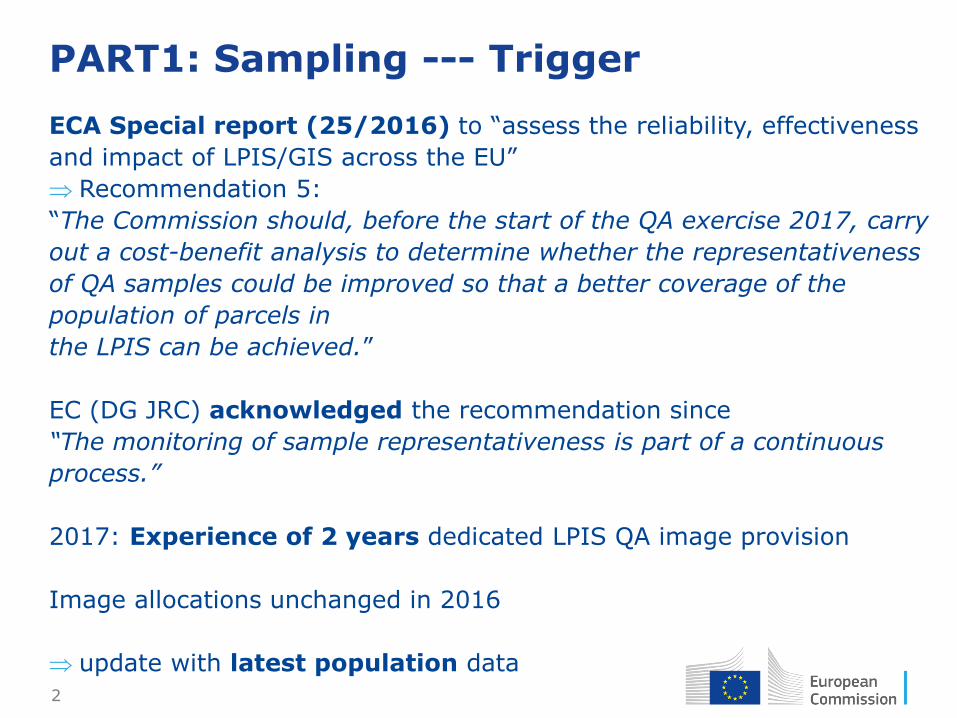
Use simulations for verifying that the whole sampling
procedure tends to produce samples in which
no particular portion of the population is over-/under-
represented.
Population
Representativesample
Unrepresentativesample
5
Population statistics:Min, max, mean, var, range, intervals of 95%,…
Each sample statistics:Min, max, mean, var, range, intervals of 95%,…
With 1, 2, 3,… zone(s) until acceptable match
Simulation (Improving representativeness of LPIS samples)
100 x sampledeach time random zones
6
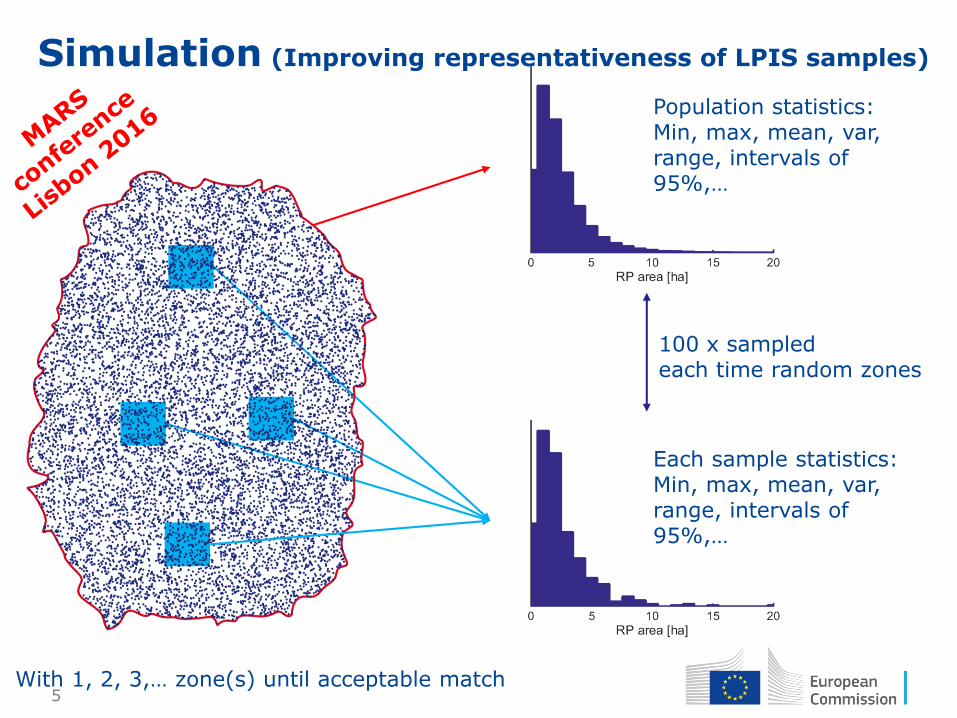
Which characteristics (stats) to compare?
Z-test Chi-square test Kolmogorov-Smirnov test
PCPI (% of pop. in
central prob. interval)
Comparison of sample and pop. means
Comparison of sample and pop. variances
Full comparisonof distribution’sshapes
Comparison of « 95% imprints »
•Detection of bias
•Fails to assessthe variability
•Fails to assessthe bias
•Detection of abnormalvariance
•Tests all aspectsof the sample
•So idealistic thatit becomes toorestrictive
•Detection of shifts•Detection of abnormalvariance…while keeping the objective realistic!

7
Tests’ results on the past LPIS samples.
Proposed tests were
applied to the actual
samples of previous
years (2010-2016)
No particular trend in
the acceptance rates (all
systems together)
Two distinct periods
2010-2014 and 2015-
2016
Impact of “at least 3
images” could be
identified (green and red
lines)
Old rule-of-thumb
reintroduced from
20.000+ km2
Accepta
nce r
ate
of th
e t
ests
[%
]
PCPI ideal
95%=Producer error
8
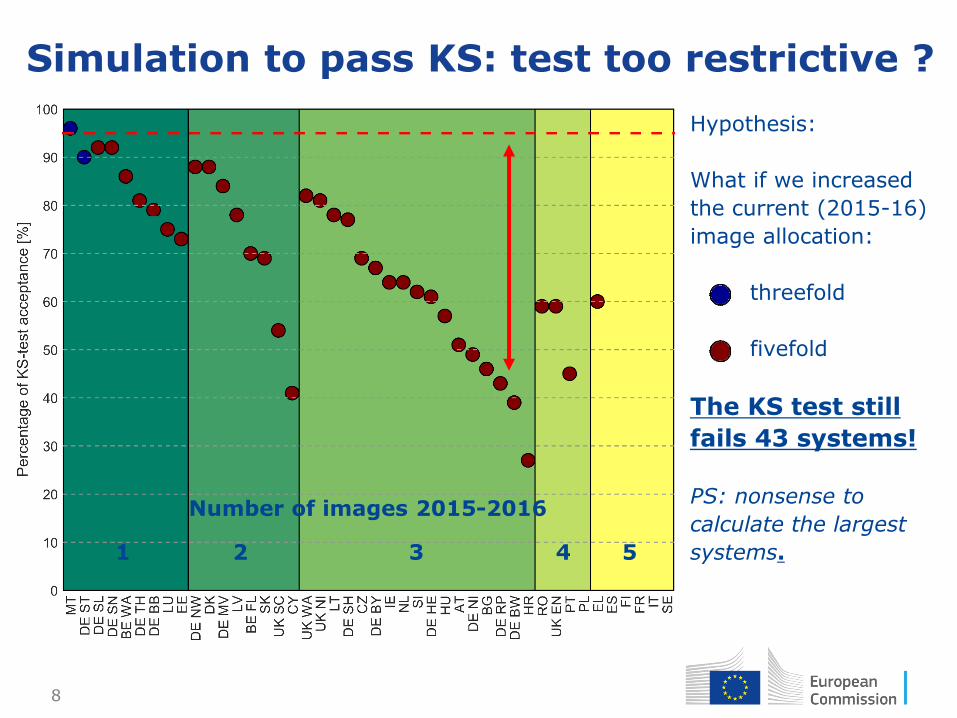
Simulation to pass KS: test too restrictive ?
Hypothesis:
What if we increased
the current (2015-16)
image allocation:
threefold
fivefold
The KS test still
fails 43 systems!
PS: nonsense to
calculate the largest
systems.
Number of images 2015-2016
1 2 3 4 5

9
PCPI simulation: steps
The working definition of representativeness: « The interval with 95% of the sample shouldcontain 95% of the population ». Statistical tolerance / margin :±2%
1: zones
2: sample
3: interval
4: PCPI

10
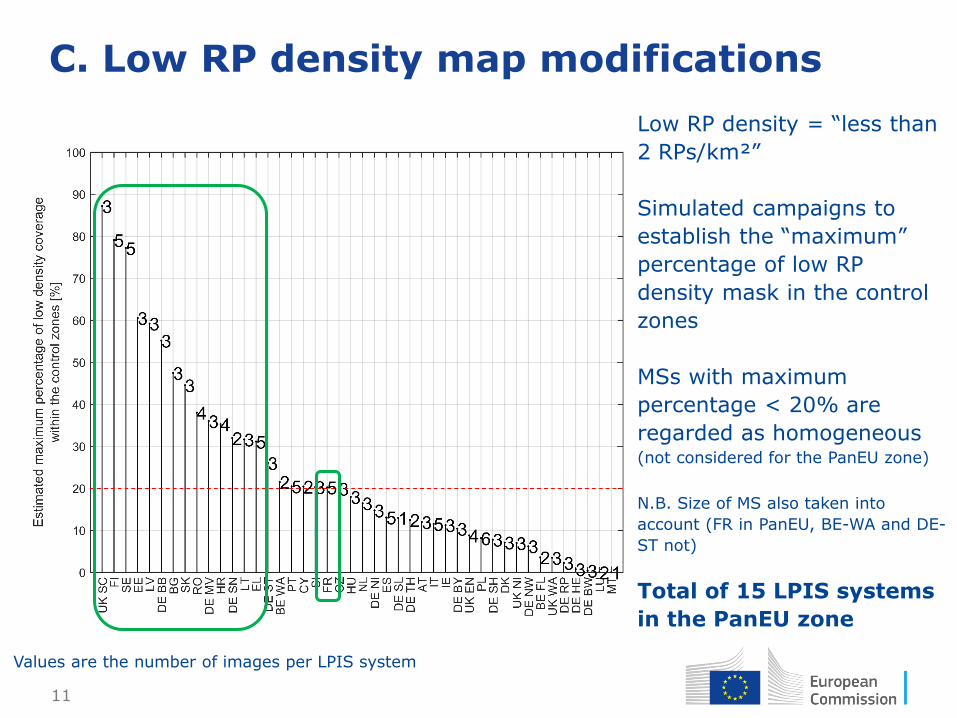
B. A new density mask
• Threshold of 2 RPs/km² for low density
• Using 2016 population
• 2 km resolution regular grid (instead of 10 km)
• Improved coastline delineation
2015-2016 2017
11
C. Low RP density map modifications
Low RP density = “less than
2 RPs/km²”
Simulated campaigns to
establish the “maximum”
percentage of low RP
density mask in the control
zones
MSs with maximum
percentage < 20% are
regarded as homogeneous (not considered for the PanEU zone)
N.B. Size of MS also taken into
account (FR in PanEU, BE-WA and DE-
ST not)
Total of 15 LPIS systems
in the PanEU zone
Values are the number of images per LPIS system

12
D. A new image allocation map
LPIS name 2015-2016 2017
BE-WA 1 + 1
CY 1 + 1
DE-BB 1 + 2
DE-MV 2 + 1
DE-NW 2 + 1
DE-SN 1 + 1
DE-ST 1 + 2
DE-TH 1 + 1
DK 2 + 1
EE 1 + 2
HR 3 + 1
LU 1 + 1
LV 2 + 1
PL 4 + 2
PT 4 + 1
SK 2 + 1
UK-SC 2 + 1
TOTAL 121 +21
1 image2 images3 imagesPanEU (2 images)
13
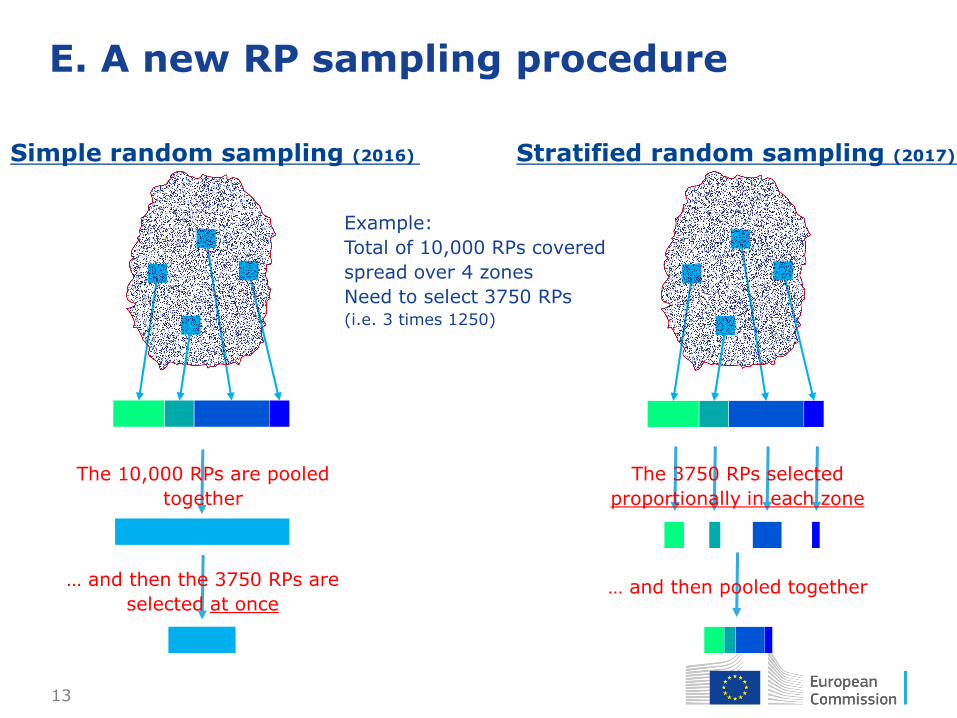
E. A new RP sampling procedure
Simple random sampling (2016) Stratified random sampling (2017)
Example:
Total of 10,000 RPs covered
spread over 4 zones
Need to select 3750 RPs(i.e. 3 times 1250)
The 3750 RPs selected
proportionally in each zone
… and then pooled together
The 10,000 RPs are pooled
together
… and then the 3750 RPs are
selected at once
14
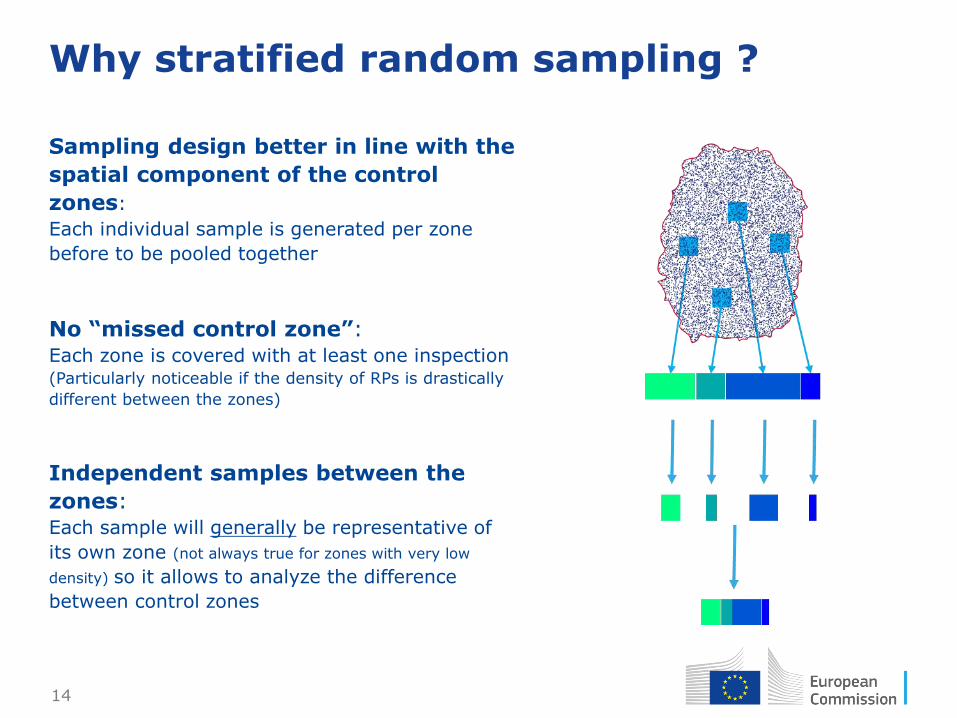
Why stratified random sampling ?
Sampling design better in line with the
spatial component of the control
zones:
Each individual sample is generated per zone
before to be pooled together
No “missed control zone”:Each zone is covered with at least one inspection (Particularly noticeable if the density of RPs is drastically
different between the zones)
Independent samples between the
zones:Each sample will generally be representative of
its own zone (not always true for zones with very low
density) so it allows to analyze the difference
between control zones

15
F. … adapted inspection loop (?)
Proposal 1 « scientific »
Proposal 2 « pragmatic »
Proposal 3 « lowest burden »
DG JRC generates one sample pre-selection list per control zone
MSs make sure that the required number of inspections per control zone is reached
DG JRC generates one uniquesample pre-selection list
MSs make sure that the required number of inspections per control zone is reached
DG JRC generates one uniquesample pre-selection list with a particular structure that “maximizes the chance to reach the required number of inspections per control zone”
• Fully in line with the samplingprocedure
• Instructions are clear (work
organized per zone)
• There is up to 6 lists for someMS (update of software?)
• Required number of inspections is garanteed
• Instructions are more complicated (manual jumping until
required number of inspections)
• There is one list (No need to
update the software)
• Required number of inspections is not garanteed
• Instructions are clear(=Business As Usual)
• There is one list (No need to
update the software)
In all the cases, no increase of inspections !

16
Example:
3 zones
10000 RPs covered (10% in control zone 1, 30% in control zone 2, 60% in control zone 3)
1250 inspections (pre-select 3750 RPs)
125 for control zone 1, 375 for control zone 2, 750 for control zone 3
Proposal 1: “Scientific”
Control zone 1: 125 inspections
RP1.1
RP1.2
RP1.375
Control zone 2: 375 inspections
RP2.1
RP2.2
RP2.1125
Control zone 3: 750 inspections
RP3.1
RP3.2
RP3.2250
Once 125 inspections reached,
start with the 2nd list
Once 375 inspections reached,
start with the 3rd list
Once 750 inspections reached,
full stop

17
Proposal 2: “Pragmatic”
Example:
3 zones
10000 RPs covered (10% in control zone 1, 30% in control zone 2, 60% in control zone 3)
1250 inspections (pre-select 3750 RPs)
125 for control zone 1, 375 for control zone 2, 750 for control zone 3
RP1.1
RP1.2
RP1.375
RP2.376
RP2.377
RP2.1500
RP3.1501
RP3.1502
RP3.3750
Once 125 inspections reached, jump
manually to the 2nd “block”
Once 375 extra (sub-total of 500)
inspections reached, jump manually to
the 3rd “block”
Once 750 extra (sub-total of 1250)
inspections reached, full stop

18
Proposal 3: “Lowest burden”
Example:
3 zones
10000 RPs covered (10% in control zone 1, 30% in control zone 2, 60% in control zone
3)
1250 inspections (pre-select 3750 RPs) - known skipping rate = 10%
125 for control zone 1, 375 for control zone 2, 750 for control zone 3
RP1.1
…
RP1.125
RP2.126
…
RP2.500
RP3.501
…
RP3.1250
RP1.1251
…
RP1.1263
RP2.1264
…
RP2.1300
RP3.1301
…
RP3.1375
RP1.1376
RP2.1377
RP3.1378
RP1.1379
….
Required number without skipping
Once 1250 inspections reached, full stop
Expected end of loop end from skipping in the past

19
2017: Improved representativeness
The objective of 2% margin
for the PCPI is now
generally met (except for CY and
LU)
Score system (with classes of
PCPI) shows good cost-
benefit improvements
Classes of PCPI2015-2016 2017
Good(less than 1% difference) 26 31
Intermediate (between 1-
2% difference) 11 11
Poor(more than 2% difference) 7 2
Score (Good=2, Intermediate=1,
Poor=0) 63 73 (+16%)
Total images123 144 (+17%)

20
Conclusions (on part 1)
• Better establishment of the location of the agricultural areas (i.e.
improved spatial resolution of density masks, improved coastline delineation…)
• Representativeness of the samples assessed and remedial actions
were taken where necessary
• Biggest changes are:
- addition of 21 images spread over 17 LPIS systems
- change of RP sampling procedure (internal for DG JRC)
- repartition of the inspections imposed across the control zones
(ETS inspections by MS) through adapted inspection loop (?)
• Required (?) number of inspections is provided per control zone
but total number of inspections (500/800/1250) is unchanged !

21
PART 2: Clarifications on some previous
communications
1. Parcels in scope (“active parcel”)
2. Counting multiple non-conformities in a single non-
conforming item
3. Mapping / reporting small artificial surfaces
THESE ARE NO CHANGES!!! Merely clarification / typo
corrections to avoid erroneous inspection recycled slides

22
reference parcel
Agricultural parcel 1declared
Agric
ultu
ral
parc
el 2
decla
red
n years
Agric
ultu
ral
parc
el 2
decla
red
Agricultural parcel 1declared
Agric
ultu
ral
parc
el 2
n years
Agric
ultu
ral
parc
el 2
reference parcel
Agricultural parcel 1
Agric
ultu
ral
parc
el 2
Agric
ultu
ral
parc
el 2
reference parcel
Active Active Not active
Belief
The LPIS QA scope
contains all RPs on
agricultural land
Fact
Only the “active” RPs are
in the scope
n ≥ 2
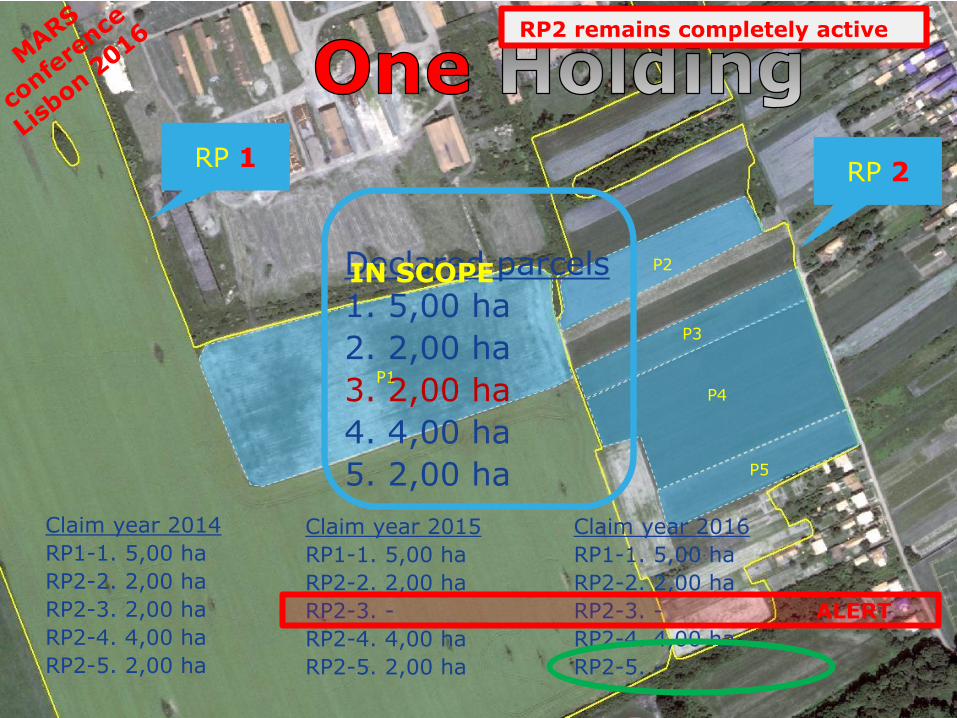
23
P1
P2
P3
P5
P4
Declared parcels
1. 5,00 ha
2. 2,00 ha
3. 2,00 ha
4. 4,00 ha
5. 2,00 ha
Claim year 2014
RP1-1. 5,00 ha
RP2-2. 2,00 ha
RP2-3. 2,00 ha
RP2-4. 4,00 ha
RP2-5. 2,00 ha
Claim year 2016
RP1-1. 5,00 ha
RP2-2. 2,00 ha
RP2-3. -
RP2-4. 4,00 ha
RP2-5. -
Claim year 2015
RP1-1. 5,00 ha
RP2-2. 2,00 ha
RP2-3. -
RP2-4. 4,00 ha
RP2-5. 2,00 ha
ALERT
RP 2RP 1
IN SCOPE
RP2 remains completely active
24
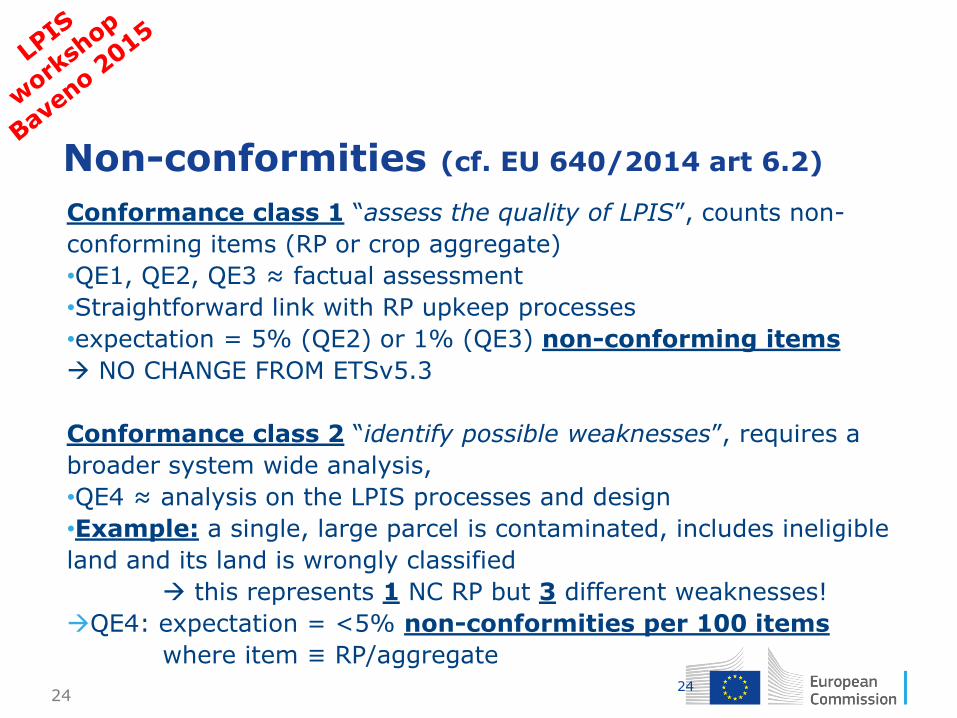
Non-conformities (cf. EU 640/2014 art 6.2)
Conformance class 1 “assess the quality of LPIS”, counts non-
conforming items (RP or crop aggregate)
•QE1, QE2, QE3 ≈ factual assessment
•Straightforward link with RP upkeep processes
•expectation = 5% (QE2) or 1% (QE3) non-conforming items
NO CHANGE FROM ETSv5.3
Conformance class 2 “identify possible weaknesses”, requires a
broader system wide analysis,
•QE4 ≈ analysis on the LPIS processes and design
•Example: a single, large parcel is contaminated, includes ineligible
land and its land is wrongly classified
this represents 1 NC RP but 3 different weaknesses!
QE4: expectation = <5% non-conformities per 100 items
where item ≡ RP/aggregate24
25
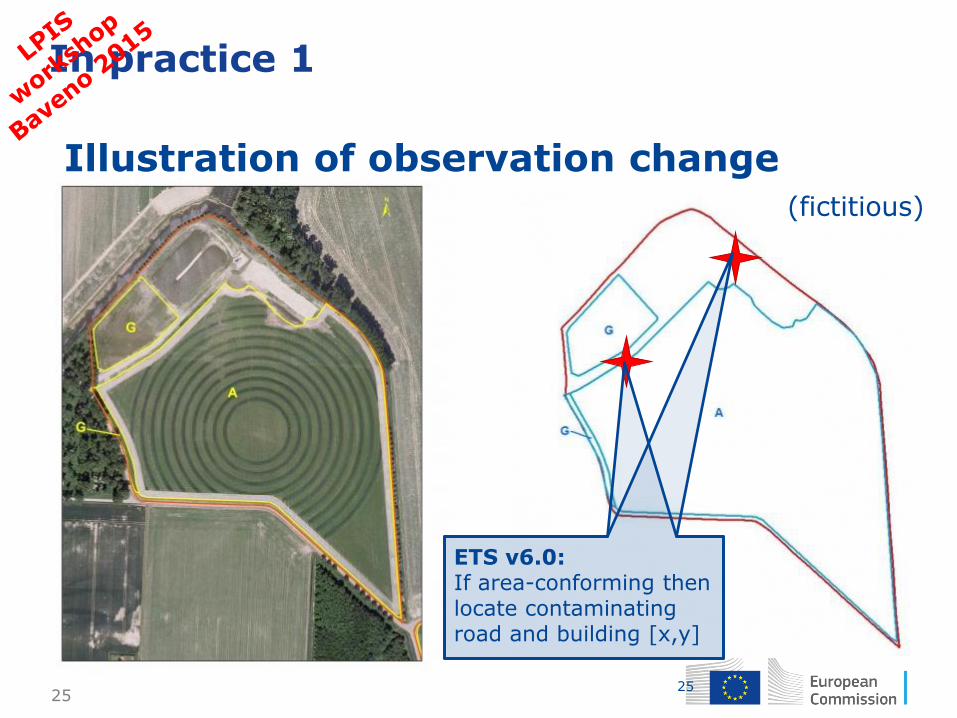
In practice 1
25
Illustration of observation change(fictitious)
ETS v6.0: If area-conforming then locate contaminating road and building [x,y]
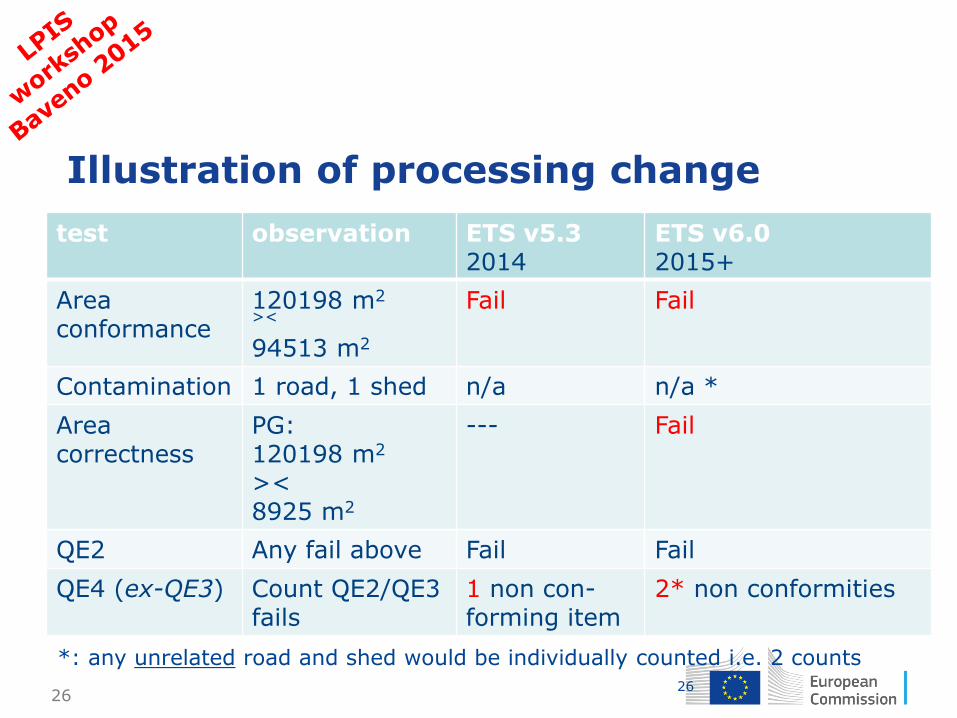
26
Illustration of processing change
26
test observation ETS v5.32014
ETS v6.02015+
Area conformance
120198 m2
><
94513 m2
Fail Fail
Contamination 1 road, 1 shed n/a n/a *
Area correctness
PG:120198 m2
><8925 m2
--- Fail
QE2 Any fail above Fail Fail
QE4 (ex-QE3) Count QE2/QE3 fails
1 non con-forming item
2* non conformities
*: any unrelated road and shed would be individually counted i.e. 2 counts

27
Mapping and reporting of small non-
agriculture features
Reporting of the artificial sealed features in ETS is regardless
their size
•for accounting: any potential triggers for contamination
•following the LPIS guidance of AGRI, stating that “man-
made constructions …. should be excluded from the RP by
delineation”
•However, ETS does not require a delineation of all non-
agriculture features
• only those larger than or equal to 0.03 ha
• or 0.01 ha depending on the orthoimage and nature of
land feature
• other smaller features are reported as points only
27