Embed Size (px)
Citation preview

Designing Sustainable
Supply Chain Systems
Joseph Fiksel
Executive Director
Resilience.OSU.edu

Resilience
The capacity to survive, adapt, and flourish in theface of turbulent change
Safety & Business
Continuity
Long-Term Strategic
Sustainability

Our Expanding Footprint
“If every human alive today consumed natural resources and emitted carbon dioxide at the same rate as the average American, European , or Australian we would need at least another two earths.”
- WWF International
Sustainable Materials Management
Waste Recovery
Natural Systems
Renewable Resource Stocks
Non-renewable Resource Stocks
Industrial Systems
Energy Production
Product/Service Supply Chains
Societal Systems
Consumable Product Use
Durable Product Use
Material& Energy
Harvesting
DemandFulfillment
Direct Utilizati
on Energy Use
Finite Media
Service Use
Energy Sources
Direct Labor
Waste & Emissions
HumanImpacts
Capital Stocks
EcosystemGoods & Services
EconomicGoods & Services
Source: J. Fiksel, “A Framework for Sustainable Materials Management,” Journal of Materials, August 2006.

Full ecologicalfootprint
Ecosystem goods and services –
embedded natural capital
The Hidden Mountain of Resource Use
Supply chainFootprint
€ $Purchased
goods & services(indirect)
Life Cycle Assessmen
t (LCA)
Direct resource consumption
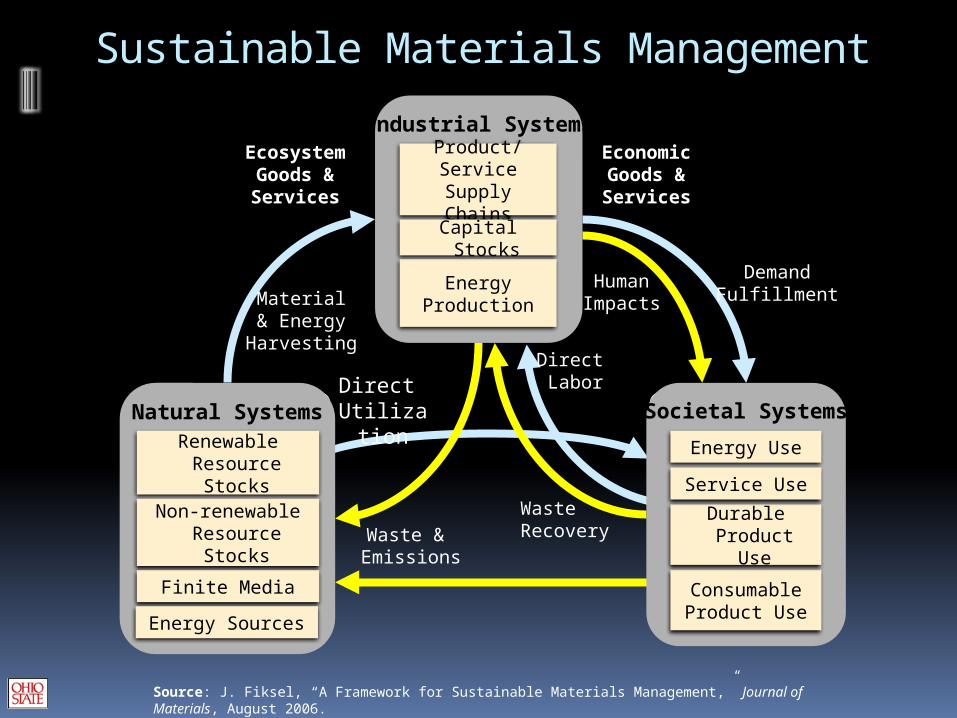
Paradigm Shift
Material-Based
Economy
• Throughput
• Products
• EconomicCapital
Value-Based
Economy
• Knowledge
• Services
• Human Capital

Less Stuff—More Value

Life Cycle Thinking
Customers
SuppliersAssets
Contractors
Natural Resources: Energy, Water, Materials, Services
Communities
Employees
Recycle
Design
SourceMake
Deliver
Support
Measure

CorporateSustainability

Enterprise Strategies
DevelopingSustainable
Products
Preventing Pollution
at the SourceConverting Wastes
into Resources
Substituting Services for
Products
Collaborative Networks
and Partnership
s
Adapted from World Business Council on Sustainable Development
Eco-efficiency
Value Out Resource In

Greening of Consumer Products

Greening of Service Industries

By-Product Synergy Networks
Industrial ecology is a process systems approach that mimics natural cycles, converting
waste into “food”
“By-product synergy (BPS) is the matching of under-valued waste or by-product streams from one facility with potential users at another facility to create new revenues or savings with potential social and environmental benefits.”
- U.S. Business Council for Sustainable Development

Eco-Flow™ Industrial Ecology Optimization
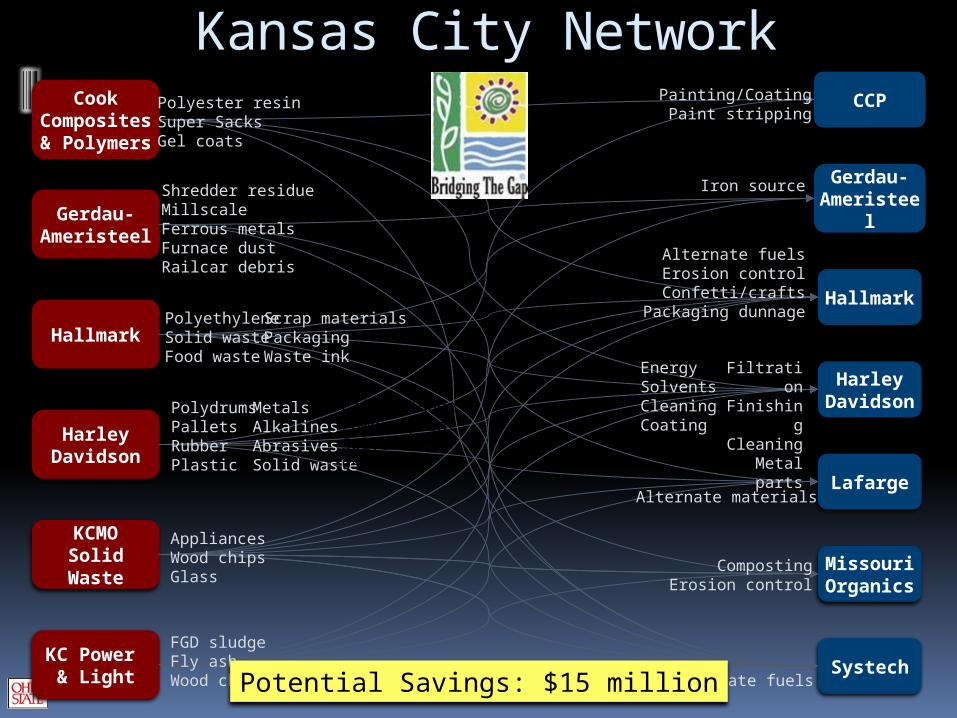
Kansas City Network
Systech
Cook Composites & Polymers
Gerdau-Ameristeel
Hallmark
KCMOSolid Waste
Lafarge
Harley Davidson
KC Power & Light
Hallmark
Harley Davidson
CCP
Missouri Organics
Gerdau-Ameristeel
Alternate fuels
Alternate materials
FiltrationFinishingCleaning
Metal parts
Alternate fuelsErosion controlConfetti/crafts
Packaging dunnage
Painting/CoatingPaint stripping
Iron source
CompostingErosion control
EnergySolventsCleaningCoating
Shredder residueMillscaleFerrous metalsFurnace dust Railcar debris
Polyester resinSuper SacksGel coats
PolyethyleneSolid wasteFood waste
AppliancesWood chipsGlass
PolydrumsPalletsRubberPlastic
MetalsAlkalinesAbrasivesSolid waste
FGD sludgeFly ashWood chips
Scrap materialsPackagingWaste ink
Paint sludgePowder paintSolventsUsed oils
Potential Savings: $15 million

Economic Products &
Services
NaturalCapital
Ecosystem Products &
Services
Economic Capital
Sun
Accounting for Natural Capital
ConsumersEco-LCA™

Life Cycle of Industrial Materials
Materials Production
Supply
Chain
Processes
Utilization &
Consumption
Processes
Residual Materials
Revalorization
ValueExtractionInputs
ValueCreation
Recycled Parts &
Materials
Energy
Recovery
Processes
Products
By-Products
Outputs
Virgin Materials
Waste & Emissions
ExtractionEnvironment – Natural Capital
Disposal
Non-Product

Automotive Fuel Analysis
Return on
Energy
Renewability
Corn Ethanol
Crop Cellulosi
c Ethanol
Biodiesel
Gasoline
8
6
4
2
0
0% 50% 100%
Source: A. Baral and B. R. Bakshi, “The Role of Ecological Resources and Aggregate Thermodynamic Metrics for Assessing the Life Cycle of Some Biomass and Fossil Fuels”, Environmental Science and Technology, 2009
MSW Cellulosi
c Ethanol

Material-Energy-Water Nexus
Energy
Materials
Water~ 100 liters per $
~ 1 kg per liter
~ 0.5 kWh/M
T
~ 100 liters/kWh
~ 0
.5 M
T/kW
h~
3 k
Wh
per $
excludes ecosystem
services

EnvironmentalFootprint
Greenhouse GasEmissions
Persistent ToxicEmissions
Solid WasteIntensity
WaterIntensity
Non-RenewableResource Intensity
EnergyIntensity
Land Intensity
Progress Indicators
SocietalValue
Energy Efficiency
Health & safetyImprovement
AssetRecovery
ResourceConservation
PovertyAlleviation
Human NeedFulfillment
EconomicDevelopment

Design for EnvironmentJoseph FikselMcGraw-Hill, July 2009
Disruptive Innovation Product Development Process Eco-Efficiency Life Cycle
Management Business Value
Creation Supply Chain
Sustainability