Embed Size (px)
Citation preview
Contents lists available at SciVerse ScienceDirect
Journal of Accounting and Economics
Journal of Accounting and Economics 54 (2012) 68–93
0165-41
http://d
$ We
Econom
Elicia Co
Univers
Univers
Univers
We alson Corr
E-m
journal homepage: www.elsevier.com/locate/jae
Are IFRS-based and US GAAP-based accountingamounts comparable?$
Mary E. Barth a,n, Wayne R. Landsman b, Mark Lang b, Christopher Williams c
a Graduate School of Business, Stanford University, Stanford, CA 94305-5015, USAb Kenan-Flagler Business School, University of North Carolina, Chapel Hill, NC 27599-3490, USAc Stephen M. Ross School of Business, University of Michigan, Ann Arbor, MI 48109-1234, USA
a r t i c l e i n f o
Article history:
Received 6 April 2010
Received in revised form
8 March 2012
Accepted 9 March 2012Available online 4 April 2012
Jel classification:
M41
M48
G15
Keywords:
Comparability
IFRS
International accounting
01/$ - see front matter & 2012 Elsevier B.V. A
x.doi.org/10.1016/j.jacceco.2012.03.001
appreciate funding from the Center for Finan
y, Stanford Graduate School of Business, and
wins, Julie Erhardt, Robert Holthausen (the ed
ity of Cologne, ESSEC Business School, Geo
ity of Leeds, University of Missouri, Oklah
ity, Southern Methodist University, Stanford
thank Dan Amiram and Mark Maffett for as
esponding author. Tel.: þ1 650 723 8536; fa
ail address: [email protected] (M.E. Barth
a b s t r a c t
This study examines whether application of IFRS by non-US firms results in accounting
amounts comparable to those resulting from application of US GAAP by US firms. IFRS
firms have greater accounting system and value relevance comparability with US firms
when IFRS firms apply IFRS than when they applied domestic standards. Comparability is
greater for firms that adopt IFRS mandatorily, firms in common law and high enforcement
countries, and in more recent years. Earnings smoothing, accrual quality, and timeliness
are potential sources of the greater comparability. Although application of IFRS has
enhanced financial reporting comparability with US firms, significant differences remain.
& 2012 Elsevier B.V. All rights reserved.
1. Introduction
The objective of this study is to determine the extent to which application of International Financial ReportingStandards (IFRS) by non-US firms (hereafter, IFRS firms) results in accounting amounts that are comparable to thoseresulting from application of US Generally Accepted Accounting Principles (GAAP) by US firms. We make thisdetermination by addressing two questions. The first is whether comparability is greater after firms apply IFRS thanwhen they applied non-US domestic standards. The second is whether comparability differs after firms adopt IFRSdepending on whether a firm mandatorily adopts IFRS, depending on the legal origin and extent of enforcement of an IFRSfirm’s country, and in more recent reporting years. Although there is a growing literature examining whether applicationof IFRS affects the quality of accounting amounts and has economic implications in capital markets (see Hail et al., 2010a,2010b), no study directly examines the extent to which application of IFRS by IFRS firms results in accounting amountsthat are comparable to those based on application of US GAAP by US firms.
ll rights reserved.
ce and Accounting Research, Kenan–Flagler Business School, the Center for Global Business and the
the PriceWaterhouseCoopers — Norm Auerbach Faculty Fellowship. We appreciate comments from
itor), Margot Howard, Elmar Venter, Rodrigo Verdi (the reviewer), and workshop participants at the
rge Washington University, Giessen Business School, University of Graz, IESE Business School,
oma State University, Shanghai University of Finance and Economics, Singapore Management
University, Washington University at St. Louis, and the European Accounting Association Congress.
sistance with data collection.
x: þ1 650 725 7979.
).
M.E. Barth et al. / Journal of Accounting and Economics 54 (2012) 68–93 69
The study is potentially relevant to current policy debates relating to possible use of IFRS by US firms.1 Following its2007 decision to permit non-US firms cross-listing in the US to file financial statements based on IFRS, the US Securitiesand Exchange Commission (SEC) presently is considering permitting US firms to file financial statements based on IFRS. Areason for this is the possibility that accounting amounts based on IFRS are comparable to those based on US GAAP. Fourcontributing factors underlying this possibility are the efforts of the International Accounting Standards Board (IASB) andthe Financial Accounting Standards Board (FASB) to converge accounting standards, the increasing use of IFRS throughoutthe world, development of international auditing standards, and the increasing coordination of international securitiesmarket regulators. A goal of these efforts is to develop similar accounting standards and more consistent interpretation,auditing, and enforcement of the standards. The accounting amounts resulting from application of US GAAP or IFRS reflectthe combined effect of these features of the financial reporting system. The SEC is concerned with comparability ofaccounting amounts, not simply comparability of accounting standards.
The basic notion of comparability in the conceptual frameworks for financial reporting underlying IFRS and US GAAP isthat accounting amounts are comparable if, when two firms face similar economic outcomes, the firms report similaraccounting amounts. We use two approaches to assess comparability of accounting amounts resulting from application ofIFRS and US GAAP, both of which use the same relations between stock price, stock return, and cash flow as economicoutcomes, and various combinations of net income and equity book value as accounting amounts.2 The first approach,which we label accounting system comparability, defines accounting amounts as being comparable if an economicoutcome (e.g., stock price) estimated based on the mapping from accounting amounts (e.g., earnings) to that economicoutcome of one system is the same as the estimated economic outcome based on the mapping of the other system. Theaccounting system comparability metrics are based on the difference between fitted values of the economic outcomesresulting from applying US GAAP and IFRS multiples to each firm’s accounting amounts. This approach is designed tooperationalize the SEC’s desire to determine how well IFRS accounting amounts fit within the US financial reportingsystem (SEC, 2010). The second approach, which we label value relevance comparability, defines accounting amounts asbeing comparable if they explain the same variation in economic outcomes. This approach also should provide evidence tothe SEC because value relevance is frequently used as a summary measure of how well accounting amounts reflect a firm’sunderlying economics.
We select stock price and stock return as economic outcomes because they are summary measures of equity value andchange in equity value that reflect investors’ capital allocation decisions and, as a result, each is commonly employed inaccounting research to capture a firm’s underlying economics. We select cash flow as an economic outcome becauseforecasting future cash flow plays a key role in economic models of equity value. We select earnings and equity book valueas accounting amounts because they are the two primary summary measures from financial statements extensivelyemployed in accounting research linking accounting amounts to equity value.
The first set of tests determines whether comparability is greater when IFRS firms apply IFRS than when they appliednon-US domestic standards. The second set of tests uses a variety of post-adoption sample partitions to determine whetherthere are comparability differences after IFRS firms adopt IFRS that are associated with particular features of the IFRS firms’financial reporting environments. We first test our predictions that comparability is greater for firms domiciled incountries with common law legal origins and with high enforcement. The basis for these predictions is that IFRS are largelyderived from financial accounting standards developed in common law countries, including the US, and code law and lowenforcement countries likely have weaker enforcement than common law and high enforcement countries (e.g., Ball et al.,2000, 2003). We also test for comparability differences between voluntary and mandatory IFRS adopters but make noprediction relating to differences between these two groups of firms. The incentives of voluntary adopters could result inaccounting amounts that exhibit greater comparability than accounting amounts of mandatory adopters. However,because mandatory adoption affects a large number of firms simultaneously, investors’ enhanced ability to understand thelink between accounting amounts and economic outcomes and more consistent application and enforcement arising frommore firms applying IFRS could result in greater comparability for mandatory adopters.3 Which effect on comparabilitydominates is difficult to predict.
Using a sample of IFRS firms domiciled in 27 countries that adopted IFRS between 1995 and 2006 and a sample of USfirms matched on size and industry, we find that IFRS firms have significantly greater accounting system and valuerelevance comparability with US firms when they apply IFRS than when they applied non-US domestic standards. We alsofind, based on most metrics, that comparability is significantly greater for firms that adopt IFRS mandatorily, for IFRS firmsin countries with common law legal origin and with high enforcement, and in more recent years. These findings suggestthat efforts to converge accounting standards, the increasing mandatory use of IFRS throughout the world, thedevelopment of international auditing standards, and the increasing coordination of international securities marketregulators have increased comparability of accounting amounts.
1 The International Accounting Standards Board (IASB) issues IFRS. IFRS include not only standards issued by the IASB, but also International
Accounting Standards (IAS) issued by the IASB’s predecessor body, the International Accounting Standards Committee, some of which have been
amended by the IASB. Our sample years include those in which IAS and IFRS were effective. For ease of exposition, throughout we use IFRS to refer to IAS
or IFRS.2 Throughout we use the terms ‘‘net income’’ and ‘‘earnings’’ interchangeably.3 Many of our sample IFRS firms are domiciled in countries that adopted IFRS mandatorily in 2005. As a result, partitioning observations based on
voluntary and mandatory adoption is highly correlated with partitioning observations before and after 2005.
M.E. Barth et al. / Journal of Accounting and Economics 54 (2012) 68–9370
Additional findings indicate US firms’ accounting amounts generally have higher value relevance than those of IFRSfirms. Findings based on the price and return metrics, but not the cash flow metric, indicate IFRS-based accountingamounts are comparable to US GAAP-based accounting amounts for firms from common law legal origin countries.Findings from the other post-adoption sample partitions indicate significant comparability differences remain.
To provide insight into potential sources of differences in comparability, we also investigate whether the increase incomparability after firms adopt IFRS and differences in comparability across post-adoption sample partitions areassociated with differences in accounting quality. Based on prior research, we consider three dimensions of accountingquality — earnings smoothing, accrual quality, and earnings timeliness. We find that both before and after IFRS firms adoptIFRS accounting quality is higher for US firms, and that all three dimensions of accounting quality are potential sources ofthe increase in comparability after IFRS firms adopt IFRS. Similar findings obtain for all post-adoption sample partitions,with the exception of firms in common law countries, which, relative to US firms, exhibit higher accounting quality alongsome dimensions but lower quality along others.
We conduct several additional analyses. First, we test for differences in regression coefficients used in constructing thecomparability metrics to provide insight into whether differences in coefficients on equity book value, net income, orchange in net income are sources of the comparability differences we document, and find evidence that they are. Second,to examine whether increased convergence between IFRS and US GAAP and more widespread use of IFRS over time areassociated with increases in comparability, we repeat our analyses using observations from 2005 to 2006 and from 2007through 2009, and find that they are. However, as with the combined post-adoption sample, significant value relevancedifferences between IFRS and US firms remain in the 2007–2009 period. Third, to provide evidence on the extent to whichglobalization explains our primary findings, we conduct comparability tests using firms domiciled in two non-UScountries, Japan and India, that do not permit firms to apply IFRS instead of our IFRS firms. Findings do not supportglobalization as an explanation for our primary findings of increased comparability after IFRS firms adopt IFRS. Fourth, toaddress the possibility that the comparability differences are concentrated in firms in particular industries, we repeat thecomparability analyses for firms in the three industries with the largest number of observations, Manufacturing, Services,and Finance, Insurance, and Real Estate. Regarding comparability differences before and after IFRS firms adopt IFRS, thefindings generally reveal significant increases in accounting system comparability for firms in Manufacturing and Services,but not Finance, Insurance, and Real Estate. The findings also generally reveal significant increases in value relevancecomparability for all three industry groups. Regarding comparability differences for the post-adoption sample partitions,findings generally result in similar inferences for all three industry groups as those relating to the full sample.
The remainder of the paper is organized as follows. The next section discusses institutional background and relatedresearch. Sections three and four develop the hypotheses and explain the research design. Sections five and six describethe sample and data and present the results. Section seven offers a summary and concluding remarks.
2. Institutional background and related research
2.1. Institutional background
The SEC and the FASB have been working with their international counterparts on a convergence effort to develop highquality, internationally comparable financial information that investors find useful for decision making in global capitalmarkets (SEC, 2008; Financial Accounting Foundation, 2009). The convergence efforts have focused on coordinatingstandard setting and reducing differences in accounting standards. To this end, the FASB and IASB are working to achievethe standard-setting milestones specified in their Memorandum of Understanding (FASB and IASB, 2008) with a goal ofdeveloping a single set of high quality accounting standards. In their conceptual frameworks for financial reporting, theFASB (FASB, 2010) and IASB (IASB, 2010) identify comparability as the qualitative characteristic of financial informationthat enables users to identify and understand similarities in, and differences among, items. Some degree of comparabilityis attained when two entities faithfully represent similar economic phenomena similarly. However, comparability ofaccounting information is a function not only of accounting standards, but also of interpretation, auditing, and theregulatory, litigation, and enforcement environment. Recognizing this, the International Auditing and Assurance StandardsBoard has been developing International Standards on Auditing to enhance convergence in application of accountingstandards around the world. Similarly, the SEC and the International Organization of Securities Commissions are workingto coordinate oversight and regulation to facilitate consistent enforcement across countries.
In 2007, the SEC began permitting non-US firms that apply IFRS as issued by the IASB to file financial statementswithout reconciliation to US GAAP (SEC, 2007). Contributing to this decision is the belief that IFRS-based financialstatement information has become sufficiently comparable to US GAAP-based information so as to render thereconciliation requirement unnecessary. However, the SEC currently requires US firms to file financial statements basedon US GAAP. Consistent with the SEC’s stated desire for firms to use a single set of high quality accounting standards, in2008, the SEC proposed a Roadmap that could lead to requiring US firms to apply IFRS (SEC, 2008). The Roadmap states:
Through this Roadmap, the Commission is seeking to realize the objective of providing investors with financialinformation from US issuers under a set of high-quality globally accepted accounting standards, which would enable
4 In
combin
M.E. Barth et al. / Journal of Accounting and Economics 54 (2012) 68–93 71
US investors to better compare financial information of US issuers and competing international investmentopportunities.
Implicit in the SEC’s decision regarding the application of IFRS by US firms is the notion that financial statementinformation based on IFRS is sufficiently comparable in quality to that based on US GAAP, and that application of IFRS willbenefit US firms and investors by increasing comparability of resulting accounting amounts.
The SEC’s consideration of whether to require application of IFRS by US firms is ongoing. In 2010, the SEC issued astatement confirming its commitment to the Roadmap (SEC, 2010).4 In the statement, the SEC indicates that:
y the Staff will gather information using a variety of methods, including, but not limited to, performing its ownresearch; seeking comment from, holding discussions with, and analyzing information from constituents, includinginvestors, issuers, auditors, attorneys, other regulators, standard setters, and academics; considering academicresearch; and researching the experiences of other jurisdictions that have incorporated or have committed toincorporate IFRS into their financial reporting systems and foreign private issuers who currently report under IFRS.
As described below, our comparability metrics are designed to provide evidence on the extent to which convergenceefforts to date have increased comparability of accounting amounts resulting from the application of US GAAP and IFRSand the contexts in which differences remain.
In its comment letter on the Roadmap, the Financial Accounting Foundation (FAF, 2009), which oversees the FASB,recommends study of the ‘‘best path forward for the US financial reporting system toward the ultimate end goal,’’ and thatthe SEC should consider ‘‘other possible approaches [beyond those specifically described in the Roadmap], such asconvergence through continuation of the joint standard-setting efforts of the FASB and the IASB over a longer period asadvocated by some investors and other parties.’’ The FAF recommends the study include:
Steps that can and should be taken through continued international cooperation to more fully realize the potentialbenefits afforded by adopting a single set of high-quality global accounting standards, given the important effects ofother factors that impact the quality and the comparability of reporting outcomes, such as differing incentives,enforcement, and auditing practices, which continue to change over time.
Our goal is to provide input to this debate by providing evidence on the effectiveness of convergence efforts to date, aswell as remaining differences in comparability of accounting amounts. Although our study cannot address the normativequestion of which approach is best, because we cannot assess the costs and benefits of IFRS adoption versus continuedconvergence, it provides evidence on the effects of convergence in accounting standards, auditing, and enforcement.
2.2. Related research
Although there is a substantial literature comparing quality of accounting amounts internationally as well as capitalmarket effects of IFRS adoption (Hail et al., 2010a, 2010b), there is less evidence on the comparability of accountingamounts resulting from application of IFRS and US GAAP. Studies in the literature can be characterized as relating tocomparisons of accounting amounts resulting from application of IFRS and non-US domestic standards, application of USGAAP and non-US domestic standards, and application of IFRS and US GAAP.
Relating to studies that compare accounting amounts based on, and the economic implications of, non-US firmsapplying IFRS and domestic standards, Barth et al. (2008) finds that accounting quality of firms applying IFRS in 21countries, not including the US, generally is higher than that of firms applying domestic standards. Studies relating toGerman firms include Bartov et al. (2005), Van Tendeloo and Vanstraelen (2005), Daske (2006), and Hung andSubramanyam (2007). With the exception of Bartov et al. (2005), these studies generally fail to find differences inaccounting quality or economic implications, e.g., cost of capital. Daske et al. (2008) analyzes economic consequences ofmandatory application of IFRS in 26 countries and generally finds capital market benefits. However, capital marketbenefits exist only in countries with strict enforcement and institutional environments that provide strong reportingincentives.
Several studies compare accounting amounts based on, and the economic implications of, US firms applying US GAAPand non-US firms applying domestic standards. Alford et al. (1993) documents differences in earnings information contentand timeliness for 17 countries. The study finds mixed evidence regarding whether US GAAP earnings is more informativeor more timely than earnings based on non-US domestic standards. Land and Lang (2002) compares earnings-price ratiosfor firms in six countries plus the US, and finds they converge between an earlier and a later sample period. Using samplesof firms from six countries plus the US and 30 countries plus the US, Ball et al. (2000) and Leuz et al. (2003), respectively,provide evidence that observed differences in the properties of accounting amounts, including quality differences, reflectcross-country differences in incentives, enforcement, and attestation, in addition to differences in accounting standards.
Evidence from studies comparing accounting amounts based on, and the economic implications of, non-US firmsapplying IFRS and US GAAP is potentially relevant to the comparability question raised by the SEC in its Roadmap. Several
2011, the SEC supplemented its Roadmap by outlining a possible framework for incorporating IFRS into the US financial reporting system that
es elements of convergence and endorsement (SEC, 2011).
M.E. Barth et al. / Journal of Accounting and Economics 54 (2012) 68–9372
studies focus on comparisons using German firms that were permitted to apply either US GAAP or IFRS. Leuz andVerrecchia (2000) and Leuz (2003) compare measures of information asymmetry for German firms and find little evidenceof differences in bid/ask spreads, trading volume, and stock price volatility for firms that apply US GAAP relative to thosethat apply IFRS. Bartov et al. (2005) documents that earnings response coefficients are highest for German firms applyingUS GAAP, followed by those applying IFRS, and followed by those applying German standards. However, it is not clear towhat extent conclusions from these studies generalize to firms in other countries because these studies examine theproperties of accounting amounts of firms in a single non-US country with unique institutional features.
Several studies compare properties of accounting amounts based on IFRS with those based on US GAAP-reconciledamounts for firms that cross-list on US markets. Harris and Muller (1999) provides evidence that US GAAP-reconciledamounts for 31 firms applying IFRS are value relevant incremental to IFRS-based accounting amounts. Gordon et al. (2008)and Hughes and Sander (2008) compare earnings attributes for earnings based on IFRS and based on US GAAP-reconciledamounts. The studies generally find IFRS and US GAAP-reconciled earnings are comparable, although there is someevidence that US GAAP-reconciled earnings are of higher quality.
Although these studies provide some evidence regarding comparability of accounting amounts based on US GAAP andIFRS, there are several reasons why these studies’ findings do not bear directly on our research question. First, by design,these studies do not include US firms. However, a primary concern of the SEC is comparability of accounting amounts ofIFRS firms with those of US firms. Cross-listed firms do not face the same incentives, enforcement, regulation, and litigationenvironment as faced by US firms (Lang et al., 2006). Second, the properties of accounting amounts resulting fromreconciliation of earnings and equity book value to US GAAP are not the same as those resulting from comprehensiveapplication of US GAAP (Bradshaw and Miller, 2008). Third, because of the reconciliation requirement, cross-listed firmsapplying IFRS likely made US GAAP-consistent choices to minimize reconciling items that likely would not be made absentreconciliation requirements (Lang et al., 2003). Fourth, within-firm comparisons of US GAAP- and IFRS-based accountingamounts implicitly control for factors other than accounting standards. However, the SEC’s comparability concerns includethe effects of all factors that affect accounting amounts, e.g., managerial incentives, enforcement, and regulatory andlitigation environments (SEC, 2010).
3. Predictions
3.1. Comparability before and after IFRS adoption
Our first prediction is that comparability increased after IFRS firms adopt IFRS. We base this prediction on priorresearch discussed in Section 2.2, particularly research showing that IFRS-based and US GAAP-based accounting amountshave higher quality than those based on non-US domestic standards. Although prior research provides evidence relating tothis prediction, prior research does not test this prediction directly, nor can the result of a test of this prediction be inferredby combining results in prior research.5
3.2. Comparability differences after IFRS adoption
We next develop predictions for differences in comparability of IFRS-based and US GAAP-based accounting amountsthat reflect differences in IFRS firms’ financial reporting systems. Accounting amounts reflect the interaction of features ofthe financial reporting system, which include accounting standards and their interpretation, auditing, enforcement, andlitigation, all of which can affect comparability. Because of the inherent flexibility of principle-based standards andpotential weakness in other features of financial reporting systems outside the US, accounting amounts based on IFRS andUS GAAP may not be comparable.
Relating to standards, the IASB and FASB employ different approaches in developing standards that could result in lackof comparability of accounting amounts. In particular, the IASB’s approach relies more on principles, whereas the FASB’sapproach relies more on rules.6 Reliance on principles specifies broad requirements, but requires judgment in application.Reliance on rules specifies more requirements that leave less room for discretion. Ewert and Wagenhofer (2005) develops arational expectations model that shows accounting standards that limit opportunistic discretion result in accountingearnings that are more reflective of a firm’s underlying economics. However, although discretion in accounting can beopportunistic and possibly misleading about the firm’s economic performance, it can be used to reveal private informationabout the firm (Watts and Zimmerman, 1986). Relating to other features of the financial reporting system, Ball (1995,2006), Lang et al. (2006), and Bradshaw and Miller (2008) observe that accounting standards and the regulatory and
5 Although Barth et al. (2008) finds that value relevance increased after firms voluntarily adopted IFRS, there are two important differences between
that study and ours. First, whereas our focus is on comparability of IFRS and US GAAP, Barth et al. (2008) does not address comparability. Second, the
Barth et al. (2008) evidence is based on voluntary IFRS adopters and a sample period that predates recent developments in accounting standards and
related institutions. In contrast, we assess comparability using accounting amounts for IFRS firms from a larger number of countries, including mandatory
adopters. Our sample also includes observations from more recent years, and therefore our findings are more likely to be relevant to the SEC’s ongoing
consideration of the use of IFRS by US firms.6 The distinction here is more relative than absolute. IFRS and US GAAP include both general principles and rules, depending on context (Schipper,
2003). However, the FASB generally has provided more detailed guidance on application of accounting principles than has the IASB.
M.E. Barth et al. / Journal of Accounting and Economics 54 (2012) 68–93 73
litigation environment affect reported accounting amounts. For example, Cairns (1999), Ball et al. (2000), Street and Gray(2001), and Ball et al. (2003) suggest lax enforcement can result in limited IFRS compliance.
Regarding potential comparability differences after IFRS firms adopt IFRS, we first predict greater comparability forfirms domiciled in countries with common law legal origins than code law legal origins (hereafter, common and code lawfirms). La Porta et al. (1998) and subsequent studies indicate that legal origin differences affect institutional features offinancial markets, including the financial reporting environment, and that key legal origin groups are common law andcode law. Relatedly, we also predict greater comparability for firms in countries with high enforcement. There are tworeasons underlying these predictions. First, because IFRS are largely derived from financial accounting standards developedin common law countries, including the US, we predict that comparability is greater for common law firms. Second, codelaw and low enforcement countries likely have weaker enforcement than common law and high enforcement countries,which affects the application of standards (e.g., Ball et al., 2000, 2003; Leuz et al., 2003). Because the US is regarded ashaving perhaps the highest level of enforcement (Leuz, 2010), we predict that comparability is greater for common lawfirms and for firms in high enforcement countries.
We make no prediction for comparability differences between voluntary and mandatory IFRS adopters becauseincentives of voluntary adopters could result in them having accounting amounts that exhibit more or less comparabilitythan those of mandatory adopters. Voluntary adopters may have incentives to commit to enhanced disclosure, resulting ingreater comparability relative to mandatory adopters that did not face such incentives. However, because mandatoryadoption affected a large number of firms simultaneously, investors’ enhanced ability to understand the link betweenaccounting amounts and share prices and more consistent application and enforcement arising from more firms applyingIFRS could result in greater comparability for mandatory adopters than voluntary adopters.
3.3. Potential sources of comparabilty differences
To provide insight into potential sources of differences in comparability, based on prior research we consider threedimensions of accounting quality — earnings smoothing, accrual quality, and earnings timeliness (Dechow and Dichev,2002; Land and Lang, 2002; Lang et al., 2003, 2006; Leuz et al., 2003; Ball and Shivakumar, 2005, 2006; Myers et al., 2007;Barth et al., 2008). For example, finding (a) an increase in comparability after IFRS firms adopt IFRS, and (b) that thedifference in earnings smoothing between IFRS and US firms decreased after the IFRS firms adopt IFRS is consistent withthe reduction in the difference in earnings smoothing being a source of the increased comparability. In Section 4.4, wedescribe the metrics we use to test for differences in accounting quality.
4. Research design
4.1. Assessing comparability
The basic notion of comparability in the FASB’s and IASB’s conceptual frameworks for financial reporting underlyingIFRS and US GAAP (FASB, 2010; IASB, 2010) is that accounting amounts are comparable if, when two firms face similareconomic outcomes, the firms report similar accounting amounts. Similarly, if the two firms face different economicoutcomes they should report different accounting amounts. We use two approaches to assess comparability of accountingamounts resulting from application of IFRS and US GAAP, both of which use stock price, stock return, and cash flow aseconomic outcomes, and various combinations of net income and equity book value as accounting amounts.
We select stock price and stock return as economic outcomes because they are summary measures of equity value andchange in equity value that reflect investors’ capital allocation decisions and, as a result, each is commonly employed inaccounting research to capture a firm’s underlying economics. We select cash flow as an economic outcome becauseforecasting future cash flow plays a key role in economic models of equity value. Providing information that is useful toinvestors in making their capital allocation decisions is the objective of financial reporting as articulated in the conceptualframeworks of the FASB and IASB. Therefore, assessing comparability based on stock price, stock return, and cash flowshould provide evidence to the SEC as to whether IFRS-based information provided to investors is comparable to US GAAP-based information. We use all three measures because there are advantages and disadvantages to each. For example,although stock price and stock return reflect any cross-country and cross-industry differences in cost of capital, cash flowdoes not. Also, although the information environment, which includes accounting standards, affects price formation andhence stock price and stock return, it does not affect cash flow. Although subsequent cash flow is available for a limitednumber of years, stock price and stock return reflect investors’ expectations for all subsequent years.
We select earnings and equity book value as accounting amounts because they are the two primary summary measuresfrom financial statements extensively employed in accounting research linking accounting amounts to equity value(Kothari, 2001). In addition, as in prior research, focusing on these two measures permits us to employ parsimoniousmodels relating accounting amounts to economic outcomes.7 The relations we use to construct our comparability metricsassociate earnings and equity book value with stock price, earnings and change in earnings with stock return, and earningswith cash flow.
7 It is possible that extending the set of accounting amounts could alter our inferences.
M.E. Barth et al. / Journal of Accounting and Economics 54 (2012) 68–9374
The first approach we use to assess comparability, which we label accounting system comparability, defines accountingamounts as being comparable if an economic outcome (e.g., stock price) estimated based on the mapping from accountingamounts (e.g., earnings) to that economic outcome of one system is the same as the estimated economic outcome based onthe mapping of the other system (De Franco et al., 2011). See Appendix A for details and Tables 3 and 4 for the relatedfindings. This approach to comparability is designed to operationalize the SEC’s desire to determine how well IFRSaccounting amounts fit within the US financial reporting system (SEC, 2010).
The second approach we use to assess comparability, which we label value relevance comparability, defines accountingamounts as being comparable if they explain the same variation in economic outcomes. See Tables 5 and 6 for the relatedfindings. This approach also should provide evidence to the SEC on whether IFRS-based and US GAAP-based accountingamounts are comparable because value relevance is frequently used as a summary measure of how well accountingamounts reflect a firm’s underlying economics (Barth et al., 2008; Ewert and Wagenhofer, 2009).
To test our predictions in Section 3, we use a matched sample design, whereby for each IFRS firm we selecta US firm in the same industry as the IFRS firm whose size as measured by equity market value is closest to theIFRS firm’s at the end of the year of its adoption of IFRS (Barth et al., 2008).8 Following prior research, weemploy a matching procedure to mitigate the effects on our inferences of accounting and economic differencesbetween IFRS and US firms unattributable to the financial reporting system. For example, the IFRS and US GAAP financialreporting systems could, in principle, prescribe the same accounting rules for capitalization or expensing of particular typesof assets that differ across industries. However, because the industry composition of IFRS firms differs from that of US firms,failing to match on industry could result in our test results indicating the two systems are not comparable when in fact theyare. Matching IFRS and US firms by industry also mitigates the effect on our inferences of industry differences in cost ofcapital that can affect how accounting amounts relate to economic outcomes, but are not relevant for assessingcomparability of IFRS and US GAAP accounting amounts. We also match IFRS and US firms on size to mitigate cost ofcapital differences and other economic differences between IFRS and US firms unattributable to the financial reportingsystem.
We require each IFRS firm to have data in the year the firm adopts IFRS and the year before. This ensures that weproperly identify the firm’s adoption year. Using the same industry classification as Barth et al. (2008), we next identify allUS firms in the same industry as each IFRS firm and simultaneously select US firm matches such that we minimize theaggregate size differences between IFRS and matched US firms in the IFRS firm’s adoption year.9 Next, we eliminate fromthe sample any matched pair for which the size difference exceeds 50% in absolute value. Our analyses include all firm–years for which the IFRS firm and its matched US firm both have data. For example, if an IFRS firm has data from 1994through 2000, and its matched US firm has data for 1995 through 2002, then our analysis includes data from 1995 through2000 for the IFRS firm and its matched US firm.
4.2. Accounting system comparability metrics
The stock price and stock return metrics are based on the difference between fitted stock prices and stock returnsresulting from applying US GAAP and IFRS pricing multiples to each firm’s earnings and equity book value, and earningsand change in earnings. Similarly, the cash flow metric is based on the difference between fitted subsequent cash flowresulting from applying US GAAP and IFRS cash flow prediction multiples to each firm’s earnings. For US (IFRS) firms, theaccounting amounts are those reported in their US GAAP (IFRS) financial statements. Because we construct a difference infitted stock prices (stock returns, cash flow) for US firms and for IFRS firms, we calculate the accounting systemcomparability metric for stock price (stock return, cash flow) as the average of the two differences. If accounting amountsin the two accounting systems are comparable, then the differences in fitted stock prices, stock returns, and cash flowbased on application of multiples from each system will be indistinguishable from zero.
As detailed in Appendix A, we construct our accounting system comparability metrics in six steps. First, we estimate therelations between stock price (stock return, subsequent year’s cash flow) and earnings and equity book value (earnings andchange in earnings, earnings) separately for US firms and IFRS firms. Second, for each set of firms, i.e., IFRS and US firms, wecalculate within-sample fitted stock price (stock return, cash flow). Third, for each set of firms, we calculate fitted stockprice (stock return, cash flow) using the multiples from the other set of firms. Fourth, for each set of firms, we calculate theabsolute value of the difference between the fitted stock price (stock return, cash flow) obtained in the second and thirdsteps. Fifth, for each IFRS and matched US firm–year pair, we average the differences in fitted stock price (stock return,cash flow) obtained in the fourth step. Sixth, we calculate our price, return, and cash flow comparability metrics as the
8 We considered propensity score matching using standard deviation of returns, equity market-to-book ratio, leverage, sales growth, return on assets,
and return on equity, in addition to size and industry. When we estimate propensity scores by industry, size is the only variable with significant
explanatory power. When we estimate the scores pooling all observations, only size and industry have significant explanatory power. Thus, adding
variables beyond size and industry to our matching procedure likely would introduce noise and yield inferior matches.9 The industry groups are based on Worldscope Industry classifications. Firms are combined into aggregate industry groups as follows (Worldscope
Industry classifications are in parentheses): Agriculture, Forestry, and Fishing (35 and 38), Mining (50, 51, 54, 56, 97, 119, and 122), Construction (30, 32,
39, and 60), Manufacturing (33, 37, 43, 48, 57, 59, 62–65, 67–69, 74, 78, 81, 82, 92, 93, 95, 98, 99, 101, 114, 117, 120, 126, 129, 130, 132, and 157), Utilities
(91, 140, and 142), Gas Distribution (31), Retail Trade (66, 83, 87, and 90), Finance, Insurance, and Real Estate (77, 102, 104, 106, 107, 111–113, 141, and
152), Services (40, 55, 58, 71, 72, 80, 84, 86, 94, 100, 103, 143, 150, and 151), and Public Administration (41, 45, 70, and 134).
M.E. Barth et al. / Journal of Accounting and Economics 54 (2012) 68–93 75
mean, median, and standard deviation of the average differences obtained in the fifth step appropriate for eachcomparability analysis we conduct.
We compute accounting system comparability metrics using several groupings of the sample observations to test ourpredictions relating to comparability differences. We use a t-test (Wilcoxon Rank Sum Test) to test for mean (median)differences in comparability relevant to each particular comparison.10 We test for significance of differences in standarddeviations using the empirical distribution of standard deviation differences obtained from a bootstrapping procedure.11 Totest whether accounting system comparability changed after IFRS firms adopt IFRS, we compute accounting systemcomparability metrics using all firm–year observations before the IFRS firms adopt IFRS, i.e., when they applied non-USdomestic standards, and all firm–year observations after they adopt IFRS. To test whether accounting system comparabilitydiffers after IFRS firms adopt IFRS depending on whether firms adopt IFRS mandatorily, and depending on whether the legalorigin of an IFRS firm’s country is common law or code law and whether the IFRS firm’s country has a relatively high or lowlevel of enforcement, we partition firm–year observations after IFRS firms adopt IFRS into the relevant groups and calculateseparate accounting system comparability metrics for each group. To identify countries as high or low enforcement, we usethe public enforcement securities regulation index described in Leuz (2010, Table 1). The public enforcement index capturesmarket supervision by a country’s regulator, its investigative powers, and the sanctions available to the regulator.12
4.3. Value relevance comparability metrics
We construct our value relevance comparability metrics based on the explanatory power of regressions of stock priceon equity book value and net income, stock return on net income and change in net income, and future operating cash flowon net income. We construct each metric as the difference in explanatory power of each full model that includes the fixedeffects in addition to the accounting amounts, and the nested model that includes only the fixed effects. The motivation fordoing this is to mitigate differences in mean stock prices, stock returns, and future cash flow across countries andindustries from affecting our value relevance metrics. Thus, each metric reflects only the explanatory power of theaccounting amounts for the dependent variable.
We estimate each full and attendant nested model using those observations relevant to each comparison we make. Forexample, when we compare value relevance of IFRS and US firms after the IFRS firms adopt IFRS, we estimate the modelsusing the combined sample of IFRS firms and their matched US firms for years after the IFRS firms adopt IFRS. Similarly,when we compare value relevance of IFRS and US firms before the IFRS firms adopt IFRS, we estimate the models using thecombined sample of IFRS firms and their matched US firms for years before the IFRS firms adopt IFRS, i.e., when theyapplied domestic standards.
Our first value relevance metric, Price, is based on the explanatory power from a regression of stock price, P, on netincome before extraordinary items per share, NI, and book value of equity per share, BVE. In particular, our first valuerelevance metric is the difference between the adjusted R2 from Eq. (1) and the adjusted R2 from the nested version ofEq. (1) that includes only the Cj and Ik:
Pit ¼ b0þb1BVEitþb2NIitþX
j
b3jCjþX
k
b4kIkþeit : ð1Þ
Following prior research, to ensure accounting information is in the public domain, P is stock price six months afterfiscal year-end (Lang et al., 2003, 2006; Barth et al., 2008). Cj (Ik) is an indicator variable that equals one for firms domiciledin country j (industry k), and zero otherwise. i and t refer to firm and year.13
Our second value relevance metric, Return, is based on the adjusted R2 from a regression of annual stock return,RETURN, on net income and change in net income, deflated by beginning of year price, NIt/Pt�1 and DNIt/Pt�1. In particular,our second value relevance metric is the difference between the adjusted R2 from Eq. (2) and the adjusted R2 from the
10 We also use these tests to test whether the mean and median comparability metrics are significantly different from zero. Throughout, we use the
term significant (marginally significant) to denote a five (ten) percent significance level under a one-sided alternative when we have a signed prediction,
and under a two-sided alternative otherwise.11 Specifically, for each test, we first randomly assign observations as either an IFRS or a US observation. For each designated IFRS observation, we
randomly assign a designated US observation as its match. We randomly assign the matched pair to the subgroups that are the subject of the particular
test. We then calculate the difference in standard deviations for the two randomly assigned groups of observations. We obtain the empirical distribution
of this difference by repeating this procedure 1000 times, with replacement. We deem a standard deviation difference as significant if our observed
sample difference exceeds 950 of the differences calculated based on the boot-strapping procedure. Inferences are unchanged if we sample without
replacement. An advantage of this approach is that it requires no assumptions about the distribution of the standard deviation differences.12 The common law countries in our sample are Australia, Canada, Hong Kong, Ireland, Singapore, South Africa, and the United Kingdom; the code
law countries are Austria, Belgium, Czech Republic, Denmark, Finland, France, Germany, Greece, Hungary, Israel, Italy, Netherlands, Norway, Peru,
Philippines, Portugal, Spain, Sweden, Switzerland, and Turkey. The high enforcement countries in our sample are Australia, Canada, France, Hong Kong,
Israel, Peru, Philippines, Portugal, Singapore, Turkey, and the United Kingdom; the low enforcement countries are Austria, Belgium, Denmark, Finland,
Germany, Greece, Ireland, Italy, Netherlands, Norway, South Africa, Spain, Sweden, and Switzerland. The enforcement index is not available for the Czech
Republic and Hungary.13 We also estimate Eq. (1) using share-weighted P, BVE, and NI. Share weighting is a control for potential differences across countries in share price
arising from differences in typical trading ranges. Untabulated findings result in generally the same inferences as those resulting from estimation of
Eq. (1). In addition, in Section 6.4.5, we conduct sensitivity analyses that include additional variables in the full and nested models as controls for
potential pricing effects unrelated to accounting amounts.
M.E. Barth et al. / Journal of Accounting and Economics 54 (2012) 68–9376
nested version of Eq. (2) that includes only the Cj and Ik:14
RETURNit ¼ b0þb1NIit=Pit�1þb2DNIit=Pit�1þb3LOSSitþb4LOSSit � NIit=Pit�1
þb5LOSSit � DNIit=Pit�1þX
j
b6jCjþX
k
b7kIkþeit : ð2Þ
RETURN is the cumulative percentage change in stock price beginning nine months before fiscal year end and endingthree months after fiscal year end, adjusted for dividends and stock splits. We permit the coefficients on NIt/Pt�1 andDNIt/Pt�1 to differ for loss firms (Hayn, 1995) using the indicator variable LOSS, which equals one if NIt/Pt�1 is negative,and zero otherwise.
Our cash flow metric, Cash Flow, is based on the R2 from the regression of cash flow on lagged net income. In particular,our third value relevance metric is the difference between the adjusted R2 from Eq. (3) and the adjusted R2 from the nestedversion of Eq. (3) that includes only the Cj and Ik:
CFitþ1 ¼ b0þb1NIit=TAit�1þX
j
b2jCjþX
k
b3kIkþeitþ1, ð3Þ
where CF is net cash flow from operations scaled by lagged total assets, TA. We test for differences in each value relevancemetric based on an empirical distribution of the differences obtained from a boot-strapping procedure similar to thatemployed for tests of significance of accounting system comparability standard deviation differences.15
We also test whether the value relevance of US and IFRS firms’ accounting amounts is comparable by testing whetherdifferences in value relevance for US and IFRS firms are significant. We predict value relevance for US firms is higher thanthat for IFRS firms.16 Prior research does not directly address whether accounting amounts of US firms have higher valuerelevance than those of IFRS firms. Lang et al. (2003) and Leuz et al. (2003) suggest that US financial reporting quality isgenerally higher than that of other countries, which likely reflects the combined effects of high quality accountingstandards and strong enforcement, and therefore accounting amounts of US firms should have higher value relevance. Weexpect this prediction to hold regardless of why firms adopt IFRS and regardless of the legal origin and level ofenforcement of IFRS firms’ countries.
4.4. Accounting quality
In this section, we describe the measures we employ to assess which dimensions of accounting quality are potentialsources of differences in comparability. We consider five metrics of accounting quality, two that relate to earningssmoothing, one that relates to accrual quality, and two that relate to earnings timeliness.
The first earnings smoothing metric is the ratio of the variance of the change in net income to the variance of thechange in cash flow, Var(DNIn)/Var(DCFn), where DNIn (DCFn) is the residual from a regression of DNIt/TAt�1 (DCF) onindustry and country fixed effects. The second metric is the correlation between accruals and cash flow, Cor(ACCn, CFn),where ACCn (CFn) is the residual from a regression of accruals scaled by lagged total assets, ACCt/TAt�1 (CF), on industry andcountry fixed effects.17 ACC is NI minus CF. As in prior research (Land and Lang, 2002; Lang et al., 2003, 2006; Leuz et al.,2003; Ball and Shivakumar, 2005, 2006; Myers et al., 2007; Barth et al., 2008), we interpret a higher ratio of variances and aless negative correlation as evidence of less earnings smoothing.
Our accrual quality metric, which is based on Dechow and Dichev (2002), is the standard deviation of residuals from theregression of ACCn on prior year, current year, and subsequent year cash flow, each deflated by its lagged total assets:
ACCn
it ¼ b0þb1CFit�1þb2CFitþb3CFitþ1þeit : ð4Þ
Following Dechow and Dichev (2002), we interpret a lower standard deviation of residuals from Eq. (4) as evidence ofhigher accrual quality.18
Following prior research (Ball et al., 2000; Lang et al., 2003, 2006; Barth et al., 2008), our timeliness metrics, Good Newsand Bad News, are the R2s from the regression of net income scaled by beginning-of-year price, NIt/Pt�1, on the residualfrom a regression of stock return on country and industry fixed effects, RETURNt
n:
NIit=Pit�1 ¼ b0þb1RETURNn
itþeit : ð5Þ
14 For ease of exposition, we use the same notation for coefficients and error terms in each equation.15 As with the tests of differences in the standard deviation accounting system comparability metric, inferences are unchanged if we sample without
replacement.16 We do not test the analogous prediction for accounting system comparability because those metrics are based on a comparison of fitted stock
prices, stock returns, or cash flow. That is, unlike for value relevance, there are not separate metrics for US and IFRS firms.17 We construct our metrics using the residual from these regressions for reasons analogous to those relating to our constructing value relevance
comparability metrics as the difference between the explanatory power of the full model and the attendant nested model that includes only country and
industry indicator variables.18 We also calculated an alternative measure of accrual quality based on the ratio of the standard deviation of residuals from Eq. (4) and the standard
deviation of residuals of a version of Eq. (4) that includes only CFit as an explanatory variable (Wysocki, 2009). Inferences are the same using this
alternative measure.
M.E. Barth et al. / Journal of Accounting and Economics 54 (2012) 68–93 77
We estimate Eq. (5) separately for positive and negative return subsamples because prior research finds that timelinessdiffers for firms with positive and negative returns. Good News (Bad News) is the R2 relating to the positive (negative)subsample. Based on prior research, we interpret a higher R2 as evidence of greater timeliness.
These accounting quality tests identify possible sources of comparability by identifying when greater comparability andaccounting quality occur at the same time. For example, finding (a) an increase in comparability after the IFRS firms adoptIFRS, and (b) a smaller difference between IFRS and US firms in the ratio of the variance of the change in net income to thevariance of the change in cash flow is consistent with a reduction in the difference in earnings smoothing being a source ofthe increased comparability.
As with the comparability tests, we test which dimensions of accounting quality changed after IFRS firmsadopt IFRS, and for accounting quality differences between firms that adopt IFRS voluntarily and mandatorily, commonand code law firms, and firms in countries with high and low enforcement. As with the value relevance comparability tests,the structure of the accounting quality differences tests permits us to test for differences in accounting quality between USand IFRS firms because we have metrics for each group of firms. Also as with the value relevance tests, we test fordifferences in each accounting quality metric using an empirical distribution of the differences using a boot-strappingprocedure.
5. Sample and data
We base our tests on a sample of firms that adopted IFRS between 1995 and 2006. Pre-adoption sample yearspotentially range from 1992 through 2005. Post-adoption sample years potentially range from 1996 through 2009. Weobtain our sample of IFRS firms from Worldscope, which identifies the set of accounting standards a firm uses to prepareits financial statements and its industry. The Worldscope standards categories that we code as IFRS based on theWorldscope Accounting Standards Applied data field are ‘‘international standards’’ and ‘‘IASC’’ or ‘‘IFRS.’’19 There are twosources of potential error in classifying a firm as applying IFRS. The first is that firms do not always indicate clearly theaccounting standards that they apply. The second is that Daske et al. (2007) reports that the Worldscope data field containsclassification errors. If a substantial portion of firms we classify as IFRS firms is affected by these sources of classificationerror and if IFRS-based accounting amounts are more comparable to US GAAP-based accounting amounts than areaccounting amounts based on other standards, it is likely that our tests are biased against our finding that IFRS- and USGAAP-based accounting amounts are comparable.20 We limit IFRS firms to those that do not cross-list in the US toeliminate effects on the IFRS accounting amounts associated with the reconciliation requirement (Harris and Muller, 1999;Lang et al., 2006).
We obtain data for IFRS and US firms from DataStream. We winsorize at the 5% and 95% levels all variables used toconstruct our metrics to mitigate the effects of outliers on our inferences. Because large negative stock returns areconcentrated in 2007 and 2008, we winsorize variables separately for sample years before and after 2006 to avoiddisproportionately winsorizing observations in the later years. The resulting sample of IFRS firms comprises 3400 firmsthat adopted IFRS between 1995 and 2006 and 17,714 firm–year observations, of which 8214 are post-IFRS adoption and9500 are pre-adoption.
Table 1, panel A, provides a breakdown of sample firms by country. Sample firms are from 27 countries, with thegreatest proportion from the United Kingdom, Australia, France, and Germany. Panel B of Table 1 provides an industrybreakdown.21 Sample firms are from many industries, with the greatest proportion from Manufacturing, Services, andFinance, Insurance and Real Estate. Panel C of Table 1 provides a breakdown by adoption year. Although firms haveadopted IFRS each year since 1995, the number jumps substantially in 2005 when IFRS became mandatory in manycountries. In addition, because no sample IFRS firms adopt IFRS after 2006, the number of observations declines after 2006,reflecting attrition arising from an IFRS firm or its US match ceasing to exist in years subsequent to the IFRS firm’sadoption year.
Table 2 reports descriptive statistics for IFRS firms and their matched US firms after the IFRS firms adopt IFRS. Althoughwe do not conduct significance tests for differences in means between IFRS and US firms, Table 2 suggests that differencesexist for several of our variables. Because it is likely that such mean differences are at least in part attributable to countryand industry differences, as described in Section 4, our value relevance comparability metrics are constructed to excludethe explanatory power of country and industry indicator variables.
19 Worldscope category 23 was ‘‘IASC’’ prior to 2005 and ‘‘IFRS’’ in 2005 through 2009.20 Limiting our comparisons to IFRS firms classified by Worldscope as applying IASC or IFRS results in inferences similar to those we obtain from our
tabulated findings.21 The sample composition by country differs from prior research largely because of differences in data requirements. For example, whereas our
sample includes eight Spanish IFRS firms, Daske et al. (2008) includes 95. This difference is attributable to our requirements that each IFRS firm has data
in the year before it adopts IFRS and has data necessary for all of the test variables, of which there are more than in Daske et al. (2008).
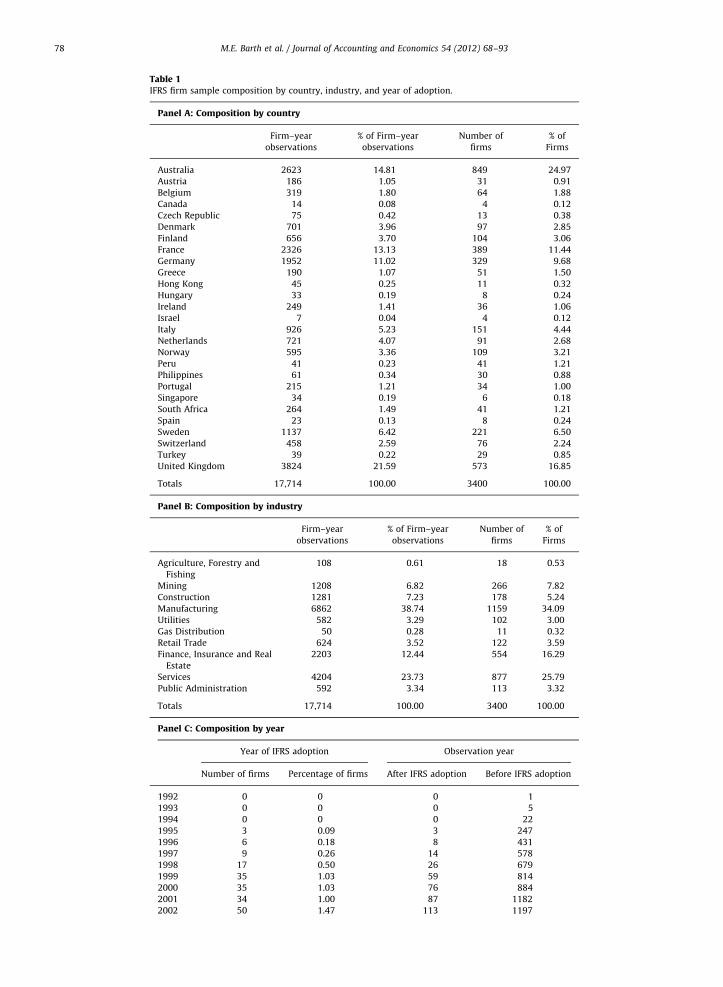
Table 1IFRS firm sample composition by country, industry, and year of adoption.
Panel A: Composition by country
Firm–year
observations
% of Firm–year
observations
Number of
firms
% of
Firms
Australia 2623 14.81 849 24.97
Austria 186 1.05 31 0.91
Belgium 319 1.80 64 1.88
Canada 14 0.08 4 0.12
Czech Republic 75 0.42 13 0.38
Denmark 701 3.96 97 2.85
Finland 656 3.70 104 3.06
France 2326 13.13 389 11.44
Germany 1952 11.02 329 9.68
Greece 190 1.07 51 1.50
Hong Kong 45 0.25 11 0.32
Hungary 33 0.19 8 0.24
Ireland 249 1.41 36 1.06
Israel 7 0.04 4 0.12
Italy 926 5.23 151 4.44
Netherlands 721 4.07 91 2.68
Norway 595 3.36 109 3.21
Peru 41 0.23 41 1.21
Philippines 61 0.34 30 0.88
Portugal 215 1.21 34 1.00
Singapore 34 0.19 6 0.18
South Africa 264 1.49 41 1.21
Spain 23 0.13 8 0.24
Sweden 1137 6.42 221 6.50
Switzerland 458 2.59 76 2.24
Turkey 39 0.22 29 0.85
United Kingdom 3824 21.59 573 16.85
Totals 17,714 100.00 3400 100.00
Panel B: Composition by industry
Firm–year
observations
% of Firm–year
observations
Number of
firms
% of
Firms
Agriculture, Forestry and
Fishing
108 0.61 18 0.53
Mining 1208 6.82 266 7.82
Construction 1281 7.23 178 5.24
Manufacturing 6862 38.74 1159 34.09
Utilities 582 3.29 102 3.00
Gas Distribution 50 0.28 11 0.32
Retail Trade 624 3.52 122 3.59
Finance, Insurance and Real
Estate
2203 12.44 554 16.29
Services 4204 23.73 877 25.79
Public Administration 592 3.34 113 3.32
Totals 17,714 100.00 3400 100.00
Panel C: Composition by year
Year of IFRS adoption Observation year
Number of firms Percentage of firms After IFRS adoption Before IFRS adoption
1992 0 0 0 1
1993 0 0 0 5
1994 0 0 0 22
1995 3 0.09 3 247
1996 6 0.18 8 431
1997 9 0.26 14 578
1998 17 0.50 26 679
1999 35 1.03 59 814
2000 35 1.03 76 884
2001 34 1.00 87 1182
2002 50 1.47 113 1197
M.E. Barth et al. / Journal of Accounting and Economics 54 (2012) 68–9378
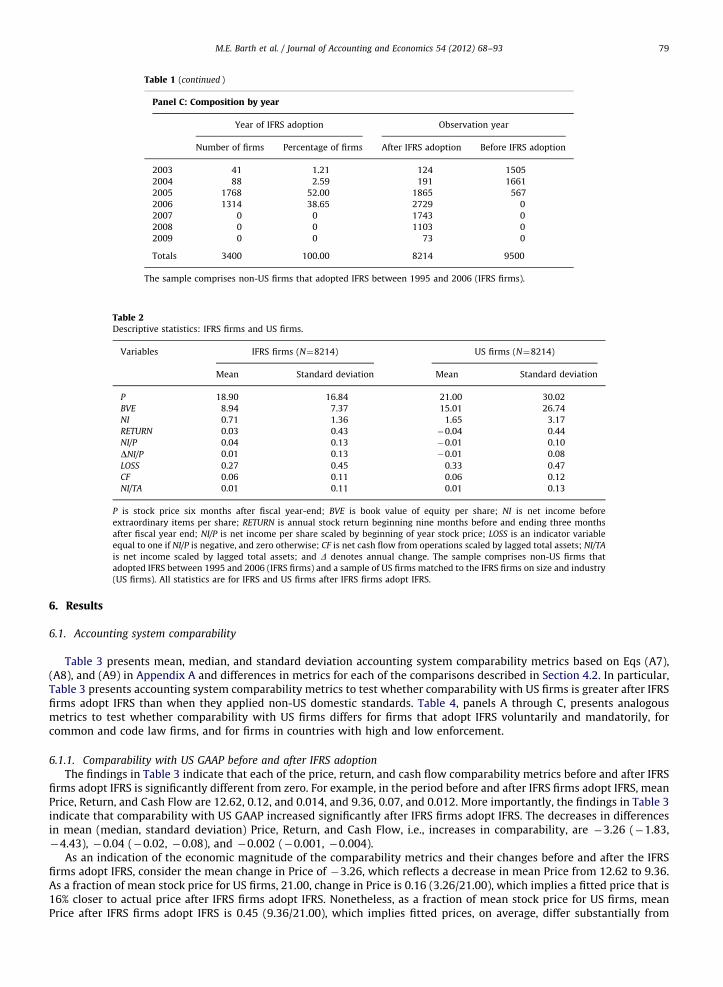
Table 1 (continued )
Panel C: Composition by year
Year of IFRS adoption Observation year
Number of firms Percentage of firms After IFRS adoption Before IFRS adoption
2003 41 1.21 124 1505
2004 88 2.59 191 1661
2005 1768 52.00 1865 567
2006 1314 38.65 2729 0
2007 0 0 1743 0
2008 0 0 1103 0
2009 0 0 73 0
Totals 3400 100.00 8214 9500
The sample comprises non-US firms that adopted IFRS between 1995 and 2006 (IFRS firms).
Table 2Descriptive statistics: IFRS firms and US firms.
Variables IFRS firms (N¼8214) US firms (N¼8214)
Mean Standard deviation Mean Standard deviation
P 18.90 16.84 21.00 30.02
BVE 8.94 7.37 15.01 26.74
NI 0.71 1.36 1.65 3.17
RETURN 0.03 0.43 �0.04 0.44
NI/P 0.04 0.13 �0.01 0.10
DNI/P 0.01 0.13 �0.01 0.08
LOSS 0.27 0.45 0.33 0.47
CF 0.06 0.11 0.06 0.12
NI/TA 0.01 0.11 0.01 0.13
P is stock price six months after fiscal year-end; BVE is book value of equity per share; NI is net income before
extraordinary items per share; RETURN is annual stock return beginning nine months before and ending three months
after fiscal year end; NI/P is net income per share scaled by beginning of year stock price; LOSS is an indicator variable
equal to one if NI/P is negative, and zero otherwise; CF is net cash flow from operations scaled by lagged total assets; NI/TA
is net income scaled by lagged total assets; and D denotes annual change. The sample comprises non-US firms that
adopted IFRS between 1995 and 2006 (IFRS firms) and a sample of US firms matched to the IFRS firms on size and industry
(US firms). All statistics are for IFRS and US firms after IFRS firms adopt IFRS.
M.E. Barth et al. / Journal of Accounting and Economics 54 (2012) 68–93 79
6. Results
6.1. Accounting system comparability
Table 3 presents mean, median, and standard deviation accounting system comparability metrics based on Eqs (A7),(A8), and (A9) in Appendix A and differences in metrics for each of the comparisons described in Section 4.2. In particular,Table 3 presents accounting system comparability metrics to test whether comparability with US firms is greater after IFRSfirms adopt IFRS than when they applied non-US domestic standards. Table 4, panels A through C, presents analogousmetrics to test whether comparability with US firms differs for firms that adopt IFRS voluntarily and mandatorily, forcommon and code law firms, and for firms in countries with high and low enforcement.
6.1.1. Comparability with US GAAP before and after IFRS adoption
The findings in Table 3 indicate that each of the price, return, and cash flow comparability metrics before and after IFRSfirms adopt IFRS is significantly different from zero. For example, in the period before and after IFRS firms adopt IFRS, meanPrice, Return, and Cash Flow are 12.62, 0.12, and 0.014, and 9.36, 0.07, and 0.012. More importantly, the findings in Table 3indicate that comparability with US GAAP increased significantly after IFRS firms adopt IFRS. The decreases in differencesin mean (median, standard deviation) Price, Return, and Cash Flow, i.e., increases in comparability, are �3.26 (�1.83,�4.43), �0.04 (�0.02, �0.08), and �0.002 (�0.001, �0.004).
As an indication of the economic magnitude of the comparability metrics and their changes before and after the IFRSfirms adopt IFRS, consider the mean change in Price of �3.26, which reflects a decrease in mean Price from 12.62 to 9.36.As a fraction of mean stock price for US firms, 21.00, change in Price is 0.16 (3.26/21.00), which implies a fitted price that is16% closer to actual price after IFRS firms adopt IFRS. Nonetheless, as a fraction of mean stock price for US firms, meanPrice after IFRS firms adopt IFRS is 0.45 (9.36/21.00), which implies fitted prices, on average, differ substantially from
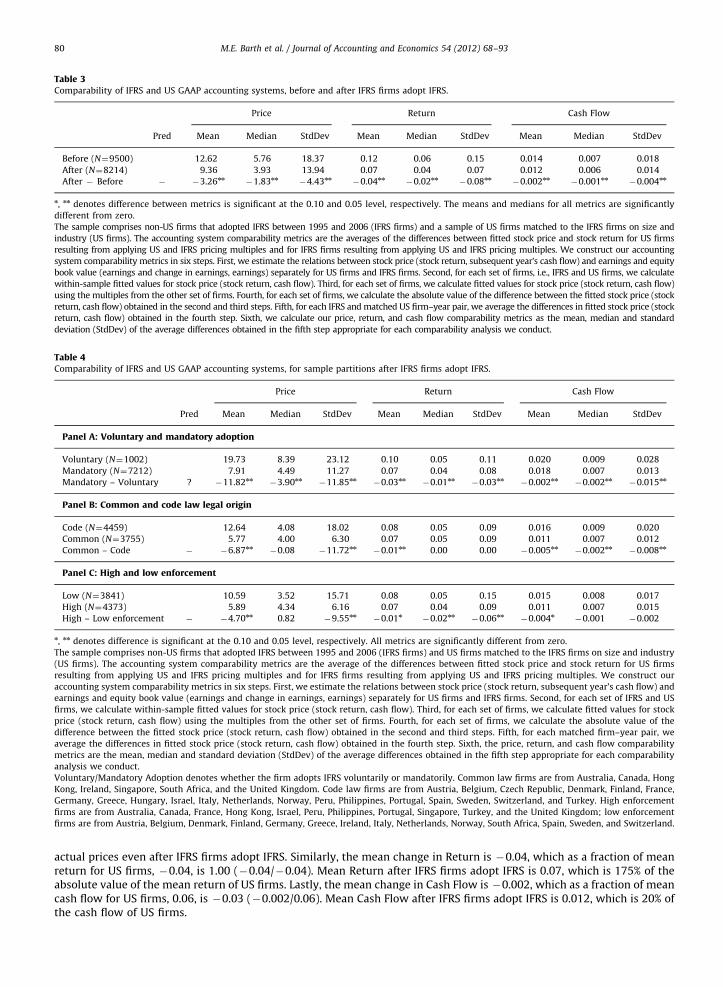
Table 3Comparability of IFRS and US GAAP accounting systems, before and after IFRS firms adopt IFRS.
Price Return Cash Flow
Pred Mean Median StdDev Mean Median StdDev Mean Median StdDev
Before (N¼9500) 12.62 5.76 18.37 0.12 0.06 0.15 0.014 0.007 0.018
After (N¼8214) 9.36 3.93 13.94 0.07 0.04 0.07 0.012 0.006 0.014
After � Before � �3.26nn�1.83nn
�4.43nn�0.04nn
�0.02nn�0.08nn
�0.002nn�0.001nn
�0.004nn
n, nn denotes difference between metrics is significant at the 0.10 and 0.05 level, respectively. The means and medians for all metrics are significantly
different from zero.
The sample comprises non-US firms that adopted IFRS between 1995 and 2006 (IFRS firms) and a sample of US firms matched to the IFRS firms on size and
industry (US firms). The accounting system comparability metrics are the averages of the differences between fitted stock price and stock return for US firms
resulting from applying US and IFRS pricing multiples and for IFRS firms resulting from applying US and IFRS pricing multiples. We construct our accounting
system comparability metrics in six steps. First, we estimate the relations between stock price (stock return, subsequent year’s cash flow) and earnings and equity
book value (earnings and change in earnings, earnings) separately for US firms and IFRS firms. Second, for each set of firms, i.e., IFRS and US firms, we calculate
within-sample fitted values for stock price (stock return, cash flow). Third, for each set of firms, we calculate fitted values for stock price (stock return, cash flow)
using the multiples from the other set of firms. Fourth, for each set of firms, we calculate the absolute value of the difference between the fitted stock price (stock
return, cash flow) obtained in the second and third steps. Fifth, for each IFRS and matched US firm–year pair, we average the differences in fitted stock price (stock
return, cash flow) obtained in the fourth step. Sixth, we calculate our price, return, and cash flow comparability metrics as the mean, median and standard
deviation (StdDev) of the average differences obtained in the fifth step appropriate for each comparability analysis we conduct.
Table 4Comparability of IFRS and US GAAP accounting systems, for sample partitions after IFRS firms adopt IFRS.
Price Return Cash Flow
Pred Mean Median StdDev Mean Median StdDev Mean Median StdDev
Panel A: Voluntary and mandatory adoption
Voluntary (N¼1002) 19.73 8.39 23.12 0.10 0.05 0.11 0.020 0.009 0.028
Mandatory (N¼7212) 7.91 4.49 11.27 0.07 0.04 0.08 0.018 0.007 0.013
Mandatory – Voluntary ? �11.82nn�3.90nn
�11.85nn�0.03nn
�0.01nn�0.03nn
�0.002nn�0.002nn
�0.015nn
Panel B: Common and code law legal origin
Code (N¼4459) 12.64 4.08 18.02 0.08 0.05 0.09 0.016 0.009 0.020
Common (N¼3755) 5.77 4.00 6.30 0.07 0.05 0.09 0.011 0.007 0.012
Common – Code � �6.87nn�0.08 �11.72nn
�0.01nn 0.00 0.00 �0.005nn�0.002nn
�0.008nn
Panel C: High and low enforcement
Low (N¼3841) 10.59 3.52 15.71 0.08 0.05 0.15 0.015 0.008 0.017
High (N¼4373) 5.89 4.34 6.16 0.07 0.04 0.09 0.011 0.007 0.015
High – Low enforcement � �4.70nn 0.82 �9.55nn�0.01n
�0.02nn�0.06nn
�0.004n�0.001 �0.002
n, nn denotes difference is significant at the 0.10 and 0.05 level, respectively. All metrics are significantly different from zero.
The sample comprises non-US firms that adopted IFRS between 1995 and 2006 (IFRS firms) and US firms matched to the IFRS firms on size and industry
(US firms). The accounting system comparability metrics are the average of the differences between fitted stock price and stock return for US firms
resulting from applying US and IFRS pricing multiples and for IFRS firms resulting from applying US and IFRS pricing multiples. We construct our
accounting system comparability metrics in six steps. First, we estimate the relations between stock price (stock return, subsequent year’s cash flow) and
earnings and equity book value (earnings and change in earnings, earnings) separately for US firms and IFRS firms. Second, for each set of IFRS and US
firms, we calculate within-sample fitted values for stock price (stock return, cash flow). Third, for each set of firms, we calculate fitted values for stock
price (stock return, cash flow) using the multiples from the other set of firms. Fourth, for each set of firms, we calculate the absolute value of the
difference between the fitted stock price (stock return, cash flow) obtained in the second and third steps. Fifth, for each matched firm–year pair, we
average the differences in fitted stock price (stock return, cash flow) obtained in the fourth step. Sixth, the price, return, and cash flow comparability
metrics are the mean, median and standard deviation (StdDev) of the average differences obtained in the fifth step appropriate for each comparability
analysis we conduct.
Voluntary/Mandatory Adoption denotes whether the firm adopts IFRS voluntarily or mandatorily. Common law firms are from Australia, Canada, Hong
Kong, Ireland, Singapore, South Africa, and the United Kingdom. Code law firms are from Austria, Belgium, Czech Republic, Denmark, Finland, France,
Germany, Greece, Hungary, Israel, Italy, Netherlands, Norway, Peru, Philippines, Portugal, Spain, Sweden, Switzerland, and Turkey. High enforcement
firms are from Australia, Canada, France, Hong Kong, Israel, Peru, Philippines, Portugal, Singapore, Turkey, and the United Kingdom; low enforcement
firms are from Austria, Belgium, Denmark, Finland, Germany, Greece, Ireland, Italy, Netherlands, Norway, South Africa, Spain, Sweden, and Switzerland.
M.E. Barth et al. / Journal of Accounting and Economics 54 (2012) 68–9380
actual prices even after IFRS firms adopt IFRS. Similarly, the mean change in Return is �0.04, which as a fraction of meanreturn for US firms, �0.04, is 1.00 (�0.04/�0.04). Mean Return after IFRS firms adopt IFRS is 0.07, which is 175% of theabsolute value of the mean return of US firms. Lastly, the mean change in Cash Flow is �0.002, which as a fraction of meancash flow for US firms, 0.06, is �0.03 (�0.002/0.06). Mean Cash Flow after IFRS firms adopt IFRS is 0.012, which is 20% ofthe cash flow of US firms.
M.E. Barth et al. / Journal of Accounting and Economics 54 (2012) 68–93 81
6.1.2. Comparability with US GAAP after IFRS adoption for sample partitions
Regarding accounting system comparability metrics for subsamples of firms after IFRS adoption, Table 4, panels Athrough C, reveals that 21 of the 27 comparability differences are significantly smaller (two marginally so) for firms thatadopt IFRS mandatorily, for common law firms, and for firms in countries with high enforcement.22
Panel A reveals that mean (median, standard deviation) differences in Price, Return, and Cash Flow between mandatoryand voluntary IFRS adopters are �11.82 (�3.90, �11.85), �0.03 (�0.01, �0.03), and �0.002 (�0.002, �0.015), all ofwhich are significantly different from zero. These findings indicate that comparability with US firms is greater for firmsthat adopt IFRS mandatorily. This finding is consistent with investors’ enhanced ability to understand the link betweenaccounting amounts and share prices and more consistent application and enforcement resulting in greater comparabilityfor mandatory adopters than voluntary adopters.
Panel B reveals that six of the nine differences in comparability metrics between common and code law firms are negativeand significant. The exceptions are the median difference in Price and the median and standard deviation differences in Return,which are insignificant. The mean (median, standard deviation) differences in Price, Return, and Cash Flow for common andcode law firms are �6.87 (�0.08, �11.72), �0.01 (0.00, 0.00), and �0.005 (�0.002, �0.008). These findings are generallyconsistent with greater comparability with US firms for common law firms, and support the notion that comparability betweenIFRS- and US GAAP-based accounting amounts is affected by domestic institutions as well as accounting standards.
Panel C reveals that eight of the differences in comparability metrics between firms in high and low enforcement countriesare negative, and four (two) are significantly (marginally significantly) so. The mean (median, standard deviation) differences inPrice, Return, and Cash Flow are �4.70 (0.82, �9.55), �0.01 (�0.02, �0.06), and �0.004 (�0.001, �0.002). These findingsare consistent with greater comparability with US firms for IFRS firms in high enforcement countries, and, as with the findingsin panel B, support the notion that comparability between IFRS- and US GAAP-based accounting amounts is affected bydomestic institutions as well as accounting standards.
6.2. Value relevance comparability
Table 5 presents value relevance comparability metrics for US and IFRS firms based on Eqs. (1)–(3) when IFRS firmsapplied IFRS and when they applied non-US domestic standards. These metrics permit us to test for value relevancecomparability and differences in comparability before and after IFRS firms adopt IFRS. Table 6, panels A through C, presentsanalogous metrics to test whether value relevance comparability with US firms differs for firms that adopt IFRS voluntarilyand mandatorily, common and code law firms, and firms in high and low enforcement countries. When testing fordifferences in comparability over time and across sample partitions, we test for differences in the absolute values ofcomparability metrics, rather than for differences in signed values. This is because comparability relates to how close themetrics are to each other, not whether one metric is larger than another.23
6.2.1. Comparability with US GAAP before and after IFRS adoption
The Table 5 findings support the prediction that value relevance comparability increased after firms adopt IFRS in thatcomparability increased significantly based on all three metrics, although only marginally so for Cash Flow. In particular,Table 5 indicates that the difference in value relevance decreased significantly from when IFRS firms applied non-USdomestic standards to when they applied IFRS. For Price, Return, and Cash Flow, the difference in value relevancedecreased by 0.07, 0.01, and 0.01.
The findings in Table 5 are consistent with our prediction that value relevance is higher for US firms than for IFRS firmsbefore they adopt IFRS in that each of the three value relevance metrics is significantly higher for US firms (0.47 vs. 0.20 forPrice, 0.09 vs. 0.07 for Return, and 0.44 vs. 0.20 for Cash Flow). However, the findings also indicate that after IFRS firmsadopt IFRS value relevance is higher for US firms, significantly so for Price (0.53 vs. 0.34) and Cash Flow (0.51 vs. 0.28) butnot for Return (0.10 vs. 0.09).
6.2.2. Comparability with US GAAP after IFRS adoption for sample partitions
Turning next to the value relevance comparability metrics for subsamples of firms after IFRS adoption, the findings inTable 6 are consistent with the findings in Table 4 in that comparability is generally significantly greater for firms thatadopt IFRS mandatorily, common law firms, and firms in high enforcement countries.
Panel A reveals that all of the differences in differences in value relevance metrics between mandatory and voluntaryadopters are negative, and all but that on Return are significantly so. The differences in differences for Price, Return, and CashFlow are �0.14, �0.01, and �0.12. Panel B reveals that two of the three comparability differences between common and codelaw firms are significantly negative, with only that for Return being insignificantly different from zero. The differences indifferences for Price, Return, and Cash Flow are �0.07, 0.01, and �0.12. Panel C reveals that two of the three comparability
22 Although subsamples based on these partitions are not independent, untabulated statistics reveal the percentage of concordant pairs generally is
less than 20% of sample firms.23 For example, as Table 5 reveals, the difference in Price between IFRS and US firms before IFRS adoption is 0.27. After IFRS adoption, the difference is
smaller, 0.20. Thus, IFRS-based accounting amounts are more comparable to US-based amounts after IFRS adoption. For the purpose of assessing
comparability, it is irrelevant that US-based accounting amounts exhibit greater value relevance than IFRS-based amounts, either before or after IFRS
adoption.
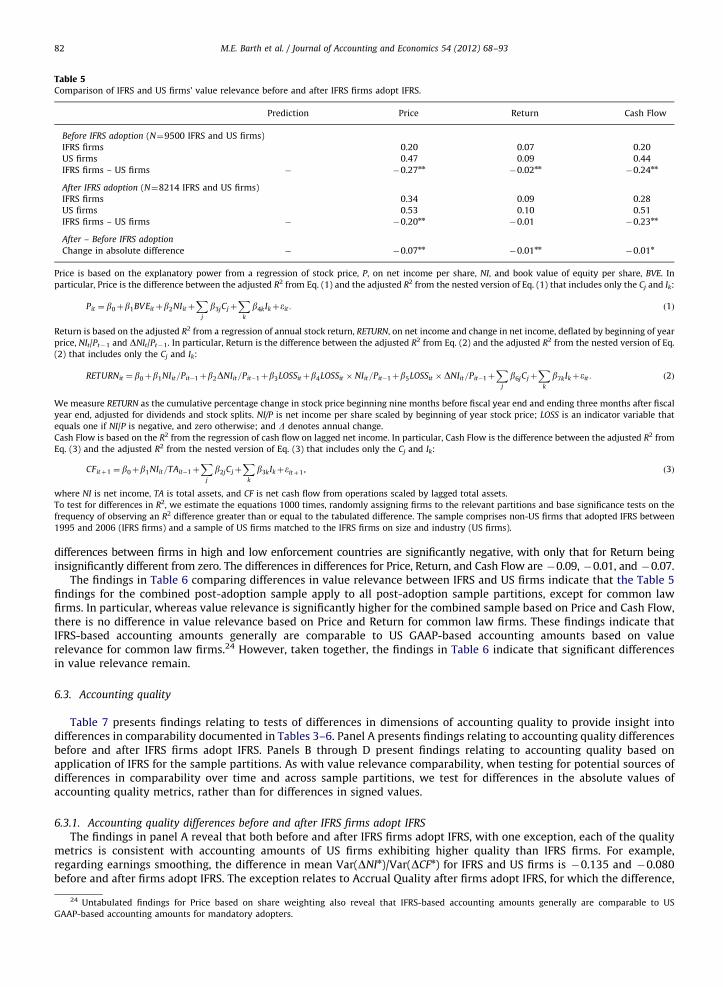
Table 5Comparison of IFRS and US firms’ value relevance before and after IFRS firms adopt IFRS.
Prediction Price Return Cash Flow
Before IFRS adoption (N¼9500 IFRS and US firms)
IFRS firms 0.20 0.07 0.20
US firms 0.47 0.09 0.44
IFRS firms – US firms � �0.27nn�0.02nn
�0.24nn
After IFRS adoption (N¼8214 IFRS and US firms)
IFRS firms 0.34 0.09 0.28
US firms 0.53 0.10 0.51
IFRS firms – US firms � �0.20nn�0.01 �0.23nn
After – Before IFRS adoption
Change in absolute difference � �0.07nn�0.01nn
�0.01n
Price is based on the explanatory power from a regression of stock price, P, on net income per share, NI, and book value of equity per share, BVE. In
particular, Price is the difference between the adjusted R2 from Eq. (1) and the adjusted R2 from the nested version of Eq. (1) that includes only the Cj and Ik:
Pit ¼ b0þb1BVEitþb2NIitþX
j
b3jCjþX
k
b4kIkþeit : ð1Þ
Return is based on the adjusted R2 from a regression of annual stock return, RETURN, on net income and change in net income, deflated by beginning of year
price, NIt/Pt�1 and DNIt/Pt�1. In particular, Return is the difference between the adjusted R2 from Eq. (2) and the adjusted R2 from the nested version of Eq.
(2) that includes only the Cj and Ik:
RETURNit ¼ b0þb1NIit=Pit�1þb2DNIit=Pit�1þb3LOSSitþb4LOSSit � NIit=Pit�1þb5LOSSit � DNIit=Pit�1þX
j
b6jCjþX
k
b7kIkþeit : ð2Þ
We measure RETURN as the cumulative percentage change in stock price beginning nine months before fiscal year end and ending three months after fiscal
year end, adjusted for dividends and stock splits. NI/P is net income per share scaled by beginning of year stock price; LOSS is an indicator variable that
equals one if NI/P is negative, and zero otherwise; and D denotes annual change.
Cash Flow is based on the R2 from the regression of cash flow on lagged net income. In particular, Cash Flow is the difference between the adjusted R2 from
Eq. (3) and the adjusted R2 from the nested version of Eq. (3) that includes only the Cj and Ik:
CFitþ1 ¼ b0þb1NIit=TAit�1þX
j
b2jCjþX
k
b3kIkþeitþ1 , ð3Þ
where NI is net income, TA is total assets, and CF is net cash flow from operations scaled by lagged total assets.
To test for differences in R2, we estimate the equations 1000 times, randomly assigning firms to the relevant partitions and base significance tests on the
frequency of observing an R2 difference greater than or equal to the tabulated difference. The sample comprises non-US firms that adopted IFRS between
1995 and 2006 (IFRS firms) and a sample of US firms matched to the IFRS firms on size and industry (US firms).
M.E. Barth et al. / Journal of Accounting and Economics 54 (2012) 68–9382
differences between firms in high and low enforcement countries are significantly negative, with only that for Return beinginsignificantly different from zero. The differences in differences for Price, Return, and Cash Flow are �0.09, �0.01, and �0.07.
The findings in Table 6 comparing differences in value relevance between IFRS and US firms indicate that the Table 5findings for the combined post-adoption sample apply to all post-adoption sample partitions, except for common lawfirms. In particular, whereas value relevance is significantly higher for the combined sample based on Price and Cash Flow,there is no difference in value relevance based on Price and Return for common law firms. These findings indicate thatIFRS-based accounting amounts generally are comparable to US GAAP-based accounting amounts based on valuerelevance for common law firms.24 However, taken together, the findings in Table 6 indicate that significant differencesin value relevance remain.
6.3. Accounting quality
Table 7 presents findings relating to tests of differences in dimensions of accounting quality to provide insight intodifferences in comparability documented in Tables 3–6. Panel A presents findings relating to accounting quality differencesbefore and after IFRS firms adopt IFRS. Panels B through D present findings relating to accounting quality based onapplication of IFRS for the sample partitions. As with value relevance comparability, when testing for potential sources ofdifferences in comparability over time and across sample partitions, we test for differences in the absolute values ofaccounting quality metrics, rather than for differences in signed values.
6.3.1. Accounting quality differences before and after IFRS firms adopt IFRS
The findings in panel A reveal that both before and after IFRS firms adopt IFRS, with one exception, each of the qualitymetrics is consistent with accounting amounts of US firms exhibiting higher quality than IFRS firms. For example,regarding earnings smoothing, the difference in mean Var(DNIn)/Var(DCFn) for IFRS and US firms is �0.135 and �0.080before and after firms adopt IFRS. The exception relates to Accrual Quality after firms adopt IFRS, for which the difference,
24 Untabulated findings for Price based on share weighting also reveal that IFRS-based accounting amounts generally are comparable to US
GAAP-based accounting amounts for mandatory adopters.
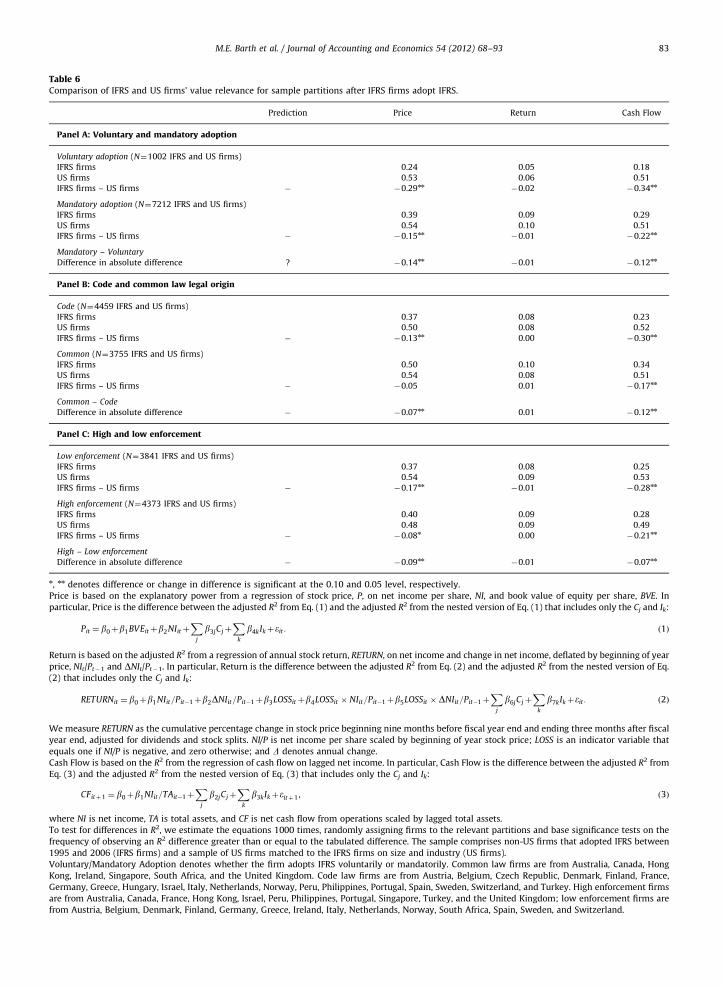
Table 6Comparison of IFRS and US firms’ value relevance for sample partitions after IFRS firms adopt IFRS.
Prediction Price Return Cash Flow
Panel A: Voluntary and mandatory adoption
Voluntary adoption (N¼1002 IFRS and US firms)
IFRS firms 0.24 0.05 0.18
US firms 0.53 0.06 0.51
IFRS firms – US firms � �0.29nn�0.02 �0.34nn
Mandatory adoption (N¼7212 IFRS and US firms)
IFRS firms 0.39 0.09 0.29
US firms 0.54 0.10 0.51
IFRS firms – US firms � �0.15nn�0.01 �0.22nn
Mandatory – Voluntary
Difference in absolute difference ? �0.14nn�0.01 �0.12nn
Panel B: Code and common law legal origin
Code (N¼4459 IFRS and US firms)
IFRS firms 0.37 0.08 0.23
US firms 0.50 0.08 0.52
IFRS firms – US firms � �0.13nn 0.00 �0.30nn
Common (N¼3755 IFRS and US firms)
IFRS firms 0.50 0.10 0.34
US firms 0.54 0.08 0.51
IFRS firms – US firms � �0.05 0.01 �0.17nn
Common – Code
Difference in absolute difference � �0.07nn 0.01 �0.12nn
Panel C: High and low enforcement
Low enforcement (N¼3841 IFRS and US firms)
IFRS firms 0.37 0.08 0.25
US firms 0.54 0.09 0.53
IFRS firms – US firms � �0.17nn�0.01 �0.28nn
High enforcement (N¼4373 IFRS and US firms)
IFRS firms 0.40 0.09 0.28
US firms 0.48 0.09 0.49
IFRS firms – US firms � �0.08n 0.00 �0.21nn
High – Low enforcement
Difference in absolute difference � �0.09nn�0.01 �0.07nn
n, nn denotes difference or change in difference is significant at the 0.10 and 0.05 level, respectively.
Price is based on the explanatory power from a regression of stock price, P, on net income per share, NI, and book value of equity per share, BVE. In
particular, Price is the difference between the adjusted R2 from Eq. (1) and the adjusted R2 from the nested version of Eq. (1) that includes only the Cj and Ik:
Pit ¼ b0þb1BVEitþb2NIitþX
j
b3jCjþX
k
b4kIkþeit : ð1Þ
Return is based on the adjusted R2 from a regression of annual stock return, RETURN, on net income and change in net income, deflated by beginning of year
price, NIt/Pt�1 and DNIt/Pt�1. In particular, Return is the difference between the adjusted R2 from Eq. (2) and the adjusted R2 from the nested version of Eq.
(2) that includes only the Cj and Ik:
RETURNit ¼ b0þb1NIit=Pit�1þb2DNIit=Pit�1þb3LOSSitþb4LOSSit � NIit=Pit�1þb5LOSSit �DNIit=Pit�1þX
j
b6jCjþX
k
b7kIkþeit : ð2Þ
We measure RETURN as the cumulative percentage change in stock price beginning nine months before fiscal year end and ending three months after fiscal
year end, adjusted for dividends and stock splits. NI/P is net income per share scaled by beginning of year stock price; LOSS is an indicator variable that
equals one if NI/P is negative, and zero otherwise; and D denotes annual change.
Cash Flow is based on the R2 from the regression of cash flow on lagged net income. In particular, Cash Flow is the difference between the adjusted R2 from
Eq. (3) and the adjusted R2 from the nested version of Eq. (3) that includes only the Cj and Ik:
CFitþ1 ¼ b0þb1NIit=TAit�1þX
j
b2jCjþX
k
b3kIkþeitþ1 , ð3Þ
where NI is net income, TA is total assets, and CF is net cash flow from operations scaled by lagged total assets.
To test for differences in R2, we estimate the equations 1000 times, randomly assigning firms to the relevant partitions and base significance tests on the
frequency of observing an R2 difference greater than or equal to the tabulated difference. The sample comprises non-US firms that adopted IFRS between
1995 and 2006 (IFRS firms) and a sample of US firms matched to the IFRS firms on size and industry (US firms).
Voluntary/Mandatory Adoption denotes whether the firm adopts IFRS voluntarily or mandatorily. Common law firms are from Australia, Canada, Hong
Kong, Ireland, Singapore, South Africa, and the United Kingdom. Code law firms are from Austria, Belgium, Czech Republic, Denmark, Finland, France,
Germany, Greece, Hungary, Israel, Italy, Netherlands, Norway, Peru, Philippines, Portugal, Spain, Sweden, Switzerland, and Turkey. High enforcement firms
are from Australia, Canada, France, Hong Kong, Israel, Peru, Philippines, Portugal, Singapore, Turkey, and the United Kingdom; low enforcement firms are
from Austria, Belgium, Denmark, Finland, Germany, Greece, Ireland, Italy, Netherlands, Norway, South Africa, Spain, Sweden, and Switzerland.
M.E. Barth et al. / Journal of Accounting and Economics 54 (2012) 68–93 83
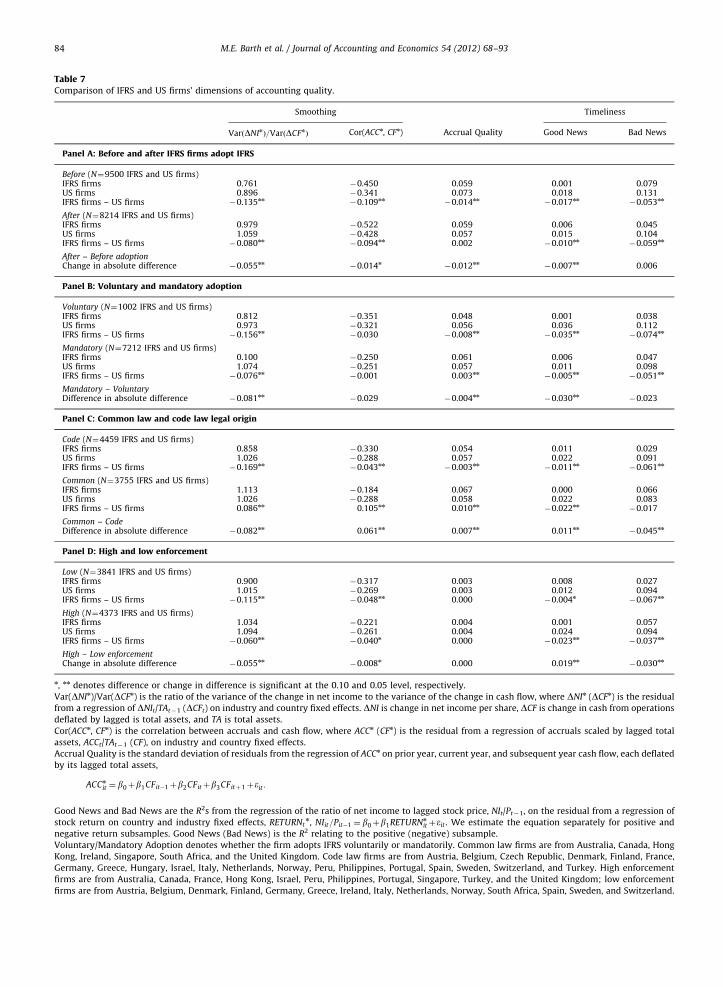
Table 7Comparison of IFRS and US firms’ dimensions of accounting quality.
Smoothing Timeliness
VarðDNInÞ=VarðDCFnÞ Cor(ACCn, CFn) Accrual Quality Good News Bad News
Panel A: Before and after IFRS firms adopt IFRS
Before (N¼9500 IFRS and US firms)IFRS firms 0.761 �0.450 0.059 0.001 0.079US firms 0.896 �0.341 0.073 0.018 0.131IFRS firms – US firms �0.135nn
�0.109nn�0.014nn
�0.017nn�0.053nn
After (N¼8214 IFRS and US firms)IFRS firms 0.979 �0.522 0.059 0.006 0.045US firms 1.059 �0.428 0.057 0.015 0.104IFRS firms – US firms �0.080nn
�0.094nn 0.002 �0.010nn�0.059nn
After – Before adoptionChange in absolute difference �0.055nn
�0.014n�0.012nn
�0.007nn 0.006
Panel B: Voluntary and mandatory adoption
Voluntary (N¼1002 IFRS and US firms)IFRS firms 0.812 �0.351 0.048 0.001 0.038US firms 0.973 �0.321 0.056 0.036 0.112IFRS firms – US firms �0.156nn
�0.030 �0.008nn�0.035nn
�0.074nn
Mandatory (N¼7212 IFRS and US firms)IFRS firms 0.100 �0.250 0.061 0.006 0.047US firms 1.074 �0.251 0.057 0.011 0.098IFRS firms – US firms �0.076nn
�0.001 0.003nn�0.005nn
�0.051nn
Mandatory – VoluntaryDifference in absolute difference �0.081nn
�0.029 �0.004nn�0.030nn
�0.023
Panel C: Common law and code law legal origin
Code (N¼4459 IFRS and US firms)IFRS firms 0.858 �0.330 0.054 0.011 0.029US firms 1.026 �0.288 0.057 0.022 0.091IFRS firms – US firms �0.169nn
�0.043nn�0.003nn
�0.011nn�0.061nn
Common (N¼3755 IFRS and US firms)IFRS firms 1.113 �0.184 0.067 0.000 0.066US firms 1.026 �0.288 0.058 0.022 0.083IFRS firms – US firms 0.086nn 0.105nn 0.010nn
�0.022nn�0.017
Common – CodeDifference in absolute difference �0.082nn 0.061nn 0.007nn 0.011nn
�0.045nn
Panel D: High and low enforcement
Low (N¼3841 IFRS and US firms)IFRS firms 0.900 �0.317 0.003 0.008 0.027US firms 1.015 �0.269 0.003 0.012 0.094IFRS firms – US firms �0.115nn
�0.048nn 0.000 �0.004n�0.067nn
High (N¼4373 IFRS and US firms)IFRS firms 1.034 �0.221 0.004 0.001 0.057US firms 1.094 �0.261 0.004 0.024 0.094IFRS firms – US firms �0.060nn
�0.040n 0.000 �0.023nn�0.037nn
High – Low enforcementChange in absolute difference �0.055nn
�0.008n 0.000 0.019nn�0.030nn
n, nn denotes difference or change in difference is significant at the 0.10 and 0.05 level, respectively.
Var(DNIn)/Var(DCFn) is the ratio of the variance of the change in net income to the variance of the change in cash flow, where DNIn (DCFn) is the residual
from a regression of DNIt/TAt�1 (DCFt) on industry and country fixed effects. DNI is change in net income per share, DCF is change in cash from operations
deflated by lagged is total assets, and TA is total assets.
Cor(ACCn, CFn) is the correlation between accruals and cash flow, where ACCn (CFn) is the residual from a regression of accruals scaled by lagged total
assets, ACCt/TAt�1 (CF), on industry and country fixed effects.
Accrual Quality is the standard deviation of residuals from the regression of ACCn on prior year, current year, and subsequent year cash flow, each deflated
by its lagged total assets,
ACCn
it ¼ b0þb1CFit�1þb2CFitþb3CFitþ1þeit :
Good News and Bad News are the R2s from the regression of the ratio of net income to lagged stock price, NIt/Pt�1, on the residual from a regression of
stock return on country and industry fixed effects, RETURNtn , NIit=Pit�1 ¼ b0þb1RETURNn
itþeit . We estimate the equation separately for positive and
negative return subsamples. Good News (Bad News) is the R2 relating to the positive (negative) subsample.
Voluntary/Mandatory Adoption denotes whether the firm adopts IFRS voluntarily or mandatorily. Common law firms are from Australia, Canada, Hong
Kong, Ireland, Singapore, South Africa, and the United Kingdom. Code law firms are from Austria, Belgium, Czech Republic, Denmark, Finland, France,
Germany, Greece, Hungary, Israel, Italy, Netherlands, Norway, Peru, Philippines, Portugal, Spain, Sweden, Switzerland, and Turkey. High enforcement
firms are from Australia, Canada, France, Hong Kong, Israel, Peru, Philippines, Portugal, Singapore, Turkey, and the United Kingdom; low enforcement
firms are from Austria, Belgium, Denmark, Finland, Germany, Greece, Ireland, Italy, Netherlands, Norway, South Africa, Spain, Sweden, and Switzerland.
M.E. Barth et al. / Journal of Accounting and Economics 54 (2012) 68–9384
M.E. Barth et al. / Journal of Accounting and Economics 54 (2012) 68–93 85
0.002, is insignificant. The insignificant difference is attributable to a decrease in accrual quality for US firms; accrualquality for IFRS firms did not change.
More importantly, the findings in panel A are consistent with all three dimensions of accounting quality being sourcesof the increase in comparability documented in Tables 3 and 5. In particular, changes in differences for four of the fivemetrics indicate that accounting quality differences significantly diminished, one marginally so, after firms adopt IFRS. Thechange in differences for Var(DNIn)/Var(DCFn), Cor(ACCn, CFn), Accrual Quality, and Good News are �0.055, �0.014,�0.012, and �0.007. Only the change in difference for Bad News, 0.006, is not significant.25
6.3.2. Accounting quality based on application of IFRS for sample partitions
The findings in panels B through D generally reveal that for all post-adoption sample partitions, with the exception ofcommon law firms, accounting amounts of US firms exhibit higher quality than IFRS firms. That is, for voluntary andmandatory adopters, code law firms, and firms in high and low enforcement countries, accounting quality is generallyhigher for US firms based on each of the five quality metrics, with 20 of the 25 differences being significantly so (twomarginally so). Relating to common law firms, panel C reveals that accounting quality is significantly higher for such firmsthan for US firms based on the two earnings smoothing measures, Var(DNIn)/Var(DCFn) and Cor(ACCn, CFn), and AccrualQuality; accounting quality is higher for US firms based on the two timeliness measures, Good News and Bad News,significantly so for Good News.
More importantly, the findings in panels B through D are generally consistent with all three dimensions of accountingquality being sources of the increase in comparability documented in Tables 4 and 6. The findings reveal accountingquality differences between US and IFRS firms are smaller for mandatory adopters and firms in high enforcement countriesbased on each of the five quality metrics, as indicated by 8 of the 10 differences being negative, 6 of which are significant(one marginally so). Only the mean differences in Good News for firms in high and low enforcement countries aresignificantly positive; the mean difference in Accrual Quality for firms in high and low enforcement countries is zero.
Panel C reveals that whereas differences in accounting quality between US and IFRS firms are significantly smaller forcommon law firms based on Var(DNIn)/Var(DCFn) and Bad News, differences are smaller for code law firms based onCor(ACCn, CFn), Accrual Quality, and Good News. These findings suggest Var(DNIn)/Var(DCFn) and Bad News dominateCor(ACCn, CFn), Accrual Quality, and Good News as potential sources of the greater comparability for common law firmsdocumented in panels B of Tables 4 and 6.
6.4. Additional analyses
6.4.1. Regression coefficients
The findings in Tables 3–6 indicate that accounting system and value relevance comparability with US firms increasedafter IFRS firms adopt IFRS, and comparability generally is greater for firms that adopt IFRS mandatorily, common lawfirms, and firms in countries with high enforcement. Because both sets of comparability metrics are based on the sameregressions of stock price, stock return, and cash flow on various combinations of equity book value and net income, Tables3–6 findings likely manifest from smaller differences in regression coefficients. In this section, we test for differences inregression coefficients for our sample partitions to provide insight into whether differences in coefficients for equity bookvalue, net income, or change in net income are sources of the differences in comparability we document.26
Table 8, panel A, reveals that four of the five coefficient differences between IFRS and US firms are smaller after firmsadopt IFRS, two of which are significant and one marginally significant. However, the net income coefficient difference inthe return regression is significantly larger. Relating to the post-adoption partitions, panels B, C, and D reveal that four,three, and two of the five coefficient differences between IFRS and US firms are either significantly or marginally smallerfor firms that adopt IFRS mandatorily, common law firms, and firms in countries with high enforcement. Of the threedifferences that are significantly or marginally significantly positive, all relate to the return regression: two relate to thenet income coefficient (voluntary/mandatory and code/common partitions) and one relates to the change in net incomecoefficient (high/low enforcement). The mixed findings for the return coefficients are consistent with the lack ofsignificance for differences in comparability based on Return in Table 6. However, the net income coefficient differencefor the cash flow regression in panel D is not significantly different for the high and low enforcement partitions, which isnot consistent with finding a significant difference in comparability based on Cash Flow in Table 6. Thus, with this oneexception, Table 8 findings reveal which decreases in coefficient differences for equity book value, net income, and changein net income are sources of the differences in comparability we document in Tables 3–6.
6.4.2. Potential comparability differences between early and later post-adoption years
Convergence between IFRS and US GAAP has increased over time (FASB and IASB, 2008), and the use of IFRS has becomemore widespread thereby increasing the likelihood of greater investor understanding and more consistent application and
25 Our inferences regarding the links between accounting quality and comparability are based on a parsimonious set of accounting quality metrics
used in prior research. Inferences could differ if we used other metrics.26 For the sake of parsimony, we do not tabulate findings from tests relating to the coefficients on the variables interacted with the indicator variable
for negative net income. Untabulated findings reveal no pattern in the difference in differences.
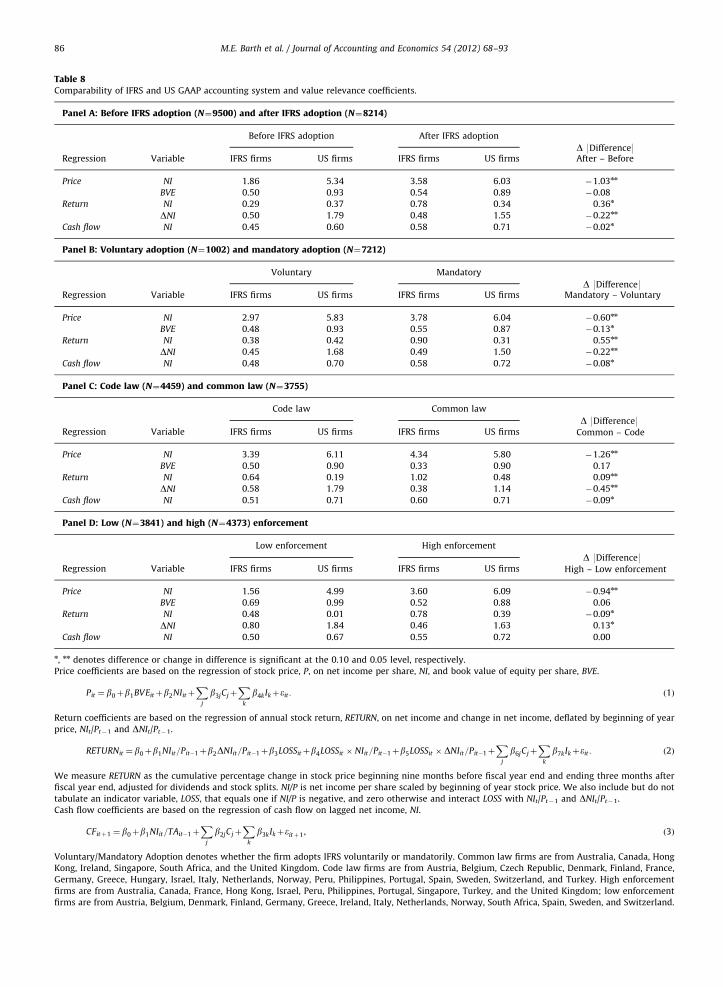
Table 8Comparability of IFRS and US GAAP accounting system and value relevance coefficients.
Panel A: Before IFRS adoption (N¼9500) and after IFRS adoption (N¼8214)
Before IFRS adoption After IFRS adoption
D 9Difference9Regression Variable IFRS firms US firms IFRS firms US firms After – Before
Price NI 1.86 5.34 3.58 6.03 �1.03nn
BVE 0.50 0.93 0.54 0.89 �0.08
Return NI 0.29 0.37 0.78 0.34 0.36n
DNI 0.50 1.79 0.48 1.55 �0.22nn
Cash flow NI 0.45 0.60 0.58 0.71 �0.02n
Panel B: Voluntary adoption (N¼1002) and mandatory adoption (N¼7212)
Voluntary Mandatory
D 9Difference9Regression Variable IFRS firms US firms IFRS firms US firms Mandatory – Voluntary
Price NI 2.97 5.83 3.78 6.04 �0.60nn
BVE 0.48 0.93 0.55 0.87 �0.13n
Return NI 0.38 0.42 0.90 0.31 0.55nn
DNI 0.45 1.68 0.49 1.50 �0.22nn
Cash flow NI 0.48 0.70 0.58 0.72 �0.08n
Panel C: Code law (N¼4459) and common law (N¼3755)
Code law Common law
D 9Difference9Common – CodeRegression Variable IFRS firms US firms IFRS firms US firms
Price NI 3.39 6.11 4.34 5.80 �1.26nn
BVE 0.50 0.90 0.33 0.90 0.17
Return NI 0.64 0.19 1.02 0.48 0.09nn
DNI 0.58 1.79 0.38 1.14 �0.45nn
Cash flow NI 0.51 0.71 0.60 0.71 �0.09n
Panel D: Low (N¼3841) and high (N¼4373) enforcement
Low enforcement High enforcement
D 9Difference9High – Low enforcementRegression Variable IFRS firms US firms IFRS firms US firms
Price NI 1.56 4.99 3.60 6.09 �0.94nn
BVE 0.69 0.99 0.52 0.88 0.06
Return NI 0.48 0.01 0.78 0.39 �0.09n
DNI 0.80 1.84 0.46 1.63 0.13n
Cash flow NI 0.50 0.67 0.55 0.72 0.00
n, nn denotes difference or change in difference is significant at the 0.10 and 0.05 level, respectively.
Price coefficients are based on the regression of stock price, P, on net income per share, NI, and book value of equity per share, BVE.
Pit ¼ b0þb1BVEitþb2NIitþX
j
b3jCjþX
k
b4kIkþeit : ð1Þ
Return coefficients are based on the regression of annual stock return, RETURN, on net income and change in net income, deflated by beginning of year
price, NIt/Pt�1 and DNIt/Pt�1.
RETURNit ¼ b0þb1NIit=Pit�1þb2DNIit=Pit�1þb3LOSSitþb4LOSSit � NIit=Pit�1þb5LOSSit � DNIit=Pit�1þX
j
b6jCjþX
k
b7kIkþeit : ð2Þ
We measure RETURN as the cumulative percentage change in stock price beginning nine months before fiscal year end and ending three months after
fiscal year end, adjusted for dividends and stock splits. NI/P is net income per share scaled by beginning of year stock price. We also include but do not
tabulate an indicator variable, LOSS, that equals one if NI/P is negative, and zero otherwise and interact LOSS with NIt/Pt�1 and DNIt/Pt�1.
Cash flow coefficients are based on the regression of cash flow on lagged net income, NI.
CFitþ1 ¼ b0þb1NIit=TAit�1þX
j
b2jCjþX
k
b3kIkþeitþ1 , ð3Þ
Voluntary/Mandatory Adoption denotes whether the firm adopts IFRS voluntarily or mandatorily. Common law firms are from Australia, Canada, Hong
Kong, Ireland, Singapore, South Africa, and the United Kingdom. Code law firms are from Austria, Belgium, Czech Republic, Denmark, Finland, France,
Germany, Greece, Hungary, Israel, Italy, Netherlands, Norway, Peru, Philippines, Portugal, Spain, Sweden, Switzerland, and Turkey. High enforcement
firms are from Australia, Canada, France, Hong Kong, Israel, Peru, Philippines, Portugal, Singapore, Turkey, and the United Kingdom; low enforcement
firms are from Austria, Belgium, Denmark, Finland, Germany, Greece, Ireland, Italy, Netherlands, Norway, South Africa, Spain, Sweden, and Switzerland.
M.E. Barth et al. / Journal of Accounting and Economics 54 (2012) 68–9386
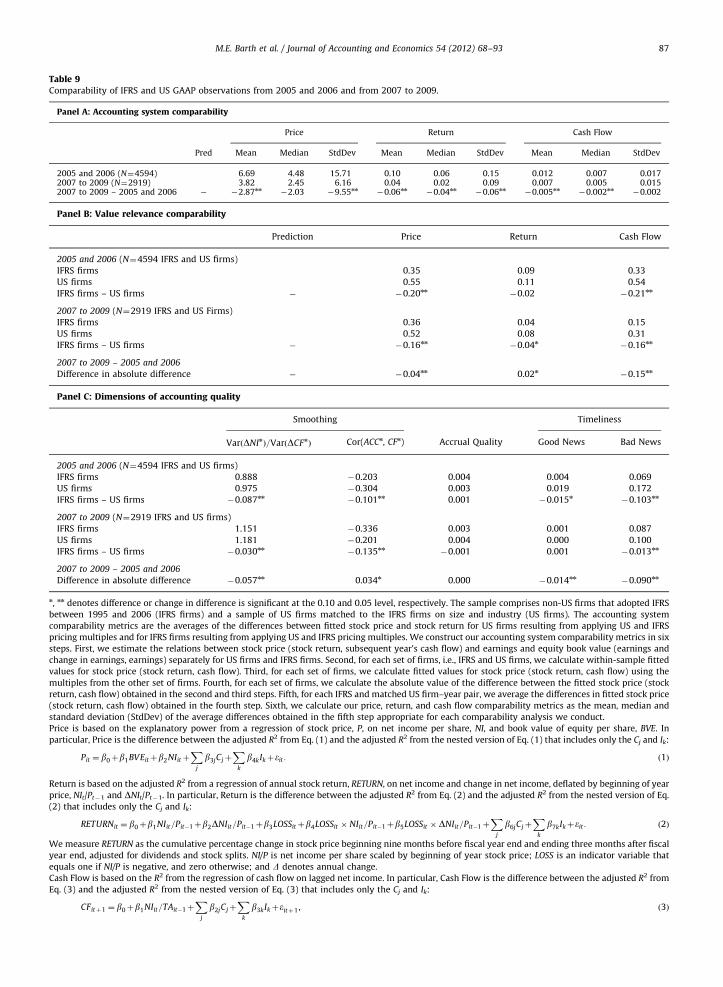
Table 9Comparability of IFRS and US GAAP observations from 2005 and 2006 and from 2007 to 2009.
Panel A: Accounting system comparability
Price Return Cash Flow
Pred Mean Median StdDev Mean Median StdDev Mean Median StdDev
2005 and 2006 (N¼4594) 6.69 4.48 15.71 0.10 0.06 0.15 0.012 0.007 0.0172007 to 2009 (N¼2919) 3.82 2.45 6.16 0.04 0.02 0.09 0.007 0.005 0.0152007 to 2009 – 2005 and 2006 � �2.87nn
�2.03 �9.55nn�0.06nn
�0.04nn�0.06nn
�0.005nn�0.002nn
�0.002
Panel B: Value relevance comparability
Prediction Price Return Cash Flow
2005 and 2006 (N¼4594 IFRS and US firms)
IFRS firms 0.35 0.09 0.33
US firms 0.55 0.11 0.54
IFRS firms – US firms � �0.20nn�0.02 �0.21nn
2007 to 2009 (N¼2919 IFRS and US Firms)
IFRS firms 0.36 0.04 0.15
US firms 0.52 0.08 0.31
IFRS firms – US firms � �0.16nn�0.04n
�0.16nn
2007 to 2009 – 2005 and 2006
Difference in absolute difference � �0.04nn 0.02n�0.15nn
Panel C: Dimensions of accounting quality
Smoothing Timeliness
VarðDNInÞ=VarðDCFnÞ Cor(ACCn, CFn) Accrual Quality Good News Bad News
2005 and 2006 (N¼4594 IFRS and US firms)
IFRS firms 0.888 �0.203 0.004 0.004 0.069
US firms 0.975 �0.304 0.003 0.019 0.172
IFRS firms – US firms �0.087nn�0.101nn 0.001 �0.015n
�0.103nn
2007 to 2009 (N¼2919 IFRS and US firms)
IFRS firms 1.151 �0.336 0.003 0.001 0.087
US firms 1.181 �0.201 0.004 0.000 0.100
IFRS firms – US firms �0.030nn�0.135nn
�0.001 0.001 �0.013nn
2007 to 2009 – 2005 and 2006
Difference in absolute difference �0.057nn 0.034n 0.000 �0.014nn�0.090nn
n, nn denotes difference or change in difference is significant at the 0.10 and 0.05 level, respectively. The sample comprises non-US firms that adopted IFRS
between 1995 and 2006 (IFRS firms) and a sample of US firms matched to the IFRS firms on size and industry (US firms). The accounting system
comparability metrics are the averages of the differences between fitted stock price and stock return for US firms resulting from applying US and IFRS
pricing multiples and for IFRS firms resulting from applying US and IFRS pricing multiples. We construct our accounting system comparability metrics in six
steps. First, we estimate the relations between stock price (stock return, subsequent year’s cash flow) and earnings and equity book value (earnings and
change in earnings, earnings) separately for US firms and IFRS firms. Second, for each set of firms, i.e., IFRS and US firms, we calculate within-sample fitted
values for stock price (stock return, cash flow). Third, for each set of firms, we calculate fitted values for stock price (stock return, cash flow) using the
multiples from the other set of firms. Fourth, for each set of firms, we calculate the absolute value of the difference between the fitted stock price (stock
return, cash flow) obtained in the second and third steps. Fifth, for each IFRS and matched US firm–year pair, we average the differences in fitted stock price
(stock return, cash flow) obtained in the fourth step. Sixth, we calculate our price, return, and cash flow comparability metrics as the mean, median and
standard deviation (StdDev) of the average differences obtained in the fifth step appropriate for each comparability analysis we conduct.
Price is based on the explanatory power from a regression of stock price, P, on net income per share, NI, and book value of equity per share, BVE. In
particular, Price is the difference between the adjusted R2 from Eq. (1) and the adjusted R2 from the nested version of Eq. (1) that includes only the Cj and Ik:
Pit ¼ b0þb1BVEitþb2NIitþX
j
b3jCjþX
k
b4kIkþeit : ð1Þ
Return is based on the adjusted R2 from a regression of annual stock return, RETURN, on net income and change in net income, deflated by beginning of year
price, NIt/Pt�1 and DNIt/Pt�1. In particular, Return is the difference between the adjusted R2 from Eq. (2) and the adjusted R2 from the nested version of Eq.
(2) that includes only the Cj and Ik:
RETURNit ¼ b0þb1NIit=Pit�1þb2DNIit=Pit�1þb3LOSSitþb4LOSSit � NIit=Pit�1þb5LOSSit �DNIit=Pit�1þX
j
b6jCjþX
k
b7kIkþeit : ð2Þ
We measure RETURN as the cumulative percentage change in stock price beginning nine months before fiscal year end and ending three months after fiscal
year end, adjusted for dividends and stock splits. NI/P is net income per share scaled by beginning of year stock price; LOSS is an indicator variable that
equals one if NI/P is negative, and zero otherwise; and D denotes annual change.
Cash Flow is based on the R2 from the regression of cash flow on lagged net income. In particular, Cash Flow is the difference between the adjusted R2 from
Eq. (3) and the adjusted R2 from the nested version of Eq. (3) that includes only the Cj and Ik:
CFitþ1 ¼ b0þb1NIit=TAit�1þX
j
b2jCjþX
k
b3kIkþeitþ1 , ð3Þ
M.E. Barth et al. / Journal of Accounting and Economics 54 (2012) 68–93 87
where NI is net income, TA is total assets, and CF is net cash flow from operations scaled by lagged total assets.
To test for differences in R2, we estimate the equations 1000 times, randomly assigning firms to the relevant partitions and base significance tests on the
frequency of observing an R2 difference greater than or equal to the tabulated difference. The sample comprises non-US firms that adopted IFRS between
1995 and 2006 (IFRS firms) and a sample of US firms matched to the IFRS firms on size and industry (US firms).
Var(DNIn)/Var(DCFn) is the ratio of the variance of the change in net income to the variance of the change in cash flow, where DNIn (DCFn) is the residual
from a regression of DNIt/TAt�1 (DCFt) on industry and country fixed effects. DNI is change in net income per share, DCF is change in cash from operations
deflated by lagged is total assets, and TA is total assets.
Cor(ACCn, CFn) is the correlation between accruals and cash flow, where ACCn (CFn) is the residual from a regression of accruals scaled by lagged total assets,
ACCt/TAt�1 (CF), on industry and country fixed effects.
Accrual Quality is the standard deviation of residuals from the regression of ACCn on prior year, current year, and subsequent year cash flow, each deflated
by its lagged total assets,
ACCn
it ¼ b0þb1CFit�1þb2CFitþb3CFitþ1þeit :
Good News and Bad News are the R2s from the regression of the ratio of net income to lagged stock price, NIt/Pt�1, on the residual from a regression of stock
return on country and industry fixed effects, RETURNtn , NIit=Pit�1 ¼ b0þb1RETURNn
itþeit . We estimate the equation separately for positive and negative
return subsamples. Good News (Bad News) is the R2 relating to the positive (negative) subsample.
M.E. Barth et al. / Journal of Accounting and Economics 54 (2012) 68–9388
enforcement. Although the findings in Tables 3 and 5 indicate that comparability between IFRS and US firms’ accountingamounts increased after adoption, this inference is based on combining all post-adoption sample years. To examinewhether the increased convergence and more widespread use of IFRS are associated with increases in comparability, werepeat our analyses using observations from 2005 to 2006 and from 2007 through 2009.
The findings in Table 9, panel A, reveal that accounting system comparability is greater for the 2007–2009 samplepartition, with all nine differences being smaller for this period and seven significantly so. The findings in panel B revealthat value relevance comparability is greater for the 2007–2009 sample partition based on Price and Cash Flow, with bothdifferences being significantly smaller for this period, but not based on Return, with the difference being marginallysignificantly larger. The findings also reveal that value relevance differences between IFRS and US firms remain in the2007–2009 period based on all three metrics. The findings in panel C relating to accounting quality differences reveal thatthe ratio of the variances of change in net income and change in cash flow, Good News, and Bad News are potential sourcesfor the increase in comparability in the 2007–2009 period.27 These findings are consistent with efforts to convergeaccounting standards, the increasing mandatory use of IFRS throughout the world, the development of internationalauditing standards, and efforts to increase coordination of international securities market regulators having increasedcomparability of accounting amounts.
6.4.3. Potential effects of globalization
Although the findings in Tables 3 and 5 indicate that accounting system and value relevance comparability with US firmsincreased after IFRS firms adopt IFRS, it is possible that the increase is attributable to effects of increased globalization, such ascross-border investments. To address this possibility, we conduct the same comparability tests for firms in two non-UScountries, India and Japan, that are major economies and therefore subject to the effects of globalization, but did not permitfirms to apply IFRS during our sample years. We obtain sample observations for Indian and Japanese firms as follows. Weassign to each sample US firm an Indian or Japanese firm in the same industry matched on size using the same matchingprocedure we use to match IFRS firms and US firms, and using the adoption date of the IFRS firm to which the US firm isassigned as the pseudo-adoption date. Table 10, panels A and B, presents the resulting accounting system and value relevancecomparability metrics. Panel A reveals that none of the Price, Return, or Cash Flow differences significantly decreases after IFRSfirms adopt IFRS, except for the standard deviation for Return, which decreases marginally significantly. Panel B reveals nosignificant differences in value relevance comparability. Additional findings reveal that none of the value relevance metricschanges significantly for Indian and Japanese firms. Taken together, the Table 10 findings do not support globalization as anexplanation for our primary findings of the increase in comparability after IFRS firms adopt IFRS.
6.4.4. Potential industry comparability differences
To address the possibility that comparability differences are concentrated in firms in particular industries, we repeatthe comparability analyses for firms in the three industries with the largest number of observations, Manufacturing,Services, and Finance, Insurance, and Real Estate, but do not tabulate the findings. Regarding comparability differencesbefore and after IFRS firms adopt IFRS, the findings generally reveal significant increases in accounting systemcomparability for firms in Manufacturing and Services, but not Finance, Insurance, and Real Estate. The findings alsoreveal significant increases in value relevance comparability for all three industry groups, except for a significant decreasefor Price for Finance, Insurance, and Real Estate firms and an insignificant change for Return for Manufacturing firms.
Regarding comparability differences for the post-adoption sample partitions, findings generally result in inferences forall three industry groups similar to those for the full sample. Notable exceptions regarding accounting systemcomparability relate to Finance, Insurance, and Real Estate firms, for which there are generally insignificant differences
27 We also compared comparability metrics for mandatory adopters for 2005–2006 and 2007–2009 to assess the extent to which our inferences from
the tests in this section are affected by the influence of voluntary adopters. Untabulated findings reveal that accounting system comparability increased
significantly after 2006 for all metrics, and value relevance comparability increased significantly for Cash Flow and marginally significantly for Price, but
marginally significantly decreased for Return.
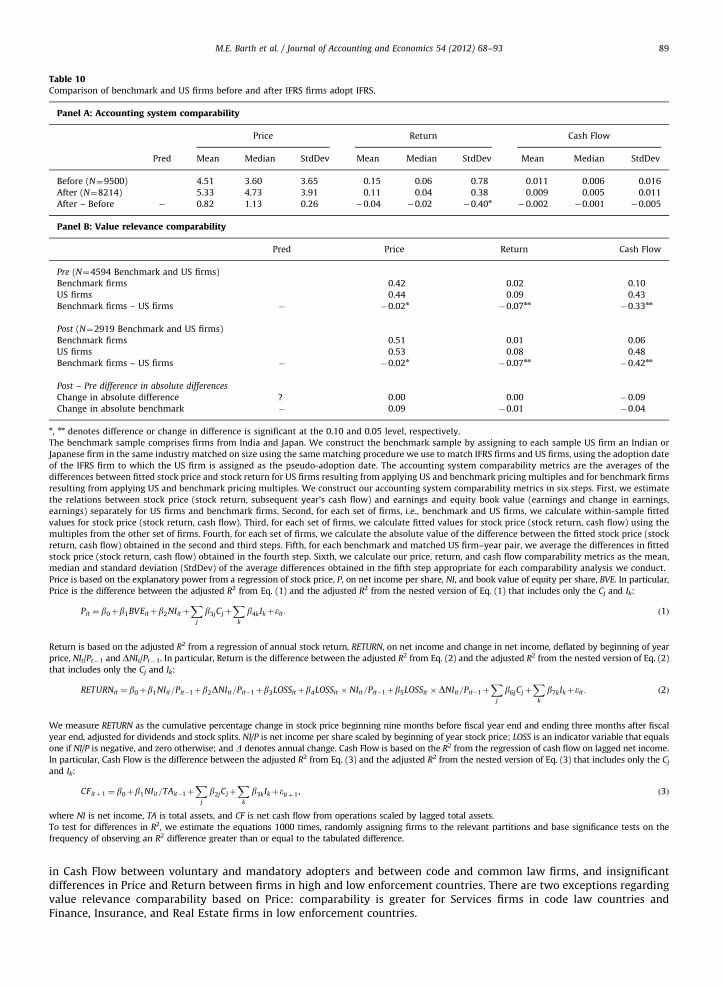
Table 10Comparison of benchmark and US firms before and after IFRS firms adopt IFRS.
Panel A: Accounting system comparability
Price Return Cash Flow
Pred Mean Median StdDev Mean Median StdDev Mean Median StdDev
Before (N¼9500) 4.51 3.60 3.65 0.15 0.06 0.78 0.011 0.006 0.016
After (N¼8214) 5.33 4.73 3.91 0.11 0.04 0.38 0.009 0.005 0.011
After – Before � 0.82 1.13 0.26 �0.04 �0.02 �0.40n�0.002 �0.001 �0.005
Panel B: Value relevance comparability
Pred Price Return Cash Flow
Pre (N¼4594 Benchmark and US firms)
Benchmark firms 0.42 0.02 0.10
US firms 0.44 0.09 0.43
Benchmark firms – US firms � �0.02n�0.07nn
�0.33nn
Post (N¼2919 Benchmark and US firms)
Benchmark firms 0.51 0.01 0.06
US firms 0.53 0.08 0.48
Benchmark firms – US firms � �0.02n�0.07nn
�0.42nn
Post – Pre difference in absolute differences
Change in absolute difference ? 0.00 0.00 �0.09
Change in absolute benchmark � 0.09 �0.01 �0.04
n, nn denotes difference or change in difference is significant at the 0.10 and 0.05 level, respectively.
The benchmark sample comprises firms from India and Japan. We construct the benchmark sample by assigning to each sample US firm an Indian or
Japanese firm in the same industry matched on size using the same matching procedure we use to match IFRS firms and US firms, using the adoption date
of the IFRS firm to which the US firm is assigned as the pseudo-adoption date. The accounting system comparability metrics are the averages of the
differences between fitted stock price and stock return for US firms resulting from applying US and benchmark pricing multiples and for benchmark firms
resulting from applying US and benchmark pricing multiples. We construct our accounting system comparability metrics in six steps. First, we estimate
the relations between stock price (stock return, subsequent year’s cash flow) and earnings and equity book value (earnings and change in earnings,
earnings) separately for US firms and benchmark firms. Second, for each set of firms, i.e., benchmark and US firms, we calculate within-sample fitted
values for stock price (stock return, cash flow). Third, for each set of firms, we calculate fitted values for stock price (stock return, cash flow) using the
multiples from the other set of firms. Fourth, for each set of firms, we calculate the absolute value of the difference between the fitted stock price (stock
return, cash flow) obtained in the second and third steps. Fifth, for each benchmark and matched US firm–year pair, we average the differences in fitted
stock price (stock return, cash flow) obtained in the fourth step. Sixth, we calculate our price, return, and cash flow comparability metrics as the mean,
median and standard deviation (StdDev) of the average differences obtained in the fifth step appropriate for each comparability analysis we conduct.
Price is based on the explanatory power from a regression of stock price, P, on net income per share, NI, and book value of equity per share, BVE. In particular,
Price is the difference between the adjusted R2 from Eq. (1) and the adjusted R2 from the nested version of Eq. (1) that includes only the Cj and Ik:
Pit ¼ b0þb1BVEitþb2NIitþX
j
b3jCjþX
k
b4kIkþeit : ð1Þ
Return is based on the adjusted R2 from a regression of annual stock return, RETURN, on net income and change in net income, deflated by beginning of year
price, NIt/Pt�1 and DNIt/Pt�1. In particular, Return is the difference between the adjusted R2 from Eq. (2) and the adjusted R2 from the nested version of Eq. (2)
that includes only the Cj and Ik:
RETURNit ¼ b0þb1NIit=Pit�1þb2DNIit=Pit�1þb3LOSSitþb4LOSSit � NIit=Pit�1þb5LOSSit �DNIit=Pit�1þX
j
b6jCjþX
k
b7kIkþeit : ð2Þ
We measure RETURN as the cumulative percentage change in stock price beginning nine months before fiscal year end and ending three months after fiscal
year end, adjusted for dividends and stock splits. NI/P is net income per share scaled by beginning of year stock price; LOSS is an indicator variable that equals
one if NI/P is negative, and zero otherwise; and D denotes annual change. Cash Flow is based on the R2 from the regression of cash flow on lagged net income.
In particular, Cash Flow is the difference between the adjusted R2 from Eq. (3) and the adjusted R2 from the nested version of Eq. (3) that includes only the Cj
and Ik:
CFitþ1 ¼ b0þb1NIit=TAit�1þX
j
b2jCjþX
k
b3kIkþeitþ1 , ð3Þ
where NI is net income, TA is total assets, and CF is net cash flow from operations scaled by lagged total assets.
To test for differences in R2, we estimate the equations 1000 times, randomly assigning firms to the relevant partitions and base significance tests on the
frequency of observing an R2 difference greater than or equal to the tabulated difference.
M.E. Barth et al. / Journal of Accounting and Economics 54 (2012) 68–93 89
in Cash Flow between voluntary and mandatory adopters and between code and common law firms, and insignificantdifferences in Price and Return between firms in high and low enforcement countries. There are two exceptions regardingvalue relevance comparability based on Price: comparability is greater for Services firms in code law countries andFinance, Insurance, and Real Estate firms in low enforcement countries.
M.E. Barth et al. / Journal of Accounting and Economics 54 (2012) 68–9390
6.4.5. Potential pricing effects of comparability
Value relevance of earnings and equity book value for stock price can increase when a firm adopts IFRS simply becauseinvestors can more easily understand the link between these two accounting amounts and stock prices when a largenumber of firms simultaneously apply IFRS. The SEC likely would interpret any increase in value relevance associated withthis increased understandability as evidence of increased comparability. However, accounting standard setters likely viewcomparability more narrowly in that they likely are more interested in comparability attributable to the accountingamounts only. To provide evidence on the standard setter view of comparability, we include variables in the full andnested models as controls for these potential pricing effects. These variables include the number of exchanges on whichthe firm is listed (Armstrong et al., 2010), the percentage of firms using international accounting standards in the firm’scountry, and the number of days during the last quarter of the firm’s fiscal year for which its stock return is zero (Daskeet al., 2008). We also include stock return for the prior year as a control for pricing effects unassociated with current yearaccounting amounts, and the yearly covariance between the daily US market return and each country-level market returnas controls for effects of global integration of financial markets. Untabulated findings reveal the same inferences as thoserelating to findings in Tables 5 and 6.
7. Summary and concluding remarks
This study documents the extent to which application of IFRS by non-US firms results in accounting amounts that arecomparable to those resulting from application of US GAAP by US firms. We use two approaches to assess comparability,accounting system comparability and value relevance comparability. For both, we find that IFRS firms’ accounting amountshave greater comparability with those of US firms when IFRS firms apply IFRS than when they applied non-US domesticstandards. We also find that comparability generally is greater for firms that adopt IFRS mandatorily, common law firms,and firms in countries with high enforcement. Additional findings indicate that US firms’ accounting amounts generallyhave higher value relevance than those of IFRS firms. However, accounting amounts for common law firms generally havevalue relevance comparable to those of US firms, but accounting amounts for firms in the other post-adoption samplepartitions generally exhibit lower value relevance than those for US firms.
We find that both before and after IFRS firms adopt IFRS accounting quality is higher for US firms, and that all threedimensions of accounting quality – earnings smoothing, accrual quality, and timeliness – are potential sources of theincrease in comparability after IFRS firms adopt IFRS. In addition, similar findings obtain for all post-adoption samplepartitions, with the exception of common law firms, which, relative to US firms, exhibit higher accounting quality alongsome dimensions but lower quality along others.
Findings from additional analyses generally reveal that differences in regression coefficients used in constructing thecomparability metrics for IFRS and US firms are smaller after IFRS firms adopt IFRS and for post-adoption sample partitionsthat exhibit greater comparability, comparability is greater in more recent years, globalization does not explain our findingof an increase in comparability after IFRS firms adopt IFRS, and although there are significant increases in value relevancecomparability for firms in each of three major industry groups after they adopt IFRS, there is no change in accountingsystem comparability for firms in the Finance, Insurance, and Real Estate industry.
Taken together, the findings suggest that efforts to converge accounting standards, the increasing mandatory use ofIFRS throughout the world, the development of international auditing standards, and efforts to increase coordination ofinternational securities market regulators have increased comparability of accounting amounts. However, althoughwidespread application of IFRS by non-US firms has enhanced financial reporting comparability with US firms, significantdifferences remain.
Appendix A
This appendix describes the six steps we use to construct our accounting system comparability metrics. Ourconstruction is adapted from De Franco et al. (2011).28
First, we estimate the relations between stock price (stock return, subsequent year’s cash flow) and earnings and equitybook value (earnings and change in earnings, earnings) separately for US firms and IFRS firms. To implement this step, weestimate the following pairs of stock price and stock return regressions, pooling observations across firms and over time,where i and t refer to firm and year, respectively.
PUSit ¼ bUS
0 þbUS1 BVEUS
it þbUS2 NIUS
it þeUSit ðA1aÞ
28 Using stock return as the economic outcome, De Franco et al. (2011) develops accounting system comparability metrics to assess the extent to
which a particular firm’s earnings is comparable to that of other firms in its industry. The study uses a sample of US firms to estimate time-series
relations between earnings and stock returns. There are several differences between our construction of accounting system comparability and that of De
Franco et al. (2011). First, our focus is on comparability of the IFRS and US GAAP accounting systems. Second, we consider stock price and cash flow as
economic outcomes in addition to stock return. Third, we consider various combinations of net income and equity book value as accounting amounts. As
a result, whereas De Franco et al. (2011) estimates a ‘‘reverse’’ regression of earnings on stock return, we estimate direct regressions of each economic
outcome on potentially multiple accounting amounts. Finally, whereas De Franco et al. (2011) assesses comparability based on time-series relations, we
assess comparability based on cross-sectional relations because we seek to determine whether IFRS and US GAAP accounting systems are comparable at
the same point in time.
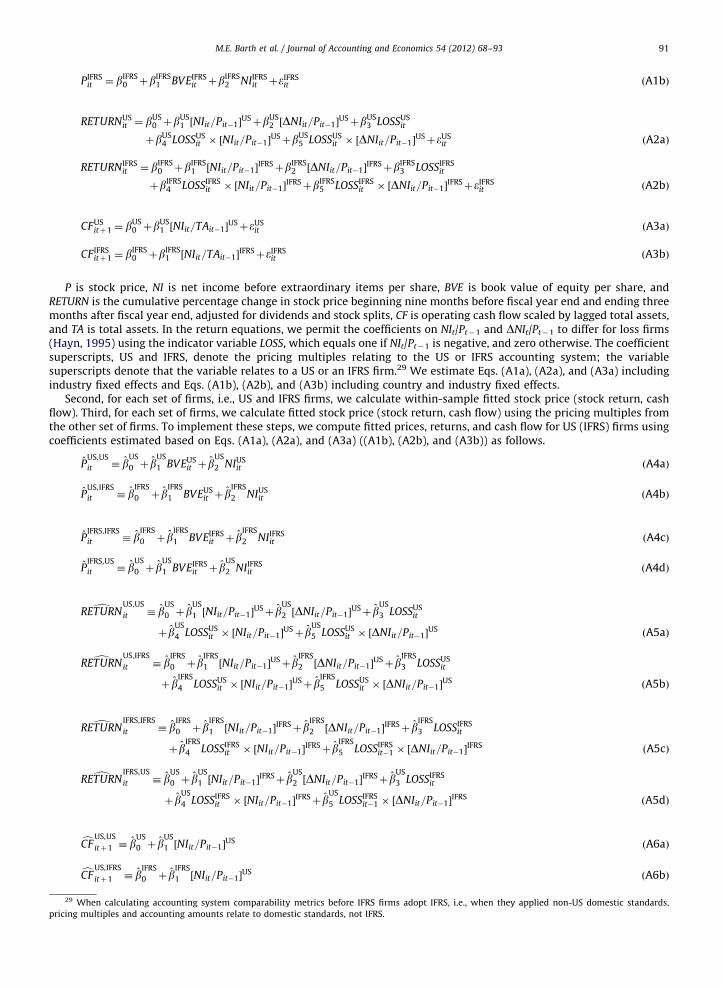
M.E. Barth et al. / Journal of Accounting and Economics 54 (2012) 68–93 91
PIFRSit ¼ bIFRS
0 þbIFRS1 BVEIFRS
it þbIFRS2 NIIFRS
it þeIFRSit ðA1bÞ
RETURNUSit ¼ bUS
0 þbUS1 ½NIit=Pit�1�
USþbUS2 ½DNIit=Pit�1�
USþbUS3 LOSSUS
it
þbUS4 LOSSUS
it � ½NIit=Pit�1�USþbUS
5 LOSSUSit � ½DNIit=Pit�1�
USþeUSit ðA2aÞ
RETURNIFRSit ¼ bIFRS
0 þbIFRS1 ½NIit=Pit�1�
IFRSþbIFRS2 ½DNIit=Pit�1�
IFRSþbIFRS3 LOSSIFRS
it
þbIFRS4 LOSSIFRS
it � ½NIit=Pit�1�IFRSþbIFRS
5 LOSSIFRSit � ½DNIit=Pit�1�
IFRSþeIFRSit ðA2bÞ
CFUSitþ1 ¼ bUS
0 þbUS1 ½NIit=TAit�1�
USþeUSit ðA3aÞ
CFIFRSitþ1 ¼ bIFRS
0 þbIFRS1 ½NIit=TAit�1�
IFRSþeIFRSit ðA3bÞ
P is stock price, NI is net income before extraordinary items per share, BVE is book value of equity per share, andRETURN is the cumulative percentage change in stock price beginning nine months before fiscal year end and ending threemonths after fiscal year end, adjusted for dividends and stock splits, CF is operating cash flow scaled by lagged total assets,and TA is total assets. In the return equations, we permit the coefficients on NIt/Pt�1 and DNIt/Pt�1 to differ for loss firms(Hayn, 1995) using the indicator variable LOSS, which equals one if NIt/Pt�1 is negative, and zero otherwise. The coefficientsuperscripts, US and IFRS, denote the pricing multiples relating to the US or IFRS accounting system; the variablesuperscripts denote that the variable relates to a US or an IFRS firm.29 We estimate Eqs. (A1a), (A2a), and (A3a) includingindustry fixed effects and Eqs. (A1b), (A2b), and (A3b) including country and industry fixed effects.
Second, for each set of firms, i.e., US and IFRS firms, we calculate within-sample fitted stock price (stock return, cashflow). Third, for each set of firms, we calculate fitted stock price (stock return, cash flow) using the pricing multiples fromthe other set of firms. To implement these steps, we compute fitted prices, returns, and cash flow for US (IFRS) firms usingcoefficients estimated based on Eqs. (A1a), (A2a), and (A3a) ((A1b), (A2b), and (A3b)) as follows.
P̂US,US
it � b̂US
0 þ b̂US
1 BVEUSit þ b̂
US
2 NIUSit ðA4aÞ
P̂US,IFRS
it � b̂IFRS
0 þ b̂IFRS
1 BVEUSit þ b̂
IFRS
2 NIUSit ðA4bÞ
P̂IFRS,IFRS
it � b̂IFRS
0 þ b̂IFRS
1 BVEIFRSit þ b̂
IFRS
2 NIIFRSit ðA4cÞ
P̂IFRS,US
it � b̂US
0 þ b̂US
1 BVEIFRSit þ b̂
US
2 NIIFRSit ðA4dÞ
dRETURNUS,US
it � b̂US
0 þ b̂US
1 ½NIit=Pit�1�USþ b̂
US
2 ½DNIit=Pit�1�USþ b̂
US
3 LOSSUSit
þ b̂US
4 LOSSUSit � ½NIit=Pit�1�
USþ b̂US
5 LOSSUSit � ½DNIit=Pit�1�
US ðA5aÞ
dRETURNUS,IFRS
it � b̂IFRS
0 þ b̂IFRS
1 ½NIit=Pit�1�USþ b̂
IFRS
2 ½DNIit=Pit�1�USþ b̂
IFRS
3 LOSSUSit
þ b̂IFRS
4 LOSSUSit � ½NIit=Pit�1�
USþ b̂IFRS
5 LOSSUSit � ½DNIit=Pit�1�
US ðA5bÞ
dRETURNIFRS,IFRS
it � b̂IFRS
0 þ b̂IFRS
1 ½NIit=Pit�1�IFRSþ b̂
IFRS
2 ½DNIit=Pit�1�IFRSþ b̂
IFRS
3 LOSSIFRSit
þ b̂IFRS
4 LOSSIFRSit � ½NIit=Pit�1�
IFRSþ b̂IFRS
5 LOSSIFRSit�1 � ½DNIit=Pit�1�
IFRS ðA5cÞ
dRETURNIFRS,US
it � b̂US
0 þ b̂US
1 ½NIit=Pit�1�IFRSþ b̂
US
2 ½DNIit=Pit�1�IFRSþ b̂
US
3 LOSSIFRSit
þ b̂US
4 LOSSIFRSit � ½NIit=Pit�1�
IFRSþ b̂US
5 LOSSIFRSit�1 � ½DNIit=Pit�1�
IFRS ðA5dÞ
cCFUS,US
itþ1 � b̂US
0 þ b̂US
1 ½NIit=Pit�1�US ðA6aÞ
cCFUS,IFRS
itþ1 � b̂IFRS
0 þ b̂IFRS
1 ½NIit=Pit�1�US ðA6bÞ
29 When calculating accounting system comparability metrics before IFRS firms adopt IFRS, i.e., when they applied non-US domestic standards,
pricing multiples and accounting amounts relate to domestic standards, not IFRS.
M.E. Barth et al. / Journal of Accounting and Economics 54 (2012) 68–9392
cCFIFRS,IFRS
itþ1 � b̂IFRS
0 þ b̂IFRS
1 ½NIit=Pit�1�IFRS ðA6cÞ
cCFIFRS,US
itþ1 � b̂US
0 þ b̂US
1 ½NIit=Pit�1�IFRS ðA6dÞ
Fourth, for each set of firms, we calculate the absolute value of the difference between the fitted stock prices, stock returns,and cash flow obtained in the second and third steps. To implement this step, we compute the following firm–year differencesfor each US observation in Eqs. (A7a), (A8a), and (A9a) and for each IFRS observation in Eqs. (A7b), (A8b), and (A9b).
PRICE_DiffUSit � 9P̂
US,US
it �P̂US,IFRS
it 9 ðA7aÞ
PRICE_DiffIFRSit � 9P̂
IFRS,IFRS
it �P̂IFRS,US
it 9 ðA7bÞ
RETURN_DiffUSit � 9 dRETURN
US,US
it � dRETURNUS,IFRS
it 9 ðA8aÞ
RETURN_DiffIFRSit � 9 dRETURN
IFRS,IFRS
it � dRETURNIFRS,US
it 9 ðA8bÞ
CF_DiffUSit � 9cCF
US,US
it �cCFUS,IFRS
it 9 ðA9aÞ
CF_DiffIFRSit � 9cCF
IFRS,IFRS
it �cCFIFRS,US
it 9 ðA9bÞ
Fifth, for each IFRS and matched US firm–year pair, we average the differences in fitted stock price from Eqs. (A7a) and(A7b), the differences in stock return from Eqs. (A8a) and (A8b), and the differences in cash flow from Eqs. (A9a) and (A9b).
Sixth, we calculate our stock price, stock return, and cash flow comparability metrics as the mean, median, andstandard deviation of the average differences obtained in the fifth step appropriate for each comparability analysis weconduct.
References
Alford, A., Jones, J., Leftwich, R., Zmijewski, M., 1993. The relative information content of accounting disclosures in different countries. Journal ofAccounting Research 31 (Supplement), 183–223.
Armstrong, C.S., Barth, M.E., Jagolinzer, A.D., Riedl, E.J., 2010. Market reaction to the adoption of IFRS in Europe. The Accounting Review 85, 31–61.Ball, R., 1995. Making accounting more international: why, how, and how far will it go? Journal of Applied Corporate Finance 8, 19–29.Ball, R., 2006. International Financial Reporting Standards (IFRS): Pros and cons for investors. Accounting Business Research International Accounting
Policy Forum 5–27.Ball, R., Kothari, S.P., Robin, A., 2000. The effect of international institutional factors on properties of accounting earnings. Journal of Accounting and
Economics 29, 1–51.Ball, R., Robin, A., Wu, J.S., 2003. Incentives versus standards: properties of accounting income in four East Asian countries. Journal of Accounting and
Economics 36, 235–270.Ball, R., Shivakumar, L., 2005. Earnings quality in UK private firms: comparative loss recognition timeliness. Journal of Accounting and Economics 39,
83–128.Ball, R., Shivakumar, L., 2006. The role of accruals in asymmetrically timely gain and loss recognition. Journal of Accounting Research 44, 207–242.Barth, M.E., Landsman, W.R., Lang, M., 2008. International accounting standards and accounting quality. Journal of Accounting Research 46, 467–498.Bartov, E., Goldberg, S., Kim, M., 2005. Comparative value relevance among German, US and international accounting standards: a German stock market
perspective. Journal of Accounting, Auditing and Finance 20, 95–119.Bradshaw, M.T., Miller, G.S., 2008. Will harmonizing accounting standards really harmonize accounting? Evidence from non-US firms adopting US GAAP.
Journal of Accounting, Auditing and Finance 23, 233–263.Cairns, D., 1999. Degrees of compliance. Accountancy International September, 68–69.Daske, H., 2006. Economic benefits of adopting IFRS or US-GAAP — have the expected costs of equity capital really decreased? Journal of Business,
Finance, and Accounting 33, 329–373.Daske, H., L. Hail, C. Leuz, and R. Verdi. 2007. Adopting a label: heterogeneity in the economic consequences of IFRS adoptions. Working paper, Wharton
School.Daske, H., Hail, L., Leuz, C., Verdi, R., 2008. Mandatory IFRS reporting around the world: early evidence on the economic consequences. Journal of
Accounting Research 46, 1085–1142.Dechow, P.M., Dichev, I.D., 2002. The quality of accruals and earnings: the role of accrual estimation errors. The Accounting Review 77, 35–59.De Franco, G., Kothari, S.P., Verdi, R.S., 2011. The benefits of financial statement comparability. Journal of Accounting Research 49, 895–931.Ewert, R., Wagenhofer, A., 2005. Economic effects of tightening accounting standards to restrict earnings management. The Accounting Review 80,
1101–1124.Ewert, R., and A. Wagenhofer. 2009. Earnings quality metrics and what they measure. Working paper, University of Graz.Financial Accounting Foundation. 2009. Comment letter on the SEC Roadmap, March 11.Financial Accounting Standards Board. 2010. Statement of Financial Accounting Concepts No. 8, Conceptual Framework for Financial Reporting, Chapter 1,
The Objective of General Purpose Financial Reporting, and Chapter 3, Qualitative Characteristics of Useful Financial Information. Norwalk, CT,September.
Financial Accounting Standards Board and International Accounting Standards Board. 2008. Completing the February 2006 Memorandum ofUnderstanding: A Progress Report and Timetable for Completion. Norwalk, CT, and London, UK, September.
M.E. Barth et al. / Journal of Accounting and Economics 54 (2012) 68–93 93
Gordon, E.A., B.N. Jorgensen, and C.L. Linthicum. 2008. Could IFRS replace US GAAP? A comparison of earnings attributes and informativeness in the USmarket. Working paper.
Hail, L., Leuz, C., Wysocki, P., 2010a. Global accounting convergence and the potential adoption of IFRS by the US (Part I): Conceptual underpinnings andeconomic analysis. Accounting Horizons 24, 355–394.
Hail, L., Leuz, C., Wysocki, P., 2010b. Global accounting convergence and the potential adoption of IFRS by the US (Part II): Political factors and futurescenarios for US accounting standards. Accounting Horizons 24, 567–588.
Hayn, C., 1995. The information content of losses. Journal of Accounting and Economics 20, 125–153.Harris, M., Muller, K., 1999. The market valuation of IAS versus US GAAP accounting measures using form 20-F reconciliations. Journal of Accounting and
Economics 26, 285–312.Hughes, S.B., and J.F. Sander. 2008. The implications of IFRS adoption: the extent of convergence and consistency between IFRS and US GAAP net income.
Working paper.Hung, M., Subramanyam, K.R., 2007. Financial statement effects of adopting international accounting standards: the case of Germany. Review of
Accounting Studies 12, 623–657.International Accounting Standards Board, 2010. The Conceptual Framework for Financial Reporting 2010. IASB, London.Kothari, S.P., 2001. Capital markets research in accounting. Journal of Accounting and Economics 31, 105–231.Land, J., Lang, M., 2002. Empirical evidence on the evolution of international earnings. The Accounting Review 77, 115–134.Lang, M., Raedy, J., Yetman, M., 2003. How representative are firms that are cross listed in the United States? An analysis of accounting quality. Journal of
Accounting Research 41, 363–386.Lang, M., Raedy, J., Wilson, W., 2006. Earnings management and cross listing: are reconciled earnings comparable to US earnings? Journal of Accounting
and Economics 42, 255–283.La Porta, R., Lopez-de-Silanes, F., Shleifer, A., Vishny, R.W., 1998. Law and finance. Journal of Political Economy 106, 1113–1155.Leuz, C., 2003. IAS versus US GAAP: information asymmetry-based evidence from Germany’s New Market. Journal of Accounting Research 41, 445–472.Leuz, C., 2010. Different approaches to corporate reporting regulation: how jurisdictions differ and why. Accounting and Business Research 40, 229–256.Leuz, C., Nanda, D., Wysocki, P., 2003. Earnings management and investor protection: an international comparison. Journal of Financial Economics 69,
505–527.Leuz, C., Verrecchia, R., 2000. The economic consequences of increased disclosure. Journal of Accounting Research 38, 91–124.Myers, J.N., Myers, L.A., Skinner, D.J., 2007. Earnings momentum and earnings management. Journal of Accounting, Auditing and Finance 22, 249–284.Schipper, K., 2003. Principles-based accounting standards. Accounting Horizons (March), 61–72.Securities and Exchange Commission. 2007. Final Rule: Acceptance from Foreign Private Issuers of Financial Statements Prepared in Accordance with
International Financial Reporting Standards without Reconciliation to U.S. GAAP.Securities and Exchange Commission. 2008. Roadmap for the Potential Use of Financial Statements Prepared in Accordance with International Financial
Reporting Standards by U.S. Issuers; Proposed Rule.Securities and Exchange Commission. 2010. Commission Statement in Support of Convergence and Global Accounting Standards.Securities and Exchange Commission. 2011. Work Plan for the Consideration of Incorporating International Financial Reporting Standards into the
Financial Reporting System for U.S. Issuers; Exploring a Possible Method of Incorporation.Street, D. and S. Gray. 2001. Observance of international accounting standards: factors explaining non-compliance. ACCA Research Report No. 74.Van Tendeloo, B., Vanstraelen, A., 2005. Earnings management under German GAAP versus IFRS. European Accounting Review 14 (1), 155–180.Watts, R., Zimmerman, J., 1986. Positive Accounting Theory. Prentice-Hall, Upper Saddle River, New Jersey.Wysocki, P.D. 2009. Assessing earnings and accruals quality: US and international evidence. Working paper, MIT.