Embed Size (px)
Citation preview

Vol 23 No 3, 2012
Journal of the Australasian College of Road Safety
Formerly RoadWise – Australia’s First Road Safety Journal
Special feature: Safer speedsPeer-reviewed papers• Reflections on speed control from a public health
perspective • Automated speed enforcement in Australia:
Recent examples of the influence of public opinion on program sustainability
• Optimum speeds on rural roads based on ‘willingness to pay’ values of road trauma
Contributed articles• How unacceptable is speeding? Insights from
a Social Acceptability Survey in Victoria • Methods for measuring motorcycle speeds and
their implications for understanding ‘safe speeds’
In this issue -Peer-reviewed papers• Cautiousness in young rural and semi-rural drivers:
Are there influencing factors?• Understanding the fear of bicycle riding in Australia • The effectiveness of wire rope barriers in Victoria • Crash performance of safety barriers
on high-speed roads
Contributed articles• A dim view of pedestrian safety: Raising awareness
of the needs of vision-impaired pedestrians


Journal of the Australasian College of Road Safety – Volume 23 No.3, 2012
ContentsFrom the President
Letters to the Editor
Diary
College news
Peer-reviewed papers
Cautiousness in young rural and semi-rural drivers: Are there influencing factors?– PJ Knight, D Iverson and MF Harris
Understanding the fear of bicycle riding in Australia– E Fishman, S Washington and N Haworth
The effectiveness of wire rope barriers in Victoria– N Candappa, A D’Elia, S Newstead and B Corben
Crash performance of safety barriers on high-speed roads– C Jurewicz and L Steinmetz
Contributed articles
A dim view of pedestrian safety: Raising awareness of the needs of vision-impaired pedestrians– C Maplesden
Special feature: Safer speeds
Peer-reviewed papers
Reflections on speed control from a public health perspective– J McLean
Automated speed enforcement in Australia: Recent examples of the influence of public opinion on program sustainability– J Fleiter and B Watson
Optimum speeds on rural roads based on ‘willingness to pay’ values of road trauma– M Cameron
Contributed articles
How unacceptable is speeding? Insights from a Social Acceptability Survey in Victoria– M Nieuwesteeg
Methods for measuring motorcycle speeds and their implications for understanding ‘safe speeds’– D Walton
Literature review
Cover image
There’s no such thing as safe speeding.Speeding sign cartoon reprinted with kind permission of J Ditchburn www.inkcinct.com.au.
Disclaimer
Materials (papers, contributed articles, letters, advertisements and editorial) in this journal may not necessarily reflect the opinions of peer reviewers or the Australasian College of Road Safety, who disclaim all liability for any damages that may result from publication of any material and from persons acting on it.
5
5
7
8
12
19
27
37
45
51
59
67
75
79
84

Journal of the Australasian College of Road Safety – Volume 23 No.3, 2012
4
The Journal of the Australasian College of Road Safety(published as RoadWise from 1988-2004) ISSN 1832-9497.Published quarterly by the Australasian College of Road Safety.Managing Editor: Deborah Banks, ACRS, PO Box 198, Mawson, ACT 2607Phone +61 (0)2 6290 2509 Fax +61 (0)2 6290 0914 [email protected] Papers Editor: Prof Raphael Grzebieta, Chair of Road Safety, Transport and Road Safety (TARS) Research, UNSW, West Wing, 1st Floor, Old Main Building (K15), University of NSW, Sydney NSW 2052Phone +61 (0)2 9385 4479 Fax +61 (0)2 9385 [email protected] Safety Literature Editor: Andrew Scarce, Road Class,6 Oasis Gardens, Bendigo, Victoria 3550.Phone +61 (0)3 5442 5226, Mobile 0429 198 314 [email protected] boardDr Jennifer Clark University of New England, NSWDr Soames Job Executive Director, National Road Safety CouncilDr Nadine Levick Objective Safety LLC, New York, USDr Andrew McIntosh Adjunct Associate Prof, TARS, University of New South WalesDr Will Murray Research Director, Interactive Driving Systems, UKA/Prof George Rechnitzer CQ University; Adjunct Associate Prof, TARS, UNSWProf Michael Regan TARS, University of NSWProf Richard Tay Faculty of Law and Management, La Trobe University Prof Michael Taylor Transport Systems Centre, University of South AustraliaProf Barry Watson CARRS-Q, Queensland University of TechnologySubscriptionsAll issues of this journal are mailed to personal members or corporate delegates of the Australasian College of Road Safety. Organisations and persons who are not members of the College may subscribe to the journal on payment of an annual subscription. Advertising and sponsorshipAdvertising rates, specifications and deadlines are on the College website at www.acrs.org.au/publications/journaladvertisingkit.html or available by email from [email protected]. Discounts are available for prepaid advertising booked to run for more than one issue. The College also welcomes sponsorship of the journal. Our current sponsors are LB International, ANCAP, and New South Wales Government. For more information about becoming a journal sponsor, please contact the Executive Officer or Managing Editor.Editorial PolicyThe aim of the Journal of the Australasian College of Road Safety is to provide a medium for expression of views and debate on all facets of the study of road safety. Articles are accepted from a variety of disciplines, such as health and medicine, road and automotive engineering, education, law, behavioural sciences, communication, history, management, and urban and traffic planning. Interdisciplinary approaches are particularly welcome.The College encourages interested persons and organisations to submit articles, photographs or letters for publication. Published
letters would normally show the name of the writer and the state or territory of residence. The journal provides the opportunity for researchers to have their work submitted for peer review, in order to improve the quality of their research papers. However, peer review cannot guarantee the validity of research nor assure scientific quality. The publisher reserves the right to reject submissions or, with approval of the author, to edit articles. No payment is offered for articles published.Material in this journal may be cited with acknowledgement of the full reference, including the author, article title and the year and volume of the journal. For permission to reprint articles, please contact the Managing Editor.Important Information for authorsIt is essential that authors writing for the journal obtain and follow the ACRS Instructions for authors. These are updated regularly and can be downloaded from the College website at www.acrs.org.au/srcfiles/Instructions-for-authors-revised.pdf. Authors should check that they have complied with all requirements before submitting their papers. All papers must be in MS Word format and sent as email attachments to journaleditor.acrs.org.au. Articles must not exceed 5000 words in length and authors should state whether or not peer review is requested. Authors must indicate if their articles have been published previously or are under consideration by other publishers. The College has adopted guidelines developed by the Committee on Publication Ethics, which are available at http://publicationethics.org/guidelines. These guidelines include the Code of conduct; Best practice guidelines for journal editors; Guidelines for retracting articles; Guidelines for the board of directors of learned society journals; Guidance for editors: Research, audit and service evaluations; and How to handle authorship disputes: A guide for new researchers. By submitting a paper, authors give their permission to the College to make minor editorial changes to conform to the College in-house style manual; to print the paper in the Journal of the Australasian College of Road Safety; to send it for indexing to SafetyLit, Informit and other relevant databases; to make the full text of the paper available online through the ACRS website and Informit; and to promote the paper through media releases or by giving permission to re-print it in full or part in other hard copy or online resources that promote road safety. All photographs and diagrams for which the author or the author’s employing organisation does not hold copyright must be accompanied by permission from the copyright holder to be used as indicated above.ACRS office contact detailsSubmissions to the journal, and any queries or comments about journal content, should be addressed to the Managing Editor. Inquiries regarding journal subscriptions, changes of address and back issues should be addressed to the Finance and Administration Officer.Inquiries about membership and College activities should be directed to the Executive Officer. Staff: Ms Claire Howe, Executive Officer, [email protected] Ms Deborah Banks, Managing Editor, [email protected] Ms Christine Bethwaite, Finance and Administration, [email protected] address: PO Box 198, Mawson, ACT 2607 Australia Phone: (02) 6290 2509Head office: Pearce Centre, Collett Place, Pearce ACT AustraliaOffice hours: Tuesday 9.00am – 5.00pm; Wednesday and Thursday 9.00am – 3.00pm. Closed Monday and Friday. Messages may be left on voicemail when the office is unattended.

Journal of the Australasian College of Road Safety – Volume 23 No.3, 2012
5
Letters to the EditorSchool-based Safe Cycle program in the ACT
Dear Editor,
I am writing in response to the article A review of evaluations of bicycle safety education as a countermeasure for child cyclist injury which appeared in the recent Child Safety Special issue of the ACRS Journal.
I’m a teacher at Melba Copland Secondary School in Canberra and have been involved in school-based cycling activities for over ten years; more recently, I’ve been
involved in the implementation of ACT Health’s ‘active travel to school’ initiatives. I agree wholeheartedly with the sentiments expressed by the article’s author, Julie Hatfield, that ‘if children are encouraged to cycle there is an imperative to address cycling safety, both as a duty of care and by way of encouraging cycling’. My enthusiasm in encouraging students to cycle for recreation and transport is tempered by my understanding of the risks associated with this activity. Of particular interest to me was the point made about the importance of including ‘risk awareness’ and ‘behaviour or attitude improvements’ in education programs.
From the PresidentDear ACRS members,
This issue of the journal has a focus on safer speeds - one of the key pillars in the Safe System approach to reducing road trauma. The ACRS Journal is an important link in the translation of knowledge into action. There is an increasing awareness of appropriate speeds, the consequences
of speeding and the need to encourage drivers to understand the limitations of much of our current road system. The articles in this issue’s Special feature explore this theme. I am pleased to report an increasing level of leadership in road safety.On 27 June, the Parliamentary Secretary for Infrastructure and Transport, the Hon Catherine King MP, made a Statement to Parliament reporting on progress against the National Road Safety Strategy 2011-2020 (NRSS) target. It was also good to see the support for that Ministerial Statement by the Shadow Parliamentary Secretary for Roads and Regional Transport, Darren Chester MP.
Minister King noted the reduction in road deaths by 9.5% in the first year of the NRSS, which is a tribute to the work of so many in governments, business and the community.
There are many new and regular developments occurring in road safety. Here are just a few.
In Canberra, in May, the Minister addressed a forum on the progress made in terms of the UN Decade of Action; this forum was coordinated by ARRB Group and the College.
The minister has also convened a National Road Safety Forum to take place in August at Parliament House. This
will bring together key stakeholders to discuss some of the important road safety matters identified in the NRSS.The forum will also give attention to the problem of deaths and injuries to children in driveway run-over incidents, an issue of growing concern in Australia. This topic will be the theme of one of four concurrent sessions at the forum; other sessions will focus on vehicle safety: manufacturer initiatives, corporate responsibility for road safety, and graduated driver licensing.
In our upcoming conference in Sydney the theme is A Safe System: Expanding the reach! While substantial reductions in road trauma have been achieved in recent decades, not all road users have benefited equally. We will discuss papers covering a wide range of users and issues and we are striving to ensure that those road users in minority sectors are provided with equitable coverage in terms of research and improvements.
There have been many recent developments in technology and systems which will help reduce road trauma in accordance with the vision outlined in the NRSS. Many are simple, low cost and perhaps not readily recognised.In the last few months, we have seen research reports on the reduction in road crashes from the relatively new vehicle technology generally described as ‘autonomous emergency braking’. These reports are showing crash rate reductions of up to 25%. This is in the same order of reduction as has occurred with electronic stability control in vehicles. The development of lightweight anti-lock braking systems (ABS) for motorcycles is also showing promise as a crash reduction technology.
Many fronts are showing many positive solutions. We should be able to get to our Vision Zero, perhaps more quickly than we had thought.
Lauchlan McIntosh AM FACRSACRS President

Journal of the Australasian College of Road Safety – Volume 23 No.3, 2012
6
I would like to bring to your attention a cycling and road awareness curriculum called Safe Cycle that has been produced in Canberra at Melba Copland Secondary School. Safe Cycle is a school-based curriculum initiative that was written with support from the NRMA-ACT Road Safety Trust and in consultation with ACT teachers.
Initial testing of students involved in the pilot Safe Cycle program demonstrated a high level of familiarity with road rules and a number of students even demonstrated exceptional bike-handling skills. However, of most concern to me, and to other teachers experienced in working with young adolescent cyclists, was the danger these kids posed to themselves. Students demonstrated low awareness of hazards associated with cycling on roads (and multi-user paths) and lack of skills needed to make decisions with their own, and other people’s, safety in mind. We also found our students with lower bike-handling skills were more cautious in their riding, did not regularly use cycling for transport and were less likely to ride on roads. Less confident bike riders, due to their lower participation in cycling for transport, were less likely to be injured and equally less likely to gain the health benefits from active travel. Students with a higher degree of bike-handling skill were more likely to ride on roads, demonstrated over-confidence in their abilities, and were more likely to be engaged in risky behaviours whilst riding.
Risk awareness and protective behaviour development has been given almost equal placing with bike-handling skills in the Safe Cycle program. Safe Cycle uses a range of teaching strategies, including practical activities, theory, games and storytelling to engage students on multiple levels to raise their awareness of risks and to promote protective behaviour. Our understanding of the pitfalls associated with cycling and road awareness education, and the way we address these pitfalls, are vitally important in determining how successful such education programs can be. I feel schools are an avenue that can be used in the delivery of this type of curriculum and teachers can contribute to the successful development of education programs.
Education programs that include ‘risk awareness’ and ‘behaviour or attitude improvements’ have the potential to significantly contribute towards adolescent cyclists’ safety, though this is only one area of focus, along with infrastructure improvement and other non-infrastructure measures.
Kind regards
Terry EvestonMelba Copland Secondary School
Performance-shaping factors at railway level crossings
Dear Editor,
Understanding the causes of motorist behaviour at railway level crossings is important. During the years 2001-2009, there were 695 collisions between road vehicles and trains in Australia, resulting in 97 fatalities [1]. Scientific evaluation of road user behaviour, seeking to understand and address the causes of accidentsat level crossings, should embrace a variety of methods and research techniques. This letter outlines an approach that has the potential to advance knowledge and understanding of the determinants of level crossing safety.
In human factors and accident research, there is ample evidence that suggests the context of the system where human actions take place needs to be diligently examined [2,3,4]. The entire features of a context will determine the human behaviour and actions in that context. It is vital that human factors research endeavours to illuminate the causes of human actions in a particular situation. To demonstrate cause and effect for driver behaviour at level crossings requires integration with existing behavioural models and theories. It is unusual for there to be a single cause for an accident, and when a number of factors are involved, it is important to identify which factors contributed to the accident more than others. Accordingly, research is needed into the performance-shaping contexts that determine road user behaviour at level crossings.
Accident models can attempt to describe the relationships between causes and effects [5] and safety has been thought to arise from the relationships of system elements [6]. Therefore, it may not be possible to determine whether a level crossing is safe by investigating only one element of the level crossing. Statements about the probability of human error which are not supported by information about the context in which humans find themselves can also be misleading. Finally, while conclusions may be made about the behaviour of the human in one particular situation, the generalisations (external validity) are poor.
The context of human error involves the conditions in which the error occurs, including the situation preceding the error and existing throughout the error [7]. It has been argued that a shift in emphasis is needed from explaining what error occurred to a greater focus on understanding the mechanisms and factors that shape human behaviour (the performance-shaping mechanisms and context) [6].
To produce evidence for cause and effect relationships in human error, a high level of experimental control is required. Consequently, simulators have been used in a range of industries (e.g. aviation, medicine, trains)

Journal of the Australasian College of Road Safety – Volume 23 No.3, 2012
7
with this in mind. Simulators offer a situation close to reality and they afford particularly important insights into human performance, principally in low-frequency high-consequence circumstances. Research carried out in a car in reality is open to a number of threats to internal validity (eg. traffic, weather, timing of train arrival). In a driving simulator, these variables are under the examiner’s control and can be altered to offer a selection of scenarios to the participant (eg. daytime, raining, low train volume).The scenarios tested should be selected based on robust scientific hypotheses for the causes of human error at level crossings. The multiple contextual variables which are present at level crossings are included in safety assessment models all over the world; however, further experimental exploration of these factors is needed.
In conclusion, human actions during complex tasks such as driving through a level crossing are fundamentally context bound. Gaining theoretical models of human behaviour at level crossings may require an emphasis on the use of driving simulation to establish cause and effect relationships between performance-shaping contexts and road user performance. The enhanced knowledge about the context which produces driving safety or error can be used to influence interventions in terms of redesigning the level crossing interface, enforcement and education strategies, and enhancing the validity of current risk assessment models.
References
1. Australian Transport Safety Bureau, ATSB transport safety report: Rail statistics. Australian Rail Safety Occurrence Data 1 January 2001 to 31 December 2009. Australia Transport Safety Bureau, 2010.
2. Plant K, Stanton N. Why did the pilots shut down the wrong engine? Explaining errors in context using Schema Theory and the Perceptual Cycle Model. Safety Science, 2012. 50(2): p. 300-315.
3. DekkerS. The field guide to understanding human error / Sidney Dekker. 2006.
4. Woods D, Dekker S, Cook R. Behind Human Error. 2010: Ashgate.
5. Qureshi Z. A review of accident modelling approaches for complex critical sociotechnical systems. 2008, Defense Science and Technology Organisation.
6. Leveson N. A new accident model for engineering safer systems. Safety Science, 2004. 42(4): p. 237-270.
7. Leiden K, Keller J, French J. Context of human error in commercial aviation. 2001. National Aeronautics and Space Administration, Ames Research Center.
Matthew GildersleeveQueensland University of TechnologyBrisbane
Have your say. The ACRS Journal provides a medium for the expression of views and the sharing of information about road safety. Readers are welcome to submit letters for consideration for publication in the Letters to the Editor section of the journal. Letters may be on any road safety issue and should be no more than 600 words in length. Write to the Managing Editor at PO Box 198, Mawson, ACT 2607 or email [email protected]. Views expressed on the letters page are not necessarily those of the ACRS.
Diary20-21 September 2012Gold Coast, Queensland.Occupational Safety in Transport (OSIT) Conference. http://ositconference.com.
1-4 October 2012Wellington, New Zealand.World Health Organization Safety Conference. www.conference.co.nz/worldsafety2012.
4-6 October 2012Wellington, New Zealand.Australasian Road Safety Research, Policing and Education Conference. http://rsw2012.transport.govt.nz.
1-2 November 2012New Delhi, India. 7th IRF Regional Conference – Road safety in urban and rural roads.
9-25 November 2012United Kingdom. Road Safety Week UK – Slower speeds = Happy people. www.roadsafetyweek.org.uk.

Journal of the Australasian College of Road Safety – Volume 23 No.3, 2012
8
2012 ACRS conferenceThe ACRS national conference was held in Sydney on August 9 and 10. This year’s theme was A Safe System: Expanding the reach. ACRS President Lauchlan McIntosh and Conference Chair A/Prof Teresa Senserrick opened the conference, followed by a video address by ACRS patron, Her Excellency Ms Quentin Bryce, the Governor-General. The Hon Catherine King MP, Parliamentary Secretary for Infrastructure and Transport, also made an address. Keynote speakers included Dr Anne McCartt , Senior Vice President - Research, Insurance Institute for Highway Safety, Arlington, Virginia. The conference was attended by around 200 delegates; presentations focused on various key components of the Safe System approach. Awards were presented for best practitioner paper (awarded to Chris Freethy of VicRoads for his paper on the L2P learner driver mentor program) and best research paper (Robert Anderson and Giulio Ponte of CASR for their work on structural incompatibility and injury risks in passenger vehicle crashes).
ACRS Fellowship awarded to Lori Mooren
Each year since 1992, the College has recognised an ACRS member who has made an outstanding contribution to the work of the College and to the cause of road safety. This member is awarded an ACRS Fellowship.
The 2012 ACRS Fellowship was awarded to Ms Lori Mooren, a senior research fellow at
Transport and Road Safety (TARS) at the University of New South Wales. In her role at TARS, Lori’s primary focus is an ongoing research program which aims to develop and test safety management systems and interventions to improve work-related driving safety, with a particular focus on the heavy vehicle transport sector. Formerly a road safety practitioner with over twenty years’ experience in both the public and private sectors, Lori was a founding member of the NSW (Sydney) Chapter of the ACRS and was a longstanding executive member of the chapter. Last year Lori guest edited a Special Issue of the ACRS Journal which highlighted heavy vehicle safety and which drew welcome media attention to this important aspect of road safety.
Lori was presented with the ACRS Fellowship award at the conference dinner by ACRS President, Lauchlan McIntosh.
3M-ACRS Diamond Road Safety Award 2012
The winning entry in the second 3M-ACRS Diamond Road Safety Award was announced at the conference dinner in Sydney on August 9. Entries for the award were sought from road safety practitioners who could show that their highly innovative and effective initiatives or projects could deliver significant improvements in road safety. Entries were received from individuals and from groups, and covered a diverse range of innovative ideas designed to save lives and injuries on our roads.
This year’s winner is an action and advocacy group known as the Transportation of Children and Youth with Additional Needs (TOCAN) partnership. The TOCAN partnership – a representative group of industry members, practitioners and policy-makers – was established to address the important issue of the safe transportation of children with additional needs, recognising that these children require special consideration when travelling as passengers in motor vehicles. The group aims to promote research, influence policy, raise community awareness, and provide advice and support to parents and carers about the safe transportation of children with additional needs, including information and advice about appropriate child restraints.
The TOCAN team’s leader, Ms Barbara Minuzzo, accepted the award on behalf of the group. One member of the TOCAN partnership will receive a trip to the United States to attend the 43rd American Traffic Safety Services Association Annual Convention and Traffic Expo 2013 (San Diego) and to visit 3M Global Headquarters in Minneapolis.
Congratulations to the members of the TOCAN partnership, and to all entrants.
College news
Journal of the Australasian College of Road Safety – Volume 23 No.3, 2012
9
Chapter ReportsVictoria
The Victorian Chapter held its Annual General Meeting on May 1, 2012. We welcomed to the Executive Committee Melinda Congiu as Deputy Chair, Greg Rowe as Secretary and Anne Harris as Treasurer. These new members bring new ideas and opportunities to our Chapter, and I look forward to working closely with them. I would like to thank outgoing members David Healy and David Skewes for their years of contributions and commitment to the College. I am pleased they will remain active members in the Victorian Chapter.
A seminar on Everything you need to know about unlicensed driving was held on April 21, 2012. The seminar featured the following speakers and presentations:
• The crash involvement of unlicensed drivers in Queensland - Professor Barry Watson, CARRS-Q• Unauthorised drivers and riders in fatal and serious injury accidents in Victoria - John Catchpole, ARRB• Automatic Number Plate Recognition (ANPR) Technology - Trent Rhodes, Victoria Police
The seminar attracted approximately 35 attendees and the presentations generated some interesting questions and discussions. A big thank you to the presenters, and to VicRoads for their contribution to the seminar.
Finally, the Victorian Chapter already has a few more seminars planned and we are looking forward to another successful year!
Jessica Truong, Victorian Chapter Representative
New South Wales
Just a brief report this issue to thank everyone who is working hard to make the 2012 ACRS National Conference a great success in Sydney this August. This especially includes the national office and the NSW (Sydney) Chapter Executive, as well as the National Executive and, of course, conference organiser Ruth Lillian. Many other members have also kindly assisted with abstract and paper reviews. We have been rewarded by many and varied sponsorships for which we are extremely grateful. I look forward to reporting on the success of the conference in the next issue.
A/Prof Teresa Senserrick, NSW (Sydney) Chapter Chair and Representative on the National ACRS Executive Committee
Queensland
The Queensland Chapter held its Annual General Meeting and Chapter meeting on July 10, 2012. The seminar preceding the AGM was presented by Dr Nerida Leal, Principal Behavioural Scientist, Department of Transport and Main Roads, Queensland. Dr Leal was the 2009 recipient of the ACRS-Q Road Safety Award for the best PY40/41 student. The presentation was titled My experience of the program and how it helped with where I am today.
Members of the Executive Committee elected at the AGM are: Chair – Dr Kerry Armstrong, Deputy Chair – Mr Lyle Schefe, Secretary/Treasurer – Ms Veronica Baldwin, Committee members – Mr Graham Smith, Ms Monique Grigg, Ms Pam Palmer, Dr Nerida Leal, Dr Mark Kingand Mr Joel Tucker.
The next quarterly seminar and Chapter meeting will be held on Tuesday, September 4, 2012.
Dr Kerry Armstrong, Queensland Chapter Chair and Representative on the ACRS Executive Committee
Australian Capital Territory
The ACT and Region Chapter met in July to elect members to committee positions. Eric Chalmers was elected Chapter Chair, with Keith Wheatley accepting the role of Secretary, Simon Abbott in the role of Treasurer and Lucienne Kleisen as the chapter’s representative on the National Executive. Members discussed plans to organise a number of seminars/workshops during the next 12 months, with a focus on speed, safety on rural roads in the ACT, safe cycling and young drivers.
Safer speeds newsNRSS ‘safe speeds’ agenda – update on progress in the first year
The National Road Safety Strategy 2011-2020 (NRSS), released in May last year, identified four key areas, or ‘cornerstones’, for attention and action during the decade. One of these cornerstones is safe speeds. In accordance with Safe System principles, and through various measures, the NRSS safe speeds agenda aims to (i) achieve speed limits that reflect a better balance between safety and mobility, (ii) set speed limits that are appropriate in the context of the road function and environment, and (iii) increase driver compliance with speed limits, particularly on high traffic or high-risk sections of the road network. States and territories have developed their own road safety strategies and action plans to accomplish this.

Journal of the Australasian College of Road Safety – Volume 23 No.3, 2012
10
A number of NRSS actions are focused on the development and implementation of risk-based speed limits. At a national level, Austroads is developing national guidelines for setting speed limits at high-risk locations and further work is planned to underpin the adoption of best practice speed limits. The issue of speed limits is also receiving attention at state and territory level, where various measures are being taken to identify and implement safer speed limits in both rural and urban areas.
In December last year, for example, the South Australian Government reduced speed limits from 110 km/h to a default 100 km/h on rural roads within 100 kilometres of Adelaide and on the Yorke peninsula.
In the Australian Capital Territory, as a result of a trial of lower speed limits in two local town centres with high levels of pedestrian (and cyclist) activity, the ACT Government recently announced its intention to implement 40 km/h zones in these areas on a permanent basis. The government also plans to extend the 40 km/h speed limits to other town centres in the territory.
Moreover, all Australian states and territories are taking steps to strengthen their speed enforcement programs. In most jurisdictions, this includes the introduction or expansion of point-to-point speed camera systems. Most are also reviewing their sanctions for speeding offences.
South Australia, for instance, will increase demerit points for lower level speeding offences and implement significantly higher penalties (increased demerit points and increased fines) for more serious speeding offences from September this year.
Following a Design Study that was completed in 2010, the ACT Government introduced the ACT’s first point-to-point speed camera system in February 2012 on a high traffic/high crash risk stretch of road. The government plans to progressively install further point-to-point cameras at other locations in the ACT, selecting sites via a methodology that uses a 50:50 weighting of traffic volume and safety factors.
Cameras are due to be operational at the next selected site before the end of the year.
The NSW Government recently announced an improved speed camera strategy which will expand the mobile speed camera program, increasing the number of mobile speed camera vehicles and improving visibility and signage. About 500 high-risk locations in NSW have been identified for increased enforcement activity. The program will also increase the number of intersection sites with red-light speed cameras. NSW Minister for Roads and Ports, Duncan Gay, made a commitment that all funds raised via speed, red-light and point-to-point cameras will be used to improve road safety. The government will monitor and review the speed camera locations, collect information on the effectiveness of the cameras and consider other road safety alternatives where these are indicated. Also, two additional point-to-point enforcement lengths have been implemented on sections of the Pacific Highway.
Queensland’s first point-to-point speed cameras began operating at the end of 2011, on a 14-kilometre stretch of the Bruce Highway identified as a high-crash zone. Point-to-point technology will also be used to manage speed in the new Brisbane Airport Link Tunnel which opened to traffic on August 1.
The NRSS also identifies the need for improved management of heavy vehicle speeding, including the prosecution of heavy vehicle speeding offences under the Chain of Responsibility laws. The new National Heavy Vehicle Regulator, which is expected to play a key role in addressing speed issues in the heavy transport sector, is due to commence operations in January 2013.
The cross-jurisdictional Australasian Intelligent Speed Assist Initiative is facilitating the implementation of intelligent speed adaptation technology (ISA). Work is underway to develop suitable speed limit maps and to investigate the potential role of ISA in managing high-risk drivers and repeat speeding offenders.
A review of state and territory campaigns and information resources is being undertaken to support the development of a national public education initiative on speed issues.
Editor’s note: Thank you to John Goldsworthy from the Department of Infrastructure and Transport for his assistance in preparing this update.
Speed limiter enforcement - crackdowns on rogues in the heavy vehicle transport sector
Recently, the NSW Government has made an unprecedented effort to target and charge companies that have tampered with speed limiting devices installed in heavy vehicles. This has been a cooperative approach by Roads and Maritime Services (RMS) and the NSW Police Force. Throughout the month of May, enforcement agencies worked together on a national program called Operation Austrans which was developed to target regulatory compliance for heavy vehicle safety.
A strategically-placed sign which is part of the ACT’s roadside advertising strategy designed to remind drivers to maintain safe speeds.

Journal of the Australasian College of Road Safety – Volume 23 No.3, 2012
11
The NSW Government signalled its intention to put more resources towards enforcing the Chain of Responsibility transport law provisions that came into effect last year.The Chain of Responsibility means that all parties in the road transport supply chain – not just the drivers and operators – are responsible for preventing any breaches of road transport laws. The strategy adopted by the enforcement authorities was one that, in the first instance, targeted the transport companies that appeared to be breaching safety laws in a serious and deliberate way. ‘Tamperproof’ speed limiters are required by Australian Design Rules (ADR) to be fitted to all heavy vehicles in Australia. When heavy vehicles are detected travelling at speeds well in excess of the speed limit specified in the ADR, this suggests that the speed limiter was not operating correctly. This can be a result of a defect in the device, or it can mean that the device was altered somehow to enable the vehicle to travel at speeds beyond the limit set by the manufacturer.
A range of actions already planned or underway were further strengthened following the tragic deaths of a family travelling in a light vehicle where a heavy vehicle was speeding. The enforcement authorities began to proactively investigate vehicles that appeared to exceed the speeds that the speed limiter design rules require. Beyond this action, where evidence suggested that a driver or company had deliberately tampered with the speed limiter, joint investigations were carried out by RMS and NSW Police officers. During these ‘raids’, all vehicles operated by the companies were inspected and those vehicles found to be in breach of the speed limiter requirements were taken off the road until the manufacturer advised that the limiters were put back to the original specifications. Currently there are ten companies under investigation.
The media has covered stories about some of these investigations. There was widespread media coverage of a tragic crash involving a B-Double crossing over into the oncoming traffic and colliding with a light vehicle, killing three people, in January this year. This drew community attention to the problem of heavy vehicle crashes. Trucking industry magazine Australasian Transport News reported that Lennon Transport Services, the company whose driver was involved in this crash, was thoroughly investigated by the authorities under Chain of Responsibility provisions. Assistant Commissioner John Hartley told Australasian Transport News that ‘police believe speed tampering of trucks has been company sanctioned’.
More recently, Australasian Transport News reported on the results of Operation Austrans, saying that NSW police were concerned that, despite a well-publicised enforcement campaign, 535 truck drivers were pulled up for speeding and 499 vehicle defects were detected. In addition, 210 seatbelt offences were recorded and there were 118 instances of unlicensed, suspended or disqualified drivers
driving trucks. RMS General Manager, Paul Endycott, advises that the crackdowns will not stop until there is a change of behaviour in the industry.
However, in recognition that the extreme rogue behaviour in the industry is likely to be confined to a small minority of heavy vehicle operators, RMS sought to consult respected industry leaders on what else can be done to stop speed limiter tampering. In June, RMS and NSW Police hosted a speeding compliance leadership forum in Sydney. At this forum, delegates voiced resounding support for the continuance of the joint enforcement operations by RMS and the police. As industry leader and safety advocate Ron Finemore said ‘It’s like football. The referee decides how tough to enforce the rules and the players adapt’.
Lori Mooren, Transport and Road Safety (TARS), UNSW
Other newsNRMA-ACT Road Safety Trust’s 2012-2013 Grants program
The NRMA-ACT Road Safety Trust will invest almost $400,000 in a range of road safety projects, with three of these projects focused on speed. The Chair of the Trust, Professor Don Aitkin, said that of the nine grants awarded, three will deal with speed – one of the areas of serious concern in the ACT and region and identified as a priority in the recent round of funding, while three other projects will focus on drink, drug and unlicensed driving.
The largest grant has been awarded to ACT Policing for research on speeding behaviour which will inform ACT Policing’s traffic enforcement strategies. The Trust looks forward to the benefits this project will bring to all ACT and region road users and the local road safety community. A La Trobe University researcher will investigate Strengthening the effectiveness of intersection safety cameras in another speed- related project.
Another project will look at crashes involving ACT drivers in NSW. The ARRB group will investigate the characteristics of casualty crashes involving ACT drivers in NSW, conduct time series modelling of crashes against relevant interventions over the last ten years, and analyse the frequency and nature of casualty crashes on popular commuter routes around Canberra, such as the Barton and Kings Highways.

Journal of the Australasian College of Road Safety – Volume 23 No.3, 2012
12
New Guide to safe vehicle travel for wheelchair users
A new resource for wheelchair users and carers, Wheels within wheels, has been produced with funding support from the NRMA-ACT Road Safety Trust. The guide includes advice on a range of issues relating to safe travel in vehicles such as choosing a wheelchair, wheelchair restraint systems, transfer equipment such as hoists and ramps, safe
parking, legal and insurance issues, and contact details for suppliers and service providers.
Wheels within wheels is available online atwww.roadsafetytrust.org.au/wheels, or the printed version of the booklet may be obtained free of charge from the Secretary/Manager, NRMA-ACT Road Safety Trust, [email protected] or phone 02 6207 7151.
Abstract
All drivers have to be prepared for driving with changed conditions, either intrinsic or external to the vehicle. This study explores factors influencing the cautiousness while driving of high school students in a rural and small semi-rural town community in New South Wales. Perceptions of caution in response to a range of different conditions including driving with passengers, bad weather, driving an unfamiliar car, poor road conditions, driving in heavy traffic and darkness – all conditions which have the potential to affect driving style or speed – were reported.
Many of the young rural students reported having started to drive at a very young age (often off-road). This reduced their reported perceptions of caution in their later driving, on-road, post-licence. Previous involvement in a crash was linked with a less cautious approach to changed lighting conditions when driving. Targeted road safety campaigns for young rural drivers may be needed which focus upon promoting specific rural road hazard perception and awareness of the implications of speed and changed road conditions on driving style and cautiousness.
Keywords
Cautiousness, Rural, Young drivers
Peer-reviewed papers
Introduction
Young drivers continue to be over-represented in crashes worldwide [1]. This is also the case in Australia [2, 3]. Despite an overall declining trend in crash rates over the last ten years [4], young rural drivers still have a higher risk of crash involvement than urban young drivers [5,6]. Although there are numerous potential causal factors, such as lack of experience [3], passengers, fatigue, and poor vehicle control [7], the influence of ‘protective’ attitudinal factors which might mitigate high risk driving behaviours has not been extensively researched.
Driving behaviours are influenced by many factors, with motivation defining the goals or purposes of driving [8].A study conducted with licensed young people serving in the defence forces in Israel linked cautiousness with self image [8]. Cautiousness – defined here as the considered response to a change in conditions which may influence driving behaviours – and confidence are contrasting factors which may be at opposing ends of a spectrum of motivational factors that influence driving behaviour, with over-confidence predicting higher risk-taking driving behaviour [8]. That study also demonstrated linkages between young people’s views of the cost and benefit of driving with their own views of themselves as drivers.Mood states have been linked to risk taking in driving in a United States-based study [9]. In relation to vehicle
Cautiousness in young rural and semi-rural drivers: Are there influencing factors?by P J Knight1, D Iverson2 and M F Harris3
1University of New South Wales, University of Wollongong (corresponding author)2Pro Vice Chancellor, Health, University of Wollongong 3Executive Director, Centre for Primary Health Care and Equity, University of New South Wales
Journal of the Australasian College of Road Safety – Volume 23 No.3, 2012
13
manoeuvring, mood states of anger-hostility, tension-anxiety and depression-dejection were negatively linked to cautiousness. These linkages were only demonstrated in the young drivers in the study. An unexpected finding was that personality traits were not linked with driving behaviours.
In a national survey of teen drivers in the US [10], protective factors to driving risk were identified. When cautiousness was measured in relation to specific driving manoeuvres or compared to all aspects of driving, a higher cautiousness value was found for males than females. Another study related cautiousness to driving styles [11]. Caution about breaking driving rules was found to be constrained by parental supervision, with those who had the most restrictive supervision having the most cautious attitudes.
A cautious driving style might be a factor that limits high risk behaviours while driving [8]. Driving styles may be influenced by the driving styles of parents of new drivers, as well as by the young driver’s personality [12]. Thus links exist between parental driving styles and those of the new driver, with anxiety and anger being the most significant traits. In the authors’ previous qualitative research [13] some trends and perspectives of young rural Australian people were identified. Young rural and semi-rural drivers appear to have quite different early driving experiences from those in urban areas and this influences their attitudes and behaviour. The aim of this study was to explore the extent to which high school students reported being cautious while driving, and to consider factors that might predict self-reported cautiousness across a range of different driving situations.
Method
Context
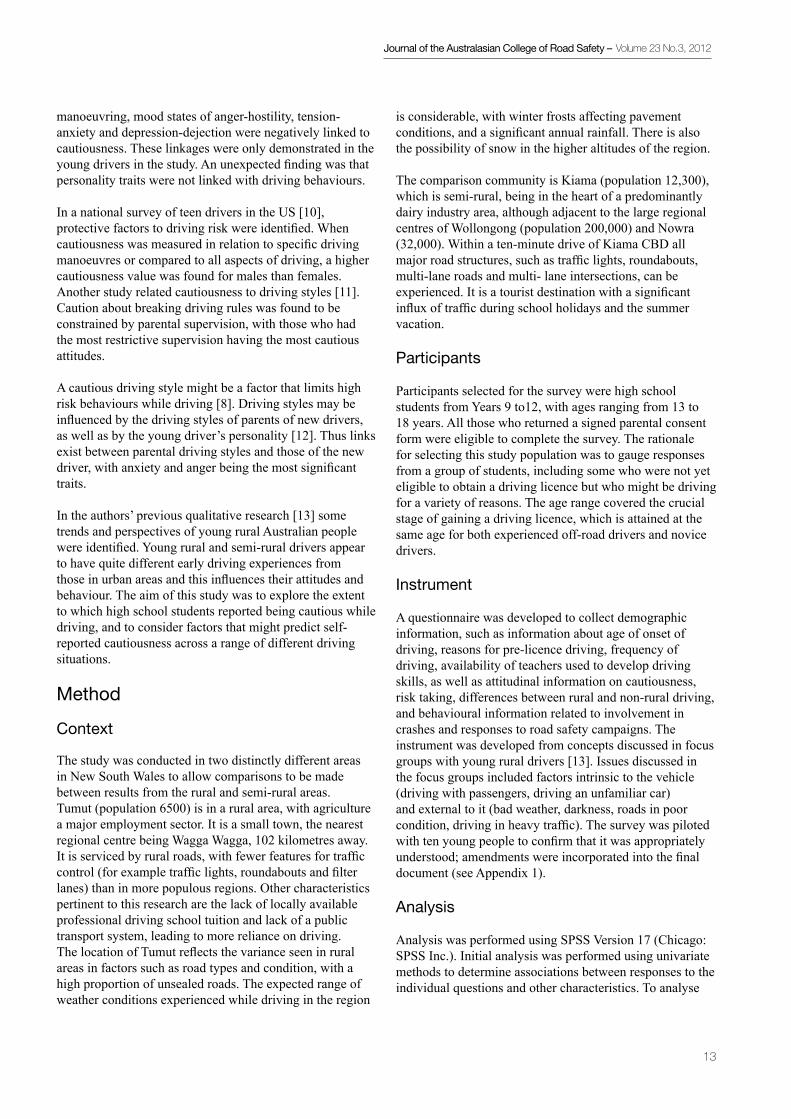
The study was conducted in two distinctly different areas in New South Wales to allow comparisons to be made between results from the rural and semi-rural areas. Tumut (population 6500) is in a rural area, with agriculture a major employment sector. It is a small town, the nearest regional centre being Wagga Wagga, 102 kilometres away. It is serviced by rural roads, with fewer features for traffic control (for example traffic lights, roundabouts and filter lanes) than in more populous regions. Other characteristics pertinent to this research are the lack of locally available professional driving school tuition and lack of a public transport system, leading to more reliance on driving. The location of Tumut reflects the variance seen in rural areas in factors such as road types and condition, with a high proportion of unsealed roads. The expected range of weather conditions experienced while driving in the region
is considerable, with winter frosts affecting pavement conditions, and a significant annual rainfall. There is also the possibility of snow in the higher altitudes of the region.
The comparison community is Kiama (population 12,300), which is semi-rural, being in the heart of a predominantly dairy industry area, although adjacent to the large regional centres of Wollongong (population 200,000) and Nowra (32,000). Within a ten-minute drive of Kiama CBD all major road structures, such as traffic lights, roundabouts, multi-lane roads and multi- lane intersections, can be experienced. It is a tourist destination with a significant influx of traffic during school holidays and the summer vacation.
Participants
Participants selected for the survey were high school students from Years 9 to12, with ages ranging from 13 to 18 years. All those who returned a signed parental consent form were eligible to complete the survey. The rationale for selecting this study population was to gauge responses from a group of students, including some who were not yet eligible to obtain a driving licence but who might be driving for a variety of reasons. The age range covered the crucial stage of gaining a driving licence, which is attained at the same age for both experienced off-road drivers and novice drivers.
Instrument
A questionnaire was developed to collect demographic information, such as information about age of onset of driving, reasons for pre-licence driving, frequency of driving, availability of teachers used to develop driving skills, as well as attitudinal information on cautiousness, risk taking, differences between rural and non-rural driving, and behavioural information related to involvement in crashes and responses to road safety campaigns. The instrument was developed from concepts discussed in focus groups with young rural drivers [13]. Issues discussed in the focus groups included factors intrinsic to the vehicle (driving with passengers, driving an unfamiliar car) and external to it (bad weather, darkness, roads in poor condition, driving in heavy traffic). The survey was piloted with ten young people to confirm that it was appropriately understood; amendments were incorporated into the final document (see Appendix 1).
Analysis
Analysis was performed using SPSS Version 17 (Chicago: SPSS Inc.). Initial analysis was performed using univariate methods to determine associations between responses to the individual questions and other characteristics. To analyse
Journal of the Australasian College of Road Safety – Volume 23 No.3, 2012
14
the data, responses to the five-point scale used in the survey (‘would never’, ‘would rarely’, ‘would sometimes’, ‘would often’ and ‘would always affect my driving’) were grouped. The three response options representing a less cautious view (would never, rarely or sometimes affect my driving) were grouped, and contrasted against the other two response options (would often, and would always affect my driving) representing a more cautious view. Associations between these response groups and location of school, age started driving, gender, and previous involvement in a crash as driver were evaluated using a Chi Square test.
Principal component analysis was performed on the six ‘cautiousness’ questions after excluding missing variables. A one-factor solution with an eigen value of 3.748 explained 62% of the variance. This suggested that the variables could be summed and averaged to give a total ‘cautiousness’ score. This score was then examined for association with the location of school, gender, whether grew up on a property, age when started to drive, whether father taught the child to drive, and previous involvement in a crash as driver or passenger, using multivariate regression.
Ethics
Prior to use of the survey instrument, permissions were obtained from the Human Research Ethics Committee at UNSW and the NSW Government Department of Education and Training Ethics in Schools Research Committee.
Results
The survey was completed by 217 high school students in Tumut and 235 students in Kiama, representing 82% and 74% of the students in the relevant age groups within the schools surveyed, respectively. Those who did not respond to the survey were either not at school on the day of the survey’s administration, or had not returned parental permission letters to take part in the survey.
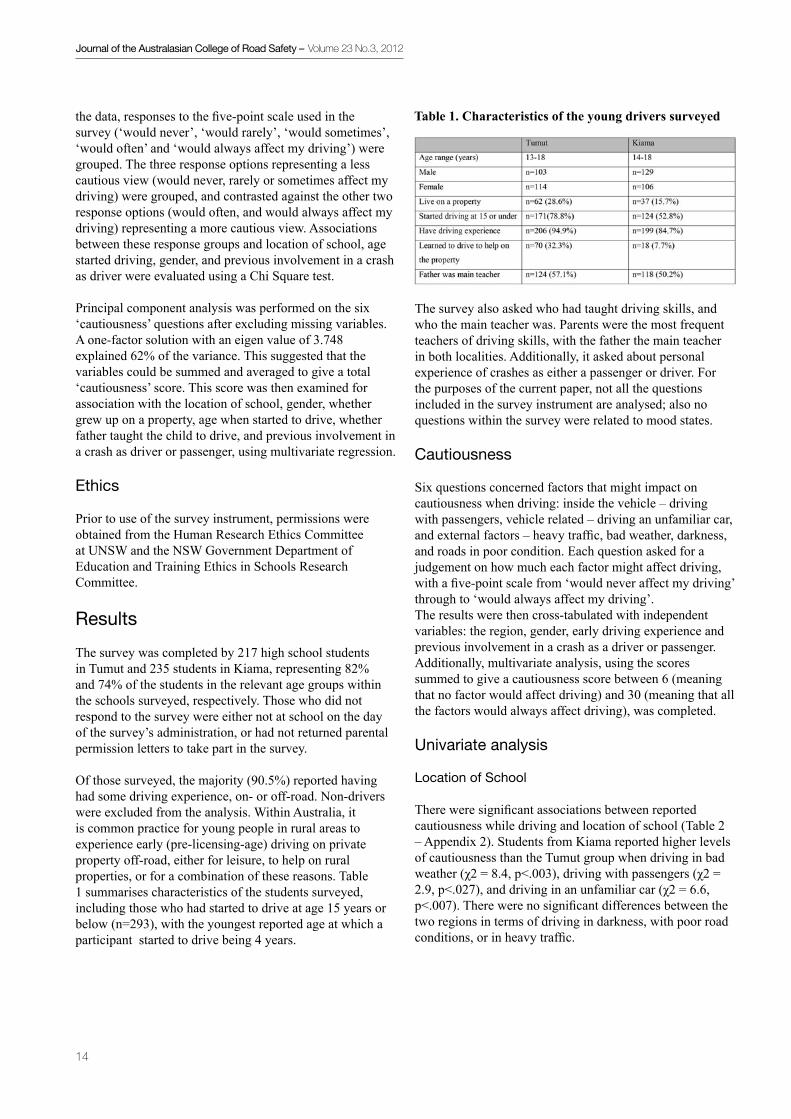
Of those surveyed, the majority (90.5%) reported having had some driving experience, on- or off-road. Non-drivers were excluded from the analysis. Within Australia, it is common practice for young people in rural areas to experience early (pre-licensing-age) driving on private property off-road, either for leisure, to help on rural properties, or for a combination of these reasons. Table 1 summarises characteristics of the students surveyed, including those who had started to drive at age 15 years or below (n=293), with the youngest reported age at which a participant started to drive being 4 years.
The survey also asked who had taught driving skills, and who the main teacher was. Parents were the most frequent teachers of driving skills, with the father the main teacher in both localities. Additionally, it asked about personal experience of crashes as either a passenger or driver. For the purposes of the current paper, not all the questions included in the survey instrument are analysed; also no questions within the survey were related to mood states.
Cautiousness
Six questions concerned factors that might impact on cautiousness when driving: inside the vehicle – driving with passengers, vehicle related – driving an unfamiliar car, and external factors – heavy traffic, bad weather, darkness, and roads in poor condition. Each question asked for a judgement on how much each factor might affect driving, with a five-point scale from ‘would never affect my driving’ through to ‘would always affect my driving’.The results were then cross-tabulated with independent variables: the region, gender, early driving experience and previous involvement in a crash as a driver or passenger. Additionally, multivariate analysis, using the scores summed to give a cautiousness score between 6 (meaning that no factor would affect driving) and 30 (meaning that all the factors would always affect driving), was completed. Univariate analysis
Location of School
There were significant associations between reported cautiousness while driving and location of school (Table 2 – Appendix 2). Students from Kiama reported higher levels of cautiousness than the Tumut group when driving in bad weather (χ2 = 8.4, p<.003), driving with passengers (χ2 = 2.9, p<.027), and driving in an unfamiliar car (χ2 = 6.6, p<.007). There were no significant differences between the two regions in terms of driving in darkness, with poor road conditions, or in heavy traffic.
Table 1. Characteristics of the young drivers surveyed
Journal of the Australasian College of Road Safety – Volume 23 No.3, 2012
15
Age started to drive
Students who started to drive at a younger age were less likely to report high levels of cautiousness. Students who started to drive at or below 12 years of age (which is four years before the licensing age for drivers in NSW) were more likely to report that the following would rarely or never affect their driving, compared with those who started after 12 years of age:
• bad weather (39.9% compared to 20.9% χ2 = 27.8, p<0.001) • driving with passengers (70.7% compared to 53.1% χ2 = 18.8, p=0.001) • darkness (49.4% compared to 40.7% χ2 = 12.7, p=0.01)• road conditions (50.8% compared to 30.3% χ2 = 21.8, p<0.001• driving an unfamiliar car (39.9% compared to 20.9% χ2 = 27.8, p<0.001).
There was no association between age of starting to drive and level of cautiousness in heavy traffic.
Gender influences
There was a significant association between gender and cautious driving with poor road conditions, with males being significantly less cautious in their attitudes than females (72.5% compared to 63.9% χ2 = 3.6, p<.037). There were no other significant differences by gender.
Previous involvement in a crash, as a driver
There was a significant negative association between previous involvement in a road crash as a driver and reported cautious driving in relation to driving in darkness. Those who had previous crash experience were less likely to report greater caution in darkness (92.3% compared to 75.7% χ2 = 3.8, p<.035). There were no significant associations between previous involvement in a crash and other cautious driving indicators.
Multiple regression analysis
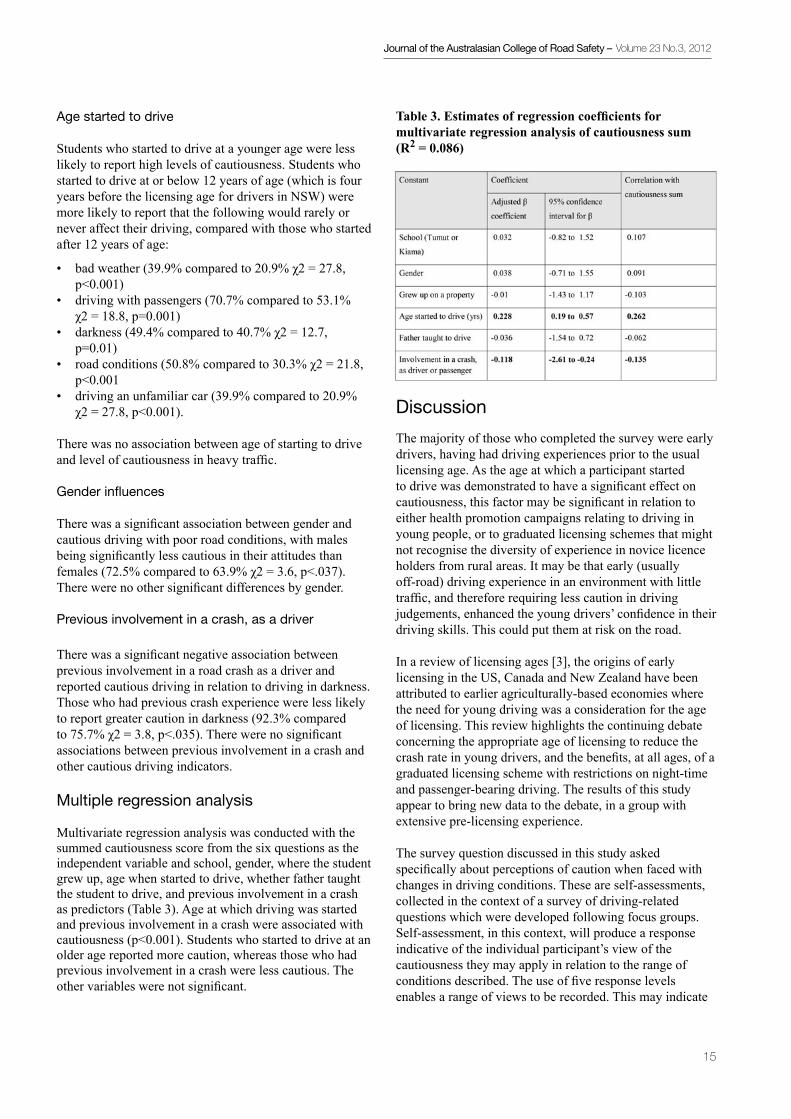
Multivariate regression analysis was conducted with the summed cautiousness score from the six questions as the independent variable and school, gender, where the student grew up, age when started to drive, whether father taught the student to drive, and previous involvement in a crash as predictors (Table 3). Age at which driving was started and previous involvement in a crash were associated with cautiousness (p<0.001). Students who started to drive at an older age reported more caution, whereas those who had previous involvement in a crash were less cautious. The other variables were not significant.
Discussion
The majority of those who completed the survey were early drivers, having had driving experiences prior to the usual licensing age. As the age at which a participant started to drive was demonstrated to have a significant effect on cautiousness, this factor may be significant in relation to either health promotion campaigns relating to driving in young people, or to graduated licensing schemes that might not recognise the diversity of experience in novice licence holders from rural areas. It may be that early (usually off-road) driving experience in an environment with little traffic, and therefore requiring less caution in driving judgements, enhanced the young drivers’ confidence in their driving skills. This could put them at risk on the road.
In a review of licensing ages [3], the origins of early licensing in the US, Canada and New Zealand have been attributed to earlier agriculturally-based economies where the need for young driving was a consideration for the age of licensing. This review highlights the continuing debate concerning the appropriate age of licensing to reduce the crash rate in young drivers, and the benefits, at all ages, of a graduated licensing scheme with restrictions on night-time and passenger-bearing driving. The results of this study appear to bring new data to the debate, in a group with extensive pre-licensing experience.
The survey question discussed in this study asked specifically about perceptions of caution when faced with changes in driving conditions. These are self-assessments, collected in the context of a survey of driving-related questions which were developed following focus groups. Self-assessment, in this context, will produce a response indicative of the individual participant’s view of the cautiousness they may apply in relation to the range of conditions described. The use of five response levels enables a range of views to be recorded. This may indicate
Table 3. Estimates of regression coefficients for multivariate regression analysis of cautiousness sum (R2 = 0.086)

Journal of the Australasian College of Road Safety – Volume 23 No.3, 2012
16
potential weakness in the data, as the results were recorded for each participant on a single occasion.
There were differences in univariate analysis between the two locations, with bad weather being rated as more likely to have an impact on driving in Kiama. This might be related to the area’s coastal position and associated high levels of rainfall and fog. The respondents from Tumut were less cautious with passengers on board, and when driving an unfamiliar car. The students from Kiama were in general more cautious in their views about factors, intrinsic and extrinsic to the vehicle, that might affect their driving. The experience of heavy traffic might be location-dependent, with Kiama, although semi-rural, being closer to urban conurbations and experiencing heavy seasonal traffic, as it is a holiday destination and experiences heavy through-traffic seasonally as visitors access the South Coast. Tumut, in contrast, is in an area that does not constantly experience heavy traffic, so the students would be less familiar with driving in it.
This is one of the first studies in which young rural people in Australia have reported exercising greater caution when driving. Although there were differences between those living in semi-rural and rural environments in the univariate analysis, in the multivariate analysis overall cautiousness was only associated with the age at which the students started to drive and previous involvement in a crash.
Students who had previous involvement in a crash as a driver or passenger reported less caution than those who had not. The extent of the crashes is not known. It may be that many were minor and, having escaped relatively unharmed, the students’ perceived risk of harm through crash involvement was lessened. Research indicates [14] that risk of injury is associated with high-risk behaviours; conversely, if a high-risk activity is observed to have been taken multiple times with no negative consequences (examples might be frequent driving without using seatbelts, or using a quad bike without a helmet), then the tendency to without using seatbelts or using a quad bike without a helmet) then the tendency to continue with the high-risk activity will not necessarily be modified by the experience of negative outcomes. The same applies to someone who has been involved in a crash in which there were limited adverse results.
Social cognitive theory [15] suggests that the influences on behaviours are varied, and include environmental, individual and developmental factors which interrelate to influence behaviours. This theoretical basis [16] can be used to understand how skills are acquired and practised in driving, and how the amount of experience increases confidence. This skill development with practice and in a staged development model is the basis of graduated driving schemes [17]. The key element of these schemes to
produce skills is extended periods of supervised driving, in which the skill-learning period is extensive, with usually a certain minimum number of hours required to progress to unsupervised driving. There is limited evidence, however, that the age at which the driving experience is obtained has an impact on later driver safety.
This study suggests that early exposure to driving increased the confidence of young drivers. Many of the students involved in this study had had significant vehicle handling time to develop and hone their skills in early off-road driving. This experience allows for skills to develop and evolve into a practised set of actions which are performed with increasing skill gained through experience.
Within a rural community, of which Tumut is an example, the driving-related behavioural beliefs of many students are based upon their individual experiences of early driving. It is widely reported that the value of being able to drive is that it signifies an important stage in adolescent development [3]. In rural agriculturally-based areas, the stage of becoming a driver is significant, partly as public transport is rarely available but also as it enables independent activities and involvement in work tasks on properties. Behavioural beliefs about when driving is initiated are influenced by the normative beliefs of the community. In rural NSW, for example, it is common for very young people to learn to drive – for leisure, to drive across a property, to get to the school bus, or to help on a property. It may be that these behavioural beliefs and their formative foundations are pertinent to the formation of views about cautiousness in driving.
In a study of intentions towards high-risk-taking driving, either with excessive speeding or drink driving [12], the theory of planned behaviour was applied to explain the influence of parental driving supervision on the factors affecting driving intention, and ultimately driving behaviours. The theory of planned behaviour explains linkages between beliefs, intentions and behaviours, in the context of specific environments. The results demonstrated that when parental supervision was ‘strongest’ there was least intention to be involved in high-risk driving. Study participants who drove early were usually taught by a parent, mainly by their father; this seems to be the norm for many rural communities.
Understanding why the experience of early driving, often with associated responsibility for tasks on a rural property, can reduce caution in on-road driving situations is important to the development of strategies to address the road toll. It may be that early driving makes young people over-confident. It may also be that, if the subjective norm of driving on a property for work-related practice is not ‘cautious’ (e.g. seatbelt usage is disregarded) young people maintain these attitudes when they drive on-road.

Journal of the Australasian College of Road Safety – Volume 23 No.3, 2012
17
Another study based upon the theory of planned behaviour examined the intention to speed of experienced motorcyclists in two contrasting road conditions [19]. The findings demonstrated that intention to speed on divided roads with a 70 mph limit was predicted by self-belief and group norms; those with intention to speed on an urban road with a speed limit of 30 mph were concerned with attitude and perceived control. It may be that there are similar variations in this study on cautiousness, influenced by learning to drive in situations that are different and distinct from the on-road driving environment. Early off-road driving is undertaken in situations unlike those on the road: there are no speed limits, road rules, or signage.
A limitation of the present study is that the surveys were both completed by those attending school, and did not include those who did not attend school for either a validor invalid reason (e.g. truancy). The study may therefore have excluded the views of some who might have more extreme tendencies to risk taking, as other research has shown that habitual risk-takers are often also poor attendees at school [15]. The study also excluded those who had chosen to leave school early before completing their final school examinations. However, it did capture responses from students in a wide age range attending the two schools. This research may indicate that the issue of caution and young rural drivers would benefit from further vigorous research, possibly including observational studies of driving behaviours.
Conclusions
The driving experiences of young drivers had an influence on their perception of factors that would affect their cautiousness in driving. This implies that recognition of (i) the driving experience prior to licensing of some rural young drivers, and (ii) the apparent behavioural norms in a rural region may warrant a special case for tailored rural road safety campaigns. These may include acknowledgement of vehicle-handling skills while also recognising the need for development of on-road hazard perception, specific to rural driving. It might also be pertinent to develop road safety campaigns that emphasise the development of staged skill development for families to teach their children in both off- and on-road driving situations. Such an approach could reflect the models used in graduated driving schemes. Both these health promotion campaigns would potentially complement the advances which the graduated licensing schemes have made in reducing the crash toll in young drivers.
Acknowledgements
The authors acknowledge the support from teachers and principals of the high schools in Tumut and Kiama, and the participation of their students.
Appendix 1Young rural drivers research study questionnaire:Thinking of factors that make you drive in a more cautious way, can you rate these situations? Please tick one box in each line.

Journal of the Australasian College of Road Safety – Volume 23 No.3, 2012
18
References
1. Peden M, Scusfield R, Sleet D, Mohan D, Hyder AA, Jarawan E, Mathers C. (2004) World Health Organisation: World Report on Road Traffic Injury Prevention
2. Williams 2003. Teenage drivers: Patterns of risk. Journal of Safety Research, 34, 5-15.
3. Williams 2009. Licensing Age and Teenage Driver Crashes: A Review of the Evidence. Traffic Injury Prevention, 10, 9 - 15.
4. Chen H Y, Senserrick T, Martiniuk ALC, Ivers R Q Boufous S Chang H Y. (2010). Fatal crash trends for Australian young drivers 1997-2007: Geographic and socioeconomic differentials. Journal of Safety Research, 41(2), 123-128.
Appendix 2Table 2. Cautiousness: Proportion of students reporting influence of particular situations on their driving by school (Tumut n=217, Kiama n=235)
Journal of the Australasian College of Road Safety – Volume 23 No.3, 2012
19
5. Stevenson M R and Palamara P. 2001. Behavioural factors as predictors of motor vehicle crashes: differentials between young urban and rural drivers. Australian and New Zealand Journal of Public Health, 25, 245-249.
6. Chen H Y Ivers R Q Martiniuk A L C Boufous S Senserrick T Woodward M Stevenson M Williamson A and Norton R. 2009. Risk and type of crash among young drivers by rurality of residence: Findings from the DRIVE Study. Accident Analysis & Prevention, 41, 676-682.
7. Braitman K A Kirley B B McCartt A T and Chaudhary N K. 2008. Crashes of novice teenage drivers: Characteristics and contributing factors. Journal of Safety Research, 39, 47-54.
8. Taubman - Ben-Ari O. 2008. Motivational sources of driving and their associations with reckless driving cognitions and behavior. Revue Européenne de Psychologie Appliquée/European Review of Applied Psychology, 58, 51-64.
9. Garrity R D and Demick J. 2001. Relations Among Personality Traits, Mood States, and Driving Behaviors. Journal of Adult Development, 8, 109.
10. Ginsburg K R Ed M S Durbin D R Garcia-Espana J F Kalicka E A & Winston F K. 2009. The Association Between Parental Style and Adolescent Driving Safety-Related Behaviors. Journal of Adolescent Health, 44, S40-S40.
11. Desrichard O Roche S and Begue L. 2007. The theory of planned behavior as mediator of the effect of parental supervision: A study of intentions to violate driving rules in a representative sample of adolescents. Journal of Safety Research, 38, 447-452.
12. Miller G and Taubman - Ben-Ari O. 2010. Driving styles among young novice drivers--The contribution of parental driving styles and personal characteristics. Accident Analysis & Prevention, 42, 558-570.
13. Knight PJ Iverson D and Harris M F. 2011, Early driving experience and influence on risk perception in young rural people, Accident Analysis & Prevention, ( Article in Press)
14. Pickett W Schmid H Boyce W F Simpson K Scheidt P C Mazur J Molcho M King M A Godeau E Overpeck M Aszmann A Szabo M & Harel Y. 2002. Multiple risk behavior and injury: An international analysis of young people. Archives of Pediatrics and Adolescent Medicine, 156, 786-793.
15. Bandura A. 1986 Social foundations of thought and action: A social cognitive theory. Englewood Cliffs,NJ: Prentice-Hall.
16. Bandura A. 1989. Human Agency in Social Cognitive Theory, American Psychologist, Vol44, No9, p1175-1184.
17. McKnight A J and Peck R C. 2003. Graduated driver licensing and safer driving. Journal of Safety Research, 34, 85-89.
18. Aizen I. 2006, Viewed 20 August 2011. http://people. umass.edu/aizen/tpb.diag.html
19. Elliott M A. 2010. Predicting motorcyclists’ intentions to speed: Effects of selected cognitions from the theory of planned behaviour, self-identity and social identity. Accident Analysis & Prevention, 42, 718-725.
Understanding the fear of bicycle riding in Australiaby E Fishman1, S Washington2, N Haworth1
1Centre for Accident Research and Road Safety – Queensland (CARRS-Q), Queensland University of Technology,Kelvin Grove, Queensland
2Faculty of Built Environment and Engineering and Centre for Accident Research and Road Safety – Queensland (CARRS-Q), Faculty of Health, Queensland University of Technology, Brisbane
Abstract
Rates of bicycle commuting currently hover around 1 - 2% in most Australian capital cities, although 17.8% of Australians report riding at least once per week. The most commonly stated reason for choosing not to ride a bicycle is fear of motorised vehicles. This paper sets out to examine the literature and offer a commentary regarding the role fear plays as a barrier to bicycle riding. The paper also provides an estimate of the relative risk of driving and riding, on a per trip basis. An analysis of the existing literature finds
fear of motorised traffic to be disproportionate to actual levels of risk to bicycle riders. Moreover, the health benefits of bicycling outweigh the risks of collision. Rather than actual collisions forming the basis of people’s fear, it appears plausible that near collisions (which occur far more frequently) may be a significant cause for the exaggerated levels of fear associated with bicycle riding. In order to achieve the Australian Government’s goal of doubling bike riding participation, this review suggests it will be necessary to counter fear through the creation of a low risk traffic environment (both perceived and real), involving marketing/promotional campaigns and the development of
Journal of the Australasian College of Road Safety – Volume 23 No.3, 2012
20
a comprehensive bicycle infrastructure network and lower speed limits.
Keywords
Bicycle-riding, Fear, Risk, Safety, Sustainable transport
Introduction
Concerns over fear and safety have frequently been reported as significant barriers to bicycle riding [1-5]. The term ‘fear’ is used in this paper to describe an unpleasant emotion caused by the threat of road traffic danger; this is distinct from ‘lack of safety’ which relates to objective measures of actual risk, rather than perception of risk. In order to achieve increased levels of bicycle riding, community concern regarding safety will need to be addressed. The fear associated with bicycling typically relates to the perceived possibility of injury resulting from a collision with a motor vehicle. Perceptions of personal security can also act as a barrier to bicycling [6]. Finally, the fear of actually being part of what has been described as an out-group, or even deviant may also create a fear of bicycle riding [6, 7]. Little work within the existing literature has specifically explored fear and evidence-based approaches to overcoming this major barrier to bicycle riding.
Background
Governments in developed countries have begun highlighting the benefits of bicycle riding as a method of increasing physical activity, reducing air and noise pollution, as well as easing traffic congestion and addressing climate change [8, 9]. With these benefits in mind, the Australian Government recently announced its goal to double cycling participation between 2011 and 2016 (National Cycling Strategy [10]). However, the parameters by which changes in participation would be measured (e.g. commuting, age categories, frequency) have not been articulated.
Bicycle riding rates in Australian cities are low compared to Europe [2]. Whilst a number of factors explain the significant difference in cycling rates in Australia and many other parts of the world, issues of safety and fear have consistently been reported as major impediments to the uptake of bicycle riding [11].
Bicycle riding participation in Australia
The Australian Bicycle Council, as part of the National Cycling Strategy 2011 – 2016, recently undertook the largest survey of bicycle riding participation in Australia [12]. This baseline data has been developed to measure
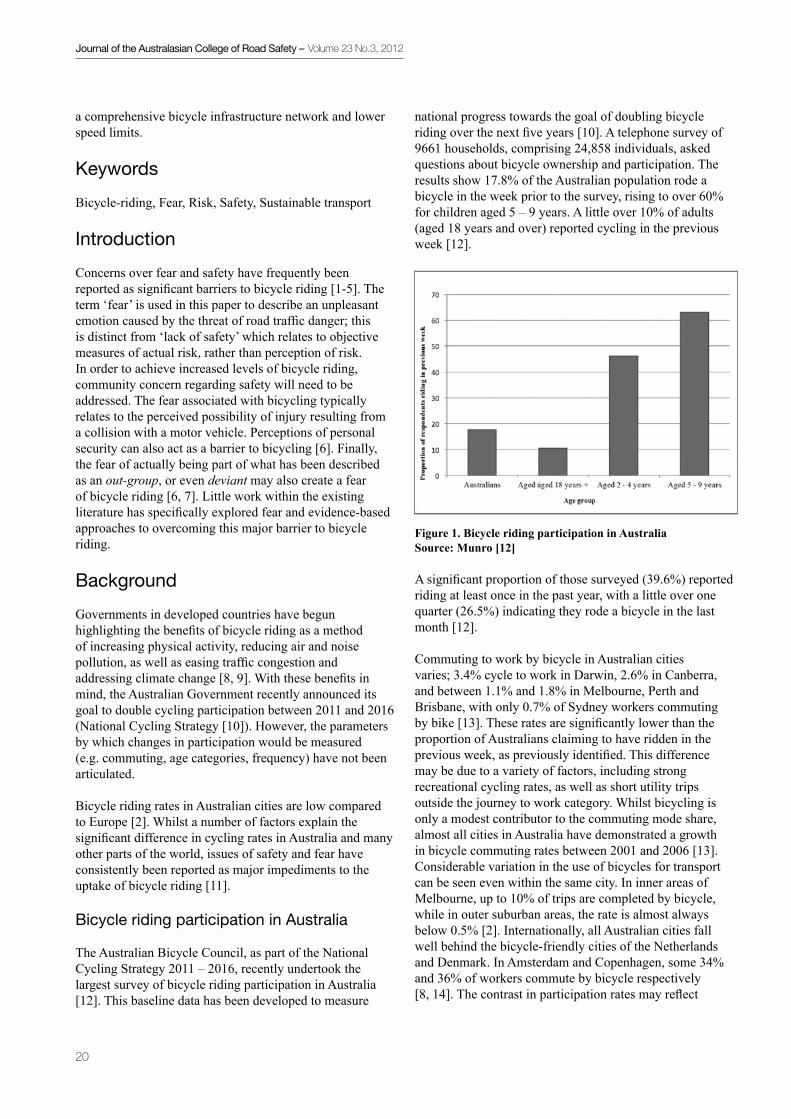
national progress towards the goal of doubling bicycle riding over the next five years [10]. A telephone survey of 9661 households, comprising 24,858 individuals, asked questions about bicycle ownership and participation. The results show 17.8% of the Australian population rode a bicycle in the week prior to the survey, rising to over 60% for children aged 5 – 9 years. A little over 10% of adults (aged 18 years and over) reported cycling in the previous week [12].
A significant proportion of those surveyed (39.6%) reported riding at least once in the past year, with a little over one quarter (26.5%) indicating they rode a bicycle in the last month [12].
Commuting to work by bicycle in Australian cities varies; 3.4% cycle to work in Darwin, 2.6% in Canberra, and between 1.1% and 1.8% in Melbourne, Perth and Brisbane, with only 0.7% of Sydney workers commuting by bike [13]. These rates are significantly lower than the proportion of Australians claiming to have ridden in the previous week, as previously identified. This difference may be due to a variety of factors, including strong recreational cycling rates, as well as short utility trips outside the journey to work category. Whilst bicycling is only a modest contributor to the commuting mode share, almost all cities in Australia have demonstrated a growth in bicycle commuting rates between 2001 and 2006 [13]. Considerable variation in the use of bicycles for transport can be seen even within the same city. In inner areas of Melbourne, up to 10% of trips are completed by bicycle, while in outer suburban areas, the rate is almost always below 0.5% [2]. Internationally, all Australian cities fall well behind the bicycle-friendly cities of the Netherlands and Denmark. In Amsterdam and Copenhagen, some 34% and 36% of workers commute by bicycle respectively [8, 14]. The contrast in participation rates may reflect
Figure 1. Bicycle riding participation in AustraliaSource: Munro [12]
Journal of the Australasian College of Road Safety – Volume 23 No.3, 2012
21
significant differences related to helmet legislation, parking and driving costs, as well as the quality of bicycle infrastructure.
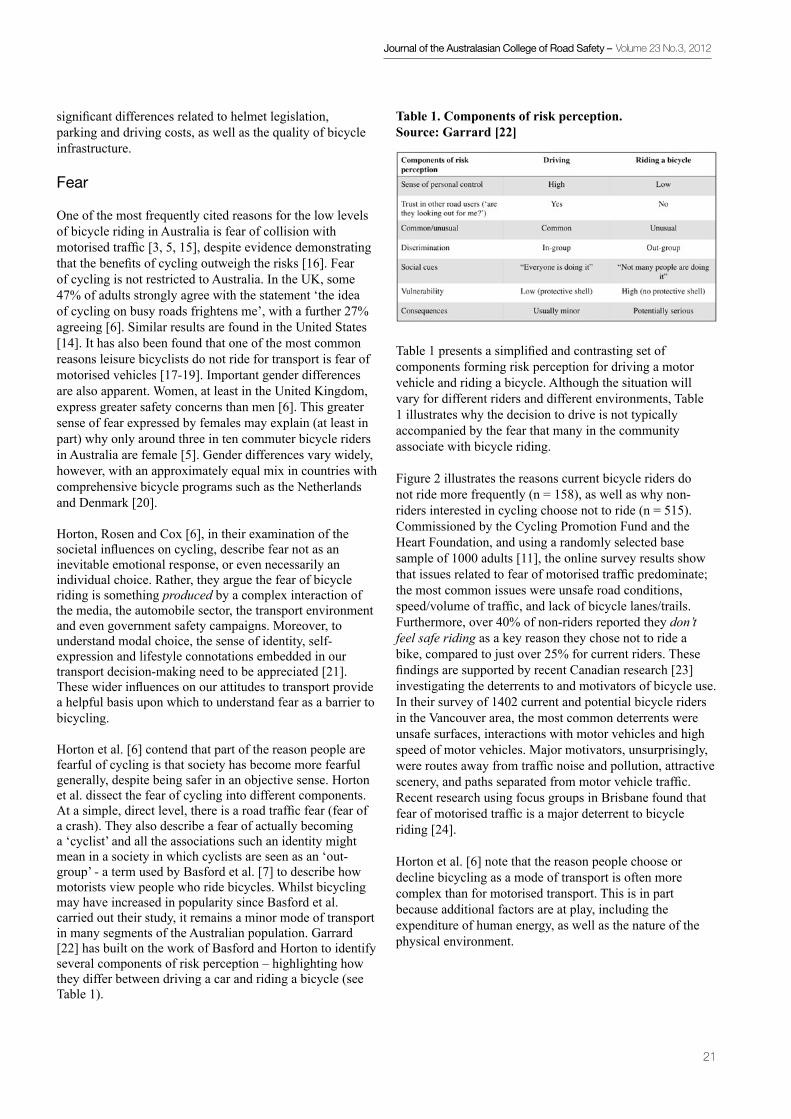
Fear
One of the most frequently cited reasons for the low levels of bicycle riding in Australia is fear of collision with motorised traffic [3, 5, 15], despite evidence demonstrating that the benefits of cycling outweigh the risks [16]. Fear of cycling is not restricted to Australia. In the UK, some 47% of adults strongly agree with the statement ‘the idea of cycling on busy roads frightens me’, with a further 27% agreeing [6]. Similar results are found in the United States [14]. It has also been found that one of the most common reasons leisure bicyclists do not ride for transport is fear of motorised vehicles [17-19]. Important gender differences are also apparent. Women, at least in the United Kingdom, express greater safety concerns than men [6]. This greater sense of fear expressed by females may explain (at least in part) why only around three in ten commuter bicycle riders in Australia are female [5]. Gender differences vary widely, however, with an approximately equal mix in countries with comprehensive bicycle programs such as the Netherlands and Denmark [20].
Horton, Rosen and Cox [6], in their examination of the societal influences on cycling, describe fear not as an inevitable emotional response, or even necessarily an individual choice. Rather, they argue the fear of bicycle riding is something produced by a complex interaction of the media, the automobile sector, the transport environment and even government safety campaigns. Moreover, to understand modal choice, the sense of identity, self-expression and lifestyle connotations embedded in our transport decision-making need to be appreciated [21]. These wider influences on our attitudes to transport provide a helpful basis upon which to understand fear as a barrier to bicycling.
Horton et al. [6] contend that part of the reason people are fearful of cycling is that society has become more fearful generally, despite being safer in an objective sense. Horton et al. dissect the fear of cycling into different components. At a simple, direct level, there is a road traffic fear (fear of a crash). They also describe a fear of actually becoming a ‘cyclist’ and all the associations such an identity might mean in a society in which cyclists are seen as an ‘out-group’ - a term used by Basford et al. [7] to describe how motorists view people who ride bicycles. Whilst bicycling may have increased in popularity since Basford et al. carried out their study, it remains a minor mode of transport in many segments of the Australian population. Garrard [22] has built on the work of Basford and Horton to identify several components of risk perception – highlighting how they differ between driving a car and riding a bicycle (see Table 1).
Table 1 presents a simplified and contrasting set of components forming risk perception for driving a motor vehicle and riding a bicycle. Although the situation will vary for different riders and different environments, Table 1 illustrates why the decision to drive is not typically accompanied by the fear that many in the community associate with bicycle riding.
Figure 2 illustrates the reasons current bicycle riders do not ride more frequently (n = 158), as well as why non-riders interested in cycling choose not to ride (n = 515). Commissioned by the Cycling Promotion Fund and the Heart Foundation, and using a randomly selected base sample of 1000 adults [11], the online survey results show that issues related to fear of motorised traffic predominate; the most common issues were unsafe road conditions, speed/volume of traffic, and lack of bicycle lanes/trails. Furthermore, over 40% of non-riders reported they don’t feel safe riding as a key reason they chose not to ride a bike, compared to just over 25% for current riders. These findings are supported by recent Canadian research [23] investigating the deterrents to and motivators of bicycle use. In their survey of 1402 current and potential bicycle riders in the Vancouver area, the most common deterrents were unsafe surfaces, interactions with motor vehicles and high speed of motor vehicles. Major motivators, unsurprisingly, were routes away from traffic noise and pollution, attractive scenery, and paths separated from motor vehicle traffic. Recent research using focus groups in Brisbane found that fear of motorised traffic is a major deterrent to bicycle riding [24].
Horton et al. [6] note that the reason people choose or decline bicycling as a mode of transport is often more complex than for motorised transport. This is in part because additional factors are at play, including the expenditure of human energy, as well as the nature of the physical environment.
Table 1. Components of risk perception. Source: Garrard [22]

Journal of the Australasian College of Road Safety – Volume 23 No.3, 2012
22
Form of harassment
Figure 3. Harassment experienced by people riding bicyclesSource: Garrard et al. [5]
Proportion of respondents
Figure 2. Reason for not riding for transportSource: Cycling Promotion Fund [11]

Journal of the Australasian College of Road Safety – Volume 23 No.3, 2012
23
Hostile behaviour from other road users towards cyclists may also be a cause of fear. In a large online survey of Bicycle Victoria members (n = 2406), over 65% of riders reported some form of harassment over the previous 12 months [5]. Figure 3 details the types and prevalence of this harassment. On average, people riding bicycles experience a form of harassment every two weeks. Although this harassment does not often result in any physical injury, it raises fears associated with bicycling and, for many, acts as a deterrent to riding a bicycle [22].
Focus group results from Brisbane suggest regular riders were generally dissatisfied with the level of awareness and respect shown to them from motor vehicle drivers [24]. With recent evidence demonstrating the low level of injury and fatality but relatively frequent near collision events [25], Garrard [22] has proposed an iceberg analogy to illustrate that although the tip of the iceberg is represented by the serious injuries and fatalities, the more substantive component of fear and anxiety is caused by the near collisions and harassment experienced by those riding bicycles. The relatively high prevalence of low severity crashes might also increase perceptions of risk. This analogy may be supported by work produced by scholars in the field of risk analysis. Here, it has been established that problems in risk communication can arise through ‘social amplification’ [26] which involves the transfer of information about a risk and the way society responds to
information. This transfer may be facilitated through the experience of bicycle riders but, perhaps more importantly, when drivers (and perhaps their passengers) experience a near miss with a person on a bicycle. Research conducted in Queensland found that as kilometres cycled increased, there was a reduction in injury likelihood, on a per kilometre travelled basis, as well as a reduction in perceived risk [27]. According to a survey of bicycle riders in Queensland, the frequency of self-reported crash injuries (includes falls both on and off-road) is approximately 0.5 per year per bicycle rider, although most of the crash-related injuries resulted in low severity outcomes (did not require admission to hospital) [27]. Additional Queensland research, using a sample of 1976 Bicycle Queensland members found 31% had experienced a bicycle injury in the last year (includes non-collisions, such as falls due to skidding, but not muscle strains). Those cycling more frequently, for less than five years and for recreation or competition had a greater likelihood of injury [28].
Road safety and bicycle riding
People riding bicycles comprise 2.3% of road deaths (when taking the average number of bicyclist and overall road fatalities from 2002 to 2011) [29] and 14% of serious road traffic injuries in Australia [30]. According to Garrard [22], there are 1.2 serious injuries in Melbourne for every million kilometres cycled. Someone bicycling 5000 kilometres
Figure 4. The Fear Iceberg of Bicycle RidingSource: Garrard [22]

Journal of the Australasian College of Road Safety – Volume 23 No.3, 2012
24
annually could expect to sustain one serious injury for every 167 years of riding (assuming the risk remains the same over the next 167 years). In terms of relative risk (using Melbourne data), a person riding a bicycle has 13 times the risk of sustaining a serious injury compared to a motor vehicle driver covering the same distance. Put simply, a journey of 13 kilometres driven has the same risk of serious injury as one kilometre cycled [22]. Given the vastly greater distances travelled by car, Garrard argues the level of fear associated with bicycle riding is disproportionate relative to the fear (or lack thereof) associated with travelling by car [22]. Combining national data collected by Austroads [31] with Victorian data on median trip distance and journey for driving and riding [32], it is possible to compare fatality and serious injury rates on a per trip and per hour basis. On a per trip basis, the analysis reveals the risk of fatality for the median car journey is half that of the median bike trip.
Without a detailed understanding of the quantitative risks associated with different modes of transport, it is plausible for individuals to form their views on road safety risk by what feels safe or unsafe. Garrard argues [22] bicycle riding feels unsafe to most Australians and this explains, to a large degree, the common finding of safety concerns acting as a barrier to the uptake of cycling. This view is supported by research undertaken by the Monash University Accident Research Centre. A study by Johnson et al. [25], in which six cyclists wore helmet mounted video cameras, found no incidents over the 46 hours of riding recorded but found there were 36 ‘near collisions’ – averaging 0.76 per hour. Interestingly, female near collisions occurred at the rate of 0.38 per hour, while male near collisions occurred 1.13 times per hour.
The authors attributed this significant difference to the fact that females had a stronger preference for off-road riding in which motor vehicles were not present. It should also be noted that whilst fear of collision with a motor vehicle is the major safety concern when riding, according to Haworth et al. [33], half the bicycle injuries in Queensland resulting in hospitalisation occurred outside of the public road network, suggesting at least half do not involve a motor vehicle. Moreover, in an analysis of serious injuries due to land transport accidents, Henley and Harrison [30] found approximately half of all serious bicycle injuries in 2006-07 occurred off the public road network and therefore without the involvement of a motor vehicle.
Closing the gap between perception/reality and improving road safety for people bicycling
Bicycle riding has been increasing for several years in Australia, as previously noted, yet concerns regarding safety continue to be a major barrier. Garrard et al. [34] suggest that the issue of safety for those riding bicycles is something of a road safety ‘blind spot’. Many of the
in-car safety advancements over recent years have helped to reduce car occupant injury and death, but relatively little action has taken place with regard to the safety of bicyclists. Motor vehicles are also equipped with seatbelts, airbags and other measures that create a more forgiving in-car environment in the event of an incident or near miss. Bicyclists are not afforded the same degree of protection and are therefore more exposed to external conditions, such as weather and road user behaviour [34]. Elvik [35], however, found that large shifts from motorised to active transport can lead to a reduction in the total number of transport injuries. As such, road safety policy could seek to achieve mode shifts to active transport on the grounds of lowering rates of road traffic injuries.
Serious injuries for pedestrians, vehicle passengers and motor vehicle drivers have declined over recent decades, yet cycling fatalities reached a plateau and serious injuries have increased ([13, 30] cited in Garrard et al. [34]). For instance, between 2000 and 2007 serious injuries for bicyclists increased by 47%, whilst such injuries for other modes of transport remained the same or reduced [30]. There is some debate as to whether this is related to changes in cycling participation, with some reports showing no significant increase [34], whilst others illustrate a marked increase [36]. The lack of data on the distance Australians cover while bicycle riding, itemised for different trip purposes (e.g. leisure, competitive sport, non-work transport and commuting), makes it difficult to determine whether the increase in injuries is a consequence of increasing exposure (i.e. more bicycle riding).
In order to overcome the perception of risk associated with bicycling, it is necessary to implement measures targeted at the major influences governing risk perception. Parkin, Wardman and Page [37] have found each of the following to be significant contributors to the perception of risk while riding:
• volume, speed and type of traffic• number of parked vehicles on the side of the road (car-door opening risk)• type of intersections.
Reducing near collisions
Near collisions create a sense of vulnerability that prevent large sections of the Australian population from bicycling and act as a deterrent for current bicyclists to ride more often [22]. Over the last 15 to 20 years, Australian governments, to varying degrees, have begun to install bicycle lanes and paths; this has improved actual and perceived levels of safety. However, in relation to international best practice, the measures taken in Australia to promote bicycling can generally be described as ‘picking the low hanging fruit’ in which some of the easy options have been taken. Decisions regarding the relative priority
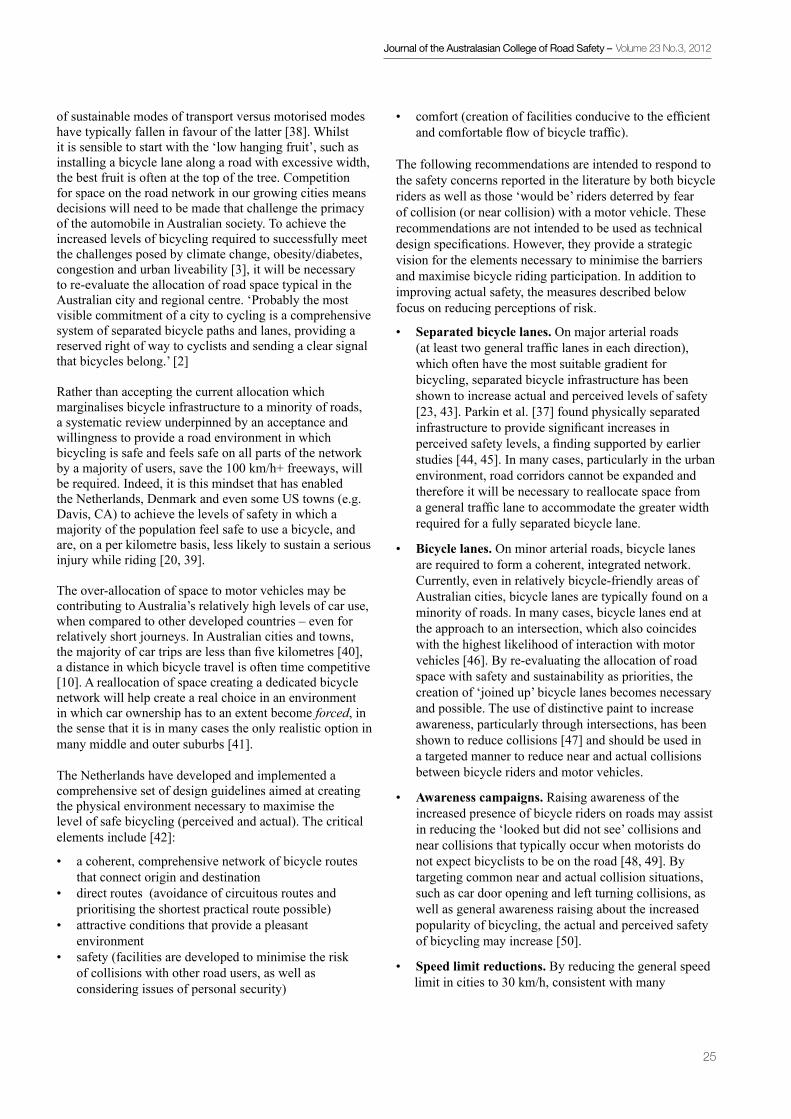
Journal of the Australasian College of Road Safety – Volume 23 No.3, 2012
25
of sustainable modes of transport versus motorised modes have typically fallen in favour of the latter [38]. Whilst it is sensible to start with the ‘low hanging fruit’, such as installing a bicycle lane along a road with excessive width, the best fruit is often at the top of the tree. Competition for space on the road network in our growing cities means decisions will need to be made that challenge the primacy of the automobile in Australian society. To achieve the increased levels of bicycling required to successfully meet the challenges posed by climate change, obesity/diabetes, congestion and urban liveability [3], it will be necessary to re-evaluate the allocation of road space typical in the Australian city and regional centre. ‘Probably the most visible commitment of a city to cycling is a comprehensive system of separated bicycle paths and lanes, providing a reserved right of way to cyclists and sending a clear signal that bicycles belong.’ [2]
Rather than accepting the current allocation which marginalises bicycle infrastructure to a minority of roads, a systematic review underpinned by an acceptance and willingness to provide a road environment in which bicycling is safe and feels safe on all parts of the network by a majority of users, save the 100 km/h+ freeways, will be required. Indeed, it is this mindset that has enabled the Netherlands, Denmark and even some US towns (e.g. Davis, CA) to achieve the levels of safety in which a majority of the population feel safe to use a bicycle, and are, on a per kilometre basis, less likely to sustain a serious injury while riding [20, 39].
The over-allocation of space to motor vehicles may be contributing to Australia’s relatively high levels of car use, when compared to other developed countries – even for relatively short journeys. In Australian cities and towns, the majority of car trips are less than five kilometres [40], a distance in which bicycle travel is often time competitive [10]. A reallocation of space creating a dedicated bicycle network will help create a real choice in an environment in which car ownership has to an extent become forced, in the sense that it is in many cases the only realistic option in many middle and outer suburbs [41].
The Netherlands have developed and implemented a comprehensive set of design guidelines aimed at creating the physical environment necessary to maximise the level of safe bicycling (perceived and actual). The critical elements include [42]:
• a coherent, comprehensive network of bicycle routes that connect origin and destination• direct routes (avoidance of circuitous routes and prioritising the shortest practical route possible)• attractive conditions that provide a pleasant environment• safety (facilities are developed to minimise the risk of collisions with other road users, as well as considering issues of personal security)
• comfort (creation of facilities conducive to the efficient and comfortable flow of bicycle traffic).
The following recommendations are intended to respond to the safety concerns reported in the literature by both bicycle riders as well as those ‘would be’ riders deterred by fear of collision (or near collision) with a motor vehicle. These recommendations are not intended to be used as technical design specifications. However, they provide a strategic vision for the elements necessary to minimise the barriers and maximise bicycle riding participation. In addition to improving actual safety, the measures described below focus on reducing perceptions of risk.
• Separated bicycle lanes. On major arterial roads(at least two general traffic lanes in each direction), which often have the most suitable gradient for bicycling, separated bicycle infrastructure has been shown to increase actual and perceived levels of safety [23, 43]. Parkin et al. [37] found physically separated infrastructure to provide significant increases in perceived safety levels, a finding supported by earlier studies [44, 45]. In many cases, particularly in the urban environment, road corridors cannot be expanded and therefore it will be necessary to reallocate space from a general traffic lane to accommodate the greater width required for a fully separated bicycle lane.
• Bicycle lanes. On minor arterial roads, bicycle lanes are required to form a coherent, integrated network. Currently, even in relatively bicycle-friendly areas of Australian cities, bicycle lanes are typically found on a minority of roads. In many cases, bicycle lanes end at the approach to an intersection, which also coincides with the highest likelihood of interaction with motor vehicles [46]. By re-evaluating the allocation of road space with safety and sustainability as priorities, the creation of ‘joined up’ bicycle lanes becomes necessary and possible. The use of distinctive paint to increase awareness, particularly through intersections, has been shown to reduce collisions [47] and should be used in a targeted manner to reduce near and actual collisions between bicycle riders and motor vehicles.
• Awareness campaigns. Raising awareness of the increased presence of bicycle riders on roads may assist in reducing the ‘looked but did not see’ collisions and near collisions that typically occur when motorists do not expect bicyclists to be on the road [48, 49]. By targeting common near and actual collision situations, such as car door opening and left turning collisions, as well as general awareness raising about the increased popularity of bicycling, the actual and perceived safety of bicycling may increase [50].
• Speed limit reductions. By reducing the general speed limit in cities to 30 km/h, consistent with many
Journal of the Australasian College of Road Safety – Volume 23 No.3, 2012
26
European countries, the perceived and actual risk of collision, near collision and severity of injury for actual collisions will be reduced [2].
Conclusion
This paper has examined the roles that fear and perceived risk play in reducing bicycle-riding participation in Australia – factors that may serve as significant barriers to the uptake of cycling. In order to significantly increase rates of bicycling, safety must be prioritised; at the same time, fear and common perceptions of road traffic crash likelihood that prevent people from cycling will need to be addressed. To adequately address community concerns, the road traffic environment will need to be made to feel safe. This can be achieved through measures such as the targeted reallocation of road space and the lowering of speed limits, along with awareness and education campaigns. Current evidence suggests that these measures will help to provide a road environment that is safer – and, importantly, one that is perceived to be safer – for bicycle riders.
References
1. Fishman E, Ker I, Garrard J, Litman T. Cost and health benefit of active transport in Brisbane, Queensland. Produced for Queensland Government, 2011.
2. Pucher J, Greaves S, Garrard J. Cycling down under: a comparative analysis of bicycling trends and policies in Sydney and Melbourne. Journal of Transport Geography. 2010;19(2):332-45.
3. Bauman AE, Rissel C, Garrard J, Ker I, Speidel R, Fishman E. Cycling: Getting Australia Moving: Barriers, facilitators and interventions to get more Australians physically active through cycling. 2008.
4. Rose G, Lo SK, Garrard J. Promoting transportation cycling for women: the role of bicycle infrastructure. Preventive Medicine. 2008;46(1):55-9.
5. Garrard J, Crawford S, Hakman N. Revolutions for women: increasing women’s participation in cycling for recreation and transport. Melbourne: Deakin University, 2006.
6. Horton D, Rosen P, Cox P. Cycling and Society. Farnham: Ashgate; 2007.
7. Basford L, Reid S, Lester T, Thomson J, Tolmie A. Drivers’ perceptions of cyclists. TRL Limited, for the UK Department for Transport. 2002.
8. Pucher J, Dill J, Handy S. Infrastructure, programs, and policies to increase bicycling: an international review. Preventive Medicine. 2010;50 Suppl 1(S106):25.
9. Shaheen S, Guzman S, Zhang H. Bikesharing in Europe, the Americas, and Asia. Transportation Research Record: Journal of the Transportation Research Board. 2010;2143:159-67.
10. Austroads. National Cycling Strategy: Gearing up for active and sustainable communities 2011–2016, Sydney: Department of Infrastructure 2010
11. Cycling Promotion Fund. Riding a Bike for Transport: Survey Findings. 2011.
12. Munro C. Australian Cycling Participation. Sydney: Austroads. 2011.
13. Austroads. Capital City Cycling Data and Indicators. 2009.
14. Gardner G. The trends that are shaping our future. New York: W.W Norton and Company; 2002.
15. City of Sydney. Sydney cycling research: focus groups. 2007.
16. de Hartog J, Boogaard H, Nijland H, Hoek G. Do the Health Benefits of Cycling Outweigh the Risks? Environmental Health Perspectives. 2010;118(8):1109-16.
17. Cyclists’ Public Affairs Group. Barriers to Cycling: Perspectives from Existing and Potential Cyclists. 1997.
18. Automobile Association. Cycling Motorists: How to Encourage Them. 1993.
19. Gardner G. Transport Implications of Leisure Cycling. Crowthorne: Transport Research Laboratory. 1998.
20. Pucher J, Buehler R. Making cycling irresistible: Lessons from the Netherlands, Denmark and Germany. Transport Reviews. 2008;28(4):495-528.
21. Gartman D. Three Ages of the Automobile: The Cultural Logics of the Car. Theory, Culture and Society. 2004;21(45):169-95.
22. Garrard J. Make it feel safe and they will come: addressing the actual and perceived risks of cycling. Asia Pacific Cycle Congress; Brisbane. 2011.
23. Winters M, Davidson G, Kao D, Teschke K. Motivators and deterrents of bicycling: comparing influences on decisions to ride. Transportation. 2011;38(1):153-68.
24. Fishman E, Washington S, Haworth N. Barriers and facilitators to public bicycle scheme use: A qualitative approach. 2012. Submitted for publication.
25. Johnson M, Charlton J, Oxley J. The Application of a Naturalistic Driving Method to Investigate On-Road Cyclist Behaviour: A Feasibility Study. Road & Transport Research: A Journal of Australian and New Zealand Research and Practice. 2010;19(2):32-41.
26. Smillie L, Blissett A. A model for developing risk communication strategy. J Risk Res. 2010;13(1):115-34.
27. Washington S, Haworth NL, Schramm AJ, On the relationships between self-reported bicycling injuries and perceived risk among cyclists in Queensland, Australia, Transportation Research Board Annual Meeting; Washington DC. 2012.
28. Heesch K, Garrard J, Sahlqvist S, What factors are associated with cyclists getting injured? Correlates of cyclist injuries in Queensland. 2010 Australasian Road Safety Research, Policing and Education Conference, 31 August - 3 September 2010; National Convention Centre, Canberra.

Journal of the Australasian College of Road Safety – Volume 23 No.3, 2012
27
29. Bureau of Infrastructure Transport and Regional Economics. Road deaths Australia: 2010 statistical summary. Canberra: Commonwealth of Australia, 2011.
30. Henley G, Harrison J. Serious injury due to land transport accidents. Canberra: Department of Health and Ageing, 2009
31. Austroads. The Road Safety Consequences of Changing Travel Modes. 2010.
32. Victorian Department of Transport. Victorian Integrated Survey of Travel and Activity 2007. Melbourne: Department of Transport 2009
33. Haworth N, Schramm A, King M, Steinhardt D. Bicycle Helmet Research: Centre for Accident Research and Road Safety - Queensland. 2010.
34. Garrard J, Greaves S, Ellison A. Cycling Injuries in Australia: Road Safety’s Blind Spot? Journal of the Australasian College of Road Safety. 2010;21(3):37-43.
35. Elvik R. The non-linearity of risk and the promotion of environmentally sustainable transport. Accident Analysis & Prevention. 2009;41(4):849-55.
36. Department of Infrastructure Transport Regional Development and Local Government. Road deaths Australia 2008. 2009.
37. Parkin J, Wardman M, Page M. Models of perceived cycling risk and route acceptability. Accident Analysis & Prevention. 2007;39(2):364-71.
38. Moodie R. Launch of ‘Cycling: Getting Australia Moving’. 2008.
39. Pucher J, Buehler R. Analysis of Bicycling Trends and Policies in Large North American Cities: Lessons for New York: University Transportation Research Centre. 2011 April.
40. Austroads. The Australian National Cycling Strategy. 2005.
41. Currie G, Stanley J, Stanley J. No way to go: transport and social disadvantage in Australian communities. 2007.
42. CROW. Design Manual for Bicycle Traffic. The Netherlands. 2007.
43. Jensen S, Rosenkilde C, Jensen N. Road safety and perceived risk of cycle facilities in Copenhagen. 2007. Available from: http://www.vehicularcyclist.com/ copenhagen1.pdf
44. Wardman M, Nash CA, Tight MR, Page M. Cycling and urban mode choice. Swindon: Economic and Social Research Council. 2000.
45. Wardman M, Hatfield R, Page M. The UK national cycling strategy: can improved facilities meet the targets? Transport Policy. 1997;4(2):123-33.
46. Bíl M, Bílová M, Müller I. Critical factors in fatal collisions of adult cyclists with automobiles. Accident Analysis & Prevention. 2010;42(6):1632-6.
47. Elvik R, Vaa T, Erke A. The Handbook of Road Safety Measures. Bradford: Emerald Group Publishing Limited; 2009. Available from: http://QUT.eblib.com. au/patron/FullRecord.aspx?p=471090.
48. Kwan I, Mapstone J. Visibility aids for pedestrians and cyclists: a systematic review of randomised controlled trials. Accident Analysis & Prevention. 2004;36(3):305-12.
49. Wood JM, Lacherez PF, Marszalek RP, King MJ. Drivers’ and cyclists’ experiences of sharing the road: Incidents, attitudes and perceptions of visibility. Accident Analysis & Prevention. 2009;41(4):772-6.
50. City of Sydney. Sydney cycling research: internet survey. 2006.
The effectiveness of wire rope barriers in Victoriaby Nimmi Candappa, Angelo D’Elia, Stuart Newstead and Bruce Corben, Monash University Accident Research Centre (MUARC), Melbourne
Abstract
Run-off-road crashes represent half of all fatal crashes in rural Victoria and many of these crashes involve collisions with fixed roadside objects. Wire rope barriers are proving to be highly effective in addressing this crash problem internationally. To date no comprehensive Victorian evaluation had been undertaken on the effectiveness of this barrier. A quasi-experimental ‘before and after’ study design was employed to evaluate the effectiveness of these barriers in addressing this crash problem. Results indicated that barriers were associated with statistically significant reductions program-wide. In addition, along two specific routes, reductions of up to 87% in targeted serious casualty crashes were indicated.
Keywords
Effectiveness, Evaluation, Run-off-road crashes,Wire rope barrier
Introduction
Single vehicle run-off-road crashes represent a major source of serious road trauma resulting from factors such as road curvature, excessive speed, driver fatigue and alcohol consumption [1]. In the five years to 2010, nearly 70% of all fatal and serious injury crashes in rural Victoria, Australia, were the result of vehicles being driven off the road or crashing into oncoming vehicles, accounting for nearly 5000 crashes. Of these, 60% involved collision

Journal of the Australasian College of Road Safety – Volume 23 No.3, 2012
28
with a fixed roadside object [2]. The issue is not confined to Victoria or indeed Australia. In New South Wales, an annual average of 80 fatal crashes were the result of run-off-road crashes on high speed undivided roads [3] while in Western Australia in the five years to 2007, run-off-road crashes comprised 56% of all casualty crashes on the rural network [4]. Internationally, single vehicle crashes in 2008 (often the result of vehicles running off the road) contributed to over a third of fatalities in the European Union, accounting for around 8000 deaths [5]. In the United States in 2009, over 18,000 fatalities - 53% of fatal crashes - were the result of vehicles running off the road, and nearly 60% of these involved fixed roadside objects [6].
Wire rope or cable barriers have been commonly utilised in Europe to address this crash type on high-speed rural roads, and were investigated for widescale use in Victoria by Corben and Johnston [7], among others. Commonly referred to as ‘flexible barriers’ for their ability to deflect and absorb much of the crash force, the barriers consist of highly-tensioned wire rope supported by frangible metal posts. In Victoria, wire rope barriers are currently in use in one of two main forms: three to four wire ropes either placed parallel to the road surface, or with the two upper wire ropes parallel to the road surface and the lower two intertwined with each other. Upon impact, the tensioned wires deflect, absorbing much of the energy of the crash while the frangible posts yield, minimising excessive force being imparted onto the vehicle and its occupants, and often effectively capturing and decelerating the vehicle [8, 9].
International evaluations of the effectiveness of these barriers have been highly promising. Many evaluations in Europe and the US indicate large reductions in injurious crashes associated with wire rope barrier use, with up to70-90% reductions in serious casualty crashes for particular crash types [10-12]. Swedish use of the barrier in the innovative 2+1 barrier format - which contains a centre lane that alternates travel direction with the wire rope barrier separating the two directions of travel - found reductions in risk of fatality of between 76% and 82% when compared to 13 metre roads without the wire rope barrier and road geometry treatment [13].
At the time of study, no comprehensive evaluation had been undertaken on the effects of the barrier on Victorian roads, although Szwed provided early indications of barrier effectiveness of 92% reduction in casualty run-off-road crashes [14]. In the Victorian Parliamentary Inquiry into Crashes with Roadside Objects (2005), several recommendations pertinent to wire rope barrier usage in Victoria were made, including ‘that VicRoads undertake a detailed analysis of the requirement for widespread installation of flexible roadside safety barriers on high speed Victorian highways. If appropriate, a long-term large-scale installation program should be proposed’[15]. The
Transport Accident Commission (TAC) reiterated this in its submission to the Inquiry with its recommendation that ‘…the systemic application of (flexible) barrier treatments known to be effective in reducing collisions with roadside objects should be actively encouraged and supported’[16]. To this end, this Victorian study was completed in 2009 to investigate how effectively wire rope barriers reduce crashes in Victoria. Particular emphasis was placed on the reductive effects of barriers on serious casualty crashes, in line with the Victorian Government road safety strategy focus of reducing serious casualties [17]. This paper presents the results of the evaluation in relation to estimated reduction in reported serious and fatal injury run-off-road crashes, after the installation of wire rope barriers on Victorian roads, as well as the overall effects on all casualty crashes.
Method
A quasi-experimental evaluation design incorporating the use of control groups was used in the study for the assessment of changes to casualty crash frequency and fatal and serious injury crash frequency attributable to wire rope barrier installation. This study design estimated treatment effect by comparing crash frequency at each treated length to those at untreated sections of the same length over the same time periods, both before and after the treatment was implemented. Use of control groups was necessary to give an adequate measure of the reductions in crash frequency due to factors other than the treatments, over the period of data analysed in the study.
Count data assembled for analysis in a quasi-experimental before and after-treatment/control design define a two by two contingency table. Apart from the lack of treatment and control group randomisation, this is the same analysis framework used in the analysis of clinical trials where a randomised treatment-control structure is used.
Medical literature shows the most appropriate means of analysing count data from trials to estimate net treatment effects relative to a control is via a log-linear analysis with a Poisson error structure [18]. The estimate resulting from the analysis in the case of casualty crash data being analysed here is not a relative risk of an outcome, such as cancer in a clinical trial, but the relative casualty crash change in treatment group compared to the control. The distributional assumptions about casualty crash frequency made in the use of this method are consistent with those proposed by Nicholson [19, 20].
The log-linear Poisson regression approach to analysing quasi-experimental road safety evaluation designs was originally proposed by Brühning and Ernst [21]. Modifications of the method have been successfully applied by Newstead and Corben in their evaluation of the TAC-

Journal of the Australasian College of Road Safety – Volume 23 No.3, 2012
29
Table 1. Contingency table format used in the analysis method
funded Accident Black Spot program implemented in Victoria between 1992 and 1996 [22], and more recently in the evaluation of crash effects of strip shopping centre treatments in Victoria [23].
The analysis method demonstrated by Brühning and Ernst can be described as follows: data defined by the quasi-experimental study design with before and after data in each of L treatment and control pairs can be summarised in a series of L two by two contingency tables, represented in Table 1.
A log-linear model with Poisson error structure, appropriate for the variability in the casualty crash data is then fitted to the data, with the model form given by Equation 1. The log-linear model form of this equation can easily be fitted in common statistical software packages such as SAS.
In Equation 1, i is the site number, j is the treatment or control group index, k is the before or after index, the b values are the model parameters and nijk is the cell casualty crash count. The percentage casualty crash reduction at site i attributable to the treatment, adjusted for the corresponding change in casualty crash frequency at the control site is given by Equation 2.
Statistical significance of ∆i is equal to the statistical significance of bijk obtained directly from the fitted log-linear model. Confidence limits for ∆i are computed in the normal way using the estimated standard error of bijk obtained from the fitted log-linear model and using the transformation given by Equation 2. Subtle modifications of the above model can be made to estimate the average treatment effect across a number of treated sites. These modifications are detailed in Brühning and Ernst [21] and were used to estimate the overall program effect of the analysed sections of road treated with flexible barrier.
Dataset
Treatment sites were defined as road lengths that contained installed lengths of wire rope barrier, and the sites were constrained to those within 100 km/h and 110 km/h speed
zones. VicRoads provided data of the lengths of road that were installed with wire rope barrier, with barrier location detail provided either in chainage or GIS coding. Most of the installations were completed over an extended time period, and the data period considered ranged from December 2000 to 2006.
Crashes occurring within a 50 metre arc of a treatment site were included for analysis using the police-reported crash dataset of VicRoads, Road Crash Information System (RCIS). In Victoria, only crashes that involve injury are recorded in the police database. Injury outcome in police-reported crashes in Victoria is classified into one of three levels, namely ‘fatal’, ‘serious injury’ (where there has been at least one hospital admission) and ‘other (minor) injury’. The severity of a crash is defined by the most serious injury level sustained by any person involved in the crash. In this report, ‘serious casualty’ refers to crashes involving either a fatal or serious injury outcome, while ‘casualty crash’ refers to all crashes involving any injury. The results refer to effects on crash numbers, not the number of road users involved.
Crashes were identified for the period January 1995 to October 2007, inclusive. The ‘before’ data period included at least five years of pre-treatment crash data across all sites (the minimum period was five years and 11 months). Between ten months and over six years of after-treatment data were utilised across the road sections. A total of 2576 casualty crashes were included in the study and analysed in the following four categories: all casualty crashes, fatal and serious injury crashes (serious casualty crashes), and ‘targeted crashes’. Road crashes in Victoria are classified under the Victorian Definitions for Classifying Accidents coding (DCA) [24]. Crashes in the ‘target crash’ category were defined by the following DCAs: 120 (head-on), 150 (head-on, overtaking), 151 (out-of-control, overtaking), 170 (off-path to the left on straight carriageway), 171 (off-path to the left into parked vehicle or object on straight carriageway), 172 (off-path to the right on straight carriageway), 173 (off-path to the right into parked vehicle or object on straight carriageway), 180 (off-path on right bend), 181 (off right bend in to parked vehicle/object), 182 (off-path on left bend), 183 (off left bend into parked vehicle/object). The ‘all crash’ category included all DCAs. Due to limited detail in the data, all crashes within the entire treatment length were included in the analysis, irrespective of whether the crash was a median or roadside crash or involved barriers.
Crash frequency at each treated road section was compared to that at untreated road sections of the same route (control sites) over the same time periods, before and after treatment. Provided control sites are carefully chosen, comparing casualty and fatal and serious injury crash changes at treated sites against those at non-treated

Journal of the Australasian College of Road Safety – Volume 23 No.3, 2012
30
sites enables the effects of treatments on crash counts to be isolated from other factors that may affect crash counts in the post-treatment period. Control sites for this study were selected using postcodes or an adjacent section of the same road. The general independence of the control sites from potential confounding factors or concurrent construction projects were confirmed through VicRoads’ advice. Regression-to-the-mean is a potentially confounding influence on estimations of Black Spot and Black Length treatment effectiveness. It is caused by selecting Black Spot/Length sites for treatment that have a high casualty crash frequency measured over a narrow window in time, due to the expression of an extreme in random variation but which have the same underlying crash rate as sites not selected for treatment. Selecting sites for treatment on such a basis means that the likelihood of the casualty crash frequency at the selected site reducing in the immediate next period, merely due to chance, is high. A number of measures have been taken to limit the possibility of regression-to-the-mean effects confounding the estimates of treatment effectiveness made in this study. Firstly, a five-year time span of pre-treatment crash data has been analysed to ensure accurate estimates of pre-treatment crash frequency. In addition, overlaps were avoided between the before data period and the crash data period from which the treated sites were selected. Finally, an analysis technique was used that fully recognises the level and distribution of random variation in the data and computes confidence limits and significance probability levels that suitably reflect this [21, 22].
Results
Analysis of barrier effect was based on around 100 kilometres of wire rope barrier installed on ten prominent routes in Victoria (see Table 2). Hume Highway had the
Table 3. Location of barrier within road cross-section
Table 4. Results for casualty crashes – all crashes
Table 2. Lengths of wire rope barrier
longest length of barrier in this particular analysis followed by Western Ring Road, Monash Freeway and Western Highway. Midland Highway had the least amount of wire rope barrier that adhered to the criteria for data inclusion. Within the current dataset, around 40% of the wire rope barrier was installed along the median and the remainder more or less divided evenly between the left and right roadsides (Table 3).

Journal of the Australasian College of Road Safety – Volume 23 No.3, 2012
31
Evaluation results are presented in terms of effect on all casualty crashes, serious casualty crashes, all crash types and targeted crash types. Highlighted in each table are the results that produced statistically significant results. Given the limited availability of data and the possibility that insufficient sample size could produce insignificant findings [25], the paper refrains from making conclusions on findings that did not produce statistically significant findings irrespective of whether the findings were positive or negative. The discussion section explores potential reasons for other routes not producing statistically significant findings.
Table 4 presents results for reduction in casualty crashes (all crashes) associated with wire rope barrier installation. Relative risk refers to the risk of a casualty crash after treatment relative to the risk prior to treatment, taken as one. The risk of a casualty crash over all the evaluated routes after treatment was 0.71 (p=0.0003), or the risk of a casualty crash was reduced by an estimated 29% as a result of barrier installation. The risk of a casualty crash on the Hume Highway at the treated sites was 0.23, relative to
Table 6. Results for casualty crashes – targeted crashes
Table 5. Results for fatal and serious injury crashes – all crashes
the risk of one prior to treatment, indicating an estimated reduction of 77% (p=0.005) in the risk of a casualty crash associated with wire rope barrier use. A similar reduction of 75% (p<0.0001) in casualty crash risk was evidenced on the Eastern Freeway at treated sites.
Table 5 presents reductions in serious casualty crashes of all crash types associated with wire rope barrier installation. Overall risk of a fatal or serious injury crash reduced by 42% (p=0.0005) across all routes considered. Risk on the Hume Highway reduced by 77% (p=0.0165) and on the Eastern Freeway by 76% (p=0.0003).
Table 6 presents the associated reductions when considering only the crashes expected to be addressed by the barrier, namely, run-off-road or head-on crashes. Casualty crashes across all the routes considered were estimated to be reduced by 44% (p=0.0013). Considering each individual route, targeted crashes along the Hume Highway were expected to reduce by 79% (p=0.0322) and along the Eastern Freeway by 86% (p<0.0001).
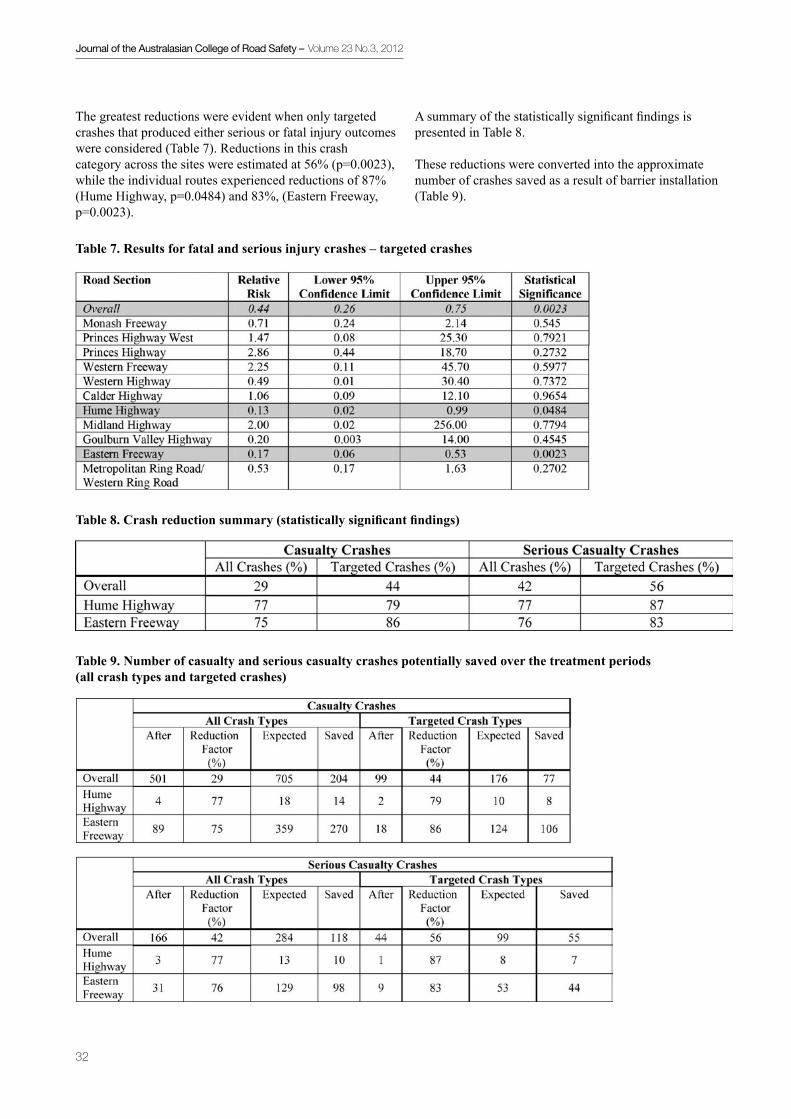
Journal of the Australasian College of Road Safety – Volume 23 No.3, 2012
32
Table 7. Results for fatal and serious injury crashes – targeted crashes
Table 8. Crash reduction summary (statistically significant findings)
Table 9. Number of casualty and serious casualty crashes potentially saved over the treatment periods (all crash types and targeted crashes)
The greatest reductions were evident when only targeted crashes that produced either serious or fatal injury outcomes were considered (Table 7). Reductions in this crash category across the sites were estimated at 56% (p=0.0023), while the individual routes experienced reductions of 87% (Hume Highway, p=0.0484) and 83%, (Eastern Freeway, p=0.0023).
A summary of the statistically significant findings is presented in Table 8.
These reductions were converted into the approximate number of crashes saved as a result of barrier installation (Table 9).

Journal of the Australasian College of Road Safety – Volume 23 No.3, 2012
33
In terms of implied crash savings, 270 casualty crashes and 98 serious casualty crashes were estimated to be saved on the Eastern Freeway alone over an approximate period of six and a half-years; along the Hume Highway, 14 casualty crashes and ten serious casualty crashes can be expected to be saved over a 21-month period. Extrapolated to annual crash saving rates, around 43 casualty crashes on the Eastern Freeway and eight casualty crashes on the Hume Highway can be expected to be saved per year of treatment. With respect to serious injury, indicative serious injury crash savings per year were 15 for the Eastern Freeway and six for the Hume Highway.
Discussion
Wire rope barrier lengths across Victoria were evaluated to determine their effectiveness on crash reduction at the installed sites. Around 100 kilometres of barrier across ten major routes were included in the analysis, with varying lengths of barriers on the left, right and road median. Results were presented in terms of overall and individual route effects on all crash types and targeted crash types, with respect to both casualty and serious casualty injury outcomes. Overall program findings suggest reductions of 29% in all casualty crashes, 44% in targeted casualty crashes, 42% serious casualty crashes, and 56% targeted serious casualty crashes. When effect estimates were considered for the two individual routes that produced statistically significant results, reductions of around three quarters in all casualty crashes and serious casualty crashes were estimated for both the Eastern Freeway and Hume Highway, and between 79% and 87% for targeted (off-road and head-on) casualty crashes and targeted serious casualty crash types. The findings focused only on reduction in injury crashes. It is noted that the implementation of continuous lengths of wire rope barrier is likely to increase the frequency of crash occurrence overall [26].
In a study design such as this, inaccuracies within the data and limited data can affect overall findings. For example, study findings depend heavily on accurate location details of the treatment. Some verification of the barrier location details was undertaken to address this through video records of road infrastructure available from VicRoads. Where there appeared to be a definite discrepancy between data and on-road barrier location details, clarification was made through VicRoads communication. Similarly, the dataset did not permit differentiation between barrier-involved crashes and crashes occurring within a treated road section, suggesting that if only those affected by the treatment were considered, the reductions are likely to be greater. Moreover, the study results are based on crash number reductions only and have not taken into account effect of changes in traffic volumes.
Nevertheless, the study results are generally comparable with some of the overseas evaluations undertaken by
Sweden, Canada, the US, NZ, and in New South Wales. Direct comparison has not been made, as comparison is difficult due to variations in parameters from one study to another. For fatalities in all crash types, evaluations in Sweden of a 2+1 wire rope barrier configuration indicate savings of up to 76% of fatalities on an ‘undivided’ 2+1 road, and up to 90% on freeways [11]. A subsequent evaluation of the effectiveness of cable barriers within 2+1 road layouts in Sweden indicated similar reductions, estimating a reduction in fatality rates of up to 82% on a 90 km/h road length [13]. A study in Alberta, Canada, of an 11 km long high-tension cable barrier installed on a median, produced preliminary results of 30 hits to the barrier over a ten-month period, none of which produced fatal injury consequences compared to the recent seven-year period prior to barrier installation along the same section of road which produced seven fatal crashes [27].
A preliminary study on the effect of wire rope barrier use on crash numbers in Oklahoma, US, found that fatalities reduced from six to one, and injuries reduced from 77 to eight, post-wire rope barrier installation [28] (approximate reductions of between 80 and 90%). Another US study of wire rope barrier effectiveness in Washington found average annual fatal median crash rates dropped from 7.2 per year to 0.8 per year (equating to a reduction of 89%) [29]. A study of 407 miles (655 km) of median cable barrier in Texas recorded a reduction of 18 fatalities and 26 incapacitating injuries (akin to serious injury definition of Victoria) [30] , in the first 12 months after barrier installation (a reduction of around 95%) [8]. Whole life cycle costs calculated in this study suggested a more favourable result for wire rope barriers over concrete barriers, contradictory to a UK study that found a form of concrete barrier, the Dutch Step Barrier, to produce a lower whole life cycle cost over a period of 50 years [31]. A NZ evaluation of around 3.5 km of median wire rope barrier estimated reductions in social costs of crashes at the site from $5,796,889 to $65,400 per year as a result of the installed wire rope barrier and reduced speed [32]. It was reported that maintenance costs increased post-barrier installation but that these costs were significantly offset by the savings in crash costs. Other potential disadvantages of the barrier when comparing it to alternatives such as concrete barriers include the potential ineffectiveness of a barrier after impact, thus requiring quicker repair time, periodic re-tensioning and the need for greater working width [33]. Table 10 summarises some of the above studies with respect to key parameters and findings.
In Australia, preliminary findings of the effectiveness of centre median wire rope barrier on the Pacific Highway in New South Wales suggest reductions of casualty crashes and cross-over crashes upon the installation of wire rope barrier [3, 34]. The results are expected to be confirmed through a subsequent study that will include a longer

Journal of the Australasian College of Road Safety – Volume 23 No.3, 2012
34
Table 10. Summary of studies quoted and respective crash reductions
after-data period. As mentioned in the introduction, an early study completed by Szwed [14] on Victorian data produced reduction figures of approximately 92% of all run-off-road casualty crashes.
While the current study looked at combined reductions in both median and roadside crashes, most of the above studies looked predominantly at median crash reductions. Potential variations in crash dynamics of the two crash types including climbing any kerbs on the median, the respective proportions of run-off-road crashes on to the roadside and to the median along the treatment length, and driver behaviour on divided roads compared to undivided roads may each affect interaction with barrier and subsequent effect; no literature was available on this at time of publishing. Based on the available data and budget constraints, project scope was restricted to the following: crash outcome categories were restricted to casualty and serious casualty only, with no distinction made between fatal and serious injury crashes. In addition, vehicle-specific analysis was not undertaken due to limited data. In particular, safety concerns raised by motorcyclists in relation to wire rope barriers have not been addressed in this paper, due in part to lack of adequate data within the existing dataset. This limited data on motorcyclist collisions with wire rope barriers in Australia creates difficulties in concluding safety effects of these barriers on motorcyclists [34, 35].A Swedish study, however, found no evidence to suggest an increase in fatal and serious injury risk to motorcyclists as a result of wire rope barrier usage on 2+1 roads, instead, reporting a reduction of 32-35% in risk of fatal and serious injury to motorcyclists when allowing for mileage [13]. There are indications that wire rope barriers have the capacity to restrain heavy vehicles although the barriers are not specifically designed to cater for heavy vehicles [36].
Little research addresses this, however, and further study is recommended.
With respect to the study results, it seems somewhat unexpected that this study produced similar reductions of at least three quarters in all four categories of casualty crashes, serious casualty crashes, targeted casualty crashes and targeted serious casualty crashes on the individual routes. The following section explores potential explanations for these partly counterintuitive results. Firstly, results indicate high reductions in not only targeted crash types but all crash types in the vicinity of the barriers, including cross-traffic crashes, right-turn crashes and rear-end crashes - crashes less likely to be affected by wire rope barriers.The actual locations from which crashes were extracted may provide an explanation for this. As barriers are generally terminated on approach to intersections (and the individual routes being highways, few intersections would exist on the treated sections), it is likely that only a limited number of intersection crashes would have been included in the analysis. Therefore, the crash types within the ‘all-crash’ category and the ‘targeted-crash’ category are then expected to be similar, producing similar reduction factors. It could also be argued that barriers may have an overall calming effect on driving performance and hence instigate generally safer driving outcomes across all crash types.
Results also counterintuitively suggest similar reductive effects on serious casualty and all casualty crashes. As barriers paradoxically present a continuous roadside hazard while simultaneously protecting the road user from other roadside hazards, the presence of barriers would be expected to play a bigger role in reducing the severity of a crash as opposed to crash frequency itself [12, 26]. A possible explanation for this result is that the barriers potentially converted the serious casualty crashes into less severe outcomes (fatal to serious injury and serious injury

Journal of the Australasian College of Road Safety – Volume 23 No.3, 2012
35
to minor), and notably, converted casualty crashes into property damage crashes, which were not included in the analysis.
The speed at which the crashes in the analysis occurred may also provide a possible explanation for the similarities in casualty and serious casualty crash reductions on the individual routes. The routes considered in the analysis were 100 km/h or 110 km/h zones. At this speed, and depending on traffic volumes, clear zone guidelines require roadside hazards to be in the vicinity of 14 metres from the edge of the carriageway [37]. At this clear zone width assuming uniform trajectory, a standard reaction time of 1.2 seconds, and typical departure angles, an errant vehicle travelling at 100 km/h is expected to collide with the object at 100 km/h, as the vehicle will travel over 30 metres prior to the driver activating the brakes[38]. Injury outcomes in these cases are expected to be serious. Proportions of casualty crashes are then likely to be similar to proportions of serious casualty crashes for targeted crash groups, hence both categories producing similar results. The study data indicated proportions of serious casualty run-off-road casualty crashes ranged from 20% to 100%; detailed crash analysis of the data would be required to investigate the extent of this influence.
Comments on differences in overall program reductions compared with individual route reductions are as follows. Results were produced with respect to individual routes and then additional analysis undertaken to give an overall indication of effectiveness across all the sites included in the analysis. The overall findings are based on substantially greater quantities of data than for individual routes, hence can potentially be considered a more reliable indicator of barrier effectiveness. However, the individual routes that produced statistically reliable findings have similar levels of statistical reliability and have confidence limits that overlap with those for overall effectiveness. This suggests that in statistical terms there is little basis for assuming a difference in the performance of barriers along the individual routes and those forming the overall sample evaluated.
Most of the routes analysed did not produce statistically significant findings. Barrier effects with non-significant results included relative risks of both greater than one and of less than one. For example, within the non-significant effects, relative risk was as low as 0.13 (p= 0.3376, ±0.002, 8.19 Goulburn Valley Highway) (Table 5), and as high as 2.86 (p=0.2732, ±0.44, 18.72, Princes Highway) (Table 7). The lack of significance and high variance in these results suggest that inadequate data exist to generate results along these routes that are credible, irrespective of effects being negative or positive. Statistical reliability in this study is influenced not only by treatment effect, but also by sample size [25] (i.e., adequate lengths of barrier, crash data
quantities as well as adequate after-periods).As barrier installation in Victoria has only gradually increased, long lengths of barrier installed early enough to provide lengthy after-periods were uncommon [39]. Additionally, barriers may not always have been introduced as a result of crash history or may be installed in short, intermittent stretches resulting in lengths of barrier with insufficient crash numbers associated with them. Such installation practices not only reduce the potential for effective barrier protection, given the degree of randomness associated with run-off-road crashes and the increased likelihood of errant vehicles slipping in between intermittent barrier lengths, it also limits the number of crashes that are appropriate to be included within the analysis. Notwithstanding these comments, it is quite possible that the lack of significance is an indication of barrier ineffectiveness. Given this uncertainty, it is suggested then that none of the non-significant effects be given much emphasis until a subsequent study can be completed with a larger dataset.
Conclusions
Roadside crashes continue to persist and a large-scale approach to address this severe crash problem is required. An evaluation was completed of limited sections of wire rope barriers installed on Victorian high-speed roads. Findings for the overall program suggested up to 56% reductions in specific crash types, and statistically significant results were produced for two of the ten individual routes; reductions of between 76% and 87% were estimated for these two routes. These reduction estimates compare well with other international studies, and as more data become available, further analysis is recommended to increase the likelihood of significant findings on individual routes. Wire rope barriers are proving to be particularly effective in reducing the severity of arun-off-road crash, while increases are predicted for property damage crashes. In response to the Victorian Parliamentary recommendations of 2010, should a large-scale mass implementation of these barriers be considered along high-speed roads, a structured, systemic implementation program rather than solely a crash-based approach is considered advantageous, capitalising on the safety and financial benefits to be gained from continuous, whole-route barrier installation. Further research to gain a more comprehensive understanding of this countermeasure is recommended, incorporating a larger and more detailed dataset, as well as evaluating the effects of barriers on all road users and the effects of barrier location.
Journal of the Australasian College of Road Safety – Volume 23 No.3, 2012
36
Acknowledgements
This project was funded through the Monash University Accident Research Centre’s Baseline Research Program for which grants have been received from the following Victorian government agencies: the Department of Justice, the Roads Corporation (VicRoads), the Transport Accident Commission (TAC) and the Victorian Police Force.
References1. Liu C, Subramanian R. Factors Related to Fatal Single-Vehicle Run-Off-Road Crashes: NHTSA, 2009.
2. VicRoads, Crashstats Data, 2010.
3. Levett S. Retro-Fitting Road Safety to Existing Rural Roads. Australasian Road Safety Research, Policing and Education Conference p2, 2009.
4. Wooldridge C. Addressing Run-Off-Road Crashes on Rural Roads p4, 2009
5. European Road Safety Observatory. Traffic Safety Basic Fact Sheets - Single Vehicle Accidents pp 3-4, 2010.
6. FARS Crash Database, 2009.
7. Corben B, Johnston I. A Strategy for Dramatically Reducing Trauma from Run-Off-Road Crashes Along High-Speed Rural Roads, Proceedings of Road Safety Research, Policing and Education Conference, pp. 4-5, 2004
8. Cooner SA, Rathod YK, Alberson DC, Bligh RP, Ranft SE, Sun D. Performance Evaluation of Cable Median Barrier Systems in Texas pp 1-2, 2009.
9. Chandler B. Eliminating Cross-Median Fatalities - Statewide Installation of Median Cable Barrier in Missouri, Transportation Research Board, p 30, 2007.
10. Hammond P, Batiste JR. Cable Median Barrier: Reassessment and Recommendations Update, Washington State Department of Transportation, pp 11, 25, 2008.
11. Larsson M, Candappa N, Corben B. Flexible Barrier Systems Along High-Speed Roads - a Life-Saving Opportunity p16, 2003.
12. NCHRP. Application of European 2+1 Roadway Designs, Report No 275, 2003.
13. Carlsson A. Evaluation of 2+1-Roads with Cable Barries: Final Report pp12-13: VTI, 2009.
14. Szwed N. Wire Rope Barriers in Victoria. ITE International Conference 2002.
15. Parliament of Victoria. Inquiry into Crashes Involving Roadside Objects p208, 2005.
16. Parliament of Victoria. Inquiry into Crashes Involving Roadside Objects p205, 2005.
17. State Government of Victoria, Arrive Alive! Strategy, 2008 – 2017, 2007.
18. Breslow NE, Day NE. Statistical Methods in Cancer Research.World Health Organisation, International Agency for Research on Cancer Scientific Publications No. 32, Lyon 1980.
19. Nicholson AJ. Estimation of the Underlying True Accident Rate: A New Procedure, Proceedings 13th ARRB Conference, Adelaide 13(9) pp 1-11, 1986a.
20. Nicholson AJ. The Randomness of Accident Counts, Accident Analysis and Prevention,.18(3) pp 193-198, 1986b.
21. Brühning E, Ernst G. Log-Linear Models in Effectiveness Studies – an Application to Simultaneous before-after Comparisons with Control Group, Evaluation ’85, International Meeting on the Evaluation of Local Traffic Safety Measure, Paris, 1985.
22. Newstead S, Corben B. Evaluation of the 1992-1996 Transport Accident Commission Funded Accident Black Spot Treatment Program in Victoria, Report No. 182: Monash University Accident Research Centre, 2001.
23. Scully J, Newstead S, Corben B. Evaluation of the Crash Effects of Strip Shopping Centre Treatments in Victoria, Report No. 279: Monash University Accident Research Centre, 2008.
24. VicRoads. Crashstats Users Guide 2008. Available from: http://crashstat1.roads.vic.gov.au/crashstats/ appendices.pdf. pp15-16.
25. Bureau of Infrastructure Transport and Regional Economics. The Black Spot Program - an Evaluation of the First Three Years pp 77, 119, 120, 2001.
26. McClanahan D, Albin RB, Milton JC. Washington State Cable Median Barrier in-Service Study p 11, 2004.
27. McGregor R, Hassan M, Lahey O. Safety Engineering for the High-Tension Median Cable Barrier on Deerfoot Trail, Calgary Alberta (Alberta Transportation) pp11-12, 2008.
28. Turner-Fairbank Highway Research Centre. Oklahoma’s Experience with Wire Rope Safety Fence,2008; (on-line powerpoint presentation, ): Available from: http://www. fhwa.dot.gov/research/tfhrc/projects/safety/ comprehensive/elcsi/ppt/presentation18.cfm.
29. MacDonald DB, Batiste JR. Cable Median Barrier Reassessment and Recommendations, Chapter 3, p43, 2007. 30. US National Highway Traffic Safety Administration. Fars Coding and Validation Manual, Fatality Analysis Reporting (Fars) 2006: Available from: http://www-nrd. nhtsa.dot.gov/Pubs/FARS06CVMan.pdf.
31. Williams G. Whole Life Cost Benefit Analysis for Median Safety Barriers pp 40-42: Transportation Research Laboratory, 2007.
32. Marsh F, Pilgrim M. Evaluation of Narrow Median Wire Rope Barrier Installation on Centennial Highway, New Zealand, Journal of the Australasian College of Road Safety, 2010.
33. Sheikh N, Alberson D, Chatham L. State of the Practice of Cable Barrier Systems, Journal of the Transportation Research Board No. 2060 pp84-91, 2008.
34. Austroads. Evaluation of the Safety Impact of Centre-of-the-Road Wire Rope Barrier (Wrb) on Undivided Rural Roads, No. AP–T135/09, 2009.
Journal of the Australasian College of Road Safety – Volume 23 No.3, 2012
37
Crash performance of safety barriers on high-speed roadsby C Jurewicz and L Steinmetz, ARRB Group Ltd., Melbourne
35. Grzebieta R, Jama H, McIntosh A, Friswell R, Favand J, Attard M, Smith R. Overview of Motorcycle Crash Fatalities Involving Road Safety Barriers p42, 2009.
36. Jacques N, Franklyn M, Corben B, Candappa N. The Investigation of the Performance of Safety Barriers in Relation to Heavy Vehicle Crashes: Unpublished report for VicRoads, 2003.
37. AustRoads. Part 6: Roadside Design, Safety and Barriers, AGRD06/10 p15, 2009.
38. Corben B, Logan D, Candappa N, Peiris S. Outcome-Based Clear Zone Guidelines unpublished report for VicRoads, 2008.
39. VicRoads, Crash Dataset, 1995-2007.
Abstract
The findings presented in this paper are based on Austroads-funded investigations of the in-service effectiveness of safety barriers on high-speed roads (that is, roads with 100 and 110 km/h speed limits). Based on past evaluations, the most promising was continuous application of flexible barriers on freeways addressing up to 86% of run-off-road and cross-median casualty crashes. Analysis of Victorian barrier crash data from high-speed roads suggested that the severity index for run-off-road casualty crashes (FSI ratio) was 0.58 for semi-rigid barrier crashes compared with 0.75 for tree crashes. Severity of run-off-road casualty crashes into semi-rigid barriers was comparable to those not involving a roadside hazard (FSI ratio of 0.55). In contrast, flexible barriers had the lowest FSI ratio of 0.38. Continuous flexible barriers appeared to be the most effective safety barrier solution among those reviewed.
Investigation of the effect of semi-rigid barrier offset from the edge line showed that the FSI ratio increased at a low rate with increasing barrier offset (~0.03, or 5% per m), although the relationship was not statistically robust. Combined with earlier research on barrier crash likelihood, the suggested ideal range for barrier installation could be in the range of 1.5 to 4 metres to allow for sealed shoulder provision. These findings may be useful in refinement of barrier selection and design guidance.
Keywords
Barrier offset, In-service, Run-off-road crash, Safety barriers, Severity
Introduction
This paper presents key findings arising from an investigation of the in-service effectiveness of safety barriers in controlling the likelihood and severity of run-off-road casualty crashes on high-speed roads. The findings presented here are drawn from a four-year Austroads study
on improvements to roadside safety in the Safe System context. They extend on the previous research by focusing on in-service performance of barriers of different types and at different offsets.
Background
Run-off-road casualty crashes contribute significantly to the nation’s road toll. Across Australia, approximately 30% of fatalities and serious injuries are caused by run-off-road crashes. Approximately half of these fatalities occur in rural and regional areas [1, 2].
The Safe System vision underpinning the national (NRSS) and Victorian (VRSS) road safety strategies [1, 2] seeks to prevent run-off-road deaths and serious injuries. This is progressed through promotion of solutions which minimise the occurrence of such crashes (e.g. electronic stability control in vehicles, improved linemarking), and through provision of more forgiving roadsides when such crashes occur. This latter approach involves the application of various roadside design and safety solutions aimed at improving the chances of recovery back onto the road (e.g. sealed shoulders). Further, it includes solutions deflecting or dissipating the kinetic energy of an errant vehicle so that occupants do not sustain life-threatening injuries. Part of this suite of solutions involves the installation of safety barriers along roadsides and medians to shield errant motorists from more severe roadside hazards.
Role of safety barriers
An assessment of roadside hazards may find that their removal, relocation or modification is not feasible (for example, where there are major structures such as bridge abutments, drop-offs or significant roadside trees). In such cases, safety barriers are typically considered. In recent years, more barriers have been applied in medians onhigh-speed divided and undivided roads to addressrun-off-road and head-on crash risk [3].

Journal of the Australasian College of Road Safety – Volume 23 No.3, 2012
38
Austroads roadside design guidelines [3] suggest that the likelihood of a vehicle colliding with a barrier is higher than the likelihood of colliding with the hazard. This assumption is based on a longer length of exposure and a greater proximity to traffic. The key condition in selection of a barrier, therefore, is an expectation that the severity of a barrier vehicle impact would be lower than the severityof impact with the hazard being shielded. Thus the net result is expected to be an improvement in roadside safety or prevention of future crashes.
Methodology
There are many useful measures of safety barrier performance used in the context of standard crash tests. These are carried out under controlled impact speed, angle and vehicle mass conditions and produce such indicators of crash severity as Theoretical Head Impact Velocity (THIV), the Post-impact Head Deceleration (PHD) and the Acceleration Severity Index (ASI) [4]. Nevertheless, such tests cannot indicate how the barrier would perform when exposed to the vehicle fleet in a given jurisdiction, or when applied in a particular road environment. Crash tests are unlikely to provide reliable information about the change in likelihood of a casualty crash after installing a barrier at a particular offset from traffic.
This investigation sought to indicate in-service performance of different barrier options in high-speed road environments. The investigation focused on past evaluation studies and the development of crash severity indices. The aim was to provide performance indicators related to barrier crash likelihood and severity. Such indicators could be used in the comparison of different design options, for example.
The following sub-sections describe the methods applied in the investigations.
Literature review – crash likelihood
The study began with a review of recent barrier effectiveness evaluation studies. For this purpose, a search was undertaken of the Australian Transport Index (ATRI), the Transportation Research Information Service (TRIS), Transport Online and the internet to identify the relevant publications. The review sought to estimate run-off-road casualty Crash Reduction Factors (CRFs) for different barrier types and applications.
The approach of reviewing past studies of the crash reduction effectiveness of barriers was preferred to the comparative analysis of crash rates between locations with and without safety barriers. Preliminary data investigations suggested that locations with barriers generally had a higher casualty crash rate than the network average. This was unlikely to be a causal relationship but rather a reflection
of the installation of barriers at higher crash risk locations (e.g. curves). Accordingly, a review of before/after safety barrier evaluations was more likely to indicate the true effectiveness of barrier installation.
Data analysis – crash severity
A run-off-road crash database was created for the purpose of comparative investigation of average severityrun-off-road casualty crashes into barriers of different types, in different high-speed road environments and at different offsets from traffic. Early in the investigation, it became clear that crash data were insufficient to provide meaningful analysis of crash cushions/attenuators, motorcyclist safety barrier retrofits, end treatments and transitions. Therefore, the investigation focused on barrier sections.
A database was developed to provide a sample of crashes for investigation. The database was prepared by extracting VicRoads crash data for speed environments of 100 km/h and 110 km/h. The crash period spanned ten years(2000 – 2009). Only run- off-road casualty crashes were extracted (excluding intersections). The crash data were limited to passenger vehicles and rigid trucks. A total of 12,216 crashes were extracted and, of these, 7655 were single vehicle into a single object crashes. Only 500 of these crashes were into a safety barrier (6.5%). Crashes were categorised into rural and urban.
The next step involved selection of a sample of crashes which included information relating to barrier type and barrier offset from the traffic lane. To obtain a representative sample of crashes into each barrier type,the adopted sampling regime was to select crashes from the sample of 500 barrier crashes, from each road environment, based on a random number generator. Final crash selection was dependent on clear police descriptions and location details, enabling the hit barriers to be located. This was subject to random error and some crashes had to be set aside. This method was considered to have minimised selection bias. A total of 289 crashes were included in this data set.
The detailed crash summary, police diagrams, satellite, aerial and site photography were used to determine barrier type and offset from the edge line. The offset information was accurate to the nearest 0.5 metre.
The next step focused on the development of FSI ratios1
associated with different barrier types and different offsets in a given road environment. The FSI ratio is a useful indicator of how close a given crash scenario is to the Safe System ideal of zero fatal and serious injuries per crash. It can be used in assessing crash severity changes due to safety treatments (e.g. tree crashes compared with safety barriers).
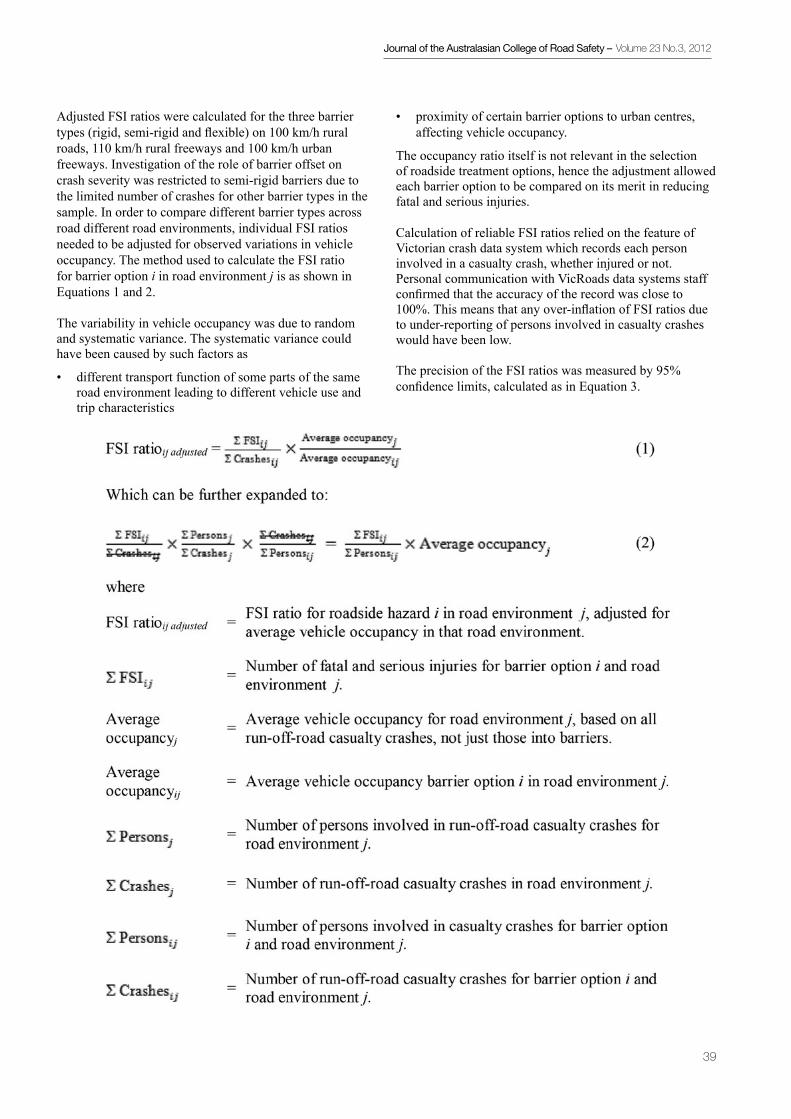
Journal of the Australasian College of Road Safety – Volume 23 No.3, 2012
39
• proximity of certain barrier options to urban centres, affecting vehicle occupancy.
The occupancy ratio itself is not relevant in the selectionof roadside treatment options, hence the adjustment allowed each barrier option to be compared on its merit in reducing fatal and serious injuries.
Calculation of reliable FSI ratios relied on the feature of Victorian crash data system which records each person involved in a casualty crash, whether injured or not. Personal communication with VicRoads data systems staff confirmed that the accuracy of the record was close to 100%. This means that any over-inflation of FSI ratios due to under-reporting of persons involved in casualty crashes would have been low.
The precision of the FSI ratios was measured by 95% confidence limits, calculated as in Equation 3.
Adjusted FSI ratios were calculated for the three barrier types (rigid, semi-rigid and flexible) on 100 km/h rural roads, 110 km/h rural freeways and 100 km/h urban freeways. Investigation of the role of barrier offset on crash severity was restricted to semi-rigid barriers due to the limited number of crashes for other barrier types in the sample. In order to compare different barrier types across road different road environments, individual FSI ratios needed to be adjusted for observed variations in vehicle occupancy. The method used to calculate the FSI ratio for barrier option i in road environment j is as shown in Equations 1 and 2.
The variability in vehicle occupancy was due to random and systematic variance. The systematic variance could have been caused by such factors as
• different transport function of some parts of the same road environment leading to different vehicle use and trip characteristics

Journal of the Australasian College of Road Safety – Volume 23 No.3, 2012
40
Findings
Findings on the in-service performance of barriers inhigh-speed road environments are presented in three parts:
• literature review findings of crash reduction effectiveness of different barrier applications • analysis of the severity of run-off-road casualty crashes into different barrier types• analysis of the severity and likelihood of run-off-road crashes into semi-rigid barriers at different offsets from the traffic lane.
Crash reduction effectiveness of barriers (literature review)
Installation of barriers as a road safety treatment on high-speed roads has been the subject of numerous evaluations in Australia and overseas. Most studies identified in the literature review reported substantial reductions in
run-off-road casualty crash frequency. Table 1 lists results of several such evaluations of different barrier applications on high-speed roads. It is clear that barrier installations have contributed to substantial reductions in severerun-off-road crashes. This was even more evident when flexible barriers were applied.
The identified evaluations of median flexible barrier applications suggest very high crash reductions for severe run-off-road and cross-median head-on crashes. A common theme of these three examples was the continuous nature of barrier application, i.e. in long sections shielding all hazards regardless of their relative risk to errant vehicles.
The literature review also found several local studies dealing with the severity of run-off-road crashes into barriers. A New South Wales study found that a ratio of casualty crashes to all recorded crashes for flexible barriers was half of that for semi-rigid and rigid barriers [14]. A South Australian study [15] found that the lateral speed of
The standard error t-values and standard errors (SE) were calculated for each component of Equation 3, as shown in Equations 4 and 5.
The size of the confidence interval range indicates the level of certainty in the result. That is, a narrow range indicates that the actual FSI ratio is equal to, or very close to, the calculated value.
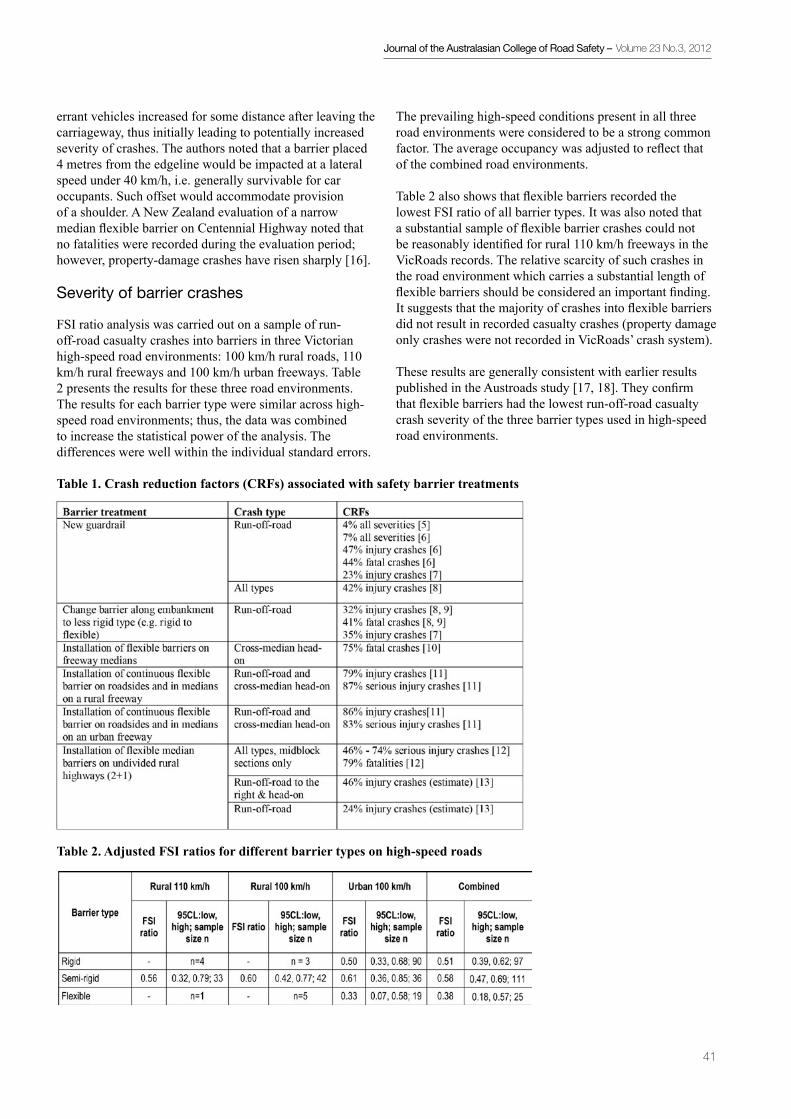
Journal of the Australasian College of Road Safety – Volume 23 No.3, 2012
41
Table 1. Crash reduction factors (CRFs) associated with safety barrier treatments
Table 2. Adjusted FSI ratios for different barrier types on high-speed roads
errant vehicles increased for some distance after leaving the carriageway, thus initially leading to potentially increased severity of crashes. The authors noted that a barrier placed 4 metres from the edgeline would be impacted at a lateral speed under 40 km/h, i.e. generally survivable for car occupants. Such offset would accommodate provision of a shoulder. A New Zealand evaluation of a narrow median flexible barrier on Centennial Highway noted that no fatalities were recorded during the evaluation period; however, property-damage crashes have risen sharply [16].
Severity of barrier crashes
FSI ratio analysis was carried out on a sample of run-off-road casualty crashes into barriers in three Victorian high-speed road environments: 100 km/h rural roads, 110 km/h rural freeways and 100 km/h urban freeways. Table 2 presents the results for these three road environments. The results for each barrier type were similar across high-speed road environments; thus, the data was combined to increase the statistical power of the analysis. The differences were well within the individual standard errors.
The prevailing high-speed conditions present in all three road environments were considered to be a strong common factor. The average occupancy was adjusted to reflect that of the combined road environments.
Table 2 also shows that flexible barriers recorded the lowest FSI ratio of all barrier types. It was also noted that a substantial sample of flexible barrier crashes could not be reasonably identified for rural 110 km/h freeways in the VicRoads records. The relative scarcity of such crashes in the road environment which carries a substantial length of flexible barriers should be considered an important finding. It suggests that the majority of crashes into flexible barriers did not result in recorded casualty crashes (property damage only crashes were not recorded in VicRoads’ crash system).
These results are generally consistent with earlier results published in the Austroads study [17, 18]. They confirm that flexible barriers had the lowest run-off-road casualty crash severity of the three barrier types used in high-speed road environments.

Journal of the Australasian College of Road Safety – Volume 23 No.3, 2012
42
Placing these results in context, the adjusted FSI ratio for a run-off-road casualty crash into a tree on high-speed roads was found to be 0.75, and 0.55 into a roadside without hitting a hazard (akin to a very wide clear zone scenario) [19]. It is clear that, in the investigated road environments, flexible barriers provided the most favourable crash severity outcome.
It should be noted that these findings were based on limited crash data from one jurisdiction. The confidence limits around the results show that the findings were of variable robustness. The key trends, however, are consistent with previous literature, e.g. [14].
Effect of barrier offset on barrier safety performance
There is currently little evidence relating to the effect that the position of a safety barrier has on the likelihood of a run-off-road casualty crash and its severity. The barrier design guidelines [3] suggest that barriers placed closer to the traffic will be hit more frequently. They also point out that the severity of crashes may increase with wider offset due to increased angle of impact. Little more detail is provided. This part of the paper seeks to provide more clarity in this area.
The effect on the FSI ratio of barrier offset from the traffic lane was investigated as part of the Austroads study. The database of 289 barrier crashes described earlier was expanded using random sampling to include some multiple-vehicle and multiple-object crashes, to boost the sample size at different offset values. Only semi-rigid barriers had a sufficiently large dataset to warrant further analysis. The data were combined across all three high-speed road environments. The adjusted FSI ratios were plotted against barrier offset to determine if there was any correlation between the two variables. Figure 1 presents the results. The barrier offset (to the nearest 0.5 m) was plotted against the mean FSI ratio for that semi-rigid barrier offset. The 95% confidence limits (dotted lines) indicate the robustness of each mean – the narrower the range, the more precise is the result.
The relationship suggests that barrier crash severity may be increasing with barrier offset. This would not be surprising as previous investigations showed that the impact angle tends to increase with depth of penetration of the roadside [15, 17]. Also, crash reconstructions [15] demonstrated that the lateral speed of a yawing errant vehicle increases for several metres after leaving the road. This would suggest a higher impact force and crash severity at greater offsets. Overall, the relationship in Figure 1 suggests a 40% increase in deaths and serious injuries per run-off-road casualty crash across the reported range of barrier offsets (≤0.5 to 7.0 m). This represents an approximate increase in
Figure 1. Changes in FSI ratio with semi-rigid barrier offset from traffic lane (high-speed road environments)
FSI ratio of 0.03 per each additional metre of offset, or 5%, from the FSI ratio of 0.55 at 0.5 m or less.
The relationship in Figure 1 is not statistically significant at p≤ 0.05, although the data points between 1.5 and 3.5 metres have a relatively low standard error, and this seems to confirm the overall trend. It should also be noted that the offset measurements were accurate to the nearest 0.5 m.
Drawing on the results from an earlier stage of the Austroads study [17], Figure 2 presents the changes in the relative risk of a run-off-road casualty crash into a semi-rigid barrier with its offset from the edge line (accurate to within 0.5 m). The dotted lines represent the 95% confidence intervals. The baseline risk of 1.0 was chosen to be in the run-off-road casualty crash rate in the offset range 2 – 3 metres, where the risk was lowest and the data most robust. The same three high-speed road environments were used in the analysis, although the data were obtained through the creation of a different type of database. The graph shows that the likelihood of a run-off-road casualty crash was highest when the barriers were placed within the first one metre of the traffic lane. The risk remained relatively constant at greater offsets. The results in the first 3.5 metres were statistically significant at the 0.05 < p < 0.1 level.
Discussion
The combined results from Figures 1 and 2 suggest a possible offset range in which semi-rigid barriers could be installed for a maximum safety benefit. Given the reduction in crash likelihood in the first 1.5 metres, a suggested minimum barrier offset could be 1.5 metres, where possible.

Journal of the Australasian College of Road Safety – Volume 23 No.3, 2012
43
Figure 2. Change in relative risk of run-off-road casualty crashes into semi-rigid barriers with different offsets fromthe traffic lane (high-speed road environments) Source: based on [12]
The upper end of the range is somewhat arbitrary as the precision of both relationships becomes very low at higher offset values. Given the low rate of the FSI ratio increase in Figure 1, an upper range for offset could be 3 – 4 metres to accommodate adequate shoulders which would further reduce run-off-road crash likelihood [19]. This could be a reasonable trade-off for a slightly higher FSI ratio. These suggested lower and upper offset limits apply to semi-rigid barriers in high-speed environments only.
The investigation reflected on the small amount of barrier run-off-road casualty crash data generated over ten years across an entire state. Only 6.5% of single vehicle crashes into a single roadside hazard involved barriers, and very few crashes involved flexible barriers. There has been a strong growth in installation of flexible barriers on high-speed roads since the early 2000s funded by the Traffic Accident Commission road safety programs. Estimates of safety barrier length by state in Jama et al. [20] suggested that flexible barriers constituted 27% of barrier length in Victoria. Run-off-road casualty crashes into flexible barriers constituted only 10% of the barrier crash sample in the Austroads study (in road environments with speed limits between 60 and 110 km/h). When considering this in the context of substantial CRFs for flexible barriers, it would be reasonable to conclude that flexible barriers rarely result in casualty outcomes.
Given the variable statistical robustness of the results, the observed findings should be viewed with caution when considering changes to design practice. Also, findings from one state are not necessarily applicable across all jurisdictions. Nevertheless, it can be summed up that the
findings presented in this paper appear to confirm the current design guidance, and could be considered in its future refinement.
Conclusions
The findings presented in this paper are based on Austroads-funded investigations of the in-service effectiveness of safety barriers, carried out as part of a broader four-year study into improvements to roadside safety. This paper focused on high-speed roads.
The paper proposed a number of Crash Reduction Factors (CRFs) based on past barrier effectiveness evaluation studies. It was found that continuous installation of flexible barriers on urban freeways reduced the incidence ofrun-off-road casualty crashes by as much as 86%. This result implied that the application of continuous flexible barriers was the most effective safety barrier solution among those reviewed.
Analysis of ten years of Victorian crash data based on 100 km/h rural roads, 110 km/h rural freeways and 100 km/h urban freeways showed that run-off-road casualty crashes into semi-rigid barriers were 23% less severe than similar crashes into trees in the same high-speed road environments (FSI ratio of 0.58 vs. 0.75). The severity of run-off-road casualty crashes into rigid or semi-rigid barriers was comparable to those not involving roadside hazards, as in cases of very wide clear zones (0.58 vs. 0.55). The least severe outcome was for crashes into flexible barriers, with the FSI ratio of 0.38.
It was noted that run-off-road casualty crashes into flexible barriers were substantially under-represented in the crash sample. When considering this in the context of substantial CRFs and low FSI ratio for crashes into flexible barriers, it would be reasonable to conclude that flexible barriers rarely result in casualty outcomes. When they do, these outcomes are less severe than for similar crashes into other barriers or into roadsides without hazards.
Further analysis of semi-rigid barriers showed that their offset from the edge line may have the effect of increasing the severity of the barrier crash. It was estimated that the FSI ratio increased at a rate of 0.03 per each additional metre of offset, or by 40% over the reported range between 0.5 and 7 metres. Also, results drawn from another investigation in the same study showed that the relative likelihood of a run-off-road casualty crash reduced most sharply in the first 1.5 metres from the edgeline and remained relatively constant at wider offsets. Hence, the findings suggest a possible ideal range for barrier placement would be between 1.5 metres and about 3 – 4 metres to allow road space for a sealed shoulder where required.

Journal of the Australasian College of Road Safety – Volume 23 No.3, 2012
44
Overall, the study findings appear to confirm the current design guidance on high-speed roads. In particular, the findings strongly support the use of flexible barriers. The findings may help to refine this practice through more risk-conscious selection of barrier offsets.
Acknowledgements
The authors would like to extend their thanks to VicRoads for the provision of data for the Austroads project, and to project team members Cara Philips, Adrian Lim, Dr Peter Cairney, Will Hore-Lacy, Colin Brodie and Michael Tziotis for their valuable input into the project.
Notes1 FSI ratio is a crash severity index. In this study it is an averaged ratio of fatal and serious injuries sustained per run-off-road casualty crash into a given roadside hazard [19].
References
1. Australian Transport Council. National Road Safety Strategy 2011 – 2020. Canberra: ATC, 2011.
2. VicRoads. Victoria’s Road Safety Strategy, arrive alive 2008 – 2017, Kew: VicRoads, 2008.
3. Austroads. Austroads guide to road design, part 6: roadside design, safety and barriers. AGRD AGRD06/10. Sydney, NSW: Austroads, 2010.
4. AASHTO. Manual for assessing safety hardware, MASH-1. Washington DC, USA: American Association of State Highway and Transportation Officials, 2009.
5. Ermer DJ, Fricker JD & Sinha KC. Accident reduction factors for Indiana. Report JHRP-91-11. Indianapolis, Indiana, USA: School of Civil Engineering, Purdue University & Indiana Department of Transportation, 1991.
6. Federal Highways Administration (FHWA). Crash modification factors (CMF) clearinghouse. Washington, DC, USA: University of North Carolina Highway Safety Research Center. Viewed 19 December 2011. <http://www.cmfclearinghouse.org/index.cfm>.
7. ADOT. ‘Benefit/cost ratio economic analysis, section 231’, in Traffic Engineering Policies, Guides and Procedures (PGP). Arizona, USA: Arizona Department of Transportation, 2009.
8. Scully J, Newstead S, Corben B & Candappa N. Evaluation of the effectiveness of the $240M statewide blackspot program-accident blackspot component. Clayton, Victoria: Monash University Accident Research Centre, 2006.
9. Elvik R, Høye A, Vaa T & Sørensen M. The handbook of road safety countermeasures, 2nd edn. Bingley, UK: Emerald, 2009.
10. Ray M, Silvestri C, Conron C & Mongiardini M. Experience with cable median barriers in the United States: design standards, policies, and performance. Journal of Transportation Engineering 2009, vol.135, no. 10, pp. 711-20.
11. Candappa N, D’Elia A, Corben B & Newstead S. Evaluation of the effectiveness of flexible barriers on Victorian roads. Clayton: Monash University Accident Research Centre, 2009. Viewed 1 June 2012. http:// www.monash.edu.au/miri/research/reports/muarc291.pdf
12. Carlsson A. Evaluation of 2+1-roads with wire rope barrier: final report. VTI report 636A. Linkoeping, Sweden: Swedish National Road and Transport Research Institute, 2009.
13. Austroads. Evaluation of the Safety Impact of Centre- of-the-road Wire Rope Barrier (WRB) on Undivided Rural Roads. AP-T135/09. Austroads, Sydney, NSW: Austroads, 2009.
14. Levett S, Tang J & Saffron D. Applying Safety Countermeasures Incrementally to Existing Roads. In Australasian Road Safety Research, Policing and Education Conference, Sydney, NSW: 2009.
15. Doecke SD & Woolley JE. Further investigation into the effective use of clear zones and barriers in a safe system’s context on rural roads. In Australasian road safety research, policing and education conference. Perth, WA. 2011.
16. Marsh, F & Pilgrim M. Evaluation of narrow median wire rope barrier installation on Centennial Highway, New Zealand, Journal of the Australasian College of Road Safety, November, Vol. 21 No. 2, 2010. pp.34–42.
17. Jurewicz C & Pyta V. Improving roadside safety: interim report stage 2. Austroads, Sydney, NSW: Austroads, 2011.
18. Jurewicz C, Lim A, McLean J & Phillips C. Improving roadside safety: interim report stage 3. Sydney, NSW: Austroads, 2012.
19. Jurewicz C, Steinmetz L, Phillips C & Lim A. Improving roadside safety: final report. Sydney, NSW: Austroads, in-press.
20. Jama HH, Grzebieta RH, Friswell R & McIntosh AS. Characteristics of fatal motorcycle crashes into roadside safety barriers in Australia and New Zealand, Accident Analysis and Prevention 2010; vol. 43, no. 2011, pp. 652- 60.

Journal of the Australasian College of Road Safety – Volume 23 No.3, 2012
45
Contributed articlesA dim view of pedestrian safety: Raising awareness of the needs of vision-impaired pedestriansby Caroline Maplesden, Orientation and Mobility Instructor, Vision Australia, Geelong, Victoria
Introduction
This article will explain the travel skills used by vision-impaired pedestrians. It is based on my personal experience working and walking alongside people who are blind or have low vision. My objective is to raise the awareness of other professionals, whose work roles or personal interests provide the opportunity to act on suggestions to improve the safety of all pedestrians, particularly those with a disability.
If you were to wake up blind tomorrow from a car accident or have an eye disease severe enough to reduce personal safety, you would be offered assistance from an Orientation and Mobility Instructor like myself, to maintain independent travel. My own training included months of blindfold and low vision simulator travel using a white cane. Trainers of Seeing Eye dogs complete a separate cadetship, and we are usually employed by not-for-profit agencies. Knowing I can remove my blindfold is an important difference between my experiences and those of my students. Instructors work with adults who need to shop, reach their community and commute to work, with children who need skills to attend school, and elderly people who need to remain active and independent.
Variations in disability and outcomes
Blindness, and what may be accomplished using other senses or residual vision, is not well understood by the general public. The type and progression of an eye disease determines what vision remains. For example, glaucoma results in a tunnel view where hazards to the side are missed; vision is worse at night. Cataracts reduce contrast, more so in glare. A stroke may eliminate exactly half of the visual field, left or right. Macular degeneration causes distortion, obscures central hazards and affects colour vision.
A visual acuity reduced to less than 6/60 in the better eye after correction, or a field of view restricted to 10 degrees or less, qualifies as legal blindness. A licence to drive a car generally requires 6/12 in the better eye and 110
degrees of horizontal field. An Australian survey in 2009 estimated 575,000 people over age 40 have a vision loss, defined as less than 6/12 acuity in both eyes [1]. At least 90% of legally blind people have some remaining vision. Whether their vision will avoid a particular hazard or locate an available clue will depend on lighting, contrast, speed and proximity, amongst other factors. Similarly to other pedestrians, they may also have a hearing, physical or cognitive disability which will impact on their training and outcomes. Their decision to walk (or use a wheelchair) within the public road network must be acknowledged as more than a choice – it is a necessity. If a person cannot hold a driver’s licence or ride a bicycle safely, walking is their only option to avoid dependence for the rest of their life. In my experience, the people I teach will continue to travel independently if they do not continually have bad experiences.
Mobility aids for independent travel
A white cane is the internationally recognised symbol of vision impairment. There are three common types. A short white cane may be displayed for identification, for example when residual vision is generally adequate for close hazards but not to judge the approach of traffic. Support canes can be white to satisfy both needs. Correct use of a long white cane will check the ground surface ahead for each footfall and provide one stride’s warningof obstacles or drop-offs. White canes can be folded up out of view and used occasionally. People who choose not to use a white cane usually say they do not want pity or to show their vulnerability. There are only minor references in information for learner drivers about the meaning of a white cane. A driver can wrongly assume eye contact with a pedestrian who has a vision loss. Road safety programs that support the public education provided by blindness organisations would be welcome.
Seeing Eye dogs are on duty when in harness, and are depended on for safety. If you pat one without permission you risk snarls from the owner. Legislation permits them

Journal of the Australasian College of Road Safety – Volume 23 No.3, 2012
46
entry to all public venues, including restaurants and taxis. Contrary to popular myth, Seeing Eye dogs do not interpret traffic lights. Aside from being colour blind they wait for the ‘pack leader’, who must be the owner, to give instructions about when to turn, what to lead towards and when to cross the road. A Seeing Eye dog should only ‘intelligently disobey’ if there is a necessity for mutual safety.
Your offer of assistance to a vision-impaired person, if they appear to need it, may be very welcome. Offer your elbow and stay half a pace ahead. Stop at any edges until they are also level with the edge, before you step up or down. They will feel the rise or drop of your elbow, then follow. Give directions left or right from their perspective and use specific words – ‘over there’ is nowhere.
Senses and the environment
Mobility lessons optimise residual vision and other sensory information. Looking upwards or to the side may provide better vision to people with reduced central acuity. The expression ‘facial vision’ usually refers to hearing the reflection of sound waves by a close object. Mental imagery of their surroundings is a conceptual skill, developed to high levels by some people. Maintaining a constant position of sunlight, or the sun’s warmth on exposed skin, can reduce veering. Facing towards the sun and listening to a ‘talking watch’ provides the north compass direction (halfway between the sun and the hour) for orientation. A watch can also be tactile. I-pads can photograph the bus timetable then enlarge the print. Applications of technology are continually created and shared, including GPS.
People with a vision loss generally say that white vehicles, and those with lots of glinting chrome on sunny days, are easier to see than dark cars and grey or metallic colours that blend into an asphalt horizon. Such information may influence decisions about purchases of fleet vehicles or of your own car. Daytime use of headlights also helps detection.
Hearing
Changes in engine or gear noises can suggest a vehicle is slowing to make a turn. Traffic surge noise must be in both directions to eliminate the possibility the noise relates to a green arrow for an advanced turn. Perpendicular or parallel noise assists orientation. Listening for idling vehicle engines at an intersection (the motor vehicle stop line) assists the vision-impaired pedestrian when beginning or completing a road crossing. Providing ‘head start boxes’ or ‘advanced stop lines for cyclists’ [2] may move the useful noise clue further away.
Anyone who stands with closed eyes at a roundabout, remembering that drivers look towards the right for other traffic and do not have to give way when turning, will appreciate the courage it takes to step out. Eye contact with the driver or detecting indicator lights may not be possible. Pedestrian facilities within a reasonable distance of busy roundabouts should be planned.
The quiet motor of an electric bicycle or hybrid/electric car are an increasing hazard for vision-impaired pedestrians. Detecting quiet vehicles in driveways or parking lots is especially difficult. Halfway refuges do reduce the complexity of judging both directions of approaching traffic but do not provide assurances of when it is safe to cross.
The source of a ticking audio-tactile device must be louder than ambient noises. The faster louder ticking informs when a crossing can be commenced, but silence during the last metres of a long crossing is not helpful. A device that provides only audible ticking is less helpful than one providing both audio and a vibrating pulse. Tactile pulses are felt with the fingertips to confirm which signal for which corner is active and are especially useful for people with severe or unequal hearing loss.
Feeling underfoot
Tactile Ground Surface Indicators (TGSI) are discerned underfoot, by cane tip or their contrasting colour. Ivory on white concrete is not best practice. A grid of hazard bumps indicates the ground surface will be changing; a ramp, stairs or train platform edge may be imminent. Hazard bumps should be placed exactly opposite the next patch of bumps to walk towards, and a user’s feet should not be pointed towards the centre of an intersection. Directional indicators (parallel bars) must commence at the building line and be wide enough for pedestrians not to miss them between strides. TGSI which are installed at correct depths should not be a tripping hazard. Gradient and camber underfoot can be interpreted. Sideways can warn that a driveway has been veered into; downwards can indicate the approach to a pram ramp.A wide strip of a soft recycled tyre product (possibly the same as is used on a footpath to slow skateboards) can be easily detected underfoot and could be tried as a tactile clue for vision-impaired pedestrians.
Hazards
White canes do not protect above waist height (an exception is overseas electronic models). When a sign is installed too low, or branches not trimmed back, or roof-rack loads protrude over a pedestrian crossing, there is potential for injury. Where paths are ‘not available’, white cane skills might track the edge of a vehicle lane or grass verge. You could inspect your local streets to appreciate the difficulties caused by breaks in continuous access along a route.
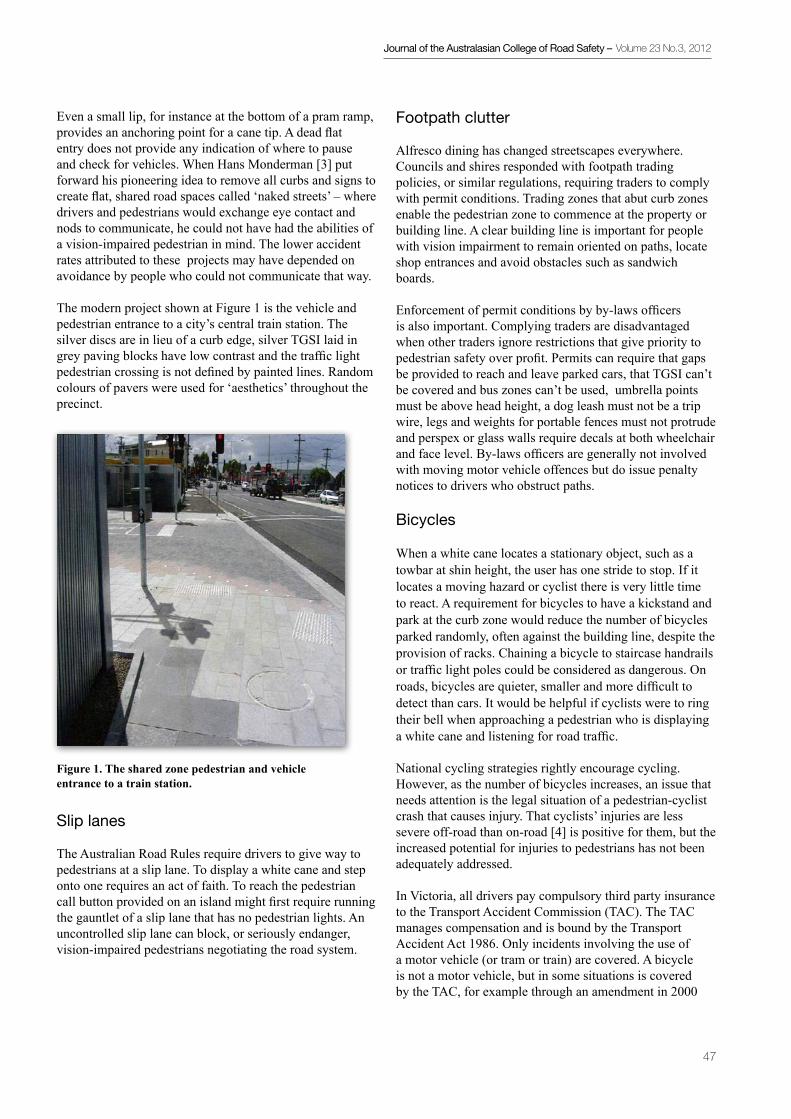
Journal of the Australasian College of Road Safety – Volume 23 No.3, 2012
47
Figure 1. The shared zone pedestrian and vehicle entrance to a train station.
Even a small lip, for instance at the bottom of a pram ramp, provides an anchoring point for a cane tip. A dead flat entry does not provide any indication of where to pause and check for vehicles. When Hans Monderman [3] put forward his pioneering idea to remove all curbs and signs to create flat, shared road spaces called ‘naked streets’ – where drivers and pedestrians would exchange eye contact and nods to communicate, he could not have had the abilities of a vision-impaired pedestrian in mind. The lower accident rates attributed to these projects may have depended on avoidance by people who could not communicate that way.
The modern project shown at Figure 1 is the vehicle and pedestrian entrance to a city’s central train station. The silver discs are in lieu of a curb edge, silver TGSI laid in grey paving blocks have low contrast and the traffic light pedestrian crossing is not defined by painted lines. Random colours of pavers were used for ‘aesthetics’ throughout the precinct.
Slip lanes
The Australian Road Rules require drivers to give way to pedestrians at a slip lane. To display a white cane and step onto one requires an act of faith. To reach the pedestrian call button provided on an island might first require running the gauntlet of a slip lane that has no pedestrian lights. An uncontrolled slip lane can block, or seriously endanger, vision-impaired pedestrians negotiating the road system.
Footpath clutter
Alfresco dining has changed streetscapes everywhere. Councils and shires responded with footpath trading policies, or similar regulations, requiring traders to comply with permit conditions. Trading zones that abut curb zones enable the pedestrian zone to commence at the property or building line. A clear building line is important for people with vision impairment to remain oriented on paths, locate shop entrances and avoid obstacles such as sandwich boards.
Enforcement of permit conditions by by-laws officers is also important. Complying traders are disadvantaged when other traders ignore restrictions that give priority to pedestrian safety over profit. Permits can require that gaps be provided to reach and leave parked cars, that TGSI can’t be covered and bus zones can’t be used, umbrella points must be above head height, a dog leash must not be a trip wire, legs and weights for portable fences must not protrude and perspex or glass walls require decals at both wheelchair and face level. By-laws officers are generally not involved with moving motor vehicle offences but do issue penalty notices to drivers who obstruct paths.
Bicycles
When a white cane locates a stationary object, such as a towbar at shin height, the user has one stride to stop. If it locates a moving hazard or cyclist there is very little time to react. A requirement for bicycles to have a kickstand and park at the curb zone would reduce the number of bicycles parked randomly, often against the building line, despite the provision of racks. Chaining a bicycle to staircase handrails or traffic light poles could be considered as dangerous. On roads, bicycles are quieter, smaller and more difficult to detect than cars. It would be helpful if cyclists were to ring their bell when approaching a pedestrian who is displaying a white cane and listening for road traffic.
National cycling strategies rightly encourage cycling. However, as the number of bicycles increases, an issue that needs attention is the legal situation of a pedestrian-cyclist crash that causes injury. That cyclists’ injuries are less severe off-road than on-road [4] is positive for them, but the increased potential for injuries to pedestrians has not been adequately addressed.
In Victoria, all drivers pay compulsory third party insurance to the Transport Accident Commission (TAC). The TAC manages compensation and is bound by the Transport Accident Act 1986. Only incidents involving the use of a motor vehicle (or tram or train) are covered. A bicycle is not a motor vehicle, but in some situations is covered by the TAC, for example through an amendment in 2000

Journal of the Australasian College of Road Safety – Volume 23 No.3, 2012
48
which encouraged commuting [5]. Currently, unless a motor vehicle is involved in a pedestrian-cyclist collision, the TAC does not cover the pedestrian. All losses and costs beyond Medicare for personal injury from a cyclist and pedestrian conflict could be out of personal pockets. The injury becomes a civil matter with the other party and can involve claims against the municipal council [6].
The incidence of vision impairment and other disabilities is higher in the older age group [1] yet the new National Disability Insurance Scheme will not apply to people over age 65 years. An amendment to the Transport Accident Act 1986 to include incidents involving only pedestrians and bicycles is required.
Engineering resources
In the past, there was an Austroads Guide to Traffic Engineering Practice devoted to the needs of elderly or disabled pedestrians, called Part 13. A similar document about cyclists’ requirements of infrastructure was Part 14. Both parts were replaced in 2009 with Part 6A Pedestrian and cyclist paths [7]. The safety checklist for pedestrian audits disappeared. Many of the pedestrian topics are now dispersed amongst Parts 1 to 12. However, most of the cyclist information of Part 14 survives as Part 6A, including its bicycle safety audit checklist, as a single resource for path requirements.
A supplement for Part 6A was published in September 2010 [8] still containing the original 1971 American urban modelling data for pedestrians. References to the capacity of stairs and travelators seem barely relevant to provision of pedestrian and cyclist paths. An engineering guide that would provide relevant information about the requirements for safe pedestrian infrastructure, in a single resource for engineers and planners, would return balance to the resources available. Pedestrian safety on shared paths will remain difficult to achieve unless literature is equitable.
Twenty one ‘Cycle notes’ provide information on the design of bicycle facilities – for example the widths for shared paths [9]. Unfortunately, the extreme situation of a two metre width was provided. That provides clearances of 30 cm between a cyclist and a pedestrian on shared paths. Average walking speed is five km/h yet standard shared path surfaces are recommended to accommodate cyclists’ speeds up to 30 km/h [4, 7]. Clearances and speed differences on shared paths require review for mutual safety.
Advocacy
Organisations like The Heart Foundation and Victoria Walks are funded primarily to address health and fitness issues. There is no organisation for pedestrians to equal
the positive road safety achievements of the Amy Gillett Foundation in terms of resources, partnerships or publicity. Valid issues raised by the Pedestrian Council of Australia attract media attention [6] but not necessarily a government response.
Suggestions that footpath cycling by all ages may not adversely affect pedestrians were based on 2002 data which indicated that ‘the incidence of cycling is not expected to change’ [4]. The Pedal Study conducted in the ACT (2011) [10] noted that cycling increased by 36% in the period 2000-2008. An attempt to permit cycling on all footpaths was defeated in Victoria, in large part due to the advocacy of Vision Australia, but that is not obvious now. Gradually changing the word ‘footpath’ to an off-road, shared, separated or transport path has circumvented the spirit and intent of then Minister Geoff Craig. When a local footpath used by a pedestrian with a disability is ‘upgraded’ to a shared path – and promoted as a cyclist network route– the safety of the pedestrian has been diminished.
Cyclist advocacy for a share of the road or footpath emphasises it is a legitimate form of transport. However, cycling clearly does not have more legitimacy than walking. Where pressures exerted by motorised traffic create conflict between cyclists and pedestrians, ‘solutions must not improve the conditions for one at the expense of the other’ [4].
Road safety programs
Safety programs with messages about children, intoxication and reversing in driveways – all good and necessary – are not addressing the generic loss of safe footpaths for pedestrians to walk on. The successful cyclist safety slogan A metre matters could be used to emphasise that ‘a metre matters to pedestrians too’.
Subtle transfer of Road Rule concepts to pedestrian areas
On-road behaviour is managed by requiring drivers and riders to obey prescribed signage and rules set out explicitly in national or state legislation. Driver knowledge and ability is tested. A licence can be lost by accumulated demerit points. Road users are prohibited from travelling in the wrong space for more expedient travel.
The abilities of a pedestrian may be inadequate to obtain a driver’s licence or ride a bicycle safely. Advisory (black) signage can be mistaken as regulatory (red). Signage of any type can be unseen or misinterpreted and similarly for symbols or paintwork. There is a recommendation that Road Rules re-introduce a requirement that pedestrians keep left on shared paths ‘to match and support the many

Journal of the Australasian College of Road Safety – Volume 23 No.3, 2012
49
Figure 2. Advisory painted lines can divide a path into widths not adequate for both users on each side. Sides can also be misinterpreted as ‘territory’.
sensible codes of conduct already in widespread use, and the effective practice of centre-line marking with “keep left” and similar stencils’ [4]. Such advisory line markings and signage can create assumptions of ‘territory’ among users, which can expose vision-impaired pedestrians to greater risk if they should stray onto the wrong side. Figure 2 demonstrates why keeping left of a painted line may not be possible.
The reason why the pedestrian shown in Figure 2 is not a driver or rider is clear, but this is not always so obvious. Symbols and ‘advisory centre lines’ for both users on each side (shown more fully across the street) have divided the path into widths not adequate for both users on each side. There is an important difference between walking along the left side of a path when possible and keeping to the left of a painted line. An expectation for all pedestrians to walk on a path, with the same level of concentration and vigilance required to walk on a road, is not reasonable. Guidelines that include stop lines and ‘give way’ signage in pedestrian areas should be reviewed for appropriateness.
Statistics
The under-reporting of pedestrian-cyclist conflict incidents was noted in a Monash University Accident Research Centre (MUARC) report back in 1989 [11], but hospital admissions continue to be the source of injury statistics today. The same study noted that pedestrian amenity needed to be addressed. The Pedal Study found that none of the pedestrian crashes in its study were reported to police [10]. A recent study of road trauma found that the likelihood of death when presenting as trauma patients during the study period (2002-2008) was five times higher for pedestrians than for pedal cyclists. The authors recommended further research into factors contributing
to pedestrian injury, including road design and pedestrian crossings [12]. More information is also needed on pedestrian-cyclist collisions.
The assumption that a pedestrian is a fit and healthy person with satisfactory vision and hearing, one who will be paying attention and does not have a physical disability, will misrepresent a significant proportion of the population [13]. Aspects of the road environment which restrict mobility and life choices for pedestrians require more attention. Vision Australia is currently gathering data on the experiences of their clients.
Summary
Raising awareness of the needs of vision-impaired pedestrians is vital to safeguard their ability to move around the complex and changing road environment and to maintain their independence and quality of life. The safety of pedestrians has not received adequate consideration, for example, in measures to increase the capacity for cycling. Solutions to minimise conflict are required that do not improve the conditions for one road (or shared path) user at the expense of another. Measures suggested in this article to improve the safety of pedestrians, particularly those with a vision impairment or other disability, will positively affect the general population and promote ‘active transport’ for all.
References 1. Clear focus - The economic impact of vision loss in Australia in 2009. An overview of the report prepared for Vision 2020 Australia by Access Economics Pty. Ltd. http://www.vision2020australia.org.au accessed 27 June 2012.
2. VicRoads. Head Start - Storage areas at intersections. Cycle Notes No 5, 2000.
3. Obituary: Hans Monderman. www.guardian.co.uk. news/2008/feb/02/obituaries accessed 27 June 2012.
4. Austroads. Pedestrian-cyclist conflict minimisation on shared paths and footpaths. Sydney: 2006.
5. Transport Accident Act 1986 No 111 of 1986 Part 1 – Preliminary S.3(1A)(c) inserted by No. 84/2000 s.4(1) http://www.tac.gov.au/upload/taa1986 p 29 accessed 13 July 2012.
6. Media release Wednesday 3 December 2008, Pedestrian Council of Australia. www.walk.com.au/ pedestriancouncil/ accessed 27 June, 2012.
7. Austroads Guide to traffic engineering practice Part 6A Pedestrian and cyclist paths, October 2009.
8. VicRoads. Supplement to the Austroads Guide to Road Design Part 6A – Pedestrian and cyclist paths, Rev.1.1 – Sept 2010.
9. VicRoads. Widths of off-road shared use paths. Cycle Notes No 21, June 2010.
Journal of the Australasian College of Road Safety – Volume 23 No.3, 2012
50
10. De Rome L, Boufous S, Senserrick T, Richardson D, Ivers R. The Pedal Study: Factors associated with bicycle crashes and injury severity in the ACT. The George Institute for Global Health, University of Sydney Medical School, Australian National University, Final report July 2011.
11. Drummond A. Pedestrian casualties resulting from collisions with cyclists on footpaths. Monash University Accident Research Centre, October 1989 Report No. 8.
12. Frydenberg EM, Curtis K, Chong S, Poulos R, Grzebieta RH, Steel TR, Nau T. Road trauma, patterns of injury and mortality in an Australian trauma centre. Journal of ACRS, Volume 23 No 1, 2012.
13. Bakovic Z. Vulnerable road users: Characteristics of pedestrians. Journal of the ACRS 2012, Volume 23, No 1, 2012.

Journal of the Australasian College of Road Safety – Volume 23 No.3, 2012
51
Australia’s National Road Safety Strategy 2011-2020 (NRSS) sets out a ten-year plan of action which is aimed at reducing fatal and serious injury crashes on Australian roads. The NRSS was released by the Australian Transport Council in May 2011 (to coincide with the International Decade of Action for Road Safety) and is based on the internationally recognised and nationally adopted Safe System approach. New Zealand’s response to the Decade of Action, the Safer Journeys strategy, is also based on Safe System principles. Both strategies focus on the key areas where appropriate action can lead to substantial gains in road safety.
The NRSS describes a range of actions or ‘interventions’ in four ‘cornerstone’ areas: these are safe roads, safe speeds, safe vehicles and safe people. This Special feature, the first in a planned series which will look at each of the four NRSS cornerstones, focuses on speed. Effective speed management is fundamental to road safety and is a critical component of the Safe System approach. Speed is a significant contributing factor in a high percentage of serious casualty crashes in Australia and speed also plays a major role in the severity of many crashes, contributing to around a third of the deaths that occur on our roads each year. The following papers explore the theme of Safer speeds.
Special feature:Safer speeds
Peer-reviewed papersReflections on speed control from a public health perspectiveby Professor Jack McLean, Centre for Automotive Safety Research (CASR), University of Adelaide
Abstract
The level of understanding of the risks associated with speed and speeding is increasing. However, this is not fully reflected in the implementation of speed reduction measures nor in an awareness of the significance of these risks by the general population. This paper reviews approaches to three other public health-related behaviours about which public perceptions and attitudes have changed radically – smoking, seatbelt wearing, and drink driving. The paper examines the evolution of policies and strategies designed to manage these public health issues and bring about enduring changes in people’s behaviour. In each case, identification and understanding of the problem has derived from epidemiological investigations of the behaviours themselves, which in turn have provided the basis for the introduction of control measures. This has significant implications for improved management of travelling speed.
The aim of this paper, therefore, is to assess opportunities for the further development, introduction and acceptance of measures used to control speed and reduce the incidence of speed-related crashes.
Keywords
Drink driving, Law enforcement, Restraint usage, Smoking, Speed
Introduction
Travelling speed is one of the major risk factors determining the safety of road users. Although the level of understanding of the risks associated with speed and speeding is increasing, this is not fully reflected in the implementation of speed reduction measures nor in an awareness of the significance of these risks by the general

Journal of the Australasian College of Road Safety – Volume 23 No.3, 2012
52
population. In an attempt to identify measures that may lead to more effective control of speed and speeding, this paper reviews approaches to three other health related behaviours: smoking, seatbelt wearing, and drink driving. In each case, the identification and understanding of the problem has derived from epidemiological investigations of the behaviours themselves which in turn provided the basis for the introduction of control measures. Consequently, this paper is concentrated on the evolution of the changes in behaviour rather than on changes in attitudes. For an investigation of attitudes as predictors of speeding, drink driving and failure to wear a seatbelt see, for example, the study by Fernandes et al.[1].
Smoking and health
Fifty years ago, smoking was an accepted activity. Smoking and non-smoking compartments were provided equally on trains and there were few other restrictions on smoking indoors. The deleterious health effects of smoking are not immediately obvious. They typically take years, or even decades, to become evident. However, in Britain in the 25 years ending in 1947 the incidence of lung cancer had increased by 1500%. During that same period, there had been an almost threefold increase in the amount of tobacco consumed in cigarette smoking [2].
In 1950, Richard Doll and Bradford Hill published a report in the British Medical Journal on a case control study of smoking and lung cancer [3]. They concluded that ‘smoking is a factor, and an important factor, in the production of carcinoma of the lung’. The publication of this paper was greeted with a combination of apathy, disbelief and scientific condemnation [2]. Nevertheless, they continued with their investigation of smoking and lung cancer with a large scale study based on medical doctors in Britain. The results, published in 1954, confirmed their earlier conclusion linking smoking to lung cancer and showed that smoking increased the risk of developing lung cancer by 25 times [4]. The daily press criticised the authors again and described them as ‘spoilsports’ and ‘grey-haired’. However, following the publication of this report, doctors became the first social group in Britain to give up smoking in large numbers.
The continuing work of Doll and Hill eventually became widely respected scientifically and, in 1962, the Royal College of Physicians published a report Smoking and Health which strongly supported the conclusion that smoking was a cause of lung cancer [5]. Newspapers were evangelistic, with front pages carrying the headline ‘Doctors Say Smoking Dangerous’. This was followed two years later by a similar report by the United States Surgeon General [6]. In 1964 Doll and Hill published a report
showing that there was a linear dose response relationship between mortality from a wide range of diseases and cigarette consumption. There was no threshold below which there was no risk from cigarette smoking. Furthermore they showed that the mortality risk fell after stopping smoking. The 25 fold risk of lung cancer decreased to only twice the very low rate of non-smokers 15 years after stopping smoking [7]. It has been said that this ‘knowledge that quitting could have such a dramatic effect on death rates would, in time, advance public health medicine as profoundly as the introduction of inoculation or the therapeutic application of penicillin’ [2]. Nevertheless, in 1964, still only one in three smokers believed that smoking caused cancer.
Increasingly, evidence accumulated that the incidence of a wide range of diseases, including lung cancer, could be reduced by the prevention of cigarette smoking. This was accompanied by the introduction of the prohibition of smoking in some areas. Restrictions on the advertising of cigarettes began to take effect, despite the vigorous opposition of the tobacco industry. Then, in 1981, Dimitrios Trichopoulos and Brian MacMahon et al. published a paper showing that passive smoking (inhaling the smoke from another person's cigarette) increased the risk of a non-smoker developing lung cancer [8]. Although by that time there was little doubt among the medical profession about the risks from cigarette smoking to the health of the smoker, this paper was the first to provide evidence that the population at risk was the community as a whole. This finding was too new for the peer review process. The paper was rejected by the first journal to which it was submitted, the New England Journal of Medicine, on the grounds that ‘The implications of your findings are enormous.We believe that you will be proved right, but the editors could not find your arguments persuasive enough to give your manuscript the extremely high priority necessary for acceptance’ [9].
By showing that cigarette smoking was hazardous to the health of the community, as well as to the health of the smoker, the implications of this paper were indeed enormous. The tobacco industry has identified the passive smoking issue as the single most important problem confronting its economic future [10]. Today cigarette smoking is prohibited in many public areas in Australia. It is no longer accepted as a social norm.
Seatbelt wearing
‘He was thrown clear in the crash and died at the scene’. Despite the incongruity of this statement, it was ‘common knowledge’ that it would be safer to be thrown clear in a crash rather than to remain inside the crashed car. It was not until the mid 1950s that research evidence became

Journal of the Australasian College of Road Safety – Volume 23 No.3, 2012
53
available, from Automotive Crash Injury Research at Cornell University Medical College in the United States, which showed that being thrown clear, or ejected, from the crashing vehicle increased the risk of fatal or serious injury four to five times [11].
By the late 1950s, seatbelts of various configurations became available in the automobile aftermarket in Australia. However, no provision was made in the design of cars for the belts to be fitted. This meant that it was necessary to drill holes in the bodywork to attach a seatbelt.
In 1963, a private member's bill was passed by the South Australian Parliament which required new cars registered in South Australia to have mounting points for seatbelts. In the debate on this bill, some members of Parliament said that it was the thin end of the wedge and that soon seatbelts would be required to be fitted to new cars, and then it would not be long before it would be made compulsory to wear a seatbelt. The response of the Hon. G. O’H Giles to the latter objection, speaking to the second reading of the bill in the Legislative Council (November 13, p. 1621), was that ‘I regard any legislation for the compulsory wearing of safety belts as being completely wrong and not the type of legislation to be introduced to the freedom-loving people of South Australia’ [12].
Two years later, in the summary report on the first Adelaide In-Depth Accident Study, it was noted that ‘Few car occupants in our survey wore belts, but the benefits of seatbelts were confirmed. The case for requiring belts as original fittings of cars is strong’ [13]. This was conclusively demonstrated in a paper presented by Nils Bohlin at the 11th Stapp Car Crash Conference in 1967 [14]. Three point seatbelts had been fitted as original equipment to the front seats of Volvo cars since 1959. Bohlin compared the outcome in crashes of 37,511 front seat occupants, 26% of whom were belted. None of the restrained occupants was ejected from the car or fatally injured at speeds below 60 mph.
In 1966, the United States Congress passed legislation which required lap type seatbelts to be fitted to passenger cars. Soon after, in 1969, the first Australian Design Rules for Motor Vehicle Safety were issued. They included a requirement for three point seatbelts to be fitted to all seats in new passenger cars.
By this time the matter of requiring that seatbelts be worn was being seriously considered in Australia. Various groups, notably the Royal Australasian College of Surgeons, were becoming very vocal in calling for the introduction of compulsory seatbelt wearing.
In February 1971, the Traffic Accident Research Unit of the New South Wales Department of Motor Transport
published a report on a survey of usage of and attitudes to seatbelts: ‘It is suggested that the fundamental source of public resistance is that motorists do not feel vulnerable to death or injury under normal driving conditions. This may prove to be an insurmountable barrier to public education designed to increase the seatbelt wearing rate’ [15]. While that study was still in progress, the Premier of Victoria announced on December 22, 1970 that, with one month’s notice, seatbelt wearing would become compulsory in all cars fitted with seatbelts in that state.
Barry Bragg, from the Canadian Department of Transport, measured community attitudes to compulsory seatbelt wearing before and after its introduction in Ontario and Quebec Provinces in 1976 [16]. Motorists in Ontario were given six weeks’ notice of the introduction of compulsory wearing whereas eight months’ warning was given in Quebec. The percentage of the population who were favourably disposed to seatbelt wearing was measured before the announcement of the legislation, soon after it was enacted, and again six months later. There was no significant change in favourability in Ontario before and soon after but then there was a steady increase which began about three months later. In Quebec, however, there was a steady and significant decrease in favourability during the eight months after the intention to enact mandatory belt legislation was announced but the law had not been passed.
Bragg postulated that by forcing an almost immediate change in behaviour in Ontario, as was also done in Victoria, motorists did not have time to decide that they would not comply with the new legislation. It was easier to comply and then begin to adjust their attitude to one of greater acceptance of seatbelt wearing thereby avoiding, to use the technical term, cognitive dissonance [17]. Consequently, Bragg recommended that ‘the introduction and passage of mandatory seatbelt legislation should be done quickly in order to preserve public favourability’.
South Australia, among other states, soon followed Victoria with compulsory seatbelt wearing legislation, demonstrating a major change in attitudes in just eight years. Today, with the notable exception of fatal crashes involving extreme behaviours (such as high speed and/or high blood alcohol levels [18]) and more generally in some rural areas [19], seatbelt use has become autonomous behaviour without any conscious safety consideration. It is a social norm.
Drink driving
Attitudes to drinking and driving have changed greatly in Australia over the past 50 years. Drinking horn competitions were a highlight of undergraduate social activities at universities and it was not uncommon for supposedly more mature members of the community to

Journal of the Australasian College of Road Safety – Volume 23 No.3, 2012
54
boast about how they managed to drive home from a party without being able to remember having done so, and with no recollection of how they got that dent in the car.
John Birrell, who was appointed Victorian Police Surgeon in 1957, noted that at that time ‘It was admired behaviour to drink heavily and stay upright’. He found that ‘police, magistrates, judges and the legal profession were ignorant of the significance of a blood alcohol level, while many of them were drinkers, influenced by all the mores and folklore of drinking’ [20].
From his work in the City Mortuary he was able to show ‘post-mortem alcohol levels to be positive in 50% of drivers killed in traffic crashes’ whereas the Australian Road Safety Council had concluded that about 3% of fatal crashes were due to intoxication, a figure derived from convictions of drunk drivers involved in fatal crashes in cases heard before a jury which, Birrell remarked, ‘was a very rare event’.
Traditional attempts to control excessive alcohol consumption included restricting the hours of operation of licensed premises. In South Australia, as in some other states, hotels were prohibited from serving alcohol after 6 pm, a measure that was introduced in 1915 during the First World War. This had the effect of encouraging binge drinking during the preceding hour, thereby ensuring that a significant proportion of the drivers on the roads after 6.00 pm were severely intoxicated. In 1962, the single hour from 6.00 to 7.00 pm accounted for 23% of the fatal road accidents in the Adelaide metropolitan area [13]. Hotel closing times were changed to 10.00 pm in 1967. The development of a portable breath alcohol meter at Indiana University in 1938 made it possible to measure a driver's blood alcohol concentration (BAC) at the roadside without having to take a blood sample. In 1954, Robert Borkenstein of the Department of Police Administration at Indiana University, refined this technology with a meter which he called the Breathalyzer and in 1963 he conducted a major case control study on drink driving and crash involvement in the City of Grand Rapids, Michigan [21]. The results of that study, which quantified the relationship between a driver's blood alcohol concentration and the risk of crash involvement, have been used to justify the selection of legal blood alcohol limits for drivers in many countries. Having chosen a legal blood alcohol limit many countries also introduced ‘per se’ laws which made it an offence to be in charge of a motor vehicle with a blood alcohol concentration at or above a specified limit.
The availability of portable breath alcohol meters transformed police enforcement of drink driving laws by making it practicable to test drivers at the roadside and uninjured drivers at crash sites and, years later, to introduce random breath alcohol testing (RBT) of very large numbers
of drivers. First introduced in Australia in Victoria in 1976, the effect of RBT was most dramatically seen in the early 1980s in New South Wales where the annual road crash fatality numbers had been constant at about 1200 for some years. Following the introduction of RBT the number of fatalities dropped to 800. Forcing a change in drink driving behaviour was remarkably effective.
The manner in which RBT effected this change in behaviour in NSW may have been indicated by the theme of the accompanying television commercials. John Bevins, who won the media contract, assumed that the message would be that drivers would be safer if they kept below the legal BAC limit. However, after observing the reactions of drivers stopped at a police radar check point, he developed the TV jingle ‘How will you do when you sit for the test? Will you be under 05 or under arrest?’
Research tracking attitudes to drink driving before and after the introduction of RBT in NSW not only resulted in dramatic changes in behaviour but also in attitudes, with a shift from viewing the apprehended drink driver as unlucky, towards the view that drink driving is criminal behaviour [22].
In the early 1970s, a major multi-year program was introduced by the National Highway Traffic Safety Administration in the United States in an attempt to reduce the frequency of alcohol-related crashes. Known as the Alcohol Safety Action Project (ASAP), it addressed all aspects of the drink driving problem including attempts to influence public attitudes to drink driving, increase the effectiveness of police enforcement and ensure that drink driving offenders were dealt with appropriately by the courts [23]. In some cases the projects also conducted education programs, screened for alcohol problems, and assisted in the provision of treatment for alcohol dependency when deemed appropriate.
The ASAP program was a major attempt at the national level in the United States to address alcohol-impaired driving with particular emphasis on changing public perceptions of drink driving from being something everybody does to viewing it as reckless criminal behaviour. It set the stage for stronger laws to be adopted by many of the states (administrative licence revocations, per se laws, and a lower BAC limit of 0.08 and sobriety checkpoints).
In 1980, a citizen activist organisation, Mothers Against Drunk Driving (MADD), was established in the United States, with the initiative coming from the mother of a 13 year old girl who was fatally injured by a car driven by a repeat drink-driving offender. ‘The mission of Mothers Against Drunk Driving is to stop drunk driving, support the victims of this violent crime and prevent underage

Journal of the Australasian College of Road Safety – Volume 23 No.3, 2012
55
drinking.’ By the end of 1984, there were more than 330 MADD Chapters in 47 states and it had successfully lobbied for an increase in the Federal minimum drinking age to 21, a measure that was adopted by all states in 1988. By 2000, MADD had grown to approximately 600 Chapters and two million members and supporters [24].
Today in Australia the problems presented by binge drinking and the alcohol-dependent driver are yet to be adequately addressed [18]. Attitudes to drink driving and the enforcement of drink-driving legislation in rural areas present particular difficulties [19]. However, in the general community, driving with an illegal blood alcohol concentration is no longer regarded as acceptable behaviour.
Speed control
There is no inherent fear of speed, as there appears to be of heights and the risk of falling [25]. If there was, no one would drive at 60 km/h in the kerb lane close to poles and trees because it would be obvious that running off the road would result in a crash as severe as driving over a 14 metre cliff. Furthermore, the risk of being involved in a casualty crash is about one in a lifetime, and the risk of being involved as a driver in a fatal crash is about one in a hundred lifetimes. So, driving at customary speeds at, or just above, the speed limit does not appear to be dangerous but, of all common activities, driving is the one that is most likely to result in death or serious injury.
Just as 50 years ago it was ‘admired behaviour to drink heavily and stay upright’ so it was acceptable to boast about how quickly one drove from Adelaide to Melbourne. Even today, some drivers do not regard speeding to be risky because they believe, often mistakenly, that their car-handling skills enable them to drive safely at higher speeds. However, a safe driver on the road is one who never gets into a situation in which he needs to use his skill.
Driving behaviour is more important in road safety than driving performance. This was demonstrated in a study conducted by Allan Williams of the on-road driving records in three States of national competition licence holders from the Sports Car Club of America and a comparison group of drivers matched by age and sex. The race car drivers had 20% to 100% more reported crashes and two to three times the frequency of speeding violations [26]. The choice of travelling speed is a central element of driving behaviour.
The most important reason for concern about controlling travelling speed is that there is a very close association between travelling speed and the risk of being involved in a casualty crash. While it seems obvious that the faster you drive the greater the risk of crashing and the greater the risk that somebody will be injured, it is only comparatively
recently that the association between crash risk and speed has been quantified.
The development of radar, and laser, speed meters has greatly facilitated the measurement of travelling speed. However, unlike the measurement of a driver's BAC after a crash, there is no simple way to estimate accurately what the travelling speed of a vehicle was before a crash. That was done in two case control studies of travelling speed and the risk of involvement in a casualty crash that were conducted by the Centre for Automotive Safety Research at the University of Adelaide, one in the Adelaide metropolitan area and the other on rural roads within 100 kilometres of Adelaide [27, 28]. The former study involved attendance at the scene of about 1000 crashes to which an ambulance was called, in order to obtain 151 relevant cases for which a travelling speed before the crash could be reliably estimated using computer-aided crash reconstruction. The speeds of control vehicles, passing the crash site at the same time of day and day of the week, were measured using a handheld laser speed meter. A similar procedure was used in the study of rural crashes.
In the metropolitan area study it was found that travelling at 65 km/h in a 60 km/h speed limit area doubled the risk of involvement in a casualty crash and that risk doubled again with each increase of 5 km/h in travelling speed. This finding was literally incredible to many people. This was not surprising because, as noted above, the risk of being involved in a casualty crash is about one in a lifetime. Therefore the risk on a given journey is so very small it is not obvious to the driver and doubling that risk will still not be obvious. However, if all drivers double their risk the road toll is doubled.
Comparing this result from the speed case control study to the risk associated with drink driving seems to make it more meaningful to many drivers: driving at 65 km/h in a 60 km/h zone increases the risk of involvement in a casualty crash to the same extent as driving at the speed limit with a .05 blood alcohol level [27]. The community today generally considers illegal drink driving to be socially unacceptable but that view does not yet extend to speeding, even when the crash risks are the same. In this respect attitudes to speeding, and even more so to travelling speed, remain closer to the attitudes to drink driving of 50 years ago.
Speed limits
Traditionally, open road speed limits were set taking into account the 85th percentile speed of traffic using the road. This assumed that drivers are able to make an accurate assessment of the safe travelling speed. However, even if drivers have been involved in a crash on that road, they are unlikely to relate that experience mainly to their travelling

Journal of the Australasian College of Road Safety – Volume 23 No.3, 2012
56
speed. As Leonard Evans has noted ‘While some learning occurs in response to adverse outcomes, experiencing traffic crashes is an unsatisfactory way to learn how to avoid them’ [29]. Because of this, driving by obeying rules will usually be safer than relying on personal driving experience, an exception being when speed limits are set at speeds that are too high for safety.
Many of the rural roads in Australia were constructed in the years following the Second World War when there was no open road speed limit, apart from a prima facie limit of 60 mph (meaning that a driver could be required to show that it was safe to travel at a higher speed). The design speed for rural road construction at that time was 50 mph (81 km/h). When an open road speed limit was first introduced in South Australia in 1974, it was set at 110 km/h; this is 29 km/h faster than the safe design speed for most of the roads.
In the United States in 1974, in response to an oil embargo, a National Maximum Speed Limit (NMSL) of 55 mph (89 km/h) was introduced by the US Congress to conserve fuel. It replaced a speed limit of 70 mph (113 km/h) on rural Interstate Highways in most states. The mileage-based fatality rate in 1974 decreased by 34% compared to the year before the reduction in the speed limit. In 1984, a Transportation Research Board Committee recommended to Congress that the NMSL be retained partly to continue to conserve fuel but mainly because it was by far the most effective traffic safety measure ever introduced in the United States [30].
Despite this strong recommendation, in 1987 Congress voted to allow individual states to increase the speed limit to 65 mph (105 km/h) on some parts of the rural Interstate Highway system, and in 1995 control of speed limits was returned entirely to the state administrations, 23 of which increased their maximum speed limits to 70 or 75 mph. There was a 35% increase in the fatality rate where the limit was raised from 65 to 70 mph [31].
Decisions on matters such as setting speed limits are critically important. The selection of a metric equivalent for the Australian urban area speed limit of 35 mph (56 km/h), which was made in 1974, was restricted to 50 or 60 km/h, but not 55 km/h because there was a view that metric speed limits should end in a zero and advisory speeds in a five so that drivers would not be confused. Despite the fact that Victoria and NSW had had urban area speed limits of 30 mph (48 km/h) up until about 10 years previously, 60 km/h was chosen, giving Australia the highest urban area speed limit in almost all highly motorised countries. This choice of 60 rather than 50 km/h for the urban area speed limit has resulted in the deaths of more than 2700 pedestrians in Australia since 1974 [32].
As demonstrated by the preceding example, the safety significance of a 10 km/h difference in travelling speed is often under-estimated. Taking as an example a car travelling at 50 km/h with another car alongside, overtaking it at 60 km/h: in an emergency braking situation when the car travelling at 50 km/h has stopped, the other car will still be travelling at 44 km/h. A 10 km/h difference in travelling speed can mean a difference between an impact at 44 km/h and no impact at all [33].
There was less knowledge and awareness in 1974 than there is today of the close relationship between travelling speed and the risk of involvement in a casualty crash. Today we know that reducing the speed limit from 60 to 50 km/h in the Adelaide metropolitan area has reduced casualty crashes by 23% on the affected roads, but the speed limit remains at 60 km/h on the arterial roads where most of the casualty crashes happen [34].
The apparent reluctance to reduce a 60 km/h urban speed limit to 50 km/h would appear to be very strange to a resident of Helsinki, the capital of Finland. In the central city and residential areas of Helsinki the speed limit is30 km/h. Arterial roads in and near the centre have a limit of 40 km/h and it is not until the main roads leading to the outer suburbs are reached that the limit is increased to50 km/h.
Enforcement of speed limits
Whereas seatbelt wearing has become virtually self-enforcing behaviour, and drink driving enforcement obviously applies only to the drinking driver (who is in a minority in the driving population), speed enforcement applies to every driver on the road at any time of the day or night. For some drivers, speed enforcement is seen as capricious, unfair and revenue-raising: capricious because the risk of being detected when speeding is very low, unfair because – as noted many times in this paper – the relationship of speed limits to safety is not obvious, and revenue-raising because the requirement to pay a speeding fine is very obvious.
The very low risk of detection for speeding means that an apprehended driver is likely to feel unlucky rather than guilty of an offence. This is particularly so if the driver has been travelling no more than 10 km/h above the speed limit. For many years it was assumed that the police would allow a tolerance of about 10 km/h before enforcing a speed limit. Today in some jurisdictions a lower enforcement tolerance has been specified by the police, and the South Australia Police have, very sensibly, announced that the tolerance has been lowered without specifying by how much. The reasons why a tolerance exists in speed enforcement is a topic for another paper. For the present purpose, it is
Journal of the Australasian College of Road Safety – Volume 23 No.3, 2012
57
sufficient to refer to the earliest days of speed enforcement by a following police vehicle and acknowledge that some speedometers may not be entirely accurate, even though any inaccuracy is likely to overestimate the speed of a vehicle in almost all cases. The concept of an enforcement tolerance illustrates very clearly the difference in public awareness of the risks associated with speeding and drink driving. Blood alcohol limits for drivers are enforced with zero tolerance, as far as the offending driver is aware, even though almost no driver has a means of measuring their blood alcohol level.
Adverse attitudes to speed enforcement – that it is capricious, unfair, and revenue-raising – are accentuated in reactions to speed cameras, despite their effectiveness in reducing crashes [35, 36]. In South Australia, most speed cameras are concealed in a vehicle parked at the side of the road. Until recently, a sign was erected about 100 metres past the camera to advise drivers that their speed had been measured.
In the 1990s, one commercial radio station in Adelaide began broadcasting the locations of some speed cameras. This practice became more widespread and eventually the South Australian Police Traffic Division provided the media with a list of some, but not all, of the speed camera locations for the following day. This may remind drivers that speed cameras will be operating and reduce the frequency of speeding on the specified roads on that day but it could also reinforce a view that speed camera enforcement is not entirely fair. It is almost incomprehensible that this practice could be extended to publicising the locations of random breath testing sites, illustrating yet again that speeding is regarded, inaccurately, as a less serious road safety problem than drink driving.
The recent introduction in some states of point to point speed cameras may overcome some of the objections to speed cameras. It can hardly be reasonably argued that penalising a driver for speeding over a long distance is in any sense capricious or unfair, even on divided highways. An objection that a speed limit may be too low on a divided rural highway can be countered by reference to the experience in the United States with the 55 mph (88 km/h) National Maximum Speed Limit which, as noted previously, was by far the most effective traffic safety measure ever introduced in the United States [30].
Implications for speed control
Reducing travelling speeds, such as by setting and enforcing lower speed limits, is the most effective and affordable way to reduce deaths and injuries on roads in both urban and rural areas. However, there is a view that it is important to ensure that there is sufficient support for such a change before action is taken. That was a reason
underlying the survey of attitudes to seatbelts conducted in NSW in 1970 [15]. Clearly, community support is highly desirable, but the manner of the introduction of change by regulation appears to be even more important.A decision to reduce a speed limit that is announced and then implemented rapidly can retain and build on community support, as demonstrated by the experience in Ontario with the introduction of mandatory seatbelt wearing [16].
The Governors Highway Safety Association in the United States has commented on the need to raise the priority of speed as a traffic safety issue, particularly with law enforcement agencies [37]. The Association has also observed that ‘Despite the prevalence of excessive speed in so many crashes, no special interest groups have mobilized to educate the public and make it unacceptable’. Leonard Evans has drawn attention to the fact that, although the behaviours associated with most of the harm in traffic do not attract the moral opprobrium focused on drink driving, nevertheless ‘an activist movement to focus grief and anger on risk-taking sober drivers who harm others, especially children, has the potential to produce safety benefits like those produced by Mothers Against Drunk Driving’ [29].
Recognition by the community at large of the need for more effective measures to control smoking was greatly enhanced by the finding that non-smokers were also at risk. Similarly, there would be benefit in emphasising that the speeding driver jeopardises the safety of all road users, not only the speeding driver and his or her passengers. In Australia, the medical profession has played a very important role in educating the community about the health hazards of smoking and has been very influential in presenting the case for compulsory seatbelt wearing. Individual doctors were at the forefront of measures which eventually resulted in a marked change in community attitudes to drink driving. While some members of the medical profession, and other relevant professionals, warn motorists of the dangers of speeding, their support for speed control measures could become even more effective if research findings on the safety benefits of even small reductions in speed limits and travelling speeds were to be more widely disseminated.
Epidemiological studies provided the basic understanding of the nature of the health-related effects of cigarette smoking, ejection from a crashing car, and the benefits of seatbelts. They have also quantified the dose response relationship between a driver’s blood alcohol concentration and the risk of crash involvement. While a start has been made in quantifying the relationship between travelling speed and the risk of involvement in a casualty crash, the opportunity remains for more extensive epidemiological investigations. The case control study conducted in metropolitan Adelaide is the only such study to have been conducted in an urban area in any country [27].

Journal of the Australasian College of Road Safety – Volume 23 No.3, 2012
58
The characteristics and relative contribution to casualty crashes of high-range and low-range speeders are also areas worthy of further investigation [38, 39]. Apart from formal studies, if full reconstructions could be conducted routinely on most serious crashes, impractical though that is at present, the role of travelling speed in crash causation and injury severity would be seen to be overwhelming [29].
Although the emphasis throughout this paper has been on safety, it is highly likely that the introduction of lower speed limits in urban areas would be most noticeable to novice and elderly drivers, as well as to pedestrians and cyclists, all of whom would find our streets and roads to be much easier to use.
Acknowledgements
The Centre for Automotive Safety Research is supported by both the South Australian Department of Planning, Transport and Infrastructure and the South Australian Motor Accident Commission. Comments from two reviewersand colleagues at CASR are gratefully acknowledged.
References 1. Fernandes R, Hatfield J, Job RFS. A systematic investigation of the differential predictors for speeding, drink-driving, driving while fatigued, and not wearing a seat belt, among young drivers. Transportation Research Part F: Traffic Psychology and Behaviour 2010; 13:179-196.
2. Keating C. Smoking kills: The revolutionary life of Richard Doll. Oxford: Signal Books, 2009.
3. Doll R, Hill AB. Smoking and carcinoma of the lung, preliminary report. British Medical Journal 1950; 2:739-748.
4. Doll R, Hill AB. The mortality of doctors in relation to their smoking habits, a preliminary report. British Medical Journal 1954; 1:1451-1455.
5. Royal College of Physicians. Smoking and health. London, Pitman Medical, 1962.
6. US Public Health Service. Smoking and health. Report of the Advisory Committee to the Surgeon General. Washington DC, US Government Printing Office, 1964.
7. Doll R, Hill AB. Mortality in relation to smoking: ten years’ observations on male British doctors. British Medical Journal, 1964; 1:1399-1410 and 1460-1467.
8. Trichopoulous D, Kalandidi A, Sparros L, MacMahon B. Lung cancer and passive smoking. International Journal of Cancer 1981; 27(1):1-4.
9. Rennie D. Rejection letter (extract) to Brain MacMahon, Harvard School of Public Health, from Deputy Editor, New England Journal of Medicine, 1980.
10. Chapman S, Borland R, Hill D, Owen N, Woodward S. Why the tobacco industry fears the passive smoking issue. International Journal of Health Services 1990; 20(3):417-427.
11. Tourin B. Ejection and automobile fatalities. Public Health Reports, 1958; 73(5):381-391 and 1164.
12. Parliament of South Australia. Parliamentary debates (Hansard). House of Assembly and Legislative Council. (1961-1963). Adelaide, Australia: South Australia House of Assembly and Legislative Council.
13. Robertson JS, McLean AJ, Ryan GA. Traffic accidents in Adelaide, South Australia (ARRB Special Report No. 1). Melbourne: Ramsay, Ware Publishing Pty. Ltd, 1966.
14. Bohlin NI (1967) A statistical analysis of 28,000 accident cases with emphasis on occupant restraint value. In 11th Stapp Car Crash Conference. New York: Society of Automotive Engineers, 1967.
15. Traffic Accident Research Unit. Seatbelts: a survey of usage and attitudes. Sydney: Department of Motor Transport, New South Wales, 1971.
16. Bragg WE. Attitudes towards, and effectiveness of mandatory seatbelt legislation in Canada. In 6th International Conference of the International Association for Accident and Traffic Medicine, Melbourne: Royal Australasian College of Surgeons, 1977.
17. Festinger L. A theory of cognitive dissonance. New York: Row, Peterson, 1957.
18. Wundersitz LN, Baldock MRJ. The relative contribution of system failures and extreme behaviour in South Australian crashes. (CASR092). Adelaide: Centre for Automotive Safety Research, 2011.
19. Siskind V, Steinhardt D, Sheehan M, O’Connor T, Hanks H. Risk factors for fatal crashes in rural Australia. Accident Analysis and Prevention. 2011; 43(3): 1082-1088.
20. Birrell JHW. Twenty years as a police surgeon. Ringwood: Brolga Publishing, 2004.
21. Borkenstein RF, Crowther RF, Shumate RP, Ziel WB, Zylman R. The role of the drinking driver in traffic accidents. Bloomington, Indiana: Department of Police Administration, Indiana University, 1964.
22. Job RFS, Prabhakar T, Lee SHV. The long term benefits of random breath testing in NSW (Australia): Deterrence and social disapproval of drink-driving. In: C. Mercier-Guyon (Ed.), Proceedings of the 14th International Conference on Alcohol, Drugs and Traffic Safety, 1997 (pp. 841-848). France: CERMT.
23. Highway Safety Research Institute. Alcohol Safety Action Project bibliography. Ann Arbor: The University of Michigan, 1976.
24. Mothers Against Drunk Driving. Irving, Texas: MADD, 2012. Viewed 15 June 2012. http://www.madd.org/
25. Gibson EJ, Walk RD. The ‘Visual cliff’. Scientific American 1960; 202:67-71
26. Williams AF, O’Neill B. On-the-road driving records of licensed race drivers. Accident Analysis & Prevention 1974; 6:263-270.

Journal of the Australasian College of Road Safety – Volume 23 No.3, 2012
59
27. Kloeden CN, McLean AJ, Moore VM, Ponte G. Travelling speed and the risk of crash involvement. Volumes 1 and 2 (CR172), Canberra: Federal Office of Road Safety, Department of Transport and Communications, 1997.
28. Kloeden CN, Ponte G, McLean AJ. Travelling speed and the risk of crash involvement on rural roads (CR204). Canberra: Australian Transport Safety Bureau, 2001.
29. Evans L. Traffic safety. Bloomfield Hills, Michigan: Science Serving Society, 2004.
30. Altshuler AA. 55, a decade of experience. Washington DC: Transportation Research Board, National Research Council, 1984.
31. Patterson TL, Frith WJ, Povey LJ, Keall MD. The effect of increasing rural interstate speed limits in the United States. Traffic Injury Prevention 2002; 3(4):316-320.
32. McLean AJ, Anderson RWG. Metrication of the urban speed limit and pedestrian fatalities. In Australasian Road Safety, Policing and Education Conference. Adelaide: Department of Transport, Energy and Infrastructure, 2008.
33. Anderson RWG, McLean AJ, Farmer MJB, Lee BH, Brooks CG. Vehicle travel speeds and the incidence of fatal pedestrian crashes. Accident Analysis & Prevention 1997; 29(5):667-674.
34. Kloeden CN, Woolley JE, McLean AJ. A follow-up evaluation of the 50km/h default urban speed limit in South Australia. In: Australasian Road Safety Research, Education and Policing Conference, Melbourne: Vicroads, 2007.
35. Wilson C, Willis C, Hendrikz JK, Le Brocque R, Bellamy N. Speed cameras for the prevention of road traffic injuries and deaths. Cochrane Database of Systematic Reviews 2010, Issue 11.
36. Victorian Auditor-General. Road Safety Camera Program. Victorian Government Printer, 2011.
37. Sprattler K. Survey of the States: Speeding and aggressive driving. Washington DC: Governors Highway Safety Association, 2012.
38. Watson BC, Watson A, Siskind V, Fleiter J. Characteristics and predictors of high-range speeding offenders. In: Australasian Road Safety Research, Policing and Education Conference, Engineers Australia, Sydney Convention and Exhibition Centre, Sydney, New South Wales.
39. Doecke SD, Kloeden CN, McLean AJ. Casualty crash reductions from reducing various levels of speeding. (CASR076). Adelaide: Centre for Automotive Safety Research, 2011.
Automated speed enforcement in Australia:Recent examples of the influence of public opinion on program sustainability by Judy J Fleiter1 and Barry Watson2
1 Postdoctoral Research Fellow, Centre for Accident Research and Road Safety – Queensland (CARRS-Q), Queensland University of Technology, Kelvin Grove, Brisbane2 Director, Centre for Accident Research and Road Safety – Queensland (CARRS-Q) Queensland University of Technology, Kelvin Grove, Brisbane
Abstract
In Australia, speeding remains a substantial contributor to road trauma. The National Road Safety Strategy (NRSS) 2011-2020 highlighted the need to harness community support for current and future speed management strategies. Australia is known for intensive speed camera programs which are both automated and manual, employing covert and overt methods. Recent developments in the area of automated speed enforcement in Australia help to illustrate the important link between community attitudes to speed enforcement and subsequent speed camera policy developments. A perceived lack of community confidence in camera programs prompted reviews in New South Wales and Victoria in 2011 by the jurisdictional Auditor-General.
This paper explores automated speed camera enforcement in Australia with particular reference to the findings of these two reports as they relate to the level of public support for, and community attitudes towards, automated speed enforcement. It also provides comment on the evolving nature of automated speed enforcement according to previously identified controversies and dilemmas associated with speed camera programs.
Keywords
Community attitudes, Enforcement tolerance, Speed cameras, Speed management, Speeding

Journal of the Australasian College of Road Safety – Volume 23 No.3, 2012
60
Introduction
Significant gains have been made in Australia in reducing road trauma. Engineering solutions, vehicle improvements, education campaigns, legislative changes and enforcement initiatives such as random roadside alcohol and drug testing and automated speed enforcement have been key factors in achieving these gains. However, the extent to which the general public understand these important gains and the reasons for them is unclear [1].
Speed management continues to occupy an important position among Australia’s road safety priorities yet, importantly, there appears to remain mixed support within the general community for the need for speed management and, more specifically, for speed camera programs [2,3,4]. Australia has some of the highest speed zones in the world, particularly when compared to Europe, and especially when compared to those European countries that have adopted systems-based harm minimisation principles such as Vision Zero (Sweden) or Sustainable Safety (Netherlands) [5]. There have been many efforts to reduce speeds in Australia. A major undertaking in this regard has been reducing speed limits [6]. Examples include 40 km/h school zones, the lowering of the default speed limits in built up areas from 60 to 50 km/h, the 2007 reduction of unrestricted speeds on major highways in the Northern Territory to 130 km/h and on other open roads to 110 km/h, and variable speed limits used for changes in traffic flow, roadwork operations, and high activity areas such as shopping/recreation precincts [2, 7, 8, 9, 10].
Another major aspect of reducing speeds in Australia is the extensive use of automated speed enforcement. Australia is known internationally for successful intensive speed camera programs which employ covert and overt methods as well as fixed and mobile deployment methods [7, 11]. The extent of the use of these approaches differs across Australian jurisdictions [4, 12, 13, 14]. Evaluations of many these camera programs have demonstrated clear road safety benefits [13, 15]. Despite this, speed camera programs continue to be perceived negatively by some sections of the community and the media [2, 4].
It is possible that some of this negativity towards speed cameras is related to what has been termed their ‘perceived legitimacy’, a term used by McKenna [16] that relates to whether, and to what extent, the community accepts the concept that intervention to reduce harm is necessary. McKenna [16] noted that perceptions have changed over time in many countries regarding the legitimacy of other activities of public harm such as smoking, drinking alcohol and driving, and not using seatbelts. He further suggested that the level of perceived legitimacy of speeding behaviour has not declined to the same extent as those other behaviours. Therefore, perceptions about the legitimacy of enforcing speeding are, not surprisingly, conflicted.
In a similar light, Goldenbeld (2003, as cited in [4]) previously identified four dilemmas associated with speed camera programs: (i) the Credibility dilemma (concerns about the purpose of the countermeasure including concerns about revenue raising rather than safety motivations), (ii) the Legitimacy dilemma (fairness of the countermeasure), (iii) the Implementation dilemma (acceptance hampered by difficulties with implementation) and (iv) the Social dilemma (mismatch between individual and collective interests including that speeding is appropriate if done safely). Delaney and colleagues [4] provided a useful summary of how these dilemmas were relevant in an Australian, British and North American context in 2005 (the reader is referred to Table 1 of [4]). The current paper extends this issue with specific reference to reviews of speed camera programs in New South Wales and Victoria conducted in 2011 by the relevant jurisdictional Auditor-General. Notably, both reviews appear to have been prompted, in part, by negative perceptions of speed camera programs among some sections of the community. The paper also provides an overview of contemporary community perceptions and attitudes towards speed enforcement in Australia.
Public attitudes towards speeding and enforcement
Public awareness of the risks of speeding
Public awareness of the risks associated with speeding and awareness and acceptance of speed enforcement are important considerations and are of direct relevance to the four dilemmas outlined above (i.e., Credibility, Legitimacy, Implementation and Social). Despite extensive efforts to promote the safety benefits of speed management in Australia, the most recent NRSS highlighted the need to harness community support for current and future speed management strategies. It also called for ‘ongoing public engagement to build sufficient acceptance of new initiatives’ [2].
Central to these comments were calls for three tasks to be undertaken. Firstly, the need for ongoing dialogue with key stakeholders was identified. This point included the need to continue engaging with motoring groups, some of whom have, historically, been cautious in offering support for reduced speed limits and more intensive speed enforcement. Secondly, the need to convince the community of the importance of complying with speed limits was highlighted. Aligned with this concept, the need to improve ‘appreciation of the social costs associated with low level speed offences’ [2] was highlighted, a point made more difficult to ‘sell’ because of the trade off of limited personal risk relative to the overall gains made by society in reducing road crashes (related to the Social dilemma).

Journal of the Australasian College of Road Safety – Volume 23 No.3, 2012
61
Thirdly, the need for a national community dialogue to explain the safety rationale for speed management was identified (related to the Credibility and Social dilemmas). Clearly, the presence of this recommendation in the NRSS indicates that part of the Australian community does not understand/accept the risks of speeding and the need for speed management. The Strategy also suggested that additional information on the economic and environmental benefits of lower speeds (e.g., reduced fuel consumption, emissions, and noise) might assist in promoting speed limit compliance. The relevance and importance of these issues to Australian motorists are not well understood. However, the concept of ecodriving, a ‘smooth’ way of driving that incorporates such things as anticipating changes in traffic flow and avoiding substantial braking or acceleration, has received growing interest because of potential cost savings [17].
Public attitudes towards speeding, enforcement and related issues have been tracked for almost two decades nationally. Encouragingly, over time, awareness of the risks associated with speeding appears to be increasing [18]. The proportion of the community holding the view that the chances of being crash-involved increase significantly if driving speed increases by 10 km/h has risen from 55% in 1995 to 70% in 2011. Responses varied across jurisdictions; the Australian Capital Territory recorded the lowest level of agreement (62%) and South Australia the highest (78%). Similarly, the level of agreement (already quite high in 1995 at 80%) has steadily increased to 92% in 2011 for the proposition that ‘an accident at 70 km/h will be a lot more severe than an accident at 60 km/h’. The Northern Territory recorded the lowest level of agreement (89%), and Victoria and South Australia the highest (95%). Additionally, 81% of respondents reported agreement that speed limits are generally set at reasonable levels, although this figure has been declining over the last decade. Responses ranged from 75% agreement in New South Wales to 86% in Queensland.
Public attitudes towards penalties and enforcement tolerance thresholds
Despite this apparent increasing recognition of risks associated with speeding, the public remain relatively sceptical about speed enforcement. In the 2011 annual community attitudes survey, approximately two thirds of respondents (62%) reported agreement that ‘fines for speeding are mainly intended to raise revenue’ (a steady increase over time from 1995 where the level of agreement was 54%) [18]. This issue is central to the Credibility dilemma because it relates to perceptions about why speed enforcement is conducted (i.e., safety vs. revenue raising). Of all the survey items discussed here, this item produced the most jurisdictional variation. In the Northern Territory, 49% of respondents expressed agreement that fines for speeding are mainly intended to raise revenue while in
South Australia the figure was 66%, followed closely by NSW and Victoria (65%). It is not clear why, in these three states, over two thirds of respondents agreed with the concept of revenue raising. It could be argued that at the time the survey was conducted (May-June 2011), public awareness of speed camera programs was heightened (at least in NSW and Victoria) because of the reviews that were being conducted in those jurisdictions (see later section of the current paper for further information on these reviews). Interestingly, a survey conducted some years earlier in NSW and reported in 2006 [19] examined levels of agreement with a similar statement (i.e., that ‘penalties for speeding are just revenue raising’) across NSW. Levels of agreement with ‘revenue raising’ were substantially lower overall (approximately 35%) compared to 65% agreement from the national survey in 2011. There was also some variation reported across NSW with metropolitan respondents reporting higher agreement (40.7%) compared to regional (38.2%) and rural respondents (26.1%), although these differences were not statistically significant [19]. Such variations across geographic areas and time characterise the fluctuating nature of public attitudes towards speeding and enforcement. They also emphasise that controversies associated with speed camera programs change over time as programs evolve [4].
The national survey results from 2011 also provide evidence of a mismatch between driving speed preferences and attitudes towards the risks of speeding [18]. For example, when asked how fast people should be allowed to travel on a 60 km/h urban road without being booked by police, approximately half (49%) the sample reported speeds of 65 km/h or higher as acceptable. Although the proportion was not as high, one third of the sample (33%) were supportive of being able to travel at 110 km/h on 100km/h rural roads without being booked. Overall, these findings suggest that many drivers report acceptance of travelling at speeds that equate to a level roughly 10% higher than the posted speed limit, a finding consistent with previous Australian research that is possibly linked to perceptions about ‘safe speeding’ and speed enforcement tolerances [20, 21]. The issue of perceived enforcement tolerances (the speed at which one can/should be allowed to travel above the posted speed limit) is relevant to three of Goldenbeld’s dilemmas: the Social (i.e., travelling at speeds slightly above the posted speed limit is not perceived as unsafe), the Legitimacy (i.e., tolerance levels related to perceived fairness of speed cameras), and the Implementation dilemma (i.e., perceptions of tolerance levels can be linked to perceptions of equipment reliability and appropriateness of speed limits) [4].
Attitudes towards speed enforcement
Levels of acceptance of current speed enforcement are also surveyed nationally. In 2011, half the sample reported no

Journal of the Australasian College of Road Safety – Volume 23 No.3, 2012
62
desire to see levels of enforcement change, while a third (35%) supported increased enforcement levels and 12% supported a decrease [18]. Some jurisdictional variation was reported, with New South Wales recording the lowest level of agreement for increases in enforcement (30%) and the Australian Capital Territory recording the highest (44%). There was significantly greater support for a reduction in the amount of speed enforcement reported by males, full motorcycle licence holders, and those who identified as ‘commuters’, compared to other respondent groups.
Attitudes towards a newer form of speed enforcement were also assessed [18]. Two thirds of respondents (65%) reported approval of the use of point-to-point speed enforcement (also known as section control or average speed enforcement) on main roads, with almost one third indicating strong support. Interestingly, at the time of the survey, only two jurisdictions were operating point-to-point speed enforcement (Victoria and NSW, with the NSW system only enforcing heavy vehicle speeding). Since then, two additional jurisdictions have introduced point-to-point enforcement systems (Australian Capital Territory and Queensland - see Table 1) and several others are contemplating its use. Despite it being a new and arguably less well known/understood enforcement method, it is encouraging that such a large proportion of respondents expressed support for its use in Australia. Point-to-point speed enforcement is used extensively in the United Kingdom and parts of Europe. Various evaluations indicate that it appears to be a positive addition to current speed enforcement strategies [22, 23]. To date, however, evaluations of this enforcement approach in Australia have not been published. The National Road Safety Strategy indicated the need for Australia to move towards greater
adoption of point-to-point enforcement, one that offers the opportunity to enforce speed limits across larger sections of the road network than is possible with traditional fixed or mobile speed camera deployments [2].
Recent reviews of speed camera programs – New South Wales and Victoria
In response to perceived concern about automated speed enforcement voiced by certain vocal sections of the community, the Auditor-General’s Office of New South Wales and the Victorian Auditor-General’s Office conducted reviews of speed camera programs in 2011. In both instances, the safety outcomes of the programs were reviewed and reported publicly. While findings overall were extremely positive, areas for improvement were identified in both jurisdictions. Each review will now be discussed and Table 2 summarises key findings.
New South Wales Auditor-General’s review – Improving Road Safety: Speed Cameras
Announced as an election commitment prior to the 2011 state election and released in July 2011, the review in New South Wales was a performance audit covering two key issues [24]
• Were speed cameras located in areas identified as having the greatest road safety risk?
• Do speed cameras reduce speeding and the number and severity of road crashes in these locations?
Table 1. Use of point-to-point speed enforcement systems in Australia

Journal of the Australasian College of Road Safety – Volume 23 No.3, 2012
63
Public submissions were invited on how to improve camera programs and speed management generally in New South Wales. The public was also invited to nominate fixed speed camera locations that they believed were improving road safety as well as those that were not. More than 1700 public submissions were received on this issue. Additionally, more than 150 submissions were received from citizens and organisations wishing to provide more extensive feedback. The majority (69%) of these submissions viewed speed cameras as revenue raisers, a situation that illustrates the Credibility dilemma. Overall, despite the negative views expressed in many of the public submissions, the outcome of the review was extremely positive from a road safety perspective and generally supportive of the way in which the jurisdictional authority administers the speed camera program (see Table 2 – Appendix 1).
An interesting situation occurred after the release of the report that relates to the recommendation to review and relocate 38 fixed cameras because they were not delivering road safety outcomes. There was public outcry from some communities at the idea of removing a camera that, in some cases, community members had campaigned to have installed to improve road safety in their area. For example, media reports indicate that communities such as the town of Clunes were successful in reversing the original decision to remove the fixed speed camera [25]. In response to public outcry, the Roads Minister agreed to retain and reactivate some cameras and to conduct a public consultative process to determine the future of the remainder. At the time of writing, that consultative process was incomplete and, therefore, the status of the 38 fixed cameras earmarked for review and relocation is unclear. The pressure applied by a community to reverse the announced decision and the subsequent consultative review process that it triggered illustrates the impact of the public voice in contemporary speed management in Australia.
Another interesting finding of the NSW review relates to the issue of revenue raising; the face value of fines issued by speed cameras in 2010 was no different from those issued in 2003, despite some increases in the value of fines during that time. In other words, contrary to the view often portrayed in the media, the overall revenue raised by speed cameras had not been increasing. Furthermore, it was noted that there seems to be much less public concern about revenue raised by police conducting speed enforcement (i.e., not automated enforcement) and yet both raise almost identical monetary amounts. This issue relates to the Credibility dilemma because it is linked to perceptions of fairness about the two different speed enforcement approaches. The public of NSW appear more supportive of speeding offenders being apprehended by police officers than by speed cameras, a finding replicated in research conducted recently in Queensland [26]. This may or may not be linked to the outsourcing of mobile
camera operations to private contractors in NSW – a point which is representative of the Implementation dilemma, and one that was not previously described when linking the four dilemmas to Australia’s speed camera programs in 2005 [4]. Importantly, however, the review found no evidence that payments to contractors were related to the number of speeding offences that they issued, a topic that had received media attention in NSW with claims that contractors had ‘targets’ to meet. This issue is also potentially relevant to the Victorian speed management context, since speed management in that state has been, for over a decade, a public/private partnership approach [27]. However, there were no findings relating to this issue in the review conducted in that jurisdiction in 2011 (see next section). Victorian Auditor-General’s Report – Road safety camera program
Released in August 2011, the report of the Victorian Auditor-General’s Office (VAGO ) investigated the effectiveness of speed and red-light cameras. In the opening statements of the report, it was noted that ‘sections of the community and media have shown significant interest in the road safety camera program, voicing concerns about whether using cameras is appropriate, the accuracy of cameras and the validity of infringements’ [28]. Furthermore, it was recognised that previous instances of faults in two of the state’s automated camera installations (i.e., the Western Ring Road in 2003 and the Hume Freeway point-to-point cameras in 2010) ‘have served to erode public confidence in the program’ and that some sections of the community allege that road safety cameras are solely for revenue raising purposes. These issues are directly related to the Credibility, Legitimacy and Implementation dilemmas. The 2003 fault concerned inappropriate issuing of infringements for speeds that were subsequently determined not to be possible under the circumstances [4] while the more recent fault (2010) refers to nine incorrectly issued infringement notices that were related to time synchronisation between adjacent cameras in Victoria’s point-to-point enforcement system [23]. In response to these concerns, the report examined
• whether there is a sound rationale for the road safety camera program
• whether cameras are sited for road safety outcomes
• the accuracy of the camera system
• whether the public can be confident that infringements are valid.
Table 2 (Appendix 1) summarises the key review findings. Consistent with the findings from NSW, the Victorian review found strong positive road safety benefits from the camera program, no evidence of revenue raising being the purpose of the programs, and the existence of

Journal of the Australasian College of Road Safety – Volume 23 No.3, 2012
64
accurate, robust, and reliable systems at the heart of the road safety camera programs (a finding that reflects the extensive work undertaken by Victorian agencies to address previous system failures). These findings provide important information that can and should be used to help redress the previously identified Credibility (safety vs. revenue raising) and Implementation dilemmas (reliability and accuracy of equipment and systems) in Victoria [4].
One point worth emphasising from the VAGO report is that the relevant road safety partners in Victoria and, arguably, elsewhere in Australia, have not been able to educate the whole community about the fundamental aspects of the safety camera program, despite good supporting research evidence. As noted by the Auditor-General, ‘this has placed the program’s ongoing legitimacy at risk’ [28]. The recommendation to develop a coordinated communcation strategy to counter negative misconceptions and promote the positive contribution of speed camera enforcement mirrors the NRSS recommendation discussed above [2]. This is particularly relevant because Australia has a strong emphasis on automated speed enforcement [13].
Conclusion
The four dilemmas associated with speed camera programs identified by Goldenbeld (2003, cited in [4]) relate to the rationale for, the fairness of, the logistics associated with implementation of, and the social acceptance of, automated speed enforcement. In Australia, despite an extensive body of evidence from domestic and international jurisdictions to justify the use of speed cameras in reducing the road trauma burden (for example [29]), issues pertaining to these dilemmas are still evident. Moreover, they represent a significant challenge to the future sustainability of speed camera programs, particularly if public confidence in the accuracy and fairness of them is diminished.
The two recent reviews conducted in New South Wales and Victoria [24, 28] have shed light on the contemporary controversies facing automated speed enforcement in Australia while simultaneously providing important information to combat them. Specifically, the findings that there was no evidence of camera siting for revenue raising purposes, that there are appropriate criteria used for siting cameras, and that the public can have a high degree of confidence in the reliability and integrity of camera systems and the accuracy of infringements issued can be used to counter the Credibility, Implementation and Legitimacy dilemma issues previously outlined. These findings should assist in boosting public confidence and must be used at every opportunity by the road safety community to promote the benefits of automated enforcement. As McKenna noted, ‘trust in the motivation of authorities’ is a critical component of the perceived legitimacy of an intervention such as speed cameras [16]. The perceived legitimacy of
automated enforcement in Australia received a huge boost from the findings of these two reviews, particularly since neither found any evidence of camera siting for revenue raising purposes, the primary controversy associated with the Credibility dilemma identified previously across many jurisdictions [4].
However, the findings also point to dilemmas still requiring attention. For instance, the inability of systems to detect speeding motorcycles (Victoria) and change the behaviour of high-level speeders (NSW) relates to the Implementation dilemma and represents ongoing challenges for authorities. The identified need to communicate the positive contributions made by speed camera enforcement and dispel negative misconceptions more effectively (Victoria) relate to the Social dilemma. The VAGO report identified key misconceptions such as ‘low-level speeding is safe’ and ‘speed cameras should not be placed on freeways because they are safe’ [28]. Together, these issues underpin beliefs about safe/appropriate speed by individuals vs. the broader community – a basic controversy relevant to the Social dilemma – that could be targeted in future media campaigns [4].
Delaney and colleagues acknowledged that ‘the controversies associated with speed camera use are not stagnant’ [4]. Importantly, over time, additional controversies can surface as enforcement programs evolve. The outsourcing of speed enforcement is an Implementation dilemma relevant in both New South Wales and Victoria, yet the use of private agencies in conducting speed enforcement was an issue of concern only for the NSW review, and not previously identified by Delaney et al. in 2005 in relation to Australia [4]. It is possible that other controversies relevant to the four dilemmas may surface as the use of point-to-point speed enforcement increases. The ongoing roll out of point-to-point enforcement in Australia offers an opportunity to enhance public acceptance of automated enforcement because it monitors speed over a longer section of the road network, rather than at one specific location. In that sense, it may be perceived as a fairer approach (linked to the Credibility dilemma) in that it can detect motorists who are intentionally speeding for longer periods, rather than those who may be detected inadvertently exceeding the speed limit for a shorter period by a camera that only measures spot speeds. There is, however, a challenge in promoting the benefits of point-to-point enforcement. If it were to be promoted solely as a ‘fairer’ way to enforce speed, this may inadvertently create the impression that other forms of automated enforcement are not/less fair. Caution is required here.
Overall, the findings of the two recent jurisdictional reviews provide important ammunition with which to combat many of the controversies associated with automated speed enforcement in Australia, particularly those relevant to the

Journal of the Australasian College of Road Safety – Volume 23 No.3, 2012
65
Appendix 1. Table 2. Summary of findings from 2011 NSW and Victorian Auditors-General reviews of speed camera programs
Question/Issue Jurisdiction
New South Wales Victoria
Cameras effective in reducing speeding/crashes?
Cameras change driver behaviour, positive road safety impact; Speeding and crashes reduced after fixed cameras introduced; Mixed results for individual cameras (crashes only decreasing at some locations).
Evaluations of mobile and fixed speed/red-light cameras demonstrate effectiveness in reducing frequency and severity of road trauma.
Criteria for camera locations? In place for each camera type, though criteria for mobile cameras less comprehensive; Locations broadly met criteria although documented reasons for some locations inconsistent with criteria.
In place for fixed cameras and siting has met these criteria; Mobile camera deployment criteria based on crash severity risk though may diminish general deterrent effect.
Cameras sited for safety and not revenue raising purposes?
No evidence that revenue is a factor in camera location decisions.
Revenue generation demonstrably not the primary purpose of camera program.
Limitations of current speed camera program
Cameras do not change behaviour of high-level speeders (e.g., 45+ km/h above posted speed limits); No overall criteria to determine most appropriate camera type for black spots.
Limited ability to detect speeding motorcyclists.
Other issues Private contractor payments not related to number of speeding offences.
Current processes and controls give particularly high level of confidence in reliability and integrity of road safety camera system; Gaps in evaluation research -fixed cameras on freeways not yet extensively evaluated, point-to-point cameras not yet evaluated.
Improvements recommended Develop overarching strategy for all cameras to include definition of how each camera type will be assessed; Annual review of existing site locations and publication of trends in crashes, revenue, and speeding or infringement data for each camera, updated annually.
Need to address gap in enforcement for motorcyclists; Pilot and evaluate alternative site selection and rostering including random rostering for mobile cameras; public concerns about purpose, effectiveness and integrity not adequately addressed; Coordinated communication strategy to counter negative misconceptions and promote positive contribution of camera program needed.
Credibility and Implementation dilemmas. The findings also indicate that more work needs to be done to address the speeding behaviour of specific groups of road users and that public education is needed to continue to explain the following issues: the dangers of speeding, the rationale for speed enforcement, the rationale for the mix of enforcement approaches used, the benefits already obtained from speed camera enforcement, and the rigorous approaches used to
deploy and monitor speed enforcement which are driven by both road safety and public integrity concerns.
Acknowledgements
The authors gratefully acknowledge funding support from the National Health and Medical Research Council Training Fellowship Australia-China Exchange Program.

Journal of the Australasian College of Road Safety – Volume 23 No.3, 2012
66
References1. Fleiter JJ and Watson B. (2012). Road trauma perceptions and the potential influence of the media. International Journal of Injury Control and Safety Promotion, epub: DOI: 10.1080/17457300.2012.679002
2. Australian Transport Council. (2011). National Road Safety Strategy 2011-2020. from http://www.infrastructure.gov.au/ roads/safety/national_road_safety_strategy/index.aspx.; accessed 4 August, 2012.
3. OECD Transport Research Centre - International Transport Forum. (2008). TOWARDS ZERO: Ambitious Road Safety Targets and the Safe System Approach.
4. Delaney A, Ward H and Cameron, M. (2005). The history and development of speed camera use Report No. 242 Melbourne: Monash University Accident Research Centre.
5. Fildes, B. N., Langford, J., Andrea, D., and Scully, J. (2005). Balance between harm reduction and mobility in setting speed limits: A feasibility study AP- R272/05: AUSTROADS.
6. Woolley, J.E. (2005).Recent advantages of lower speed limits in Australia, Journal of the Eastern Asia Society for Transportation Studies, 6, 3562-3573.
7. Austroads (2001). Speed Enforcement in Australasia: Volume 1: Practice, Performance Measures, Outcome Measures, AP–R189/01, Sydney.
8. Kloeden, C.N., Woolley, J.E., and McLean, A.J. (2007). A follow-up evaluation of the 50km/h default urban speed limit in South Australia, In Proceedings of 2007 Road Safety Research, Education and Policing Conference, Melbourne, 17-19 October 2007
9. Langford, J. (2009). Setting safer speed limits - Fact Sheet #2, Curtin-Monash Accident Research Centre, from http://c-marc.curtin.edu.au/local/docs/CMARC%20Fact%20 Sheet%202%20Safer%20Speeds.pdf; accessed 30 October, 2010.
10. Northern Territory Police. (2008). Road Safety Strategy 2008 - 2013. http://www.nt.gov.au/pfes/documents/File/ police/publications/strategic/NTP_RoadSafeStrat_ WEBFINAL.pdf; accessed 27 June, 2009.
11. Cameron, M.H and Delaney, A.K. (2008). Speed enforcement - effects, mechanisms, intensity and economic benefits of each mode of operation, In Proceedings Joint Australasian College of Road Safety and Queensland Parliamentary Travelsafe Committee conference: High Risk Road Users - Motivating behaviour change: what works and what doesn't work?, 18-19 September 2008, Australasian College of Road Safety, Brisbane, Australia, pp. 29-39.
12. Cameron, M and Delaney, A. (2006). Development of strategies for best practice in speed enforcement in Western Australia: Final report Number 270: Melbourne: MUARC.
13. Cameron, M. (2008). Development of strategies for best practice in speed enforcement in Western Australia: Supplementary Report Number 277. Melbourne: MUARC.
14. Carnis, L., Rakotonirainy, A and Fleiter, J. J. (2008). Speed Enforcement Programmes in France and Queensland: First Elements for a Systematic Comparison. In Proceedings Joint Australasian College of Road Safety and Queensland Parliamentary Travelsafe Committee conference: High Risk Road Users - Motivating behaviour change: what works and what doesn't work?, 18-19 September 2008, Australasian College of Road Safety, Brisbane, Australia, http://eprints. qut.edu.au/12254/.
15. Newstead, S. V. (2006). Evaluation of the crash effects of the Queensland speed camera program in the year 2005: Consultancy Report. Melbourne: Monash University Accident Research Centre.
16. McKenna, F. P. (2007). The perceived legitimacy of intervention: A key feature for road safety. AAA Foundation for Traffic Safety. Retrieved from http://www.aaafoundation. org/pdf/McKenna.pdf, accessed 23 June, 2009.
17. Symmons, M., Rose, G., and Van Doorn, G. (2009). Ecodrive as a road safety tool for Australian conditions - Road Safety Research Grant No. 2009-004: Department of Infrastructure, Transport, Regional Development and Local Government, Canberra.
18. Petroulias, T. (2011). Community Attitudes to Road Safety – 2011 Survey Report. Department of Infrastructure and Transport, Canberra.
19. Hatfield, J., and Job, R. F. S. (2006). Beliefs and attitudes about speeding and its countermeasures, Report No. B2001/0342. Canberra: Australian Transport Safety Bureau.
20. Fleiter, J. J., and Watson, B. (2006). The speed paradox: the misalignment between driver attitudes and speeding behaviour. Journal of the Australasian College of Road Safety, 17(2), 23-30.
21. Fleiter, J. J., Watson, B., Lennon, A., King, M. J., and Shi, K. (2009). Speeding in Australia and China: A comparison of the influence of legal sanctions and enforcement practices on car drivers. Paper presented at the Australasian Road Safety Research Policing Education Conference, Sydney.
22. Soole, D., Watson, B., and Fleiter, J.J. (2012). Effects of Average Speed Enforcement on Speed Compliance and Crashes: A Review of the Literature, Under review, Accident Analysis and Prevention.
23. Lynch, M., White, M., and Napier, R. (2011). Investigation into the use of point-to-point speed cameras: NZ Transport Agency Research Report 465.
24. Auditor-General New South Wales. (2011). Improving Road Safety: Speed Cameras, Road and Traffic Authority - New South Wales Auditor-General’s Report.
25. Villagers win battle to keep speed camera after Minister intervenes. (2011). Sydney Morning Herald. Retrieved from http://smh.drive.com.au/motor-news/villagers-win-battle-to- keep-speed-camera-after-minister-intervenes-20110801- 1i87x.html; accessed 5 August, 2011.
26. Soole, D. (2012). The relationship between drivers' perceptions toward police speed enforcement and self- reported speeding behaviour, Unpublished Masters Thesis, Queensland University of Technology.
27. Shuey, R. (2004). The Safety Camera Partnership in Victoria - Key Success Factors to Achieve Road Trauma Reduction for Speed Related Collisions. 2004 Year Book of the Australasian College of Road Safety - Road Safety Towards 2010, 37-39.
28. Victorian Auditor-General's Office. (2011). Victorian Auditor- General’s Report: Road Safety Camera Program.
29. Wilson, C., Willis, C., Hendrikz, J. K., Le Brocque, R., and Bellamy, N. (2010). Speed cameras for the prevention of road traffic injuries and deaths (Review). Cochrane Database of Systematic Reviews 2010 (Issue 10. Art. No.: CD004607). doi: 10.1002/14651858.CD004607.pub3.

Journal of the Australasian College of Road Safety – Volume 23 No.3, 2012
67
Abstract
The optimum speed is one which minimises the total social costs of the impacts of speed, including the costs of road trauma, travel time, air pollution emissions, noise and vehicle operating costs. Previous research has estimated the optimum speeds for cars and trucks on various classes of rural roads in Australia, based on ‘human capital’ costs of road trauma. This paper presents estimates of the optimum speeds if the changes in road trauma are valued using recent ‘willingness to pay’ estimates. If speed limits were set so that all cars and trucks travelled at their optimum speed on each class of road, there would be a 34% reduction in crash costs and an overall 3.4% reduction in total social costs on rural highways in Victoria.
Keywords
Economic analysis, Optimum speed, Social costs, Speed, Speed limits
Introduction
The goal of the Safe System approach to eliminate death and serious injury puts a focus on the speeds (and masses) of vehicles involved in crashes. An optimum speed limit is one that provides maximum benefit from reduced travel times while minimising the costs of road trauma, air pollution emissions and vehicle operating costs. This paper summarises the calculation of the optimum speeds for the range of Australian rural road types: rural freeways, multi-lane divided roads, and single-lane undivided roads, with and without shoulder-sealing. Optimum speeds had been initially estimated using ‘human capital’ costs of road trauma [1, 2]. The system-wide impacts if cars and trucks were to travel at their optimum speeds, as a basis for setting speed limits in each road environment, had then been calculated. While the optimum speed of cars on rural freeways and divided roads was higher than existing speed limits, it was found that crash costs across the full rural road system would decrease by at least 10% and total travel time would increase by only 1% [3]. This paper re-examines the optimum speeds on rural roads if road trauma is valued using the ‘willingness to pay’ approach.
Previous research on optimum speeds
Research in Europe has examined the collective impacts of vehicle speeds on road trauma, travel times, operating costs, and air and noise pollution [4-11]. The optimum speed for a class of road was defined as one which minimises the total social costs of the impacts of speed. The optimum speed has been estimated for urban roads, where speed limits are generally 50 km/h in Europe, and for rural freeways and divided and undivided roads. The European research has generally found that optimum speeds on rural roads were 15-25 km/h lower than current European speed limits and travel speeds. For example, in Great Britain during the 1990s, it was found that optimum speeds were up to 15 mph lower than existing limits on rural motorways and ‘A’ roads. Similarly, in Sweden it was found that travel speeds were 15-25 km/h higher than the optimum speed for each class of rural road [8].
A framework for assessing the impacts of speed was developed as part of the European project MASTER (Managing Speeds of Traffic on European Roads) [12]. The MASTER project developed a computer spreadsheet to allow all the impacts of a change in speed management policy to be recorded, and analysed where appropriate. The author used the MASTER framework to estimate the optimum speed on urban residential streets in Australia [13, 14]. The optimum speed depended on the method used to value road trauma. When ‘human capital’ valuations of road trauma costs [15] were used, the analysis suggested that the optimum speed on residential streets is 55 km/h. When the analysis was repeated making use of road trauma costs valued by a ‘willingness to pay’ approach [16], the analysis suggested that the optimum speed on residential streets is 50 km/h.
The author also used a modified MASTER framework to aggregate the economic costs and benefits of changes to speed limits on rural roads in Australia [1, 2]. The key modification was that the effects of speed on road trauma levels were calculated using relationships linking changes in average free speed with changes in crashes at each severity level on rural roads, developed in Sweden by Nilsson [17, 18]. Road trauma was valued by ‘human capital’ unit costs related to the injury severity of crash outcomes [15], and some estimates used early ‘willingness to pay’ values of crashes [16]. The unit cost of a fatal crash
Optimum speeds on rural roads based on ‘willingness to pay’ values of road traumaby Max Cameron, Monash University Accident Research Centre, Monash Injury Research Institute, Melbourne
Journal of the Australasian College of Road Safety – Volume 23 No.3, 2012
68
was valued at $1.74 million and $4.55 million, respectively, in year 2000 dollars. Net costs and benefits were estimated over a range of mean travel speeds (80 to 130 km/h) for the following road classes:
• freeway standard rural roads
• other divided rural roads (not of freeway standard)
• two-lane undivided rural roads (with and without shoulder sealing).
Method of this study
The effects of speed on road trauma levels were calculated using relationships linking changes in average free speed with changes in numbers of fatal, serious injury and minor injury crashes, as follows:
nA = (vA/vB)p * nB
where nA = number of crashes after the speed change nB = number of crashes before the speed change vA = mean or median free speed after vB = mean or median free speed before p = estimated exponent depending on the injury severity of the crashes.
Relationships of this form were originally developed by Nilsson based on research linking changes in median free speeds with changes in crash frequencies at various injury severities, as a result of many changes in rural speed limits in Sweden during 1967-1972 [17]. Meta-analysis of a large number of subsequent studies of road trauma changes associated with speed limit changes has since been conducted [19-21]. The analysis confirmed Nilsson’s relationships on rural roads and freeways, but found that the relationships were weaker or non-existent on urban roads. The final exponent estimates (p) for fatal crashes (4.1), serious injury crashes (2.6) and slight injury crashes (1.1) on rural roads and freeways [21] were used for this paper.
On rural roads it was generally assumed that travel time = link length/free speed of traffic flow (cruise speed). This was considered to be a reasonable assumption on rural roads where traffic congestion, and hence constrained speeds, are a rarity. Travel time was valued by Austroads estimates of time costs reflecting the vehicle type and trip purposes [22].
Vehicle operating costs for cars, light commercial vehicles and rigid and articulated trucks were based on Austroads published models linking these costs with speed [22]. Emission rates of air pollutants of each type were derived from research conducted as part of the MASTER project [23, 12]. Increased fuel consumption and emission rates associated with deceleration from cruise speeds for sharp curves (and occasional stops) on undivided rural roads, and then acceleration again, were estimated from mathematical models calibrated for this purpose in the United States [24].
The analysis also provided estimates of average speeds over 100 kilometre sections of curvy undivided roads and these average speeds were used to adjust the travel times on these roads. Air pollution cost estimates were provided by Austroads [22]. Noise pollution related to speed could not be estimated nor valued. This social cost was considered to be small along rural highways in Australia, but could be substantial in urban areas. Further details of the analysis method are given in two comprehensive reports [1, 25].
In contrast with a previous paper using ‘human capital’ costs of crashes [3], this paper has valued the changes in crashes in each road environment by 2011 ‘willingness to pay’ (WTP) values. The value of each crash saved, by maximum injury severity in the crash, has been calculated from WTP estimates of the values assigned to preventing person casualties in a study commissioned by the NSW Roads and Traffic Authority [26]. The value assigned to each crash, in 2011 dollars, was:
• fatal crash $8.03 million• serious injury crash $472,000• minor injury crash $103,000.
An Austroads project found that there is general agreement that WTP is the most appropriate for determining crash costs and that it is consistent with the Safe System approach. Australia has fallen behind other countries by valuing lives and safety benefits at low levels using the human capital approach and WTP should be adopted [27]. The Safe System approach puts even higher, perhaps infinite, value on preventing road deaths and serious injuries. A later Austroads report noted the study commissioned by the NSW Roads and Traffic Authority to provide WTP estimates and recommended the use of WTP unit costs alongside human capital costs [28].
To match the crash costs valued in 2011 dollars, the unit costs of travel time, air pollution emissions and vehicle operating were updated from 2007 values [22] to 2011 dollars using the ABS Consumer Price Index for the average of the capital cities.
Assumptions for the analysis
1. It was assumed that vehicles of each type cruise attheir speed limit, so that their average speed is the same as the limit, unless their speed is reduced by slowing for curves or stopping in some parts of the road section (e.g. at crossroads or in towns).
2. Apart from where indicated, the rural roads are relatively straight without intersections and towns, allowing vehicles to travel at cruise speed throughout the whole road section. This was assumed to be 100 km/h for each type of vehicle, except for light vehicles on rural freeways and divided roads where it was assumed that they cruise at 110 km/h.
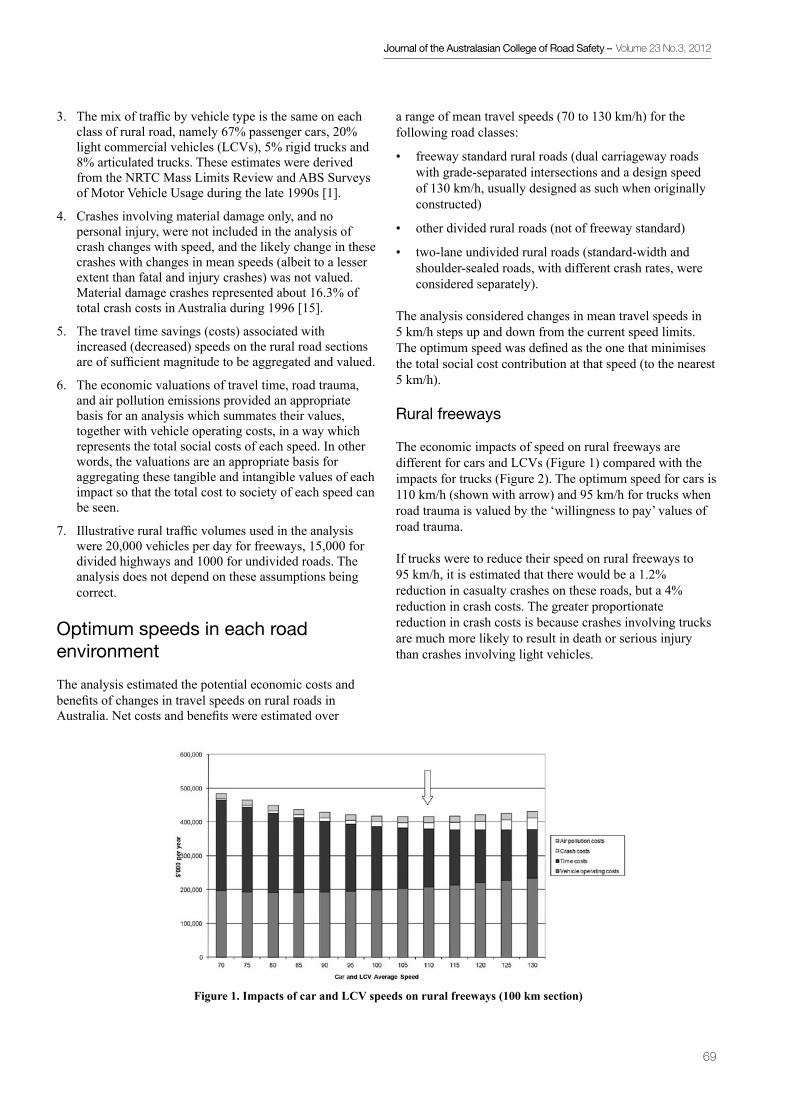
Journal of the Australasian College of Road Safety – Volume 23 No.3, 2012
69
3. The mix of traffic by vehicle type is the same on each class of rural road, namely 67% passenger cars, 20% light commercial vehicles (LCVs), 5% rigid trucks and 8% articulated trucks. These estimates were derived from the NRTC Mass Limits Review and ABS Surveys of Motor Vehicle Usage during the late 1990s [1].
4. Crashes involving material damage only, and nopersonal injury, were not included in the analysis of crash changes with speed, and the likely change in these crashes with changes in mean speeds (albeit to a lesser extent than fatal and injury crashes) was not valued. Material damage crashes represented about 16.3% of total crash costs in Australia during 1996 [15].
5. The travel time savings (costs) associated with increased (decreased) speeds on the rural road sections are of sufficient magnitude to be aggregated and valued.
6. The economic valuations of travel time, road trauma, and air pollution emissions provided an appropriate basis for an analysis which summates their values, together with vehicle operating costs, in a way which represents the total social costs of each speed. In other words, the valuations are an appropriate basis for aggregating these tangible and intangible values of each impact so that the total cost to society of each speed can be seen.
7. Illustrative rural traffic volumes used in the analysiswere 20,000 vehicles per day for freeways, 15,000 for divided highways and 1000 for undivided roads. The analysis does not depend on these assumptions being correct.
Optimum speeds in each road environment
The analysis estimated the potential economic costs and benefits of changes in travel speeds on rural roads in Australia. Net costs and benefits were estimated over
a range of mean travel speeds (70 to 130 km/h) for the following road classes:
• freeway standard rural roads (dual carriageway roads with grade-separated intersections and a design speed of 130 km/h, usually designed as such when originally constructed)
• other divided rural roads (not of freeway standard)
• two-lane undivided rural roads (standard-width andshoulder-sealed roads, with different crash rates, were considered separately).
The analysis considered changes in mean travel speeds in5 km/h steps up and down from the current speed limits. The optimum speed was defined as the one that minimises the total social cost contribution at that speed (to the nearest 5 km/h).
Rural freeways
The economic impacts of speed on rural freeways are different for cars and LCVs (Figure 1) compared with the impacts for trucks (Figure 2). The optimum speed for cars is 110 km/h (shown with arrow) and 95 km/h for trucks when road trauma is valued by the ‘willingness to pay’ values of road trauma.
If trucks were to reduce their speed on rural freeways to95 km/h, it is estimated that there would be a 1.2% reduction in casualty crashes on these roads, but a 4% reduction in crash costs. The greater proportionate reduction in crash costs is because crashes involving trucks are much more likely to result in death or serious injury than crashes involving light vehicles.
Figure 1. Impacts of car and LCV speeds on rural freeways (100 km section)

Journal of the Australasian College of Road Safety – Volume 23 No.3, 2012
70
Divided roads
The economic impacts of speed on rural divided roads were similar to the impacts on freeways, except that the risk of a crash is higher. The optimum speed for cars is 95 km/h and 90 km/h for trucks when road trauma is valued by the ‘willingness to pay’ approach.
Undivided roads
The economic impacts of speed on straight sections of standard (up to 7 metres sealed width) undivided rural roads for cars and LCVs (Figure 3) and trucks (Figure 4) shows that the optimum speeds are lower than on rural freeways and divided roads. Analysis was also carried out for undivided roads through curvy terrain and
Figure 2. Impacts of truck speeds on rural freeways (100 km section)
Figure 3. Impacts of car and LCV speeds on straight undivided rural roads (100 km section)
occasional crossroads and towns, each feature requiring slowing from cruise speeds at the speed limit (Figures 5 and 6). This analysis took into account the substantial increases in operating costs associated with deceleration and acceleration, especially for trucks, and the associated increases in air pollution and fuel consumption per vehicle-kilometre.
The optimum cruise speed for cars and light commercial vehicles (LCVs) travelling on these roads is estimated to be90 km/h if the road is straight without crossroads and towns (Figure 3), but only 85 km/h if the road has many sharp bends and includes intersections and towns requiring stopping (Figure 5). The optimum cruise speed for trucks is estimated to be 85 km/h on both straight roads and on curvy undivided roads of the same standard (Figures 4 and 6).

Journal of the Australasian College of Road Safety – Volume 23 No.3, 2012
71
Figure 4. Impacts of truck speeds on straight undivided rural roads (100 km section)
Figure 5. Impacts of car and LCV speeds on undivided rural roads with curvy alignment,crossroads and towns (100 km section)
Figure 6. Impacts of truck speeds on undivided rural roads with curvy alignment,crossroads and towns (100 km section)

Journal of the Australasian College of Road Safety – Volume 23 No.3, 2012
72
The corresponding pair of charts for cars and LCVs (Figures 3 and 5) and for trucks (Figures 4 and 6) are shown on the same scale so that the influence of curvy terrain, crossroads and towns on total economic costs at the higher cruise speeds, compared with the total costs on straight, unimpeded roads, can be seen.
Undivided roads with shoulder sealing
The optimum cruise speed on the higher standard undivided roads with shoulder sealing is estimated to be 90 km/h for both cars and trucks if the road is straight without crossroads and towns, but only 85 km/h for both vehicle types if the road has many sharp bends and includes intersections and towns requiring stopping.
Summary of optimum speeds in each road environment
Table 1 summarises the estimate (to the nearest 5 km/h) of the optimum speed in each road environment for light vehicles and trucks separately. The optimum speeds using the ‘human capital’ costs of road trauma [3] are also shown for comparison with those estimated using the ‘willingness to pay’ values. The Safe System approach puts greater value on preventing road deaths and serious injuries than in the past. While ‘willingness to pay’ may not fully reflect that value, it is a better basis for defining optimum speeds.
Impact if all vehicles travelled at their optimum speed
If speed limits on each class of rural road (including rural undivided roads) were to be moved closer to the optimum speeds, there could be a substantial net gain in total economic costs across the road network. This is because a large proportion of rural road travel (and an even larger proportion of rural crashes) is on undivided roads.
Reliable data on rural traffic levels using each of the four classes of road analysed in this study was available for Victoria. This data allowed calculation of the total economic impacts across the Victorian rural road network if all vehicles travelled at the optimum speed for the road type and vehicle type. The analysis used the optimum speeds estimated in this study using ‘willingness to pay’ values of road trauma. The Victorian rural main road network was estimated to be 19,500 km long and carry about 15,200 million vehicle-kilometres per year.
Compared with the existing situation, assuming all vehicles travel at current speed limits, the change to travelling at the optimum speed in each road environment would result in a 13% increase in travel time, an 18% reduction in casualty crashes, and a 4-9% reduction in air pollution emissions of various types (Table 2).
The reduction in casualty crashes is estimated to represent a saving of 57 fatal crashes (approximately 34% of the rural road toll in Victoria), 248 serious injury crashes, and 247 minor injury crashes. When these savings in road trauma are valued using the ‘willingness to pay’ approach, there would be a 34% reduction in crash costs on Victoria’s rural highways (Table 3).
The overall economic impact if all vehicles travelled at their optimum speeds was estimated to be a saving of $384 million per annum in total social costs. However, there would be a 13% increase in travel time costs to provide this total societal benefit in the rural areas of Victoria (Table 3).
a This estimate is less than 85 km/h because of the different vehicle operating cost model used in the previous analysis [3] compared with that used here [22], resulting in lower estimated cost at low speeds
Table 2. Physical impact if all vehicles changed to travelling at their optimum speed, compared to travelling at their current speed limits (rural Victoria roads)
Table 1. Estimated optimum speeds using ‘willingness to pay’ (WTP) values of road trauma and using ‘human capital’ unit costs (BTE 2000)

Journal of the Australasian College of Road Safety – Volume 23 No.3, 2012
73
These economic impacts can be compared with those based on optimum speeds using human capital costs of road trauma [3], but are not directly comparable because the previous estimates used a different model of vehicle operating costs related to speed and all economic costs were in year 2000 dollars. Nevertheless, because the human capital approach produced higher optimum speeds, particularly for cars (Table 1), the overall savings in road trauma were not so great (10%) and the increase in total travel time was small (1%). Optimum speeds using human capital costs suggested speed limits of 120 to 125 km/h on freeways and other divided roads (though limits on undivided roads substantially less than 100 km/h for trucks, and for cars on the curvy roads with crossroads and towns).
Discussion
If rural speed limits are to be set taking into consideration the full range of costs of the impacts on road trauma, travel time, emissions and vehicle operating costs, then optimum speeds based on ‘willingness to pay’ valuations of road trauma are more consistent with the Safe System approach than those based on ‘human capital’ cost valuations. This method does not value savings in road trauma infinitely, but does provide a workable basis for rationalising all the costs of speed of each vehicle type on each class of rural road.
The optimum speeds of trucks on rural divided roads are lower than those calculated for light vehicles, especially on rural freeways where a 15 km/h difference has been estimated (Table 1). A lower speed limit for trucks than for light vehicles would appear appropriate on rural divided roads. The availability of at least two traffic lanes in each direction on these divided roads would facilitate the safe overtaking maneouvres that would be required to a greater extent if light vehicles and trucks had differential speed limits. Lower speed limits for trucks (than for light vehicles) are common in Europe, typically 90 km/h on multi-lane rural divided roads.
The optimum speeds on rural undivided two-lane roads for trucks and light vehicles, respectively, are essentially the same for each standard of road (Table 1). Hence, while
lower speed limits appear appropriate for undivided rural roads, particularly through curvy road environments, there is no case for differential speed limits for trucks and light vehicles on any standard of undivided road. The need for increased opportunities for safe overtaking maneouvres on these roads, if general speed limits were reduced, would appear no greater than currently.
The findings of this paper depend on the functional relationships between speed and road trauma, travel time, air pollution emissions and vehicle operating costs, the assumptions made, and the input parameters. The sensitivity of the findings to variations in these factors has been tested only to a limited extent.
Conclusions
Within the limits of the assumptions made and the data available for this study, a number of conclusions about optimal rural speeds and speed limits were reached.
1. Using recent ‘willingness to pay’ valuations of crashcosts, the optimum speeds on rural freeways would be 110 km/h for cars and light commercial vehicles and 95 km/h for trucks. On other divided rural roads, the optimum speeds would be 95 km/h and 90 km/h, respectively. These findings suggest that the current default rural speed limit of 100 km/h on divided roads, with a limit of 110 km/h on the higher quality freeways, is close to economically optimal for light vehicles but not for trucks. The analysis suggests that a limit of 90 km/h for trucks, with perhaps 95 km/h on freeways, would be appropriate.
2. There is economic justification for decreased speed limits on two-lane undivided rural roads, even on the safer roads with sealed shoulders. The optimum speed on straight sections of these roads is no more than 90 km/h for both light vehicles and trucks. The analysis suggests that the speed limit should be at most 90 km/h on undivided rural roads.
3. On undivided roads through terrain requiring slowingfor sharp bends and occasional stops in towns, increased fuel consumption and air pollution emissions associated with deceleration from and acceleration to high cruise speeds would add very substantially to the total economic costs. The optimum speed for both light vehicles and trucks is about 5 km/h less on the curvy roads with crossroads and towns than the 90 km/h speed limit suggested above for undivided rural roads. The analysis suggests that a speed limit of 85 km/h would be appropriate for undivided rural roads through curvy road environments. However, if this figure is not acceptable (because it does not follow current speed limit practice based on multiples of 10 km/h) then a limit of 80 km/h should be considered.
Table 3. Economic impact if all vehicles changed totravelling at their optimum speed, compared to travelling at their current speed limits (rural Victoria roads)

Journal of the Australasian College of Road Safety – Volume 23 No.3, 2012
74
4. Rationalisation of speed limits applicable to each class of rural road and for each type of vehicle, making the limits consistent with the optimum speed in each case, has the potential to reduce casualty crashes and crash costs substantially. Although travel times and costs would increase significantly, there would be a reduction in the total social costs on rural highways when all the benefits of reduced road trauma, air pollution emissions and vehicle operating costs from reduced speeds are considered.
References
1. Cameron MH. Potential benefits and costs of speed changes on rural roads. Report No. CR 216. Australian Transport Safety Bureau, Canberra, 2003.
2. Cameron MH. Potential benefits and costs of speed changes on rural roads. In Proceedings, Road Safety Research, Policing and Education Conference, Perth, 2004.
3. Cameron MH. Rationalisation of speed limits within the Safe System approach. In Proceedings, Road Safety Research, Policing and Education Conference, Perth, 2011.
4. Nilsson G. Speeds, accident rates and personal injury consequences for different road types. Rapport 277, Swedish National Road and Transport Research Institute (VTI), Sweden, 1984
5. Andersson G, Bjoerketurn U, Bruede U, Larsson J, Nilsson G, and Thulin H. Forecasts of traffic safety and calculated traffic safety effects for a choice of measures. TFB and VTI forskning/research 7:6. Sweden, 1991.
6. Peeters PM, van Asseldonk Y, van Binsbergen AJ, Schoemaker TJH, van Goevreden CD, Vermijs RGMM, Rietveld P, and Rienstra SA. Time to tame our speed? A study of the socioeconomic cost and benefits of speed reduction of passenger cars. Report to Research Unit for Integrated Transport Studies, Den Haag, The Netherlands, 1996.
7. Rietveld P, van Binsbergen A, Schoemaker T, and Peeters P. Optimum speed limits for various types of roads: a social cost-benefit analysis for the Netherlands. Tinbergen Institute, Free University Amsterdam, The Netherlands, 1996.
8. Carlsson G. Cost-effectiveness of information campaigns and enforcement and the costs and benefits of speed changes. In Proceedings of European Seminar, Cost-Effectiveness of Road Safety Work and Measures, Luxembourg, 1997.
9. Toivanen S, and Kallberg V-P. Framework for assessing the impacts of speed. Papers, Workshop II on Speed Management, In Proceedings, 9th International Conference, Road Safety in Europe, Cologne, Germany, 1998.
10. Elvik, R. Cost-benefit analysis of safety measures for vulnerable and inexperienced road users: Work Package 5 of EU-Project PROMISING. TOI, Norway, 1999.
11. Elvik, R. Optimal speed limits: Limits of optimality models. Transportation Research Record 1818, National Research Council, Washington DC, USA, 2002.
12. Kallberg, V-P, and Toivanen, S. Framework for assessing the impacts of speed in road transport. Deliverable 8, MASTER project, European Commission, 1998.
13. Cameron, MH. Estimation of the optimum speed on urban residential streets. Report to Australian Transport Safety Bureau, Canberra. Monash University Accident Research Centre, 2000.
14. Cameron, MH. Estimation of the optimum speed on urban residential streets. In Proceedings, Road Safety Research, Policing and Education Conference, Melbourne, 2001.
15. BTE – Bureau of Transport Economics. Road crash costs in Australia. Report 102, BTE, Canberra, 2000.
16. BTCE – Bureau of Transport and Communications Economics. The costs of road accidents in Victoria – 1988. Unpublished monograph. BTCE, Canberra, 1997.
17. Nilsson G. The effects of speed limits on traffic accidents in Sweden. In Proceedings, International Symposium, Dublin. OECD, 1981.
18. Nilsson G. Traffic safety dimensions and the Power Model to describe the effect of speed on safety. Bulletin 221, Lund Institute of Technology, Department of Technology and Society, Traffic Engineering, Lund, Sweden, 2004.
19. Elvik R, Christensen P, and Amundsen A. Speed and road accidents. An evaluation of the Power Model. Report 740/2004, Institute of Transport Economics, Oslo, Norway, 2004.
20. Elvik R. The Power Model of the relationship between speed and road safety. Update and new analyses. Report 1034/2009, Institute of Transport Economics, Oslo, Norway, 2009.
21. Cameron MH, and Elvik R. Nilsson’s Power Model connecting speed and road trauma: Applicability by road type and alternative models for urban roads. Accident Analysis and Prevention, 2010; 42(6): 1908-1915.
22. Perovic J, Evans C, Lloyd B, and Tsolakis D. Guide to project evaluation. Part 4: project evaluation data. Austroads Publication No. AGPE04/08, Austroads, Sydney, 2008.
23. Robertson S, Ward H, Marsden G, Sandberg U, and Hammerstrom U. The effect of speed on noise, vibration and emissions from vehicles. Working paper R 1.2.1, MASTER project, European Commission, 1998.
24. Ding Y. Quantifying the impact of traffic-related and driver- related factors on vehicle fuel consumption and emissions. MSc thesis, Civil and Environmental Engineering, Virginia Polytechnic Institute & State University, Blacksburg VA, USA, 2000.
25. Cameron MH. Economic evaluation of the introduction of lower rural default and national highway speed limits in Tasmania. Report to Department of Infrastructure, Energy and Resources, Hobart, Tasmania, 2009.
26. Roads and Traffic Authority. Economic valuation of safety benefits: Serious injuries – Final Summary Report. RTA, Sydney, New South Wales, 2008.
27. Tsolakis, D, Turner, B, Perovic, J, and Naude, C. Component Costs in Transport Projects to Ensure the Appropriate Valuing of Safety Effects. Austroads Publication No. AP–T125/09, Austroads, Sydney, 2009.
28. Tsolakis D, Naude C, Tan F, Evans C, Makwasha T, and Shackleton J. Updating Austroads RUE Unit Values and Related Methodologies. Austroads Publication No. AP–R373/11, Austroads, Sydney, 2011.

Journal of the Australasian College of Road Safety – Volume 23 No.3, 2012
75
Introduction
Compliance with speed limits among vehicle operators, and attitudes towards speeding behaviour, do not appear to have changed significantly in Victoria over the last eight or nine years. Contrary to drink driving behaviour, which in Victoria is met with almost unanimous social disapproval, speeding behaviour does not attract the indignation of the populace; consequently there is little or no social pressure to comply with speed limits. Building community acceptance for effective speed management is, therefore, a priority for road safety agencies, including the Transport Accident Commission (TAC). The TAC believes its efforts in public education and road safety promotion over the past 20 years have contributed to a shift in the community's social norms in relation to drink driving behaviour. Making speeding behaviour similarly socially unacceptable is likely to be a long term process. This article considers the current level of social acceptance of speeding in light of a range of survey data collected by the TAC.
The problem
Survey data collected on a regular and ongoing basis by the TAC since 2001 reveals that since 2004 there has been little movement in self-reported speeding behaviour and a range of attitudes and beliefs in relation to speeding and speed enforcement (see Figure 1 and Table 1).
The early movements observed between 2001 and 2004 are likely to be a result of a package1 of speed management changes implemented in Victoria between 2000 and 2004. The lack of progress since that time suggests that making speeding behaviour socially unacceptable is a major challenge for the TAC and other road safety agencies. This challenge has become a key element of the TAC’s road safety and marketing strategy.
This follows on from the premise that social norms are a powerful motivator of behaviour (see, for example, Goldstein, Cialdini and Griskevicius [1]). Of particular relevance is whether there are elements of social norms, social unacceptability and social pressure that can be used to help shift social norms in relation to speeding behaviour.
Contributed articlesHow unacceptable is speeding? Insights from a Social Acceptability Survey in Victoriaby Michael Nieuwesteeg, Transport Accident Commission (TAC), Victoria
Table 1. Agreement with speeding-related statements - TAC Road Safety Monitor survey
Figure 1. Drivers exceeding the speed limit - TAC tracking study. Question put to drivers (aged <50 yrs only): When driving, how often would you exceed the speed limit, evenif by only a few km/h?

Journal of the Australasian College of Road Safety – Volume 23 No.3, 2012
76
Quantifying the social acceptability of speeding behaviour
In 2009, the TAC and Sweeney Research developed the Social Acceptability Survey, an instrument that sought to quantify and rank the levels of social acceptability and unacceptability of a range of driving and other general behaviours (see [2]). The objective of the survey instrument was to track changes in the community's attitudes over time, and identify segments within the community that are most resistant to the TAC's public messages. A range of social behaviours were included in the survey so as to position the level of community acceptance of speeding behaviour in relation to other behaviours.
A questionnaire asked respondents to assess a range of human behaviours as being acceptable or unacceptable, on a seven-point scale, ranging from ‘very unacceptable’ through to ‘very acceptable’. Each behaviour question was prefaced by the question ‘How would most other people judge my behaviour if I…’ and was phrased in the past tense for consistency. There were seven questions in the survey that dealt with speeding behaviour.
Social Acceptability Survey results
A selection of results from the second iteration of the survey, conducted in 2010, is presented below. The twenty most socially unacceptable behaviours from the questionnaire (according to the arithmetic mean where ‘very unacceptable’ is scored -3, ‘unacceptable’ -2 and so on through to ‘very acceptable’ being +3) are presented in Table 2.
Of those speeding behaviours included in the survey, the more extreme behaviours were considered more unacceptable than lower level speeding behaviours. The most unacceptable speeding behaviour tested was driving at 100 km/h in a 60 km/h zone, considered to be unacceptable by about 95% of respondents. By contrast, the least unacceptable speeding behaviour was driving at 110 km/h in a 100 km/h zone, with 61% considering this to be unacceptable and around 25% of respondents considering this behaviour to be acceptable.
Female drivers believe the community to have less tolerant attitudes towards speeding than male drivers. This is the case for each of the seven speeding behaviour questions, with the difference being significant.
There is an increase in unacceptability ratings with age group for each of the speeding behaviour questions. The differences were more substantial in the speeding behaviours 10 and 20 km/h over the limit, where people in the younger groups are less likely to consider speeding to be an extreme behaviour. For example, 57% of 50-60 year olds consider driving 50 km/h in a 40 km/h zone to be either very unacceptable or unacceptable, compared with 50% of 40-49 year olds, 42% of 30-39 year olds and 35% of 18-29 year olds.
The differences between geographic locations are less pronounced, but variations do apply. For speeding behaviours 40 km/h over the speed limit and 80 km/h in a 60 km/h zone, residents of major urban locations have the most tolerant attitudes, followed by rural and other urban locations. In 100 km/h zones, residents of other urban and
Table 2. Twenty most socially unacceptable behaviours, 2010 TAC Social Acceptability Survey

Journal of the Australasian College of Road Safety – Volume 23 No.3, 2012
77
rural locations are more tolerant of travelling at 110 km/h than residents of major urban locations. Travelling at 120 km/h in a 100 km/h zone was considered by 30% of rural residents as not unacceptable, compared with 19% and 20% of residents in major urban and other urban locations respectively. Table 3 shows these demographic variations.
The survey also identified self-reported speeders, being those who reported they speed all or most of the time when they drive. They represented 8.6% of respondents, and consistently reported higher levels of acceptance of speeding behaviour. In fact, the majority of self-reported speeders consider their behaviour while driving 110 km/h in a 100 km/h zone would be judged to be acceptable, with one-third believing that behaviour to be socially unacceptable.
Another perspective
An alternative source of data provides another perspective on the issue of acceptability of low level speeding, this time with a personal rather than social focus. The TAC Road Safety Monitor survey in 2011 considered self-reported speeding behaviour in the context of the participant’s personal opinion of what constitutes speeding. The survey first asked what speed a person should be allowed to drive in a 60 km/h zone. This was followed by the question ‘When you have the opportunity, how often do you exceed that speed?’ The results show that a majority of people are willing to speed, even after allowing for their personal level of tolerance. As shown in Figure 3, 38% of drivers think they should be allowed to drive at 65 km/h in a 60 km/h zone, and 69% of these drivers actually do this sometimes.
Figure 2. Speeding behaviours – responses from 2010 survey
Table 3. Level of unacceptability of speeding behaviours by demographic group

Journal of the Australasian College of Road Safety – Volume 23 No.3, 2012
78
These results reveal that two-thirds of drivers knowingly exceed the actual speed limit in 60 km/h zones. Also, a majority (58%) of drivers think people should be allowed to exceed the speed limit by up to three km/h, while those who think people should be allowed to exceed the limit by more than five km/h are in the minority (12% of all drivers).
Perhaps the most important conclusion to draw from these results is that a majority of drivers admit to exceeding the speed at which they think they should be allowed to drive, and those drivers with a more liberal interpretation of speed limits are most likely to exceed the speed at which they think they should be allowed to drive.
Implications
The Social Acceptability Survey sheds light on the social pulse: what society views as socially wrong. The TAC expects to continue to use and develop this survey in coming years, with the intention of monitoring trends in the unacceptability of speeding behaviour as well as identifying segments within the community most resistant to the TAC’s message.
The results show that the community feels very strongly about high-level speeding, but is much more accepting of lower-level speeding. The challenge appears to be greatest in 100 km/h speed zones, where there is a higher level of acceptance of speeding behaviour. Consideration of the range of behaviours that were rated as more unacceptable than driving at 110 km/h in a 100 km/h zone gives an
insight into the nature of this challenge. Such behaviours as failing to say please/thanks to a waiter, picking your nose in public, throwing recyclables in landfill bin, being drunk in a public place and watering the garden during restrictions were all considered more unacceptable. There is clearly a challenging task ahead for public educators such as the TAC to convince drivers of the risks associated with speeding behaviour.
Perhaps more worrying than the complacency about driving at 110 km/h in a 100 km/h zone is that one-third of self-reporting speeders recognise that the community views their speeding behaviour as unacceptable. This implies that road safety proponents cannot rely on social norms alone. We also know from the Road Safety Monitor survey questions on speed tolerance and speeding behaviour that 68% of drivers think people should be allowed to exceed the posted speed limit.
It would seem that, where there is compliance with speed limits, this behaviour is largely influenced by speed enforcement. With widespread acceptance of speeding by a few km/h, and a low level of social unacceptability of speeding by 10 km/h, it is clear that enforcement remains a key element of any speed management approach. A question worthy of future research would be whether the widespread availability of speed assistance technology, such as Intelligent Speed Assist – a technology that alerts drivers when they exceed the speed limit – will lessen the acceptance of low-level speeding.
Figure 3. Speed at which a person should be allowed to drive in a 60 km/h zone, and level of compliance- TAC Road Safety Monitor 2011
Journal of the Australasian College of Road Safety – Volume 23 No.3, 2012
79
The power of social influence will perhaps become a key influencer of driving speeds only when speeding is overwhelmingly considered to be very unacceptable, as is the case with driving with a Blood Alcohol Concentration (BAC) of 0.1%.
Notes1 This package of measures included expansion of the covert speed camera program, a lowering of the cameras’ speed detection threshold, increased camera operating hours, the introduction of a 50 km/h general urban speed limit and a large public education campaign Wipe off 5. It has been evaluated [3] as having led to a statistically significant reduction in casualty crashes.
References
1. Goldstein N, Cialdini R, Griskevicius R. A Room with a Viewpoint: Using Social Norms to Motivate Environmental Conservation in Hotels. Journal of Consumer Research 35, (2008), 472-482.
2. Nieuwesteeg M and Lowery R. 2011. Making speeding socially unacceptable: measuring community attitudes. Paper presented at the 2011 Road Safety Research, Policing and Education Conference, Perth, Australia.
3. D'Elia A, Newstead S, and Cameron M. (2007). Overall Impact During 2001-2004 of Victorian Speed- Related Package. Melbourne, Victoria: Monash University Accident Research Centre.
Methods for measuring motorcycle speeds and their implications for understanding ‘safe speeds’by Darren Walton, Director - Research and Evaluation, Health Promotion Agency, Wellington, New Zealand; Senior Adjunct Fellow, University of Canterbury, NZ
Introduction
New Zealand traffic accident data show that motorcycles account for 13% of road crash fatalities [1] but that motorcyclists undertake only around 0.5% of travel time or trips [2]. From these statistics, it is determined that motorcyclists are around 16-23 times more likely to be involved in a fatal or injury crash than car drivers [1]. The high relative crash risk for motorcycles is replicated in every country; only the magnitude of the estimate varies, as motorcycles are always the most dangerous form of travel. One report estimates that motorcycles have a relative crash risk as high as 34 times that of cars [3].
Based on vehicle registrations, the number of motorcycles may seem insignificant: they constitute only 3.47% of the NZ vehicle fleet. However, motorcycle registrations have grown to over 100,000 in recent years, with the largest increase occurring between 2004 and 2008 [4]. The popularity of the motorcycle comes and goes but the recent rise in registrations coincides with increased rates of crashes resulting in death or injury [1]. Stephan et al [5] reviewed fatal motorcycle accident files from 115 Australian coroners’ cases and found the rider was travelling too fast for the conditions in over 70% of cases. This conclusion is made notwithstanding that forensic techniques used for estimating a motorcycle’s speed from crash scene evidence are far less accurate than those available for cars [6-7].
The main concern here is to consider the relative speeds of motorcycles and cars implied by reported statistics available from New Zealand, Australia, the United Kingdom and elsewhere. The argument developed in this paper is that our
routine monitoring of vehicle speeds is not sophisticated enough to reveal the actual speed profile of motorcycles and is confounded by the classification of motorcycles in a group with scooters and mopeds. Recent work in New Zealand reveals how misleading our reported statistics are concerning motorcycle speeds.
The category that is referred to as ‘motorcycles’ formally includes motorcycles, motor scooters, mopeds, motor-powered bicycles and three-wheeled motorcycles [8]. The category can be referred to as ‘powered two-wheelers’ to avoid misclassification of the range of vehicle types, but this will simply mask the fact that scooters and motorcycles are used by different demographics for different trip purposes, implying different speed profiles and crash rates. To further complicate the issue, modern scooters can be more powerful than small motorcycles. The wide range in vehicle power associated with ‘motorcycles’ places the researcher in a position akin to classifying light trucks with family sedans and expecting speed monitoring to fit within a single distribution.
Annual speed surveys
In New Zealand, an annual vehicle speeds survey is conducted by the Ministry of Transport to provide key monitoring statistics on all vehicle speeds based on vehicle classifications [9]. The survey is central to all performance criteria established by other agencies (as it is in Australia, see for example [10]). It is usual practice to report mean speeds, ‘excessive speeds’ (defined as the percentage of vehicles travelling in excess of the speed limit) [11], and the 85% percentile of the distribution of observed speeds.

Journal of the Australasian College of Road Safety – Volume 23 No.3, 2012
80
The methodology used in New Zealand relies on roadside observers and is sophisticated enough to accurately measure the speeds of different truck and trailer configurations. However, notably absent from what is otherwise best practice is the recorded speed of motorcycles, or ‘motorcycles, scooters and mopeds’. New Zealand is not unique. Australian states report annual vehicle speed monitoring but do not attempt motorcycles [12-13]. Similarly, of the six states in America reporting annual speed survey results on the web (following OECD [11]), none provides estimates of the speeds for motorcycles. The US Department of Transport acknowledges the importance of particularly monitoring motorcycle behaviours because of their different behavioural patterns and the need to determine exposure rates from travel patterns to account for the fact that ‘motorcycles are the most dangerous motor vehicles for both operators and passengers of any age’ [8].
Relatively rare among jurisdictions is the United Kingdom (UK), which reports monitoring motorcycle speeds (see Table 1). In the UK, speed monitoring is conducted using a network of embedded automatic monitoring units (Figure 1). The UK statistics show motorcycles travelling around the speed of cars in all years from 2006 to 2011. Note that the percentage of motorcycles exceeding the speed limit is about 50%, but the percentage exceeding the speed limit by more than 5 mph is significantly more than that of cars (between 4-8% greater than that observed for cars).
Even when limiting their concern to simply count motorcycles, the US Federal Highway Authority (FHA) recognises five problems with automated systems [8]. Motorcycles (i) are lightweight, (ii) have low metal mass, (iii) have a narrow footprint, (iv) travel in parallel or in staggered formations, and (v) are easily confused with other vehicle types (especially truck and trailer units). The range of equipment marketed as automatic counters for motorcycles includes side looking radar, inductive loops, video capture, quadruple loops, road tubes, infrared beams and magnetometers. Recently emerging techniques include GPS monitoring and point-to-point speed data [15].
There is a wide range of technical apparatus which, when claiming to monitor motorcycle speeds, purports to overcome five major technical hurdles:
• false positives – when other vehicle types are recordedas motorcycles, especially bicycles in urban areas or trailers on truck units on highways
• false negatives – failure to detect a motorcycle becausethey are masked by other traffic, missed in groups, travel too fast or too slow, miss the inductive loops, fail to trigger the magnetometer, or trigger the wrong mechanism
• classification problems – failure to distinguish the different distributions of speeds for mopeds, scooters and motorcycles; typical equipment for monitoring traffic speeds can fail to detect motorcycles or incorrectly classify bicycles as scooters or motorcycles but it is now recognised that scooters and mopeds travel at slower speeds than motorcycles [16], so combining them together distorts the value of the reported mean speeds and the variation
• accuracy of the speed estimate – the identification ofthe target vehicle can be successful but the measurement of speed is in error; road tube systems are notorious for coming loose, loop detectors need to be calibrated to a sensitivity that detects motorcycles but not a truck in the adjacent lane
• the error rate is not random across the range ofspeeds recorded (i.e. fast motorcycles are inaccurately measured). In summary, no system is perfectly suited to monitoring all traffic types, and none is especially good at detecting motorcycles.
Table 1. Free flow vehicle speeds on built-up roads in30 mph speed zones in the United Kingdom (Annual figures from 2006 to 2011, reported by the UK Department of Transport [14])
Figure 1. The UK Department of Transport monitors vehicle counts and speeds using a network of around 180 sites with embedded sensors configured asDouble D inductive loop arrays

Journal of the Australasian College of Road Safety – Volume 23 No.3, 2012
81
Despite the significant technical challenges involved in attempting to accurately estimate the distribution of speeds of motorcycles, it is occasionally done within dedicated research. Reported methods for undertaking the more difficult task of monitoring motorcycle speeds include automated traffic monitoring [17], video camera surveillance [18-19] and equipment- supported roadside observation [16-17].
Comparing results from different surveys
Table 2 combines the available statistics from the UK [4], Australia [17] and NZ [3, 16] to report six sets of free speeds (headways of four seconds or more) for cars and motorcycles. Walton and Buchanan [16] had the aim of measuring motorcycle speeds using a portable TIRTL traffic monitoring system (a system developed, and used widely, in Australia) across five sites and two matched weeks of weekday observations. The system uses infrared beams to detect ‘wheel configurations’ based on algorithms that evaluate the size of the wheel base and the size of the wheels. Despite its technical sophistication, the system was found to confuse bicycles with motorcycles and could not distinguish between scooters and motorcycles (no current system can). Roadside observers were used to record ‘bicycle events’ and type of motorcycle (classifying scooters based on training). Results of this investigation are reported in Table 3. These results, among others, led to the conclusion that ‘motorcycle and scooter riders travel with an increased likelihood of exceeding the speed limit, around 3.4 times more likely than other traffic’ [16].
Baldock et al. [17] used ‘Metrocount’ hardware [20].As Baldock et al. were examining highway speeds, they could be confident not to encounter the full range of difficulties concerning misclassifications (e.g. bicycles and mopeds). In addition, they used roadside observers to report other characteristics of the motorcyclist such as the use of high-visibility gear and to classify ‘motorcycle’ type, although they do not report separate estimates of mean speeds for motorcycles and scooters.
It is common to observe around 40-50% of traffic travelling at ‘excessive speeds’ with variation according to time of day [11]. So, at first sight, the UK results (50%) seem radically different to the results of Walton and Buchanan [16] (with only 20.6%) and also those in highway speeds in Australia (67%). It is clear in Table 2 that the mean speeds for motorcycles are significantly lower in the urban environments monitored in NZ, and also that a difference is observed when comparing the mean speeds across vehicle types, and this does not appear to be the case in the UK. Some of these differences are due to the site locations in NZ observations, resulting in lower mean scores and average speeds well below the speed limits. It is usual for annual speed surveys to record speeds at midblock sections of the road and maximise the opportunity for free speeds to
reduce error in the observations. Baldock et al. follow the pattern of NZ, showing significantly higher mean speeds for motorcycles compared to cars.
It is also important to consider the removal of bicycles and other sources of error in the research data of Walton and Buchanan, along with the division of motorcycles and scooters for separate considerations. Importantly, in NZ there are higher observed average speeds for motorcycles and scooters compared to cars, a finding that held consistent across each of five sites in inner city Wellington.
Despite appearances, the UK results and others are not radically different. The important consideration is not the mean speeds (which can been shown to vary between sites) but the variation in speed for motorcycles, and particularly the variation in motorcycle speeds compared to that observed for cars. This standard deviation of the samples can be calculated from the point estimates of the mean and the portion travelling above the speed limit. This backward estimation of the variation relies on the assumption that the speed distribution is approximately normal in both cases and the point estimates are determined with a sufficient sample. For example, the estimated standard deviation for the distributions in the UK (30 mph) samples for cars and motorcycles are 7.96 km/h for cars and 10.73 km/h for motorcycles. These calculated estimates of variation can be expressed as the proportion of motorcycles exceeding a notional limit (i.e a 50 km/h speed limit, 5 mph above the 30 mph limit in the UK or 10 km/h above the speed limits in France and Australia) relative to cars exceeding the same limit. These are then presented in Table 4 as the relative odds of motorcycles travelling faster than cars.
Table 2. Reported mean free speeds for cars and motorcycles from samples drawn in the UK, NZ, Australia and France
Table 3. Average speed by vehicle type in five inner urban locations with 50 km/h limits in Wellington, NZ as reported by Walton and Buchanan [16]
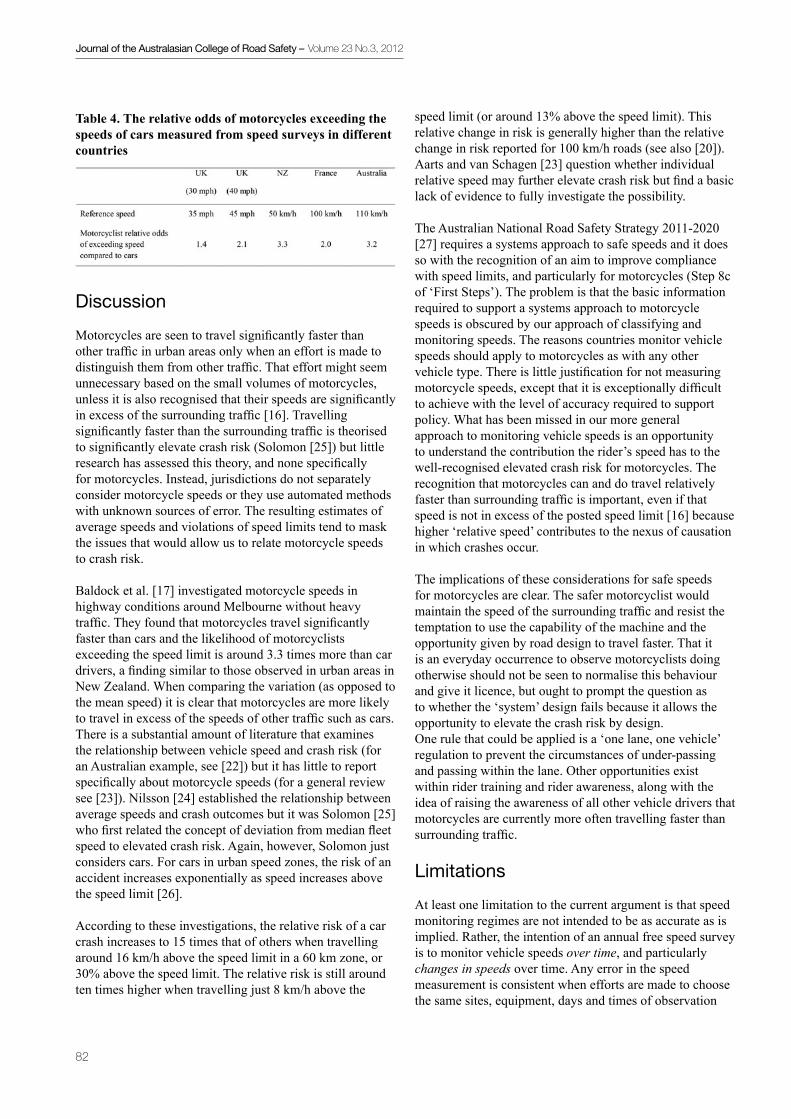
Journal of the Australasian College of Road Safety – Volume 23 No.3, 2012
82
Discussion
Motorcycles are seen to travel significantly faster than other traffic in urban areas only when an effort is made to distinguish them from other traffic. That effort might seem unnecessary based on the small volumes of motorcycles, unless it is also recognised that their speeds are significantly in excess of the surrounding traffic [16]. Travelling significantly faster than the surrounding traffic is theorised to significantly elevate crash risk (Solomon [25]) but little research has assessed this theory, and none specifically for motorcycles. Instead, jurisdictions do not separately consider motorcycle speeds or they use automated methods with unknown sources of error. The resulting estimates of average speeds and violations of speed limits tend to mask the issues that would allow us to relate motorcycle speeds to crash risk.
Baldock et al. [17] investigated motorcycle speeds in highway conditions around Melbourne without heavy traffic. They found that motorcycles travel significantly faster than cars and the likelihood of motorcyclists exceeding the speed limit is around 3.3 times more than car drivers, a finding similar to those observed in urban areas in New Zealand. When comparing the variation (as opposed to the mean speed) it is clear that motorcycles are more likely to travel in excess of the speeds of other traffic such as cars. There is a substantial amount of literature that examines the relationship between vehicle speed and crash risk (for an Australian example, see [22]) but it has little to report specifically about motorcycle speeds (for a general review see [23]). Nilsson [24] established the relationship between average speeds and crash outcomes but it was Solomon [25] who first related the concept of deviation from median fleet speed to elevated crash risk. Again, however, Solomon just considers cars. For cars in urban speed zones, the risk of an accident increases exponentially as speed increases above the speed limit [26].
According to these investigations, the relative risk of a car crash increases to 15 times that of others when travelling around 16 km/h above the speed limit in a 60 km zone, or 30% above the speed limit. The relative risk is still around ten times higher when travelling just 8 km/h above the
speed limit (or around 13% above the speed limit). This relative change in risk is generally higher than the relative change in risk reported for 100 km/h roads (see also [20]). Aarts and van Schagen [23] question whether individual relative speed may further elevate crash risk but find a basic lack of evidence to fully investigate the possibility.
The Australian National Road Safety Strategy 2011-2020 [27] requires a systems approach to safe speeds and it does so with the recognition of an aim to improve compliance with speed limits, and particularly for motorcycles (Step 8c of ‘First Steps’). The problem is that the basic information required to support a systems approach to motorcycle speeds is obscured by our approach of classifying and monitoring speeds. The reasons countries monitor vehicle speeds should apply to motorcycles as with any other vehicle type. There is little justification for not measuring motorcycle speeds, except that it is exceptionally difficult to achieve with the level of accuracy required to support policy. What has been missed in our more general approach to monitoring vehicle speeds is an opportunity to understand the contribution the rider’s speed has to the well-recognised elevated crash risk for motorcycles. The recognition that motorcycles can and do travel relatively faster than surrounding traffic is important, even if that speed is not in excess of the posted speed limit [16] because higher ‘relative speed’ contributes to the nexus of causation in which crashes occur.
The implications of these considerations for safe speeds for motorcycles are clear. The safer motorcyclist would maintain the speed of the surrounding traffic and resist the temptation to use the capability of the machine and the opportunity given by road design to travel faster. That it is an everyday occurrence to observe motorcyclists doing otherwise should not be seen to normalise this behaviour and give it licence, but ought to prompt the question as to whether the ‘system’ design fails because it allows the opportunity to elevate the crash risk by design.One rule that could be applied is a ‘one lane, one vehicle’ regulation to prevent the circumstances of under-passing and passing within the lane. Other opportunities exist within rider training and rider awareness, along with the idea of raising the awareness of all other vehicle drivers that motorcycles are currently more often travelling faster than surrounding traffic.
Limitations
At least one limitation to the current argument is that speed monitoring regimes are not intended to be as accurate as is implied. Rather, the intention of an annual free speed survey is to monitor vehicle speeds over time, and particularly changes in speeds over time. Any error in the speed measurement is consistent when efforts are made to choose the same sites, equipment, days and times of observation
Table 4. The relative odds of motorcycles exceeding the speeds of cars measured from speed surveys in different countries

Journal of the Australasian College of Road Safety – Volume 23 No.3, 2012
83
and so on. However, this argument is flawed when considering motorcycles for the reasons alluded to at the outset: motorcycle registrations are increasing, motorcycle power is increasing [11], and the purposes of the trips that are undertaken are altering along with the reasons for the waxing and waning of motorcycle popularity. As a consequence, the use of time as an independent variable is fraught with the difficulty that significant sources of error in the dependent measure (speed) are not evenly distributed across the independent variable (time).
Conclusions
Inadequate technology, poor quality data and poor assessment of the available data mean issues concerning the relationship between speed and crash risk for motorcycles are masked in the statistics we monitor and report, usually on an annual basis. It is exceptionally difficult to accurately determine true mean speeds for motorcycles; a dedicated sampling effort is probably necessary to remove sources of error that otherwise show that motorcycles are no more likely to travel faster than cars. Motorcycles do travel faster than surrounding traffic and this is rarely considered from the perspective of their elevated risk for crashes or from the perspective of examining the system that creates this opportunity.
Acknowledgements
The author wishes to acknowledge the support of the Accident Compensation Corporation for funding the series of investigations into motorcycle safety and especially Judy Buchanan who championed investigating motorcycle speeds. The author also thanks Steve Dennis, UK Department of Transport, for supplying the image of the Double D loop array used to assess vehicle speeds across their network.
References
1. Ministry of Transport, NZ. Motorcyclists: crash statistics for the year ending 31 December 2010: Crash Factsheet: Wellington: Research and Statistics, Ministry of Transport, 2011.2. Ministry of Transport, NZ. Motorcyclists: New Zealand household Travel survey 2003 2009. Wellington: Research and Statistics, Ministry of Transport , 2010. 3. Lin , Mau-Roung and Kraus, Jess F. A review of risk factors and patterns of motorcycle injuries. Accident Analysis & Prevention 2009; 41 (4) 710–722.4. Ministry of Transport, NZ. The New Zealand vehicle fleet: annual fleet statistics, 2011. Wellington: Research and Statistics, Ministry of Transport, 2011. 5. Stephan, Karen., Symmons, Mark., Hillard, H., Bohensky, M. Muir, C and Lenne. Michael. Characteristics of fatal motorcycle crashes involving excessive speed and/or inappropriate speed, 2009. Viewed October 17 2011 http:// www.arrivealive.vic.gov.au/print/node/248.
6. Wood, D. P., Alliot, R., Glynn, C., Simms., C. K. and Walsh, D. G. Confidence limits for motorcycle speed from slide distances. Proceedings of the Institutes of Mechanical Engineers: Part D Automobile Engineering, 222, 1349-1360, 2009.
7. Wood, D. P., Glynn, C. & Walsh, D. Motorcycle-to-car and scooter-to-car collisions: speed estimation from permanent deformation. Proceedings of the Institution of Mechanical Engineers Part D: Automobile Engineering, 223 (6) 737-756, 2009.
8. Federal Highways Administration (2008). Traffic Monitoring Guide Supplement. US Department of Transportation, Federal Highway Administration. Viewed February 7, 2011. www. fhwa.dot.gov/ohim/tmguide/pdf/tmgsupp.pdf
9. Ministry of Transport, NZ. 2010 Speed survey: results summary. Wellington: Research and Statistics, Ministry of Transport , 2011.
10. Small M, Norman P, and Fedojuk T. Stronger road safety performance monitoring in South Australia 2009. Australasian Road Safety Research, Policing and Education Conference 10 -13 November 2009, Sydney, New South Wales, 2009.
11. Organisation for the Economic Cooperation and Development (OECD) Speed management. Paris: Organisation for the Economic Cooperation and Development. viewed, 10 July 2012, http://www.internationaltransportforum.org/ Pub/pdf/06Speed.pdf
12. Road and Traffic Authority of New South Wales, Sydeny. How widespread a problem is speeding. Viewed 10 July 2012: http://www.rta.nsw.gov.au/saferroadsnsw/speeding-risks.pdf
13. Kloeden CN and Woolley JE. Vehicle speeds in South Australia. CASR Report Series: Adelaide: University of Adelaide, 2012.
14. Department of Transport, UK. Index of free flow traffic speeds. Viewed July 1, 2012. http://www.dft.gov.uk/statistics/ series/speeds/
15. RTA (2011). Annual Speed and traffic volume data in Sydney http://www.rta.nsw.gov.au/publicationsstatisticsforms/ downloads/annual_speed_and_traffic_volume_data_2009- 2010.pdf
16. Walton D and Buchanan J. Motorcycle and scooter speeds approaching urban intersections. Accident Analysis and Prevention; (48) 335-340, 2012.17. Baldock MRJ, Kloeden, CN, Lydon M, Ponte G, Raftery S. Motorcycling in Victoria: preliminary findings of the evaluation of the community education and policy project. The Australasian Road Safety Research, Policing and Education Conference, 2010.18. Kanhere, N. K., Birchfield, S. T., Sarasua, W. A. and Khoeini, S. Traffic monitoring of motorcycles during special events using video detection. Transportation Research Board TRB Paper Number: #10-3933, TRB Annual Meeting, Washington, 2009.19. Minh, C.C., Sano, K., and Matsumoto, S. The speed, flow and headway analyses of motorcycle traffic. Journal of Eastern Asia Society for Transportation Studies (6) 1496-1508, 2005.
20. Metrocount (2012). Metrocount 5600 series vehicle classifier system. Viewed 10 July 2012, http://www.metrocount.com/ products/mc5600/
21. Observatoire National Interministériel de la Sécurité Routière (ONISR) Bilan de l’année 2004, Ministère des Transports, Paris, 2005.

Journal of the Australasian College of Road Safety – Volume 23 No.3, 2012
84
22. Kloeden, C. N., Ponte, G., Mclean, A. J. Travelling speed and the rate of crash involvement on rural roads. Report No CR 204. Canberra: Australian Transport Safety Bureau. 2001.
23. Aarts, L & van Schagen, I. Driving speed and the risk of road crashes: a review. Accident Analysis and Prevention; (38) 215-224, 2006.
24. Nilsson G. Traffic safety dimensions and the Power Model to describe the effect of speed on safety, Lund Institute of Technology and Society, Traffic Engineering, 2004.
25. Solomon, David. Accidents on main rural highways related to speed, driver, and vehicle. Technical report, U.S. Department of Commerce/Bureau of Public Roads (precursor to Federal Highway Administration), 1974.
26. Fildes, B.N., Rumbold, G., Leening, A. Speed behaviour and drivers’ attitude to speeding. General Report No. 16: VIC Roads, Hawthorn, Vic, 1991.
27. Australian Transport Council. Australian National Road Safety Strategy 2011-2020 viewed 6 July 2012. http://www.atcouncil.gov.au/documents/files/ NRSS_2011_2020_15Aug11.pdf
A study conducted by researchers at Monash University Accident Research Centre (MUARC) has demonstrated the crash-reduction benefits of combining fixed digital speed and red light cameras. The study evaluated the crash effects of 87 fixed digital speed and red light (FDSRL) cameras and accompanying warning signs at 77 signalised intersections in Victoria over a ten-year period.
The combination of speed and red light fixed cameras is not common and had not been tested previously. Analysis of crash statistics at the 77 sites provided evidence that the use of FDSRL cameras and associated signage significantly reduced the number of casualty crashes. Results showed a 26% drop in all casualty crashes, and a 47% reduction when focusing only on vehicles travelling from the intersection leg where the camera was installed.
MUARC placed the equipment over a large population of signalised intersections in the Greater Melbourne area, with others in regional Victoria including three FDSRL cameras in Geelong, one in Echuca and another in Bendigo.
The study was conducted against a backdrop of entrenched research showing the association between red light running and speed and severe injury/fatalities. In Victoria, speeding has been identified as the main cause of 20% of fatalities and serious injury collisions, while another 20% of casualty crashes at major intersections in metropolitan Melbourne are caused by red light-running.
Currently more than 150 speed cameras and 83 red light cameras are used in Victoria, with an average 2.8 million vehicles speed-checked per month.
The study noted that the benefit of red light cameras ‘may be off-set by increases in rear-end crashes’. MUARC reported that while FDSRL cameras had their highest deterrence effect on the intersection leg where the camera was located, accompanying signage warning of the presence of cameras had a further deterrent effect on other lanes. ‘While the use of FDSRL cameras was associated with a reduction in overall casualty crash risk, there was no evidence of a reduction in relative crash severity’, MUARC said.
In contrast to public perceptions that cameras are installed as revenue-raising devices, the research found strong evidence that this automated technology has been associated with significant reductions in casualty crashes and associated costs to the community from road trauma. Across the 77 intersections studied, it was estimated that 17 crashes causing serious injuries or fatalities, and 39 minor injury crashes, would be prevented each year, representing cost savings to the community of over $8 million.
Monash University Accident Research Centre - Report #307 [2011]: Evaluation of the crash effects of Victoria’s Fixed Digital Speed and Red Light Cameras (Authors: Budd L, Scully J and Newstead S) is available at http://www.monash.edu.au/miri/research/reports/muarc307.html.
Factors that influence driving speed
Another MUARC study, published in June, looked at factors that influence driving speeds, including driver (or rider) characteristics, motivational and attitudinal
Literature ReviewRecent reports reviewed by Andrew Scarce and Deborah Banks
Victorian study supports use of combined speed and red light cameras to reduce crashes at intersections

Journal of the Australasian College of Road Safety – Volume 23 No.3, 2012
85
factors, speed limits and enforcement, road design and infrastructure. The researchers conducted a review of current and recent literature in order to gain a better understanding of the factors that affect drivers’ speed choices in various environments. The study identified a number of issues that need to be taken into account when developing speed management strategies, and made a range of recommendations for more effective speed management in Victoria aimed at reducing road trauma.
A driver’s choice of speed involves assessing the level of risk involved and deciding what level of risk is acceptable. The study found that, in the main, drivers and riders lack awareness of the true relationship between speed and road trauma. They tend to under-estimate crash and injury risk and over-estimate what is a safe speed. The study also found that higher speeds have a ‘contagious effect’ on other drivers and riders, causing them to adopt even higher average speeds.
The characteristics of the road also have a significant impact on choice of speed, and it is possible that many roads give incorrect cues or messages to drivers. For example, a stretch of road may look safe for travel at high speeds, but there may be hazards ahead (such as a tight curve in the road) or cyclists or other vulnerable road users present that drivers are not aware of.
The authors concluded that it is of the utmost importance that the public understand that speed limits are set for the purpose of increasing road safety, and that this understanding is crucial to speed compliance. Among other recommendations concerning road infrastructure,
enforcement and use of technology, the authors recommended improved public education programs and media campaigns with more innovative messages.
The study was commissioned by VicRoads, and forms part of a series of four papers addressing various aspects of speed management.
Monash University Accident Research Centre - Report #308 [2012]: Velocity Series Discussion Paper 4 – Factors influencing travel speed (Authors: Liu S, Oxley J, Corben B and Young K) is available at http://www.monash.edu.au/miri/research/reports/muarc308.html.
Survey of vehicle speeds in South Australia
This CASR report summarises data on vehicle speeds collected at various sites in South Australia during 2010 and compares results with those of earlier surveys. Systematic measurement of vehicle speeds has been carried out on an annual basis at selected sites – with a broad range of road types and varying speed zones, and in both urban and rural areas – as part of a series of surveys commissioned by the Department of Transport, Energy and Infrastructure; these have been conducted to monitor driver behaviour in various locations and to assess the effectiveness of speed reduction countermeasures.
Centre for Automotive Safety Research Report CASR097 [2012]: Vehicle speeds in South Australia 2010 (Authors: Kloeden C and Woolley J) is available at http://casr.adelaide.edu.au/publications/list/?id=1281.
By writing for the journal, you have the opportunity to contribute to the important exchange of views and information on road safety. Articles on any aspect of road safety are welcome and may be submitted as papers for the peer-reviewed section of the journal, or as contributed articles. Articles are now invited for issues in 2013. When preparing articles for submission, authors are asked to download and follow the ACRS Instructions for authors, available at http://acrs.org.au/publications/journals/author-guidelines. Please contact the Managing Editor for further information, and for publication dates and deadlines. Letters to the Editor and items for the News section will also be considered for publication; feedback or suggestions
The ACRS Journal needs you!
about journal content are also welcome. Please submit all articles/contributions to the Managing Editor at [email protected]. Next issue: The next issue of the journal, Vol 23.4, will be a Special Issue devoted to themes and outcomes from the 2012 ACRS National Conference. This Special Issue will be guest edited by A/Prof Teresa Senserrick of TARS at UNSW.
Have you thought about contributing to the journal? All readers are encouraged to help make the journal more valuable to our members and to the road safety community.


Proudly sponsored byLB Australia
New South Wales Governmentand ANCAP
Australasian College of Road Safety Inc.
ACRS, PO Box 198, Mawson ACT 2607 AustraliaTel 02 6290 2509Fax 02 6290 0914
Email [email protected] Office
Pearce Centre, Collett Place, Pearce ACT Australia
Visit the College website at www.acrs.org.au