Embed Size (px)
Citation preview

Original Article
Journal of Building Physics
1–16
� The Author(s) 2017
Reprints and permissions:
sagepub.co.uk/journalsPermissions.nav
DOI: 10.1177/1744259117704926
journals.sagepub.com/home/jen
Pore characterization ofheterogeneous buildingmaterials: Pyroclasticarid–based concrete
I Gomez-Arriaran1, S Roels2, I Flores-Abascal1,M Odriozola-Maritorena1
and K Martın1
AbstractIn this article, the results of the hygroscopic characterization of a building material called‘picon’, consisting of cement mortar and pyroclastic deposits from volcanic eruptions,are presented. The material obtained is used for the manufacture of blocks used in theconstruction of buildings in the Canary Islands. Picon is a heterogeneous material withuncontrolled particle size, having a pore system of very scattered sizes, what affects themoisture behaviour of the blocks. This heterogeneity results in a pore structure thataffects the determination of the moisture properties of the material. In this work, thisdifficulty is faced, separately studying the pore structure of the cement paste and theaggregates, to come to a better interpretation of the concrete behaviour. The resultsindicate that the pore structure of the heterogeneous concrete differs from what couldbe expected from separately obtained porosimetry of each component of the concrete.
KeywordsPore structure, heterogeneous material, moisture properties, concrete
1ENEDI Research Group, Department of Thermal Engineering, University of the Basque Country (UPV/
EHU), Donostia – San Sebastian, Spain2Department of Civil Engineering, Faculty of Engineering Science, KU Leuven, Leuven, Belgium
Corresponding author:
I Gomez-Arriaran, ENEDI Research Group, Department of Thermal Engineering, University of the Basque
Country (UPV/EHU), Plaza Europa 1 20018 Donostia-San Sebastian, Spain.
Email: [email protected]

Introduction
Picon is a very abundant volcanic material in the Canary Islands, formed frompyroclastic deposits from volcanic eruptions. These volcanic materials, lava flowsand pyroclastic deposits, cover large areas of the islands, creating fields of lapilliand volcanic ash. Depending on its size and quality, these materials were destinedto different applications. The grosser elements were traditionally used in smalllocal buildings, for paving roads and even as vine crop base support (since its highhygroscopicity contributes to capture and store the dew moisture). More fine frac-tions were used to amend certain types of agricultural soils. The picon is currentlyused on a large scale in asphalt applications for the execution of roads and cemen-titious applications for building. In cementitious applications, it is used to manu-facture blocks, where the picon acts as grain in a compacting mixture of cementand sand. Thus, the composition of the block material is heterogeneous, and theknowledge of the pore system characteristics of both, the cement and the aggre-gates, is necessary to be able to identify how the resultant concrete will behave inthe presence of the moisture.
In this research, the moisture behaviour of heterogeneous concrete is measuredand characterized by the sorption isotherm and the water absorption coefficient(Aw). The moisture basic, storage and transport properties of porous materials areinfluenced by their pore structure (Bentz et al., 2011; Carmeliet and Roels, 2002;Gomez et al., 2007, 2008; Roels et al., 2004; Sanchez Fajardo et al., 2015). Concreteis a heterogeneous material formed by aggregates and hardened cement pastebinder. The properties of the cement paste acting as binder are critical (Cookand Hover, 1999; Song and Kwon, 2007; Wu et al., 2014) to the behaviour of theheterogeneous mortar.
It has been found that aggregates influence the pore structure of the concrete.The pore size distribution of cement paste in the concrete differs from the pore sizedistribution of plain paste hydrated without aggregates. It is usually considered(Winslow and Cohen, 1994; Winslow and Liu, 1990) that for mortar and concrete,additional porosity occurs in pore sizes larger than the plain paste’s threshold dia-meter as measured by mercury intrusion.
It is well known that the curing conditions of the cement paste have criticalinfluence on the resultant pore structure. Longer curing times and lower water–cement (w/c) ratio result in greater degrees of hydration, lower total porosities andsmaller values of threshold pore width as stated in Baroghel-Bouny (2007) andCook and Hover (1999), where 92 hardened cement paste specimens with differentw/c ratios and curing times were tested and their implications with respect to poreconnectivity were presented. The resulting threshold phenomena in cement pastesand mortars are discussed in Diamond (2000) where the limitations of the mercuryintrusion porosimetry (MIP) technique to provide estimation of the pore size distri-bution on these materials are discussed in depth, and it is concluded in Diamond(2000), Chatterji (2001) and Wild (2001) that the MIP measurements are usefulonly to provide threshold diameters and total porosity information. The drying
2 Journal of Building Physics

process of cement-based materials does also affect the pore structure as confirmedby Galle (2001), where four drying methods were compared. The results confirmedthat oven-drying generates important damages to the materials’ microstructure inthe capillary porosity domain and confirmed the applicability of the freeze-dryingtechnique as a suitable drying procedure to investigate cement-based materials’pore structure using the MIP.
Figure 1 shows the type of block from which test samples were extracted for thisresearch.
Figure 2 shows the macroscopic scale composition of the picon-based concrete.Two types of lapilli grains, black and brown, with a very different granulometry,can be observed. The binder material is formed by cement and aggregates of verysmall size.
This heterogeneous composition will affect not only the storage but also themoisture transport properties of the material. As a result, the characterization ofthe picon aggregates as well as the cementitious paste is required to better under-stand the moisture behaviour of the block.
Experimental tests
The tests were performed at the Building Physics Section of the University ofLeuven, Belgium, and in the Hygro-thermal Properties Laboratory set up at theUniversity of the Basque Country and the Building Quality Control Laboratory ofthe Government of the Basque Country. The material samples were supplied bythe Government of Canary Islands. Table 1 presents the number of samples testedon each test.
The tests were performed in general according to the Heat Air and MoistureStandards Development (HAMSTAD) project (Roels et al., 2003) recommendations
Figure 1. Picon block.
Gomez-Arriaran et al. 3

and the corresponding standard for each test (NBN B 24-213 1976; UNE-EN ISO12571:2015, 2015; Tables 2–4).
Figure 2. Picon sample.
Table 1. Number of samples per test.
Test Vacuum saturation test Water uptake test Mercury intrusion test
Sample codes 1–8 9-101-102-121 P1, P2Number of samples 8 4 2
Table 2. Samples for vacuum saturation test.
Sample code md (g) V (cm3)
1 528.26 278.62 708.71 361.13 514.07 257.64 628.13 329.35 257.92 129.46 264.66 137.67 389.34 202.18 294.13 151.7
4 Journal of Building Physics
The basic properties of the picon concrete were measured by means of a vacuumsaturation test according to Belgian Standard NBN B 24-213 (1976).
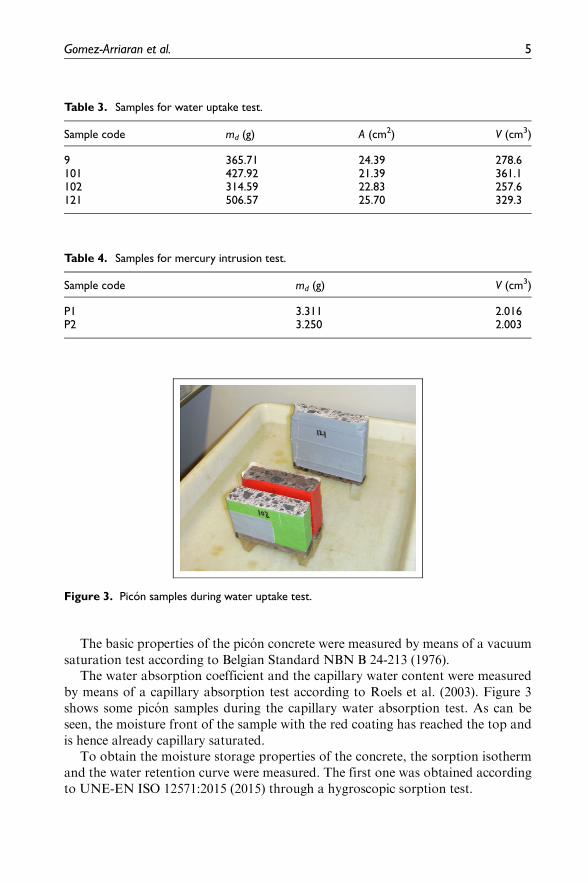
The water absorption coefficient and the capillary water content were measuredby means of a capillary absorption test according to Roels et al. (2003). Figure 3shows some picon samples during the capillary water absorption test. As can beseen, the moisture front of the sample with the red coating has reached the top andis hence already capillary saturated.
To obtain the moisture storage properties of the concrete, the sorption isothermand the water retention curve were measured. The first one was obtained accordingto UNE-EN ISO 12571:2015 (2015) through a hygroscopic sorption test.
Table 3. Samples for water uptake test.
Sample code md (g) A (cm2) V (cm3)
9 365.71 24.39 278.6101 427.92 21.39 361.1102 314.59 22.83 257.6121 506.57 25.70 329.3
Table 4. Samples for mercury intrusion test.
Sample code md (g) V (cm3)
P1 3.311 2.016P2 3.250 2.003
Figure 3. Picon samples during water uptake test.
Gomez-Arriaran et al. 5

The moisture retention curve was determined using the mercury intrusion tech-nique. First, the mercury intrusion technique was applied and then the correspond-ing pore volume distribution was deduced for the picon concrete. A Micromeritichs9310 porosimeter was used to test three samples of each material. For the MIP test,the samples were obtained from a sample of paste cured without aggregates.
Results
Basic properties
The basic properties were obtained from a vacuum saturation test. Table 5 showsthe results of this test.
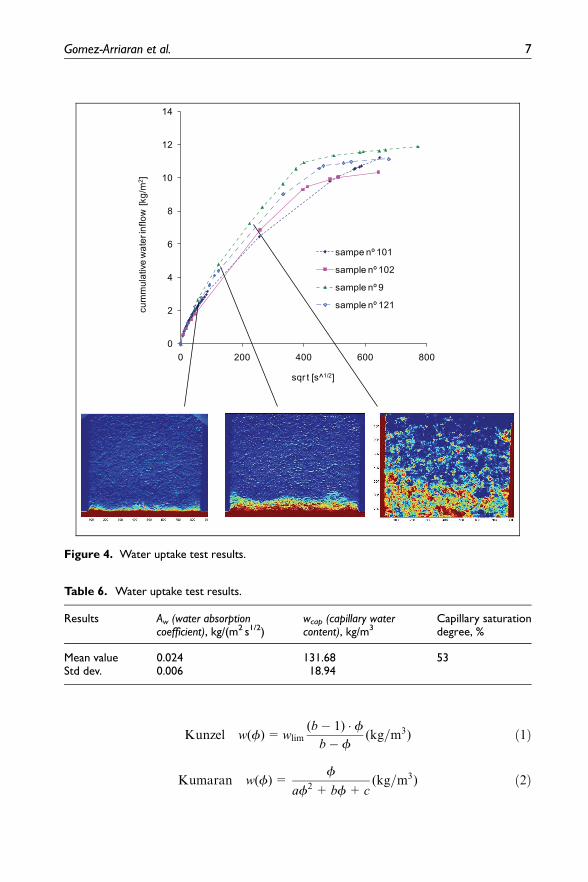
Figure 4 shows the capillary water absorption curve for each sample. This curverepresents the cumulative water inflow versus square root of time. X-ray images ofthe progress of the moisture profile (Gomez et al., 2007; Roels and Carmeliet,2006) at three different moments during the capillary absorption process illustratethe heterogeneous character of the material. Table 6 shows the results of this test.
The picon concrete has a low capillary absorption coefficient (0.024 kg/m2 s1/2).This low value was expected according to the small and thus hardly capillary activepores of the cement paste surrounding the coarser grains. From Figure 4, it can beobserved that there is not a uniform and well-defined moisture front during thewater uptake. This is due to the heterogeneous porous structure of the picon con-crete, as will be discussed later on when the pore structure is analysed.
The degree of saturation corresponding to the capillary moisture content is alsovery small (53%), which is a possible indication of air entrapment in the picongrains surrounded by fine pores of the cement paste and the corresponding previsi-ble hysteresis on sorption process.
Moisture storage properties
Three sorption models proposed by different authors (Burch and Choi, 1997; Krus,1996; Kumaran, 1996; Kunzel, 1995) were used to fit the experimental data onhygroscopic sorption
Table 5. Vacuum saturation test results.
Results c0 (openporosity, %)
rb (bulkdensity), kg/m3
rP (matrixdensity), kg/m3
wsat (vacuum saturationcontent), kg/m3
Mean value 0.25 1942.88 2586.43 248.64Std dev. 0.02 37.28 33.46 20.51Max. value 0.27 1995.23 2639.59 271.41Min. value 0.21 1896.15 2527.12 210.47
6 Journal of Building Physics
Kunzel w(f)=wlim(b� 1) � f
b� f(kg=m3) ð1Þ
Kumaran w(f)=f
af2 + bf+ c(kg=m3) ð2Þ
Figure 4. Water uptake test results.
Table 6. Water uptake test results.
Results Aw (water absorptioncoefficient), kg/(m2 s1/2)
wcap (capillary watercontent), kg/m3
Capillary saturationdegree, %
Mean value 0.024 131.68 53Std dev. 0.006 18.94
Gomez-Arriaran et al. 7

MOIST w(f)=A1
1� f� 1
� �B
(kg=m3) ð3Þ
where wlim is the free limit moisture content (equivalent to the capillary water con-tent), and a, b c, A and B are the fitting parameters for each correlation. Figure 5shows the fit of the hygroscopic sorption test data using all three models men-tioned. As can be observed, the picon concrete has high hygroscopicity, due to thefine size of the cement paste.
Table 7 shows the fit parameters for the three models, the goodness of fit (chi-square) for each model. The goodness of fit is calculated as
x2 =X (wi � wfitting)
2
s2i
where wi is the measured moisture content value, wfitting is the fitted value and si isthe standard deviation.
The goodness of fit for the Kumaran (1996) and Kunzel (1995) model is consid-erably better than for the MOIST (Burch and Choi, 1997) model.
Finally, multimodal functions were used to fit the data obtained from the MIPtest. These functions are based on the sum of Van Genuchten–type functions(Durner, 1994)
Figure 5. Sorption isotherm fitting for picon concrete.
8 Journal of Building Physics

w(pc; l, c, n)=wsat �Xk
i= 1
li 1+(cipc)ni½ �
1ni�1
� �ð4Þ
where ci and ni are the fitting coefficients, li is the weight factor and k is the modal-ity or number of analytical functions necessary to describe the whole pore system.
The results were combined with the results of the hygroscopic sorption (sorptionisotherm), vacuum saturation (wsat) and capillary absorption (wcap) tests to com-plete the retention curve over the full range of capillary pressures. Due to the meso-scopic heterogeneous composition of the picon concrete, there were slightdifferences in mercury intrusion test results between different samples. Figure 6shows the results of the mercury intrusion test for two picon concrete samples aswell as the fitting of the water retention curve using the Van Genuchten–type mul-timodal functions. Each pore subsystem is also drawn for the respective concretesample. In one case, the fitting results in four subfunctions corresponding to foursubsystems (s1, s2, s3 and s4) of pores with differing degrees of significance, andfor the other sample it results in a modality of three (s1, s2 and s3).
Table 8 shows the multimodal fit parameters, drawn on a least square basis, forboth the picon concrete samples.
Pore structure
From the derivation of the moisture retention curve, the distribution of pore sizescan be calculated using the following expression
fv(r)= � 1
r1
∂w(pc)
∂ log pc(r)ð Þ = � 1
r1
∂w(pc)
∂pc
pc ln (10) ð5Þ
As shown in Figure 7, the heterogeneous porous structure of the picon concretecomprises a combination of three to four pore subsystems. Basically, to simplify,
Table 7. Sorption isotherm fit parameters for type 04 lightened clay.
Model Reading Chi-square
Kumaran 3.68a 20.04678532b 20.01726704c 0.07936101
Kunzel 3.72wlim 63.5653208b 1.16184942
MOIST 18.24A 10.5598018B 0.46603014
Gomez-Arriaran et al. 9

the pore structure of the picon concrete can be described by three different sizes ofpores: very narrow pores in the hygroscopic range, with radii of around 0.016–0.019mm; a second subsystem also with narrow pores but close to the frontierbetween hygroscopic and super-hygroscopic range, with radii of around 0.47–0.58mm; and a third subsystem in the super-hygroscopic or capillary range, withcoarse pores’ radii of around 17.4–45.7mm.
This ‘apparent’ porous structure of the picon concrete, where the picon aggre-gates are surrounded by the cement paste, is probably being affected by the ‘ink-bottle’ effect (Roels et al., 2001). This effect is caused by the connection betweennarrow and coarse pores and leads to an incorrect or ‘apparent’ resultant pore vol-ume distribution of the concrete, in which the coarse pores are underestimated andthe finest pores connecting to coarser pores are overestimated. To avoid this errorand obtain a ‘real’ pore volume distribution of the concrete, it was decided to testthe two constituents of the concrete: the cement paste and the picon grains, sepa-rately in the mercury intrusion test. This allows obtaining the corresponding waterretention curve and pore volume distribution for each constituent.
Figure 8 shows the water retention curve for the concrete and the concrete con-stituents, that is, the cement paste and the picon aggregate samples. Figure 9 showsthe pore volume distribution of the picon concrete as well as the constituent compo-nents deduced from the water retention curves.
From these retention curves of each constituent, the pore size distribution canbe deduced for cement paste as well as picon aggregates. Figure 9 shows the pore
Figure 6. Multimodal fit of the moisture retention curve of picon concrete.
10 Journal of Building Physics

Table 8. Multimodal fit parameters for picon concrete.
Model: multimodal w(pc; l, c, n) = wsat �Pki = 1
li 1 + (cipc)ni½ �
1ni�1
� �
Curve type Drying Sample 1 Drying Sample 2
Modality k 3 4wsat (kg/m3) 248.64 248.64wcap (kg/m3) 131.68 131.68Parameter c1 (kg/m3) 1.01E207 8.64E207Parameter c2 (kg/m3) 6.62E206 1.32E204Parameter c3 (kg/m3) 3.45E204 4.10E206Parameter c4 (kg/m3) 1.13E207Exponent n1 2.4564 1.3Exponent n2 1.5854 3.4Exponent n3 8.5538 4.9Exponent n4 6Weight factor l1 0.2623 0.6595Weight factor l2 0.6531 0.0590Weight factor l3 0.0845 0.2045Weight factor l4 0.0770S chi-square 84.00 101.78
Figure 7. Picon concrete pore volume distribution.
Gomez-Arriaran et al. 11

size distribution for both the cement paste samples and the picon aggregates. Thecement paste has three pore size subsystems, two of them are mainly situated in thehygroscopic range (pore radii 0.126 and 0.479mm) and a less relevant third subsys-tem in the capillary range (pore radii 6.918–10.000mm).
Regarding the picon aggregates, there are two coarse pore subsystems, both inthe capillary active range, with pore radii of around 45.708–46.773mm.
In Figure 9, the three pore subsystems of the cement paste (results for two sam-ples are drawn) and the two pore subsystems of the aggregates are clearly repre-sented. When comparing this pore distribution curves to the obtained ‘apparent’distribution for the picon concrete, in Figure 10, it is possible to observe the conse-quences of the ‘ink-bottle’ effect.
When testing the picon concrete by means of mercury intrusion, the resultant‘apparent’ pore distribution does not only overestimate the fine pores and underes-timate the coarser pores but also it ‘apparently’ indicates that narrow pores arefiner than the obtained from the cement paste mercury intrusion. This indicatesthat probably the pores in the cement paste are really finer in the concrete withaggregates than when the cement paste is cured without aggregates. It might bepossible that the aggregates influence the curing conditions of the cement paste,changing the pore volume distribution.
Considering the results, and as predicted by Krus et al. (1997), it seems possiblethat a contraction of capillary pores due to moisture-related swelling of the cementgel leads to this differences on pore structure.
Figure 8. Water retention curve for picon concrete, cement paste and picon aggregates.
12 Journal of Building Physics

Figure 9. Pore volume distribution for cement paste and picon aggregates.
Figure 10. Pore volume distribution for picon concrete, cement paste and picon aggregates.
Gomez-Arriaran et al. 13

Conclusion
The obtained results indicate that when measuring the pore structure of each com-ponent of the concrete (the paste and the aggregates) separately, different results onpore structure are obtained than those obtained when measuring the pore structureof the heterogeneous concrete.
A possible reason for this is that the curing conditions of the cement paste in theheterogeneous material are different than the curing conditions of the cement pastealone. Put otherwise, it seems that the presence of the aggregates influences the cur-ing conditions, which results in a different pore volume distribution for the cementpaste.
It can be concluded that when measuring the pore structure of a heterogeneousmaterial, careful analysis and interpretation of results is required, and measuringseparately the pore structure of each component of the concrete is necessary to cor-rectly determine the pore structure of the concrete.
Acknowledgement
The authors acknowledge the support provided by the Laboratory for the Quality Control inBuildings of the Basque Government.
Declaration of Conflicting Interests
The author(s) declared no potential conflicts of interest with respect to the research, author-ship and/or publication of this article.
Funding
The author(s) received no financial support for the research, authorship and/or publicationof this article.
References
Baroghel-Bouny V (2007) Water vapour sorption experiments on hardened cementitious
materials. Part II: essential tool for assessment of transport properties and for durability
prediction. Cement and Concrete Research 37(3): 438–454.
Bentz DP, Peltz MA, Duran-Herrera A, et al. (2011) Thermal properties of high-volume fly
ash mortars and concretes. Journal of Building Physics 34(3): 263–275.
Burch DM and Choi J (1997) MOIST: A PC Program for Predicting Heat and Moisture
Transfer in Building Envelopes (NIST Special Publication 917). Gaithersburg, MD:
National Institute of Standards and Technology, U.S. Department of Commerce.
Carmeliet J and Roels S (2002) Determination of the moisture capacity of porous building
materials. Journal of Building Physics 25: 209–237.
Chatterji S (2001) A discussion of the paper ‘Mercury porosimetry – an inappropriate
method for the measurement of pore size distributions in cement-based materials’ by S.
Diamond. Cement and Concrete Research 31: 1657–1658.
14 Journal of Building Physics

Cook RA and Hover KC (1999) Mercury porosimetry of hardened cement pastes. Cement
and Concrete Research 29: 933–943.
Diamond S (2000) Mercury porosimetry: an inappropriate method for the measurement of
pore size distributions in cement-based materials. Cement and Concrete Research 30:
1517–1525.
Durner W (1994) Hydraulic conductivity estimation for soils with heterogeneous pore
structure. Water Resources Research 30: 211–223.
Galle C (2001) Effect of drying on cement-based materials pore structure as identified by
mercury intrusion porosimetry: a comparative study between oven-, vacuum-, and freeze-
drying. Cement and Concrete Research 31: 1467–1477.
Gomez I, Sala JM and Millan JA (2007) Characterization of moisture transport properties
for lightened clay brick – comparison between two manufacturers. Journal of Building
Physics 31: 179–194.
Gomez I, Sala JM and Millan JA (2008) Moisture storage properties of multi-slotted light-
weight ceramic blocks: comparison between two manufacturers. Journal of Building
Physics 31: 225–242.
Krus M (1996) Moisture Transport and Storage Coefficients of Porous Mineral Building
Materials: Theoretical Principles and New Test Methods. Fraunhofer IRB Verlag.
Krus M, Hansen KK and Kunzel HM (1997) Porosity and liquid absorption of cement
paste. Materials and Structures 30: 394–398.
Kumaran MK (1996) Heat, air and moisture transport in envelope parts. Final Report, Task
3 Material Properties, IEA, ECBCS, Leuven.
Kunzel HM (1995) Simultaneous heat and moisture transport in building components, one-and
two-dimensional calculation using simple parameters. Report, IRB-Verlag Fraunhofer-
Institut fur Bauphysik, Stuttgart.
NBN B 24-213 (1976) Essais des materiaux de maconnerie. Absorption d’eau sous vide.
Brussels: Institu Belge de Normalisation (IBN).
Roels S and Carmeliet J (2006) Analysis of moisture flow in porous materials using
microfocus X-ray radiography. International Journal of Heat and Mass Transfer 49:
4762–4772.
Roels S, Carmeliet J and Hens H (2003) HAMSTAD, WP1: Final Report Moisture Transfer
Properties and Materials Characterization (HAMSTAD Document KUL2003-h18).
Leuven: KU Leuven.
Roels S, Carmeliet J, Hens H, et al. (2004) Interlaboratory comparison of hygric properties
of porous building materials. Journal of Building Physics 27(4): 307–325.
Roels S, Elsen J, Carmeliet J, et al. (2001) Characterisation of pore structure by combining
mercury porosimetry and micrography. Materials and Structures 34: 76–82.
Sanchez Fajardo VM, Torres ME and Moreno AJ (2015) Hydraulic and hygrothermal
properties of lightweight concrete blocks with basaltic lapilli as aggregate. Construction
and Building Materials 94: 398–407.
Song HW and Kwon SJ (2007) Permeability characteristics of carbonated concrete
considering capillary pore structure. Cement and Concrete Research 37(6): 909–915.
UNE-EN ISO 12571:2015 (2015) Hygrothermal performance of building materials and
products – determination of hygroscopic sorption properties (ISO 12571:2013).
Wild S (2001) A discussion of the paper ‘Mercury porosimetry – an inappropriate method
for the measurement of pore size distributions in cement-based materials’ by S. Diamond.
Cement and Concrete Research 31: 1653–1654.
Gomez-Arriaran et al. 15

Winslow DN and Cohen MD (1994) Percolation and pore structure in mortars and concrete.
Cement and Concrete Research 24(1): 25–37.
Winslow DN and Liu D (1990) The pore structure of paste in concrete. Cement and Concrete
Research 20(2): 227–235.
Wu M, Johannesson B and Geiker MR (2014) A study of the water vapor sorption
isotherms of hardened cement pastes: Possible pore structure changes at low relative
humidity and the impact of temperature on isotherms. Cement and Concrete Research 56:
97–105.
Appendix 1
Notation
A cross section (cm2)Aw water absorption coefficient (kg/m2 s1/2)ci fitting coefficient (–)fv (r) pore volume distribution (–)k modality of multimodal function (–)li weight factor of modal function (–)md sample mass in dry conditions (g)ni fitting coefficients (–)pc capillary pressure (Pa)r pore radius (m)V volume (cm3)wcap capillary water content (kg/m3)wfitting moisture content value obtained from fitting (kg/m3)wi measured moisture content (kg/m3)wsat saturation moisture content (kg/m3)w(pc) water retention curve value (kg/m3)
rb bulk density (kg/m3)rl liquid water density (kg/m3)rP matrix density (kg/m3)c0 open porosity (%)
16 Journal of Building Physics