Embed Size (px)
Citation preview
SH
JHa
Cb
a
ARRAA
KGPRcLS
1
tfta[fnsKN
h0
Journal of Chromatography A, 1542 (2018) 61–71
Contents lists available at ScienceDirect
Journal of Chromatography A
j o ur na l ho me page: www.elsev ier .com/ locate /chroma
tudy on the polymorphism of G-quadruplexes by reversed-phasePLC and LC–MS
un-qin Qiaoa, Zhao-ming Caoa, Chao Lianga, Hong-juan Chenb, Wei-juan Zhengb,ong-zhen Liana,∗
State Key Laboratory of Analytical Chemistry for Life Science, Collaborative Innovation Center of Chemistry for Life Sciences, School of Chemistry &hemical Engineering and Center of Materials Analysis, Nanjing University, 163 Xianlin Avenue, Nanjing 210023, ChinaState Key Laboratory of Pharmaceutical Biotechnology, School of Life Sciences, Nanjing University, 163 Xianlin Avenue, Nanjing 210023, China
r t i c l e i n f o
rticle history:eceived 24 November 2017eceived in revised form 3 February 2018ccepted 11 February 2018vailable online 12 February 2018
eywords:-quadruplexesolymorphismeversed-phase high performance liquidhromatographyiquid chromatography–mass spectrometrypectroscopic techniques
a b s t r a c t
Polymorphism is inherent for G-quadruplexes (G4s), and the different structural forms are importantfor the participation in different biological functions of telomeres. A lot of progress has been made inthe exploration of G4 polymorphism. However, quick separation and reliable assessment methods fordifferent conformations of G4 are still very few. In this work, the polymorphism of three sequencesd[(G3T)3G3], d[(G3C)3G3] and d[(G3T)4] annealed in six different solutions were investigated by meansof reversed-phase high performance liquid chromatography (RP-HPLC), liquid chromatography–massspectrometry (LC–MS), fluorescence spectroscopy, circular dichroism spectroscopy, together with native-polyacrylamide gel electrophoresis. Different G4 conformations of these three sequences can be separatedclearly by RP-HPLC, and further characterized by on-line LC–MS analysis. It is revealed that high-orderstructures other than intramolecular quadruplexes were favored for d[(G3T)3G3] and d[(G3C)3G3] underthe annealing conditions. However, flanking loop impeded d[(G3T)4] to form higher-order structures thandimer. In addition, the nature and concentration of cation, as well as the annealing solution component,all have decent influence on the stability and relative ratios of various G4 building blocks. Based on the
above findings, RP-HPLC and LC–MS combined with spectroscopic techniques can be used as a facile andpowerful tool for quick separation and identification of G4s in solutions, and for effective assessment ofDNA sequences and annealing environments on G4 polymorphism. The established protocol provides anovel strategy for evaluating G4 polymorphism, which will facilitate studies on quadruplex structuresand their biophysical properties.© 2018 Elsevier B.V. All rights reserved.
. Introduction
G-quadruplex (G4), formed by G-rich sequences, is a charac-eristic secondary structure of DNA. G4-forming sequences areound prevalent in human genome such as the telomeric DNA, andheir possible roles in biological regulation [1–6], potential ther-peutic drug targets [7–10] or as therapeutic agents themselves11,12] receive much attention currently. A G4 contains at leastour runs of two guanines and requires certain cations to coordi-ate to the O6 of four guanine residues forming the quartets. More
table and complex structures have been found in the presence of+ and NH4+ ions than those formed in the presence of Li+ anda+ ions [13]. However, polymorphism is inherent in G4 forma-
∗ Corresponding author.E-mail address: [email protected] (H.-z. Lian).
ttps://doi.org/10.1016/j.chroma.2018.02.021021-9673/© 2018 Elsevier B.V. All rights reserved.
tion for most G4-forming sequences [14,15]. Dailey et al. reportedthat there were at least eight distinguishable G4 species co-existingunder slow annealing conditions in K+-containing buffer for theanticancer aptamer AS1411 [14]. The relatively simple humantelomeric sequence d(GGGTTA)4 even can theoretically fold intomore than 200 intramolecular conformations [15]. In general, thepolymorphism of G4s is influenced by the length of chains, thetype of loop, the orientation of adjacent bases in nucleic acids, thenature and concentration of cations, and the concentration of DNAs[16–18]. Moreover, a slight change of DNA sequence may drasti-cally change the structural topologies of G4s [13]. It is noteworthythat different structural forms are important for the participationin different biological functions of telomeres [19].
However, G4 structures are far from being fully recognized.The structural and biophysical studies of G4 DNAs have been hin-dered by our inability to isolate and characterize the individualG4s that may occur in solution [15]. Separating and distinguish-

6 atog
ibdnr[lftfass(tttEtgsrctstHmrwwirmtrssbuwieatb
sfpcMnbb
2
2
(Gbg
2 J.-q. Qiao et al. / J. Chrom
ng different conformations are inevitable for the structural andiophysical studies of G4s. A number of techniques have beeneveloped for the characterization of G4s. High resolution tech-iques such as X-ray diffraction (XRD) and nuclear magneticesonance (NMR) can provide atomic-resolution structures of G4s20]. However, these two techniques both have their limitations:arge DNA consumption is usually needed; not every nucleic acidragment provides single crystals suitable for XRD, and the crys-allization agents (alcohols, spermine, salts) may influence the G4olding; 2D NMR requires that the DNA fragments must be shortnd only single dominating conformer, which cannot always beatisfied because of G4 structural polymorphism [21]. The spectro-copic techniques used for G4s analysis include circular dichroismCD), UV-melting, surface plasmon resonance (SPR), fluorescenceitration, etc. [22]. However, the resolution of these techniques isoo low to obtain more-refined analysis of potential G4 conforma-ions in the mixture of single strand and its quadruplex species.lectrophoresis is a useful tool in selective separation and purifica-ion of target molecules in bio-system, and native-polyacrylamideel electrophoresis (Native-PAGE) has been widely used in theeparation of G4s [23–27]. However, it is laborious and of lowesolution. Compared with Native-PAGE, high performance liquidhromatography (HPLC) is simple and effective, which can be usedo distinguish oligonucleotides with different length, base compo-ition, or even only different base sequence [28–30]. Nevertheless,he applications of HPLC for G4s study are still limited. The reportedPLC modes for G4s separation mainly include size-exclusion chro-atography (SEC) [14,15,31,32], affinity chromatography [33], and
eversed-phase HPLC (RP-HPLC) [34–38]. Up to now, SEC is the mostidespread HPLC mode used in the study of G4s polymorphism, inhich retention of solute is dominated by molecular size. RP-HPLC
s also in general use in the study of G4s polymorphism, in whichetention of analyte is dominated by hydrophobicity related witholecular structure. However, there is a significant restriction on
he direct identification of G4s conformations with these currentlyeported HPLC methods. As a highly sensitive analytical tool, masspectrometry (MS) has been widely used in the research of G4structure [13,39–42]. Since some low-order structure signals maye the fragments of high-order structures in gas phase, people aresually in doubt about G4 structures recognized by MS analysisith direct injection. Therefore, utilizing HPLC technique compat-
ble with MS detector for direct structure identification will be anffective and promising strategy for elucidating G4s polymorphismnd evaluating the proportions of different G4s conformations. Tohe best of our knowledge, there has been no report for G4s analysisy using on-line LC–MS up to now.
In this study, three oligonucleotides with different loopequences were selected for the study of G4s polymorphism in dif-erent K+ and NH4
+ solutions. A separation and characterizationrotocol for G4s was tried by using RP-HPLC-UV and LC–MS, inombination with fluorescence spectroscopy, CD and Native-PAGE.oreover, the influence factors on G4s polymorphism including the
ature and the concentration of cation, the component of annealinguffer solution, and the flanking loop of nucleic acid were discussedased on the separation and characterization protocol.
. Materials and methods
.1. Materials and reagents
Three oligonucleotides, 5′-GGGTGGGTGGGTGGG-3′
d[(G3T)3G3]), 5′-GGGCGGGCGGGCGGG-3′ (d[(G3C)3G3]) and 5′-GGTGGGTGGGTGGGT-3′ (d[(G3T)4]), were custom-synthesizedy Realgene Biological Technology Co., Ltd. (Nanjing, China). HPLCrade methanol (CH3OH) and acetonitrile (CH3CN) were purchased
r. A 1542 (2018) 61–71
from Honeywell (Ulsan, Korea), and HPLC grade trimethylamine(TEA) were obtained from Tedia Company Inc. (Ohio, USA). Thewater used was ultrapure water. All of other chemicals were ofanalytical reagent grade unless otherwise noted.
2.2. Sample preparation
Single strands of d[(G3T)3G3], d[(G3C)3G3] and d[(G3T)4] weredissolved in water individually, and then kept at 4 ◦C before use.DNA quadruplexes were prepared by heating the annealing solu-tions containing each DNA strand in 95 ◦C water bath for 5 min andcooling to room temperature naturally. The solutions were thenstored at 4 ◦C overnight. Six different annealing solutions listed asfollows were used in the experiment: I. 50 mM K2HPO4 + 50 mMKH2PO4 (pH 7.0); II. 50 mM K2HPO4 (pH 7.0); III. 10 mM Tris–HCl(pH 7.4), 1 mM EDTA, 100 mM KCl; IV. 10 mM Tris–HCl, 100 mMKCl (pH 7.4); V. 100 mM NH4OAc (pH 7.0); VI. 50 mM NH4OAc (pH7.0). The annealing solutions, single strand DNAs, and annealedDNAs were labeled separately. Numbers 1–6 represent the anneal-ing solutions I–VI, respectively. And letters a–c represent singlestrands d[(G3T)3G3], d[(G3C)3G3] and d[(G3T)4], respectively. Thecombination of a number and a letter represents an annealed DNA,such as “1a” represents d[(G3T)3G3] annealed under solution I.
2.3. Fluorescence spectroscopy and CD spectroscopy experiments
Fluorescence emission spectra were acquired on an F-7000Hitachi temperature control fluorescence spectrophotometer(Hitachi, Japan) at room temperature with scanning rate of1200 nm min−1. The excitation wavelength was kept at 260 nm, andthe emission wavelength was scanned from 280 nm to 480 nm. Theexcitation and emission slits were 10 nm and 5 nm, respectively. CDmeasurements were performed using a Chirascan digital circulardichroism spectropolarimeter (Applied Photophysics Ltd, England)using a 1-mm path length quartz cuvette. The sampling interval was0.5 s and slit width was 1 nm. The measurements were the averagesof three repetitions between 200 nm and 320 nm at room tempera-ture. The CD spectra of base-line and the buffers were recorded, andthey were subtracted from the spectra of DNA-containing solutions.All DNAs for fluorescence and CD measurements were all preparedat concentration of 10 �M.
2.4. Native-PAGE experiments
Native-PAGE experiments were carried out on a BioradPowerPacTM HV apparatus (Bio-Rad, USA). Each DNA samples of50 �M were prepared for Native-PAGE analysis, because the elec-trophoretic bands were unclear at low DNA concentration (data notshown). Electrophoresis was performed using 20% polyacrylamidegels, containing 50 mM KCl and 1 × TBE buffer (80 mM Tris-borate,2 mM EDTA, pH 8.3). Quadruplex-forming oligonucleotides ran in1 × TBE buffer supplementing with 50 mM KCl by using the fol-lowing parameters: temperature = 4 ◦C, voltage = 120 V, time = 3 h.Bands in the gels were visualized after silver staining. Oligo 15,oligo 30, oligo 45, and oligo 60 were used as markers, and theirsequences were 5′-GTC GTA ACT GAC CGT-3′, 5′-GCG TCA GTA TAGCCC AGT CTT GAG TGC CAT-3′, 5′-GTC GTA ACT GAC CGT GCG ACTGTA TAG CCC AGT CTT GAG TGC CAT-3′, and 5′-GTC GTA ACT GACCGT GTC GTA ACT GAC CGT GCG ACT GTA TAG CCC AGT CTT GAGTGC CAT-3′, respectively.
2.5. RP-HPLC-UV condition
RP-HPLC experiments were performed on a LC-20AD (Shi-madzu, Japan) with a variable wavelength UV–vis detector.
J.-q. Qiao et al. / J. Chromatogr. A 1542 (2018) 61–71 63
Fig. 1. The fluorescence spectra of d[(G3T)3G3] (A), d[(G3C)3G3] (B) and d[(G3T)4] (C). Samples: a–c are single strand DNAs; 1a–6a, 1b–6b and 1c–6c are d[(G3T)3G3],d[(G3C)3G3] and d[(G3T)4 annealed at six different annealing solutions: 1. 50 mM K2HPO4 + 50 mM KH2PO4 (pH 7.0); 2. 50 mM K2HPO4 (pH 7.0); 3. 10 mM Tris–HCl (pH 7.5),1 mM EDTA, 100 mM KCl; 4. 10 mM Tris–HCl, 100 mM KCl (pH 7.5); 5. 100 mM NH4OAc (pH 7.0); 6. 50 mM NH4OAc (pH 7.0).
(C). S
Smw2ma4v
2
JCuw02wto54w
3
3
3
ei
Fig. 2. The CD spectra of d[(G3T)3G3] (A), d[(G3C)3G3] (B) and d[(G3T)4]
eparation was accomplished on a Merck Chromolith®
Perfor-ance RP-18e column (100 × 2.0 mm i.d.). The column temperatureas maintained at 25 ◦C, and the detection wavelength was set at
60 nm. K2HPO4 (50 mM, pH 7.0) (A) and CH3OH (B) were used asobile phases for gradient elution at flow rate of 0.25 mL min−1,
nd the gradient was as follow: 0–25 min, 15%B–40%B; 25–38 min,0%B–40%B. The sample concentration was 10 �M with injectionolume of 5 �L.
.6. LC–MS condition
LC–MS experiments were carried out on a LC-30AD (Shimadzu,apan) – TripleTOFTM 4600 (AB SCIEX, USA). LC condition: A Merckhromolith
®Performance RP-18e column (100 × 2.0 mm i.d.) was
sed with the temperature maintained at 25 ◦C. The mobile phasesere NH4OAc (20 mM, pH 7.0) (A) and CH3OH (B) at flow rate of
.25 mL min−1 with the elution gradient: 0–25 min, 13% B–32% B;5–35 min, 32% B–32% B. The sample concentration was 100 �Mith injection volume of 5 �L. MS condition: Electrospray ioniza-
ion (ESI) source were used in negative mode with spray voltagef 4500 V. Full scan mode was used with mass scanning range of00–4000 Da. Ion source 1, ion source 2, and gas curtain were set at5 Psi, 45 Psi and 35 Psi, respectively. The atomization temperatureas 500 ◦C, and declustering potential was 80 V.
. Results and discussion
.1. Verification of G-quadruplexes
.1.1. Fluorescence spectroscopyQuadruplexes possess intrinsic fluorescence due to the
xtended conjugation of the four-base quartet. The increase ofntrinsic fluorescence can provide a way to monitor the folding
amples of a–c,1a–6a, 1b–6b and 1c–6c are the same with that in Fig. 1.
of G4s [43]. We collected fluorescence data on each sequence inwater, and in the presence of K+ ion (solutions 1–4) and NH4
+ ion(solutions 5 and 6), respectively (Fig. 1). Results showed that the flu-orescence emission intensity is very weak for single strand DNAswithout cations. With the addition of K+ or NH4
+, there is an obviousfluorescence enhancement for all the annealed DNAs, indicatingthat the G4 structures of d[(G3T)3G3], d[(G3C)3G3] and d[(G3T)4]have formed. It was found that the maximal emission wavelengthof G4s for the three DNA sequences are all around 380 nm, which isin agreement with the results reported by Kwok et al. [44]. Fluores-cence intensity of G4s formed in different annealing solutions wascompared. As a whole, the fluorescence intensity in K+ solution wasstronger than that in NH4
+ solution, indicating K+ is more preferredto stabilize G4s. In addition, d[(G3T)3G3] and d[(G3C)3G3] both havehigher fluorescence intensity in 100 mM K+ (annealing solutions 2and 4) than those in 150 mM K+ (annealing solution 1). Moreover,relative higher fluorescence intensity was observed for all the threesequences in 50 mM NH4
+ than those in 100 mM NH4+, indicating
that a higher concentration of cation is not always necessary to sta-bilize G4s. Different from d[(G3T)3G3] and d[(G3C)3G3], d[(G3T)4]has almost the same fluorescence intensity in different K+ solutions.All the above findings suggest that both buffer condition and loopsequence play important roles in G4s fluorescence [15,44].
3.1.2. CD spectroscopyCircular dichroism is remarkably sensitive to the conforma-
tional states of nucleic acids, and it has been used to study manydifferent DNA and RNA structures [22]. G4s exhibit distinct CDsignatures, depending on the arrangement and orientation of thestrands. Three major topologies of parallel, antiparallel and hybrid
G4 structures have been presented [33]. For the parallel G4s, there isa positive peak at around 260 nm and a minimum at around 240 nm,whereas for antiparallel G4s, there are two positive peaks at around245 nm and 295 nm, and a minimum at around 260 nm [44,45]. For
6 atogr. A 1542 (2018) 61–71
(2[uisdaiobapKwtHr
3
drwstGsowomoSpiaiF
tDms[e(otasvs
3
raparMse
Fig. 3. PAGE analysis of d[(G3T)3G3] (A), d[(G3C)3G3] (B) and d[(G3T)4] (C) annealedin K+ and NH + buffers. Oligo 15, oligo 30, oligo 45 and oligo 60 are markers. 1a–6a,
4 J.-q. Qiao et al. / J. Chrom
3 + 1) hybrid quadruplexes, there are two positive peaks at around60 nm and 290 nm coupled with a negative peak at around 240 nm45–47]. Therefore, CD spectroscopy is another technique widelysed to diagnose the existence of G4s, and it is very useful for mon-
toring conformational changes induced by different cations andolution conditions [48,49]. Fig. 2 shows the CD spectra of 10 �M[(G3T)3G3], d[(G3C)3G3] and d[(G3T)4] annealed in six differentnnealing solutions, as well as those single strand DNAs dissolvedn water. From CD spectra, it can be seen that there were an obvi-usly positive band at 263 nm and a relatively shallow negativeand at 242 nm, indicating that the G4 s of d[(G3T)3G3], d[(G3C)3G3]nd d[(G3T)4] formed in six different annealing solutions are allarallel topologies. The CD intensity at 263 nm also suggests that+ is more inclined to induce G4 formation than NH4
+. However,ith the same concentration of given cation, the variation of solu-
ion composition has no significant effect on the CD signals of G4s.ence, CD spectroscopy should be seen as a pioneering approach to
eveal the formation and possible topology of DNA arrangements.
.2. Native-PAGE separation
In order to gain additional insight into the G4s of d[(G3T)3G3],[(G3C)3G3] and d[(G3T)4], Native-PAGE was performed and theesults are shown in Fig. 3. Three predominant migrating bandsere observed for d[(G3T)3G3] and d[(G3C)3G3], respectively, in
ix annealing solutions (Fig. 3A and B), while there was an addi-ional fast migrating faint band for d[(G3C)3G3]. It is known that-rich oligomer moves slower than the sequence with identicalize but random base composition [50]. Therefore, the faint bandf 15-mer d[(G3C)3G3] might be intramolecular or bimolecular G4,hich migrated between 30-mer and 45-mer markers (oligo 30 and
ligo 45) (Fig. 3B). It is reasonable to assume that the second fast-igrating band in d[(G3C)3G3] corresponded to a bimolecular G4,
f which the migration speed was comparable to that of oligo 45.ome higher-order structures may have formed, since other tworedominant bands all migrated slower than that of oligo 45. Sim-
lar to d[(G3C)3G3], it is speculated that intermolecular G4s werelso induced in six annealing solutions for d[(G3T)3G3]. Surpris-ngly, there was only one major band for d[(G3T)4] as shown inig. 3C, which was tentatively deduced as a bimolecular G4.
The migration speed in Native-PAGE is influenced not only byhe molecular weight but also by the shape of analytes. For duplexNAs and oligonucleotides of moderate length, the size can be esti-ated by comparison with a ladder of known lengths, but this is not
uitable for small quadruplexes that have more compact structures51]. In this experiment, we found that different kinds of mark-rs with identical length even exhibited different migration speedsFig. S1). Therefore, it is difficult to acquire the true conformationsf quadruplexes, due to the lack of markers having similar structureo G4s. However, the migration bands of d[(G3T)3G3], d[(G3C)3G3]nd d[(G3T)4] in Native-PAGE analysis can reflect the number of G4species and their relative size for these three sequences, which isery helpful for the identification of G4 conformations in the furthertudy.
.3. RP-HPLC separation
RP-HPLC separation was performed in order to obtain the more-efined structural profile of individual G4s. Triethylammoniumcetate (TEAA, 100 mM, pH 7.0) – CH3CN, the classical mobilehase used for nucleic acids separation by ion-pair RP-HPLC, wasdopted at first to separate G4s. However, different from PAGE
esults, there was only one main peak in annealed DNA d[(G3T)3G3].oreover, the only peak was eluted at the same time with its corre-ponding single strand DNA, although different peak shapes werexhibited for annealed DNA and water dissolved DNA in isocratic
4
1b–6b and 1c–6c are d[(G3T)3G3], d[(G3C)3G3] and d[(G3T)4 annealed at the sixdifferent annealing solutions as in Fig. 1.
elution (Fig. S2). Similar retention phenomena were also observedfor d[(G3C)3G3] and d[(G3T)4]. It is likely that their G4 structureswere instable in TEAA – CH3CN mobile phase.
It is known that K+ and NH4+ ions are the critical factors in
maintaining the stability of G4s structure [39]. Therefore, it is nec-essary to introduce K+, the relatively stronger stabilizer for G4s, intomobile phase. First, K2HPO4 (50 mM, pH 7.0 adjusted by H3PO4) –CH3OH was chosen as the mobile phase in order to keep a relativehigh K+ concentration. Methanol in mobile phase mainly influencesthe separation resolution of G4s (data not shown). Similar to othernucleic acids, no satisfactory separation result was achieved forG4s in isocratic elution. Relatively good separation was obtainedin an optimized gradient elution for all the annealed DNAs (Fig. 4).
In Fig. 4A and B, similar peak distributions of DNAs d[(G3T)3G3]and d[(G3C)3G3] appeared under the same annealing conditions.Take d[(G3T)3G3] as example, seven common peaks (peaks 1–7) allemerged for the DNA under six different annealing solutions. There
J.-q. Qiao et al. / J. Chromatogr. A 1542 (2018) 61–71 65
Fig. 4. The chromatograms of d[(G3T)3G3] (A), d[(G3C)3G3] (B) and d[(G3T)4] (C) under K2HPO4 (50 mM, pH 7.0)–CH3OH elution. Gradient elution: 0–25 min, 15%–40% CH3OH;25–38 min, 40% CH3OH. Samples of a–c are single strands of d[(G3T)3G3], d[(G3C)3G3] and d[(G3T)4], respectively; samples of 1a–6a, 1b–6b and 1c–6c are d[(G3T)3G3],d[(G3C)3G3] and d[(G3T)4] annealed at the six different annealing solutions as in Fig. 1.
Table 1The relative proportions of peaks 1–5 in annealed d[(G3T)3G3] and d[(G3C)3G3].
Sequences Samples Peak 1 (%) Peak 2 (%) Peak 3 (%) Peak 4 (%) Peak 5 (%)
d[(G3T)3G3] 1a 1.85 1.28 42.22 43.96 10.692a 1.70 1.31 44.79 42.95 9.253a 2.25 1.03 34.36 47.80 14.564a 2.29 1.16 32.80 48.76 14.995a 6.61 11.60 4.56 37.23 40.006a 3.26 5.16 8.10 47.09 36.39
d[(G3C)3G3] 1b 2.88 0.48 31.08 48.86 16.702b 2.10 0.25 46.82 40.81 9.323b 2.56 0.36 39.43 45.29 12.36
7
02
9
wwnOsiomcwitdAf
spoT(ts
4b 2.55 0.35b 9.67 16.6b 6.13 6.1
ere also three major peaks (peaks 3–5), which were in accordanceith the results in PAGE. Notably, peak 4 was always the promi-ent one no matter in K+- or NH4
+-containing annealing solution.n the other hand, peak 2 was prominent in NH4
+ ion annealingolution compared with that in K+ ion annealing solution, imply-ng that the presence of NH4
+ ion favors to form DNA structuref peak 2. It is shown that the relative proportions for the threeain peaks were somewhat different even at same annealing K+
oncentration (2a–4a) (Table 1), indicating the buffer componentsith given cation also have an influence on the G4s conformation
nclination. Similar with PAGE, there was only one main peak for allhe annealed d[(G3T)4] (Fig. 4C), suggesting that the G4 species for[(G3T)4] are really less than that of d[(G3T)3G3] and d[(G3C)3G3].dditionally, K+ and NH4
+ ions have no obvious disparity in theormation of G4 for d[(G3T)4].
However, DNAs d[(G3T)3G3], d[(G3C)3G3] and d[(G3T)4] dis-olved in water all showed two main peaks under K2HPO4 (50 mM,H 7.0) – CH3OH mobile phase. We speculate that at least onef them was G4 formed spontaneously in high-salt mobile phase.o verify this speculation, low concentrations of K2HPO4 buffer
20–40 mM, pH 7.0) were used in mobile phases, and the reten-ion behavior of these three sequences were compared. It can beeen that the retention times for all peaks in d[(G3T)3G3] became37.92 46.40 12.766.82 35.69 31.7912.48 46.12 29.08
slightly short with the decreased K2HPO4 concentration (Fig. S3).Besides, in water dissolved d[(G3T)3G3], the first main peak (peak3) became smaller, and the second main peak (peak 1) becamelarger with the decreased K2HPO4 concentration (Fig. S3A). Weknow some G4s can form spontaneously in solutions containingcations. Therefore, peak 1 may correspond to single strand DNA orone kind of G4 stable in low concentration of cation, and peak 3should be one G4 stable in high concentration of cation. However,for annealed d[(G3T)3G3], the intensity and the resolution of majorpeaks declined with the decreased ion strength in mobile phases,no matter for K+ or NH4
+ annealed samples (Fig. S3B and C). Gen-erally speaking, the intensity of peak 4 and peak 5 decreased morethan that of peak 3, implying the G4s of peak 4 and peak 5 are morestable in high concentration cation. Furthermore, peak 6 and peak7 even could not be detected in 20 mM K2HPO4, confirming that K+
concentration plays an important role in stabilizing G4s structure.Similar phenomena were observed for d[(G3C)3G3] and d[(G3T)4](Figs. S4 and S5). Consequently, in order to realize a good separa-tion of annealed DNA and have a clear overview of different kindsof G4s, the concentration of K2HPO4 (pH 7.0) in mobile phase was
finally selected as 50 mM, of which the cation concentration is closeto that in most annealing buffers we used.
66 J.-q. Qiao et al. / J. Chromatogr. A 1542 (2018) 61–71
spect
aaHtmtLu7
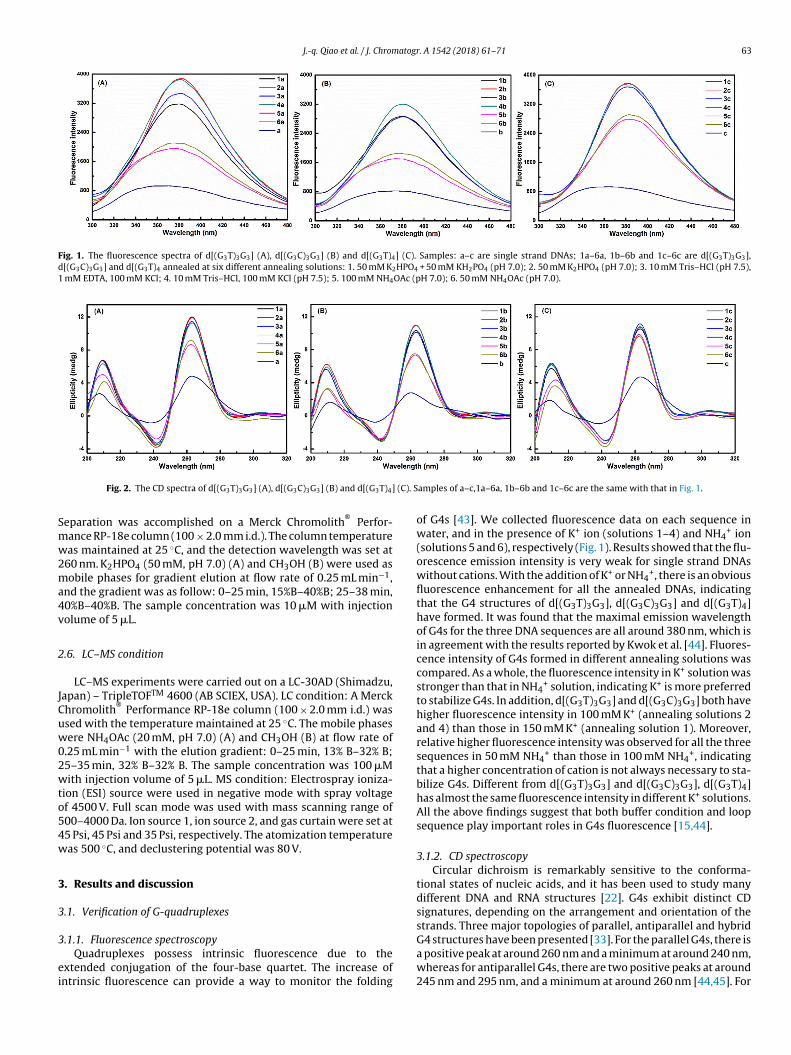
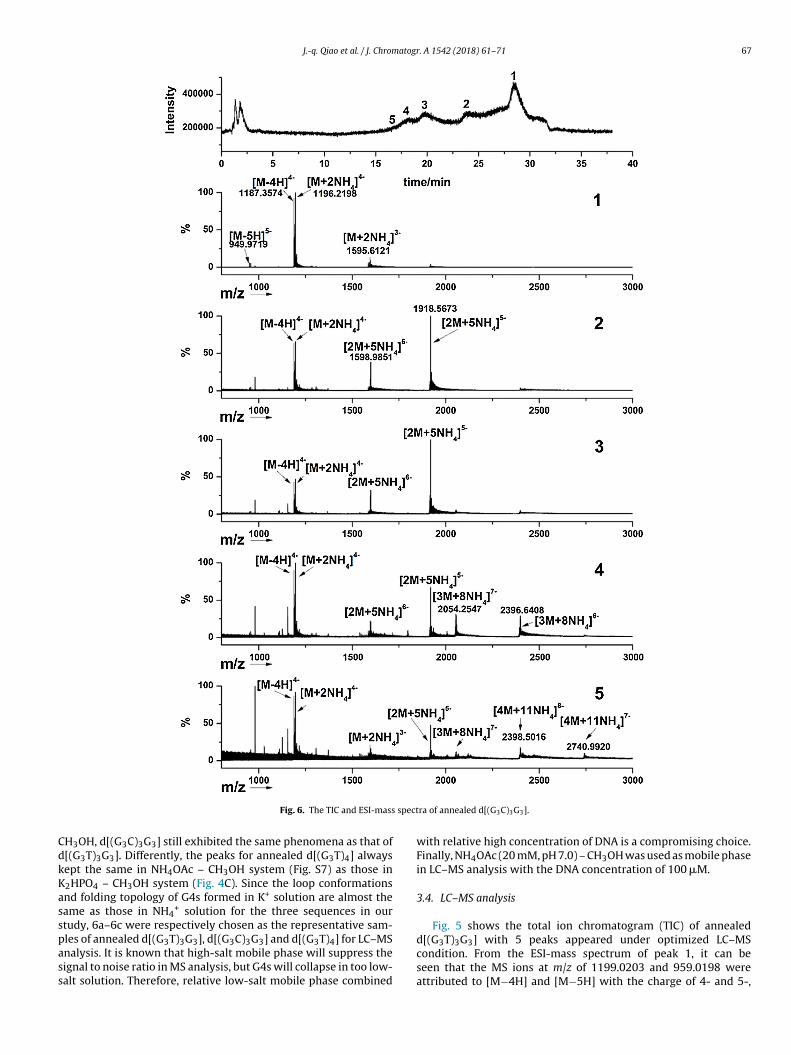
Fig. 5. The TIC and ESI-mass
Although the different forms of G4s for d[(G3T)3G3], d[(G3C)3G3]nd d[(G3T)4] can be separated by RP-HPLC with K2HPO4-CH3OHs mobile phase, their conformations could not be recognized yet.ence, LC–MS analysis was employed in order to obtain the struc-
ural features of these G4s. Since NH4+ is another key ion used to
aintain structure of G4s, volatile NH4OAc buffer was introducedo mobile phase in order to develop a method suitable for following
C–MS analysis. The retention behaviors of G4s were investigatednder optimized gradient elution of NH4OAc (10, 20 and 50 mM, pH.0, adjusted by NH3·H2O) – CH3OH. Results showed that the majorra of annealed d[(G3T)3G3].
peaks of d[(G3T)3G3] annealed in K+ solution (1a–4a) changed alot even in 50 mM NH4OAc – CH3OH mobile phase (Fig. S6) com-pared with those in K2HPO4 – CH3OH mobile phase (Fig. 4A).That is, peak 4 and peak 5 disappeared, and the height of peak 3increased. It is suspected that the G4s induced by K+ ion, displayedas peak 4 and peak 5, are unstable in NH4OAc – CH3OH mobilephase, and there may be a rapid conformational transformation
between peaks 3–5. However, 5a and 6a annealed in NH4+ solutionhad the same peak distribution in NH4OAc – CH3OH mobile phase(Fig. S6) as that in K2HPO4 – CH3OH mobile phase. In NH4OAc –
J.-q. Qiao et al. / J. Chromatogr. A 1542 (2018) 61–71 67
spect
CdkKasspass
Fig. 6. The TIC and ESI-mass
H3OH, d[(G3C)3G3] still exhibited the same phenomena as that of[(G3T)3G3]. Differently, the peaks for annealed d[(G3T)4] alwaysept the same in NH4OAc – CH3OH system (Fig. S7) as those in2HPO4 – CH3OH system (Fig. 4C). Since the loop conformationsnd folding topology of G4s formed in K+ solution are almost theame as those in NH4
+ solution for the three sequences in ourtudy, 6a–6c were respectively chosen as the representative sam-
les of annealed d[(G3T)3G3], d[(G3C)3G3] and d[(G3T)4] for LC–MSnalysis. It is known that high-salt mobile phase will suppress theignal to noise ratio in MS analysis, but G4s will collapse in too low-alt solution. Therefore, relative low-salt mobile phase combinedra of annealed d[(G3C)3G3].
with relative high concentration of DNA is a compromising choice.Finally, NH4OAc (20 mM, pH 7.0) – CH3OH was used as mobile phasein LC–MS analysis with the DNA concentration of 100 �M.
3.4. LC–MS analysis
Fig. 5 shows the total ion chromatogram (TIC) of annealed
d[(G3T)3G3] with 5 peaks appeared under optimized LC–MScondition. From the ESI-mass spectrum of peak 1, it can beseen that the MS ions at m/z of 1199.0203 and 959.0198 wereattributed to [M−4H] and [M−5H] with the charge of 4- and 5-,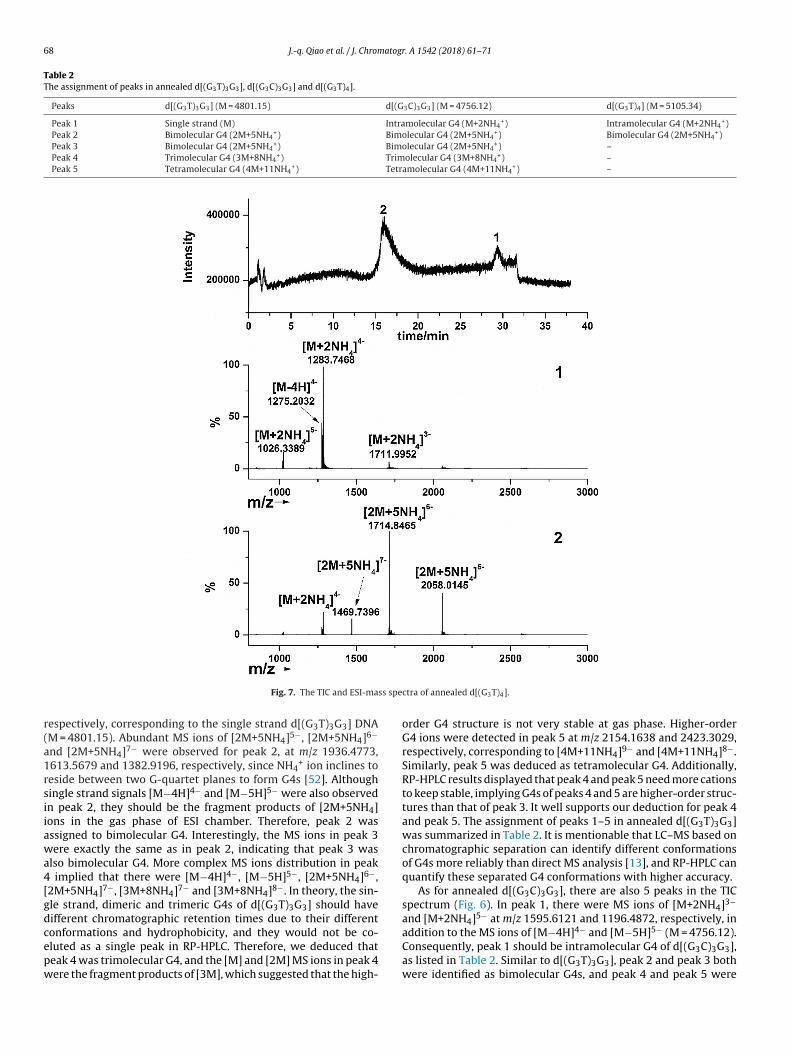
68 J.-q. Qiao et al. / J. Chromatogr. A 1542 (2018) 61–71
Table 2The assignment of peaks in annealed d[(G3T)3G3], d[(G3C)3G3] and d[(G3T)4].
Peaks d[(G3T)3G3] (M = 4801.15) d[(G3C)3G3] (M = 4756.12) d[(G3T)4] (M = 5105.34)
Peak 1 Single strand (M) Intramolecular G4 (M+2NH4+) Intramolecular G4 (M+2NH4
+)Peak 2 Bimolecular G4 (2M+5NH4
+) Bimolecular G4 (2M+5NH4+) Bimolecular G4 (2M+5NH4
+)Peak 3 Bimolecular G4 (2M+5NH4
+) Bimolecular G4 (2M+5NH4+) –
Peak 4 Trimolecular G4 (3M+8NH4+) Trimolecular G4 (3M+8NH4
+) –Peak 5 Tetramolecular G4 (4M+11NH4
+) Tetramolecular G4 (4M+11NH4+) –
ss spe
r(a1rsiiawa4[gdcepw
Fig. 7. The TIC and ESI-ma
espectively, corresponding to the single strand d[(G3T)3G3] DNAM = 4801.15). Abundant MS ions of [2M+5NH4]5−, [2M+5NH4]6−
nd [2M+5NH4]7− were observed for peak 2, at m/z 1936.4773,613.5679 and 1382.9196, respectively, since NH4
+ ion inclines toeside between two G-quartet planes to form G4s [52]. Althoughingle strand signals [M−4H]4− and [M−5H]5− were also observedn peak 2, they should be the fragment products of [2M+5NH4]ons in the gas phase of ESI chamber. Therefore, peak 2 wasssigned to bimolecular G4. Interestingly, the MS ions in peak 3ere exactly the same as in peak 2, indicating that peak 3 was
lso bimolecular G4. More complex MS ions distribution in peak implied that there were [M−4H]4−, [M−5H]5−, [2M+5NH4]6−,2M+5NH4]7−, [3M+8NH4]7− and [3M+8NH4]8−. In theory, the sin-le strand, dimeric and trimeric G4s of d[(G3T)3G3] should haveifferent chromatographic retention times due to their different
onformations and hydrophobicity, and they would not be co-luted as a single peak in RP-HPLC. Therefore, we deduced thateak 4 was trimolecular G4, and the [M] and [2M] MS ions in peak 4ere the fragment products of [3M], which suggested that the high-ctra of annealed d[(G3T)4].
order G4 structure is not very stable at gas phase. Higher-orderG4 ions were detected in peak 5 at m/z 2154.1638 and 2423.3029,respectively, corresponding to [4M+11NH4]9− and [4M+11NH4]8−.Similarly, peak 5 was deduced as tetramolecular G4. Additionally,RP-HPLC results displayed that peak 4 and peak 5 need more cationsto keep stable, implying G4s of peaks 4 and 5 are higher-order struc-tures than that of peak 3. It well supports our deduction for peak 4and peak 5. The assignment of peaks 1–5 in annealed d[(G3T)3G3]was summarized in Table 2. It is mentionable that LC–MS based onchromatographic separation can identify different conformationsof G4s more reliably than direct MS analysis [13], and RP-HPLC canquantify these separated G4 conformations with higher accuracy.
As for annealed d[(G3C)3G3], there are also 5 peaks in the TICspectrum (Fig. 6). In peak 1, there were MS ions of [M+2NH4]3−
and [M+2NH4]5− at m/z 1595.6121 and 1196.4872, respectively, in4− 5−
addition to the MS ions of [M−4H] and [M−5H] (M = 4756.12).Consequently, peak 1 should be intramolecular G4 of d[(G3C)3G3],as listed in Table 2. Similar to d[(G3T)3G3], peak 2 and peak 3 bothwere identified as bimolecular G4s, and peak 4 and peak 5 were

J.-q. Qiao et al. / J. Chromatogr. A 1542 (2018) 61–71 69
ctures
tiubcc
1a1tpi[t
3d
atlhersrsbaafbd
Fig. 8. The main possible G4 stru
rimolecular and tetramolecular G4s, respectively. LC–MS results,n combination with RP-HPLC-UV, suggested that the intramolec-lar G4 (peak 1) and bimolecular G4 (peak 3) of d[(G3C)3G3]oth spontaneously form in salt-containing mobile phase, and theompetition exists between these two G4 species when salt con-entration changes in the mobile phase.
In Fig. 7 for annealed d[(G3T)4], it can be seen that peak gave main MS ions of [M−4H]4−, [M+2NH4]3−, [M+2NH4]4−
nd [M+2NH4]5−, respectively, at m/z of 1275.2032, 1026.3389,283.7468, and 1711.9952 (M = 5105.34). Therefore, it is valido deduce peak 1 was the intramolecular G4. Peak 2 showed arominent MS ion of [2M+5NH4]6− at m/z 1714.8465, which was
dentified as the bimolecular G4. The MS ions of [2M+5NH4]7− and2M+5NH4]5−, respectively, at m/z 1469.7396 and 2058.0145 fur-her confirmed that peak 2 was bimolecular G4 of d[(G3T)4].
.5. The possible conformations of G4s for d[(G3T)3G3],[(G3C)3G3] and d[(G3T)4]
Very importantly, multimeric G4s are more preferred fornnealed d[(G3T)3G3] and d[(G3C)3G3] in our experiment ratherhan the only intramolecular G4s induced by K+ in LiCacody-ate solution, as reported in previous reference [44]. Additionally,igh-order structures incline to form in the annealing systemven at DNA concentration as low as 5 �M (Fig. S8). RP-HPLCesults indicated that increasing the concentration of cation cantabilize the high-order structures (Figs. S3–S5). Interestingly, aetention order of tetramer < trimer < dimer < monomer (or singletrand) was present in this study, similar to that in SEC. This isecause n-octanol/water partition coefficients (logP) of guanyliccid (GMP), thymidylic acid (TMP) and cytidylic acid (CMP) are
ll negative, corresponding to −1.44, −1.60 and −2.17 (calculatedrom ACD/Labs software V11.02), respectively, and the hydropho-icity will decrease gradually with the increase of polymerizationegree of DNA. Thus, the retention order for the G4s in RP-HPLC isof d[(G3T)3G3] and d[(G3C)3G3].
mainly related to their hydrophobicity. It is known that a high-order structure, G-wire, can form only under the conditions inwhich all strands are oriented in the parallel, and G-wire is use-ful for its well-controlled and regulated alignment of numerousDNA strands with G-quartets [53]. Therefore, we deduce the G4sof d[(G3T)3G3] and d[(G3C)3G3] in this present study may adopt G-wire structure. Two models for G-wire have been reported: one isthe stacked monomer structure, and the other is the inter-lockedstructure [53,54]. From the ESI–MS results, it can be seen that,for d[(G3T)3G3] and d[(G3C)3G3], tetramer easily dissociated totrimer, dimer and monomer or single strand in gas phase, andtrimer dissociated to dimer and monomer (or single strand), andthe like. Therefore, the formation of high-order G4s for d[(G3T)3G3]and d[(G3C)3G3] prefers to start from the formation of parallelintramolecular structure, then assembles into dimer, trimer andtetramer. During the association process, the relative orientationof the strands does not change (Fig. 8, lower right). We deducethat peaks 6 and 7 in RP-HPLC chromatograms (Fig. 4A and B) areassigned to the G4s with higher-order structures than tetramer.For d[(G3T)3G3], the monomeric G4 may be just an intermediatewhich can rapidly transform to high-order structures, so its sig-nal was not detected in LC–MS. No higher-order G4 than dimer inannealed d[(G3T)4] should be attributed to the additional base “T”in 3′-end, for the presence of flanking base in G-rich sequencesoften inhibits the formation of higher-order structures [52,54].The parallel dimer of d[(G3T)4] should only take an inter-lockeddimer (Fig. 9), a more stable structure than two stacked monomers[55,56]. From RP-HPLC-UV and LC–MS analyses, we know that therewere both two dimers with different retention times in d[(G3T)3G3]and d[(G3C)3G3]. The tetramer (peak 5) and the trimer (peak 4)formed in K+-containing annealing solution could easily transform
to the dimer (peak 3) in NH4+ mobile phase (Fig. S6), indicating peak3 was relatively stable. Moreover, the dimer (peak 3) was inclined togenerate in high-salt solution without annealing process, the samephenomenon as the dimer in d[(G3T)4]. Based on the above, we

70 J.-q. Qiao et al. / J. Chromatogr. A 1542 (2018) 61–71
le G4
dwrprRuh
4
fNaimmtIdRthhbMaIttTpes
A
d
[[
[
Fig. 9. The main possib
educe peak 3 should be interlocked dimer (Fig. 8, upper right), inhich K+ could not easily leave G4 into mobile phase for the steric
estraints of diagonal-type loops [57]. In addition, the retention ofeak 2 was stronger than that of peak 3, indicating peak 2 had aelative stronger interaction with C18 decorated on the surface ofP-HPLC stationary phase. Therefore, peak 2 should be bimolec-lar G4 with stacked monomer structures, which exposed moreydrophobic sites to the stationary phase.
. Conclusions
In this work, RP-HPLC method was successfully establishedor the separation of potential G4s in three different sequences.otably, LC–MS was used to analyze G4s for the first time, providing
simple and easy strategy to acquire the structural information ofndividual G4s without pre-purification. Similar parallel G4 confor-
ations were observed for d[(G3T)3G3] and d[(G3C)3G3]. The mainultimers detected for these two sequences included tetramer,
rimer and dimer, among which trimeric G4 was most prominent.nterestingly, dimeric G4 was the main conformation for annealed[(G3T)]4, due to one “T” base in the 3′-end. The retention of G4s inP-HPLC presented an elution order similar to that in SEC, that is,etramer < trimer < dimer < monomer, attributed to their decreasedydrophobicity. Experimental results indicated that formation ofigh-order G4s are influenced not only by base sequence, but alsoy the nature and concentration of cation in annealing matrixes.oreover, the components of annealing matrixes with given cation
lso have some influence on the proportions of different G4s.n conclusion, RP-HPLC and LC–MS, combined with spectroscopicechniques are proved to be an efficient and powerful strategy forhe separation and identification of G-quadruplexes in solutions.he established protocol can be used to assess the G-quadruplexesolymorphism for different DNA sequences and different annealingnvironment, which will facilitate the elucidation on G-quadruplextructures.
cknowledgments
This work was supported by the National Natural Scinece Foun-ation of China (21275069, 21577057 and 91643105), the Natural
[
structure of d[(G3T)4].
Science Foundation of Jiangsu Province (BK20171335), and theAnalysis & Test Fund of Nanjing University.
Appendix A. Supplementary data
Supplementary data associated with this article can be found,in the online version, at https://doi.org/10.1016/j.chroma.2018.02.021.
References
[1] S. Cogoi, L.E. Xodo, G-quadruplex formation within the promoter of the KRASproto-oncogene and its effect on transcription, Nucleic Acids Res. 34 (2006)2536–2549.
[2] X.D. Wang, T.M. Ou, Y.J. Lu, Z. Li, Z. Xu, C. Xi, J.H. Tan, S.L. Huang, L.K. An, D. Li,L.Q. Gu, Z.S. Huang, Turning off transcription of the bcl-2 gene by stabilizingthe bcl-2 promoter quadruplex with quindoline derivatives, J. Med. Chem. 53(2010) 4390–4398.
[3] Z.A.E. Waller, S.A. Sewitz, S.T.D. Hsu, S. Balasubramanian, A small moleculethat disrupts G-quadruplex DNA structure and enhances gene expression, J.Am. Chem. Soc. 131 (2009) 12628–12633.
[4] A. Siddiqui-Jain, C.L. Grand, D.J. Bearss, L.H. Hurley, Direct evidence for aG-quadruplex in a promoter region and its targeting with a small molecule torepress c-MYC transcription, Proc. Natl. Acad. Sci. U. S. A. 99 (2002)11593–11598.
[5] S. Kumari, A. Bugaut, J.L. Huppert, S. Balasubramanian, An RNA G-quadruplexin the 5’ UTR of the NRAS proto-oncogene modulates translation, Nat. Chem.Biol. 3 (2007) 218–221.
[6] K. Paeschke, T. Simonsson, J. Postberg, D. Rhodes, H.J. Lipps, Telomereend-binding proteins control the formation of G-quadruplex DNA structuresin vivo, Nat. Struct. Mol. Biol. 12 (2005) 847–854.
[7] M. Read, R.J. Harrison, B. Romagnoli, F.A. Tanious, S.H. Gowan, A.P. Reszka,W.D. Wilson, L.R. Kelland, S. Neidle, Structure-based design of selective andpotent G quadruplex-mediated telomerase inhibitors, Proc. Natl. Acad. Sci. U.S. A. 98 (2001) 4844–4849.
[8] S. Neidle, M.A. Read, G-quadruplexes as therapeutic targets, Biopolymers 56(2001) 195–208.
[9] A.M. Burger, F. Dai, C.M. Schultes, A.P. Reszka, M.J. Moore, J.A. Double, S.Neidle, The G-quadruplex-interactive molecule BRACO-19 inhibits tumorgrowth, consistent with telomere targeting and interference with telomerasefunction, Cancer Res. 65 (2005) 1489–1496.
10] J.L. Huppert, Hunting G-quadruplexes, Biochimie 90 (2008) 1140–1148.11] P.J. Bates, J.B. Kahlon, S.D. Thomas, J.O. Trent, D.M. Miller, Antiproliferative
activity of G-rich oligonucleotides correlates with protein binding, J. Biol.Chem. 274 (1999) 26369–26377.
12] Y. Teng, A.C. Girvan, L.K. Casson, W.M. Pierce, M. Qian, S.D. Thomas, P.J. Bates,
AS1411 alters the localization of a complex containing protein argininemethyltransferase 5 and nucleolin, Cancer Res. 67 (2007) 10491–10500.13] X.H. Guo, S.Y. Liu, Z. Yu, Bimolecular quadruplexes and their transitions tohigher-order molecular structures detected by ESI-FTICR-MS, J. Am. Soc. MassSpectrom. 18 (2007) 1467–1476.

atogr
[
[
[
[
[
[
[
[
[
[
[
[
[
[
[
[
[
[
[
[
[
[
[
[
[
[
[
[
[
[
[
[
[
[
[
[
[
[
[
[
[
[
[interlocked dimeric parallel-stranded DNA quadruplex: a potent inhibitor ofHIV-1 integrase, PNAS 102 (2005) 634–639.
[57] J.P. Primozsket, Not all G-quadruplexes exhibit ion-channel-like properties:
J.-q. Qiao et al. / J. Chrom
14] M.M. Dailey, M.C. Miller, P.J. Bates, A.N. Lane, J.O. Trent, Resolution andcharacterization of the structural polymorphism of a singlequadruplex-forming sequence, Nucleic Acids Res. 14 (2010) 4877–4888.
15] M.C. Miller, H.T. Le, W.L. Dean, P.A. Holt, J.B. Chaires, J.O. Trent, Polymorphismand resolution of oncogene promoter quadruplex-forming sequences, Org.Biomol. Chem. 9 (2011) 7633–7637.
16] S.M. Kewrin, G-quadruplex DNA as a target for drug design, Curr. Pharm. Des.6 (2000) 441–478.
17] S. Burge, G.N. Parkinson, P. Hazel, A.K. Todd, S. Neidle, Quadruplex DNA:sequence, topology and structure, Nucleic Acids Res. 34 (2006) 5402–5415.
18] P. Hazel, J. Huppert, S. Balasubramanian, S. Neidle, Loop-length-dependentfolding of G-quadruplexes, J. Am. Chem. Soc. 126 (2004) 16405–16415.
19] W.H. Zhou, N.J. Brand, L.M. Ying, G-quadruplexes–novel mediators of genefunction, J. Cardiovasc. Trans. Res. 4 (2011) 256–270.
20] N.Q. Do, K.W. Lim, M.H. Teo, B. Heddi, A.T. Phan, Stacking of G-quadruplexes:NMR structure of a G-rich oligonucleotide with potential anti-HIV andanticancer activity, Nucleic Acids Res. 39 (2011) 9448–9457.
21] M. Vorlícková, I. Kejnovská, J. Sagi, D. Renciuk, K. Bednárová, J. Motlová, J.Kypr, Circular dichroism and guanine quadruplexes, Methods 57 (2012)64–75.
22] G. Yuan, Q. Zhang, J. Zhou, H.H. Li, Mass spectrometry of G-quadruplex DNA:formation, recognition, property, conversion, and conformation, MassSpectrom. Rev. 30 (2011) 1121–1142.
23] M. Schoonover, S.M. Kerwin, G-quadruplex DNA cleavage preference andidentification of a perylene diimide G-quadruplex photocleavage agent usinga rapid fluorescent assay, Bioorg. Med. Chem. 20 (2012) 6904–6918.
24] Y. Xu, H. Sato, Y. Sannohe, K.I. Shinohara, H. Sugiyama, Stable lariat formationbased on a G-quadruplex scaffold, J. Am. Chem. Soc. 130 (2008) 16470–16471.
25] M. Nambiar, G. Goldsmith, B.T. Moorthy, M.R. Lieber, M.V. Joshi, B. Choudhary,R.V. Hosur, S.C. Raghavan, Formation of a G-quadruplex at the BCL2 majorbreakpoint region of the t(14;18) translocation in follicular lymphoma,Nucleic Acids Res. 39 (2011) 936–948.
26] Y.N. Hong, M. Häubler, J.W.Y. Lam, Z. Li, K.K. Sin, Y.Q. Dong, H. Tong, J.Z. Liu,A.J. Qin, R. Renneberg, B.Z. Tang, Label-free fluorescent probing ofG-quadruplex formation and real-time monitoring of DNA folding by aquaternized tetraphenylethene salt with aggregation-induced emissioncharacteristics, Chem. Eur. J. 14 (2008) 6428–6437.
27] Y. Sannohe, K. Sato, A. Matsugami, K.I. Shinohara, T. Mashimo, M. Katahira, H.Sugiyama, The orientation of the ends of G-quadruplex structuresinvestigated using end-extended oligonucleotides, Bioorg. Med. Chem. 17(2009) 1870–1875.
28] M. Sturm, S. Quinten, C.G. Huber, O. Kohlbacher, A statistical learningapproach to the modeling of chromatographic retention of oligonucleotidesincorporating sequence and secondary structure data, Nucleic Acids Res. 35(2007) 4195–4202.
29] M. Gilar, K.J. Fountain, Y. Budman, U.D. Neue, K.R. Yardley, P.D. Rainville, R.J.Russell, J.C. Gebler, Ion-pair reversed-phase high-performance liquidchromatography analysis of oligonucleotides: retention prediction, J.Chromatogr. A 958 (2002) 167–182.
30] D.P. Lee, J.H. Kindsvater, Porous polymeric packing for high-performanceliquid chromatographic separation of nucleosides and corresponding bases,Anal. Chem. 52 (1980) 2425–2428.
31] S. Benabou, R. Eritja, R. Gargallo, Variable-temperature size exclusionchromatography for the study of the structural changes in G-quadruplex,ISRN Biochem. 2013 (2013) 1–7.
32] E. Largy, J.L. Mergny, Shape matters: size-exclusion HPLC for the study ofnucleic acid structural polymorphism, Nucleic Acids Res. 42 (2014) 1–15.
33] T.J. Chang, X.J. Liu, X.H. Cheng, C. Qi, H.C. Mei, D.H. Shangguan, Selectiveisolation of G-quadruplexes by affinity chromatography, J. Chromatogr. A1246 (2012) 62–68.
34] G. Bai, X.L. Cao, H. Zhang, J.F. Xiang, H. Ren, L. Tan, Y.L. Tang, Direct screeningof G-quadruplex ligands from Kalopanax septemlobus (Thunb.) Koidz extractby high performance liquid chromatography, J. Chromatogr. A 1218 (2011)
6433–6438.35] D. Musumeci, G. Oliviero, G.N. Roviello, E.M. Bucci, G. Piccialli,G-quadruplex-forming oligonucleotide conjugated to magneticnanoparticles: synthesis, characterization, and enzymatic stability assays,Bioconj. Chem. 23 (2012) 382–391.
. A 1542 (2018) 61–71 71
36] M.C. Miller, C.J. Ohrenberg, A. Kuttan, J.O. Trent, Separation of quadruplexpolymorphism in DNA sequences by reversed-phase chromatography, Curr.Protoc. Nucleic Acid Chem. 61 (2015) 17.7.1–17.7.18.
37] M.H. Wu, Q. Wang, Study on the inhibition of different concentrations ofBMVC on Exonuclease I by high performance liquid chromatography, J. Anal.Sci. 27 (2011) 678–680.
38] M. Morikawa, K. Kino, T. Oyoshi, M. Suzuki, T. Kobayashi, H. Miyazawa,Product analysis of photooxidation in isolated quadruplex DNA; 8-oxo-7,8-dihydroguanine and its oxidation product at 3’-G are formed instead of 2,5-diamino-4H-imidazol-4-one, RSC Adv. 3 (2013) 25694–25697.
39] J. Zhou, G. Yuan, Effect of pH and cations on the formation and structure ofhuman telomeric G-quadruplex DNA, Acta Chim. Sin. 65 (2007) 1728–1732.
40] L. Ma, M. Lezzi, M.S. Kaucher, Y.F. Lam, J.T. Davis, Cation exchange in lipophilicG-quadruplexes: not all ion binding sites are equal, J. Am. Chem. Soc. 128(2006) 15269–15277.
41] A. Marchand, V. Gabelica, Native electrospray mass spectrometry of DNAG-quadruplexes in potassium solution, J. Am. Soc. Mass Spectrom. 25 (2014)1146–1154.
42] M.L. Birrento, T.M. Bryan, S. Samosorn, J.L. Beck, ESI–MS investigation of anequilibrium between a bimolecular quadruplex DNA and a duplex DNA/RNAhybrid, J. Am. Soc. Mass Spectrom. 26 (2015) 1165–1173.
43] N.T. Dao, R. Haselsberger, M.E. Michel-Beyerle, A.T. Phan, FollowingG-quadruplex formation by its intrinsic fluorescence, FEBS Lett. 585 (2011)3969–3977.
44] C.K. Kwok, M.E. Sherlock, P.C. Bevilacqua, Effect of loop sequence and looplength on the intrinsic fluorescence of G-quadruplexes, Biochemistry 52(2013) 3019–3021.
45] A. Ambrus, D. Chen, J.X. Dai, T. Bialis, R.A. Jones, D.Z. Yang, Human telomericsequence forms a hybrid-type intramolecular G-quadruplex structure withmixed parallel/antiparallel strands in potassium solution, Nucleic Acids Res.34 (2006) 2723–2735.
46] D.J.E. Yue, K.W. Lim, A.T. Phan, Formation of (3 + 1) G-quadruplexes with along loop by human telomeric DNA spanning five or more repeats, J. Am.Chem. Soc. 133 (2011) 11462–11465.
47] M. Vorlícková, J. Chládková, I. Kejnovská, M. Fialová, J. Kypr, Guanine tetraplextopology of human telomere DNA is governed by the number of (TTAGGG)repeats, Nucleic Acids Res. 33 (2005) 5851–5860.
48] Z. Bagheri, B. Ranjbar, H. Latifi, M.I. Zibaii, T.T. Moghadam, A. Azizi, Spectralproperties and thermal stability of AS1411 G-quadruplex, Int. J. Biol.Macromol. 72 (2015) 806–811.
49] D.M. Gray, J.D. Wen, C.W. Gray, R. Repges, C. Repges, G. Raabe, J. Fleischhauer,Measured and calculated CD spectra of G-quartets stacked with the same oropposite polarities, Chirality 20 (2008) 431–440.
50] M. Kaushik, A. Bansal, S. Saxena, S. Kukreti, Possibility of an antiparallel(tetramer) quadruplex exhibited by the double repeat of the human telomere,Biochemistry 46 (2007) 7119–7131.
51] A.N. Lane, J.B. Chaires, R.D. Gray, J.O. Trent, Stability and kinetics ofG-quadruplex structures, Nucleic Acids Res. 36 (2008) 5482–5515.
52] K. Phillips, Z. Dauter, A.I.H. Murchie, D.M.J. Lilley, B. Luisi, The crystal structureof a parallel-stranded guanine tetraplex at 0.95 angstrom resolution, J. Mol.Biol. 273 (1997) 171–182.
53] D. Miyoshi, A. Nakao, N. Sugimoto, Structural transition from antiparallel toparallel G-quadruplex of d(G4T4G4) induced by Ca2+, Nucleic Acids Res. 31(2003) 1156–1163.
54] N. Smargiasso, F. Rosu, W. Hsia, P. Colson, E.S. Baker, M.T. Bowers, E. De Pauw,V. Gabelica, G-Quadruplex DNA assemblies: loop length, cation identity, andmultimer formation, J. Am. Chem. Soc. 130 (2008) 10208–10216.
55] Y. Krishnan-Ghosh, D.S. Liu, S. Balasubramanian, Formation of an interlockedquadruplex dimer by d(GGGT), J. Am. Chem. Soc. 126 (2004) 11009–11016.
56] A.T. Phan, V. Kuryavyi, J.B. Ma, A. Faure, M.L. Andréola, D.J. Patel, An
NMR study of ammonium ion (non)movement within the d(G3T4G4)2
quadruplex, J. Am. Chem. Soc. 129 (2007) 8794–8800.


![c4dt01927j 15351..15358 - Nanjing Universityhysz.nju.edu.cn/whuang/publication/Dalton-2014-ZK-authorreprints.pdf · mation of 36-membered [2 + 2] macrocyclic dinuclear Zn(II)complexes](https://img.pdfslide.net/doc/110x75/5c1009a509d3f280158c065d/c4dt01927j-1535115358-nanjing-mation-of-36-membered-2-2-macrocyclic.jpg)