Embed Size (px)
Citation preview

2455-0272 / JACS Directory©2017. All Rights Reserved
Cite this Article as: Tadesse Sisay, Abebe Beyene, Esayas Alemayehu, Assessment of drinking water quality and treatment plant efficiency in Southwest Ethiopia, J. Env. Sci. Pollut. Res. 3(3) (2017) 208–212.
J. Environ. Sci. Pollut. Res. - Volume 3 Issue 3 (2017) 208–212
Share Your Innovations through JACS Directory
Journal of Environmental Science and Pollution Research
Visit Journal at http://www.jacsdirectory.com/jespr
Assessment of Drinking Water Quality and Treatment Plant Efficiency in Southwest Ethiopia
Tadesse Sisay1,2,*, Abebe Beyene1, Esayas Alemayehu3 1Department of Environmental Health Sciences and Technology, College of Health Sciences, Jimma University, P.O. Box 378, Jimma, Ethiopia. 2Department of Environmental Health, Wollo University, P.O. Box 1145, Dessie, Ethiopia. 3School of Civil and Environmental Engineering, Jimma Institute of Technology (JiT), Jimma University, P.O. Box 378, Jimma, Ethiopia.
A R T I C L E D E T A I L S
A B S T R A C T
Article history: Received 26 July 2017 Accepted 12 September 2017 Available online 26 September 2017
Treatment of public water supply is an indispensable element in providing safe drinking water and to minimize the prevalence of waterborne diseases. However the efficiency of treatment plants was not known in Ethiopia. This study aims to determine drinking water quality and the efficiency of treatment plants in Southwest Ethiopia. Eighty four water samples were collected from the sources to household taps during dry and rainy seasons. A pre-tested and calibrated multi-parameter probe and turbidity meter were used to measure on the spot. Samples were transported at 4 °C and analyzed according to standard methods and procedures. The majority (87.4%) of physicochemical parameters were in compliance with the WHO standard. However, free residual chlorine, coliform and fluoride were not within the recommended limits. WQI of Agaro and Metu were in good category; whereas Jimma water was in poor category. The log removal value (LRV) and efficiency of treatment plants were 73.6%, 48.4% and 74.1% effective in overall pollutant removal in Jimma, Agaro and Metu, respectively. The treatment plants were still technologically appropriate to deliver safe water to the public, but focusing on technical skills on water treatment and quality monitoring may improve the observed negative findings.
Keywords: Physicochemical Studies Treatment Plant Water Quality WQI
1. Introduction
The government of Ethiopia was striving to enhance all national efforts towards the efficient, equitable and optimum utilization of water resources to access a universal coverage in drinking water [1]. In the meantime, the Ministry of Finance and Economic Development (MoFED) reported that, the national coverage for improved water sources reached 82.4% urban and 66.3% rural; and 90.0% urban and 65.9% rural in Oromia regional, state [2]. On the contrary, diarrhea was the second largest single cause of under-five child mortality (88/1000 live births) and morbidity due to diarrhea accounts 31%, mainly due to lack of quality water sources [3]. Moreover, Acute Watery Diarrhea (AWD) was becoming a major public health problem both in urban and rural settings of Ethiopia [4]. This paradox indicated, delivery of safe drinking water service to all people is the greatest development setback in the 21st century in developing countries including Ethiopia.
The production and supply of safe drinking water to consumers at all times constitutes a major challenge to water authorities. This task is more challenging in tropical countries like Ethiopia, where strong seasonal variations prevail. This variation can affect the efficiency of water treatment, water supply pattern and the quality of water in the water distribution system too [5].
Nowadays, the quality of drinking water is degrading due to large scale application of Agrochemicals, direct pollution by untreated sewage and infiltration of effluent from sewage treatment plants and storage pits [6]. However, the efficiency of existing water treatment systems to remove potential pollutants from the above sources in different seasons were not clearly known [7].
Conventional water treatment and bore hole are the dominant drinking water sources for urban settings in Ethiopia. But, studies are very limited and even the existing studies focused on springs and wells [8-10]. Despite, the alarming rate of water pollution and the huge disease burden associated with unsafe water supply, very little effort has been done to investigate the efficiency of existing water treatment systems in developing countries where Ethiopia is the case in point. Thus, the focus of this research was to determine the quality compliance of drinking water
with the WHO guideline value. Although, to calculate WQI for all town water supplies and determine the efficiency of existing water treatment systems in removing selected water quality parameters in Southwest Ethiopia.
2. Experimental Methods
2.1 Study Design and Area
A longitudinal study was conducted to determine the drinking water quality compliance and the treatment efficiency of municipal drinking water sources in the dry and rainy seasons in Jimma, Agaro and Metu towns, Southwest Ethiopia (Fig. 1). Giligel Gibe River was the source of raw water for Jimma town. While the final treated water is lifted via high-lift pumps to a reservoir situated in the Aba-Jiffar palace for onward distribution to the town administration. The treatment plant has an intake structure with four low-lift pumps and the aerator structure is a concrete cascade in two parallel units. The plant consists of sedimentation, filtration and chlorination structures. It served the town for about 20 years and renovated in 2014.
Metu is the capital town of the Illuababora zone in Oromia regional state. The source of raw water is Sore River and slow sand filter was used for treatment. The treatment plant consists of the sedimentation chamber (5.10 m x 26.50 m), aeration chamber (2.15 m x 5.10 m), two compartments of filtration thank (7.8 m x13. 30 m) each with a sand depth of 2 meters and a chlorination chamber. It served the town for about 32 years and conventional water treatment was under construction on the same source. Agro town has been served by ground water exploration from four bore holes situated in the west part of the town; while water is pumped to the reservoir for chlorination before distribution.
These towns were selected due to availability of the common conventional water treatment methods existing in Ethiopia (Rapid sand filter, slow sand filter and Borehole). Based on the Central Statistical Agency of Ethiopia (CSA) projection, the total population for Agaro, Jimma and Metu were 32, 928, 184, 925 and 37, 227 respectively [11].
*Corresponding Author Email Address: [email protected] (Tadesse Sisay)
ISSN: 2455-0272

209
Tadesse Sisay et al. / Journal of Environmental Science and Pollution Research 3(3) (2017) 208–212
Cite this Article as: Tadesse Sisay, Abebe Beyene, Esayas Alemayehu, Assessment of drinking water quality and treatment plant efficiency in Southwest Ethiopia, J. Env. Sci. Pollut. Res. 3(3) (2017) 208–212.
Fig. 1 Map of the study area and sampling locations in Jimma, Agaro and Metu town, Southwest Ethiopia, 2016
2.2 Sample Collection
During the dry and rainy seasons, 84 representative samples were collected from the raw, filtered and treated water. Water samples were taken four times from each sampling locations during the rainy and dry seasons at 08:00-12:00 AM in 2014 and 2015. The sampling was carried out scrupulously following standard methods [12]. The water samples were collected aseptically using a sterile two liter polyethylene (PET) bottle for physicochemical analysis and 250 milliliter (mL) sterilized glass bottles for bacteriological analysis. Glass bottles were autoclaved with 0.1ml sodium thiosulphate for chlorinated water sample collection [13].
The tap was turned on at maximum flow rate and the water allowed to flow for 2 minutes. The tap was disinfected for a minute using a 70% alcohol and allowed to flow at a medium rate for 2 minutes. A previously sterilized glass and clean PET bottles were opened for collecting water samples by holding the bottle steady under the water jet, while the cover cup was held in up down position. Samples at treatment units were taken according to surface water sampling procedure by dipping the sampling container to 20 cm of the water body. The samples were sealed, labeled and transported in the icebox to Environmental Health Science and Technology Laboratory, Jimma University within 8 hours of sample collection (Table 1).
Table 1 Water sample labels and details of sampling locations in Agaro, Jimma and Metu town, Southwest Ethiopia, 2016
S.No Sample labels Latitude Longitude Source
1 ATJ-1 37-232886 08-68842 Borehole
2 ATJ-2 37-0232530 8-68492 Borehole
3 ATJ-4 37-0232227 8-69942 Borehole
4 ATW1 37-0233665 8-68928 Tap water
5 ATW2 36-34'518 7-51295 Tap water
6 ATW3 36-35'265 7-51291 Tap water
7 ATW4 36-35'470 7-51158 Tap water
8 JRW 36,52,27.9 7-39099 Raw water
9 JSW 36-52396 7-39324 Settled water
10 JFW 36-52,279 7-39096 Filtered water
11 JClW 36-52395 7-39324 Chlorinated water
12 JTW1 36-51181 7-40198 Tap water
13 JTW2 36-49'473 7-40101 Tap water
14 JTW3 36-49'520 7-40503 Tap water
15 JTW4 36-50'263 7-40444 Tap water
16 MRW 36-0786211 9-19163 Raw water
17 MFW 36-0786214 9-19165 Filtered water
18 MClW 36-0786216 9-19167 Chlorinated water
19 MTW1 35-34'29.92 8-174818 Tap water
20 MTW2 35-33'29.70 8-191090 Tap water
21 MTW3 35-34'53.7 8-80832 Tap water
Physicochemical analysis: temperature, electrical conductivity (EC), dissolved oxygen (DO) and pH were determined using a pre-tested and a calibrated portable digital multi-parameter probe, specifically; Hatch PHC 101 probe, Hatch Loo, US PAT 691 2050 probe and Hatch CDC 401 probe, respectively. Similarly, turbidity was determined by Hanna LP turbidity meter [14]. Total alkalinity (TA) was determined by a visual titration method using methyl orange and phenolphthalein indicator. Total hardness (TH) was measured by ethylene-diaminetetra-aceticacid (EDTA)
titration method using Eriochrome black T (EBT) indicator according to standard methods [12]. Fluoride (F) was determined by Alizarin photometric method and [15] fluoride ion selective electrode for double checking. Nitrate (NO3) was measured using DR 5000; HACH, LANGE spectrophotometer and Iron (Fe) was determined by phenanthroline method. Free residual chlorine and Total residual chlorine were determined by the planitest diethyl paraphenylene diamine (DPD) method.
Bacteriological analysis: total coliform (TC) and fecal coliform (FC) were determined using membrane filtration (MF) technique within 8 hours of sample collection. Hundred mil-liters of water samples were filtered through 0.45 µm membrane filter, under vacuum. The membrane filter, then layered to 2 mL prepared (35.6 mg/L proportion) membrane lauryl sulfate broth (AVONCHEM, Limited) with absorbent pad and incubated at 37 °C and 44 (±0.5 °C) for 24 hours, respectively. After 24 hours of incubation, the plates were examined for development of yellow colonies and it was expressed in colony forming unit (CFU) per 100 mL of water sample [16]. Laboratory grade reagents and blank test were used for laboratory analysis and quality checking. 2.3 Water Quality Index (WQI)
A water quality Index is a numeric expression used to evaluate the quality of water and to be easily understood by managers. It is defined as a rating that reflects the composite influence of different water quality parameters [17]. It was calculated for drinking water in all towns. First, each of the parameters was assigned a weight (wi) based on their perceived effects on primary health. The highest weight of five was assigned to parameters which have the major effects on water quality. The relative weight (Wi) is computed from the following equation:
Wi =𝑤𝑖
∑ wi𝑛𝑖=1
(1)
where: Wi is the relative weight, wi is the weight of each parameter and n is the number of parameters, ∑wi is the sum of all the parameters. Then, a quality rating scale (qi) for each parameter is assigned by dividing its concentration in each water sample by its respective standard and the result multiplied by 100,
qi =𝐶𝑖
𝑆𝑖∗ 100 (2)
where; qi is the quality rating scale, Ci is the concentration of each parameter in each water sample in mg/L, and Si is the World Health Organization standard for each parameter in milligrams per liter [18]. To calculate WQI, first, SIi value were determined using the following equations:
𝑆𝐼𝑖 = 𝑤𝑖𝑞𝑖 (3)
WQI = ∑ SIi (4) The computed WQI values are classified into five categories as follows [19] <50: excellent water; 50–100: good water; 100–200: poor water; 200–300: very poor water; >300: unsuitable for drinking
Statistical Analysis: Microsoft Excel software analyze was deployed to determine drinking water quality compliance with the WHO guideline values and WQI calculation. The overall efficiency of the plants was calculated using the Log Removal value (LRV) and overall parametric efficiency (Eq.(5)) [20].
LRV = 𝑙𝑜𝑔10(Influent concentration of contaminant)
Effluent concentration of contaminant (5)
3. Results and Discussion
3.1 pH
The majority (87.3%) of water sources pH were found within the recommended limits of WHO drinking water guideline values of 6.5 to 8 in both seasons [21] (Table 2 and Fig. 2). It was consistent with other studies done in Ethiopia [22, 23].
However, the lowest pH was 6.3±0.22 in Jimma water source during the rainy seasons. This may be due to the use of chemical alum (Al2(SO4)3) to coagulation process, in conventional treatment method as reported in another study in Nigeria [24] addition of excess aluminum sulfate would reduce the pH of the water. The pH values more than 8 are not suitable for effective disinfection with chlorine while values less than 6.5 enhance corrosion in water pipes and household plumbing systems [21].
210
Tadesse Sisay et al. / Journal of Environmental Science and Pollution Research 3(3) (2017) 208–212
Cite this Article as: Tadesse Sisay, Abebe Beyene, Esayas Alemayehu, Assessment of drinking water quality and treatment plant efficiency in Southwest Ethiopia, J. Env. Sci. Pollut. Res. 3(3) (2017) 208–212.
Fig. 2 Comparison of mean values of pH of drinking water sources during the dry and rainy seasons in Jimma, Agaro and Metu towns, Southwest Ethiopia, 2016
Table 2 Drinking water quality compliance with the WHO permissible limits in the dry and rainy seasons in Jimma, Agaro and Metu town, Southwest Ethiopia 2016
Parameters Jimma town Agaro town Metu town WHO limit
Dry Rainy Dry Rainy Dry Rainy
Temprature 23.82
±0.5
20.76
±0.9
26.52
±1.43
22.41
±1.25
24.44
±.95
22.00
±1.06
25-30
pH 7.54
±0.19
6.3
±0.22
7.39
±0.2
7.23
±0.19
7.19
±0.24
7.21
±0.14
6.5-8
Turbidity 4.13
±0.85
5.15
±1.46
3.84
±0.82
4.25
±0.35
3.75
±.34
4.30
±0.47
5.0
Dissolved
oxygen
6.74
±0.46
7.50
±0.56
5.34
±2.26
5.7
±1.74
6.22
±1.32
7.56
±0.64
6.0
Conductivity 182
±5.99
105.8
±1.2
635.4
±11.7
624.1
±12.8
261.0
±5.4
264.5
±10.2
1000
Total hardness 50.2
±1.1
24.36
±1.04
121.0
±52.1
141.4
±16.6
63.00
±10.3
64.00
±10.8
100
Total alkalinity 16.3
±8.86
16.20
±8.96
142.0
±21.89
121.4
±3.58
60.00
±17.2
54.00
±17.9
200
Nitrate 0.85
±0.11
0.85
±0.1
0.0
±00
0.0
±0.0
0.36
±0.27
0.51
±0.2
50
Iron 0.11
±0.01
0.76
±0.6
0.17
±0.19
0.21
±0.28
0.79
±0.25
0.52
±0.24
0.3
Fluoride 0.15
±0.06
0.15
±0.06
3.33
±3.24
3.44
±2.96
0.06
±0.06
0.05
±0.08
1.5
Total coliform 2.5
±1.89
56
±17.35
26.8
±15.6
41.5
±24.15
16.83
±21.1
31.67
±29.2
0
Faecal Coliform 0
±0
3.25
±3.9
5.75
±2.6
10.5
±5.92
1.17±
2.02
1.0
±1.73
0
NB: Temperature measurements are in (°C), Dissolved oxygen, Total hardness, Total alkalinity, Iron, Nitrate, Fluoride in mg/L, Conductivity in (μS/cm), and Turbidity in (NTU), WHO limit= World Health Organization drinking water permissible standard
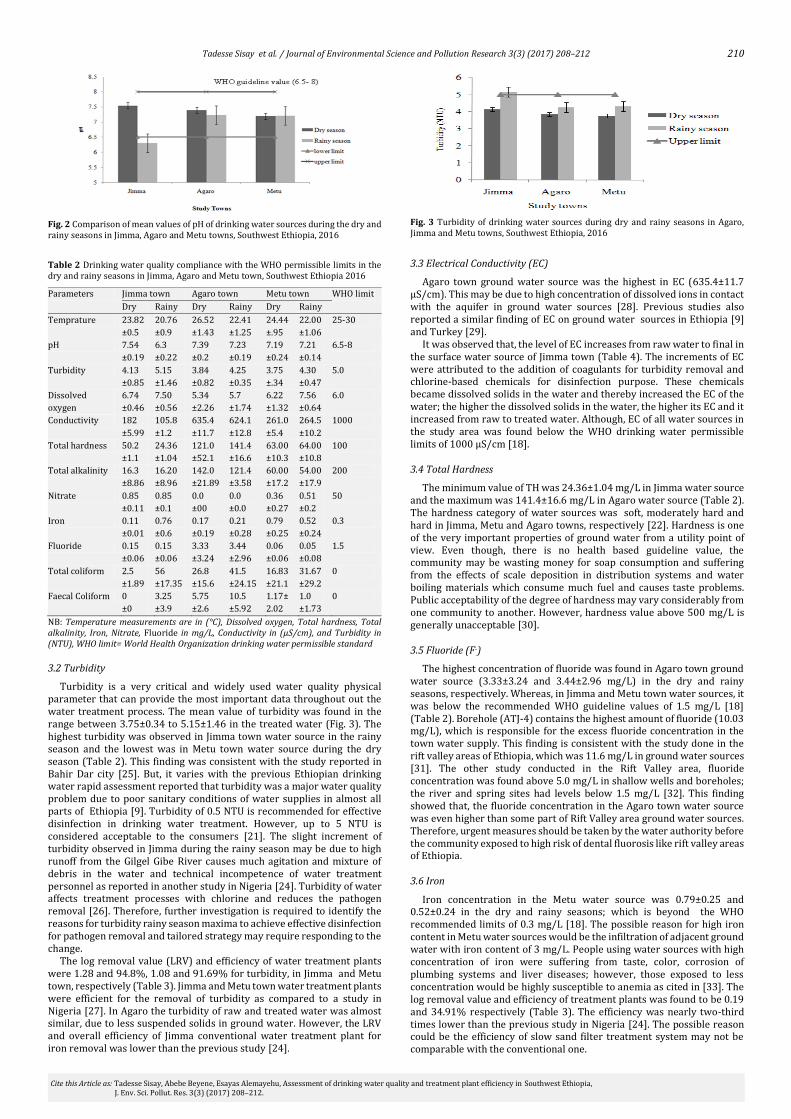
3.2 Turbidity
Turbidity is a very critical and widely used water quality physical parameter that can provide the most important data throughout out the water treatment process. The mean value of turbidity was found in the range between 3.75±0.34 to 5.15±1.46 in the treated water (Fig. 3). The highest turbidity was observed in Jimma town water source in the rainy season and the lowest was in Metu town water source during the dry season (Table 2). This finding was consistent with the study reported in Bahir Dar city [25]. But, it varies with the previous Ethiopian drinking water rapid assessment reported that turbidity was a major water quality problem due to poor sanitary conditions of water supplies in almost all parts of Ethiopia [9]. Turbidity of 0.5 NTU is recommended for effective disinfection in drinking water treatment. However, up to 5 NTU is considered acceptable to the consumers [21]. The slight increment of turbidity observed in Jimma during the rainy season may be due to high runoff from the Gilgel Gibe River causes much agitation and mixture of debris in the water and technical incompetence of water treatment personnel as reported in another study in Nigeria [24]. Turbidity of water affects treatment processes with chlorine and reduces the pathogen removal [26]. Therefore, further investigation is required to identify the reasons for turbidity rainy season maxima to achieve effective disinfection for pathogen removal and tailored strategy may require responding to the change.
The log removal value (LRV) and efficiency of water treatment plants were 1.28 and 94.8%, 1.08 and 91.69% for turbidity, in Jimma and Metu town, respectively (Table 3). Jimma and Metu town water treatment plants were efficient for the removal of turbidity as compared to a study in Nigeria [27]. In Agaro the turbidity of raw and treated water was almost similar, due to less suspended solids in ground water. However, the LRV and overall efficiency of Jimma conventional water treatment plant for iron removal was lower than the previous study [24].
Fig. 3 Turbidity of drinking water sources during dry and rainy seasons in Agaro, Jimma and Metu towns, Southwest Ethiopia, 2016
3.3 Electrical Conductivity (EC)
Agaro town ground water source was the highest in EC (635.4±11.7 μS/cm). This may be due to high concentration of dissolved ions in contact with the aquifer in ground water sources [28]. Previous studies also reported a similar finding of EC on ground water sources in Ethiopia [9] and Turkey [29].
It was observed that, the level of EC increases from raw water to final in the surface water source of Jimma town (Table 4). The increments of EC were attributed to the addition of coagulants for turbidity removal and chlorine-based chemicals for disinfection purpose. These chemicals became dissolved solids in the water and thereby increased the EC of the water; the higher the dissolved solids in the water, the higher its EC and it increased from raw to treated water. Although, EC of all water sources in the study area was found below the WHO drinking water permissible limits of 1000 μS/cm [18]. 3.4 Total Hardness
The minimum value of TH was 24.36±1.04 mg/L in Jimma water source and the maximum was 141.4±16.6 mg/L in Agaro water source (Table 2). The hardness category of water sources was soft, moderately hard and hard in Jimma, Metu and Agaro towns, respectively [22]. Hardness is one of the very important properties of ground water from a utility point of view. Even though, there is no health based guideline value, the community may be wasting money for soap consumption and suffering from the effects of scale deposition in distribution systems and water boiling materials which consume much fuel and causes taste problems. Public acceptability of the degree of hardness may vary considerably from one community to another. However, hardness value above 500 mg/L is generally unacceptable [30]. 3.5 Fluoride (F-)
The highest concentration of fluoride was found in Agaro town ground water source (3.33±3.24 and 3.44±2.96 mg/L) in the dry and rainy seasons, respectively. Whereas, in Jimma and Metu town water sources, it was below the recommended WHO guideline values of 1.5 mg/L [18] (Table 2). Borehole (ATJ-4) contains the highest amount of fluoride (10.03 mg/L), which is responsible for the excess fluoride concentration in the town water supply. This finding is consistent with the study done in the rift valley areas of Ethiopia, which was 11.6 mg/L in ground water sources [31]. The other study conducted in the Rift Valley area, fluoride concentration was found above 5.0 mg/L in shallow wells and boreholes; the river and spring sites had levels below 1.5 mg/L [32]. This finding showed that, the fluoride concentration in the Agaro town water source was even higher than some part of Rift Valley area ground water sources. Therefore, urgent measures should be taken by the water authority before the community exposed to high risk of dental fluorosis like rift valley areas of Ethiopia. 3.6 Iron
Iron concentration in the Metu water source was 0.79±0.25 and 0.52±0.24 in the dry and rainy seasons; which is beyond the WHO recommended limits of 0.3 mg/L [18]. The possible reason for high iron content in Metu water sources would be the infiltration of adjacent ground water with iron content of 3 mg/L. People using water sources with high concentration of iron were suffering from taste, color, corrosion of plumbing systems and liver diseases; however, those exposed to less concentration would be highly susceptible to anemia as cited in [33]. The log removal value and efficiency of treatment plants was found to be 0.19 and 34.91% respectively (Table 3). The efficiency was nearly two-third times lower than the previous study in Nigeria [24]. The possible reason could be the efficiency of slow sand filter treatment system may not be comparable with the conventional one.

211
Tadesse Sisay et al. / Journal of Environmental Science and Pollution Research 3(3) (2017) 208–212
Cite this Article as: Tadesse Sisay, Abebe Beyene, Esayas Alemayehu, Assessment of drinking water quality and treatment plant efficiency in Southwest Ethiopia, J. Env. Sci. Pollut. Res. 3(3) (2017) 208–212.
3.7 Bacteriological Quality
The study revealed that, both TC and FC in all town water sources were above the recommended limits of WHO drinking water guideline values (0/100 mL) in the rainy season (Fig. 4-6). This may be due to high runoff, rising of the water table, leaching during the rainy season and failure of the treatment plant [34]. However, the FC count of Jimma town water source was within the WHO limit in the dry season. The possible reason may be the treatment process during the rainy season could be affected by turbidity of surface water sources due to high rainfall.
In Agaro ground water source up to 16.11 and 7.33 CFU/100 mL FC was detected in raw and treated water samples, respectively. The high FC count may be attributed to the failure of the treatment process due to malfunctioning of automatic chlorination devices and manual application of chlorine [35]. In addition, free residual chlorine was not detected in Agaro town water source throughout the study periods (Fig. 5). According to the WHO guideline, for inactivating 90% of FC a free chlorine residual of 1 mg/L is required for about 25–30 minutes. The residual chlorine in Jimma and Metu water sources was found in the recommended limits (0.5 mg/L) in the dry season [18]. Lack of regular water quality monitoring in the treatment plant and distribution may be the possible explanation for the poor bacteriological quality of water sources in the study area. A study done in Pakistan also indicated that water treatments with nonfunctional chlorination equipment had more TC and FC in the distribution system [35]. This finding also consistent with the previous studies conducted in the Jimma zone on spring water and hand dug well bacterial loads of non-chlorinated water sources [8, 10].
The LRV and efficiency of treatment plants were 1.27 and 94.6%, 0.34 and 54.5% and 1.35 and 95.5% for FC in Jimma, Agaro and Metu town, respectively. The FC removal efficiency of Jimma and Metu water treatments were in line with the water research Australia recommendations of LRV of 1,2 and 3 is equivalent to 90%, 99% and 99.9%, respectively, for target pathogen removal [20]. Agaro ground water treatment efficiency was lower than other studies; This may be due to malfunctioning of chlorination devices and manual application of chlorine affects the bacteriological quality. Even though, lack of previous study in Ethiopia, the treatment efficiency was slightly lower than a study done in Nigeria [24] and report of Jefferson City rapid sand filter treatment plant efficiency [36].
Fig. 4 Total coliform and Faecal coliform in water sources during dry and rainy seasons in Jimma, Agaro and Metu towns, southwest Ethiopia, 2016
Fig. 5 Free residual chlorine in water sources during dry and rainy seasons in Jimma, Agaro and Metu towns, southwest Ethiopia, 2016
Fig. 6 Faecal coliform count at sampling points of Jimma, Agaro and Metu town, Southwest Ethiopia, 2016
Table 3 Overall Efficiency of the treatment processes on selected parameters considered, in Jimma, Agaro and Metu towns, Southwest Ethiopia, 2016
Water
Parameters
Jimma water treatment (Rapid sand filter) Agaro water treatment (only Chlorination) Metu water treatment (slow sand filter)
Raw Treated LRV % Raw Treated LRV % Raw Treated LRV %
Turbidity 88.9 4.62 1.28 94.8 4.09 3.89 0.02 4.89 48.97 4.07 1.08 91.69
Electrical Conductivity 131 160.4 -0.09 - 625.3 636.4 -0.01 - 261 261.17 0.00 -
Iron 0.97 0.55 0.25 43.3 0.28 0.11 0.41 60.7 1.06 0.69 0.19 34.91
Faecal coliform 35.5 1.92 1.27 94.6 16.11 7.33 0.34 54.5 40.67 1.83 1.35 95.50
Total coliform 100 38.42 0.42 61.6 45.33 31.67 0.16 30.1 100 25.75 0.59 74.25
Average % effectiveness 73.6 48.4 74.1
NB. Turbidity (NTU), Iron (mg/L), Total and Faecal coliform (CFU/100 mL), LRV= Log Removal Value, %= efficiency percent
Table 4 Physiochemical parameters considered to calculate the drinking water quality index, Southwest Ethiopia, 2016
Note: Ci= concentration in mg/L, wi= weight, Wi= relative weight
3.8 Water Quality Index Calculation
WQI is an important parameter for identifying the water quality and its suitability for drinking purposes [17]. In the present study, WQI was computed for the three town water supplies. First, important water quality parameters (pH, Turbidity, DO, EC, Total hardness, Nitrate, Iron and Fluoride) were selected and a weight was assigned to each parameter depending upon the effect on human health and water quality. In addition, the limit values of the World Health Organization’s guidelines [21] were utilized in the calculations (Table 4). The highest weight of 5 was assigned to parameters such as Turbidity, EC, Nitrate and fluoride, which have the major effects on drinking water quality. While, DO and pH has been assigned a weight of 4; Hardness and Iron have been assigned a value of 3 by taking into consideration their importance in water quality. The relative weights (Wi) are computed for each parameter and results are
given in Table 4. The WQI values have been calculated using related equations (Eqs.(1-4)) given in the method part and WQI results and water classification for all towns were presented in Fig. 7. The WQI for these town water supplies were ranged from 68.78 in Metu and 157.4 in Jimma town. The classification was “good water” in Metu and Agaro water supplies, whereas Jimma town water supply was classified in “Poor water” category. The water quality in the study area was in good and poor category as compared to a study done in Nepal [17]. The possible reason may be water treatment plant efficiency was not controlled in the rainy season due to high runoff from Gilgel Gibie River and high fluoride concentration in the Agaro water source. From the LRV and WQI calculation, the researcher concluded that, the quality of drinking water in the study area needs attention for quality checking and deployment of skilled personnel for proper operation the treatment plants.
Parameters WHO standard Jimma Agaro Metu
Ci wi Wi Ci wi Wi Ci wi Wi
pH 6.5 7.12 4 0.1176 7.35 4 0.1176 7.28 4 0.118
Turbidity 5 4.62 5 0.1471 3.89 5 0.1471 4.07 5 0.147
Dissolved O2 6 6.75 4 0.1176 6.82 4 0.1176 6.75 4 0.118
Conductivity 1000 160.14 5 0.1471 636.42 5 0.1471 261.17 5 0.147
Total hardness 100 41.18 3 0.0882 106.25 3 0.0882 64.33 3 0.088
Nitrate 50 0.89 5 0.1471 0 5 0.1471 0.48 5 0.147
Iron 0.3 0.55 3 0.6000 0.11 3 0.0882 0.69 3 0.088
Fluoride 1.5 0.15 5 0.1471 3.12 5 0.1471 0.05 5 0.147
∑wi =34 ∑wi =34 ∑wi =34

212
Tadesse Sisay et al. / Journal of Environmental Science and Pollution Research 3(3) (2017) 208–212
Cite this Article as: Tadesse Sisay, Abebe Beyene, Esayas Alemayehu, Assessment of drinking water quality and treatment plant efficiency in Southwest Ethiopia, J. Env. Sci. Pollut. Res. 3(3) (2017) 208–212.
Fig. 7 Water quality index, in Jimma, Agaro and Metu town, Southwest Ethiopia, 2016
4. Conclusion
Physicochemical quality of all water sources was in compliance with the WHO recommended limits. TC and FC were identified in both water sources indicated lack of regular sanitary checking and skill gaps in chlorination process. Free residual chlorine was very minimal and below detectable limits in treated water samples and needs strict monitoring and regular checkup for removal of bacteriological indicator bacteria.
Fluoride concentration in the borehole (ATJ-4) was 10.03 mg/L and the tap water samples were 3.12 mg/L which is higher than the recommended limits. ATJ-4 may be the source of high fluoride in Agaro town. Therefore, looking alternative source or treatment of the sources is a solution to avoid high fluoride concentration problems.
The WQI showed that, the Jimma water was classified as poor, and Agaro and Metu were in the good category. Therefore, WSA needs strict evaluation of the water quality in the rainy season, particularly in Jimma and Agaro towns. The overall efficiency of treatment plants were 73.6%, 48.4% and 74.1% effective in overall pollutant removal in Jimma, Agaro and Metu town, respectively. The study concluded that the treatment plants were still technologically appropriate to deliver safe water to the public, but giving attention on technical skills on water quality monitoring may improve the observed negative findings on bacteriological quality and free residual chlorine.
Acknowledgments
The authors are grateful for the financial support of Jimma University and Wollo University. We would like to thank laboratory staffs of Environmental health science and technology laboratory, Jimma University. We are also very grateful to all the staffs of water and sewerage authorities in Agaro, Jimma and Metu towns.
References
[1] FMoWR, Ethiopian water resources management policy, Addis Ababa, Ethiopia, 2008.
[2] MoFED, Federal democratic republic of Ethiopia growth and transformation plan annual progress report for F.Y. 2012 / 13, Addis Ababa, Ethiopia, 2014.
[3] CSA, Ethiopia demographic and health survey preliminary report, Addis Ababa, Ethiopia, 2011.
[4] OCHA, Scaled-up response required to curb the ongoing acute watery diarrhea (AWD) outbreak in Oromia, Somali and SNNP regions, Wkly. Humanit Bull. Ethiop., Ethiopia, 2016.
[5] A.T. Etchie, T.O. Etchie, G.O. Adewuyi, K. Kannan, S.R. Wate, S. Sivanesan, et al., Influence of seasonal variation on water quality in tropical water distribution system : Is the disease burden significant ?, Water Res., 49 (2014) 186–196.
[6] H. Pathak, Assessment of physico-chemical quality of groundwater by multivariate analysis in some populated villages nearby Sagar city, MP, India. 2(5) (2012) 555-562.
[7] W. Chen, J.R. Lund, W.E. Fleenor, Delta drinking water quality and treatment costs, Technical Appendix H, Public Policy Institute of California, USA, 2008.
[8] T.G. Sofonias Kifle, Microbial quality of Jimma water supply, Ethiop. J. Educ. Sc. 2(1) (2006) 21-35.
[9] T. Dagnew, D. Assefa, G. Aberra, G. Woldemariam, Rapid assessment of drinking- water quality in the federal democratic republic of Ethiopia, Addis Ababa, Ethiopia, 2010.
[10] S. Abera, A. Zeyinudin, B. Kebede, A. Deribew, S. Ali, E. Zemene, Bacteriological analysis of drinking water sources, 5(18) (2011) 2638–2641.
[11] CSA, Population and housing census of Ethiopia, Uma ética para quantos?, Addis Ababa, Ethiopia, 2007.
[12] APHA, Standard methods for the examination of water and wastewater, 20th Ed., American Public Health Association, Washington DC, USA, 1999.
[13] M. Cheesbrough, District laboratory practice in tropical countries, 2nd Ed., Uma ética para quantos?, Cambridge University Press, New York, 2006.
[14] H. LP 2000 Precision Bench Turbidity Meter, 2000. Retrived from: www.hannainst.com (Accessed on: DATE)
[15] Mettler Toledo, perfectION Guidebook, Combination Fluoride Electrode Successful Ion Measurement. Retrived from https://www.mt.com (Accessed on: 5th February, 2016)
[16] J. Bartram, R. Balance, Water quality monitoring, 1st Ed., Chapman & Hall, London, UK, 1996.
[17] E.S. Sehnaz Sener, Assessment of groundwater quality and health risk in drinking water basin using GIS, J. Water Health. 15(1) (2016) 112-132.
[18] WHO, Guidelines for drinking-water quality, 3rd Ed., World Health Organization, Geneva, 2011, p.595.
[19] S. Mark, Y. Adadow, Assessing water quality using water quality index and multivariate analysis, Env. Ment. Earth Sci. 59 (2010) 1461–1473.
[20] Water Research Australia, Log removal values in wastewater treatment, Australia, 2014.
[21] WHO, Guidelines for drinking-water quality, 2nd Ed., Health Criteria and Other Supporting Information, World Health Organization, Geneva, 1996.
[22] B. Duguma, A. Tegegne, B.P. Hegde, Assessment of the effect of season and location on microbiological and physicochemical quality of livestock drinking water in Ginchi Watershed, Ethiopia. Glob Vet. 8(4) (2012) 342–346.
[23] D. Siyum, D. Woyessa, Assessment of bacteriological quality and traditional treatment methods of water-borne diseases among well water users in Jimma Town , Southwest Ethiopia, ARPN J. Agric. Biol. Sci. 8(6) (2013) 477–486.
[24] A.A. Badejo, J.M. Ndambuki, W.K. Kupolati, A. Adebola, S.A. Taiwo, D.O. Omole, Appraisal of access to safe drinking water in southwest Nigeria, African J. Sci. Technol. Innov. Dev. 7(6) (2015) 441–445.
[25] T. Milkiyas, K. Mulugeta, Bacteriological and physicochemical quality of drinking water and hygiene- sanitation practices of the consumers in Ethiopia, Ethiop. J. Heal. Sci. 21 (2011) 19–26.
[26] Dagnew Tadesse, Assefa Desta, Aberra Geyid, Woldemariam girma, Solomon Fisseha, Rapid assessment of drinking- water quality in the Federal Democratic Republic of Ethiopia, Country Report, Addis Ababa, Ethiopia, 2010.
[27] A.Q. Ibrahim, P.C. Onyenekwe, I.M. Nwaedozie, An efficiency assessment of lower usuma water treatment plant in Abuja Metropolis, Nigeria, IOSR J. Environ. Sci. Toxicol. Food Technol. 8(12) (2014) 46–53.
[28] D. Chapman, Water quality assessments - a guide to use of biota, Sediments and water in environmental monitoring, 2nd Ed., E&FN Spon, Great Britain, 1996.
[29] M. Soylak, F.A. Aydin, S. Saracoglu, L. Elci, M. Dogan, Chemical analysis of drinking water samples from Yozgat, Turkey Polish J. Environ. Stud. 11(2) (2002) 151-156.
[30] K.N. Asadullah, Physico-chemical properties of drinking water available in educational institutes of Karachi city, Sci. Tech. Dev. 32(1) (2013) 28–33.
[31] C. Reimann, K. Bjorvatn, B. Frengstad, Z. Melaku, R. Tekle-Haimanot, U. Siewers, Drinking water quality in the Ethiopian section of the East African Rift Valley I--data and health aspects, Sci. Total Environ. 311(1–3) (2003) 65–80.
[32] H. Kloos, R.T. Haimanot, Distribution of fluoride and fluorosis in Ethiopia and prospects for control, Trop. Med. Int. Heal. 4(5) (1999) 355–364.
[33] M.K. Das, B. Karmakar, R.L. Rajib Paul, Assessment of physicochemical characterstics of drinking water sources in Chawmanu, Int. J. Res. Eng. Technol. 3(7) (2014) 33–38.
[34] A.N.Elisante, Sources and seasonal variation of coliform bacteria abundance in groundwater around the slopes of Mount Meru, Arusha, Tanzania, Environ. Monit. Assess. 7 (2016) 188-395.
[35] S. Haydar, M. Arshad, J. Aziz, A evaluation of drinking water quality in urban areas of Pakistan: A Case Study of Southern Lahore, Pakistan. J. Eng. Appl. Sci. 5 (2009) 16–23.
[36] AWWA, WQTC, Assessments of water treatment plant performance and distribution system water quality, American Water Works Association, USA, 1987.