Embed Size (px)
Citation preview
Contents lists available at ScienceDirect
Journal of Financial Economics
Journal of Financial Economics 98 (2010) 177–194
0304-40
doi:10.1
$ We
insights
Corbus,
Jens Ma
and sem
Interme
in Finan
Univers
Norweg
for help
providin
Finance� Cor
E-m
journal homepage: www.elsevier.com/locate/jfec
Auctioned IPOs: The US evidence$
Franc-ois Degeorge a, Franc-ois Derrien b, Kent L. Womack c,�
a Swiss Finance Institute, University of Lugano, Switzerlandb HEC Paris, Francec Rotman School of Management, University of Toronto, 105 St. George, Toronto, Ontario, Canada M5S 3E6
a r t i c l e i n f o
Article history:
Received 5 December 2008
Received in revised form
14 July 2009
Accepted 29 July 2009Available online 11 May 2010
JEL classification:
G24
G32
Keywords:
Initial public offerings
Investment banking
Auctions
5X/$ - see front matter & 2010 Elsevier B.V.
016/j.jfineco.2010.05.005
thank the editor and an anonymous refere
as well as Lena Booth, Geraldo Cerqueiro, Jo
Jacqueline Garner, David Goldreich, Tim Loug
rtin, Jay Ritter, Ann Sherman, David Thesmar
inar participants at the Second Swiss Confe
diation, the 2009 FMA European Conference,
ce Conference, Finrisk Research Day, the S
ity of Michigan, the University of Notre
ian School of Management BI, ESSEC and T
ful comments and discussions. We thank W
g data. Franc-ois Degeorge thanks the NCCR Fi
Institute for financial support.
responding author. Tel.: +1 416 946 3297.
ail address: [email protected]
a b s t r a c t
Between 1999 and 2007, WR Hambrecht completed 19 initial public offerings (IPOs) in
the US using an auction mechanism. We analyze investor behavior and mechanism
performance in these auctioned IPOs using detailed bidding data. The existence of some
bids posted at high prices suggests that some investors (mostly retail) try to free-ride on
the mechanism. But institutional demand in these auctions is very elastic, suggesting
that institutional investors reveal information in the bidding process. Investor
participation is largely predictable based on deal size, and demand is dominated by
institutions. Flipping is at most as prevalent in auctions as in bookbuilt deals. But, unlike
in bookbuilding, investors in auctions do not flip their shares more in ‘‘hot’’ deals.
Finally, we find that institutional investors, who provide more information, are
rewarded by obtaining a larger share of the deals that have higher 10-day underpricing.
Our results therefore suggest that auctioned IPOs can be an effective alternative to
traditional bookbuilding.
& 2010 Elsevier B.V. All rights reserved.
1. Introduction
In 1999, WR Hambrecht introduced the OpenIPOauction mechanism in the United States to compete withthe bookbuilding approach, which effectively had com-plete control over initial public offering (IPO) issuancesbefore then. Between 1999 and 2007, WR Hambrecht was
All rights reserved.
e for very valuable
nathan Clarke, Clay
hran, Stefano Lovo,
, Donghang Zhang,
rence on Financial
the Banff Frontiers
GF Conference, the
Dame, NHH, the
oulouse University
R Hambrecht for
nrisk and the Swiss
a (K.L. Womack).
the lead underwriter in 19 auctioned IPOs.1 This paperprovides an analysis of investor behavior and mechanismperformance in these IPOs using detailed bidding datafrom these auctions. We find that auctioned IPOs performwell under two important criteria: They exhibit highlyelastic (i.e., informative) demand, and they attract strongand predictable participation from institutional investors.Our results suggest that auctioned IPOs could therefore bean effective alternative to traditional bookbuilding.
IPOs have been notoriously hard to price for the issuerand the underwriter as demonstrated by significantvariance in first day returns (Lowry, Officer, and Schwert,2010). An important aim of the IPO selling mechanism isto extract information from investors that enables a moreaccurate pricing of the issue. A series of theoretical papershas analyzed the pros and cons of bookbuilding versusother IPO mechanisms. Benveniste and Spindt (1989),
1 WR Hambrecht was also a co-manager in the auctioned IPOs of
Google in 2004, NetSuite in 2007, and Rackspace in 2008.
F. Degeorge et al. / Journal of Financial Economics 98 (2010) 177–194178
Benveniste and Wilhelm (1990), Spatt and Srivastava(1991), and Sherman (2000) argue that the bookbuildingmechanism, thanks to its pricing and allocation flexibility,allows underwriters to elicit truthful information revela-tion from informed investors. These papers, however,generally assume that no agency conflicts exist betweenthe issuing firm and the underwriter. Biais and Faugeron-Crouzet (2002) and Biais, Bossaerts, and Rochet (2002)take a mechanism-design approach to characterize theoptimal IPO mechanism and show that, under certainassumptions, the Offre �a Prix Minimal (previously calledMise en Vente), a modified auction mechanism used inFrance, exhibits information-extraction properties similarto bookbuilding. Sherman (2005), meanwhile, suggeststhat, with costly information acquisition, auctions canlead to suboptimal information production and free-riding by uninformed investors. The Offre �a Prix Minimal
mechanism reduces these problems by discriminatingagainst bidders who submit bids at prices far above the expost market-clearing price.
Because of the lack of detailed IPO bidding dataavailable from investment bankers, few empirical papershave addressed these issues. Exceptions include Cornelliand Goldreich (2001, 2003) and Jenkinson and Jones(2004), who analyze bidding and allocation in Europeanbookbuilt IPOs. Cornelli and Goldreich find that orderbooks contain information that is used to price bookbuiltdeals and that investors who provide information receivebetter allocations. Jenkinson and Jones use a differentsample of bookbuilt IPOs and conclude that the informa-tion extraction role of bookbuilding is limited. Kandel,Sarig, and Wohl (1999) analyze demand curves in Israeliauctioned IPOs. Liu, Wei, and Liaw (2001), Lin, Lee, and Liu(2007), and Chiang, Qian, and Sherman (2010) analyzebidding in Taiwanese auctioned IPOs. Taiwanese auc-tioned IPOs are discriminatory: Successful bidders pay theprice they bid. As such they are different from the USauctioned IPOs we study in this paper. In the US, theSecurities and Exchange Commission (SEC) requires thatall successful investors pay the same price (such auctionsare called ‘‘non-discriminatory’’ or ‘‘uniform-price’’).2
Our detailed bidding data from the universe of WRHambrecht auctioned IPOs enable us to weigh in empiricallyon the bookbuilding versus auction debate. There are twomain potential concerns about auctioned IPOs. First, the
2 Other empirical studies have compared bookbuilding and auctions
without using detailed bidding data. Using data from countries in which
several mechanisms were available, Derrien and Womack (2003),
Kaneko and Pettway (2003), and Kutsuna and Smith (2004) show lower
mean underpricing and lower fees for auctioned versus bookbuilt IPOs.
Jagannathan, Jirnyi, and Sherman (2009) take a more global approach
and show that virtually every country that has allowed issuers to use
auctions has abandoned this mechanism. Degeorge, Derrien, and
Womack (2007) argue that the search for better analyst coverage could
explain the willingness of issuers to choose bookbuilding over auctions,
in spite of the higher fees and underpricing associated with book-
building. Ritter and Welch (2002) and Loughran and Ritter (2002)
discuss agency problems that can arise with bookbuilding. Several
studies have analyzed Treasury auctions, which are different from IPOs,
as information extraction is not a primary concern (Back and Zender,
1993; Nyborg, Rydqvist, and Sundaresan, 2002; Keloharju, Nyborg, and
Rydqvist, 2005).
nondiscriminatory feature of auctioned IPOs in the UScould create an incentive for uninformed investors to placebids at very high prices (quasi-market orders), effectivelyfree-riding on informed investors’ information. Widespreadfree-riding might disrupt the price discovery process.Furthermore, if informed bidders, who generate a positiveprice-discovery externality, cannot be compensated bybeing given preferential allocations of underpriced shares,few bidders might choose to become informed. Second, therole of the underwriter is more limited in auctions than inbookbuilding, which could reduce the underwriter’s incen-tive to actively promote the IPO, hence creating a risk ofunexpectedly low participation. We examine these twoissues empirically and conclude that these concerns arelargely unwarranted.
We do find some evidence of free-riding. Retail investorsare much more likely than institutional investors to placehigh � presumably, uninformative � bids. However, free-riding by retail investors does not impede the auctioned IPOmechanism’s ability to extract information from investors.We construct the demand curves for our sample ofauctioned IPOs, and we argue, as others before us have,that a high elasticity of the demand curve is indicative ofhigh information content in investors’ bids (see, for instance,Kandel, Sarig, and Wohl, 1999). We find that the demandcurves in our US sample are on average more elastic thanthose estimated in previous studies of bookbuilt deals. Usinga conservative definition of the price elasticity of demand(the absolute value of the relative change in the number ofshares demanded when the price goes up by 25 cents fromthe clearing price), we find a median value of about 14 inour sample. Using a different definition of elasticity, Cornelliand Goldreich (2003) report a median value of 3.6 in theirsample of European bookbuilt IPOs. In our US sample, usingtheir definition, we find a median value of 34.6. We alsofind, importantly, that the demand curve for institutionalinvestors is much more elastic than that of retail investors.We conclude that, in spite of evidence of some free-riding byretail investors, WR Hambrecht’s IPO auction mechanism issuccessful at eliciting pricing information from institutionalinvestors.
We also find that auctioned IPOs attract strong participa-tion from institutional investors. Institutions account forabout 84% of demand in dollar value, and they receive about87% of the shares offered in the IPO, on average. Moreover,the main driver of participation is the size of the deal, acharacteristic that is known to all before the deal is marketed,which suggests that participation is largely predictable.
The spirit of auctions is to allow investor bids todetermine the price. But in seven out of 19 deals, theinvestment banker, WR Hambrecht, and the issuer chosean IPO price at a discount to the auction clearing price. Wefind that a discount was more likely and larger when theclearing price was affected by high bids (and thereforelikely to contain froth), when there was less investorconsensus in the demand curve, and when many largebids were just below the clearing price (consistent with adesire by the issuers to allocate shares to large investorswho bid slightly below the clearing price).
A desirable property of an IPO selling mechanism is itsability to place shares in safe hands, that is, with investors
F. Degeorge et al. / Journal of Financial Economics 98 (2010) 177–194 179
who are unlikely to resell them immediately after theoffering (a practice known as ‘‘flipping’’). Flipping is mostly aconcern in ‘‘cold’’ deals � that is, deals with poor initialstock price performance � because it effectively forces theunderwriter to buy back shares or possibly see the sharessuffer significant price declines. We find that the amount offlipping in these auctioned IPOs, defined as initial allocantsselling shares within one month of the IPO, is at mostcomparable to that shown for US bookbuilt IPOs. However,for auctioned IPOs, flipping is not more prevalent in ‘‘hot’’deals, in contrast to the patterns shown in US bookbuilt IPOs(Aggarwal, 2003). We conjecture that it could be harder todiscourage investors from flipping cold auctioned IPOs,perhaps because the IPO auction mechanism rules preventthe underwriter from punishing flippers by withdrawingallocations in future deals.
When we extend the time horizon to examine whetherinitial allocants still report holding 6 months after the IPO,we find no difference between cold and hot deals, andinitial allocants in auctioned IPOs seem to hold theirshares somewhat longer than in the bookbuilt IPOsstudied by Ritter and Zhang (2007).
Interestingly, while the allocation of shares in WRHambrecht IPO auctions is not discriminatory, we findthat retail investors get a higher proportion of the worstperforming deals. This suggests that informational free-riding by retail investors, potentially at the expense ofinstitutions, does not curtail institutions’ informationaladvantage. Institutions appear to be compensated for theinformation they provide in the pricing process.
In a nutshell, our results suggest that free-riding happensin auctioned IPOs, but it does not wreck the mechanism.Auctioned IPOs exhibit strong and predictable institutionalparticipation and highly elastic demand curves, indicatinghigh information content in the bids. Institutions arecompensated for the information they provide in the formof higher returns than those retail investors obtain. Ourresults imply that the auction IPO mechanism is an effectivealternative to traditional bookbuilding.
The remainder of the paper is organized as follows.Section 2 describes the OpenIPO mechanism used in WRHambrecht auctioned IPOs. Section 3 presents the data.Section 4 reports summary statistics of our sample.Sections 5–10 report our results on bidding, investorparticipation, the elasticity of the demand curves, pricing,flipping, and investor returns. Section 11 concludes.
4 There is only one exception to this allocation rule in the 19 IPOs of
our sample. In the Andover.net IPO, in December 1999, the IPO price was
set at $18, but only investors with bids at or above $24 received shares.5 The allocation rule is such that investors always receive round lots.
2. The IPO auction mechanism
WR Hambrecht’s OpenIPO mechanism works as fol-lows. First, WR Hambrecht announces the number ofshares to be offered to the public as well as an indicativeprice range, and it organizes a road show in which thedeal is presented to institutional investors, similar to thefamiliar bookbuilding approach.3 The auction opens
3 Retail investors have access to an electronic version of the
roadshow. In December 2005, www.retailroadshow.com started provid-
ing access to most roadshows for both bookbuilt and auctioned IPOs in
the US.
approximately two weeks before the scheduled IPO date.Investors can then submit price and quantity bids.Investors can submit multiple bids at tiered price levels,and bid prices can be outside the indicative price range.Bids can be canceled or modified until the auction closes,which immediately precedes the pricing of the deal.
When the auction closes, WR Hambrecht constructs ademand curve and calculates the clearing price, which is thehighest price at which the number of shares asked for is atleast equal to the number of shares offered (including sharesin the overallotment option if the underwriter decides toexercise this option). WR Hambrecht then meets with theissuer to decide on the IPO price, which can be at or belowthe clearing price. Such auctions, in which the price can beset below the clearing price, are sometimes called ‘‘dirtyDutch’’ auctions. The issuer can also decide to adjust thenumber of shares offered to the public. Price and quantityadjustments are limited by a SEC rule that specifies that theissuer needs to refile the IPO if the proceeds (IPO pricemultiplied by the number of shares offered) differ from theproceeds announced in the last pre-IPO prospectus by morethan 20%. Once the price has been chosen, investors who bidat or above the IPO price receive shares at the chosen price.4
When there is excess demand at the price chosen for theIPO, investors receive shares on a pro rata basis.5
Loughran, Ritter, and Rydqvist (1994) categorize IPOselling mechanisms on the basis of two criteria. First, isthe offer price set before or after information about thestate of demand is acquired? Second, do underwritershave discretion in the allocation of shares? Both auctionsand bookbuilding set the offer price after information isacquired, but they differ on the dimension of underwriterdiscretion in share allocation. The other features of theIPOs in our sample are similar to those observed intraditional US IPOs. For example, in all of the IPOs in oursample the underwriter receives an overallotment option.In 17 out of 19, pre-IPO shareholders have 180-daylockups, and 18 of them are firm-commitment deals.
3. The data
For the 19 auctioned IPOs in which WR Hambrecht wasthe lead underwriter between 1999 and 2007, we havethe demand schedule from all investors at the time of theclosing of the auction process. The data contain thefollowing information, for each of the bids in the demandschedule:
(1)
Due
and
rece
gina
subm
wha
The type of broker through which the investorsubmitted his bids. There are typically five broker
to this rule, in case of excess demand investors with similar price
quantity bids (in particular, investors who submit small bids) can
ive slightly different allocations. However, apart from these mar-
l adjustments, investors are treated equally, i.e., two investors that
it the same bid have the same ex ante expected allocation,
tever their identity.
6
WR7
Agga8
bear
F. Degeorge et al. / Journal of Financial Economics 98 (2010) 177–194180
types: ‘‘WRH institutional,’’ ‘‘WRH Middle Markets,’’and ‘‘WRH retail’’ are used for bids submitted directlyto WR Hambrecht by institutional investors, middlemarket investors (typically small institutions), andretail investors, respectively. The ‘‘Co-Managers’’ labelis used for bids submitted through one of the co-managers of the deal. Finally, the ‘‘Selling Group’’ labelis used for investors who submit their bids throughother brokers who participate in the deal as sellinggroup members.
(2)
The identity of investors. The data set contains thename of institutional investors that place their bidsthrough the ‘‘WRH institutional,’’ ‘‘WRH MiddleMarkets,’’ and ‘‘Co-Managers’’ channels in 16 deals,which allows us to follow the bidding of institutionalinvestors across these deals.6 When investors bidthrough selling group members, they are identifiedwith codes, so we do not know the investor’s identityor type (institution or retail). The names of retailinvestors are not included.(3)
The bids submitted by investors. For each bid, weobserve the number of shares and the price of the bid,as well as the allocation received.We obtain data on the characteristics of the IPOs fromfinal prospectuses and data on aftermarket prices andtrading volumes from the Center for Research in SecurityPrices (CRSP). Finally, for a subsample of 11 IPOs, we haveaccess to flipping reports, which indicate whether in-vestors who received shares in the IPO sell these shares inthe month following the offering. The Depositary TrustCorp. (DTC) collects these data from all the selling groupmembers and sends them to WR Hambrecht.7 Forinstitutional investors that bought their shares throughWR Hambrecht and co-managers, flipping reports containthe identity of the investor and the number of sharesflipped within 30 days of the IPO. For retail investors whobid directly through WR Hambrecht and for all investorsthat bid through selling group members, flipping reportscontain the aggregate amount of flipping.
4. Summary statistics
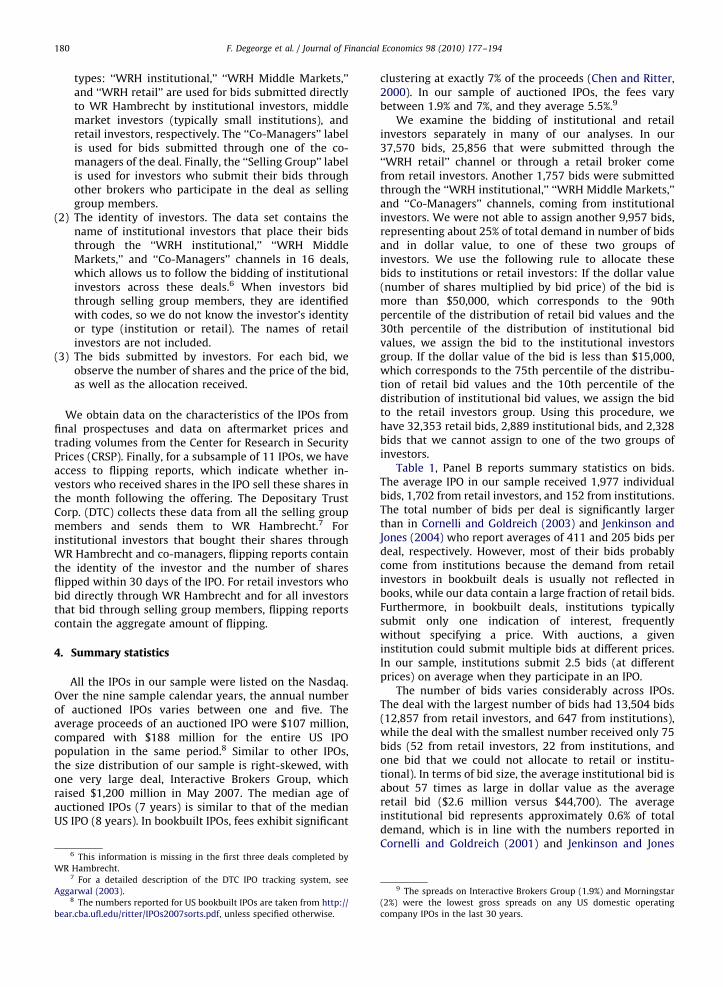
All the IPOs in our sample were listed on the Nasdaq.Over the nine sample calendar years, the annual numberof auctioned IPOs varies between one and five. Theaverage proceeds of an auctioned IPO were $107 million,compared with $188 million for the entire US IPOpopulation in the same period.8 Similar to other IPOs,the size distribution of our sample is right-skewed, withone very large deal, Interactive Brokers Group, whichraised $1,200 million in May 2007. The median age ofauctioned IPOs (7 years) is similar to that of the medianUS IPO (8 years). In bookbuilt IPOs, fees exhibit significant
This information is missing in the first three deals completed by
Hambrecht.
For a detailed description of the DTC IPO tracking system, see
rwal (2003).
The numbers reported for US bookbuilt IPOs are taken from http://
.cba.ufl.edu/ritter/IPOs2007sorts.pdf, unless specified otherwise.
clustering at exactly 7% of the proceeds (Chen and Ritter,2000). In our sample of auctioned IPOs, the fees varybetween 1.9% and 7%, and they average 5.5%.9
We examine the bidding of institutional and retailinvestors separately in many of our analyses. In our37,570 bids, 25,856 that were submitted through the‘‘WRH retail’’ channel or through a retail broker comefrom retail investors. Another 1,757 bids were submittedthrough the ‘‘WRH institutional,’’ ‘‘WRH Middle Markets,’’and ‘‘Co-Managers’’ channels, coming from institutionalinvestors. We were not able to assign another 9,957 bids,representing about 25% of total demand in number of bidsand in dollar value, to one of these two groups ofinvestors. We use the following rule to allocate thesebids to institutions or retail investors: If the dollar value(number of shares multiplied by bid price) of the bid ismore than $50,000, which corresponds to the 90thpercentile of the distribution of retail bid values and the30th percentile of the distribution of institutional bidvalues, we assign the bid to the institutional investorsgroup. If the dollar value of the bid is less than $15,000,which corresponds to the 75th percentile of the distribu-tion of retail bid values and the 10th percentile of thedistribution of institutional bid values, we assign the bidto the retail investors group. Using this procedure, wehave 32,353 retail bids, 2,889 institutional bids, and 2,328bids that we cannot assign to one of the two groups ofinvestors.
Table 1, Panel B reports summary statistics on bids.The average IPO in our sample received 1,977 individualbids, 1,702 from retail investors, and 152 from institutions.The total number of bids per deal is significantly largerthan in Cornelli and Goldreich (2003) and Jenkinson andJones (2004) who report averages of 411 and 205 bids perdeal, respectively. However, most of their bids probablycome from institutions because the demand from retailinvestors in bookbuilt deals is usually not reflected inbooks, while our data contain a large fraction of retail bids.Furthermore, in bookbuilt deals, institutions typicallysubmit only one indication of interest, frequentlywithout specifying a price. With auctions, a giveninstitution could submit multiple bids at different prices.In our sample, institutions submit 2.5 bids (at differentprices) on average when they participate in an IPO.
The number of bids varies considerably across IPOs.The deal with the largest number of bids had 13,504 bids(12,857 from retail investors, and 647 from institutions),while the deal with the smallest number received only 75bids (52 from retail investors, 22 from institutions, andone bid that we could not allocate to retail or institu-tional). In terms of bid size, the average institutional bid isabout 57 times as large in dollar value as the averageretail bid ($2.6 million versus $44,700). The averageinstitutional bid represents approximately 0.6% of totaldemand, which is in line with the numbers reported inCornelli and Goldreich (2001) and Jenkinson and Jones
9 The spreads on Interactive Brokers Group (1.9%) and Morningstar
(2%) were the lowest gross spreads on any US domestic operating
company IPOs in the last 30 years.
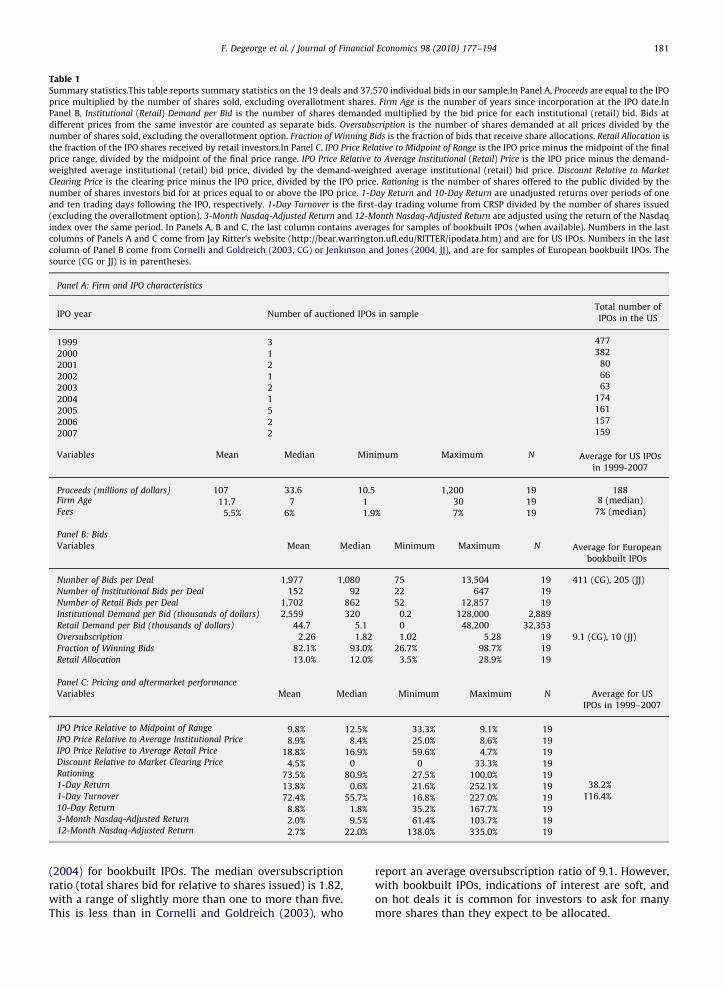
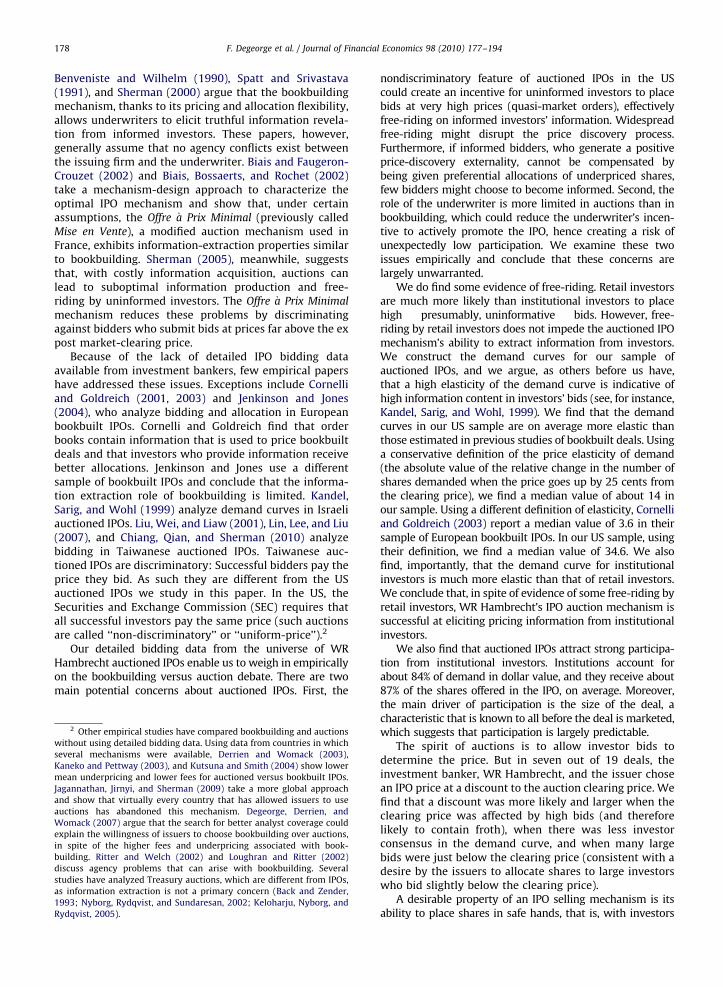
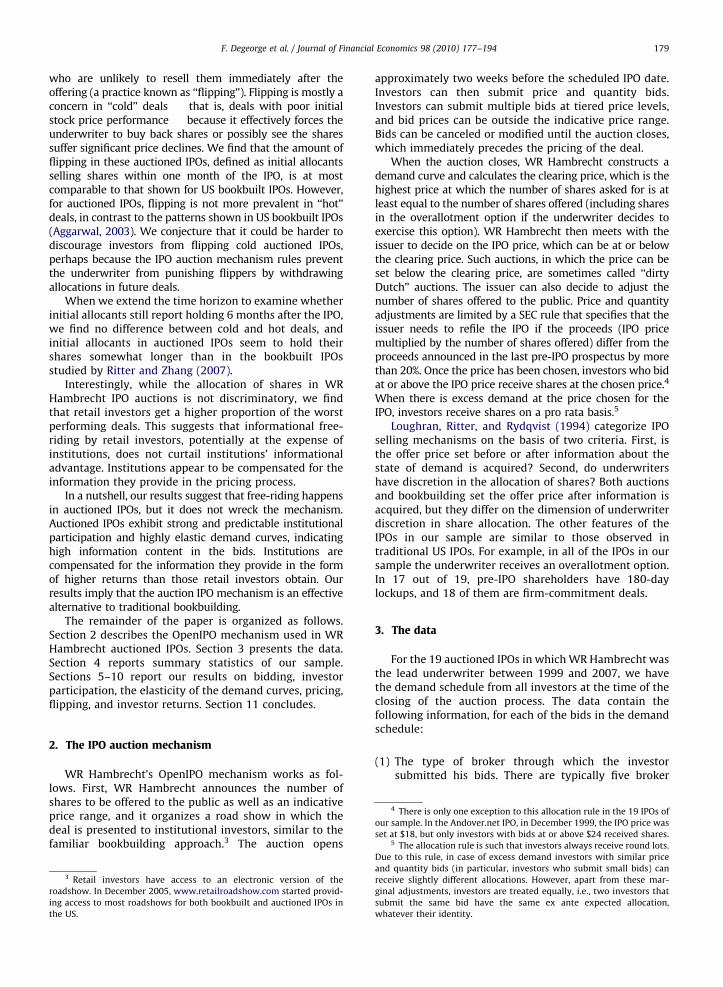
Table 1Summary statistics.This table reports summary statistics on the 19 deals and 37,570 individual bids in our sample.In Panel A, Proceeds are equal to the IPO
price multiplied by the number of shares sold, excluding overallotment shares. Firm Age is the number of years since incorporation at the IPO date.In
Panel B, Institutional (Retail) Demand per Bid is the number of shares demanded multiplied by the bid price for each institutional (retail) bid. Bids at
different prices from the same investor are counted as separate bids. Oversubscription is the number of shares demanded at all prices divided by the
number of shares sold, excluding the overallotment option. Fraction of Winning Bids is the fraction of bids that receive share allocations. Retail Allocation is
the fraction of the IPO shares received by retail investors.In Panel C, IPO Price Relative to Midpoint of Range is the IPO price minus the midpoint of the final
price range, divided by the midpoint of the final price range. IPO Price Relative to Average Institutional (Retail) Price is the IPO price minus the demand-
weighted average institutional (retail) bid price, divided by the demand-weighted average institutional (retail) bid price. Discount Relative to Market
Clearing Price is the clearing price minus the IPO price, divided by the IPO price. Rationing is the number of shares offered to the public divided by the
number of shares investors bid for at prices equal to or above the IPO price. 1-Day Return and 10-Day Return are unadjusted returns over periods of one
and ten trading days following the IPO, respectively. 1-Day Turnover is the first-day trading volume from CRSP divided by the number of shares issued
(excluding the overallotment option). 3-Month Nasdaq-Adjusted Return and 12-Month Nasdaq-Adjusted Return are adjusted using the return of the Nasdaq
index over the same period. In Panels A, B and C, the last column contains averages for samples of bookbuilt IPOs (when available). Numbers in the last
columns of Panels A and C come from Jay Ritter’s website (http://bear.warrington.ufl.edu/RITTER/ipodata.htm) and are for US IPOs. Numbers in the last
column of Panel B come from Cornelli and Goldreich (2003, CG) or Jenkinson and Jones (2004, JJ), and are for samples of European bookbuilt IPOs. The
source (CG or JJ) is in parentheses.
Panel A: Firm and IPO characteristics
IPO year Number of auctioned IPOs in sampleTotal number of
IPOs in the US
1999 3 477
2000 1 382
2001 2 80
2002 1 66
2003 2 63
2004 1 174
2005 5 161
2006 2 157
2007 2 159
Variables Mean Median Minimum Maximum N Average for US IPOs
in 1999-2007
Proceeds (millions of dollars) 107 33.6 10.5 1,200 19 188Firm Age 11.7 7 1 30 19 8 (median)
Fees 5.5% 6% 1.9% 7% 19 7% (median)
Panel B: Bids
Variables Mean Median Minimum Maximum N Average for European
bookbuilt IPOs
Number of Bids per Deal 1,977 1,080 75 13,504 19 411 (CG), 205 (JJ)
Number of Institutional Bids per Deal 152 92 22 647 19
Number of Retail Bids per Deal 1,702 862 52 12,857 19
Institutional Demand per Bid (thousands of dollars) 2,559 320 0.2 128,000 2,889
Retail Demand per Bid (thousands of dollars) 44.7 5.1 0 48,200 32,353
Oversubscription 2.26 1.82 1.02 5.28 19 9.1 (CG), 10 (JJ)
Fraction of Winning Bids 82.1% 93.0% 26.7% 98.7% 19
Retail Allocation 13.0% 12.0% 3.5% 28.9% 19
Panel C: Pricing and aftermarket performance
Variables Mean Median Minimum Maximum N Average for US
IPOs in 1999–2007
IPO Price Relative to Midpoint of Range �9.8% �12.5% �33.3% 9.1% 19IPO Price Relative to Average Institutional Price �8.9% �8.4% �25.0% 8.6% 19IPO Price Relative to Average Retail Price �18.8% �16.9% �59.6% 4.7% 19Discount Relative to Market Clearing Price 4.5% 0 0 33.3% 19Rationing 73.5% 80.9% 27.5% 100.0% 191-Day Return 13.8% 0.6% �21.6% 252.1% 19 38.2%
1-Day Turnover 72.4% 55.7% 16.8% 227.0% 19 116.4%
10-Day Return 8.8% 1.8% �35.2% 167.7% 193-Month Nasdaq-Adjusted Return �2.0% �9.5% �61.4% 103.7% 1912-Month Nasdaq-Adjusted Return �2.7% �22.0% �138.0% 335.0% 19
F. Degeorge et al. / Journal of Financial Economics 98 (2010) 177–194 181
(2004) for bookbuilt IPOs. The median oversubscriptionratio (total shares bid for relative to shares issued) is 1.82,with a range of slightly more than one to more than five.This is less than in Cornelli and Goldreich (2003), who
report an average oversubscription ratio of 9.1. However,with bookbuilt IPOs, indications of interest are soft, andon hot deals it is common for investors to ask for manymore shares than they expect to be allocated.
F. Degeorge et al. / Journal of Financial Economics 98 (2010) 177–194182
On average, retail investors account for 80.3% of thewinning bids but receive only 13% of the shares sold inthe auction, due to the smaller size of their bids. Thus,even though auctioned IPOs are open to retail investors,they are effectively dominated by institutions, liketraditional bookbuilt IPOs. In that respect, US auctionedIPOs differ from their Taiwanese counterparts, in whichretail investors receive about 80% of the shares sold onaverage (Chiang, Qian, and Sherman, 2010). Japaneseauctions were also dominated by retail investors,partly due to government-induced rules that severelyconstrained the ability of institutions to participate(see Pettway, Thosar, and Walker, 2008; Kaneko andPettway, 2003).
Table 1, Panel C reports statistics on pricing andaftermarket performance of the 19 auctioned IPOs. Theaverage IPO is priced approximately 10% below themidpoint of its final price range, 9% below the demand-weighted average institutional bid price, and 19% belowthe average retail bid price and is discounted by 4.5%relative to the auction clearing price.10 Seven deals werediscounted, and 12 were priced at their clearing price. Theaverage first-day return is 13.8%. This is less than averageIPO underpricing in the US in 1999–2007 (38.2%). Medianunderpricing, however, is close to zero. The differencebetween the median and the mean is due to one outlier,Andover.net, which had a first-day return of 252%.11
When we drop this observation, the average first-dayreturn decreases to 0.6%.12 First-day turnover is 72% onaverage, compared with 116% for the entire universe of USIPOs in 1999–2007. Similar to US IPOs in general, first-dayturnover was much higher in 1999–2000 (141% versus149% for US IPOs) than in 2001–2007 (54% versus 84% forUS IPOs). Three- and 12-month Nasdaq-adjusted returnsare slightly negative on average (�2.0% and �2.7%,respectively) and exhibit very large variance.13 This issimilar to the results of many studies of long-term post-IPO performance in and outside the United States.
5. Bidding and the potential for free-riding
Investors who receive shares in auctioned IPOs all paythe same price regardless of their bid. This uniform-pricerequirement is mandated by the SEC and applies to allsales of securities to the general public. It gives investorsan incentive to place market orders to free-ride on the
10 To compute the clearing price, we use the actual number of shares
sold in the IPO, including overallotment shares.11 Andover.net was the first Linux operating system company to go
public. Its initial public offering occurred on December 8, 1999, 1 day
before that of its competitor, VA Linux, which used the bookbuilding
method and had a 697% first-day return. Andover’s offer price was the
maximum possible without refiling. Andover chose to set this offer price
(even though the clearing price was considerably higher) because the
company viewed a one-day delay as important given the VA Linux deal.12 The three other US auctioned IPOs were priced further from their
aftermarket price. Google and Netsuite jumped by 18.0% and 36.5%,
respectively, and Rackspace dropped by 19.9% on their first trading day.13 Two firms (Andover.net and Nogatech) were acquired and
delisted before the first anniversary of their IPO. Their 12-month
performance is calculated at their delisting date.
valuation homework of other investors and to benefitfrom the possible underpricing of the IPO. While actualmarket orders are not permitted in auctioned IPOs,investors can submit quasi-market orders by placing bidsat very high prices. If free riding were widespread inauctioned IPOs, it might result in uninformative demandcurves and mispriced shares.
For investors bidding for a large quantity of shares,such as institutions, the incentive to free-ride is temperedby the concern that their bid might inflate the auctionclearing price. Thus, IPO investors in auctions face adilemma. All would like to free ride on each other’sinformation. But only retail investors can safely do sobecause their small bids are unlikely to move up the price.Accordingly, we expect retail investors to be much morelikely to place high bids than institutional investors.
The issuing firm has to refile with the SEC if changes inprice or quantity alter realized proceeds by more than 20%relative to the indicated proceeds in the initial prospectus.Hence, an investor bidding at a price that exceeds the top ofthe price range by more than 20% is almost certain toreceive shares. Thereafter we define such bids as ‘‘high bids.’’
Table 2, Panel A confirms that retail investors are moreprone to place high bids. Averaging across deals, 9.7% ofbids placed by retail investors were high, versus 6% forinstitutions when the percentages are computed as thenumber of bids (when the percentages are computed indollar value, the percentages are 16.5% for retail versus6.5% for institutional bids). These percentages are variableacross deals, raising the question of which dealcharacteristics are associated with high bidding behavior.
Table 2, Panel B presents the results of logit regressionsmodeling the probability of placing a high bid as afunction of deal and investor characteristics. The unit ofobservation for these regressions is a bid, and thedependent variable is an indicator variable equal to oneif the bid is high (i.e., at a price that exceeds the top of theprice range by more than 20%) and zero otherwise. Fixingthe explanatory variables at their means, the base rateprobability of a retail investor bidding high is 6%, versus2% for an institutional investor. Consistent with theunivariate results, retail investors are more likely to placehigh bids than institutional investors.
Institutional investors bidding for larger amounts areless likely to bid high. For them, a one standard deviationincrease in Log(Bid Size) is associated with about a onepercentage point decrease in the probability of a high bid.This finding supports the idea that institutional investorsmaking large bids are concerned that their bids mightraise the offering price.
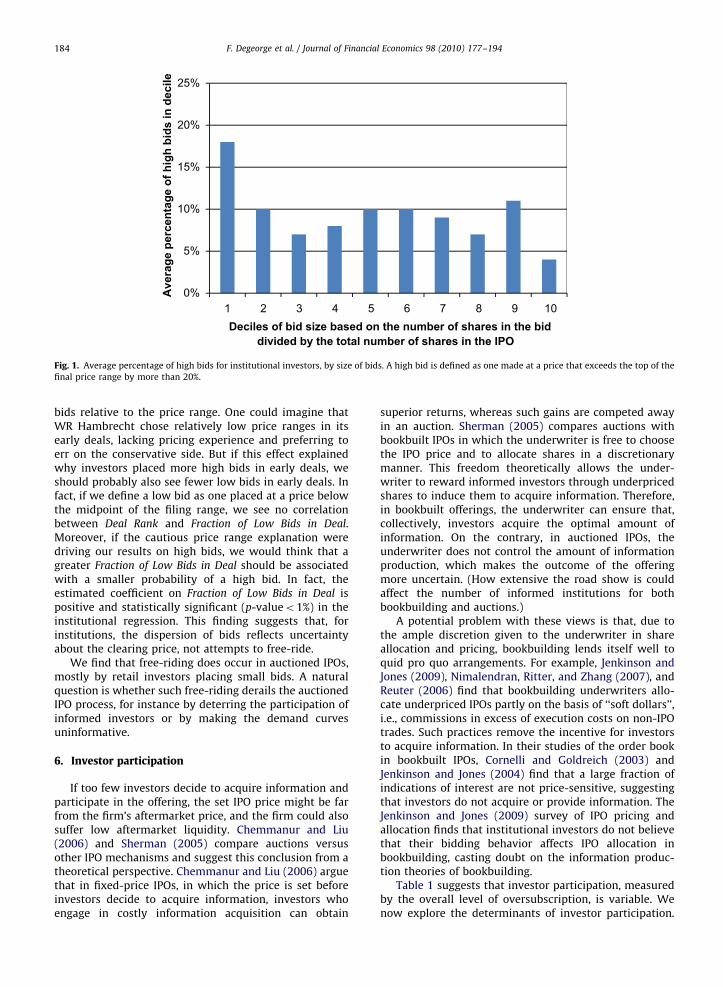
The concern of institutional investors that their bidmight increase the clearing price should be mostprevalent for the largest bid sizes. In the median deal,when bids are ranked by size (in number of shares), the90th percentile institutional bid represents about 5% oftotal demand and is about ten times the size of the 50thpercentile institutional bid. Thus, the median institutionalbidder is unlikely to affect the IPO price, but the largest(90th percentile) institutional bidders are likely to affectit. To check this intuition we split institutional bids intobid size deciles, and we compute the mean percentage of
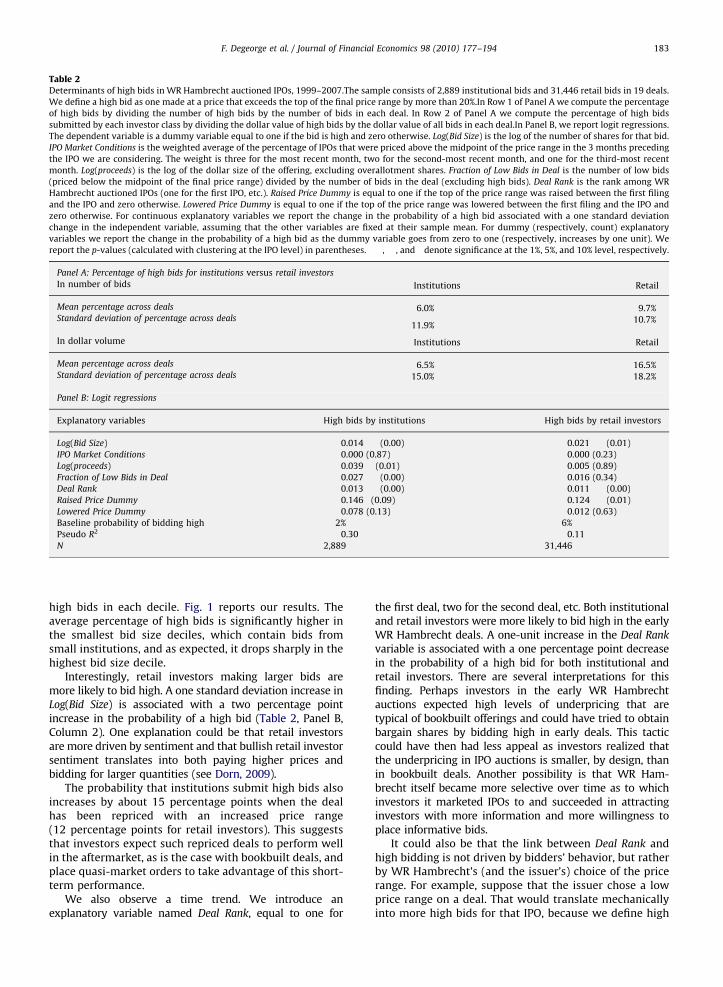
Table 2Determinants of high bids in WR Hambrecht auctioned IPOs, 1999–2007.The sample consists of 2,889 institutional bids and 31,446 retail bids in 19 deals.
We define a high bid as one made at a price that exceeds the top of the final price range by more than 20%.In Row 1 of Panel A we compute the percentage
of high bids by dividing the number of high bids by the number of bids in each deal. In Row 2 of Panel A we compute the percentage of high bids
submitted by each investor class by dividing the dollar value of high bids by the dollar value of all bids in each deal.In Panel B, we report logit regressions.
The dependent variable is a dummy variable equal to one if the bid is high and zero otherwise. Log(Bid Size) is the log of the number of shares for that bid.
IPO Market Conditions is the weighted average of the percentage of IPOs that were priced above the midpoint of the price range in the 3 months preceding
the IPO we are considering. The weight is three for the most recent month, two for the second-most recent month, and one for the third-most recent
month. Log(proceeds) is the log of the dollar size of the offering, excluding overallotment shares. Fraction of Low Bids in Deal is the number of low bids
(priced below the midpoint of the final price range) divided by the number of bids in the deal (excluding high bids). Deal Rank is the rank among WR
Hambrecht auctioned IPOs (one for the first IPO, etc.). Raised Price Dummy is equal to one if the top of the price range was raised between the first filing
and the IPO and zero otherwise. Lowered Price Dummy is equal to one if the top of the price range was lowered between the first filing and the IPO and
zero otherwise. For continuous explanatory variables we report the change in the probability of a high bid associated with a one standard deviation
change in the independent variable, assuming that the other variables are fixed at their sample mean. For dummy (respectively, count) explanatory
variables we report the change in the probability of a high bid as the dummy variable goes from zero to one (respectively, increases by one unit). We
report the p-values (calculated with clustering at the IPO level) in parentheses. ���, ��, and � denote significance at the 1%, 5%, and 10% level, respectively.
Panel A: Percentage of high bids for institutions versus retail investors
In number of bids Institutions Retail
Mean percentage across deals 6.0% 9.7%Standard deviation of percentage across deals
11.9%10.7%
In dollar volume Institutions Retail
Mean percentage across deals 6.5% 16.5%Standard deviation of percentage across deals 15.0% 18.2%
Panel B: Logit regressions
Explanatory variables High bids by institutions High bids by retail investors
Log(Bid Size) �0.014��� (0.00) 0.021��� (0.01)
IPO Market Conditions 0.000 (0.87) �0.000 (0.23)
Log(proceeds) 0.039�� (0.01) �0.005 (0.89)
Fraction of Low Bids in Deal 0.027��� (0.00) 0.016 (0.34)
Deal Rank �0.013��� (0.00) �0.011��� (0.00)
Raised Price Dummy 0.146� (0.09) 0.124��� (0.01)
Lowered Price Dummy 0.078 (0.13) 0.012 (0.63)
Baseline probability of bidding high 2% 6%
Pseudo R2 0.30 0.11
N 2,889 31,446
F. Degeorge et al. / Journal of Financial Economics 98 (2010) 177–194 183
high bids in each decile. Fig. 1 reports our results. Theaverage percentage of high bids is significantly higher inthe smallest bid size deciles, which contain bids fromsmall institutions, and as expected, it drops sharply in thehighest bid size decile.
Interestingly, retail investors making larger bids aremore likely to bid high. A one standard deviation increase inLog(Bid Size) is associated with a two percentage pointincrease in the probability of a high bid (Table 2, Panel B,Column 2). One explanation could be that retail investorsare more driven by sentiment and that bullish retail investorsentiment translates into both paying higher prices andbidding for larger quantities (see Dorn, 2009).
The probability that institutions submit high bids alsoincreases by about 15 percentage points when the dealhas been repriced with an increased price range(12 percentage points for retail investors). This suggeststhat investors expect such repriced deals to perform wellin the aftermarket, as is the case with bookbuilt deals, andplace quasi-market orders to take advantage of this short-term performance.
We also observe a time trend. We introduce anexplanatory variable named Deal Rank, equal to one for
the first deal, two for the second deal, etc. Both institutionaland retail investors were more likely to bid high in the earlyWR Hambrecht deals. A one-unit increase in the Deal Rank
variable is associated with a one percentage point decreasein the probability of a high bid for both institutional andretail investors. There are several interpretations for thisfinding. Perhaps investors in the early WR Hambrechtauctions expected high levels of underpricing that aretypical of bookbuilt offerings and could have tried to obtainbargain shares by bidding high in early deals. This tacticcould have then had less appeal as investors realized thatthe underpricing in IPO auctions is smaller, by design, thanin bookbuilt deals. Another possibility is that WR Ham-brecht itself became more selective over time as to whichinvestors it marketed IPOs to and succeeded in attractinginvestors with more information and more willingness toplace informative bids.
It could also be that the link between Deal Rank andhigh bidding is not driven by bidders’ behavior, but ratherby WR Hambrecht’s (and the issuer’s) choice of the pricerange. For example, suppose that the issuer chose a lowprice range on a deal. That would translate mechanicallyinto more high bids for that IPO, because we define high
0%
5%
10%
15%
20%
25%
1Deciles of bid size based on the number of shares in the bid
divided by the total number of shares in the IPO
Ave
rage
per
cent
age
of h
igh
bids
in d
ecile
2 3 4 5 6 7 8 9 10
Fig. 1. Average percentage of high bids for institutional investors, by size of bids. A high bid is defined as one made at a price that exceeds the top of the
final price range by more than 20%.
F. Degeorge et al. / Journal of Financial Economics 98 (2010) 177–194184
bids relative to the price range. One could imagine thatWR Hambrecht chose relatively low price ranges in itsearly deals, lacking pricing experience and preferring toerr on the conservative side. But if this effect explainedwhy investors placed more high bids in early deals, weshould probably also see fewer low bids in early deals. Infact, if we define a low bid as one placed at a price belowthe midpoint of the filing range, we see no correlationbetween Deal Rank and Fraction of Low Bids in Deal.Moreover, if the cautious price range explanation weredriving our results on high bids, we would think that agreater Fraction of Low Bids in Deal should be associatedwith a smaller probability of a high bid. In fact, theestimated coefficient on Fraction of Low Bids in Deal ispositive and statistically significant (p-valueo1%) in theinstitutional regression. This finding suggests that, forinstitutions, the dispersion of bids reflects uncertaintyabout the clearing price, not attempts to free-ride.
We find that free-riding does occur in auctioned IPOs,mostly by retail investors placing small bids. A naturalquestion is whether such free-riding derails the auctionedIPO process, for instance by deterring the participation ofinformed investors or by making the demand curvesuninformative.
6. Investor participation
If too few investors decide to acquire information andparticipate in the offering, the set IPO price might be farfrom the firm’s aftermarket price, and the firm could alsosuffer low aftermarket liquidity. Chemmanur and Liu(2006) and Sherman (2005) compare auctions versusother IPO mechanisms and suggest this conclusion from atheoretical perspective. Chemmanur and Liu (2006) arguethat in fixed-price IPOs, in which the price is set beforeinvestors decide to acquire information, investors whoengage in costly information acquisition can obtain
superior returns, whereas such gains are competed awayin an auction. Sherman (2005) compares auctions withbookbuilt IPOs in which the underwriter is free to choosethe IPO price and to allocate shares in a discretionarymanner. This freedom theoretically allows the under-writer to reward informed investors through underpricedshares to induce them to acquire information. Therefore,in bookbuilt offerings, the underwriter can ensure that,collectively, investors acquire the optimal amount ofinformation. On the contrary, in auctioned IPOs, theunderwriter does not control the amount of informationproduction, which makes the outcome of the offeringmore uncertain. (How extensive the road show is couldaffect the number of informed institutions for bothbookbuilding and auctions.)
A potential problem with these views is that, due tothe ample discretion given to the underwriter in shareallocation and pricing, bookbuilding lends itself well toquid pro quo arrangements. For example, Jenkinson andJones (2009), Nimalendran, Ritter, and Zhang (2007), andReuter (2006) find that bookbuilding underwriters allo-cate underpriced IPOs partly on the basis of ‘‘soft dollars’’,i.e., commissions in excess of execution costs on non-IPOtrades. Such practices remove the incentive for investorsto acquire information. In their studies of the order bookin bookbuilt IPOs, Cornelli and Goldreich (2003) andJenkinson and Jones (2004) find that a large fraction ofindications of interest are not price-sensitive, suggestingthat investors do not acquire or provide information. TheJenkinson and Jones (2009) survey of IPO pricing andallocation finds that institutional investors do not believethat their bidding behavior affects IPO allocation inbookbuilding, casting doubt on the information produc-tion theories of bookbuilding.
Table 1 suggests that investor participation, measuredby the overall level of oversubscription, is variable. Wenow explore the determinants of investor participation.

F. Degeorge et al. / Journal of Financial Economics 98 (2010) 177–194 185
We make a distinction between institutional and retailparticipation, because the willingness and ability of thesetwo types of investors to generate information and thefactors that influence their decision to participate in anIPO could differ.
If participation depends on costly information acquisi-tion, then it should be higher when the IPO is less subject toinformation asymmetry, which should be the case for largerIPOs. For example, we would expect more interest frominstitutions in the large Morningstar IPO than for smalldeals such as Briazz. Over time, investors could also learnabout the OpenIPO process and fine-tune the cost-benefitanalysis of participation in auctioned IPOs, so we includeDeal Rank, the time rank of the deal, in our tests. Investors’willingness to participate in IPOs could also increase withstronger IPO market conditions (see, for example, Derrien,2005), so we include a measure of market conditions in theregressions. Our IPO Market Conditions variable is theweighted average of the percentage of IPOs (in the entirepopulation of US IPOs) that were priced above the midpointof the price range in the 3 months preceding the IPO we areconsidering. The weight is three for the most recent month,two for the second-most recent month, and one for thethird-most recent month.
Table 3 reports analyses of institutional and retailparticipation in Panels A and B, respectively. The unit ofobservation is the deal (N=19). In both panels, investorparticipation is the dependent variable, and we measureit as oversubscription, using the number of shares
Table 3Determinants of investor participation at the deal level.This table reports ordi
explanatory variables: Deal Rank is the rank among WR Hambrecht auctioned
average of the percentage of IPOs that were priced above the midpoint of the
weight is three for the most recent month, two for the second-most recent mont
dollar size of the offering, excluding overallotment shares. In Panel A, the depe
Institutional oversubscription (initial filing) is the number of shares demanded by
issuer in the first IPO filing. Institutional oversubscription (final) is the number of
shares offered by the issuer in the IPO prospectus. In Panel B, the depend
oversubscription (initial filing) is the total number of shares demanded by retail i
IPO filing. Retail oversubscription (final) is the total number of shares demanded b
the final IPO prospectus. We report p-values in parentheses. ���, ��, and � den
Panel A: Institutional participation
Explanatory variables Institutional ove
Deal Rank �0.066 (0.23)
IPO Market Conditions 0.730 (0.34)
Log(proceeds) 1.566��� (0.
Constant �25.034��� (0.
R2 0.62
R2 when tests are replicated without Log(proceeds) 0.08
N 19
Panel B: Retail participation
Explanatory variables Retail ove
Deal Rank �0.021 (0
IPO Market Conditions 0.393�
Log(proceeds) 0.330��
Constant �5.459��
R2 0.53
R2 when tests are replicated without Log(proceeds) 0.05
N 19
announced in the initial filing, as well as the finalnumber of shares announced.
The size of the deal is by far the main driver of bothinstitutional and retail participation. The coefficient onthe Log(proceeds) variable is statistically significant at the1% level for institutional participation and at the 5% levelfor retail participation. A 10% increase in the proceeds isassociated with an increase of nine percentage points ininstitutional oversubscription and two percentage pointsin retail oversubscription, which is economically signifi-cant compared with the average oversubscription of 226%reported in Table 1. This finding is consistent with thehypothesis that more information is produced in largerIPOs because information is relatively less costly toacquire for larger, more visible firms. The smallest dealsin our sample could also have failed to generate institu-tional interest because they were so small that they didnot allow institutions to meet their investment capitaliza-tion requirements (e.g., some institutions restrict invest-ments to firms with a market capitalization of at least$100 million). None of the other explanatory variables isconsistently significant in all regressions.
Interestingly, the R2 is high in all regressions (62% and51% in institutional participation regressions, 53% and 47%in retail participation tests), and it drops dramatically (to4�8%) when we exclude Log(proceeds) from the models.This implies that while participation is highly variable, it isalso predictable using firm and IPO characteristics knownbefore the deal, especially deal size.
nary least squares regressions of investor participation on the following
IPOs (one for the first IPO, etc.). IPO Market Conditions is the weighted
price range in the 3 months preceding the IPO we are considering. The
h, and one for the third-most recent month. Log(proceeds) is the log of the
ndent variables are two measures of institutional investor participation:
institutions (at all prices) divided by the number of shares offered by the
shares demanded by institutions (at all prices) divided by the number of
ent variables are two measures of retail investor participation: Retail
nvestors divided by the number of shares offered by the issuer in the first
y retail investors divided by the number of shares offered by the issuer in
ote significance at the 1%, 5%, and 10% level, respectively.
rsubscription (initial filing) Institutional oversubscription (final)
�0.054 (0.19)
0.658 (0.42)
01) 0.942��� (0.00)
01) �14.360��� (0.00)
0.51
0.04
19
rsubscription (initial filing) Retail oversubscription (final)
.14) �0.017 (0.13)
(0.07) 0.386� (0.08)
(0.03) 0.197�� (0.02)
(0.04) �3.188�� (0.03)
0.47
0.08
19
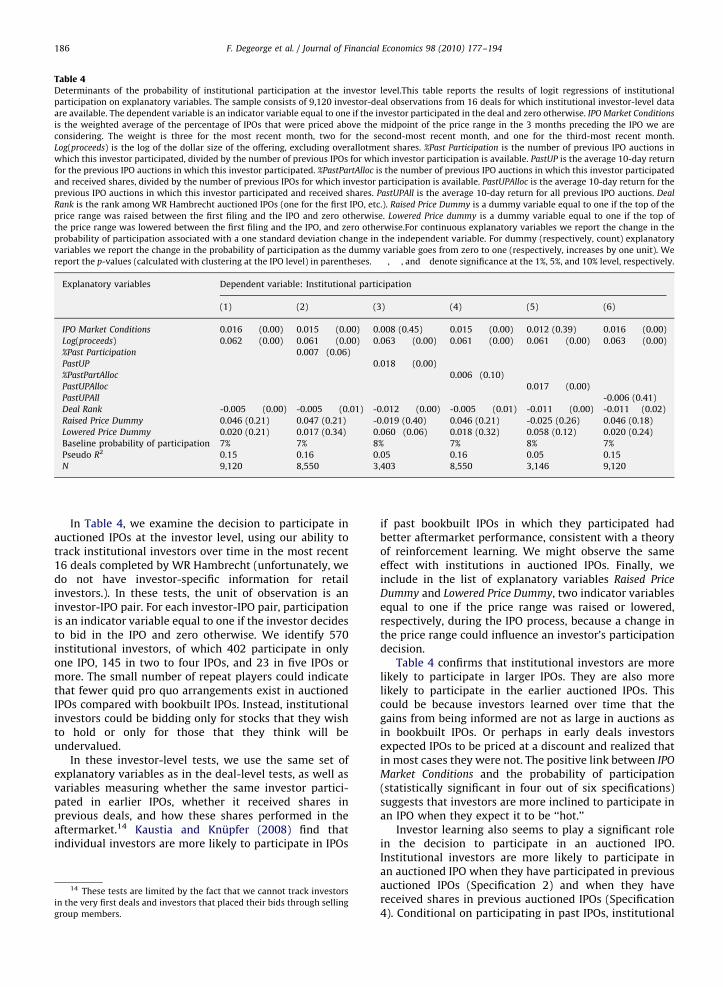
Table 4Determinants of the probability of institutional participation at the investor level.This table reports the results of logit regressions of institutional
participation on explanatory variables. The sample consists of 9,120 investor-deal observations from 16 deals for which institutional investor-level data
are available. The dependent variable is an indicator variable equal to one if the investor participated in the deal and zero otherwise. IPO Market Conditions
is the weighted average of the percentage of IPOs that were priced above the midpoint of the price range in the 3 months preceding the IPO we are
considering. The weight is three for the most recent month, two for the second-most recent month, and one for the third-most recent month.
Log(proceeds) is the log of the dollar size of the offering, excluding overallotment shares. %Past Participation is the number of previous IPO auctions in
which this investor participated, divided by the number of previous IPOs for which investor participation is available. PastUP is the average 10-day return
for the previous IPO auctions in which this investor participated. %PastPartAlloc is the number of previous IPO auctions in which this investor participated
and received shares, divided by the number of previous IPOs for which investor participation is available. PastUPAlloc is the average 10-day return for the
previous IPO auctions in which this investor participated and received shares. PastUPAll is the average 10-day return for all previous IPO auctions. Deal
Rank is the rank among WR Hambrecht auctioned IPOs (one for the first IPO, etc.). Raised Price Dummy is a dummy variable equal to one if the top of the
price range was raised between the first filing and the IPO and zero otherwise. Lowered Price dummy is a dummy variable equal to one if the top of
the price range was lowered between the first filing and the IPO, and zero otherwise.For continuous explanatory variables we report the change in the
probability of participation associated with a one standard deviation change in the independent variable. For dummy (respectively, count) explanatory
variables we report the change in the probability of participation as the dummy variable goes from zero to one (respectively, increases by one unit). We
report the p-values (calculated with clustering at the IPO level) in parentheses. ���, ��, and � denote significance at the 1%, 5%, and 10% level, respectively.
Explanatory variables Dependent variable: Institutional participation
(1) (2) (3) (4) (5) (6)
IPO Market Conditions 0.016��� (0.00) 0.015��� (0.00) 0.008 (0.45) 0.015��� (0.00) 0.012 (0.39) 0.016��� (0.00)
Log(proceeds) 0.062��� (0.00) 0.061��� (0.00) 0.063��� (0.00) 0.061��� (0.00) 0.061��� (0.00) 0.063��� (0.00)
%Past Participation 0.007� (0.06)
PastUP 0.018��� (0.00)
%PastPartAlloc 0.006� (0.10)
PastUPAlloc 0.017��� (0.00)
PastUPAll -0.006 (0.41)
Deal Rank -0.005��� (0.00) -0.005��� (0.01) -0.012��� (0.00) -0.005��� (0.01) -0.011��� (0.00) -0.011�� (0.02)
Raised Price Dummy 0.046 (0.21) 0.047 (0.21) -0.019 (0.40) 0.046 (0.21) -0.025 (0.26) 0.046 (0.18)
Lowered Price Dummy 0.020 (0.21) 0.017 (0.34) 0.060� (0.06) 0.018 (0.32) 0.058 (0.12) 0.020 (0.24)
Baseline probability of participation 7% 7% 8% 7% 8% 7%
Pseudo R2 0.15 0.16 0.05 0.16 0.05 0.15
N 9,120 8,550 3,403 8,550 3,146 9,120
F. Degeorge et al. / Journal of Financial Economics 98 (2010) 177–194186
In Table 4, we examine the decision to participate inauctioned IPOs at the investor level, using our ability totrack institutional investors over time in the most recent16 deals completed by WR Hambrecht (unfortunately, wedo not have investor-specific information for retailinvestors.). In these tests, the unit of observation is aninvestor-IPO pair. For each investor-IPO pair, participationis an indicator variable equal to one if the investor decidesto bid in the IPO and zero otherwise. We identify 570institutional investors, of which 402 participate in onlyone IPO, 145 in two to four IPOs, and 23 in five IPOs ormore. The small number of repeat players could indicatethat fewer quid pro quo arrangements exist in auctionedIPOs compared with bookbuilt IPOs. Instead, institutionalinvestors could be bidding only for stocks that they wishto hold or only for those that they think will beundervalued.
In these investor-level tests, we use the same set ofexplanatory variables as in the deal-level tests, as well asvariables measuring whether the same investor partici-pated in earlier IPOs, whether it received shares inprevious deals, and how these shares performed in theaftermarket.14 Kaustia and Knupfer (2008) find thatindividual investors are more likely to participate in IPOs
14 These tests are limited by the fact that we cannot track investors
in the very first deals and investors that placed their bids through selling
group members.
if past bookbuilt IPOs in which they participated hadbetter aftermarket performance, consistent with a theoryof reinforcement learning. We might observe the sameeffect with institutions in auctioned IPOs. Finally, weinclude in the list of explanatory variables Raised Price
Dummy and Lowered Price Dummy, two indicator variablesequal to one if the price range was raised or lowered,respectively, during the IPO process, because a change inthe price range could influence an investor’s participationdecision.
Table 4 confirms that institutional investors are morelikely to participate in larger IPOs. They are also morelikely to participate in the earlier auctioned IPOs. Thiscould be because investors learned over time that thegains from being informed are not as large in auctions asin bookbuilt IPOs. Or perhaps in early deals investorsexpected IPOs to be priced at a discount and realized thatin most cases they were not. The positive link between IPO
Market Conditions and the probability of participation(statistically significant in four out of six specifications)suggests that investors are more inclined to participate inan IPO when they expect it to be ‘‘hot.’’
Investor learning also seems to play a significant rolein the decision to participate in an auctioned IPO.Institutional investors are more likely to participate inan auctioned IPO when they have participated in previousauctioned IPOs (Specification 2) and when they havereceived shares in previous auctioned IPOs (Specification4). Conditional on participating in past IPOs, institutional
F. Degeorge et al. / Journal of Financial Economics 98 (2010) 177–194 187
investors are also more likely to participate when theprevious IPOs in which they did participate had higher10-day underpricing (specifications 3 and 5). The effect issignificant statistically and economically. A one standarddeviation increase in the average 10-day return of pastauctioned IPOs in which institutional investors partici-pated increases their probability of participating in agiven IPO by about two percentage points relative to anunconditional probability of about 8% (Specification 5).Thus, past experience with the auction mechanismand success with it are important ingredients in thedecision of institutional investors to participate in anauctioned IPO.
This section suggests that investor participation inauctioned IPOs is primarily a function of deal size. As dealsize is known to all before the IPO goes through, weinterpret this finding to mean that while variable acrossdeals, investor participation is largely predictable. Thusthe fact that auctioned IPOs allow less role for theunderwriter to drum up demand among investors neednot be a concern.
7. The elasticity of the demand curves
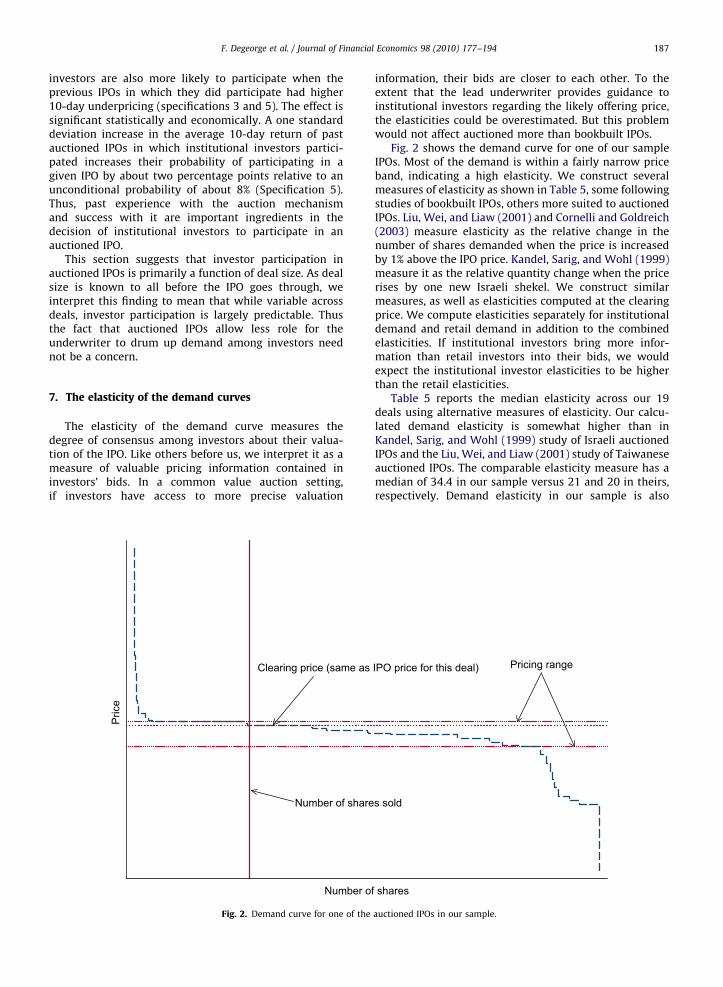
The elasticity of the demand curve measures thedegree of consensus among investors about their valua-tion of the IPO. Like others before us, we interpret it as ameasure of valuable pricing information contained ininvestors’ bids. In a common value auction setting,if investors have access to more precise valuation
Number of share
Clearing price (same as
Pric
e
Number o
Fig. 2. Demand curve for one of the
information, their bids are closer to each other. To theextent that the lead underwriter provides guidance toinstitutional investors regarding the likely offering price,the elasticities could be overestimated. But this problemwould not affect auctioned more than bookbuilt IPOs.
Fig. 2 shows the demand curve for one of our sampleIPOs. Most of the demand is within a fairly narrow priceband, indicating a high elasticity. We construct severalmeasures of elasticity as shown in Table 5, some followingstudies of bookbuilt IPOs, others more suited to auctionedIPOs. Liu, Wei, and Liaw (2001) and Cornelli and Goldreich(2003) measure elasticity as the relative change in thenumber of shares demanded when the price is increasedby 1% above the IPO price. Kandel, Sarig, and Wohl (1999)measure it as the relative quantity change when the pricerises by one new Israeli shekel. We construct similarmeasures, as well as elasticities computed at the clearingprice. We compute elasticities separately for institutionaldemand and retail demand in addition to the combinedelasticities. If institutional investors bring more infor-mation than retail investors into their bids, we wouldexpect the institutional investor elasticities to be higherthan the retail elasticities.
Table 5 reports the median elasticity across our 19deals using alternative measures of elasticity. Our calcu-lated demand elasticity is somewhat higher than inKandel, Sarig, and Wohl (1999) study of Israeli auctionedIPOs and the Liu, Wei, and Liaw (2001) study of Taiwaneseauctioned IPOs. The comparable elasticity measure has amedian of 34.4 in our sample versus 21 and 20 in theirs,respectively. Demand elasticity in our sample is also
s sold
Pricing rangeIPO price for this deal)
f shares
auctioned IPOs in our sample.
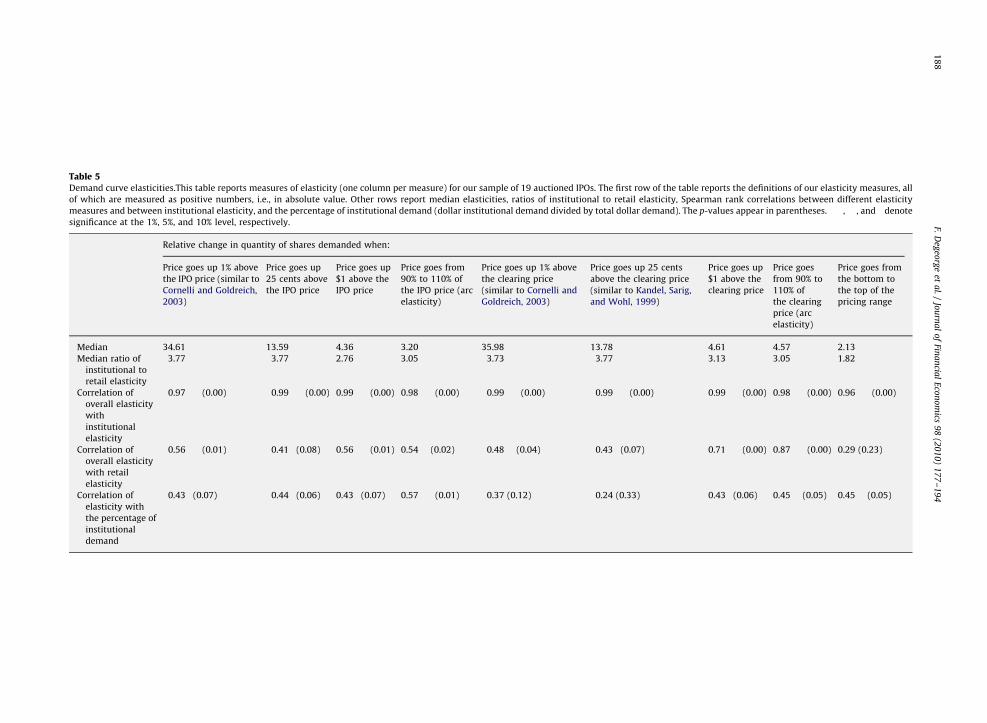
Table 5Demand curve elasticities.This table reports measures of elasticity (one column per measure) for our sample of 19 auctioned IPOs. The first row of the table reports the definitions of our elasticity measures, all
of which are measured as positive numbers, i.e., in absolute value. Other rows report median elasticities, ratios of institutional to retail elasticity, Spearman rank correlations between different elasticity
measures and between institutional elasticity, and the percentage of institutional demand (dollar institutional demand divided by total dollar demand). The p-values appear in parentheses. ���, ��, and � denote
significance at the 1%, 5%, and 10% level, respectively.
Relative change in quantity of shares demanded when:
Price goes up 1% above
the IPO price (similar to
Cornelli and Goldreich,
2003)
Price goes up
25 cents above
the IPO price
Price goes up
$1 above the
IPO price
Price goes from
90% to 110% of
the IPO price (arc
elasticity)
Price goes up 1% above
the clearing price
(similar to Cornelli and
Goldreich, 2003)
Price goes up 25 cents
above the clearing price
(similar to Kandel, Sarig,
and Wohl, 1999)
Price goes up
$1 above the
clearing price
Price goes
from 90% to
110% of
the clearing
price (arc
elasticity)
Price goes from
the bottom to
the top of the
pricing range
Median 34.61 13.59 4.36 3.20 35.98 13.78 4.61 4.57 2.13
Median ratio of
institutional to
retail elasticity
3.77 3.77 2.76 3.05 3.73 3.77 3.13 3.05 1.82
Correlation of
overall elasticity
with
institutional
elasticity
0.97��� (0.00) 0.99��� (0.00) 0.99��� (0.00) 0.98��� (0.00) 0.99��� (0.00) 0.99��� (0.00) 0.99��� (0.00) 0.98��� (0.00) 0.96��� (0.00)
Correlation of
overall elasticity
with retail
elasticity
0.56��� (0.01) 0.41� (0.08) 0.56��� (0.01) 0.54�� (0.02) 0.48�� (0.04) 0.43� (0.07) 0.71��� (0.00) 0.87��� (0.00) 0.29 (0.23)
Correlation of
elasticity with
the percentage of
institutional
demand
0.43� (0.07) 0.44� (0.06) 0.43� (0.07) 0.57��� (0.01) 0.37 (0.12) 0.24 (0.33) 0.43� (0.06) 0.45�� (0.05) 0.45�� (0.05)
F.D
egeo
rge
eta
l./
Jou
rna
lo
fFin
an
cial
Eco
no
mics
98
(20
10
)1
77
–1
94
18
8
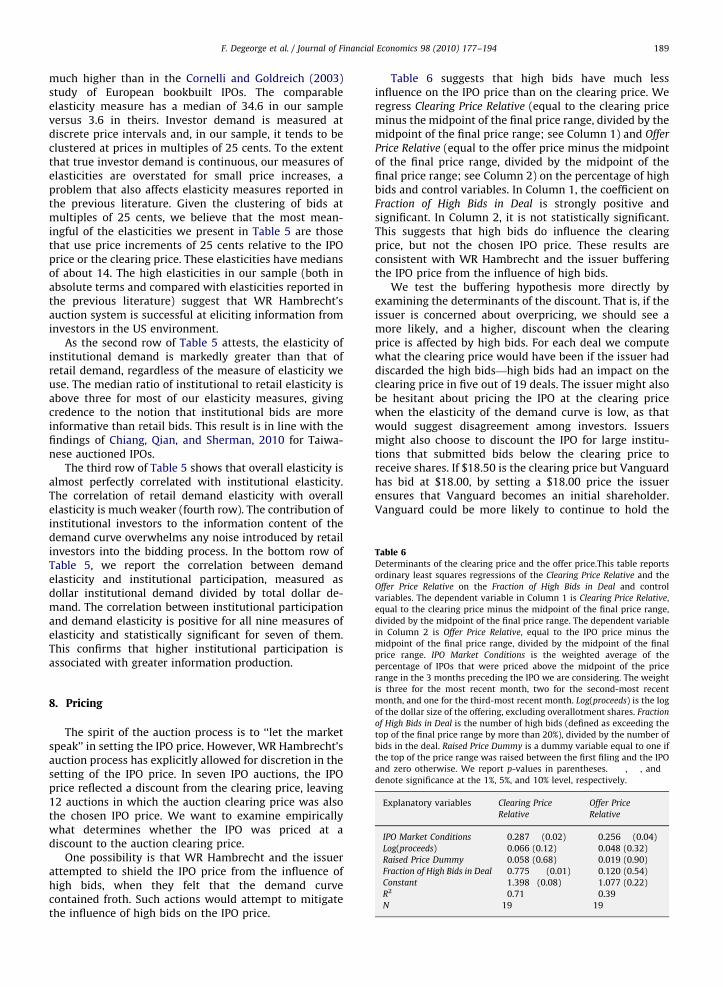
Table 6Determinants of the clearing price and the offer price.This table reports
ordinary least squares regressions of the Clearing Price Relative and the
Offer Price Relative on the Fraction of High Bids in Deal and control
variables. The dependent variable in Column 1 is Clearing Price Relative,
equal to the clearing price minus the midpoint of the final price range,
divided by the midpoint of the final price range. The dependent variable
in Column 2 is Offer Price Relative, equal to the IPO price minus the
midpoint of the final price range, divided by the midpoint of the final
price range. IPO Market Conditions is the weighted average of the
percentage of IPOs that were priced above the midpoint of the price
F. Degeorge et al. / Journal of Financial Economics 98 (2010) 177–194 189
much higher than in the Cornelli and Goldreich (2003)study of European bookbuilt IPOs. The comparableelasticity measure has a median of 34.6 in our sampleversus 3.6 in theirs. Investor demand is measured atdiscrete price intervals and, in our sample, it tends to beclustered at prices in multiples of 25 cents. To the extentthat true investor demand is continuous, our measures ofelasticities are overstated for small price increases, aproblem that also affects elasticity measures reported inthe previous literature. Given the clustering of bids atmultiples of 25 cents, we believe that the most mean-ingful of the elasticities we present in Table 5 are thosethat use price increments of 25 cents relative to the IPOprice or the clearing price. These elasticities have mediansof about 14. The high elasticities in our sample (both inabsolute terms and compared with elasticities reported inthe previous literature) suggest that WR Hambrecht’sauction system is successful at eliciting information frominvestors in the US environment.
As the second row of Table 5 attests, the elasticity ofinstitutional demand is markedly greater than that ofretail demand, regardless of the measure of elasticity weuse. The median ratio of institutional to retail elasticity isabove three for most of our elasticity measures, givingcredence to the notion that institutional bids are moreinformative than retail bids. This result is in line with thefindings of Chiang, Qian, and Sherman, 2010 for Taiwa-nese auctioned IPOs.
The third row of Table 5 shows that overall elasticity isalmost perfectly correlated with institutional elasticity.The correlation of retail demand elasticity with overallelasticity is much weaker (fourth row). The contribution ofinstitutional investors to the information content of thedemand curve overwhelms any noise introduced by retailinvestors into the bidding process. In the bottom row ofTable 5, we report the correlation between demandelasticity and institutional participation, measured asdollar institutional demand divided by total dollar de-mand. The correlation between institutional participationand demand elasticity is positive for all nine measures ofelasticity and statistically significant for seven of them.This confirms that higher institutional participation isassociated with greater information production.
range in the 3 months preceding the IPO we are considering. The weight
is three for the most recent month, two for the second-most recent
month, and one for the third-most recent month. Log(proceeds) is the log
of the dollar size of the offering, excluding overallotment shares. Fraction
of High Bids in Deal is the number of high bids (defined as exceeding the
top of the final price range by more than 20%), divided by the number of
bids in the deal. Raised Price Dummy is a dummy variable equal to one if
the top of the price range was raised between the first filing and the IPO
and zero otherwise. We report p-values in parentheses. ���, ��, and �
denote significance at the 1%, 5%, and 10% level, respectively.
Explanatory variables Clearing Price
Relative
Offer Price
Relative
IPO Market Conditions 0.287�� (0.02) 0.256�� (0.04)
Log(proceeds) 0.066 (0.12) 0.048 (0.32)
Raised Price Dummy 0.058 (0.68) 0.019 (0.90)
Fraction of High Bids in Deal 0.775��� (0.01) 0.120 (0.54)
Constant �1.398� (0.08) �1.077 (0.22)
R2 0.71 0.39
N 19 19
8. Pricing
The spirit of the auction process is to ‘‘let the marketspeak’’ in setting the IPO price. However, WR Hambrecht’sauction process has explicitly allowed for discretion in thesetting of the IPO price. In seven IPO auctions, the IPOprice reflected a discount from the clearing price, leaving12 auctions in which the auction clearing price was alsothe chosen IPO price. We want to examine empiricallywhat determines whether the IPO was priced at adiscount to the auction clearing price.
One possibility is that WR Hambrecht and the issuerattempted to shield the IPO price from the influence ofhigh bids, when they felt that the demand curvecontained froth. Such actions would attempt to mitigatethe influence of high bids on the IPO price.
Table 6 suggests that high bids have much lessinfluence on the IPO price than on the clearing price. Weregress Clearing Price Relative (equal to the clearing priceminus the midpoint of the final price range, divided by themidpoint of the final price range; see Column 1) and Offer
Price Relative (equal to the offer price minus the midpointof the final price range, divided by the midpoint of thefinal price range; see Column 2) on the percentage of highbids and control variables. In Column 1, the coefficient onFraction of High Bids in Deal is strongly positive andsignificant. In Column 2, it is not statistically significant.This suggests that high bids do influence the clearingprice, but not the chosen IPO price. These results areconsistent with WR Hambrecht and the issuer bufferingthe IPO price from the influence of high bids.
We test the buffering hypothesis more directly byexamining the determinants of the discount. That is, if theissuer is concerned about overpricing, we should see amore likely, and a higher, discount when the clearingprice is affected by high bids. For each deal we computewhat the clearing price would have been if the issuer haddiscarded the high bids—high bids had an impact on theclearing price in five out of 19 deals. The issuer might alsobe hesitant about pricing the IPO at the clearing pricewhen the elasticity of the demand curve is low, as thatwould suggest disagreement among investors. Issuersmight also choose to discount the IPO for large institu-tions that submitted bids below the clearing price toreceive shares. If $18.50 is the clearing price but Vanguardhas bid at $18.00, by setting a $18.00 price the issuerensures that Vanguard becomes an initial shareholder.Vanguard could be more likely to continue to hold the
F. Degeorge et al. / Journal of Financial Economics 98 (2010) 177–194190
shares than if it had to go into the market and purchaseshares after receiving a zero allocation (Zhang, 2004).From the issuer’s perspective, having a large institution inits ownership could be beneficial (Stoughton and Zechner,1998). From WR Hambrecht’s perspective, allocatingshares to institutions that bid slightly below the clearingprice could have improved these institutions’ perceptionof the auction mechanism and, therefore, increased theirprobability of participating in future auctioned deals.
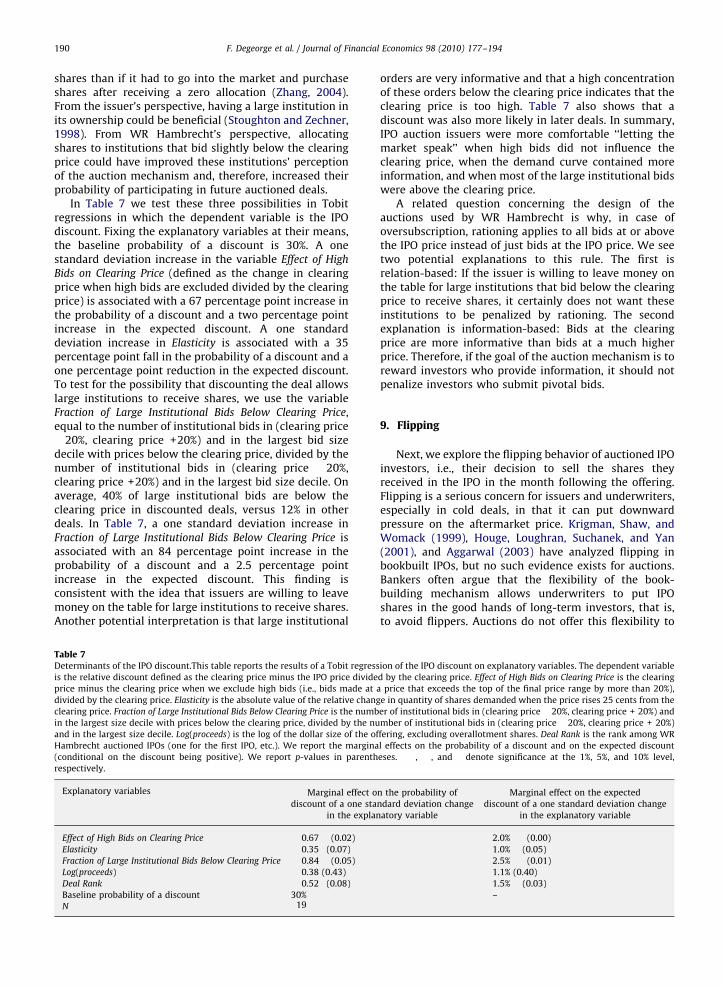
In Table 7 we test these three possibilities in Tobitregressions in which the dependent variable is the IPOdiscount. Fixing the explanatory variables at their means,the baseline probability of a discount is 30%. A onestandard deviation increase in the variable Effect of High
Bids on Clearing Price (defined as the change in clearingprice when high bids are excluded divided by the clearingprice) is associated with a 67 percentage point increase inthe probability of a discount and a two percentage pointincrease in the expected discount. A one standarddeviation increase in Elasticity is associated with a 35percentage point fall in the probability of a discount and aone percentage point reduction in the expected discount.To test for the possibility that discounting the deal allowslarge institutions to receive shares, we use the variableFraction of Large Institutional Bids Below Clearing Price,equal to the number of institutional bids in (clearing price�20%, clearing price +20%) and in the largest bid sizedecile with prices below the clearing price, divided by thenumber of institutional bids in (clearing price �20%,clearing price +20%) and in the largest bid size decile. Onaverage, 40% of large institutional bids are below theclearing price in discounted deals, versus 12% in otherdeals. In Table 7, a one standard deviation increase inFraction of Large Institutional Bids Below Clearing Price isassociated with an 84 percentage point increase in theprobability of a discount and a 2.5 percentage pointincrease in the expected discount. This finding isconsistent with the idea that issuers are willing to leavemoney on the table for large institutions to receive shares.Another potential interpretation is that large institutional
Table 7Determinants of the IPO discount.This table reports the results of a Tobit regress
is the relative discount defined as the clearing price minus the IPO price divide
price minus the clearing price when we exclude high bids (i.e., bids made at
divided by the clearing price. Elasticity is the absolute value of the relative chang
clearing price. Fraction of Large Institutional Bids Below Clearing Price is the numb
in the largest size decile with prices below the clearing price, divided by the nu
and in the largest size decile. Log(proceeds) is the log of the dollar size of the of
Hambrecht auctioned IPOs (one for the first IPO, etc.). We report the margina
(conditional on the discount being positive). We report p-values in parenth
respectively.
Explanatory variables Marginal effect o
discount of a one sta
in the explan
Effect of High Bids on Clearing Price 0.67�� (0.02)
Elasticity �0.35� (0.07)
Fraction of Large Institutional Bids Below Clearing Price 0.84�� (0.05)
Log(proceeds) �0.38 (0.43)
Deal Rank 0.52� (0.08)
Baseline probability of a discount 30%
N 19
orders are very informative and that a high concentrationof these orders below the clearing price indicates that theclearing price is too high. Table 7 also shows that adiscount was also more likely in later deals. In summary,IPO auction issuers were more comfortable ‘‘letting themarket speak’’ when high bids did not influence theclearing price, when the demand curve contained moreinformation, and when most of the large institutional bidswere above the clearing price.
A related question concerning the design of theauctions used by WR Hambrecht is why, in case ofoversubscription, rationing applies to all bids at or abovethe IPO price instead of just bids at the IPO price. We seetwo potential explanations to this rule. The first isrelation-based: If the issuer is willing to leave money onthe table for large institutions that bid below the clearingprice to receive shares, it certainly does not want theseinstitutions to be penalized by rationing. The secondexplanation is information-based: Bids at the clearingprice are more informative than bids at a much higherprice. Therefore, if the goal of the auction mechanism is toreward investors who provide information, it should notpenalize investors who submit pivotal bids.
9. Flipping
Next, we explore the flipping behavior of auctioned IPOinvestors, i.e., their decision to sell the shares theyreceived in the IPO in the month following the offering.Flipping is a serious concern for issuers and underwriters,especially in cold deals, in that it can put downwardpressure on the aftermarket price. Krigman, Shaw, andWomack (1999), Houge, Loughran, Suchanek, and Yan(2001), and Aggarwal (2003) have analyzed flipping inbookbuilt IPOs, but no such evidence exists for auctions.Bankers often argue that the flexibility of the book-building mechanism allows underwriters to put IPOshares in the good hands of long-term investors, that is,to avoid flippers. Auctions do not offer this flexibility to
ion of the IPO discount on explanatory variables. The dependent variable
d by the clearing price. Effect of High Bids on Clearing Price is the clearing
a price that exceeds the top of the final price range by more than 20%),
e in quantity of shares demanded when the price rises 25 cents from the
er of institutional bids in (clearing price �20%, clearing price + 20%) and
mber of institutional bids in (clearing price �20%, clearing price + 20%)
fering, excluding overallotment shares. Deal Rank is the rank among WR
l effects on the probability of a discount and on the expected discount
eses. ���, ��, and � denote significance at the 1%, 5%, and 10% level,
n the probability of
ndard deviation change
atory variable
Marginal effect on the expected
discount of a one standard deviation change
in the explanatory variable
2.0%��� (0.00)
�1.0%�� (0.05)
2.5%��� (0.01)
�1.1% (0.40)
1.5%�� (0.03)
–
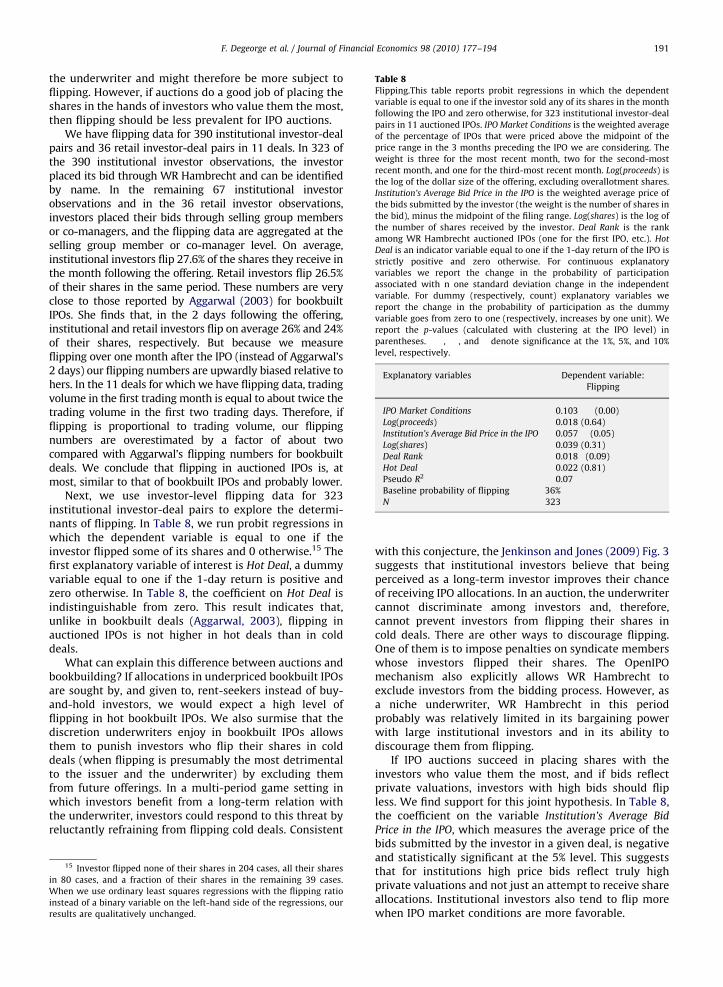
Table 8Flipping.This table reports probit regressions in which the dependent
variable is equal to one if the investor sold any of its shares in the month
following the IPO and zero otherwise, for 323 institutional investor-deal
pairs in 11 auctioned IPOs. IPO Market Conditions is the weighted average
of the percentage of IPOs that were priced above the midpoint of the
price range in the 3 months preceding the IPO we are considering. The
weight is three for the most recent month, two for the second-most
recent month, and one for the third-most recent month. Log(proceeds) is
the log of the dollar size of the offering, excluding overallotment shares.
Institution’s Average Bid Price in the IPO is the weighted average price of
the bids submitted by the investor (the weight is the number of shares in
the bid), minus the midpoint of the filing range. Log(shares) is the log of
the number of shares received by the investor. Deal Rank is the rank
among WR Hambrecht auctioned IPOs (one for the first IPO, etc.). Hot
Deal is an indicator variable equal to one if the 1-day return of the IPO is
strictly positive and zero otherwise. For continuous explanatory
variables we report the change in the probability of participation
associated with n one standard deviation change in the independent
variable. For dummy (respectively, count) explanatory variables we
report the change in the probability of participation as the dummy
variable goes from zero to one (respectively, increases by one unit). We
report the p-values (calculated with clustering at the IPO level) in
parentheses. ���, ��, and � denote significance at the 1%, 5%, and 10%
level, respectively.
Explanatory variables Dependent variable:
Flipping
IPO Market Conditions 0.103��� (0.00)
Log(proceeds) 0.018 (0.64)
Institution’s Average Bid Price in the IPO �0.057�� (0.05)
Log(shares) �0.039 (0.31)
Deal Rank �0.018� (0.09)
Hot Deal �0.022 (0.81)
Pseudo R2 0.07
Baseline probability of flipping 36%
N 323
F. Degeorge et al. / Journal of Financial Economics 98 (2010) 177–194 191
the underwriter and might therefore be more subject toflipping. However, if auctions do a good job of placing theshares in the hands of investors who value them the most,then flipping should be less prevalent for IPO auctions.
We have flipping data for 390 institutional investor-dealpairs and 36 retail investor-deal pairs in 11 deals. In 323 ofthe 390 institutional investor observations, the investorplaced its bid through WR Hambrecht and can be identifiedby name. In the remaining 67 institutional investorobservations and in the 36 retail investor observations,investors placed their bids through selling group membersor co-managers, and the flipping data are aggregated at theselling group member or co-manager level. On average,institutional investors flip 27.6% of the shares they receive inthe month following the offering. Retail investors flip 26.5%of their shares in the same period. These numbers are veryclose to those reported by Aggarwal (2003) for bookbuiltIPOs. She finds that, in the 2 days following the offering,institutional and retail investors flip on average 26% and 24%of their shares, respectively. But because we measureflipping over one month after the IPO (instead of Aggarwal’s2 days) our flipping numbers are upwardly biased relative tohers. In the 11 deals for which we have flipping data, tradingvolume in the first trading month is equal to about twice thetrading volume in the first two trading days. Therefore, ifflipping is proportional to trading volume, our flippingnumbers are overestimated by a factor of about twocompared with Aggarwal’s flipping numbers for bookbuiltdeals. We conclude that flipping in auctioned IPOs is, atmost, similar to that of bookbuilt IPOs and probably lower.
Next, we use investor-level flipping data for 323institutional investor-deal pairs to explore the determi-nants of flipping. In Table 8, we run probit regressions inwhich the dependent variable is equal to one if theinvestor flipped some of its shares and 0 otherwise.15 Thefirst explanatory variable of interest is Hot Deal, a dummyvariable equal to one if the 1-day return is positive andzero otherwise. In Table 8, the coefficient on Hot Deal isindistinguishable from zero. This result indicates that,unlike in bookbuilt deals (Aggarwal, 2003), flipping inauctioned IPOs is not higher in hot deals than in colddeals.
What can explain this difference between auctions andbookbuilding? If allocations in underpriced bookbuilt IPOsare sought by, and given to, rent-seekers instead of buy-and-hold investors, we would expect a high level offlipping in hot bookbuilt IPOs. We also surmise that thediscretion underwriters enjoy in bookbuilt IPOs allowsthem to punish investors who flip their shares in colddeals (when flipping is presumably the most detrimentalto the issuer and the underwriter) by excluding themfrom future offerings. In a multi-period game setting inwhich investors benefit from a long-term relation withthe underwriter, investors could respond to this threat byreluctantly refraining from flipping cold deals. Consistent
15 Investor flipped none of their shares in 204 cases, all their shares
in 80 cases, and a fraction of their shares in the remaining 39 cases.
When we use ordinary least squares regressions with the flipping ratio
instead of a binary variable on the left-hand side of the regressions, our
results are qualitatively unchanged.
with this conjecture, the Jenkinson and Jones (2009) Fig. 3suggests that institutional investors believe that beingperceived as a long-term investor improves their chanceof receiving IPO allocations. In an auction, the underwritercannot discriminate among investors and, therefore,cannot prevent investors from flipping their shares incold deals. There are other ways to discourage flipping.One of them is to impose penalties on syndicate memberswhose investors flipped their shares. The OpenIPOmechanism also explicitly allows WR Hambrecht toexclude investors from the bidding process. However, asa niche underwriter, WR Hambrecht in this periodprobably was relatively limited in its bargaining powerwith large institutional investors and in its ability todiscourage them from flipping.
If IPO auctions succeed in placing shares with theinvestors who value them the most, and if bids reflectprivate valuations, investors with high bids should flipless. We find support for this joint hypothesis. In Table 8,the coefficient on the variable Institution’s Average Bid
Price in the IPO, which measures the average price of thebids submitted by the investor in a given deal, is negativeand statistically significant at the 5% level. This suggeststhat for institutions high price bids reflect truly highprivate valuations and not just an attempt to receive shareallocations. Institutional investors also tend to flip morewhen IPO market conditions are more favorable.
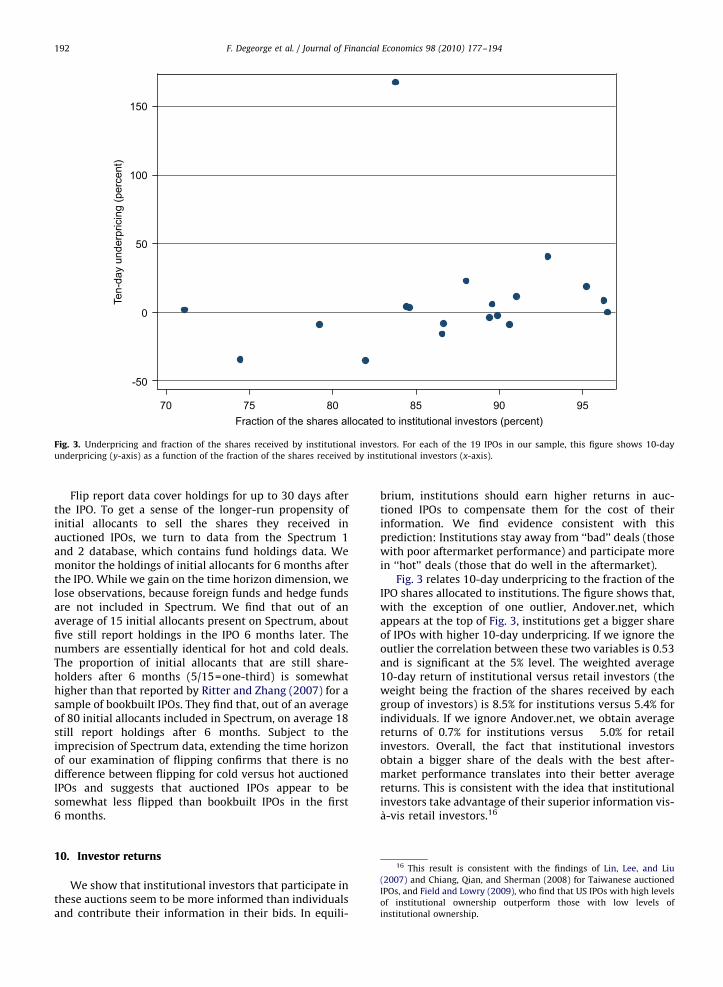
-50
0
50
100
150Te
n-da
y un
derp
ricin
g (p
erce
nt)
70 75 80 85 90 95Fraction of the shares allocated to institutional investors (percent)
Fig. 3. Underpricing and fraction of the shares received by institutional investors. For each of the 19 IPOs in our sample, this figure shows 10-day
underpricing (y-axis) as a function of the fraction of the shares received by institutional investors (x-axis).
F. Degeorge et al. / Journal of Financial Economics 98 (2010) 177–194192
Flip report data cover holdings for up to 30 days afterthe IPO. To get a sense of the longer-run propensity ofinitial allocants to sell the shares they received inauctioned IPOs, we turn to data from the Spectrum 1and 2 database, which contains fund holdings data. Wemonitor the holdings of initial allocants for 6 months afterthe IPO. While we gain on the time horizon dimension, welose observations, because foreign funds and hedge fundsare not included in Spectrum. We find that out of anaverage of 15 initial allocants present on Spectrum, aboutfive still report holdings in the IPO 6 months later. Thenumbers are essentially identical for hot and cold deals.The proportion of initial allocants that are still share-holders after 6 months (5/15=one-third) is somewhathigher than that reported by Ritter and Zhang (2007) for asample of bookbuilt IPOs. They find that, out of an averageof 80 initial allocants included in Spectrum, on average 18still report holdings after 6 months. Subject to theimprecision of Spectrum data, extending the time horizonof our examination of flipping confirms that there is nodifference between flipping for cold versus hot auctionedIPOs and suggests that auctioned IPOs appear to besomewhat less flipped than bookbuilt IPOs in the first6 months.
16 This result is consistent with the findings of Lin, Lee, and Liu
(2007) and Chiang, Qian, and Sherman (2008) for Taiwanese auctioned
IPOs, and Field and Lowry (2009), who find that US IPOs with high levels
of institutional ownership outperform those with low levels of
institutional ownership.
10. Investor returns
We show that institutional investors that participate inthese auctions seem to be more informed than individualsand contribute their information in their bids. In equili-
brium, institutions should earn higher returns in auc-tioned IPOs to compensate them for the cost of theirinformation. We find evidence consistent with thisprediction: Institutions stay away from ‘‘bad’’ deals (thosewith poor aftermarket performance) and participate morein ‘‘hot’’ deals (those that do well in the aftermarket).
Fig. 3 relates 10-day underpricing to the fraction of theIPO shares allocated to institutions. The figure shows that,with the exception of one outlier, Andover.net, whichappears at the top of Fig. 3, institutions get a bigger shareof IPOs with higher 10-day underpricing. If we ignore theoutlier the correlation between these two variables is 0.53and is significant at the 5% level. The weighted average10-day return of institutional versus retail investors (theweight being the fraction of the shares received by eachgroup of investors) is 8.5% for institutions versus 5.4% forindividuals. If we ignore Andover.net, we obtain averagereturns of 0.7% for institutions versus �5.0% for retailinvestors. Overall, the fact that institutional investorsobtain a bigger share of the deals with the best after-market performance translates into their better averagereturns. This is consistent with the idea that institutionalinvestors take advantage of their superior information vis-�a-vis retail investors.16
F. Degeorge et al. / Journal of Financial Economics 98 (2010) 177–194 193
11. Conclusion
We study 19 auctioned IPOs that used WR Ham-brecht’s OpenIPO auction mechanism between 1999 and2007. Overall, we find convincing evidence that thismechanism allows the underwriter and the issuer toextract valuable pricing information from investors’ bids.Bids submitted at high prices suggest that some investors(predominantly retail investors, whose impact on theclearing price is limited) try to free-ride on the mechan-ism. Retail bids are less informative than institutionalbids, but they do not seem to affect the information-extraction mechanism enough to discourage institutionalinvestors from participating. Demand in auctioned IPOs,especially from institutions, is elastic, suggesting thatinstitutional investors produce information and reveal itin the bidding process. The pricing flexibility offered bythe mechanism allows the issuer to buffer against suchfree-riding by discounting the deal relative to the clearingprice when more investors submit bids at high prices. Wealso find that flipping is at most as prevalent in auctionsas in bookbuilt deals. However, unlike in bookbuilding, inthe first month after the IPO investors do not flip theirshares more in ‘‘hot’’ deals (i.e., deals with positive short-term returns) perhaps because the absence of allocationdiscrimination in auctions prevents issuers from penaliz-ing past flippers or because shares in underpriced book-built IPOs are preferentially allocated to flippers. Finally,we find that institutional investors, who provide moreinformation, are somewhat rewarded by obtaining largershares of the deals with higher 10-day underpricing.
A potential concern with our results might be that oursample consists only of successful deals. But the numberof withdrawn auctioned IPOs over the 1999–2007 period(six of 25 attempted auctions, or 24%) is in line with thatreported by Dunbar and Foerster (2008) who find that 20%of IPOs were withdrawn in the 1985–2000 period in theUS. (The withdrawal rate for bookbuilt IPOs seems to havebeen higher during 2001–2007.) Another concern is thatissuers select their IPO mechanism, and we cannotexclude the possibility that issuing companies for whichinvestors have more information are disproportionatelyrepresented in WR Hambrecht’s IPO auctions. In a multi-variate setting, Lowry, Officer, and Schwert (2010) findthat older firms are more likely to use auctions. Olderfirms are better known and have an existing customerbase, which might explain in part why the demand curvesfor auctioned IPOs are very elastic.
Subject to these caveats, our results suggest thatauctions are an effective alternative to traditionalbookbuilding. One might wonder why, despite theiradvantages (low costs and efficient pricing), auctionedIPOs failed to gain a significant market share in the USin recent years. A possible explanation is that WRHambrecht is not a bulge-bracket underwriter, andbulge-bracket underwriters have increased their marketshare in the last two decades. These underwriters couldhave been reluctant to give up the traditional IPOmechanism, perhaps for fear of losing the benefits theygain from the quid pro quo relation with investorsinherent in bookbuilding. WR Hambrecht has no all-star
analyst, and if analyst coverage is in the issuers’ objectivefunction (Loughran and Ritter, 2004; Degeorge, Derrien,and Womack, 2007), the bundling of analyst coverage andIPO underwriting could be partly responsible for the highmarket share of bulge-bracket firms, where most all-staranalysts work.
References
Aggarwal, R., 2003. Allocation of initial public offering and flippingactivity. Journal of Financial Economics 68, 111–135.
Back, K., Zender, J.F., 1993. Auctions of divisible goods: on the rationalefor the treasury experiment. Review of Financial Studies 6, 733–764.
Benveniste, L., Spindt, P., 1989. How investment bankers determine theoffer price and allocation of new issues. Journal of FinancialEconomics 24, 343–361.
Benveniste, L., Wilhelm, W., 1990. A comparative analysis of IPOproceeds under alternative regulatory regimes. Journal of FinancialEconomics 28, 173–207.
Biais, B., Bossaerts, P., Rochet, J.-C., 2002. An optimal IPO mechanism.Review of Economic Studies 69, 117–146.
Biais, B., Faugeron-Crouzet, A.-M., 2002. IPO auctions: English, Dutch, yFrench, and Internet. Journal of Financial Intermediation 11,9–36.
Chemmanur, T., Liu, M., 2006. In: How should a firm go public? Adynamic model of the choice between fixed-price offerings andauctions in IPOs and privatizations. Unpublished Working Paper.Boston College.
Chen, H., Ritter, J.R., 2000. The seven percent solution. Journal of Finance55, 1105–1131.
Chiang, Y.-M., Qian, Y., Sherman, S., 2010. Endogenous entry and partialadjustment in IPO auctions: are institutional investors betterinformed? Review of Financial Studies 23 (3), 1200–1230.
Cornelli, F., Goldreich, D., 2001. Bookbuilding and strategic allocations.Journal of Finance 56, 2337–2369.
Cornelli, F., Goldreich, D., 2003. Bookbuilding: how informative is theorder book? Journal of Finance 58, 1415–1443.
Degeorge, F., Derrien, F., Womack, K.L., 2007. Analyst hype in IPOs:explaining the popularity of bookbuilding. Review of FinancialStudies 20, 1021–1058.
Derrien, F., 2005. IPO pricing in ‘‘hot’’ market conditions: who leavesmoney on the table? Journal of Finance 60, 487–521.
Derrien, F., Womack, K.L., 2003. Auctions vs. bookbuilding and thecontrol of underpricing in hot IPO markets. Review of FinancialStudies 16, 31–61.
Dorn, D., 2009. Does sentiment drive the retail demand for IPOs? Journalof Financial and Quantitative Analysis 44, 85–108.
Dunbar, C., Foerster, S., 2008. Second time lucky? Withdrawn IPOs thatreturn to the market. Journal of Financial Economics 87, 610–635.
Field, L., Lowry, M., 2009. Institutional versus individual investment inIPOs: the importance of firm fundamentals. Journal of Financial andQuantitative Analysis 44, 489–516.
Houge, T., Loughran, T., Suchanek, G., Yan, X., 2001. Divergence ofopinion, uncertainty, and the quality of initial public offerings.Financial Management 30, 5–23.
Jagannathan, R., Jirnyi, A., Sherman, A., 2009. In: Why have IPO auctionsfailed the market test? Unpublished Working Paper. NorthwesternUniversity, Evanston, IL.
Jenkinson, T.J., Jones, H., 2004. Bids and allocations in European IPObookbuilding. Journal of Finance 59, 2309–2338.
Jenkinson, T.J., Jones, H., 2009. IPO pricing and allocation: a survey of theviews of institutional investors. Review of Financial Studies 22 (4),1477–1504.
Kandel, S., Sarig, O., Wohl, A., 1999. The demand for stocks: an analysis ofIPO auctions. Review of Financial Studies 12, 227–247.
Kaneko, T., Pettway, R.H., 2003. Auctions versus bookbuilding ofJapanese IPOs. Pacific-Basin Finance Journal 11, 439–462.
Kaustia, M., Knupfer, S., 2008. Do investors learn from personalexperience? Evidence from IPO subscriptions. Journal of Finance63, 2679–2702.
Keloharju, M., Nyborg, K.G., Rydqvist, K., 2005. Strategic behavior andunderpricing in uniform price auctions: evidence from Finnishtreasury auctions. Journal of Finance 60, 1865–1902.
Krigman, L., Shaw, W.H., Womack, K.L., 1999. The persistence of IPOmispricing and the predictive power of flipping. Journal of Finance54, 1015–1044.
F. Degeorge et al. / Journal of Financial Economics 98 (2010) 177–194194
Kutsuna, K., Smith, R., 2004. Why does bookbuilding drive out auctionmethods of IPO issuance? Evidence from Japan. Review of FinancialStudies 17 (4), 1129–1166.
Lin, J.C., Lee, Y.T., Liu, Y.J., 2007. IPO auctions and private information.Journal of Banking and Finance 31, 1483–1500.
Liu, Y.J., Wei, K.C.J., Liaw, G., 2001. On the demand elasticity of initialpublic offerings: an analysis of discriminatory auctions. InternationalReview of Finance 2, 151–178.
Loughran, T., Ritter, J.R., 2002. Why don’t issuers get upset aboutleaving money on the table in IPOs? Review of Financial Studies 15,413–443.
Loughran, T., Ritter, J.R., 2004. Why has IPO underpricing changed overtime? Financial Management 33, 5–37.
Loughran, T., Ritter, J.R., Rydqvist, K., 1994. Initial public offerings:international insights. Pacific-Basic Finance Journal 2, 165–199.
Lowry, M., Officer, M.S., Schwert, G.W., 2010. The variability of IPO initialreturns. Journal of Finance 65, 425–465.
Nimalendran, M., Ritter, J.R., Zhang, D., 2007. Do today’s trades affecttomorrow’s IPO allocations? Journal of Financial Economics 84 (1),87–109.
Nyborg, K.G., Rydqvist, K., Sundaresan, S.M., 2002. Bidder behavior inmultiunit auctions: evidence from Swedish treasury auctions.Journal of Political Economy 110, 394–424.
Pettway, R.H., Thosar, S., Walker, S., 2008. Auctions versus bookbuilt IPOsin Japan: a comparison of aftermarket volatility. Pacific-BasinFinance Journal 16, 224–235.
Reuter, J., 2006. Are IPO allocations for sale? Evidence from mutualfunds. Journal of Finance 61 (5), 2289–2324.
Ritter, J.R., Welch, I., 2002. A review of IPO activity, pricing andallocations. Journal of Finance 57 (4), 1795–1828.
Ritter, J.R., Zhang, D., 2007. Affiliated mutual funds and the allocationof initial public offerings. Journal of Financial Economics 86 (2),337–368.
Sherman, A., 2000. IPOs and long-term relationships: an advantage tobookbuilding. Review of Financial Studies 13, 697–714.
Sherman, A., 2005. Global trends in IPO methods: bookbuilding versusauctions with endogenous entry. Journal of Financial Economics 65,3–29.
Spatt, C., Srivastava, S., 1991. Preplay communication, participationrestrictions, and efficiency in initial public offerings. Review ofFinancial Studies 4, 709–726.
Stoughton, N.M., Zechner, J., 1998. IPO mechanisms, monitoring, andownership structure. Journal of Financial Economics 49, 45–77.
Zhang, D., 2004. Why do IPO underwriters allocate extra shares whenthey expect to buy them back? Journal of Financial and QuantitativeAnalysis 39 (3), 571–594.