Embed Size (px)
Citation preview

IDRiM(2012)2(2) ISSN: 2185-8322 DOI10.5595/idrim.2012.0033
Journal of Integrated Disaster Risk Management
Original paper
Disaster Microinsurance for Pro-Poor Risk Management: Evidence from South Asia
Stefan Hochrainer-Stigler1, Rakhi B.Sharma2, and Reinhard Mechler3
Received: 29/09/2011 / Accepted: 01/10/2012 / Published online: 21/11/2012
Abstract This paper offers a large empirical cross-country assessment of the impact of disaster microinsurance in the South Asia region capitalizing on the prevalence of disaster-prone communities, many of which are mixes of both households with and without disaster microinsurance. Overall, the results of this study show that there is interest in and willingness to pay for disaster microinsurance programs. The products are reaching poor clients, many who are below the poverty line, highly in debt, and employ limited and difficult coping mechanisms after disasters. However, findings have shown difficulties with the claim process and inadequate total coverage with a number of individuals borrowing additional funds from money lenders, friends, and family. In addition, there seems to be a need to review products and potential clients in communities to ensure that although “the poor” are being served, “poorer than the poor” are not being excluded due to costs and information barriers.
Key words Microinsurance; Impact assessment; Cross-country study; South Asia region.
1. INTRODUCTION
Across the globe, natural disasters are growing in destructiveness and their human toll is escalating:
over the period 1970-2009, more than 6 billion people were cumulatively affected by natural disasters (CRED, 2010). The number affected has also grown from 1.78 billion in the first half of that period (1970-1989) to almost 4.3 billion in the second half (1990-2009) and has continued to increase (Dilley et al. 2005).
As the frequency and severity of major natural hazards has increased around the globe, countries of the South Asia region –Afghanistan, Bangladesh, Bhutan, India, Maldives, Nepal, Pakistan, and Sri Lanka – have been no exception to this trend. With over 900 events reported since 1970, the South Asia region can be viewed as extremely vulnerable to a number of both natural hazards such as tropical cyclones, floods,
1 Risk, Policy and Vulnerability Program, International Institute for Applied Systems Analysis, Laxenburg, Austria, [email protected] 2Indian Institute of Technology (IIT), Delhi, [email protected] 3 Risk, Policy and Vulnerability Program, International Institute for Applied Systems Analysis, Laxenburg, Austria, [email protected]
70

IDRiM(2012)2(2) ISSN: 2185-8322 DOI10.5595/idrim.2012.0033
earthquakes, tsunamis, landslides/mudslides/debris-flow, and fluctuations of extreme temperature and rainfall. Between 1990 and 2008, over 750 million people - 50 percent of the population in the region – were affected by a natural disaster, leaving almost 60,000 dead and about US$45 billion in damages (Meijer, Pusch and Sinha 2009).
In response to the growing frequency and severity of disasters in the region, communities, NGOs, governments, and international organizations have all worked to respond effectively to disasters while decreasing vulnerabilities over the long-term. Disaster risk management – the process of implementing strategies, policies and improved coping capacities to lessen the adverse impacts of disasters – has become an important area, however much of the management of disasters in the region is still focused on dealing with disasters after they occur (Gurenko 2004; Linnerooth-Bayer et al. 2005). This is to say, the region continues to rely on systems of disaster relief and humanitarian aid to deal with post-disaster losses such as the Asian Tsunami of 2004 that killed nearly 220,000 people, injured thousands, and displaced over 1.7 million. Much of the recovery from this disaster was funded through humanitarian aid pledged by governments, humanitarian organizations, and individuals amounting to US$3.5 billion (for an excellent summary see Jayasuriya and McCawley 2010). Other disasters such as the Pakistan Earthquake of 2005 or Bangladesh Cyclone of 2007 were declared national emergencies in which national disaster or calamity funds were utilized.
No matter how small, this aid is a key source of funding to deal with the consequences of natural hazards in the region. Emergency assistance aid can be made available to households, businesses, and local governments. However, while appropriations are made for emergencies, the actual budgetary outlays on such events are often well in excess of budgeted amounts. This means less funding for affected communities or government’s borrowing externally to fill the gap. Table 1 shows the ratio of economic losses from recent large catastrophic events in South Asia to the amount of annual budgetary appropriations for emergencies in 2008-2009.
Table 1.Economic Losses from Recent Catastrophic Events vs. Available Government Funding.
Source: Gurenko 2010. Event Economic Loss
($ millions) Available disaster funding ($
millions) Ratio
Bangladesh Sidr (2007) 1675 117 14.3 Pakistan Earthq. (2005) 5490 54.26 101.2 Gujarat Earthq. (2001) 3491 790 4.4
According to this, in Bangladesh, it would take over 100 times the available emergency budgetary
allocations from all sources to cover the economic losses from a severe catastrophic event with a 20-50 year return period such as that of Cyclone Sidr in 2007. This exemplifies the inadequate funding available to cover disaster losses in the region.
In addition to national annual budgetary allocations for emergencies, the affected have to rely on international assistance, which however, only provides a limited amount of necessary funding and often come with considerable time lags. As one example, two years after the 2001 earthquake in Gujarat, India, assistance from the central reserve fund and international sources had reached only 20 percent of original pledged commitments (World Bank 2003). The 2005 Pakistan earthquake and the 2004 Indian Ocean Tsunami are exceptions in the region where countries had received significant external assistance.
In the absence of functioning financial and insurance markets, the international community, rural development banks, the private sector and NGOs in developing countries have worked to create novel formal and informal instruments to manage financial needs in the face of risks. Microfinance institutions are increasingly providing affordable financial services, especially credit and savings, to low-income and
71

IDRiM(2012)2(2) ISSN: 2185-8322 DOI10.5595/idrim.2012.0033
poor households and enterprises, thus improving their income stability and asset-building opportunities. In developing countries, financial services providers—banks, microfinance institutions, credit unions, and other institutions—serve around 500 million low-income clients (Thomas 2005).
One gap has been microinsurance, and to fill this gap of providing poor households with more affordable safety nets for disasters, microinsurance schemes have developed across the region catering to the needs of this segment with cost-effective, simple, and flexible programs. These include insurance products (index-based insurance for agriculture), risk-pooling schemes (e.g., funeral and burial societies), income support (e.g., credit arrangements; transfers), and consumption smoothing arrangements (e.g., savings; grain banks).
Microinsurance is defined as “the protection of low-income people against specific perils in exchange for regular premium payments proportionate to the likelihood and risk of cost involved” (Churchill 2006). There is an ongoing discussion if microinsurance could help the poor to reduce their vulnerability to shocks such as natural hazards (Barret et al. 2007) and to avoid falling into poverty traps (Carter et al. 2006). Despite the promising potentials of such schemes such as low transaction costs and absence of moral hazard (Linnerooth-Bayer, Hochrainer-Stigler and Mechler 2011) little is known about how microinsurance actually benefits households and communities after disasters. Most of the research has focused on supply side issues, including pricing details as well as implementation questions, whereas the demand side perspective and potential benefits to the insured has been left unexamined through rigorous evidence-based studies (see Kono and Takahashi 2010).
This paper attempts to fill part of this gap through an empirical cross-country assessment of the impact of disaster microinsurance in the South Asia region. Microinsurance is offered in the region to low-income households, farmers, and businesses as a means of providing access to post-disaster liquidity for recovery. Basically, there are two types of disaster microinsurance schemes: the classical indemnity based one and the newer index-based scheme. While the former pays claims based on the actual losses, the latter is written against a physical trigger, such as temperature or precipitation (Hess and Syroka 2005). If the index falls below or reaches a certain measure or “trigger”, claim payments are made, regardless of the actual loss. Index-based schemes may offer a viable alternative to traditional crop insurance, which has failed in many countries mainly due to the high transaction costs associated with settling claims on a case-by-case basis (Linnerooth Bayer and Mechler 2007). Most index-based schemes have been backed by international financial institutions or other sources of subsidies. In the South Asia region, alliances among NGO/community groups, microfinance organizations, rural development banks, government regulators, entrepreneurs, and international financial and donor institutions have pioneered disaster microinsurance products targeted directly at the poor. Some have grown out of pressing needs identified on the ground in the aftermath of a disaster while others have developed through “replication” of what has been heralded as a social protection “best practice”.
The aim of the paper is to advance the discussion of disaster microinsurance from anecdotal knowledge to specific evidence-based recommendations by assessing and understanding the impacts of products on clients. Key areas covered include: i) client satisfaction in products and services; ii) client awareness, understanding and perceptions of risk, products, and needs; iii) current disaster coping mechanisms and risk management behaviour; iv) delivery mechanisms tailored for this low-income market; and, v) the potential for vulnerability reduction, including poverty and disaster risk reduction as well as enhancements in human welfare.
To answer these questions, an original dataset was generated through primary data collection based on stratified sampling of responses received from a control group (or “non-clients”) as well as microinsurance clients of the following five organizations offering disaster microinsurance products:
- Basix (India); - Self-Employment Women’s Association (SEWA India); - All India Disaster Management Institute (AIDMI India);
72

IDRiM(2012)2(2) ISSN: 2185-8322 DOI10.5595/idrim.2012.0033
- Yasiru (Sri Lanka); and, - Proshika (Bangladesh).
One disaster product was surveyed for Yasiru, AIDMI, and SEWA, while two different products were
surveyed for Basix and Proshika bringing the number of products evaluated to seven. The microinsurance products assessed covered natural hazards and consequent risks specifically for tropical cyclones, floods, earthquakes, tsunamis, landslides/mudslides/debris-flow, as well as fluctuations of extreme temperature and rainfall. Non-natural hazards such as epidemics and/ or other risks such as accidents, illness, unemployment, and the like may have been covered under the programs of the participating organizations of the study however, were not the primary interest of the study. A total of 2,171 surveys were completed with 1,640 client evaluations and 531 responses from non-insured clients.
The paper is organized as follows. Section two gives an introduction in microinsurance for poor households including a discussion of methodologies applied and results found within the literature. This serves as a basis for section three, which discusses the case study regions, the sampling procedure and hypothesis. Section four presents the results while section five gives a discussion and further outlook into the future.
2. MICROINSURANCE FOR POOR HOUSEHOLDS
Different microinsurance definitions have emerged in academic literature (see Mechler, Linnerooth-Bayer and Peppiatt 2006). For example, the Consultative Group to Assist the Poor (2003) defines microinsurance taking a demand side perspective.
“The protection of low-income people against specific perils in exchange for monetary payments (premiums) proportionate to the likelihood and cost of the risk involved. As with all insurance, risk pooling allows many individuals or groups to share the costs of a risky event. To serve poor people, microinsurance must respond to their priority needs for risk protection (depending on the market, they may seek health, car, or life insurance), be easy to understand, and affordable.”
Other sources emphasize the specific delivery channels characteristically used by microinsurance for reaching the poor and low income via microfinance institutions (MFIs), NGOs and other organizations. Finally, the group-based nature of contracts is a common feature of microinsurance, as often groups of at-risk individuals or farmers share one insurance contract reducing the costs of issuing contracts and processing premiums and claims (Cohen and Sebstad 2003; Brown and Churchill 2000). From a supply-side, provider perspective, Brown and Churchill (2000) list the following conditions for insurability:
• A large number of similar units exposed to the risk; • Limited policy holder control over the insured event; • Insurable interest; • Losses being determinable and measurable; • Losses should not be catastrophic; • Chance of loss is calculable; and, • Premiums are economically affordable.
As identified by Cohen and McCord (2003), there can be four institutional models for providing microinsurance:
73

IDRiM(2012)2(2) ISSN: 2185-8322 DOI10.5595/idrim.2012.0033
• Community-based model: Local communities, MFIs, NGOs and/or cooperatives develop and distribute the product, manage the risk pool and absorb the risk, with no involvement on the part of commercial insurers.
• Full service model: Commercial or public insurers provide the full range of insurance services. • Provider model: Banks and other providers of microfinance directly offer or require insurance
contracts. These are usually coupled with credit, for example, to insure against default risk. • Partner-agent model: Commercial or public insurers together with MFIs or non-governmental
organizations (NGOs) collaboratively develop the product. The insurer absorbs the risk, and the MFI/NGO markets the product through its established distribution network. This lowers the cost of distribution and thus promotes affordability.
Following the United Nations International Year of Microcredit 2005, there has been growing interest in microfinance solutions to help alleviate poverty in developing countries. Whereas using microcredit and, to a lesser extent, microinsurance to cover life and health risks is now widely established, the use of microinsurance to indemnify against losses caused by severe or catastrophic natural disaster is only just emerging.
With disaster microinsurance in its infancy in the region, there have been a number of programs set up by private sector organizations and NGOs with the goal of relieving the financial impact of disasters but have not been based on empirical evidence on potential benefits. There has been considerable debate on the benefits of safety nets such as insurance for protecting against adverse disaster impacts. For example, in a survey evaluating the impacts of the BASIX microinsurance scheme, the World Bank’s Commodity Risk Management Group (CRMG) and Development Economics Research Group (DECRG) partnering with the International Crop Research Institute conducted a baseline survey sampling from two districts characterized by low and uncertain rainfall, low levels of irrigation, and shallow and infertile soils. The sample included 1,052 farming households, 267 buyers, 186 non-buyers that attended the marketing meeting, and 299 non-attendees in the sampled villages. In addition, 300 farming households were interviewed in control villages. Results indicated no changes in farming practice, although higher-risk, higher-yield methods of farming were anticipated as a result of financial protection. (Gine 2005). The traditional social security or protection paradigm is conceived to be a risk mitigation effort to address the economic crisis emerging from unemployment, work injury, maternity, sickness, old age, and death. Whether this is effective based on disaster experience has not ever been rigorously tested.
Criticism of microinsurance schemes are founded in ideas that such informal and formal approaches offer limited protection, low returns for households, and are prone to breakdown during emergencies. Additionally, the argument that microinsurance, and the credit made available by it, encourages people to aspire for higher-return or higher risk activities has not been supported by evidence. The community-based risk management schemes in the region are thought to rely too heavily on personal relations between participants, limiting scalability and geographic spread. Moreover, such mechanisms also have very limited viability in a condition where the entire community, that is homogeneous in terms of economic activities and climatic specifications, is prone to some kind of instability (Bhattamishra and Barrett 2008).
In terms of cost, some cite that microinsurance is usually never subsidized which entails that the entire burden is borne by the customer. Others note that since microinsurance products in general evolved around women self-help groups, there exist gender discriminations with men benefiting instead of women who paid the premium (Mayoux 2005).
Finally, there is an increasing concern over the shift in responsibility of supporting poor at the time of disasters from governments - which may have been implicit in the disaster due to structural failures - to the poor themselves. Therefore, the question of whether microinsurance for disasters is really reducing risks or just shifting the burden is crucial however unaddressed.
74

IDRiM(2012)2(2) ISSN: 2185-8322 DOI10.5595/idrim.2012.0033
The debate on the need to incorporate natural disaster based risks through safety nets is critical now in light of a large gap in knowledge and with the increasing frequency of, and interest in, the region to alleviate impacts through innovative mechanisms like microinsurance. In order to shed light on the subject, there is a need for empirical investigations on the impact of such programs in reaching their goals.
In 2006, a study sponsored by ProVention was undertaken reviewing key microinsurance products that cater to disaster risk across the globe to access their effectiveness in reducing vulnerability during the post-disaster period both from a long- and short-term perspective. The global review demonstrated the large potential of disaster microinsurance programs in order to protect the poor in the aftermath of natural disasters. One of the findings of this review is the existence of creative alliances among NGO/community groups, microfinance organizations, government regulators, entrepreneurs, and international financial and donor institutions in pioneering microinsurance programs. Of special interest is an emerging new role for donors in supporting these schemes. Yet significant challenges were also revealed and it was concluded that while “insurers have reliably and quickly settled claims, there is little information as to how these payments may have mitigated post-disaster poverty.” (Mechler, Linnerooth-Bayer, and Peppiatt 2007).
At the international level, there is a general acceptance of the need to have microinsurance products to mitigate disaster risk however, there is a hardly any understanding of the real ways that microinsurance can aid in disaster risk mitigation. Therefore, there is a large gap in disaster microinsurance literature of strong evidence to support the claim that these products are achieving their goal of reaching the poor, reducing the impact of disasters, and helping move households out of poverty traps.
Empirical reviews aid insurance providers in developing “much needed”, “regional specific” and “disaster specific” features of appropriate microinsurance products that cater to disaster risks. These also assist organizations in identifying the most appropriate products and delivery models to generate the most benefit to target populations, governments, and insurance suppliers. As one case in point, many of the microinsurance products available in India since 1984 onwards exemplify institutional failures in the delivery of microinsurance products. This supply and delivery gap is mainly due to the lack of understanding on the part of policy-making bodies of the process of designing and delivering a risk mitigation product for low-income segments of the population. Finally, gaining clarity on the effectiveness of microinsurance may also assist in promoting other insurance suppliers to offer disaster coverage while promoting customer uptake.
In order to initiate debate on the need for microinsurance as a disaster management tool, it is essential to develop an understanding on how it affects or supports the households. Also, it is imperative to gain some understanding on the roles of individuals, government, and other stakeholders to manage disaster risk of the poor. The perspective of insurance holders towards an insurance product is also equally critical for the design and distribution. Finally, it is essential to understand the diversity and intensity in different types of risks on the livelihood and habitation of the poor.
In this scenario, the present study attempts to bring some understanding of the impact of microinsurance at the household level, risk mitigation mechanisms followed by households, and perspectives towards microinsurance products based on empirical assessment of primary data.
3. METHODOLOGY 3.1 The Survey: General Information
The study period ran from January 2008 to October 2010 with the actual evaluation training and field surveying from October 2008 to September 2009. The organizations that underwent the surveying in this period were (in order): AIDMI, Basix, Yasiru, Proshika, and SEWA, in India, Sri Lanka, and Bangladesh
75

IDRiM(2012)2(2) ISSN: 2185-8322 DOI10.5595/idrim.2012.0033
(see Table 2 for an overview).
Table 2.Summary of Microinsurance schemes assessed.
Country Organization Microinsurance product No. of benficiaries India AIDMI All disaster coverage 1,706
(2010) India BASIX Weather index-based crop
insurance 4,545 (2008)
India BASIX Micro-enterprise insurance 21,928 (2008)
India SEWA Rainfall insurance 1,441 (2009)
Sri Lanka Yasiru Disaster, health, accident insurance
20,129 (2009)
Bangladesh Proshika Proshika Savings Scheme (PSS) insurance-cum-savings
1,752
Bangladesh Proshika Enterprise and Social Security Programme (ESSP)
23,015
Many of the participating organizations had multiple products that could be categorized as “disaster
microinsurance.” While all were microinsurance schemes, some were clearly labelled as “disaster” related schemes while others were “rainfall insurance,” “accident insurance,” or “weather-index insurance.” It was the components of the insurance coverage that rendered them as “disaster microinsurance” in their coverage against hazards including: tropical cyclones, floods, earthquakes, tsunamis, landslides/mudslides/debris-flow, as well as fluctuations of extreme temperature and rainfall. For each organization, an evaluation was conducted during the training sessions where clients of the disaster microinsurance program were located. Maps were divided into areas of concentration and based on the density of the clients, diversity between urban and rural areas, hazard variance, manpower available for surveying, location of surveyors, and feasibility of travel to areas, various geographical areas were selected for surveying.
In order to ascertain the impacts of microinsurance programs in the region, the study undertook interviews of current clients (also known as “the treatment group”, the “insured”, or “beneficiaries”) and non-clients (also known as “the control group”). In the absence of a recent disaster where clients could be directly interviewed on their experience with the microinsurance scheme, or without a baseline for which to compare the present findings with an earlier one, this was thought to be the most suitable study methodology. A control group was used to better determine the impact of microinsurance programs. If, for example, the amalgamated results of the insured population showed a trend in a certain factor, comparing with the control group could yield analysis if this trend was normal for the socio-economic distribution or if it was specifically attributable to the impact of involvement in the microinsurance scheme. The aim of this process was to keep all variables the same so that any differences could be ascribed to the microinsurance program itself with much greater confidence. The insured group survey took, on average, between 30-45 minutes each while the control group took, on average, between 20-30 minutes. Completing the work involved over 85 people in participating organizations with 54 people involved in training, 85 people in field surveying, and 15 in online survey inputting.
3.2 Survey Sample Size
In order to establish an adequate survey size, four factors were taken into account: i) an examination of
76

IDRiM(2012)2(2) ISSN: 2185-8322 DOI10.5595/idrim.2012.0033
the total client sizes of the participating organizations; ii) variance of important variables in the questionnaire; iii) statistical confidence levels and intervals; and, iv) manpower and time availability of organization to undertake the surveying. The combination of these factors proved difficult to balance with the large diversity in participating organizations. Based only on confidence intervals and levels, for AIDMI, 450 beneficiary surveys were determined to be necessary. While this was feasible for this organization, it was not as feasible for others due to different beneficiary sizes or time availability. It was decided that an important aspect was to keep all survey samples sizes the same throughout all the organizations although a significant amount of diversity existed between them. Therefore, keeping between a 90-95 percent confidence interval and 4 percent margin of error, it was determined that 400 surveys were sufficient. Of this, 75 percent (300 surveys) were sought to be completed for insured clients and 25 percent (100 surveys) would be conducted for the control portion for each organization. Some organizations completed a few extra surveys in each category. In total, 1,640 insured group surveys were completed and 531 control group surveys for a total of 2,171 surveys. Slight variations in the numbers existed. However, the minimum of 300 insured and 100 control were reached for each organization.
To generate an original dataset, the surveyors employed stratified sampling techniques to choose both the clients and the control group. This was done to ensure that there was no bias (e.g. only interviews of males), selection of both the insured and control groups were done taking into account various factors determined important by each organization in presenting a representative sample of the population. There was no quota set for the number in each group, surveyors were asked to take into account various criteria to ensure that one group was not overly surveyed or that any one group was not excluded.
3.3 Types of Questions
In terms of the types of questions, the study aimed to keep them mainly yes/no, multiple choice, and ranking types of questions with a few open-ended ones as well. This ensured that the results were easily comparable, were not overly difficult for the surveyors to conduct, and could be conducted with a reasonable timeframe. The following (also based on the discussion in section 1 and 2) were guiding questions in the development of the survey:
Client profiling
• What strata of society does disaster micro-insurance really reach? Are these the working poor or the ‘better off’?
• Who participates and who does not, and why? How do they perceive risks, and benefits of insurance?
• Why and how do they participate (process and perceptions from the demand side) • What are the opportunity costs of micro-insurance? • Are the costs involved affordable for institutions and clients? • What percentage of losses does insurance cover? What are their actual needs? • Are we targeting the right populations? Is the premium right for them? • What is process for claim settlement and the issues? • What are the determinants of policy retaining?
Ex post effects
• What are the ex-post risk reduction mechanisms prevailing in the study regions? • How is the insurance claim utilised by the policy holder?
Ex-ante effects • Has micro-insurance increased the insured’s economic disaster resilience? • Are client achieving better economic status because of the financial stability provided by micro-
77

IDRiM(2012)2(2) ISSN: 2185-8322 DOI10.5595/idrim.2012.0033
insurance? • Can micro-insurance incentives better risk management practices and how? • How does micro-insurance impact the credit/debt situation of clients? • What are the risk reduction/preparedness initiatives being undertaken to also assist clients to
reduce their risks? What else can be done? • Are service providers doing enough about reducing risks?
Factors that facilitate the expansion of insurance market
• Are there any effective precedents to enhance the demand for insurance in the regions studied? • What are the key features that facilitate the risk reduction effort of the policy holder? • As a risk reduction strategy, is it sustainable?
3.4 Translation
The questionnaires were developed, field-tested, and revised first through AIDMI in September 2008. The surveys were translated into local languages and refined during the training sessions and after field-testing. The surveys were translated and conducted by the participating organizations in the following languages:
• AIDMI: Gujarati • Basix: Telegu (with Telegu/English responses) • Yasiru: Sinhalese • Proshika: Bangla • SEWA: Gujarati
Efforts were made to keep the meaning of each question however, with slight changes based on the translation into local language. In order to ensure that the surveys were completed correctly, a 3-5 day training program was undertaken for each organization. This allowed for detailed discussion on each question, and possible confusion or misunderstandings in the English as well as translated questionnaires. In the training session, a mock interview with a client was undertaken with all surveyors completing actual surveys. These were collected and graded in the class. Problem areas were discussed and followed by a subsequent survey of a non-client and graded to ensure that problem areas were resolved. In addition, surveyors were sent out in groups of 2-4 people with group leaders for each team. The group leader was responsible for reviewing surveys to ensure that they were adequately completed as well as monitoring team members while surveys were being conducted. The group leaders were trained on techniques for reviewing the completed surveys. Finally, after inputting had been completed through the online system, a review of responses was conducted and any anomalies or errors were discussed and rectified.
4. RESULTS
We start with some socio-economic variables of the respective households. Afterwards, we address the
issue of costs and benefits for the microinsurance products. The last part will deal with knowledge about microinsurance and interest in it.
4.1 Socio-demographic variables
Various socio-demographic variables where assessed, including variables on rural/urban locations main earning person, caste, religion, household size, and literacy rate (see Table 3).
78

IDRiM(2012)2(2) ISSN: 2185-8322 DOI10.5595/idrim.2012.0033
Table 3.Selected socio-demographic variables for the control and insured group
Control Group Insured Group Total number 531 1640 Living in rural area 70 percent (of total) 80 percent (of total) Majority of interviewed persons India (60 percent) India (60 percent) Main earning person Male (90 percent) Male (86 percent) Main Caste General caste (70 percent) General caste (60 percent) Main Religion Hindu (52 percent) Hindu (53 percent) People in household 6 (30 percent) 6 (23 percent) Literacy rate 70 percent 70 percent
The insured and control group are very similar with the exception of urban and rural location where the control group was 10 percent higher than the insured group in the former. The average size of client households was approximately 6 people of which 2 are children (this is the same for the control group). A greater prevalence of women in the insured group than in the control group was observed, i.e. forty-five percent of surveyed clients were male while 51 percent were female (4 percent of survey responses did not have clear values for gender) as compared with 60 percent male and 40 percent female in the control group survey. Disaster microinsurance clients self-reported the same literacy rates as their counterparts in the control group at 70 percent. An average of the national literacy rates of the three participating countries (India, Sri Lanka, Bangladesh) weighted with the increased participation from Indian organizations renders a tri-country literacy rate of 67.3 percent. For microinsurance clients, 31 percent did not have any formal education while all others had at least some kind of education but with substantial variation. Only 0.5 percent had achieved education beyond bachelor’s degrees. Similar to the control group, nearly 60 percent of clients belonged to the general caste, and 30 percent to Other Backward Castes (OBC). This question pertains only to India and Sri Lanka, which have caste systems. Regarding religion, disaster microinsurance clients are more or less the same as their counterparts in the control group with 53 percent Hindu for clients and 52 percent for the control, 25 percent Muslim for both clients and control, and 16 percent Buddhists for clients and 17 percent for control. The remainder comprised of other religions.
The average household income of disaster microinsurance clients is $105 per month, 17 percent below their neighbours in the control group at $126 (while the data is very skewed and the median income level is nearly equal in both groups, $87, non-parametric tests including Mann-Whitney statistics showing significant differences). Household expenses amount to the major part of income use at $78 per month for clients (74.3 percent of income) and $88 (69.9 percent) for non-clients. With an average of 6 people (4 adults and 2 children) in each household, this means that incomes are being considerably stretched. In terms of the individual incomes reported, microinsurance clients also made less with an average of $66 a month whereas their counterparts in the control group averaged $86 per month. Regarding income sources Table 4 shows the main sources of income for clients. As this is in percentage of total income, the information here must be treated with caution. Interestingly, farming, wage labour, and service jobs are the most widely reported for disaster microinsurance clients with primary incomes sources reported as farming (more than 50 percent to total income reported) with the remainder from trade and business. On the other hand, if an individual’s primary income source is wage labour, the other primary income source is income through service jobs. Therefore, in principle, one can distinguish between a sub-group of farmers/traders and a sub-group of people employed in the service industry.
Regarding the variables above significant differences between the insured and control group for the remittances and the trade variable were found (Mann-Whitney U tests were performed, p value was below 0.05 level, see Table 5).
79

IDRiM(2012)2(2) ISSN: 2185-8322 DOI10.5595/idrim.2012.0033
Table 4.Main sources of income for clients in percentage.
Remittances Husbandry/
Farming Wage labour
Trade/ Business
Service job
Government program
Other
Mean 26.3 54.3 47.9 44.5 52.3 17.9 25.8 Median 20 50 50 50 50 10 25 Std.Dev 20.5 32.4 22.2 24.0 21.9 15.9 15.9 Skewness 1.34 0.20 0.12 0.08 0.08 2.43 0.45
Table 5.Non-parametric tests between insured and control group regarding sources of income.
Remittances Husbandry/ farming
Wage Labour
Trade/ Business
Service job
Gov. Prog.
Other
Mann-Whitney U 232 87582 77530 40032 9943 1475 730 Wilcoxon W 298 115785 100321 173935 40324 4103 961 Z -2.137 -.588 -1.071 -4.085 -.526 -.003 -1.631 p-value .033 .556 .284 .000 .599 .997 .103
Income through remittances is significantly higher in the insured group, however, due to the low number of respondents in the control group (N=11) this result has to be treated with caution. Furthermore, it seems that in the control group income comes primarily from the trade/business sector compared to the insured group. If the variables are separated according to the sub-groups Farmer/Service worker, and perform the same test procedure, significant differences include the remittances variable as well, i.e. service workers get more remittances than farmers.
4.2 Costs of Microinsurance: Is it affordable?
Before examining whether clients felt they were being charged an amount that was affordable it is necessary to determine the relative cost of the microinsurance product. This can be done in terms of the potential payout as well as total annual household income. Table 6 shows the premium to coverage ratio for each of the products surveyed.
Table 6.Risks covered and pricing as a ratio of premium to coverage.
Country Name Risks covered Pricing: premium to
coverage Bangladesh Proshika Scheme 1 (PSS) Savings 50% Bangladesh Proshika Scheme 2 (ESSP) Loan 48% India AIDMI Life, property and contents < 1% Sri Lanka Yasiru Life 2% India BASIX Scheme 1 (All Haz) Property 1% India BASIX Scheme 2 (Index) Crops 9%
India SEWA Crops 10%
80

IDRiM(2012)2(2) ISSN: 2185-8322 DOI10.5595/idrim.2012.0033
While the Proshika schemes cover loans and savings, the organization only pays back twice the amount disbursed in case of a disaster. AIDMI, Yasiru and BASIX Scheme 1, on the other hand, focuses on life and property insurance and only charges a very small portion of the amount covered. Finally, the crop insurance arrangements providing coverage for relatively frequent drought events charge about 10 percent of the maximum coverage. In terms of annual household income, Figure 1 below shows the annual premium payments in percentage of annual household income.
Figure 1. Premiums paid in percentage of annual household income.
The premium rates are between 0.1 and 0.3 percent of annual household income, which seems to be small, but represent important opportunity costs as well as shown further down below.
Given the wide range of risks covered and premiums charged, surprisingly a large majority of people felt that they can afford the amount they pay. Nearly 77 percent stated that the amount they pay is okay, and surprisingly 11 percent stated it is too little, whereas a little less than 7 percent indicated that the amount they pay is too much. That also corresponds well with questions regarding the satisfaction of the features of the disaster microinsurance programs. This result is strengthened by the fact that most people who said the premium is too high also answered that to encourage more people to take disaster insurance, it is necessary to make it more affordable.
Regarding socio-economic dimensions, the responses of clients are more a function of wealth, e.g. family income, savings and debt which again strengthens the hypothesis that successful claims and affordability are the primary reasons in perceiving a right amount of premium being charged. Interestingly, differences between income and expenditure, i.e. net effects, play no role here. However, one obvious indicator is the experience of a successful claim and independent tests show a significant result. This is to say that people with successful claims tend to say that the premium charged is okay, while the ones without any successful claims or no claims yet tend to say that the premium is too high.
Overall, there seems to be indication that there is general willingness to pay for microinsurance services or that households of a certain income group are able to afford these products more than others. However, there still may be a large population of individuals poorer than the current clients which need to be served which could not afford the premium to join the program. This is especially in line with the
81

IDRiM(2012)2(2) ISSN: 2185-8322 DOI10.5595/idrim.2012.0033
results shown in Table 7 about the opportunity costs of microinsurance.
Table 7.Opportunity costs for insurance: Question: “If you were not paying for your disaster insurance policy,
what would you spend that money on?”
Item Percentage (Yes) House 13 Food 44 Household items 18 Livelihood-related 30 Lending money 1 Savings 23 Medical 6 Funeral 0 Children education 12 Marriage 1 Repay previous loan 2 Other 6
A reduction in food consumption and livelihood-related expenses has been found to be the primary
opportunity costs for disaster microinsurance. This includes spending on food (44 percent), livelihood-related expenses (30 percent), as well as savings (23 percent). All of them are the most basic needs of the poorest of the poor, which consequently do not have any option to be part of microinsurance schemes.
4.3 Benefits of Microinsurance
While affordability and opportunity costs were discussed before, the benefits of microinsurance are discussed next. Overall there is a positive perception that insurance can help reduce poverty. Nearly 90 percent of the insured group felt personally that microinsurance could help reduce poverty and more than 80 percent in the control group, many of which do not have any type of insurance. Therefore, one could argue that there is a perception of economic benefits of microinsurance. Furthermore, approximately 39 percent of disaster microinsurance clients also felt that insurance could prevent or lessen the need to borrow money after a disaster at least a little and for the control group, this was 24 percent (however, not significant, Chi-Square=0.296, df=2, p=.863). Furthermore, the findings have shown that microinsurance clients, in actual disaster situations, rely on additional borrowing, and there is a positive perception that microinsurance schemes could prevent or lessen borrowing in the future.
Does having money to “bounce back” after a disaster help individuals get back to work faster? In the study, analysis of the variable “number of days taken off” after a disaster did not reveal any significant difference. The number of working days lost due to a disaster event is, on average, 68 days for individuals with insurance and 66 days for the control group. The high level of days off may be correlated with the timing when individuals finally receive claims money, which has ranged from 1-3 months.
Getting money to clients in a timely way is important to ensure that needs are being met. Of the clients that filed a claim and received money, the majority (44 percent) indicated that they received it within one month of filing the necessary paperwork. However, a large number also received it after two months (26 percent), or three months (30 percent). There seems also a dependency between the time period in which money is received and how it will be spent. Table 8 gives a breakdown of expenses according to when claims money was received:
82
IDRiM(2012)2(2) ISSN: 2185-8322 DOI10.5595/idrim.2012.0033
Table 8.Expenditure of claims money by the time it was received in months (multiple responses possible).
1 month
(60 respondents, 44%) 2 months
(35 respondents, 26%) 3 months
(40 respondents, 30%) Food 65% 17% 45% Housing 50% 12% Livelihood 25% 17% 46% Medical expenses 10% 25% Savings 9% Other 24%
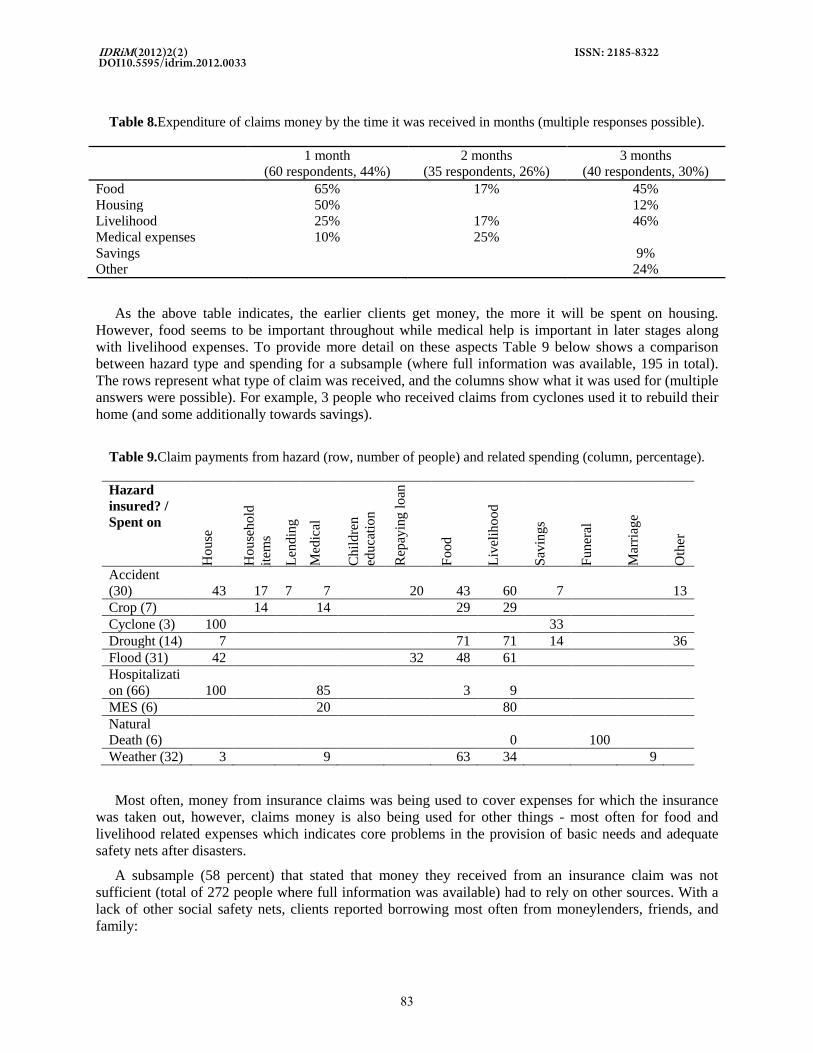
As the above table indicates, the earlier clients get money, the more it will be spent on housing. However, food seems to be important throughout while medical help is important in later stages along with livelihood expenses. To provide more detail on these aspects Table 9 below shows a comparison between hazard type and spending for a subsample (where full information was available, 195 in total). The rows represent what type of claim was received, and the columns show what it was used for (multiple answers were possible). For example, 3 people who received claims from cyclones used it to rebuild their home (and some additionally towards savings).
Table 9.Claim payments from hazard (row, number of people) and related spending (column, percentage).
Hazard insured? / Spent on
Hou
se
Hou
seho
ld
item
s
Lend
ing
Med
ical
Chi
ldre
n ed
ucat
ion
Rep
ayin
g lo
an
Food
Live
lihoo
d
Savi
ngs
Fune
ral
Mar
riage
Oth
er
Accident (30) 43 17 7 7 20 43 60 7 13 Crop (7) 14 14 29 29 Cyclone (3) 100 33 Drought (14) 7 71 71 14 36 Flood (31) 42 32 48 61 Hospitalization (66) 100 85 3 9 MES (6) 20 80 Natural Death (6) 0 100 Weather (32) 3 9 63 34 9
Most often, money from insurance claims was being used to cover expenses for which the insurance
was taken out, however, claims money is also being used for other things - most often for food and livelihood related expenses which indicates core problems in the provision of basic needs and adequate safety nets after disasters.
A subsample (58 percent) that stated that money they received from an insurance claim was not sufficient (total of 272 people where full information was available) had to rely on other sources. With a lack of other social safety nets, clients reported borrowing most often from moneylenders, friends, and family:
83

IDRiM(2012)2(2) ISSN: 2185-8322 DOI10.5595/idrim.2012.0033
• 29 percent from moneylenders with the most common interest rate of 36 percent • 22 percent from community or an organization (22 percent) with an average interest rate of 12
percent • 12 percent from Banks with interest rates ranging between 2 and 6 percent in the majority of
cases • 11 percent from friends with the most common interest rate of 3 percent • 5 percent from family (no interest rates could be calculated)
However, while many are borrowing to offset costs after a disaster, it cannot really be said that the
claim payments are not adequate. In some cases, additional funds are required for financing other things such as previous loans, increased need for basic provisions such as food, medical care, shelter, or to fill the gap through loss of livelihood such as farming income. What does emerge is a sense of high risk of indebtedness over a long period of time and need for additional insurance coverage.
Interestingly, the microinsurance client group prefers insurance more than the control group. Furthermore, more individuals in the control group prefer money from disaster relief after an event as compared to the insured group. More respondents in the control group prefer a combination of insurance and relief money while the opposite is true for the insured group (see Table 10).
Table 10.Percentage of people who would prefer money or insurance as disaster relief.
Insurance
(count/expected) Relief
(count/expected) Both
(count/expected) Other
(count/expected) Insured Group
29 (443/401)
3 (40/58)
62 (947/969)
3 (90/92)
Control Group
18 (88/129)
8 (37/19)
68 (37/19)
6 (31/30)
Note: expected means number of people under the assumption of independence between groups.
Statistical test (Chi Square and contingency coefficients) showing significant results, i.e. the Null hypothesis of independence between the two groups, can be rejected (p<0.001 for Chi –square and symmetric measures leading to significant results p<0.001, i.e. Cramers V= .146, p=.000). This could be interpreted that the already insured clients are more comfortable with pro-active instruments as possible disaster relief measures than the ones who did not have any experience with it. However, it also seems to be the case that the control group would like to be engaged in such instruments, but assume a need for both, e.g. disaster relief as well as insurance.
After most disasters, affected communities employ a number of coping strategies in the immediate aftermath. Figure 2 shows the post-disaster coping strategies employed by clients compared with the control group.
As illustrated, coping with disaster shocks on the household level can be achieved in multiple ways. However, some of them will more likely cause greater negative long-term consequences than others. Borrowing money, reducing expenditure, and taking out savings, are the primary coping mechanisms found for both clients and the control group. These are also the ones which can be expected to cause the lowest stress on future growth (see Morsink et al. 2011). However, more stressful coping strategies are also employed, e.g. sell land or assets. This can be expected to have serious consequences on long-term development and therefore can be seen as strategies of last resort. Significant differences (using Chi-square tests) between the insured and control group for the different coping strategies mentioned in the survey were found only in terms of the need to borrow money, with more people in the insured group
84

IDRiM(2012)2(2) ISSN: 2185-8322 DOI10.5595/idrim.2012.0033
mentioning this option compared to the control group. Microinsurance does not seem to be decreasing the need for such coping capacities in comparison to the control group. The different effects of these options and the ordering of instruments used to cope with the disaster for specific households has therefore been taken into account for studying poverty dynamics and microinsurance instruments.
Figure 2.Responses for post-disaster coping strategies by organization and control group.
4.4 Knowledge Information about Microinsurance
Is the problem in growth of disaster microinsurance penetration the lack of awareness and information? For the surveys completed by people without insurance, the following question had to be reported at the end of the interview to assess this issue, “Did the person voluntarily request information on the program or express interest in joining?” It was found that spending just 15-30 minutes interviewing individuals while explaining how disaster microinsurance worked had a very positive outcome. At the end of the survey, 18 percent of individuals interviewed expressed interest in joining the insurance scheme, 32 percent expressed interest in getting more information, while another 31 percent requested both – getting more information and joining (Table 11). This is evidence of the important role of information and awareness-building and the future work of organizations involved in this area. While it was important that the interviewed person voluntary ask for such additional information, it is however difficult to say if this was really the case. Hence, there could be a bias within the results.
Table 11.Interest in information or joining the program.
Percent of total Information 31.9 Joining 17.5 Both 30.9 None 7.7 No Answer 12.2
The importance of awareness rising and information about these products is strengthened by the fact that around 60 percent of the insured group received first information about microinsurance products through visits from organizations (NGOs), and (30 percent) through their village community (neighbours
85

IDRiM(2012)2(2) ISSN: 2185-8322 DOI10.5595/idrim.2012.0033
and friends). A large number of respondents (81 percent) think that insurance should be promoted to others, whereas only a minority (2.3 percent) thinks that it should not. Interestingly, another 11 percent are unsure if this is a good idea. This could be also due to possible under information of the clients of how insurance is working, which was stated very often.
5. CONCLUSION
The results of this study show a general interest in and willingness towards paying for disaster microinsurance programs in South Asia. The products are reaching poor clients, many who are below the poverty line, highly in debt, and employ limited and difficult coping mechanisms after disasters. However, the findings also have shown that clients had difficulties with the claim process (but with adequate help being provided by organizations) and inadequate coping capacities with a number of individuals borrowing additional funds from money lenders, friends, and family. Clients usually have high existing levels of indebtedness, which only get exacerbated after disasters which calls for a review of modification in product offerings and other risk managing financial services and safety nets in combination with disaster microinsurance. In addition, there is a need to review products and potential clients in communities to ensure that although “the poor” are being served, “poorer than the poor” are not being excluded due to costs and information barriers. As the opportunity costs are mostly food and livelihood related this is an important issue to be considered in the future. It was already stated in the literature (see Barret et al. 2007; Pflug et al. 2011) that different initial wealth levels (or asset levels) will demand different risk management strategies. That being said, it may be the case that for the poorest of the poor, subsidies have to be granted as well as technical assistance (see Linnerooth-Bayer et al. 2011).
Awareness and information seems to be the key to increase disaster microinsurance penetration in the region. The study signalled high demand for disaster microinsurance after non-insured clients had been given information showing the relevance and pricing of such products as well as the power of organizations to reach more clients simply through outreach. An overwhelming majority (80 percent) of clients feel that disaster microinsurance should be promoted to others while only a minority (2.3 percent) thinks it should not.
With disaster microinsurance in its infancy in the region, a number of things are required which are beyond the scope of the study. This include research in the promotion of regulatory systems in countries that do not have a legal apparatus for microinsurance, increasing possibilities for reinsurance options, and diversifying of delivery models. Based on the empirical results of this study some priority activities and interventions can be recommended.
First, the client community should be utilized to increase awareness and augment insurance penetration. Microinsurance organizations should work to create innovative ways to involve the community in outreach and awareness generation of disaster microinsurance. Client satisfaction is high and as the study has shown, an overwhelming majority is ready to refer friends to the program. Second, while microinsurance can help in case of disastrous events, the additional losses not covered by the contract are still too large to effectively cope through personal resources. Hence, indebtedness usually goes up even for those with microinsurance and therefore they may be even more vulnerable against a upcoming disaster than before. A holistic approach in disaster risk management on different levels should be performed including risk reduction strategies as well as long-term economic growth perspectives. Thirdly, as the dynamics of wealth over a longer time horizon for different wealth classes and different products and hazards are still poorly understood at the empirical level (see Carter et al. 2009 as an exception than a rule) it is important to study mechanisms that keep households on low-growth paths (Antman and McKenzie, 2007) or even into poverty traps (Bowles et al. 2006). It should also be noted that it is usually not just one type of risk, such as natural disaster events, that plays a role for the client
86

IDRiM(2012)2(2) ISSN: 2185-8322 DOI10.5595/idrim.2012.0033
community but other risks as well. Hence, bundled products may be a possibility to increase the demand for such microinsurance schemes. If they are constructed well and cover a large set of independent risks, they could be pooled together over larger regions and therefore decreasing premiums. This would also decrease the need for subsidizing the products to make them affordable, thus creating a market that would be less dependent on donors. Livelihood model approaches should shed more light on these issues, which are important also from a risk management perspective.
REFERENCES
Antman, Francisca and David McKenzie. 2007. "Poverty traps and nonlinear income dynamics with measurement error and individual heterogeneity." The Journal of Development Studies 43(6): 1057-1083.
Barrett, Christopher B., Barnett, Barry J., Carter, Michael R., Chantarat, Sommarat, Hansen, James W., Mude, Andrew G., Osgood, Daniel, Skees, Jerry R., Turvey, Calum G. and Ward, M. Neil. 2007. Poverty Traps and Climate Risk: Limitations and Opportunities of Index-Based Risk Financing. IRI Technical Report 07-03. Columbia University, New York: The International Research Institute for Climate and Society.
Bhattamishra, Ruchira, and Christopher B. Barrett. 2008. "Community-Based Management Arrangements: An Overview and Implications for Social Fund Program Design.” Social Protection Discussion Papers 46333. Washington DC: The World Bank.
Bowles, S., Durlauf, S.N. and Hoff, K., 2006. Poverty traps. New York: Russell Sage Foundation.
Brown, Warren and Craig Churchill. 2000. Insurance Provision to Low-Income Communities, Part II, Initial Lessons from Microinsurance Experiments for the Poor, Microenterprise Best Practices Project, Bethesda, MD, USA.
Carter, Michael R., and Christopher B. Barrett. 2006. “The Economics of Poverty Traps and Persistent Poverty: An Asset-Based Approach.” Journal of Development Studies 42: 178-199.
Churchill, Craig. 2006. Protecting the Poor: A Micro-Insurance Compendium. Geneva: International Labour Office.
Cohen, Monique and JenneferSebstad. 2003. Reducing Vulnerability: The Demand for Microinsurance. MicroSave-Africa.
Cohen, Monique and Michael J. McCord. 2003. “Financial Risk Management Tools for the Poor.” In Microinsurance Centre Briefing Note #6, ed. ADA.Microinsurance Centre.
Consultative Group to Assist the Poor. 2003. Microinsurance: A Risk Management Strategy. Donor Brief No. 16, Consultative Group to Assist the Poor, Washington, DC.
CRED. 2010. EM-DAT: International Disaster Database. Brussels, Belgium, Centre for Research on the Epidemiology of Disasters (CRED), UniversitéCatholique de Louvain.
Dilley, Maxx, Robert S. Chen, UweDeichmann, Arthur L. Lerner-Lam, and Margaret Arnold. 2005. Natural Disaster Hotspots: A Global Risk Analysis. Washington, D.C.: World Bank Publications.
Gine, Xavier. 2005. “Weather Insurance in India. Survey Findings”.Presentation at BASIX Quarterly Review & Insurance Meeting, Hyderabad, India.
Gurenko, Eugene. 2004. Catastrophe risk and reinsurance: A country risk management perspective. London: Risk Books.
Gurenko, Eugene. 2010. "Disaster Risk Financing in the Countries of South Asia." Unpublished Technical Paper.
87

IDRiM(2012)2(2) ISSN: 2185-8322 DOI10.5595/idrim.2012.0033
Hess, Ulrich and Joanna Syroka. 2005. Weather-Based Insurance in Southern Africa. The Case of Malawi. Washington, D.C.: World Bank.
Jayasuriya, Sisira and Peter McCawley. 2010. The Asian tsunami: aid and reconstruction after a disaster. Cheltenham: Edward Elgar.
Kono, Hisaki and Kazushi Takahashi. 2010. “Microfinance Revolution: Its Effects, Innovations, and Challenges.” The Developing Economices 48:15-73.
Kovacevic,Raimund and Georg Ch. Pflug. 2011. “Does insurance help to escape the poverty trap? – A ruin theoretic approach.”The journal of Risk and Insurance 78 (4): 10003-1028.
Linnerooth-Bayer, Joanne, Mechler Reinhard and Georg Pflug. 2005. "Refocusing Disaster Aid." Science 309 (5737): 1044-1046.
Linnerooth-Bayer, Joanne and Reinhard Mechler. 2007. “Disaster Safety Nets for Developing Countries: Extending public-private partnerships.” Environmental Hazards 7: 54-61.
Linnerooth-Bayer, Joanne, Reinhard Mechler, and Stefan Hochrainer-Stigler. 2011. „Insurance against Losses from Natural Disasters in Developing Countries. Evidence, Gaps and the Way Forward.” Journal of Integrated Disaster Risk Management 1(1): 1:23.
Mayoux, Loinda. 2005. "Women’s Empowerment through Sustainable Micro-Finance: Rethinking Best Practice". http://www.genfinance.info/Documents/Mayoux_Backgroundpaper.pdf (accessed 1 April 2012)
Mechler, Reinhard, Joanne Linnerooth-Bayer and David Peppiatt. 2006. Microinsurance for Natural Disasters in Developing Countries: Benefits, Limitations and Viability. ProVention Consortium, Geneva. http://www.proventionconsortium.org/themes/default/pdfs/Microinsurance_study_July06.pdf. (accessed 1 April 2012)
Meijer, Siet, Christopher Pusch, and Ranu Sinha. 2009. “Natural Disaster.” In South Asia: Shared Views on Development and Climate Change. World Bank, South Asia Region Sustainable Development Department, Washington, DC.World Bank. Chapter 8: 109-118.
Morsink, K., Geurts, P. and Kooijman-van Dijk, A. 2011. “Impact of microinsurance on vulnerability of low income households in the Philippines: the case of typhoon re-housing insurance”. Proceeding of the Second European conference on microfinance, Groningen, pp. 1-37.
Thomas, Jeanette. 2005. “A Microfinance Institution Perspective,” in Invest to Prevent Disaster, United Nations International Strategy for Disaster Relief, Geneva, Switzerland.
World Bank. 2003. Financing rapid onset natural disaster losses in India: a risk management approach. Washington, DC: World Bank.
88