Embed Size (px)
Citation preview

Journal of International Technology and Information Management Journal of International Technology and Information Management
Volume 23 Issue 3 Double Issue 3/4 Article 6
2014
The Study of Competitive Priorities and Information Technology The Study of Competitive Priorities and Information Technology
Selection: Exploring Buyer and Supplier Performance Selection: Exploring Buyer and Supplier Performance
Thawatchai Jitpaiboon Ball State University
Follow this and additional works at: https://scholarworks.lib.csusb.edu/jitim
Part of the Management Information Systems Commons
Recommended Citation Recommended Citation Jitpaiboon, Thawatchai (2014) "The Study of Competitive Priorities and Information Technology Selection: Exploring Buyer and Supplier Performance," Journal of International Technology and Information Management: Vol. 23 : Iss. 3 , Article 6. Available at: https://scholarworks.lib.csusb.edu/jitim/vol23/iss3/6
This Article is brought to you for free and open access by CSUSB ScholarWorks. It has been accepted for inclusion in Journal of International Technology and Information Management by an authorized editor of CSUSB ScholarWorks. For more information, please contact [email protected].

Study of Competitive Priorities and IT Selection: Exploring Buyer & Supplier Performance T. Jitpaiboon
© International Information Management Association, Inc. 2014 91 ISSN: 1543-5962-Printed Copy ISSN: 1941-6679-On-line Copy
The Study of Competitive Priorities and Information Technology
Selection: Exploring Buyer and Supplier Performance
Thawatchai Jitpaiboon
Department of Information Systems and Operations Management
Miller College of Business
Ball State University
USA
ABSTRACT
Competitive priorities are the critical operational dimensions a process or supply chain must
possess to satisfy its internal or external customers. The concept of competitive priorities is very
important to organizations because it helps them set up achievable goals and it has long been
known to be associated with organizational performance. This research introduces an
alternative theory to explain the mechanism by which the buying firms and suppliers adopt
different competitive priorities as they enter into buyer-supplier relationships and to explore
further how technology choices influence the competitive priority adaptation. Using empirical
data collected from the Society of Manufacturing Engineer’s executives, a confirmatory factor
analysis was used to refine the measurement. The measures were refined to satisfy key
measurement rigors including convergent validity, discriminant validity, and reliability. The
structural model results show that suppliers’ adaption of competitive priorities and IT use is
largely influenced by buyers’ level of competitive priorities and IT use; however, there is no
clear relationship pattern relating to suppliers’ competitive priorities and IT use.
INTRODUCTION
Competitive priorities are the critical operational dimensions a process or supply chain must
possess to satisfy its internal or external customers, both now and in the future (Krajewski,
Ritzman, & Malhotra, 2013). The concept of competitive priorities is very important to
organizations because it helps set up achievable goals when implementing corporate plans into
operational plans. The competitive priorities help organizations set the right course of actions for
process selection. When process capabilities fall short of the predetermined competitive priorities,
they must be re-determined and re-focused to close the gap or else revise the priority. There are
five common groups of competitive priorities namely cost, quality, time, flexibility and
innovation. Finding the right competitive priorities does not happen overnight, many companies
struggle for years when making decisions regarding different competitive priorities. Nowadays,
large organizations such as Wal-Mart employ information technology (IT) to help achieve
competitive priority strategy. Wal-Mart embraced the Retail Link System technology (a
mammoth database located in Bentonville, Arkansas) to become an innovator in the way stores
track inventory and restock their shelves. Through a global satellite system, Retail Link is
connected to analysts who forecast supplier demands to the supplier network, which displays
real-time sales data from cash registers and to Wal-Mart’s distribution centers. In the buyer-
supplier relationships, information technology is changing the way organizations operate. The

Journal of International Technology and Information Management Volume 23, Numbers 3/4 2014
© International Information Management Association, Inc. 2014 92 ISSN: 1543-5962-Printed Copy ISSN: 1941-6679-On-line Copy
competitive priority strategy of Wal-Mart provides a good example to describe how
organizations’ technology selection may affect the changes in competitive priorities.
Technology selection is an imperative decision for organizations to gain competitive advantage
over their rivals. Organizations must choose the right technology to either achieve low cost
operations or find ways to differentiate themselves through the latest innovation. Firms choose to
implement information technology (IT) to connect with customers, enabling them to recognize
individual preferences, tailor products accordingly, produce in a timely manner, and sell at a
reasonable price (Sophie Lee et al., 2000). Through information networks, organizations work
closely with suppliers, sharing accurate and timely information (Tracey et al., 1999; Dean et al.,
2009). Unfortunately, current literature provides limited support for what constitutes IT selection
and how it affects competitive priorities and eventually organizational performance.
Although there are several attempts to understand the link between IT selection and competitive
priorities, opportunity remains to extend scholarly research to delineate the relationships between
IT selection and competitive priorities within the buyer-supplier relationship. The intention of
this research is to formulate general ideas portraying how IT selection relates to competitive
priority adaptation and in turn leads organizational performance. There has not been much
research for this attempt; therefore, this research should be considered exploratory in nature.
Hopefully, the results will be useful to provide a new platform for practitioners and academicians
trying to have a deeper understanding of competitive priorities.
In the next section of the paper, the literature on competitive priorities and IT selection will be
reviewed. Based on the literature, the conceptual model will be developed and research
hypotheses will be discussed. The data is gathered using a questionnaire survey. Rigorous
research methodologies will be employed to ensure measurement reliability and validity. The
structural equation modeling (SEM) will be used to test hypotheses. The results will be presented
along with implications.
LITERATURE REVIEW
Competitive Priorities and Competitive Priority Measures
Regarding the measurement of competitive priorities, there is broad agreement that competitive
priorities can be expressed in terms of at least five basic components: low cost, quality, delivery
time, flexibility, and innovativeness (e.g., Fine & Hax, 1985; Wheelwright, 1984; Leong, Snyder,
& Ward, 1990; Ferdows & De Meyer, 1990; Vickery, 1991; Vickery et al., 1993). Especially,
Leong, Snyder, and Ward (1990) reported innovativeness as the fifth competitive priority;
however, innovativeness has not been operational as a competitive priority in empirical study in
their study. Vickery, Droge, and Markland (1994) developed a system to assess reliability and
validity of the measures used to assess the various competitive priorities. Youndt et al. (1996)
used cluster analysis to analyze 97 manufacturers across four manufacturing strategies
orientation which is later known as competitive priorities (quality, delivery flexibility, scope
flexibility, and cost). Though their main objective was not to develop or test any taxonomy of
manufacturing strategy, their findings have a bearing on competitive priority research. Their
findings yielded five groups of manufacturers, which they labeled by the emphasis on

Study of Competitive Priorities and IT Selection: Exploring Buyer & Supplier Performance T. Jitpaiboon
© International Information Management Association, Inc. 2014 93 ISSN: 1543-5962-Printed Copy ISSN: 1941-6679-On-line Copy
corresponding manufacturing strategies as: (1) quality emphasis, (2) cost and quality emphasis,
(3) cost, quality, delivery and delivery flexibility and scope flexibility emphasis, (4) quality and
delivery flexibility emphasis, and (5) no strategic emphasis. However, they did not find these
strategy clusters to have any direct impact on manufacturing performance. Ward et al. (1998)
discussed important dimensions to evaluate the extent of competitive priorities using factor
analysis. In their study, Cost Importance competitive priority includes production costs, labor
productivity, capacity utilization, reducing inventory, cost and productivity; Quality Importance
competitive priority includes high product performance, high product durability, high product
reliability, ease to service product, promptness in solving customer complaints, and conformance
to design specs; Delivery Time Importance competitive priority includes short delivery time,
delivery on due date, reduced production lead time, on-time delivery, and production cycle time;
and Flexibility Importance competitive priority includes large number of product features or
options, new products into production quickly, rapid capacity adjustment, and design changes in
production.
Jayaram et al. (1999) examined the linkage between human resource management practices and
four dimensions of competitive priority – quality, cost, flexibility, and time. Santos (2000)
identified human resource management policies appropriate for each of the four competitive
priorities. In the study, competitive priority includes Cost (to offer products and/or services with
the lowest price), Quality (to offer with high performance, to differentiate products from
competitors, to delivery appropriate technical assistance, to build and improve products and
company image, and to improve products reliability and durability), Delivery performance (to
manufacture products with agility, to warrant reliability of delivery deadline, to provide technical
assistance services with replacement parts), and Flexibility (to change product designs or to
launch new products quickly, to offer a broad product mix, and to change the production volume
quickly). Frohlich and Dixon (2001) added Service as the fifth variable to measure competitive
priority in addition to Price, Quality, Delivery, and Flexibility.
Makadok (2001) defined capabilities as special types of resources that can enhance productivity
of other resources. Low cost, high quality, reliable, fast delivery and product mix (variety and
volume) are considered to be the most essential capabilities (Wheelwright, 1984). Ahmad and
Schroeder (2003) investigated the impact of seven human resource practices on an aggregate
operational performance measure, and examined whether the use of these practices differed by
country or industry. Diaz et al. (2005) investigated the relationship between competitive
priorities and performance of investment in AMT (advanced manufacturing technologies) in
different organizational size. In their study, costs (inventory reduction, increase in utilization of
capacity, reduce production costs, and increase in labor productivity), quality (to offer high
performance products, consistent quality with low defect rate, and to offer reliable products),
deliveries (reduction of lead times, fast deliveries, and meet promised delivery times), and
flexibility (fast introduction of new products, fast changes in design, adjust capacity quickly, fast
volume changes, offering a wide variety of products, and fast changes in product mix) were used
to measured competitive priority. Peng et al. (2010) defined competitive priorities as a strategic
emphasis on developing certain intended competitive capabilities such cost, quality, delivery and
flexibility.

Journal of International Technology and Information Management Volume 23, Numbers 3/4 2014
© International Information Management Association, Inc. 2014 94 ISSN: 1543-5962-Printed Copy ISSN: 1941-6679-On-line Copy
In 2011, Prajogo and McDermott modified competitive priorities from previous studies and
developed a new set of priorities consistent with a service setting. Their priorities comprised of
conformance to specification, service innovation, customer retention, speed, service delivery,
responsiveness, brand image, cost effectiveness, productivity, and service recovery. Saarijarvi et
al. (2012) used a pairwise comparison method to assess competitive priorities within the supply
chain. They introduced a case study of a supply chain within the packaged food industry to
illustrate the assessment. In the study, six competitive priorities were employed including cost
efficiency, speed, reliability, innovativeness, flexibility, and collaboration. Kruger (2012) studied
the strength and importance of competitive priorities for South African businesses using five
dimensions including quality, cost, speediness, dependability, and flexibility.
The literature review shows that the measurement of competitive priorities is well documented.
Following the majority of previous studies, the current study proposes five dimensions to capture
the concept of competitive priority which include (1) cost leadership, (2) product quality, (3)
delivery reliability, (4) process flexibility, and (5) innovation. The context of this study is a
manufacturing environment; therefore, the concept of competitive priority is reported for both
buying firms and suppliers. See Appendix A for detailed items.
IT Selection
IT selection is defined as technology choices organizations choose to affect changes in the
supply chain. Based on the literature, IT selection can be categorized into three groups based on
how it is utilized namely (1) strategic, (2) operational, and (3) infrastructural.
IT can have a strategic role and a direct and favorable impact on value creation by building
linkages with a firm’s customers and suppliers (Soroor et al., 2009) that lead to better products,
enhanced productivity, higher quality, better equipment utilization, reduced space needs, and
increased flexibility (Kim & Narasimhan, 2002). Porter and Millar (1985) asserted that IT use
has a significant influence on activities of the firm by creating more value for customers,
integrating information and material flows, and facilitating the development of new value chains.
In the current study, the term Planning IT use portrays how well an organization uses IT for
strategic reasons such as long-term planning, proactiveness and internal and external analysis.
Planning IT use is the extent to which a firm uses IT to formulate, justify, and improve long-
range business planning and decision making (Jitpaiboon, Ragu-Nathan, & Vonderembse, 2006).
Operational IT use is the extent to which a firm uses IT for monitoring, justifying, improving,
and controlling day-to-day operational decision processes (Sabherwal & Chan, 2001; Jitpaiboon,
Ragu-Nathan, & Vonderembse, 2006). This captures IT use for value creation activities
(Narasimhan & Kim, 2001). Operational IT usage promotes the improvement of daily operations
the meet operational goals. Narasimhan and Kim (2001) proposed measuring information
systems (IS) utilization with three sub-constructs: (1) IS for infrastructural support (e.g.,
accounting information systems and office information systems); (2) IS for value creation
management (e.g., production plan and process control, sales and price management, and
inventory and warehouse management), and (3) IS for logistical operations (e.g., transportation
management, automatic ordering, and warehouse location selection).

Study of Competitive Priorities and IT Selection: Exploring Buyer & Supplier Performance T. Jitpaiboon
© International Information Management Association, Inc. 2014 95 ISSN: 1543-5962-Printed Copy ISSN: 1941-6679-On-line Copy
Infrastructural IT use is the extent to which a firm uses IT to facilitate information sharing and
data communication, recommend standards for IT architecture, implement security, and
coordinate work activities (Jitpaiboon, Ragu-Nathan, & Vonderembse, 2006). In this study, the
Infrastructural IT use consists of two major components: Data Integration and Network
Integration (Wyse & Higgins, 1993; Bhatt, 2000). Data Integration deals with standardization of
data, definitions, formats, and presentations of information. Network Integration involves system
connection and communication tools, information sharing, and network infrastructures.
Buyer performance
Buyer performance (BP) is the extent to which a buying firm fulfills its market and financial
goals. Wisner (2003) studied the effects of supply chain management strategy on BP, which can
be measured by market share, return on assets, overall product quality, overall competitive
position, and overall customer service level. BP is a key outcome measure given that a firm’s
manufacturing capabilities such as cost, quality, flexibility, and delivery can be linked to its
competitive priorities (Taps & Steger-Jensen, 2007). Rosenzweig et al. (2003) used four items to
measure business performance including pre-tax return on assets, percentage of revenues from
new products, overall customer satisfaction, and business unit sales growth. Frohlich (2002) used
two items to measure e-business performance: annual percent of procurement using the Internet
and annual percent of sales/turnover using the Internet. Narasimhan and Kim (2002) used sales
growth and market share growth with a three year look-back, profitability, return on investment,
return on assets, revenue growth, financial liquidity, and net profit to measure BP. With concern
for rigor and consistent with previous scholarly work, herein BP is measured by customer
retention rate, sales growth, return on investment, production throughput time, and overall
competitive position. See Appendix A for detailed items.
The next section of this paper discusses the theoretical framework and hypotheses. The following
section describes research methodology. The subsequent section presents the results, and the
final section discusses the implications of the research findings for researchers and practitioners.
COMPETITIVE PRIORITY ADAPTATION FRAMEWORK FOR IT
SELECTION AND HYPOTHESES
Competitive Priority Adaptation Framework
The topic of competitive priorities was first brought about in operations management by Skinner
(1969). Skinner identified competitive priorities for two furniture manufacturers as one
manufacturing a low-cost product line and the other making high-price, high-style furniture. He
stated that the two manufacturers would need to develop different policies, personnel, and
operations to be able to carry out their strategies successfully. Early researchers in manufacturing
strategy (Wheelwright, 1984; Skinner, 1985) considered the competitive priorities to be mutually
exclusive. They maintained that a manufacturer has to choose between conflicting competitive
priorities, such as delivery and flexibility. Skinner (1996) later accepted the notion that choosing
competitive priorities could be dynamic. He maintained that some trade-offs do exist such as
between quality and cost. The concept of manufacturing trade-offs is now being challenged.
Based on a study of Japanese manufacturers, Nakane (1986) noted that they were developing

Journal of International Technology and Information Management Volume 23, Numbers 3/4 2014
© International Information Management Association, Inc. 2014 96 ISSN: 1543-5962-Printed Copy ISSN: 1941-6679-On-line Copy
manufacturing competitiveness through the progressive build-up of capabilities: by developing,
first, quality as the foundation capability, followed by dependability, then cost and, lastly
flexibility. Then, while Nakane’s observation concerned how the Japanese were competing, Hall
(1987) suggested that manufacturers should pursue a step-wise progression through the
capabilities, and offered as a typical goal progression: quality improvement; dependability; cost
reduction; and then flexibility. Ferdows and De Meyer (1990) investigated both the trade-off
model and the cumulative model using data from the European Manufacturing Futures Project.
While finding the evidence somewhat inconclusive, they rejected the trade-off model and cited
some support for a cumulative model. Formally proposing a cumulative model for lasting
improvements (referred to as the “sand cone” model), they suggested that the order and manner
in which manufacturing capabilities are built can change the nature of trade-offs, so that one
capability is not necessarily at the expense of another. The sand cone model starts with quality at
the base, followed by dependability, flexibility and then cost-efficiency, differing slightly from
the order suggested by both Nakane and Hall. Safizadeh et al. (2000) observed that different
patterns of trade-offs exist in plants with different production processes. Pagell et al. (2000)
found the existence of trade-offs at higher levels, as well as evidence of simultaneous
improvements along multiple competitive dimensions. Boyer and Lewis (2002) found no trade-
off between quality and cost, but asserted that some other trade-offs between competitive
priorities still remain. Swink et al. (2005) stated that “a growing literature suggests that
capabilities are mutually reinforcing or cumulative”. Recognizing this trend, this research
pursues multiple competitive priorities simultaneously.
Currently, the previous literature suggests two models explaining the dynamic of changing
competitive priorities organizations experience. The first model so called “Trade-Offs” model
suggests organizations may progress from one competitive priority at the lower level to the
higher level one (Wheelwright, 1984; Skinner, 1985; Skinner, 1996). This suggests typical
organizations such as Wal-Mart start out by offering products at low cost to customers and then
eventually when opportunities present, they pursue the higher level priority by offering higher
quality and highly customized products. With the new competitive priority, the organizations
will no longer be interested in offering the products at low cost. The trade-offs model implies
that organizations must choose one specific priority over another in a progressive manner. This is
also supported by Hall and Nakane (1990) who suggested organizational competitive priority
progressively evolves from quality improvement to dependability to cost reduction to flexibility
to a company-developed culture to innovation. The second model so called the “Sand Cone”
model suggests the selection of competitive priorities is mutually reinforcing or cumulative
(Swink et al., 2005; Nakane, 1986; Hall, 1987; Ferdows & De Meyer, 1990). The theory explains
organizations may start out at the lower end of competitive priorities and progressively build up
to the higher end in a stepwise manner. Ferdows and De Meyer (1990) suggested the
organizational competitive priority starts with quality at the base, followed by dependability,
flexibility, and then cost-efficiency. The sand cone model implies one capability is not
necessarily at the expense of another; therefore; organizations such as Wal-Mart may choose to
offer high quality and customized products and somehow manage to offer at a reasonable price
comparable to competitors.
Both theories are legitimate depending on different circumstances (e.g., products, type of
organizations, technologies, and etc.). For example, the sand cone model can be used to explain

Study of Competitive Priorities and IT Selection: Exploring Buyer & Supplier Performance T. Jitpaiboon
© International Information Management Association, Inc. 2014 97 ISSN: 1543-5962-Printed Copy ISSN: 1941-6679-On-line Copy
how Dell Computer can offer both highly customized laptop computers with consistent quality
and still manage to be competitive on price. On the other hand, the trade-offs model can possibly
be used to explain the product offerings at Best Buy. Best Buy is less likely to offer low cost
products when customers demand high quality and customization. Although both models are
equally important in explaining competitive priority adaptable within organizations; the theories
lose their integrity when dealing with supply chain relationship. In both trade-offs and sand cone
models, the competitive priority dynamism in buyer-supplier relationship is not taken into
account. In the supply chain environment, organizations commonly form cooperative
relationship with each other. Manufacturing firms or Buyers, commonly a large enterprise, are at
the forefront when initiating and implementing buyer-supplier relationships (Harrison, 1992;
Blenckhorn & Noon, 1990; O’Neal & Bertrand, 1991). Buyers are more likely to form stronger
relationships with suppliers through greater purchasing power as they are mainly interested in
minimizing risk by using single or dual-sourcing (Sinclair, Hunter, & Beaumont, 1996). As a
result, buyers are likely to initiate changes from one competitive priority to another and use
purchasing muscle to force changes to suppliers as a contractual condition (Lascelles & Dale,
1989). In typical situations, buyers force their suppliers to implement new processes and invest
in new technologies such as e-commerce, ERP systems, flexible machines, and CAD equipment
just to maintain equivalent level of competitive priority (Matthyssens & Bulte, 1994). Suppliers
seldom take a proactive role in initiating or implementing a new priority (Bertrand, 1986). Rather
they concentrate on complying with buyers’ requirements in order to remain in the shrinking
supplier base. To better explain the competitive priority mechanism in the buyer-supplier
relationship, this study proposes an alternative model called Influential Adaptation Model.
Influential adaptation model provides a broader theory to explain how a buyer firm’s competitive
priority can influence a competitive priority of a supplier. Figure 1 shows influential priority
adaptation framework.

Journal of International Technology and Information Management Volume 23, Numbers 3/4 2014
© International Information Management Association, Inc. 2014 98 ISSN: 1543-5962-Printed Copy ISSN: 1941-6679-On-line Copy
Figure 1: Influential Adaptation Model of Competitive Priorities.
Recently, some scholars have suggested that a supply chain relationship between buyers and
suppliers should be seen as a distinctive resource or capability. Buyer-supplier relationship
developed over time could become the basis of a rich information network, thereby enabling
firms to form new alliance opportunities with reliable suppliers (Gulati, 1995; Powell et al.,
1996). A firm’s competitive position is affected by its suppliers’ abilities to respond to the firm’s
requirements. Studies have shown that collaboration with suppliers can reduce transaction costs
(Dyer, 1997). For example, Dell Computer manages all the transactions over the Internet,
leaving the real operational activities in the hands of the suppliers (Swink, Narasimhan, & Kim,
2005). In the literature, supplier performance is considered one of the determining factors for the
buyers’ operational success (Monczka et al., 1983; Baxter, Fersuson, Macbeth, & Neal, 1989;
Ellram, 1991; Davis, 1993; Levy, 1997). Harley-Davidson has reported that supplier
involvement has improved its overall quality, reduced costs, and helped Harley-Davidson
compete against Japanese manufacturers (Carr & Pearson, 2002). Gulati (1999) noted that the
information advantage realized as a result of ties with suppliers could be conceptualized as a
network resource, which is similar to the Coleman’s 1988 notion of social capital. Network
resources are similar to financial and technological resources. As noted above, firm managers
determine the types of resources they wish to accumulate over time, and the accumulation of
resources is likely to have a path dependent component that eventually ends up at the suppliers’
site (Dierickx & Cool, 1989). Therefore, firm managers’ discretionary choices relating to how to
compete and what resources and capabilities to acquire over time are likely to determine the
level of supply chain relationship they wish to pursue with suppliers. Influential adaptation
model (Figure 1) suggests that both buyers and suppliers start out at the lower end of competitive
priorities such as low cost operation and gradually progress to the higher end of the competitive
Influential Priority Adaptation
Innovation
Process Flexibility
Delivery Reliability
Product Quality
Cost Leadership
Innovation
Process Flexibility
Delivery Reliability
Product Quality
Cost Leadership
Buyers’ Competitive
Priorities
Suppliers’ Competitive
Priorities
Low
Prio
rity H
igh P
riority
Low
Prio
rity H
igh P
riority

Study of Competitive Priorities and IT Selection: Exploring Buyer & Supplier Performance T. Jitpaiboon
© International Information Management Association, Inc. 2014 99 ISSN: 1543-5962-Printed Copy ISSN: 1941-6679-On-line Copy
priorities such as consistent quality, top quality, delivery reliability, volume flexibility, and
innovation; however, they adopt each competitive priority at a different rate. Normally, firm
managers initiate decisions to adopt a new competitive priority when they realize there is a
mismatch between competitive strategy and supply chain ties (e.g., customers, suppliers,
distributions, or competitors) that could deteriorate firms’ competitive advantage. This notion
holds true in the buyer-supplier relationship. The mismatch of competitive priorities between the
two parties should warrant the changes in competitive priority to the higher spectrum. Since
buyers are in the upper hand of the relationship. The changing is normally initiated by the buyers.
It has been suggested that firms should participate in supply chain networks that are consistent
with their product offerings (Krause et al, 1998; Fisher, 1997). Fisher (1997) suggested that
innovative production should utilize responsive supply chain networks, whereas functional
products require efficient supply chain networks. He noted that a mismatch between supply
chain choices and product offerings could negatively affect firm performance. These findings
delineate the importance of establishing a certain level of supply chain relationship with
suppliers to match firm strategy and capabilities. This study proposes that as buyers are moving
toward the higher end of priority such as offering innovative products, it should warrant
suppliers to establish certain levels of competitive priorities at least equivalent to the buyers’ one;
however, the rate of adoption may vary depending on the suppliers’ feasibility. Figure 2 shows
the main hypothesis and its corresponding hypotheses.
H1: The buyers’ adoption of competitive priorities leads to the suppliers’ adoption of
competitive priorities
H1a: The level of suppliers’ competitive priorities is at least is equivalent to the level of
buyers’ competitive priorities
H1b: The buyers’ competitive priority progresses from a lower level priority to a higher
level priority
H1c: The suppliers’ competitive priority progresses from a lower level priority to a
higher level priority

Journal of International Technology and Information Management Volume 23, Numbers 3/4 2014
© International Information Management Association, Inc. 2014 100 ISSN: 1543-5962-Printed Copy ISSN: 1941-6679-On-line Copy
Figure 2: Competitive Priority Adaptation Framework for IT Selection.
IT Use Linked to Competitive Priority
When information technology is properly utilized, buyers and suppliers become more cost
effective, more efficient, more agile, more responsive to market changes, and more innovative
(Tegarden et al., 2005). Highly frequent information exchanges between buyers and suppliers in
production processes increase delivery stability and reliability (Stank et al., 1996). Integrated
systems improve information flow between functions of the two parties in the product
development process and thus reduce time and effort needed to design new products (Koufteros,
Vonderembse, & Jayaram, 2005). The operations management literature reports a number of
studies on the operational performance benefits that firms derive from IT use (Frohlich &
Westbrook, 2002; Rosenzweig et al., 2003). Successful IT use can provide good quality; accurate,
useful and timely information; as well as create systems that operate efficiently by ensuring
system availability, reliability, and responsiveness (Buck-Lew, Wardle, & Plishin, 1992). A case
study by Carter and Ellram (1994) reported that frequent communication between buyers and
suppliers provides both parties the opportunities to access more efficient manufacturing
processes, have higher product quality, implement more reliable logistical systems, reduce
production cost, and devote more time to product design and innovation. Using proper
Competitive Priority Organizational
Performance
IT Selection
Buyer
Performance
H5
H2
Buyers’ Competitive
Priorities
Cost Leadership
|
Product Quality
|
Delivery Reliability
|
Process Flexibility
|
Innovation
Suppliers’ Competitive
Priorities
Cost Leadership
|
Product Quality
|
Delivery Reliability
|
Process Flexibility
|
Innovation
H3
H1 H4
H6
Suppliers’ IT Use
Infrastructural IT Use
|
Operational IT Use
|
Planning IT Use
Buyers’ IT Use
Infrastructural IT Use
|
Operational IT Use
|
Planning IT Use
H7
Low
Prio
rity H
igh P
riority
Low
Prio
rity H
igh P
riority

Study of Competitive Priorities and IT Selection: Exploring Buyer & Supplier Performance T. Jitpaiboon
© International Information Management Association, Inc. 2014 101 ISSN: 1543-5962-Printed Copy ISSN: 1941-6679-On-line Copy
information technology is an important step toward supply chain integration because it reduces
the information errors and the level of mistrust between a firm and its trading partners. The
seamless thread of information between functions can help reduce the variation of demand thus
reducing the bullwhip effect in the supply chain (Chatfield, Kim, Harrison, & Hayya, 2004).
With intensification of competition, the utilization of IT directly influences operational processes
comprising the value chain, thus enhance operational performance (Rosenzweig, Roth, & Dean,
2003). Therefore,
H2: The higher the extent of buyers’ IT use, the higher the extent of buyers’ competitive
priorities
H3: The higher the extent of buyers’ IT use, the higher the extent of suppliers’
competitive priorities
H4: The higher the extent of suppliers’ IT use, the higher the extent of buyers’
competitive priorities
H5: The higher the extent of suppliers’ IT use, the higher the extent of suppliers’
competitive priorities
Competitive Priority Linked to Buyer Performance
Competitive priorities play a major role in many studies as intermediate performance indicators
(Vonderembse & Tracey, 1999). This capability will in turn influence a firms’ overall
performance (Mentzer, Min, & Zacharia, 2000). Operational performance provides necessary
factors that impact organizational performances by ruling out other types of performance that are
not related to supply chain activities. There are many studies supporting these relationships
(Carr & Pearson, 1999; Frazier, Spekman, & O’Neal., 1988; Carr & Ittner, 1992; Tan et al.,
1998). For example, Carr and Pearson (1999) investigated the impact of strategic purchasing and
buyer-supplier relationships on the firm’s financial performance. They found that strategically
managed long-term relationships with key suppliers improve overall product quality, delivery,
and process flexibility; and thus have a positive impact on the firm’s financial performance.
Therefore,
H6: The greater the extent of buyers’ competitive priorities, the greater the extent of
buyer performance (BP).
H7: The greater the extent of suppliers’ competitive priorities, the greater the extent of
buyer performance (BP).
RESEARCH METHODOLOGY
Instrument development for all constructs was carried out in three phases: (1) literature review to
identify the domain of the constructs and generate the initial measurement items (Churchill,
1979), (2) review by academic and management experts, and (3) Q-sort (Moore and Benbasat,
1991) using manufacturing managers. The Q-sort results indicate acceptable convergence with

Journal of International Technology and Information Management Volume 23, Numbers 3/4 2014
© International Information Management Association, Inc. 2014 102 ISSN: 1543-5962-Printed Copy ISSN: 1941-6679-On-line Copy
the inter-judge raw agreement scores of 91%, overall placement ratio of items 93%, and the
Kappa scores of 90%. The final survey items used in this study can be found in Appendix A.
A cross-sectional self-administered mail survey was conducted. A sample was obtained from the
Society of Manufacturing Engineers (SME), an internationally known organization of
manufacturing managers and engineers. The initial mailing list of 4,000 was randomly selected
from the SME members in the East North Central and West North Central regions. 579 surveys
did not reach the targeted respondents because of incorrect addresses, 235 responses stated that
they would not participate and 14 surveys were returned empty. This left 3,172 in the eligible
sample of which 220 surveys were returned providing usable responses. Thus, the response rate
for the survey is 6.94% (or 220/3172). A response rate of this size is typical in large-scale
surveys that require information from managers (Pflughoeft et al., 2003; Li et al., 2005; Devaraj
et al., 2007; Braunscheidel & Suresh, 2009). Respondents were primarily employees holding the
title of Manager or Supervisor (80.5%). Of these, 12.3% reported the title of CEO or Director
with the balance reporting general management positions consisting of COOs, Chief
Manufacturing Engineers, and Vice Presidents, among others. A self-assessment item measured
each respondent’s level of computer literacy ranging from 1: know nothing about computers to
10: expert computer user. In an attempt to test for bias between novice and expert computer users,
the sample was bifurcated at the mean (µ=7.32) and all of the variables under study were
examined using t-tests. None of the variables in the model produced statistically significant
results indicating no difference between the novice and expert computer user groups. In terms of
industry, 71.81% of respondents represented the rubber and plastic products (SIC 30), fabricated
metal products (SIC 34), industrial machinery and equipment (SIC 35), transportation equipment
(SIC 37), and other miscellaneous manufacturing industries (SIC 39). Annual sales ranged from
$10 to over $100 million for 65% of responding firms, with 24.1% generating > $100 million.
Table 1 shows sample characteristics of respondents by job titles, job functions, and level of
education.
Non-response bias was tested by comparing results from the first (n = 148) and second (n = 72)
mailings. This is a commonly used method for testing non-response bias in Operations
Management research (for examples Narasimhan & Kim, 2001; Tu et al., 2004; Li et al., 2005;
Swafford et al., 2006). Chi-square tests were performed on sales volume and t-tests were
performed on the summated scale of each construct (Armstrong & Overton, 1977). The results in
Table 2 indicate no significant difference in the data between the early and late responders,
suggesting that the data is representative of the population.

Study of Competitive Priorities and IT Selection: Exploring Buyer & Supplier Performance T. Jitpaiboon
© International Information Management Association, Inc. 2014 103 ISSN: 1543-5962-Printed Copy ISSN: 1941-6679-On-line Copy
Table 1: Sample Characteristics.
1.
Job Titles (220)
CEO/President 6.82% (15)
Director 7.27% (16)
Manager 53.18% (117)
Supervisor 27.27% (60)
Engineer 4.55% (10)
Other 0.91% (2)
2.
Job Functions (261) (respondents may have more than one job functions)
Corporate Executive 6.51% (17)
Purchasing 6.13% (16)
Transportation 2.30% (6)
Manufacturing Production 41.38% (108)
Distribution 1.15% (3)
Sales 6.13% (16)
Unidentified 13.41% (35)
Other 22.99% (60)
3.
Level of Education (220)
High School 10.45% (23)
Two-year College 20.00% (44)
Bachelor’s Degree 31.82% (70)
Master’s Degree 16.36% (36)
Doctor’s Degree 1.36% (3)
Unidentified 15.91% (35)
Other 4.09% (9)

Journal of International Technology and Information Management Volume 23, Numbers 3/4 2014
© International Information Management Association, Inc. 2014 104 ISSN: 1543-5962-Printed Copy ISSN: 1941-6679-On-line Copy
Table 2: Test of Non-Response Bias.
Variables
First wave Second wave Second wave Chi-square
Test Frequency
(%)
Expected Freq.
(%)
Observed Freq.
(%)
Sales Volume in millions of $ (220)
<5 20 7 0
2=10.78
df=6
p>.10
5 to <10 10 5 6
10 to <25 28 13 11
25 to <50 13 8 12
50 to <100 20 9 6
Over 100 33 17 20
Unidentified 24 13 17
Variables First wave Second wave
t - Test p - value Total score Total score
Buyers’ IT Use 72.92 72.52 0.22 0.82
Suppliers’ IT Use 86.34 87.47 0.48 0.63
Suppliers’ Competitive
Priorities 82.58 81.57 0.62 0.53
Buyers’ Competitive
Priorities 88.87 88.53 0.20 0.84
The calculation formula
f
ff
e
oe)(
2
2
Instrument Reliability and Validity Assessment
Structural Equation Modeling (SEM) was employed to assess the measurement and structural
properties of the model (James et al., 1982; Swafford et al., 2006). This analysis was conducted
using SPSS and AMOS 18. Content validity was determined through a comprehensive review of
the literature, Q-sort, and assessment by a panel of practitioners and academics to ensure that
measurement items covered the domain of the construct (Nunnally, 1978; Churchill, 1979).
Table 3 displays the original first order instruments, the second order constructs, the standardized
item loadings for the measurement models under study (Swafford et al., 2006) as well as the path
coefficients between the first and second order models (Braunscheidel & Suresh, 2009). All item
loadings are sufficient to demonstrate convergent validity. Items in italic were dropped because
of the low factor loading.

Study of Competitive Priorities and IT Selection: Exploring Buyer & Supplier Performance T. Jitpaiboon
© International Information Management Association, Inc. 2014 105 ISSN: 1543-5962-Printed Copy ISSN: 1941-6679-On-line Copy
Table 3: Measurement model factor loadings.
First order construct Indicators First order
loadings (λ) Indicators
First order
loadings (λ)
Buyer’s Planning IT Use SII1 .74 SII6 .75
9 indicator items SII2 .76 SII7 .63
SII3 .82 SII8 .73
SII4 .80 SII9 .82
SII5 .71
Buyer’s Operational IT Use OII1 .65 OII5 .67
8 indicator items OII2 .58 OII6 .40
OII3 .68 OII7 .63
OII4 .76 OII8 .65
Buyer’s Infrastructural IT Use DII1 .51 NII1 .83
13 indicator items DII2 .59 NII2 .75
6 indicator items for data integration DII3 .62 NII3 .85
7 indicator items for network integration DII4 .59 NII4 .88
DII5 .31 NII5 .85
DII6 .58 NII6 .69
NII7 .76
Supplier’s Planning IT Use SIE1 .81 SIE6 .77
9 indicator items SIE2 .89 SIE7 .82
SIE3 .90 SIE8 .89
SIE4 .85 SIE9 .86
SIE5 .86
Supplier’s Operational IT Use OIE1 .79 OIE5 .80
8 indicator items OIE2 .73 OIE6 .70
OIE3 .76 OIE7 .78
OIE4 .83 OIE8 .70
Supplier’s Infrastructural IT Use DIE1 .73 NIE1 .82
12 indicator items DIE2 .69 NIE2 .82
6 indicator items for data integration DIE3 .75 NIE3 .73
6 indicator items for network integration DIE4 .72 NIE4 .84
DIE5 .61 NIE5 .79
DIE6 .74 NIE6 .81
Buyer’s Cost Leadership CLF1 .42 CLF4 .83
5 indicator items CLF2 .78 CLF5 .71
CLF3 .73
Buyer’s Innovation INF1 .69 INF4 .55
5 indicator items INF2 .59 INF5 .55
INF3 .64
Buyer’s Product Quality PQF1 .82 PQF4 .78
6 indicator items PQF2 .78 PQF5 .70
PQF3 .71 PQF6 .77
Buyer’s Process Flexibility PFF1 .66 PFF4 .53
6 indicator items PFF2 .62 PFF5 .52
PFF3 .70 PFF6 .49
Buyer’s Delivery Reliability DRF1 .60 DRF4 .80
6 indicator items DRF2 .55 DRF5 .79
DRF3 .74 DRF6 .58

Journal of International Technology and Information Management Volume 23, Numbers 3/4 2014
© International Information Management Association, Inc. 2014 106 ISSN: 1543-5962-Printed Copy ISSN: 1941-6679-On-line Copy
Supplier’s Cost Leadership CLS1 .61 CLS4 .84
5 indicator items CLS2 .83 CLS5 .69
CLS3 .77
Supplier’s Innovation INS1 .71 INS4 .72
5 indicator items INS2 .77 INS5 .75
INS3 .85
Supplier’s Product Quality PQS1 .76 PQS4 .85
6 indicator items PQS2 .80 PQS5 .82
PQS3 .63 PQS6 .77
Supplier’s Process Flexibility PFS1 .57 PFS4 .55
6 indicator items PFS2 .72 PFS5 .56
PFS3 .67 PFS6 .70
Supplier’s Delivery Reliability DRS1 .74 DRS4 .81
6 indicator items DRS2 .61 DRS5 .73
DRS3 .72 DRS6 .58
Buyer Performance (FP)
4 indicator items
BP1
BP2
.74
.79
BP3
BP4
.77
.85
Second order analysis for buyer’s constructs
First order factor IT Use
Second order loadings (λ) First order factor
Competitive Priorities
Second order loadings (λ)
Planning IT Use .58 Delivery Reliability .69
Operational IT Use .86 Process Flexibility .68
Infrastructural IT Use .81 Cost Leadership .75
Innovation .86
Product Quality .81
Second order analysis for supplier’s constructs
First order factor IT Use
Second order loadings (λ) First order factor
Competitive Priorities
Second order loadings (λ)
Planning IT Use .70 Delivery Reliability .73
Operational IT Use .77 Process Flexibility .75
Infrastructural IT Use .93 Cost Leadership .63
Innovation .74
Product Quality .77
Note: All coefficients are statistically significant.
Cronbach’s α, composite reliability, and average variance extracted (AVE) were used to test
reliability. Convergent validity can be assessed by examining the individual item loadings on
their theorized latent variables (Swafford et al., 2006). The Goodness of Fit Index (GFI)
indicates the relative amount of variance and covariance jointly explained by the model. The
Adjusted Goodness of Fit Index (AGFI) differs from the GFI in adjusting for the number of
degrees of freedom (Byrne, 1989). Both range from 0 to 1. Values of 0.9 or more are considered
a good fit (Hair et al., 1998). The RMSEA takes into account the error of approximation and is
expressed per degree of freedom, thus making the index sensitive to the number of estimated
parameters in the model; values less than 0.05 indicate good fit, values as high as 0.08 represent
reasonable errors of approximation in the population (Browne & Cudeck, 1993), values range
from 0.08 to 0.10 indicate mediocre fit, and those greater than 0.10 indicate poor fit (MacCallum,
Browne, & Sugawara, 1996). A review of Table 4 reveals that almost all constructs display

Study of Competitive Priorities and IT Selection: Exploring Buyer & Supplier Performance T. Jitpaiboon
© International Information Management Association, Inc. 2014 107 ISSN: 1543-5962-Printed Copy ISSN: 1941-6679-On-line Copy
AVE values > 0.50 (both process flexibilities are very close to 0.50), thus providing further
evidence of convergent validity. Some items were dropped to improve convergent validity (Note:
items in italic were dropped. See Appendix A).
Table 4: Convergent Validity and Reliability Analysis (n = 220).
Scale
Cronbach’s α min ≥ 0.70
Composite
Reliability min ≥ 0.70
Average
Variance
Extracted
min ≥ 0.50
GFI
min ≥ 0.90
AGFI
min ≥ 0.90
RMSEA
Buyer’s Competitive Priorities .93 .86 .83 .07
Delivery Reliability (4) .88 .89 .66 1.00 .99 .00
Process Flexibility (6) .83 .82 .45 .98 .96 .03
Cost Leadership (5) .87 .60 .60 .98 .95 .07
Innovation (4) .79 .80 .50 .98 .90 .13
Product Quality (4) .86 .86 .61 .98 .94 .08
Buyers’ IT Choices .92 .85 .81 .08
Planning IT Use (5) .91 .89 .62 .98 .94 .07
Operational IT Use (6) .87 .88 .54 .97 .94 .07
Infrastructure IT Use (8) .89 88 .52 .94 .90 .09
Supplier’s Competitive Priorities .93 .86 .83 .07
Delivery Reliability (5) .88 .89 .61 .98 .93 .09
Process Flexibility (5) .81 .82 .48 .99 .97 .00
Cost Leadership (5) .88 .89 .62 .97 .91 .10
Innovation (4) .88 .88 .65 .98 .92 .11
Product Quality (4) .85 .86 .61 1.00 .98 .02
Supplier’ IT Use .94 .83 .79 .09
Planning IT Use (6) .95 .93 .72 .98 .90 .10
Operational IT Use (6) .91 .91 .64 .98 .95 .05
Infrastructure IT Use (6)
Buyer Performance (4)
.90
.80
.90
.87
.60
.63
.97
.99
.92
.96
.08
.05
Evidence of discriminant validity exists if the AVE of each construct is greater than the square of
the correlations (Braunscheidel & Suresh, 2009). An acceptable alternative suggests that the
square root of a construct’s AVE should be greater than the correlations between constructs
(Chin, 1998; Fornell & Larcker, 1981; Koufteros, 1999; Koufteros et al., 2001). Table 5 displays
the correlations between all latent constructs. The square root of the AVE for each construct is
bolded and can be found on the diagonal. Each is greater than the value of the correlations in its
corresponding row and column.

Journal of International Technology and Information Management Volume 23, Numbers 3/4 2014
© International Information Management Association, Inc. 2014 108 ISSN: 1543-5962-Printed Copy ISSN: 1941-6679-On-line Copy
Table 5: Discriminant validity (square root of AVE on diagonal in bold).
Buyer’s Constructs DR PF CL IN PQ PI OI II BP
Delivery Reliability .82
Process Flexibility .41 .67
Cost Leadership .50 .51 .78
Innovation .16 .56 .67 .71
Product Quality .48 .57 .53 .70 .79
Planning IT Use .16 .18 .37 .29 .26 .79
Operational IT Use .51 .37 .30 .34 .32 .51 .73
Infrastructural IT Use .46 .39 .23 .31 .39 .46 .68 .72
Buyer Performance .23 .32 .45 .47 .50 .22 .23 .20 .79
Supplier’s Constructs DR PF CL IN PQ PI OI II BP
Delivery Reliability .78
Process Flexibility .62 .70
Cost Leadership .40 .50 .79
Innovation .42 .55 .50 .81
Product Quality .61 .49 .47 .60 .78
Planning IT Use .06 .11 .05 .27 .12 .85
Operational IT Use .29 .22 .06 .17 .24 .52 .80
Infrastructural IT Use .16 .25 .02 .26 .20 .60 .66 .78
Buyer Performance .28 .20 .27 .34 .27 .20 .22 .15 .71
Finally, it is important to control for common method bias (CMB) prior to evaluating the
structural model. CMB can prove problematic in studies that employ survey method from single
respondents for data collection by inflating or deflating the relationships among variables
(causing both Type I and Type II errors) (Podsakoff et al., 2003). Thus, certain preventive
measures were undertaken during the data collection consistent with Rosenzweig (2009). The
data were also statistically tested for the presence of CMB following data collection. Harman’s
(1967) single-factor test is often used to assess CMB (Rosenzweig, 2009). In this study, the data
do not appear to fit the single-factor model, nor does one factor account for a substantial amount
of variance. Next, the single-method-factor test advocated by Podsakoff et al. (2003) was
employed. After controlling for the effects of the latent method factor, all of the path loadings of
the hypothesized items remained statistically significant on their target constructs and the
average item variance explained by the substantive constructs was substantially greater than
those linked to the latent method factor. Further, only a few of the latent method factor
coefficients were statistically significant. Thus, the presence of CMB is unlikely (Podsakoff et al.,
2003; Rosenzweig, 2009).
Structural model results
After the measurement models are specified, the hypothesis testing was done using structural
equation modeling (AMOS 18). Table 6 indicates that H1 is supported at the p<0.001 level
(β=.64, t=5.32), which suggests that the buyers’ competitive priorities influence the suppliers’
adoption of competitive priorities. H1a is supported, which lends support that suppliers will
adopt certain competitive priorities at least equivalent to those adopted by the buying firms.
Evidences from Table 6 also provide detailed insights. For example, when buying firms adopt
lower competitive priorities such as cost leadership, product quality, and delivery reliability,

Study of Competitive Priorities and IT Selection: Exploring Buyer & Supplier Performance T. Jitpaiboon
© International Information Management Association, Inc. 2014 109 ISSN: 1543-5962-Printed Copy ISSN: 1941-6679-On-line Copy
suppliers only pursue the same priority as the buyers and perform poorly on the higher priorities.
However, the suppliers perform much better when the buyers adopt higher priorities such as
process flexibility and innovation as it shows especially that innovation strongly influences the
suppliers to improve on all competitive priorities.
Table 6: Structural model results for Hypotheses 1 and 1a.
Buyers Suppliers † t-value Buyers Suppliers † t-value
Delivery
Reliability
Delivery Reliability .30 4.60*** Innovation Delivery Reliability .58 6.52***
Process Flexibility -.06 -0.99 Process Flexibility .65 6.63***
Cost Leadership -.12 -2.08** Cost Leadership .69 6.64***
Innovation -.02 0.68 Innovation .82 7.52***
Product Quality .06 0.32 Product Quality .71 6.86***
Process
Flexibility
Delivery Reliability .27 4.10*** Product
Quality
Delivery Reliability -.03 -0.51
Process Flexibility .40 5.72*** Process Flexibility -.36 -5.49***
Cost Leadership -.13 -2.02** Cost Leadership -.20 -3.22***
Innovation .06 1.07 Innovation -.09 -1.59
Product Quality -.02 -0.31 Product Quality .20 3.17***
Cost
Leadership
Delivery Reliability -.25 -3.54*** Buyer’s
Competitive
Priorities
Supplier’s
Competitive
Priorities
.64 5.32***
Process Flexibility -.12 -2.05**
Cost Leadership .22 3.32***
Innovation -.18 -2.84***
Product Quality -.21 -3.11***
*** = p < .001; ** = p < .05; † Coefficient
From Table 7, H1b is supported at the p<0.001 level, which indicates that the buying firms’
competitive priorities progress sequentially from a lower priority to a higher one. The
progressive sequence is portrayed as cost leadership product quality delivery reliability
process flexibility innovation. H1c is also supported at the p<0.001 level, which indicates that
the suppliers’ competitive priorities evolve progressively from a lower priority to a higher one
with the same sequence as the buyer.
Table 7: Structural model results for hypotheses 1b and 1c.
Buyer Coefficient t-value
Cost Leadership –> Product Quality .59 5.65
Product Quality –> Delivery Reliability .56 5.71
Delivery Reliability –> Process Flexibility .48 5.67
Process Flexibility –> Innovation .58 6.46
Supplier
Cost Leadership –> Product Quality .48 5.66
Product Quality –> Delivery Reliability .63 7.63
Delivery Reliability –> Process Flexibility .65 6.96
Process Flexibility –> Innovation .57 6.14
Note: All coefficients are statistically significant at p < .001.

Journal of International Technology and Information Management Volume 23, Numbers 3/4 2014
© International Information Management Association, Inc. 2014 110 ISSN: 1543-5962-Printed Copy ISSN: 1941-6679-On-line Copy
From Table 8, H2 is supported at the p<0.05 level (β=.55, t=2.50), which suggests that the
utilization of IT may help buyers to better at setting competitive priority goals and achieving
them. Unfortunately, the equivalent reference cannot be drawn for the suppliers. H3, H4, and H5
are not significantly supported, which indicates suppliers’ competitive priorities may not be
affected by the level of IT use from both sides. Suppliers’ IT use is also found to have no impact
on the how buyers perform on competitive priorities. H6 is supported at the p<0.001 level
(β=.76, t=5.67), which suggests that buyers’ competitive priorities lead to higher buyer
performance. Unfortunately, the suppliers’ competitive priorities do not lead to buyer
performance and thus, H7 is not statistically support.
Table 8: Structural model results for hypotheses 2, 3, 4, 5, 6 and 7.
*** = p < .001; ** = p < .05
DISCUSSION AND IMPLICATIONS
This research proposes and empirically tests a conceptual model if and how IT use impacts
operational performance (i.e., competitive priorities) of both a buying firm and its suppliers and
how they affect the buying firm’s bottom line. Consequently, this model laid the groundwork for
the development of a survey to empirically examine such relationships in the manufacturing
industry. Data from the Society of Manufacturing Engineers were gathered and analyzed. The
results of the study can be summarized in the following managerial suggestions and guidelines.
Managerial and Academic Implications
Five competitive priorities were employed including cost leadership, product quality, delivery
reliability, process flexibility and innovation. In addition, three IT selection sub-constructs were
developed including planning IT use, operational IT use, and infrastructural IT use. Overall, the
evidence suggests that the instrument can provide reliable data and that the constructs measured
are valid. The instruments were tested using rigorous reliability and validity procedures to
achieve the highest level of refinement that can be applied more generally to survey research in
Hypotheses Exogenous Endogenous Coefficients t-value p
H2 Buyers’ IT Use Buyers’ Competitive Priorities 0.55 2.50 **
H3 Buyers’ IT Use Suppliers’ Competitive Priorities -0.19 -0.89 0.38
H4 Suppliers’ IT Use Buyers’ Competitive Priorities -0.05 -0.23 0.82
H5 Suppliers’ IT Use Suppliers’ Competitive Priorities 0.21 1.08 0.28
H6 Buyers’ Competitive
Priorities Buyer Performance 0.76 5.67 ***
H7 Suppliers’ Competitive
Priorities Buyer Performance -0.11 -1.10 0.27

Study of Competitive Priorities and IT Selection: Exploring Buyer & Supplier Performance T. Jitpaiboon
© International Information Management Association, Inc. 2014 111 ISSN: 1543-5962-Printed Copy ISSN: 1941-6679-On-line Copy
operations strategy or other supply chain management areas. Operational measures of key
decision variables such as competitive priorities and IT selection are useful to both decision
makers and researchers. Measures of competitive priorities and IT selection can be used to guide
decisions made on process choice, technology, and inventory strategy for both firms and
suppliers. Thus having a reliable and valid instrument is crucial. Operational measures of
competitive priorities and IT selection also have direct managerial utility in auditing the
manufacturing strategy of the firm and in deciding appropriate benchmarking strategy with
suppliers. For researchers, the instrument for IT selection can be used to expand operations
strategy research. It is important for researchers to build on each other’s work, using scales that
have proved to be reliable and valid, and searching for new measures for variables not well
measured to date. It is one way to move forward in the research stream.
The results show that three of the seven main hypotheses were significantly supported.
Underpinned by the competitive priorities literature, this paper provides a research framework to
understand the dynamism of competitive priorities in both firms and suppliers. Previous
literature suggests two models explaining the changing dynamic of competitive priorities. The
Trade-Offs model suggests firms pursue one priority over another (Wheelwright, 1984; Skinner,
1985; Skinner, 1996). The Sand Cone model suggests firms’ selection of competitive priorities is
mutually reinforcing or cumulative (Swink et al., 2005; Nakane, 1986; Hall, 1987; Ferdows &
De Meyer, 1990). This study introduces the Influential Adaptation model by arguing that, in the
supply chain relationship environment, buying firms form a cooperative bond with suppliers.
They both consider each other as a distinctive source of capability (Gulati, 1995; Powell et al.,
1996; Gulati, 1999). The Influential Adaptation model suggests that buying firms are likely to
initiate the adoption of a new and better competitive priority, and suppliers are likely to follow
suit under the impression that the mismatch may deteriorate competitive advantages. For
influential priority adaptation, the results provide full support for all hypotheses. It shows both
firms’ and suppliers’ competitive priority progresses from lower end (e.g., cost leadership) to the
higher end (e.g., innovation). The results also confirm that suppliers adopt at least an equivalent
level of competitive priority to the firm level and the firm’s adoption of higher level competitive
priorities (e.g., process flexibility and innovation) may influence suppliers to do more to improve
themselves.
IT use within a buying organization is found to be directly and positively related to its firm
operational capabilities. It provides the ability to link and collaborate externally with suppliers.
These findings are consistent with the current research stating that the process of integration
should progress from internal integration to external integration (Bowersox, 1989; Stevens, 1989;
Byrne & Markham, 1991; Hewitt, 1994). Since, internal IT capabilities increase both internal
and external collaboration as well as firm performance (Sanders & Premus, 2005), managers
seeking to gain benefits from supply chain integration must first ensure that IT use within their
organizations is integrated at the operational and strategic levels to maximize their benefits. Thus,
managers should carefully consider adopting enterprise-wide information systems that can be
expanded to be compatible with external partners. Although such implementations are often time
consuming and capital intensive and not all firms will be successful, our results suggest those
that are successful can attain operational advantages such as improving delivery speed, product
quality, product development time and cost, enhancing process flexibility and reliability.

Journal of International Technology and Information Management Volume 23, Numbers 3/4 2014
© International Information Management Association, Inc. 2014 112 ISSN: 1543-5962-Printed Copy ISSN: 1941-6679-On-line Copy
The findings do not lend any support regarding suppliers’ competitive priorities. Suppliers’
operational performance is not improved by any type of technology implemented internally or by
the buyers. This suggests that although integration of buyers’ information systems with suppliers
can lead to improved buyer performance, suppliers do not gain benefits from technology
implementation. Commonly, suppliers implement technologies just to pass status quo or make
the buyers happy. They do not actually use the technologies to improve themselves. Therefore, it
is a tall order for managers to follow through to make sure that suppliers actually utilize the
technologies. However, one caveat is that forcing technology implementation is likely to be
more difficult with small suppliers who may not have sufficient resources and information
technology capabilities (Larson, Carr, & Dhariwal, 2005). The results show the relationship
between buyers’ competitive priorities and buyer performance. However, the suppliers’
competitive priorities do not directly affect the buyer performance. The results confirm the
suspension mentioned previously regarding suppliers’ performance. With the low acceptance in
technology implementation from suppliers, it is likely that suppliers do not have the same
sentiment regard technology adoption as the buyers do. They do not value new technologies and
thus, do not fully utilize them. It is not surprised to find that suppliers’ performance does not lead
to buyer performance because the two firms are in the buyer-supplier relationship and sometimes
they have conflict of interest. Suppliers normally serve many buyers and sometimes they must
share their interest among many firms. Therefore, managers must set forth fierce selective
criteria and systematic supplier appraisal procedures that ensure suppliers’ accountabilities on IT
utilization.
Limitations and Future research
While this research makes significant contributions from both a theoretical and practical point of
view, the findings are subject to two limitations. First, individual respondents (manufacturing
managers and top managers) were asked to respond to many issues regarding competitive
priorities and IT use for both firms and supplier. Although these biases may be minimized by
sample size in this study, future research should seek to utilize multiple respondents from each
participating organization as an effort to enhance reliability of research findings. Second, the
response rate of approximately 7%, while comparable to similar studies (see Tu et al., 2001; Tu
et al., 2004; Li et al., 2005; Tan & Tracey, 2007), is less than hoped for. A possible cause of the
low response rate is the lengthy questionnaire. Because of time constraints executives are less
likely to participate in a lengthy survey. This issue can be addressed by reducing the number of
items in the questionnaire and focusing on areas requiring further clarification.
Overall, these limitations do not substantially detract from the significance of findings. The
concept of competitive priorities has been widely adopted by both conceptual and empirical
researchers in many areas such as manufacturing strategy, supply chain management and etc. and
by practitioners. Since competitive priorities continue to be important variables in operations
strategy research, the findings of this paper are offered as a small important extension to the
research stream.

Study of Competitive Priorities and IT Selection: Exploring Buyer & Supplier Performance T. Jitpaiboon
© International Information Management Association, Inc. 2014 113 ISSN: 1543-5962-Printed Copy ISSN: 1941-6679-On-line Copy
REFERENCES
Ahmad, S., & Schroeder, R. G. (2003). The impact of human resource management practices
on operational performance: recognizing country and industry differences. Journal of
Operations Management, 21(1), 19-43.
Armstrong, J. S., & Overton, T. S. (1977). Estimating nonresponse bias in mail surveys. Journal
of Marketing Research, 14(3), 396-402.
Baxter, L. F., Ferguson, N., Macbeth, D. K., & Neil, G. C. (1989). Getting the message across?
Supplier quality improvement programs: some issues in practice. International Journal of
Operations and Production Management, 9(5), 69-76.
Bertrand, K. (1986). The just-in-time mandate, Business Marketing, 71, 44-55.
Bhatt, G. D. (2000). An empirical examination of the effects of information systems integrations
on business process improvement. International Journal of Operations & Production
Management, 20(11), 1331-1359.
Blenckhorn, D. L., & Noon, A. H. N. (1990). What it take to supply Japanese OEMs. Industrial
Marketing Management, 19(1), 21-30.
Boyer, K. K., & Lewis, M. W. (2002). Competitive priorities: investigating the need for trade-
offs in operations strategy. Production and Operations Management, 11(1), 9-20.
Bowersox, D. J. (1989). Logistics in the integrated enterprise. The Annual Conference of the
Council of Logistics Management, St. Louis, MO.
Braunscheidel, M., & Suresh, N. (2009). The organizational antecedents of a firm’s supply chain
agility for risk mitigation and response. Journal of Operations Management, 27(2), 119-
140.
Browne, M. W., & Cudeck, R. (1993). Alternative ways of assessing model fit. In K.A. Bollen
& J.S. Long (Eds.), Testing structural equation models, 445-455.
Byrne, B. M. (1989). A primer of LISREL: Basic applications and programming for
confirmatory factor analytic models. New York: Springer-Verlag.
Byrne, P. M., & Markham, W. J. (1991). Improving quality and productivity in the logistics
processes: Achieving customer satisfaction breakthroughs. Oak Brook, IL.
Buck-Lew, M., Wardle, M., & Pliskin, N. (1992). Accounting for information technology in
corporate acquisitions. Information and Management, 22, 363-369.
Carr, L., & Ittner, C. D. (1992). Measuring the cost of ownership. Journal of Cost Management,
6(3), 42-51.

Journal of International Technology and Information Management Volume 23, Numbers 3/4 2014
© International Information Management Association, Inc. 2014 114 ISSN: 1543-5962-Printed Copy ISSN: 1941-6679-On-line Copy
Carr, A. S., & Pearson, J. N. (1999). Strategically managed buyer-seller relationships and
performance outcomes. Journal of Operations Management, 17(5), 497-519.
Carr, A. S., & Pearson, J. N. (2002). The impact of purchasing and supplier involvement on
strategic purchasing and its impact on firm’s performance. International Journal of
Operations & Production Management, 22(9), 1032-1053.
Chin, W. W. (1998). Issues and opinion on structural equation modeling. MIS Quarterly, 22(1).
Churchill Jr., G. A. (1979). A paradigm for developing better measures of marketing constructs.
Journal of Marketing Research, 16 (1), 64–73.
Coleman, J. S. (1988). Social capital in the creation of human capital. American Journal of
Sociology (Supplement), 94, 95 - 120.
Davis, T. (1993). Effective supply chain management. Sloan Management Review, 34(4), 35-46.
Dean, P. R., Tu, Y. L., & Xue, D. (2009). An information system for one-of-a-kind production,
International Journal of Production Research, 47(4), 1071-1087.
Devaraj, S., Krajewski, L., & Wei, J. (2007). Impact of eBusiness technologies on operational
performance: The role of production information integration in the supply chain. Journal
of Operations Management, 25(6), 1199-1216.
Díaz, M. S., Gil, M. J. Á., & Machuca, J. A. D. (2005). Performance measurement systems,
competitive priorities, and advanced manufacturing technology: Some evidence from the
aeronautical sector. International Journal of Operations & Production Management 25
(7/8), 781-799.
Dierickx, I., & Cool, K. (1989). Asset stock accumulation and sustainability of competitive
advantage, Management Science, 35, 1504-1513
Dyer, J. H. (1997). Effective interfirm collaboration: How firms minimize transaction costs and
maximize transaction value. Strategic Management Journal, 18(7), 535-556.
Ellram, L.M., (1991). Supply chain management: the industrial organization perspective.
International Journal of Physical Distribution and Logistics Management, 21(1), 13-22.
Ferdows, K., & De Meyer, A. (1990). Lasting improvements in manufacturing performance: in
search of a new theory. Journal of Operations Management, 9(2), 168-84.
Fine, C. H., & Hax, A. C. (1985). Manufacturing strategy: A methodology and an illustration.
Interfaces, 15(6), 28-46.
Fisher, M. (1997). What is the right supply chain for your product? Harvard Business Review,
75, 105-117.

Study of Competitive Priorities and IT Selection: Exploring Buyer & Supplier Performance T. Jitpaiboon
© International Information Management Association, Inc. 2014 115 ISSN: 1543-5962-Printed Copy ISSN: 1941-6679-On-line Copy
Fornell, C., & Larcker, D. F. (1981). Evaluating structural equation models with unobservable
variables and measurement error. Journal of Marketing Research, 18(1), 39–50.
Frazier, G. L., Spekman, R. E., & O’Neal, C. R. (1988). Just-in-time exchange relationships in
industrial markets. Journal of Marketing, 52(4), 52-68.
Frohlich, M. T., & Dixon, J. R. (2001). A taxonomy of manufacturing strategies revisited.
Journal of Operations Management, 19 (5), 541-558.
Frohlich, M. T. (2002). e-Integration in the supply chain: Barriers and Performance. Decision
Sciences, 33(4), 537-555.
Frohlich, M. T., & Westbrook, R. (2002). Demand chain management in manufacturing and
services: web-based integration, drivers, and performance. Journal of Operations
Management, 20, 729-745.
Gulati, R. (1995). Social structure and alliances formation pattern: A longitudinal analysis.
Administrative Science Quarterly, 40, 619-652.
Gulati, R. (1999). Network location and learning: the influence of network resources and firms
capabilities on alliance formation. Strategic Management Journal, 20, 397-420.
Hair, J. F., Anderson, R. E., Tatham, R. L., & Black, W. C. (1998). Multivariate data analysis.
Fifth Edition, Macmillan Publishing Company, New York, NY.
Hall, R. W. (1987). Attaining Manufacturing Excellence, Dow Jones-Irwin, Homewood, IL.
Hall, R. W., & Nakane, J. (1990). Flexibility – Manufacturing Battlefield of the 90s: A Report on
Attaining Manufacturing Flexibility in Japan and the United States. Association for
Manufacturing Excellence, Wheeling, IL.
Harman, H. (1967). Modern Factor Analysis. University of Chicago Press, Chicago, IL.
Harrison, A. (1992). Just-in-time manufacturing in perspective. London: Prentice Hall.
Hewitt, F. (1994). Supply chain redesign. The International Journal of Logistics Management,
5(2), 1-8.
James, L. R., Mulaik, S. A., & Brett, J. M., (1982). Causal Analysis: Assumptions, Models and
Data. Sage, Beverly Hills, CA.
Jayaram, J., Droge, C., & Vickery, S. K. (1999). The impact of human resource management
practices on manufacturing performance. Journal of Operations Management, 18(1),1-20.
Jitpaiboon, T., Ragu-Nathan, T. S., & Vonderembse, M. A. (2006). An Empirically Derived
Taxonomy of Information Systems Integration. Journal of International Technology and
Information Management, 15(2), 17-38.

Journal of International Technology and Information Management Volume 23, Numbers 3/4 2014
© International Information Management Association, Inc. 2014 116 ISSN: 1543-5962-Printed Copy ISSN: 1941-6679-On-line Copy
Kim, S. W. & Narasimhan, R. (2002). Information system utilization in supply chain integration
efforts. International Journal of Production Research, 40(18), 4585-4609.
Koufteros, X. (1999). Testing a model of pull production: a paradigm for manufacturing research
using structural equation modeling. Journal of Operations Management, 17(4), 467–488.
Koufteros, X., Vonderembse, M. A., & Doll, W. (2001). Concurrent engineering and its
consequences. Journal of Operations Management, 19(1), 97–115.
Koufteros, X., Vonderembse, M., & Jayaram, J. (2005). Internal and external integration for
product development: The contingency effects of uncertainty, equivocality, and platform
strategy. Decision Sciences, 36(1), 97-133.
Krajewski, L. J., & Ritzman, L. P. (1996). Operations management: strategy and analysis, 4th
edition, Wesley, Addison.
Krajewski, L. J. Ritzman, L. P., & Malhotra, M. K. (2013). Operations management: processes
and supply chains, 10th
edition, Pearson, New Jersey.
Krause, D. R., Handfield, R. B., & Scannell, T. V. (1998). An empirical investigation of supplier
development: reactive and strategic process. Journal of Operation Management, 17, 39-
58.
Kruger, L. P. (2012). Developing operations strategies – reassessing the strength and importance
of competitive operations priorities for South African businesses. South African Journal
of Business Management, 43(3), 13-28.
Larson, P., Carr, P., & Dhariwal, K. (2005). SCM involving small versus large suppliers:
Relational exchange and electronic communication media. Journal of Supply Chain
Management, 41(1), 18-28.
Lascelles, D. M., & Dale, B. G. (1989). The buyer–supplier relationship in total quality
management. International Journal of Purchasing and Materials Management, 25(3),
10–19.
Levy, D.L., (1997). Lean production in an international supply chain. Sloan Management Review,
38(2), 94-102.
Li, S., Rao, S., Ragu-Nathan, T. and Ragu-Nathan, B., (2005). Development and validation of a
measurement instrument for studying supply chain management practices. Journal of
Operations Management, 23(6), 618-641.
MacCallum, R. C., Browne, M. W., & Sugawara, H. M. (1996). Power analysis and
determination of sample size for covariance structure modeling. Psychological Methods,
1, 130-149.
Makadok, R. (2001). Toward a synthesis of the resource-based and dynamic-capability view of
rent creation. Strategic Management Journal, 22, 387 – 401.

Study of Competitive Priorities and IT Selection: Exploring Buyer & Supplier Performance T. Jitpaiboon
© International Information Management Association, Inc. 2014 117 ISSN: 1543-5962-Printed Copy ISSN: 1941-6679-On-line Copy
Matthyssens, P., & Bulte, C. V. D. (1994). Getting closer and nicer: Partnerships in the supply
chain. Long Range Planning, 27(1), 72-83.
Mentzer, J. T., Min, S., & Zacharia, Z. G. (2000). The nature of interfirm partnership in supply
chain management. Journal of Retailing, 76(4), 549-568.
Monczka, R. M., Trent, R. J., & Callahan, T. J. (1983). Supply base strategies to maximize
supplier performance. International Journal of Physical Distribution and Logistics
Management, 23(4), 42-54.
Moore, G. C., & Benbasat, I. (1991). Development of an instrument to measure the perceptions
of adopting and information technology innovation. Information Systems Research. 2(3),
192-222.
Nakane, J. (1986). Manufacturing Futures Survey in Japan, a Comparative Survey 1983-1986,
System Science Institute, Waseda University, Tokyo.
Narasimhan, R., & Kim, S. W. (2001). Information system utilization strategy for supply chain
integration. Journal of business logistics, 22(2), 51-75.
Narasimhan, R., & Kim, S. W. (2002). Effect of supply chain integration on the relationship
between diversification and performance: evidence from Japanese and Korean firms.
Journal of Operations Management, 20(3), 303-323.
Nunnally, J. C. (1978). Psychometric theory, McGraw Hill, New York.
O’Neal, C., & Bertrand, K. (1991). Developing a winning J.I.T. marketing strategy- the
industrial marketer’s guide. Englewood Cliffs, New Jersey: Prentice Hall.
Pagell, M., Melnyk, S. A., & Handfield, R. (2000). Manufacturing strategy: strategic choices and
tradeoffs in the stamping die industry. Business Horizons, 43(3), 69-77.
Peng, D. X., Schroeder, R. G., & Shah, R. (2011). Competitive priorities, plant improvement and
innovation capabilities, and operational performance: a test of two forms of fit.
International Journal of Operations & Production Management, 31(5), 484-510.
Pflughoeft, K. A., Ramamurthy, K., Soofi, E. S., Yasai-Ardekani, M., & Zahedi, F. (2003).
Multiple conceptualizations of small business web use and benefit. Decision Sciences,
34(3), 467–512.
Podsakoff, P. M., MacKenzi, S. B., Lee, J. Y., & Podsakoff, N. P., (2003). Common method
biases in behavioral research: a critical review of the literature and recommended
remedies. Journal of Applied Psychology, 88(5), 879–903.
Porter, M. E., & Millar, V. E. (1985). How information gives you competitive advantage.
Harvard Business School, 63(4), 149-160.

Journal of International Technology and Information Management Volume 23, Numbers 3/4 2014
© International Information Management Association, Inc. 2014 118 ISSN: 1543-5962-Printed Copy ISSN: 1941-6679-On-line Copy
Powell, W. W., Koput, K., & Smith-Doerr, L. (1996). Interorganizational collaboration and the
locus of innovation: Networks of learning in biotechnology. Administrative Science
Quarterly, 41, 116-145.
Prajogo, D. I., & McMermott, P. (2011), Examining competitive priorities and competitive
advantage in service organisations using importance-performance analysis matrix.
Managing Service Quality, 21(5), 465-483.
Rosenzweig, E. D. (2009). A contingent view of e-collaboration and performance in
manufacturing. Journal of Operations Management, 27(6), 462-478.
Rosenzweig, E. D., Roth, A. V., & Dean Jr., J. W. (2003). The influence of an integration
strategy on competitive capabilities and business performance: an exploratory study of
consumer products manufacturers. Journal of Operations Management, 21(4), 437-456.
Saarijarvi, H., Kuusela, H., & Spence, M. T. (2012). Using the pairwise comparison method to
assess competitive priorities within a supply chain. Industrial Marketing Management, 41,
631-638.
Sabherwal, R., & Chan, Y. 2001. Alignment between business and IS strategies: a study of
prospectors, analyzers and defenders. Information Systems Research, 12(1), 11-33.
Safizadeh, M. H., Ritzman, L. P., & Mallick, D. (2000), Revising alternative theoretical
paradigms in manufacturing strategy. Production and Operations Management, 9(2),
111-40.
Sanders, N. & Premus, R., (2005). Modeling the relationship between firm IT capability,
collaboration, and performance. Journal of Business Logistics, 26(1), 1-23.
Santos, F .C. A. (2000). Integration of human resource management and competitive priorities of
manufacturing strategy. International Journal of Operations & Production Management,
20(5), 610-28.
Sinclair, D., Hunter, L., & Beaumont, P. (1996).Models of customer-supplier relations. Journal
of General Management, 22(2), 56-75.
Skinner, W. (1969). Manufacturing: the missing link in corporate strategy. Harvard Business
Review, May-June, 136-45.
Skinner, W. (1985). Manufacturing: The Formidable Competitive Weapon, Wiley, New York,
NY.
Skinner, W. (1996). Manufacturing strategy on the S curve. Production and Operations
Management, 5(1), 3-14.
Soroor, J., Tarokh, M. J., & Keshtgary, M., 2009. Preventing failure in IT-enabled systems for
supply chain management. International Journal of Production Research, 47(23), 6543-
6557.

Study of Competitive Priorities and IT Selection: Exploring Buyer & Supplier Performance T. Jitpaiboon
© International Information Management Association, Inc. 2014 119 ISSN: 1543-5962-Printed Copy ISSN: 1941-6679-On-line Copy
Sophie Lee, C. H., Barua, A., & Whinston, A. B. 2000. The complementary of mass
customization and electronic commerce. Economic Innovation New Technology, 9(2), 81-
109.
Stank, T. P., Daugherty, P. J., & Ellinger, A. E. (1996). Information Exchange, Responsiveness
and Logistics Provider Performance. International Journal of Logistics Management,
7(2), 43-57.
Stevens, G. C. (1989). Integrating the supply chain. International Journal of Physical
Distribution and Materials Management, 19(8), 3-8.
Swafford, P. M., Ghosh, S., & Murthy, N. (2006). The antecedents of supply chain agility of a
firm: scale development and model testing. Journal of Operations Management, 24(2),
170-188.
Swink, M., Narasimhan, R., & Kim, S. W. (2005). Manufacturing practices and strategy
integration: effects on cost efficiency, flexibility, and market-based performance.
Decision Sciences, 36(3), 365-529.
Taps, S. B., & Steger-Jensen, K., 2007. Aligning supply chain design with manufacturing
strategies in developing regions. Production Planning & Control, 18(6), 475-486.
Tan, K. C., Kannan, V. R., & Handfield, R. B. (1998). Supply chain management: supplier
performance and firm performance. International Journal of Purchasing & Materials
Management, 34(3), 2-9.
Tan, C., & Tracey, M., 2007. Collaborative new product development environments:
implications for supply chain management. Journal of Supply Chain Management, 43(3),
2-15.
Tegarden, L. F., Sarason, Y., Childers, J. S., & Hatfield, D. (2005). The Engagement of
Employees in the Strategy Process and Firm Performance: The Role of Strategic Goals
and Environment. Journal of Business Strategies, 22(2), 75-99.
Tracey, M., Vonderembse, M. A., & Lim, J. (1999). Manufacturing technology and strategy
formulation: keys to enhance competitiveness and improving performance. Journal of
Operations Management, 17(4), 411-429.
Tu, Q., Vonderembse, M. A., & Ragu-Nathan, T. S., 2001. The impact of time-based
manufacturing practices on mass customization and value to customer. Journal of
Operations Management, 19(2), 201-217.
Tu, Q., Vonderembse, M. A., Ragu-Nathan, T. S., & Ragu-Nathan, B., (2004). Measuring
modularity-based manufacturing practices and their impact on mass customization
capability: A Customer-Driven Perspective. Decision Sciences, 35(2), 147-168.

Journal of International Technology and Information Management Volume 23, Numbers 3/4 2014
© International Information Management Association, Inc. 2014 120 ISSN: 1543-5962-Printed Copy ISSN: 1941-6679-On-line Copy
Vickery, S. K. (1991). A theory of production competence revisited. Decision Sciences, 22(3),
635-643.
Vickery, S. K., Droge, C., & Markland, R. R. (1993). Production competence and business
strategy: Do they affect business performance. Decision Sciences, 24(2), 435-456.
Vickery, S. K., Droge, C., & Markland, R. R. (1994). Strategic production competence:
Convergent, discriminant, and predictive validity. Production and Operations
Management, 3(4), 308-318.
Vonderembse, M. A., & Tracey, M. (1999). The impact of supplier selection criteria and
supplier involvement on manufacturing performance. The Journal of Supply Chain
Management: A Global Review of Purchasing and Supply, 35(3), 33-39.
Ward, P. C., McCreery, T. K., Ritzman, L. P. & Sharma, D. (1998), “Competitive priorities in
operations management”, Decision Sciences, Vol. 29 No. 4, pp. 1035-46.
Wisner, J. D. (2003). A structural equation model of supply chain management strategies and
firm performance. Journal of Business Logistics, 24(1), 1-26.
Wheelwright, S. C. (1984). Manufacturing strategy: defining the missing link. Strategic
Management Journal, 5(1), 77-91.
Wyse, J. E., & Higgins, C. A. (1993). MIS integration: a framework for management. Journal of
Systems Management, Feb, 32-37.
Youndt, M. A., Snell, S. A., Dean, J. W. Jr., & Lepak, D. P., (1996), Human resource
management, manufacturing strategy and firm performance, 39 (4), 836–866.

Study of Competitive Priorities and IT Selection: Exploring Buyer & Supplier Performance T. Jitpaiboon
© International Information Management Association, Inc. 2014 121 ISSN: 1543-5962-Printed Copy ISSN: 1941-6679-On-line Copy
APPENDIX A
Measurement of research constructs (Items in italic were dropped to improve divergent validity in the final model.)
Competitive Priorities: The following situations describe the extent to which the buying firm (or supplier)
assesses the level of competitive priorities. Please circle the appropriate number to indicate the level of your
attainment of each objective.
Coding Items Coding Items
Delivery reliability (DR-S) Delivery reliability (DR-F)
DR-S1 Deliver materials/components/products as
promises. DR-F1
Deliver materials/components/products as
promises.
DR-S2 Provide materials/components/products that are
highly reliable. DR-F2
Provide materials/components/products that are
highly reliable.
DR-S3 Provide fast delivery. DR-F3 Provide fast delivery.
DR-S4 Provide on-time delivery. DR-F4 Provide on-time delivery.
DR-S5 Provide reliable delivery. DR-F5 Provide reliable delivery.
DR-S6 Decrease manufacturing lead time. DR-F6 Decrease manufacturing lead time.
Process flexibility (PF-S) Process flexibility (PF-F)
PF-S1 Make rapid design changes. PF-F1 Make rapid design changes.
PF-S2 Make rapid production volume changes. PF-F2 Make rapid production volume changes.
PF-S3 Make rapid changeover between product lines. PF-F3 Make rapid changeover between product lines.
PF-S4 Process both large and small orders. PF-F4 Process both large and small orders.
PF-S5 Produce a variety of different products. PF-F5 Produce a variety of different products.
PF-S6 Increase capacity utilization. PF-F6 Increase capacity utilization.
Cost leadership (CL-S) Cost leadership (CL-F)
CL-S1 Produce materials/components/products at low
cost. CL-F1
Produce materials/components/products at low
cost.
CL-S2 Reduce production cost. CL-F2 Reduce production cost.
CL-S3 Reduce inventory cost. CL-F3 Reduce inventory cost.
CL-S4 Reduce unit cost. CL-F4 Reduce unit cost.
CL-S5 Increase labor productivity. CL-F5 Increase labor productivity.
Innovation (IN-S) Innovation (IN-F)
IN-S1 Develop new ways of customer service. IN-F1 Develop new ways of customer service.
IN-S2 Develop new forms of shop floor management. IN-F2 Develop new forms of shop floor management.
IN-S3 Develop new ways of supply chain
management. IN-F3 Develop new ways of supply chain management.
IN-S4 Develop new products and features IN-F4 Develop new products and features
IN-S5 Develop new process technologies. IN-F5 Develop new process technologies.
Product quality (PQ-S) Product quality (PQ-F)
PQ-S1 Provide better product performance. PQ-F1 Provide better product performance.
PQ-S2 Improve product durability PQ-F2 Improve product durability
PQ-S3 Provide product conformance to specifications. PQ-F3 Provide product conformance to specifications.
PQ-S4 Improve product reliability PQ-F4 Improve product reliability
PQ-S5 Reduce defective rate. PQ-F5 Reduce defective rate.
PQ-S6 Better product reputation. PQ-F6 Better product reputation.

Journal of International Technology and Information Management Volume 23, Numbers 3/4 2014
© International Information Management Association, Inc. 2014 122 ISSN: 1543-5962-Printed Copy ISSN: 1941-6679-On-line Copy
IT Selection: The following situations describe the extent to which the buying firm (or supplier) uses
information technology (IT) for strategic (planning), operational, and infrastructural purposes. Please circle
the appropriate number to indicate the extent to which you agree or disagree with each statement as applicable to
your unit.
Coding Items Coding Items
Firm’s Planning IT Use Supplier’s Planning IT Use
SII1 Formulate long-term collaborative decision
making. SIE1 Formulate long-term collaborative decision making.
SII2 Justify long-term business plans. SIE2 Justify long-term business plans.
SII3 Analyze long-term business plans. SIE3 Analyze long-term business plans.
SII4 Develop long-term business opportunities. SIE4 Develop long-term business opportunities.
SII5 Identify new markets. SIE5 Identify new markets.
SII6 Identify long-term technology justification and
planning. SIE6
Identify long-term technology justification and
planning.
SII7 Study strategies of competitors. SIE7 Study strategies of competitors.
SII8 Define long-term competitive positioning. SIE8 Define long-term competitive positioning.
SII9 Set long-term strategic goals. SIE9 Set long-term strategic goals.
Firm’s Operational IT Use Supplier’s Operational IT Use
OII1 Adjust daily manufacturing processes. OIE1 Adjust daily manufacturing processes.
OII2 Adjust daily product development processes. OIE2 Adjust daily product development processes.
OII3 Control daily product quality. OIE3 Control daily product quality.
OII4 Manage daily order quality. OIE4 Manage daily order quality.
OII5 Exchange daily inventory information. OIE5 Exchange daily inventory information.
OII6 Select suppliers. OIE6 Select raw materials and parts.
OII7 Manage daily logistical activities. OIE7 Manage daily logistical activities.
OII8 Establish daily product forecasts. OIE8 Establish daily product forecasts.
Firm’s Infrastructural IT Use Supplier’s Infrastructural IT Use
Data Integration Data Integration
DII1 Use standard data definitions and codes. DIE1 Use standard data definitions and codes.
DII2 Use standard information/data format. DIE2 Use standard information/data format.
DII3 Use standard presentation format. DIE3 Use standard presentation format.
DII4 Use centralized databases. DIE4 Use centralized databases.
DII5 Use database synchronization system. DIE5 Use database synchronization system.
DII6 Integrate data and information. DIE6 Use compatible database systems.
Network Integration Network Integration
NII1 Use IS networks to communicate with other
departments. NIE1 Use IS networks to communicate with each other.
NII2 Use IS networks to connect to each other’s
database. NIE2 Use IS networks to connect to each other’s database.
NII3 Use IS network applications. NIE3 Use IS network applications.
NII4 Use IS networks to share information with other
departments. NIE4
Use IS networks to share information with each
other.
NII5 Use IS networks to connect to centralized
databases. NIE5 Use IS networks to facilitate periodic meetings.
NII6 Use IS networks to facilitate periodic
interdepartmental meetings. NIE6 Use compatible network architectures.
NII7 Use compatible network architectures.
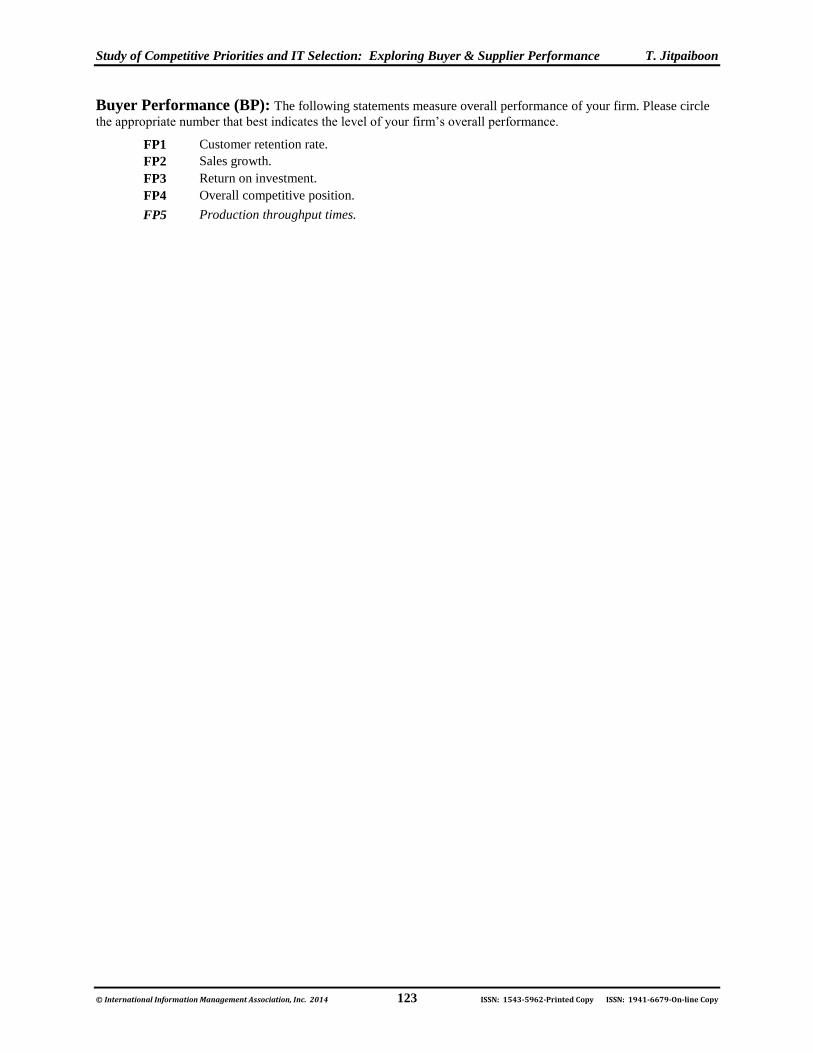
Study of Competitive Priorities and IT Selection: Exploring Buyer & Supplier Performance T. Jitpaiboon
© International Information Management Association, Inc. 2014 123 ISSN: 1543-5962-Printed Copy ISSN: 1941-6679-On-line Copy
Buyer Performance (BP): The following statements measure overall performance of your firm. Please circle
the appropriate number that best indicates the level of your firm’s overall performance.
FP1 Customer retention rate.
FP2 Sales growth.
FP3 Return on investment.
FP4 Overall competitive position.
FP5 Production throughput times.

Journal of International Technology and Information Management Volume 23, Numbers 3/4 2014
© International Information Management Association, Inc. 2014 124 ISSN: 1543-5962-Printed Copy ISSN: 1941-6679-On-line Copy
This Page Left Intentionally Blank