Embed Size (px)
Citation preview
NUML Journal of Management & Technology
Vol: 8, No: 1. Janurary, 2013 ISSN 1997-4507
1
NUML Journal of Management & Technology
ISSN: 1997- 4507
Volume: 8 - Numbers: 1 - January, 2013
A Research Journal Published by
Faculty of Management Sciences
National University of Modern Languages
Islamabad-Pakistan www.numl.edu.pk
This Issue includes:
Copyright © 2013 NJMT
1. Overcoming Employee Silence to Achieve Organizational Commitment (4-23)
Ms. Amen Imran, Dr. Zekeriya Nas
2. The impact of macroeconomic factors on stock market returns: A case of lead-lag
relationship of gold prices and index return. (24-30)
Fathima Rasheed ,
Saadia Mushtaq
3. Impact of Macroeconomic Variables on Stock Returns of Chemical Industry in
Pakistan. (31-43)
Sadaf Rahim
4. Analyzing the Determinant of Household Savings Behaviour in Pakistan. (44-53)
Abdul Mansoor
5. Impact of optimism Bias on Investment Decisions on Mutual Funds (54-73)
Aijaz M. Hashmi, M.Ilyas Khan
6. Book Review: Decision Making & Problem Solving Strategies (2nd
Edition, 2007)
By. John Adair. Kogan Page. London. (74-75)
Dr. Naveed Akhtar

NUML Journal of Management & Technology
Vol: 8, No: 1. Janurary, 2013 ISSN 1997-4507
2
NUML Journal of Management & Technology
Patron-in-Chief
Major General Masood Hassan ®
Rector NUML
Patron
Brig. Azam Jamal,
Director General , NUML
Chief Editor
Dr. Rashid Ahmad Khan, Dean Faculty of Management Sciences
Editor
Dr. Naveed Akhtar Faculty of Management Sciences
Editorial Advisory Board
Working Group Members:
Mr. Faid Gul Ms. Rauza Ms. Alia Khan
Professor Dr. Bahaudin Mujtaba,
Huizinga, NOVA , Florida, USA
Brig. Dr. Akhtar Nawaz,
NUST (EME)
Professor Dr. Canan CETIN,
Marmara University Faculty of
Economy and Administrative
Sciences, Instanbul, Turkey
Dr. Muhammad Akbar
Dean IT & Engineering, NUML
Dr. Amir
SZABIST
Professor Dr. Ayse Kucuk Yilmaz,
Anadolu University Turkey
Dr. M.Zahid Iqbal
COMSATAS, Islamabad.
Dr.Lisa Anderson, University of
Liverpool Management School.
Dr. Waheed Akhtar
COMSATS, Lahore
Dr. Sermin Senturan
Bulent Ecevit University Zonguldak,
Turkey
Dr. Aurangzeb Zulfiqar Khan
COMSATS, Islamabad
Dr. Mehmet Sisman, Marmara
University, Istanbul
Dr. Sajid Bashir
MAJU
Dr. Shahab Alam
COMSATS, Islamabad
Dr. Shaheena Bhatti,
Head R & D NUML
w w w . n u m l . e d u . p k
NUML Journal of Management & Technology
Vol: 8, No: 1. Janurary, 2013 ISSN 1997-4507
3
Table of Contents
1. Overcoming Employee Silence to Achieve Organizational Commitment (4-23)
Ms. Amen Imran, Dr. Zekeriya Nas
2. The impact of macroeconomic factors on stock market returns: A case of lead-lag
relationship of gold prices and index return (24-30)
Fathima Rasheed,
Saadia Mushtaq
3. Impact of Macroeconomic Variables on Stock Returns of Chemical Industry in
Pakistan (31-43)
Sadaf Rahim
4. Analyzing the Determinant of Household Savings Behaviour in Pakistan (44-53)
Abdul Mansoor
5. Impact of optimism Bias on Investment Decisionso on Mutual Funds (54-73)
Aijaz M. Hashmi, M.Ilyas Khan
6. Book Review: Decision Making & Problem Solving Strategies (2nd
Edition, 2007)
By. John Adair. Kogan Page. London. (74-75)
Dr. Naveed Akhtar
w w w . n u m l . e d u . p k
Volume: 8 - Numbers: 1 - January, 2013
This Issue includes NUML ICBM 2012 Conference Proceedings:
NUML Journal of Management & Technology
Vol: 8, No: 1. Janurary, 2013 ISSN 1997-4507
4
OVERCOMING EMPLOYEE SILENCE TO ACHIEVE
ORGANIZATIONAL COMMITMENT Ms. Amen Imran, Preston University, Islamabad, Pakistan.
Dr. Zekeriya Nas, Head of Turkish Department, NUML University, Islamabad, Pakistan
Abstract
One of the fast spread issue in the organization is the employee silence, yet few empirical
studies are conducted to identify its nature and main components. The purpose of this
paper was to investigate the factors leading to silence climate in the firm and discovering
the effects of these factors on organizational commitment. In the stressful situations,
when business is in need of innovative ideas and creativity, employees want to remain
silent leading to many negative consequences. In such a situation, what matters is the
participative leadership style that encourages the employees to raise their voices. This
paper also highlights the positive impact of effective communication and decentralized
decision making process along with conducive norms and organizational culture on
employee silence behavior. Thus the overall theme of this study was to present a
framework exploring how employee silence effects the organizational commitment
through the leadership style, communication process and organizational culture. A cross-
sectional study was conducted on a sample of 200 employees, taken from the NGO (Non
Governmental Organization) sector, in Peshawar, Pakistan, in which three aspects of
employee silence, namely leadership style, communication process and organizational
culture, were constructed and measured in order to examine their effects on
organizational commitment. Regression analysis will be used to test the hypotheses.
Although the concept of employee silence is projected in organizations, less empirical
work is noted in the literature focusing on exploring, analyzing and handling it. Review
of literature has proved a negative impact of silence climate on organizations’
performance, innovation and creativity. This exploratory research work was intended to
investigate and measure factors contributing to employee silence such as leadership
style, communication process and organizational culture and their impact on
organizational commitment.
Keywords – Employee silence, leadership style, communication process, organizational
culture, organizational commitment.
INTRODUCTION
To cope with the customers demand and quality assurance issues in the competitive
market, firms have raised their expectations from their employees in term of taking
initiative, bringing creativity and innovation, bearing the responsibility and speaking up
for the betterment of the firm. (Quinn and Spreitzer, 1997). For the survival,
organizations are in dare need of workforce who can respond to the challenges quickly
and wisely, can raise their voice against issues as well as can provide information and
who can stand up not only for their own welfare but for the whole team. On the other
hand they are employees who decide when to speak and when to remain silent. They use
silence or voice approach to show their willingness or unwillingness to participate in
organizational decisions making process (Pinder and Harlos, 2001). As mentioned by
NUML Journal of Management & Technology
Vol: 8, No: 1. Janurary, 2013 ISSN 1997-4507
5
many researchers (Van Dyne & LePine, 2003, Whiting, Podsakoff & Pierce, 2008),
voice and silence are connected to organizational citizenship behaviors, thus leading to
influencing organizational commitment. Finally it is said that voice have a positive
effects, while silence, have the negative effects on the firm performance.
According to Cuellar, Keil & Johnson, (2006), employees uses silence approach as a self
defense mechanism, which is called Deaf Effect or the Mum Effect (Smith, Keil &
Depledge, 2001). Thus it is sarcastic that in critical economic situations, when innovation
and creative ideas are required, employees refuse to share their views, resulting in
decreased organizational performance. Moreover, Schlenker & Weigold, (1989); Van
Dyne et al., (2003), describes defensive silence as “intentional and proactive behavior
that is intended to protect the self from external threats”. On the other hand, sometimes
employees prefer to raise their voice. Meyerson, (2001), in his research work quoted
Cynthia Cooper, an employee at WorldCom and Coleen Rowley from the FBI, who were
awarded the title of 2002 People of the Year, by Time Magazine for their bravery to raise
voice in front of their top management regarding problems they noticed in their
organizations, hence it depends when employees choose to speak and to remain silent.
Perlow and Williams (2003) declared in their research work that the phenomenon of
employee silence is one of the critical organizational concerns yet little empirical work is
done in the field (Milliken et al., 2003; Van Dyne et al., 2003). The work of Morrison and
Milliken (2000) to introduce the concept is notable. They identified the integral
organizational elements leading to employee silence behavior. These elements, such as
decision-making processes, management processes, and culture, demonstrate the silence
behavior of each worker as to how they perceive it. For the purpose of this study, the
organizational characteristics leading to employee silence were organizational culture,
communication process, leadership style and organizational commitment.
To ensure that decision makers are informed and consider all sides to an issue while
change management process, employees are motivated to speak and be a part of open and
honest communication process (Nemeth, 1997). This open communication highlights the
problems and difficulties faced by the workforce. A part from all this literature citation,
employees complaint that their organizations do not encourage free flow of information
thus result in silent climate in the firm (Beer and Noria, 2000). Moreover, one of the main
hurdle faced by the companies towards organizational development was cited to be lack
of formal upward feedback mechanism and trust, as well as centralized decision making
process, due to which employees choice is to remain silent, that is as discussed by
Morrison and Milliken (2000) employee‟s choice to „„withhold their opinions and
concerns about organisational problems‟‟. For the purpose of this study communication
and input by the employees is referred to:
(1) Employee‟s communication with their co-workers and to the top management of
their complaints in a work-related issues; and
(2) Employees participation in the decision-making processes of the firm (McCabe and
Lewin; 1992).
NUML Journal of Management & Technology
Vol: 8, No: 1. Janurary, 2013 ISSN 1997-4507
6
For the sake of this paper employees refers to all organizational members regardless
of their position (management, subordinate), whereas while talking about leadership, it
refers to anyone in the firm having authority to take decision, regardless of their position.
Just like previous researches, this paper also focuses on organizational culture and
prevailing norms as a source of employee silence. Followed by the concept of Van Dyne
et al. (2003), this paper highlights procedural injustice as one of the factor of silent
behavior as well as negative consequences by the top management associated with raising
the voice. Senge (1999) continues that in most of the organizations environment of fear
and silence are the values to be followed. This restriction towards openness consequent in
keeping silent, resulting in dissatisfaction and creates „„silent‟‟ culture for the upcoming
workforce. Moreover, accepting the argument of Morrison and Milliken (2000) this paper
states untrustworthiness and lack of loyalty as the negative consequences attached to
raising voice, perceived by the top management. However, Oppel (2002), mentioned the
case of Enron in his research stating that employees at Enron was adopt to the culture of
remaining silent, although knowing the facts about the drop down of the business
finances, as they were afraid to raise their voice to the top management due to the
negative consequences. The justice literature has linked voice to the presence of due
process procedures that enhance justice judgments and facilitate employee participation
in decision-making (e.g., Bies and Shapiro, 1988).
Vakola and Bouradas (2005), declared that the leader is the one who can fight against
the silent culture and create a culture of openness. He further stated that leader‟s attitudes
toward silence is the strongest forecaster of silence climate followed by top executive
attitudes and organizational communication process. But in times of depression and hard
times leader‟s ability to sense employee voice decreases, consequently employees starts
feeling hesitation to share information and their opinions, thus resulting in dissatisfaction
(Pinder & Harlos 2001, Peirce, Smolinski & Rosen 1998). In contrast some other
researchers (Kassing, 1997; Redding, 1985; Seeger and Ulmer, 2003) presents a different
view and mentioned that leaders are mostly ready to hear about the problems faced by the
employees but employees on the other hand are afraid to speak due to expecting negative
reaction from the top management (Nemeth, 1985; Sprague and Ruud, 1988). According
to Wilson and Harrison, (2001), the reason behind employees silent behavior is they
doesn‟t want to contaminate their image in the eyes of higher authorities. Many worker
fear retaliation that could be in form of harassment, lower performance appraisal ratings
and decreased promotion possibilities (Feuille and Delaney, 1993) and also being fired
from the job (Westin et al., 1981). This paper focuses on the leader‟s positive attitude
towards his team members, to eliminated the climate of silence.
On the basis of the above arguments this exploratory study aims to identify the
influence of organizational factors, such as organizational culture, leadership style and
communication process, leading to the employee silence and consequently its impact on
the organizational commitment. Past researches have proved a negative relationship
between silence behavior and organizational commitment. Therefore it is important for
the organization to recognize when employees are contributing voice or silence to the
NUML Journal of Management & Technology
Vol: 8, No: 1. Janurary, 2013 ISSN 1997-4507
7
organization‟s dialogue. To investigate this cause and effects relationship researcher
planned to survey 200 employees in any organization.
Thus researcher tries to find answers for the following questions:
Research Question 1. How does leadership style contributes to employee silence.
Research Question 2. How does organizational communication process contributes to
employee silence.
Research Question 3. How organizational culture does contributes to employee silence.
Research Question 4. How does employee silence effects organizational commitment?
The rest of the manuscript is arranged as follows. In the subsequent section, the
current literature on the employee silence, organizational characteristics influencing
employee silence behavior such as communication process, leadership style and
organizational culture and organizational commitment is reviewed, pursued by a concise
discussion about the methodology used. After that, the theoretical framework of
employee silence and its impact on organizational commitment is presented, followed by
some statistical analysis of the elements involved along with the interpretation of data
and suggestions about how organizations can deal with the issue of employee silence
finally leading towards achievement of organizational commitment. In the end, the
conclusion, the implications and recommendations for future study are discussed.
THEORY AND HYPOTHESIS
Although, leaders have faith that they motivate their employees to share problems
and express ideas but conversely, they use indirect procedure to create climate of, which
Hennestad (1990), described as „„double bind leadership‟‟. Few tactics to create silence
climate used by the leaders are to make employees realize that they are inexperienced to
give ideas and are not authorized to take decisions (Izraeli and Jick, 1986). Consequently,
employees prefer to remain silent and do not speak up to their leader in any case
(Dickson and Roethlisberger, 1966).
Moreover, evidences have been provided regarding the negative response of
leaders to negative feedback which is mostly avoided or postponed, also when provided it
is discarded (Fisher, 1979). In addition, Argyris and Shon (1978) states that leaders do so
to prevent embarrassment, threat and feelings of incompetence. Thus, they don‟t trust
their employees as well as the reliability of their feedback. Previous literature provided
the evidence that organizations have to incur high cost due to lack of leader‟s ability to
encourage openness among employees (Sugarman, 2001; Collins, 2001).
On the basis of above literature, it is found that this sort of leader‟s behavior
results in employees silence behavior. Therefore, it is hypothesize that:
H1. Lack of leader‟s ability to motivate employee to speak up is positively related to
employee silence behavior.
NUML Journal of Management & Technology
Vol: 8, No: 1. Janurary, 2013 ISSN 1997-4507
8
Figure 1: impact of leadership style on employee silence behavior
According to Senge (1999) sometimes within organization such culture and norms
are developed in which employees tries to solve their problems by their own and are least
concerned about other functional areas. Also they don‟t discuss expose their problems for
open discussion and only share them in private. Hence it result in dissatisfaction and
environment of fear and silent is promoted and this silent norms and behavior is made
available to the newcomers, to follow.
Moreover Argyris (1977) mentioned that there are some defensive organizational
norms and that do not encourage employees to speak up what they feel, thus they are
forced to remain silent although they know the reality about certain issues and can
suggest solutions (Morrison and Milliken, 2000). In addition, Employees are often afraid
to raise voice as it may be considered as lack of trust and loyalty from employee side
(Morrison and Milliken; 2000), and also due to the negative consequences generated by
the top management, such as, job harassment, low performance appraisal ratings and less
chances of promotion (Feuille and Delaney, 1993) and high risk of termination (Westin et
al., 1981; Nemeth, 1985; Sprague and Ruud, 1988; Wilson and Harrison, 2001). Many
researches mentioned culture procedural injustice in an organization as a factor leading to
employee silence (Bies and Shapiro,1988). As a result of the above discussion, it is
proposed that:
H2: Supportive organizational culture and norms are negatively related to employee
silence.
Figure 2: impact of organizational culture on employee silence behavior
Unwillingness to express idea, information sharing and providing feedback
adversely affects level of employee commitment. Moreover, as stated by Beer and
Eisenstat (2000), it have the potential to negatively affect the organizational decision
making process. Due to the silence climate, change management process fails and
positive communication climate is the only key to the success of the organization
(Appelbaum et al., 2000). Additionally, Morrison and Milliken (2000) suggested few
organizational practices that leads to the climate of silence within an organization such as
centralized decision making process along with absence of formal upward
communication process, whereas Schweiger and Denisi (1991) indicated free flow of
communication as the practice to be adopted to avoid employee silence behavior.
Leadership Style Employee Silence
Behavior
Organizational Culture Employee Silence
Behavior
NUML Journal of Management & Technology
Vol: 8, No: 1. Janurary, 2013 ISSN 1997-4507
9
Open Communication process refers to trust and openness in sharing information
and feeling of being fairly heard. Previous research work have shown that presence of
formal upward communication mechanism leads to employee‟s participation in decision
making process and increased level of trust on top management (McCauley and Kuhnert,
1992; Smidts et al., 2001). Some researches resulted in a positive relationship between
the free flow of information and organizational productivity as well as absenteeism rate
(Schweiger and Denisi, 1991).
Thus on the basis of the above literature, it is proposed that:
H3. Absence of free flow communication mechanism and centralization of decision
making process is positively related to employees silence behavior.
Figure 3: impact of communication process on employee silence behavior
Organizational commitment is defined as „„the relative strength of an individual‟s
identification and involvement in a particular organization‟‟ (Porter et al.,1974).
According to Mowday et al. (1982), commitment is an attitude, that highlights the
strength of relationship among an employee and an organization. It is said to be a state in
which an individual relates himself with a specific organization and its objectives. It is
mentioned that organizational commitment is a phenomenon that tries to develop an
exchange linkage between an individual and an organization in which individuals
identifies themselves to the particular organization in return for certain rewards from the
firm (Buchanan, 1974).
Workers join organization, keeping in mind certain rewards they can get out of
working there and expect healthy working environment where they can make best use of
their abilities and can freely express themselves. If provided with the opportunities, their
level of commitment increases. The organizational Commitment refers to ones
acceptance of organizational norms and goals, and willingly putting hard efforts in favor
of organization success, and finally wishes to stay with the organization for a longer
period of time.
As mentioned by Morrison and Milliken (2000), employee silence creates sentiments of
not being worthwhile, and thus in low level of satisfaction, commitment and motivation.
In addition, Oliver (1990) commented that dissatisfaction, de-motivation and lack of
organizational commitment have negative after effects inform of high turnover rate and
job stress. Hence, it is hypothesized that:
H4. Employees‟ silence behavior has a negative impact on organizational commitment
Figure 4: Impact of Employee Silence Behavior on Organizational Commitment
Communication process Employee Silence
Behavior
Organizational
Commitment Employee Silence
Behavior
NUML Journal of Management & Technology
Vol: 8, No: 1. Janurary, 2013 ISSN 1997-4507
10
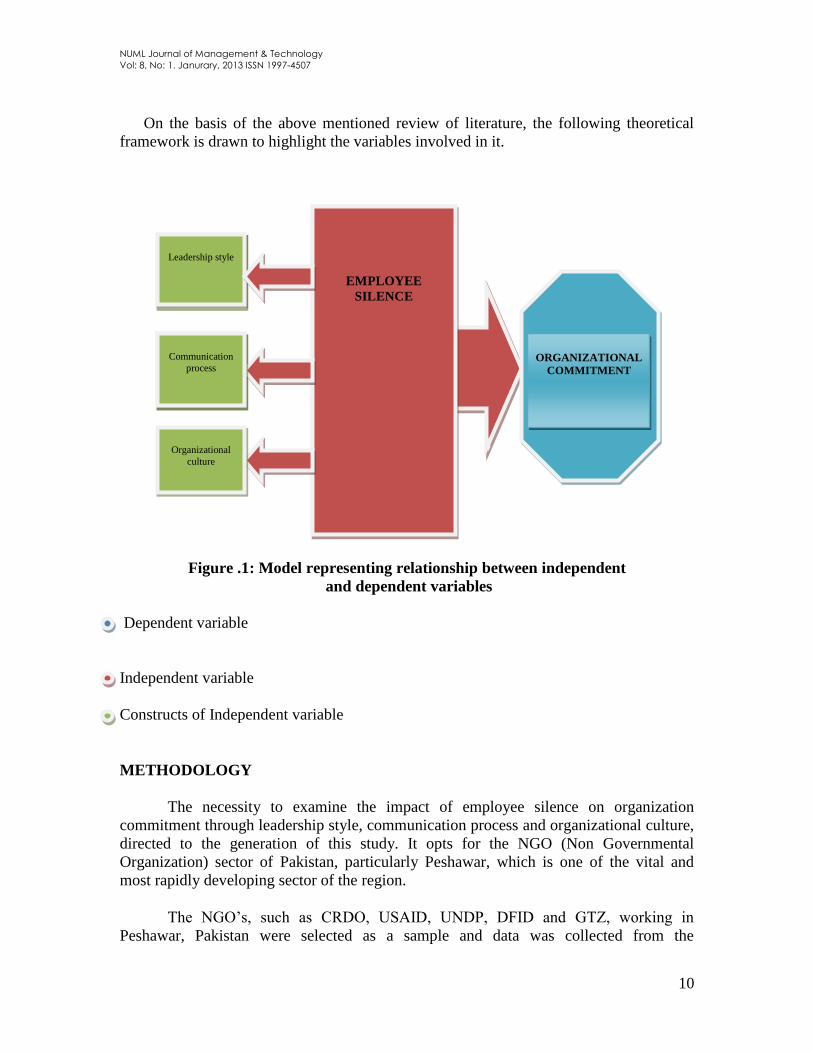
On the basis of the above mentioned review of literature, the following theoretical
framework is drawn to highlight the variables involved in it.
Figure .1: Model representing relationship between independent
and dependent variables
Dependent variable
Independent variable
Constructs of Independent variable
METHODOLOGY
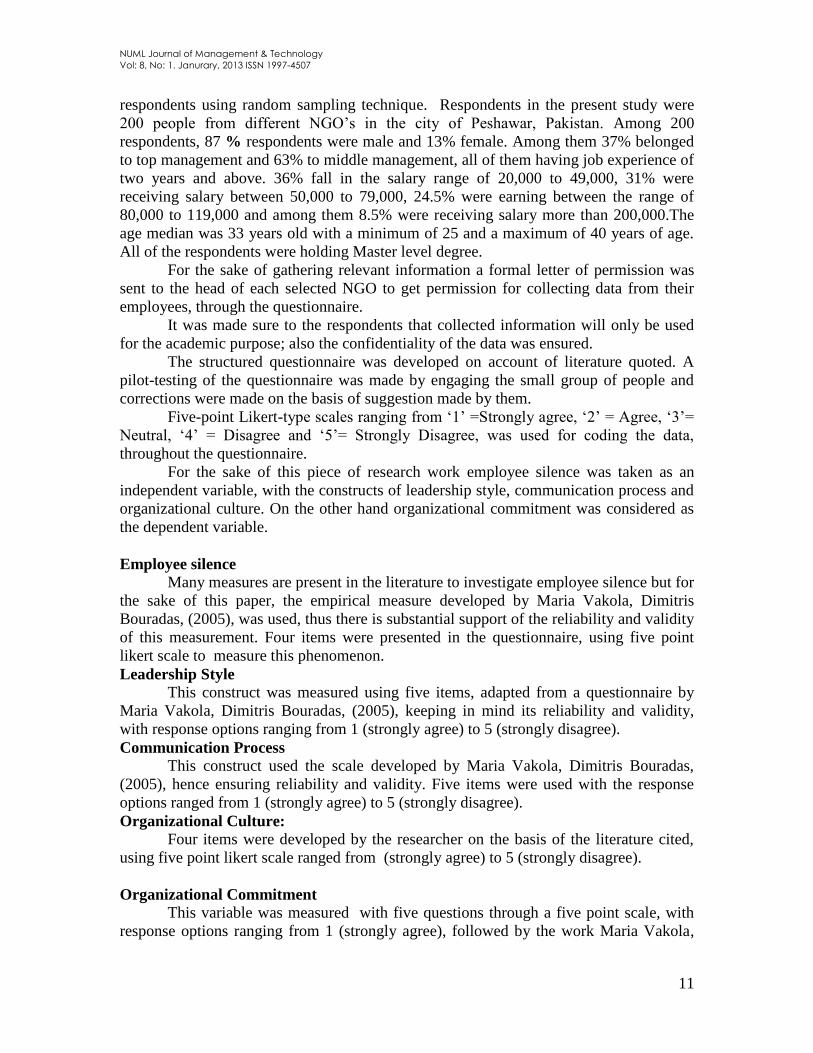
The necessity to examine the impact of employee silence on organization
commitment through leadership style, communication process and organizational culture,
directed to the generation of this study. It opts for the NGO (Non Governmental
Organization) sector of Pakistan, particularly Peshawar, which is one of the vital and
most rapidly developing sector of the region.
The NGO‟s, such as CRDO, USAID, UNDP, DFID and GTZ, working in
Peshawar, Pakistan were selected as a sample and data was collected from the
EMPLOYEE
SILENCE
Leadership style
Organizational
culture
Communication
process
ORGANIZATIONAL
COMMITMENT
NUML Journal of Management & Technology
Vol: 8, No: 1. Janurary, 2013 ISSN 1997-4507
11
respondents using random sampling technique. Respondents in the present study were
200 people from different NGO‟s in the city of Peshawar, Pakistan. Among 200
respondents, 87 % respondents were male and 13% female. Among them 37% belonged
to top management and 63% to middle management, all of them having job experience of
two years and above. 36% fall in the salary range of 20,000 to 49,000, 31% were
receiving salary between 50,000 to 79,000, 24.5% were earning between the range of
80,000 to 119,000 and among them 8.5% were receiving salary more than 200,000.The
age median was 33 years old with a minimum of 25 and a maximum of 40 years of age.
All of the respondents were holding Master level degree.
For the sake of gathering relevant information a formal letter of permission was
sent to the head of each selected NGO to get permission for collecting data from their
employees, through the questionnaire.
It was made sure to the respondents that collected information will only be used
for the academic purpose; also the confidentiality of the data was ensured.
The structured questionnaire was developed on account of literature quoted. A
pilot-testing of the questionnaire was made by engaging the small group of people and
corrections were made on the basis of suggestion made by them.
Five-point Likert-type scales ranging from „1‟ =Strongly agree, „2‟ = Agree, „3‟=
Neutral, „4‟ = Disagree and „5‟= Strongly Disagree, was used for coding the data,
throughout the questionnaire.
For the sake of this piece of research work employee silence was taken as an
independent variable, with the constructs of leadership style, communication process and
organizational culture. On the other hand organizational commitment was considered as
the dependent variable.
Employee silence
Many measures are present in the literature to investigate employee silence but for
the sake of this paper, the empirical measure developed by Maria Vakola, Dimitris
Bouradas, (2005), was used, thus there is substantial support of the reliability and validity
of this measurement. Four items were presented in the questionnaire, using five point
likert scale to measure this phenomenon.
Leadership Style
This construct was measured using five items, adapted from a questionnaire by
Maria Vakola, Dimitris Bouradas, (2005), keeping in mind its reliability and validity,
with response options ranging from 1 (strongly agree) to 5 (strongly disagree).
Communication Process
This construct used the scale developed by Maria Vakola, Dimitris Bouradas,
(2005), hence ensuring reliability and validity. Five items were used with the response
options ranged from 1 (strongly agree) to 5 (strongly disagree).
Organizational Culture:
Four items were developed by the researcher on the basis of the literature cited,
using five point likert scale ranged from (strongly agree) to 5 (strongly disagree).
Organizational Commitment
This variable was measured with five questions through a five point scale, with
response options ranging from 1 (strongly agree), followed by the work Maria Vakola,
NUML Journal of Management & Technology
Vol: 8, No: 1. Janurary, 2013 ISSN 1997-4507
12
Dimitris Bouradas, (2005). Therefore there is considerable evidence of the validity and
reliability of this measurement.
The methodology used in this causal study was based on the primary data as data
was directly collected through questionnaire from the respondents. This first hand
information was collected personally by the researcher and assistance was provided to the
respondents to fill the questionnaire without any confusion hence decreased the problem
of common biasness.
Furthermore, the researchers made some observations during the survey about the
variables involved in the study and presented recommendation as well as draw the
conclusion. The data collected was coded and statistical tools were applied using SPSS
V. 17 and correlation and regression analysis techniques was used to extract relevant
results.
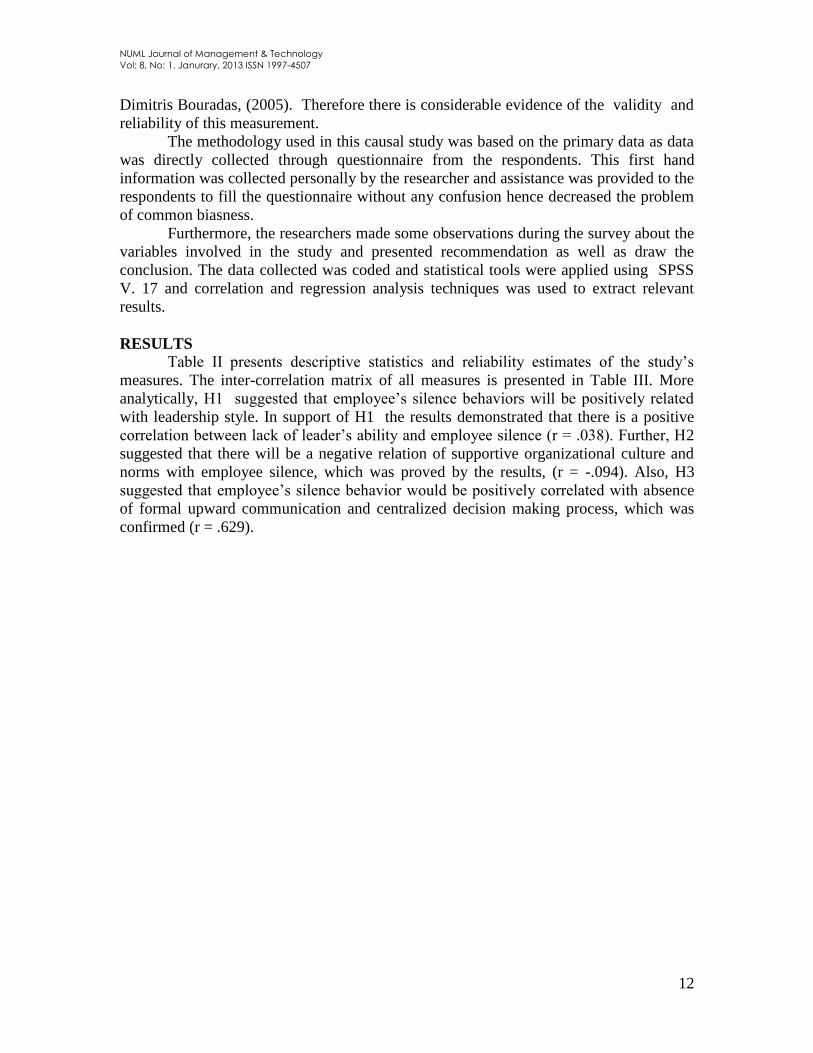
RESULTS
Table II presents descriptive statistics and reliability estimates of the study‟s
measures. The inter-correlation matrix of all measures is presented in Table III. More
analytically, H1 suggested that employee‟s silence behaviors will be positively related
with leadership style. In support of H1 the results demonstrated that there is a positive
correlation between lack of leader‟s ability and employee silence (r = .038). Further, H2
suggested that there will be a negative relation of supportive organizational culture and
norms with employee silence, which was proved by the results, (r = -.094). Also, H3
suggested that employee‟s silence behavior would be positively correlated with absence
of formal upward communication and centralized decision making process, which was
confirmed (r = .629).
NUML Journal of Management & Technology
Vol: 8, No: 1. Janurary, 2013 ISSN 1997-4507
13
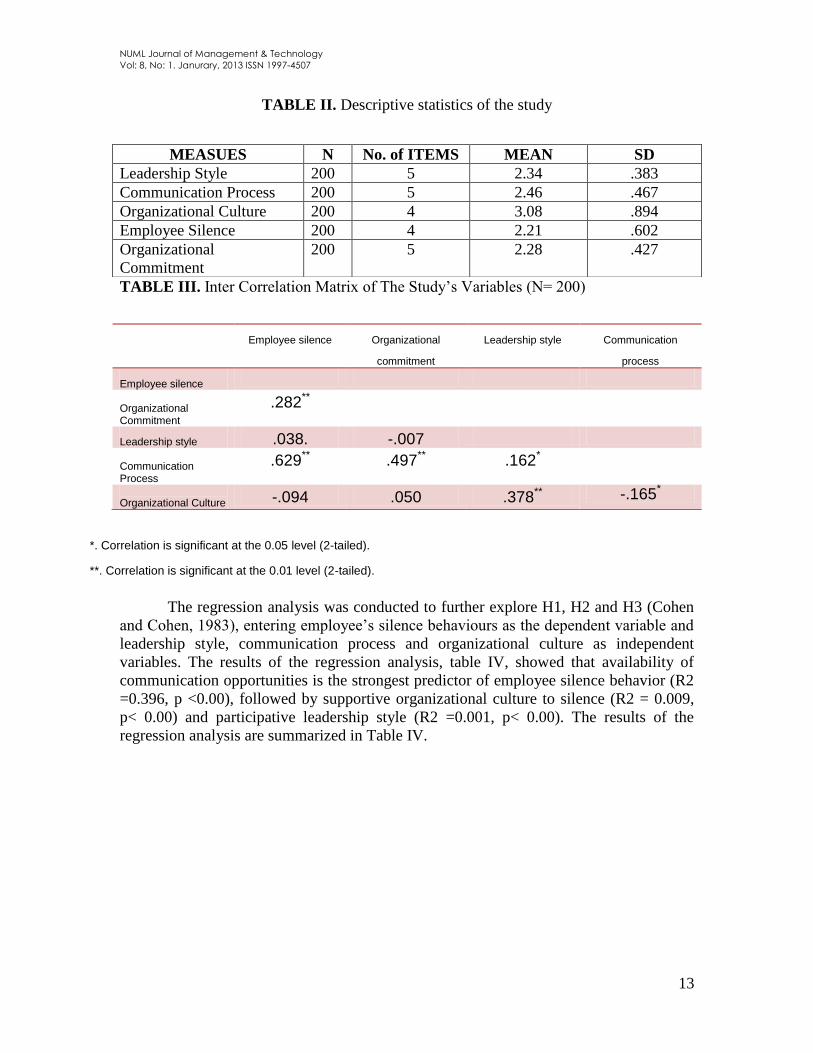
TABLE II. Descriptive statistics of the study
TABLE III. Inter Correlation Matrix of The Study‟s Variables (N= 200)
*. Correlation is significant at the 0.05 level (2-tailed).
**. Correlation is significant at the 0.01 level (2-tailed).
The regression analysis was conducted to further explore H1, H2 and H3 (Cohen
and Cohen, 1983), entering employee‟s silence behaviours as the dependent variable and
leadership style, communication process and organizational culture as independent
variables. The results of the regression analysis, table IV, showed that availability of
communication opportunities is the strongest predictor of employee silence behavior (R2
=0.396, p <0.00), followed by supportive organizational culture to silence (R2 = 0.009,
p< 0.00) and participative leadership style (R2 =0.001, p< 0.00). The results of the
regression analysis are summarized in Table IV.
MEASUES N No. of ITEMS MEAN SD
Leadership Style 200 5 2.34 .383
Communication Process 200 5 2.46 .467
Organizational Culture 200 4 3.08 .894
Employee Silence 200 4 2.21 .602
Organizational
Commitment
200 5 2.28 .427
Employee silence Organizational
commitment
Leadership style Communication
process
Employee silence Organizational Commitment
.282**
Leadership style .038. -.007 Communication Process
.629** .497** .162*
Organizational Culture -.094 .050 .378** -.165*
NUML Journal of Management & Technology
Vol: 8, No: 1. Janurary, 2013 ISSN 1997-4507
14
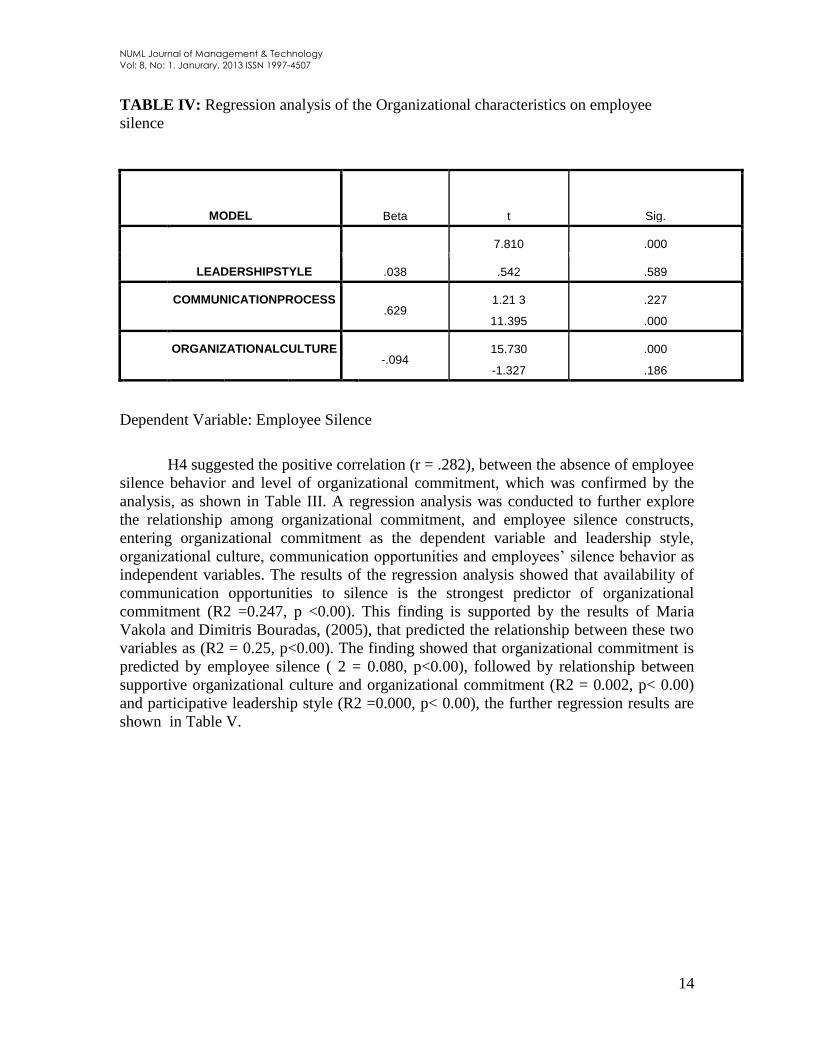
TABLE IV: Regression analysis of the Organizational characteristics on employee
silence
MODEL Beta t Sig.
7.810 .000
LEADERSHIPSTYLE .038 .542 .589
COMMUNICATIONPROCESS
.629 1.21 3
11.395
.227
.000
ORGANIZATIONALCULTURE
-.094 15.730
-1.327
.000
.186
Dependent Variable: Employee Silence
H4 suggested the positive correlation (r = .282), between the absence of employee
silence behavior and level of organizational commitment, which was confirmed by the
analysis, as shown in Table III. A regression analysis was conducted to further explore
the relationship among organizational commitment, and employee silence constructs,
entering organizational commitment as the dependent variable and leadership style,
organizational culture, communication opportunities and employees‟ silence behavior as
independent variables. The results of the regression analysis showed that availability of
communication opportunities to silence is the strongest predictor of organizational
commitment (R2 =0.247, p <0.00). This finding is supported by the results of Maria
Vakola and Dimitris Bouradas, (2005), that predicted the relationship between these two
variables as (R2 = 0.25, p<0.00). The finding showed that organizational commitment is
predicted by employee silence ( 2 = 0.080, p<0.00), followed by relationship between
supportive organizational culture and organizational commitment (R2 = 0.002, p< 0.00)
and participative leadership style (R2 =0.000, p< 0.00), the further regression results are
shown in Table V.
NUML Journal of Management & Technology
Vol: 8, No: 1. Janurary, 2013 ISSN 1997-4507
15
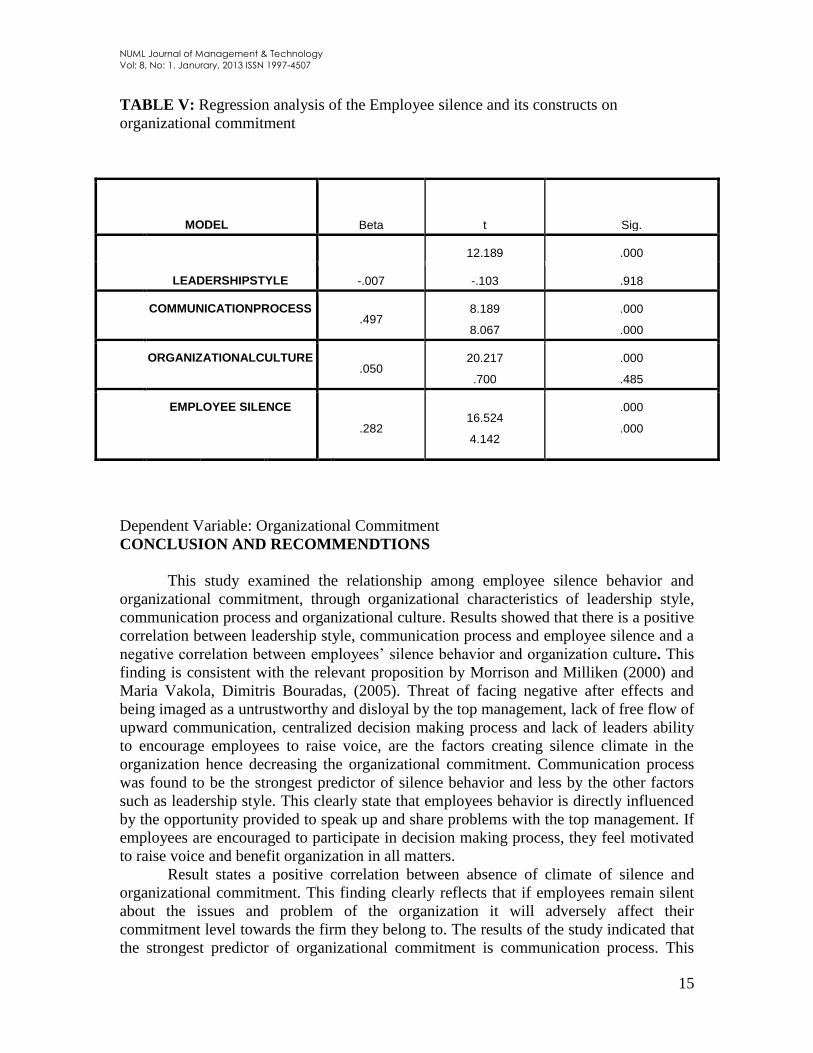
TABLE V: Regression analysis of the Employee silence and its constructs on
organizational commitment
Dependent Variable: Organizational Commitment
CONCLUSION AND RECOMMENDTIONS
This study examined the relationship among employee silence behavior and
organizational commitment, through organizational characteristics of leadership style,
communication process and organizational culture. Results showed that there is a positive
correlation between leadership style, communication process and employee silence and a
negative correlation between employees‟ silence behavior and organization culture. This
finding is consistent with the relevant proposition by Morrison and Milliken (2000) and
Maria Vakola, Dimitris Bouradas, (2005). Threat of facing negative after effects and
being imaged as a untrustworthy and disloyal by the top management, lack of free flow of
upward communication, centralized decision making process and lack of leaders ability
to encourage employees to raise voice, are the factors creating silence climate in the
organization hence decreasing the organizational commitment. Communication process
was found to be the strongest predictor of silence behavior and less by the other factors
such as leadership style. This clearly state that employees behavior is directly influenced
by the opportunity provided to speak up and share problems with the top management. If
employees are encouraged to participate in decision making process, they feel motivated
to raise voice and benefit organization in all matters.
Result states a positive correlation between absence of climate of silence and
organizational commitment. This finding clearly reflects that if employees remain silent
about the issues and problem of the organization it will adversely affect their
commitment level towards the firm they belong to. The results of the study indicated that
the strongest predictor of organizational commitment is communication process. This
MODEL Beta t Sig.
12.189 .000
LEADERSHIPSTYLE -.007 -.103 .918
COMMUNICATIONPROCESS
.497 8.189
8.067
.000
.000
ORGANIZATIONALCULTURE
.050 20.217
.700
.000
.485
EMPLOYEE SILENCE
.282 16.524
4.142
.000
.000
NUML Journal of Management & Technology
Vol: 8, No: 1. Janurary, 2013 ISSN 1997-4507
16
finding is supported by the earlier research work (Putti and Aryee, 1990), and Maria
Vakola, Dimitris Bouradas, (2005), highlighting that among all organizational processes,
clarity of communication process have a positive influence on the commitment level of
employees. When employee feels that he can easily communicate with the higher
authority, and share everything in trustworthy environment, he gets more attached to the
organization and develop a sense of belongingness, hence takes decision to associate
himself with the firm for longer period of time.
Mostly it is noticed that employee silence behavior prevails to avoid its negative
consequences for individuals as well as for the organization. For instance, while
employees often remain silent about the bad news, positive news frequently flow upward
on communication channel to the top management. Consequently a lot of important
information is lost and yet not delivered to the top management thus, weakening their
decisions ability. On the other hand it does adversely affect the working of the employees
(Beer & Eisenstat, 2000; Morrison & Milliken, 2000; Nemeth, 1997; Tamuz, 2001).
These results can have severe long-term after effects for the employees as well as and for
the business.
The critical question that needs answer is that how it can be ensured in the firm
that employees will raise voice at the time they are confronted with problem. The leader
must realize that to develop an organization employees must be encouraged to provide
information regarding the issues faced and must share new ideas and innovations. To do
so, employees must be provided with an environment where they can speak up and truly
state the issues faced by them Edmondson (2003). If employees feels that their supervisor
do not give attention to what they are saying or he is least interested in the information
provided by them, they will be discouraged to raise their voice or to participate in
problem solving. Moreover leaders should try to change the mindset of the employees
that they will be imaged negatively if they speak up, and should appreciate those who
dare to inform organization regarding the issues. Moreover, managers should develop
such a system that allows employees to talk about sensitive problems in confidentiality.
Also, a person could be designated who can present the ideas of the subordinates to the
top management Milliken et al. (2003). Theses suggestion could lead to the development
of an environment that promotes employees to raise their voice.
To develop and environment that encourage employees to speak up is to provide
them with adequate communication opportunities. There should be free flow of upward
communication and decision should be taken on the participation of the employees.
To compete in the business world, firm not only need to recruit human capital but
also to retain it. Retention is gained by developing a high sense of commitment among
employees. Employee silence behavior negatively affects organizational commitment. To
avoid silence behavior and to achieve high commitment level room for open discussion
of problem and ideas should be given and organizational culture and norms should
appreciate speaking up behavior.
LIMITATIONS OF THE STUDY
This study presents a new empirical contribution in the field of research, however consist
of certain limitations. Firstly, the data was collected through using one-shot
questionnaire methodology to measured perceptions of employees regarding the variables
under consideration and didn‟t rely on other sources of primary data. This generates the
possibility for perceptual bias that is one of the common problems connected with data
NUML Journal of Management & Technology
Vol: 8, No: 1. Janurary, 2013 ISSN 1997-4507
17
collection (e.g., Premeaux & Bedeian 2003). It may also create self-report bias because
respondents answer the questions on the basis of their own mind set. In addition, the
study may be contaminated due to the social desirability biasness that caused respondents
to answer the questions positively to represent good self image.
It has been noticed that there are a lot of factors leading to employee silence in the
organization; however for the sake of this study few constructs were considered. Thus, it
is suggested to conduct future researches with the addition of other constructs.
Another limitation of the study is that it was a one shot study and small sample
was involved but it could be replaced by a longitudinal study in future along with the
larger sample size, to further explain the concept in detail. Moreover the existing model
did not include the moderate variable, thus it is beyond the scope of this paper. Future
study could also add moderate variables in the existing model, to see its effect on the
relationship between dependent and independent variable. Finally, it could be said that
the approach of this paper is not comprehensive but still provides an initial foundational
framework to guide future research in the same field.
FUTURE IMPLICATIONS
The climate of silence influences the firm‟s ability to identify mistakes, thus
negatively affecting the organizational performance. Tamuz, (2001) expressed that due to
this silence behavior employee my get the victim of stress, depression, and
dissatisfaction. Therefore it is important to answer the question that how firms can
generates an environment in which employees feel comfortable to speak regarding issues
faced by them. On the basis of the findings of the study few significant implications are
discussed in this section.
The result showed that leader‟s ability to encourage employees to raise voice,
formal upward communication and participative decision making process, and healthy
organizational culture are positively related to employee silence behavior, thus
organizations need to develop such a climate where all these practices takes place
smoothly so that high level of organizational commitment could be achieved. More
particularly, leaders could encourage employees to participate in open communication
and decision making processes, which was found to positively influence the employee
silence (Morrison and Milliken 2000). Several organizational characteristics, that
facilitates the above leader‟s behavior to take place, may discourage the climate of
silence as it is shown in the study of Pierce et al. (1984), that leader‟s attitude towards
the employees affects the working behavior of the subordinates due to the power held by
them. It also has the power to develop trustworthy behavior among employees hence
enhancing their trust and loyalty towards the organization. This trustworthy behavior on
part of employees could be considered as a source of competitive advantage by the top
management.
In addition, open communication and feedback channels, availability of accurate
knowledge, free flow of thoughts and ideas (Schweiger and Denisi; 1991), are important
elements to be considered by the mangers in order to cope with employee‟s feeling of
uncertainty, job insecurity and job stress which can obstruct the change management
process and also because the firms with the centralized and formal communication
channel limits the development of organizational commitment.
In todays fast pace business world, firms are moving towards a flat and team-
oriented organizational structure, which highlights the importance of improving level of
NUML Journal of Management & Technology
Vol: 8, No: 1. Janurary, 2013 ISSN 1997-4507
18
commitment among employees at all levels, in order to achieve organizational goals
(Mowday et al.; 1982). Moreover, as stated by Morrison and Milliken (2000), climate of
silence leads to lack of organizational commitment as employees develop the feelings of
not being valued, and creates cognitive dissonance among workforce. In addition, Oliver
(1990), mentioned that the above factors results in adverse outcomes for the organization
such as high turnover rate, increased stress level and dissatisfaction.
This study in hand presented a comparatively new area in the field of organizational
behavior and provided evidences that employee silence behavior, created due to poor
leadership style, lack of open communication process and defensive organizational
culture and norms, adversely affect organizational commitment. While one may not
disagree with the causal justifications of the findings, because of the research design
implement, the results propose a noteworthy insight in understanding the impact of
employee silence on organizational commitment.
RESEARCH LIMITATIONS
The study in focus was one shot study, that could be further elaborated as longitudinal
study to get more deeper insight into the phenomenon under study. The survey of the
study only included few employees of the organization that could be further increased to
generalize the study.
PRACTICAL IMPLICATIONS
The methodology of this paper could be employed by the firms to discourage and handle
employee silence and to explore the factors causing silence climate thus raising
organizational commitment among the employees.
SOCIAL IMPLICATIONS
This research also has implications for organization that want to achieve superior
organizational performance through innovation and creativity. Moreover organizational
commitment could be achieve through encouraging employee to share their ideas for the
betterment of the firm. Participative leadership style could result in better involvement of
employees in decision making process. Further if employees know that they can easily
communicate their issues to the co-workers and top management and would be heard,
such sort of conducive organizational culture develops high level of commitment.
REFRENCES
Appelbaum, S.H., Gandell, J., Yortis, H., Proper, S. and Jobin, F. (2000), „„Anatomy of a
merger: behavior of organizational factors and processes throughout the pre-
during- post-stages (part 1)‟‟, Management Decision, Vol. 38, pp. 649-61.
Argyris, C. (1977), „„Double loop learning in organizations‟‟, Harvard Business Review,
Vol. 55, No. 5, pp. 115-29. Argyris, C. and Shon, D. (1978), „„Reading‟‟, Organisational Learning, Addison-Wesley,
MA.
Beer, M. and Eisenstat, R. (2000), „„The silent killers of strategy implementation and
learning‟‟, Sloan Management Review, Vol. 41, pp. 29-40. Beer, M. and Noria, N. (2000), „„Cracking the code of change‟‟, Harvard Business
Review, May-June, pp. 133-41. Bies, R.J. and Shapiro, D. L. (1988), Voice and justification: their influence on
procedural fairness judgments. Academy of Management Journal, Vol. 31, pp.
NUML Journal of Management & Technology
Vol: 8, No: 1. Janurary, 2013 ISSN 1997-4507
19
676-85.
Buchanan, B. (1974), „„Building organizational commitment: the socialisation of
managers in work organisations‟‟, Administrative Science Quarterly, Vol. 19, pp.
533-46.
Cohen, J. and Cohen, P. (1983), Applied Multiple Regression/Correlation Analysis for
the Behavioral Sciences, Lawrence Erlbaum Associates Inc., Hillsdale, NJ. Collins, J. (2001), Good to Great, Random House, London.
Cuellar, M. J. and Keil, M. and Johnson, R.D. (2006), “The Deaf Effect Response to Bad
News Reporting in Information Systems Projects.” e-Service Journal Vol. 5 No. 1
(2006), pp 75-97. Project MUSE. Web. 21 Jan. 2011. <http://muse.jhu.edu/>. Dickson, W. and Roethlisberger, F. (1966), Counseling in an Organization: A Sequel to
the Hawthorne Researches, Harvard University Press, Boston, MA.
Edmondson, A. (2003), „„Speaking up in the operating room: How team leaders promote
learning in interdisciplinary action teams‟‟, Journal of Management Studies, Vol.
40 No. 6, 1419-52.
Feuille, P. and Delaney, J.T. (1993), “The individual pursuit of organizational justice:
grievance procedures in nonunion workplaces”, in Ferris, G.R. and Rowland,
K.M. (Eds), Research in Personnel and Human Resource Management, Vol. 10,
JAI Press, Greenwich CT, pp. 187-232.
Fisher, C. (1979), „„Transmission of positive and negative feedback to subordinates: a
laboratory investigation‟‟, Journal of Applied Psychology, October, pp. 533-40.
Hennestad, B. (1990), „„The symbolic impact of double bind leadership: double bind and
the dynamics of organization culture‟‟, Journal of Management Studies, Vol. 27
No. 3, pp. 265-80.
Izraeli, D. and Jick, T. (1986), „„The art of saying no: linking power to culture‟‟,
Organization Studies, Vol. 7 No. 2, pp. 171-92. Kassing, J.W. (1997), “Articulating, antagonizing, and displacing: a model of employee
dissent”, Communication Studies, Vol. 48, pp. 311-32.
Maria Vakola, Dimitris Bouradas, (2005),"Antecedents and consequences of
organisational silence: an empirical investigation", Employee Relations, Vol. 27
Iss: 5 pp. 441 – 458. McCabe, D.M. and Lewin, D. (1992), “Employee voice: a human resource management
perspective”, California Management Review, Vol. 34 No. 3, pp. 112-23. McCauley, D.P. and Kuhnert, K.W. (1992), „„A theoretical review and empirical
investigation of employee trust in management‟‟, Public Administration
Quarterly, Vol. 16, pp. 265-84.
Meyerson, D. 2001. Tempered radicals: How people use difference to inspire change at
work. Boston, Ma.: Harvard Business School Press. Milliken, F., Morrison, E. and Hewlin, P. (2003), „„An exploratory study of employee
silence: issues that employees don‟t communicate upward and why‟‟, Journal of
Management Studies, Vol. 40 No. 6, pp. 1453-76. Morrison, E. and Milliken, F. (2000), „„Organisational silence: a barrier to change and
development in pluralistic world‟‟, Academy of Management Review, Vol. 25
No. 4, pp. 706-25.
Mowday, R., Porter, L. and Steers, R. (1982), Employee-Organization Linkages: The
NUML Journal of Management & Technology
Vol: 8, No: 1. Janurary, 2013 ISSN 1997-4507
20
Psychology of Commitment, Absenteeism and Turnover, Academic Press, New
York, NY.
Nemeth, C.J. (1985), “Dissent, group process, and creativity”, Advances in Group
Processes, Vol. 2, pp. 57-75.
Nemeth, C.J. (1997), “Managing innovation: when less is more”, California Management
Review, Vol. 40 No. 1, pp. 59-74.
Oliver, N. (1990), „„Rewards, investments, alternatives and organisational commitment:
Empirical evidence and theoretical development‟‟, Journal of Occupational
Psychology, Vol. 63, pp. 19-31.
Oppel, R. A. Enron official says many knew about shaky company finances. New York
Times, February,15, 2002. Peirce, E., Smolinski, C. and Rosen, B. (1998), “Why sexual harassment complaints fall
on deaf ears.” Academy of Management Executive, Vol. 12 No. 3, pp 41-54.
Perlow, L. and Williams, S. (2003), „„Is silence killing your company?‟‟ Harvard
Business Review, May, pp. 52-8.
Pierce, J., Dunham, R. and Cummings, L. (1984), „„Sources of environmental structuring
and participant responses‟‟, Organizational Behaviour and Human Performance,
Vol. 33, pp. 214-42.
Pinder, C. and Harlos, H. (2001), „„Employee silence: quiescence and acquiescence as
responses to perceived injustice‟‟, Research in Personnel and Human Resource
Management, Vol. 20, pp. 331-69.
Porter, L., Steers, R., Mowday, R. and Boulian, P. (1974), „„Organizational commitment,
job satisfaction and turnover among psychiatric technicians‟‟, Journal of Applied
Psychology, Vol. 59, pp. 603-9.
Premeaux, S. F. and Bedeian, A. G. (2003), “Breaking the silence: The moderating
effects of self-monitoring in predicting speaking up in the workplace.” Journal of
Management Studies, Vol. 40 No. 6, pp 1537-1562.
Putti, J. and Aryee, S. (1990), „„Communication relationship satisfaction‟‟, Group and
Organization Studies, Vol. 15 No. 1, pp. 44-53.
Quinn, R. and Spreitzer, G. (1997), „„The road to empowerment: seven questions every
leader should answer‟‟, Organizational Dynamics, Vol. 26 No. 2, pp. 37-50.
Redding, W.C. (1985), “Rocking boats, blowing whistles, and teaching speech
communication”, Communication Education, Vol. 34, pp. 245-58. Schlenker, B.R. and Weigold, M.F. (1989), “Self-identification and accountability.” In R.
A. Giacalone & P. Rosenfeld, (Eds.), Impression management in the organization,
pp 21-43. Hillsdale, NJ: Erlbaum.
Schweiger, D. and DeNisi, A. (1991), „„Communication with employees following a
merger: a longitudinal field experiment‟‟, Academy of Management Journal, Vol.
34, pp. 110-35.
Seeger, M.W. and Ulmer, R.R. (2003), “Explaining enron”, Management communication
Quarterly, Vol. 17 No. 1, p. 58. Senge, P. (1999), The Dance of Change: The Challenges of Sustaining Momentum in
Learning Organisations, Nicholas Brealey Publishing, London. Smidts, A., Pruyn, A. and Van Riel, C. (2001), „„The impact of employee communication
and perceived external prestige on organisational identification‟‟, Academy of
NUML Journal of Management & Technology
Vol: 8, No: 1. Janurary, 2013 ISSN 1997-4507
21
Management Journal, Vol. 44 No. 5, pp. 1051-63.
Smith, J., Keil, M. and Depledge, G. (2001), “Keeping mum as the project goes under:
Towards an explanatory model.” Journal of Management Information Systems,
Vol. 18 No. 2, pp 189-227.
Sprague, J.A. and Ruud, G.L. (1988), “Boat-rocking in the high technology culture”,
American Behavioral Scientist, Vol. 32, pp. 169-93.
Sugarman, B. (2001), „„A learning-based approach to organisational change: some results
and guidelines‟‟, Organizational Dynamics, Vol. 30 No. 1, pp. 62-76.
Tamuz, M. (2001), „„Learning disabilities for regulators: the perils of organizational
learning in the air transportation industry‟‟, Administration and Society, Vol. 3,
pp. 276-302.
Vakola, M., and Bouradas, D. (2005), “Antecedents and consequences of employee
silence: an empirical investigation.” Employee Relations, Vol. 27, pp 441-458.
Van Dyne, L., Ang, S. and Botero, I. (2003), „„Conceptualizing employee silence and
employee voice as multidimensional constructs‟‟, Journal of Management
Studies, Vol. 40 No. 6, pp. 1359-92.
Westin, A.F., Kurtz, H.I. and Robbins, A. (1981), Whistleblowing: Loyalty and Dissent
in the Corporation, McGraw-Hill, New York, NY.
Whiting, Steven W.; Podsakoff, Philip M.; Pierce, Jason R. (2008), “Effects of task
performance, helping, voice, and organizational loyalty on performance appraisal
ratings.” Journal of Applied Psychology, Vol 93 No. 1, pp 125-139.
Wilson, J. and Harrison, M. (2001), “The necessity of driving to Abilene”, Organization
Development Journal, Vol. 19 No. 2, pp. 99-108.
Questionnaire
Study on “overcoming employee silence to achieve organizational commitment”
Within organizations employees often need to decide whether to speak up or
remain silent, which means whether to share or withhold, information, and ideas
necessary to the success of organization. This decision by the employees has a direct
effect on the organizational commitment.
This study entitled “overcoming employee silence to achieve organizational
commitment” is conducted for the academic purpose that aims to investigate the causal
relationship between the employee silence and organizational commitment through
leadership style, organizational communication process and organizational culture. Your
honorable self in requested to fill the attach questionnaire and be the part of this study by
providing unbiased and valid information. Thank you for your time. Please feel free to
contact if you have any problem in understanding the questions.
NUML Journal of Management & Technology
Vol: 8, No: 1. Janurary, 2013 ISSN 1997-4507
22
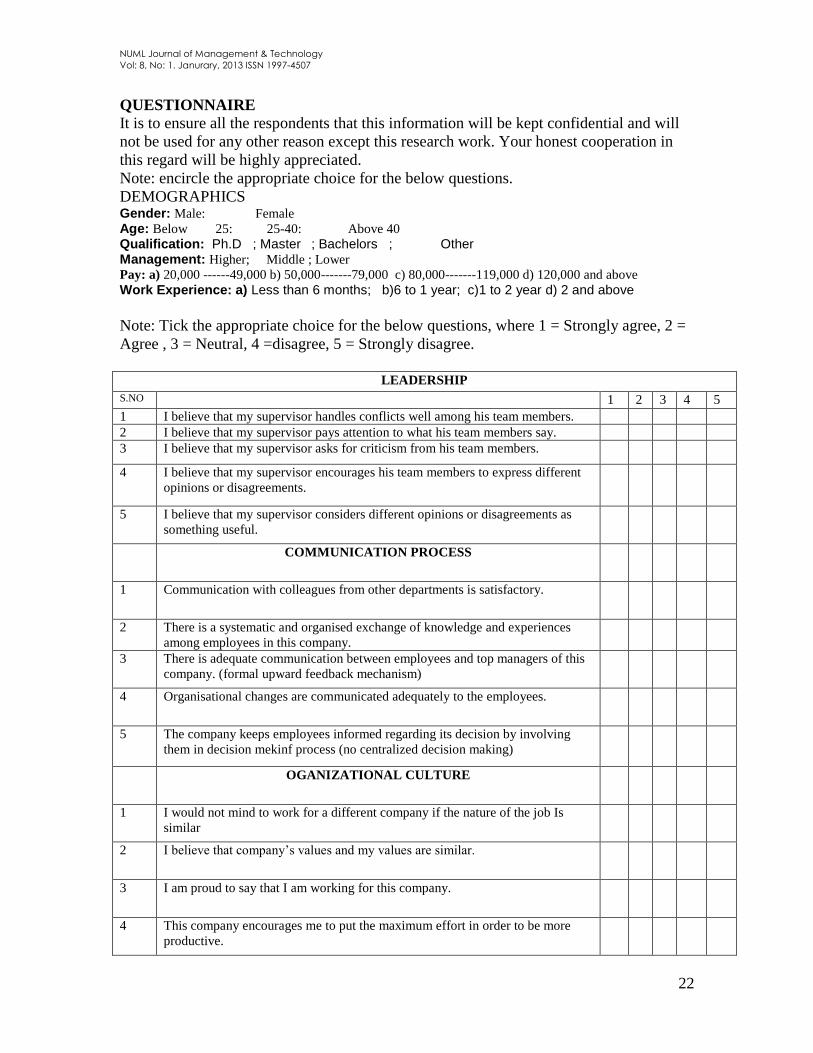
QUESTIONNAIRE
It is to ensure all the respondents that this information will be kept confidential and will
not be used for any other reason except this research work. Your honest cooperation in
this regard will be highly appreciated.
Note: encircle the appropriate choice for the below questions.
DEMOGRAPHICS Gender: Male: Female
Age: Below 25: 25-40: Above 40
Qualification: Ph.D ; Master ; Bachelors ; Other Management: Higher; Middle ; Lower
Pay: a) 20,000 ------49,000 b) 50,000-------79,000 c) 80,000-------119,000 d) 120,000 and above Work Experience: a) Less than 6 months; b)6 to 1 year; c)1 to 2 year d) 2 and above
Note: Tick the appropriate choice for the below questions, where 1 = Strongly agree, 2 =
Agree , 3 = Neutral, 4 =disagree, 5 = Strongly disagree.
LEADERSHIP
S.NO 1 2 3 4 5
1 I believe that my supervisor handles conflicts well among his team members.
2 I believe that my supervisor pays attention to what his team members say.
3 I believe that my supervisor asks for criticism from his team members.
4 I believe that my supervisor encourages his team members to express different
opinions or disagreements.
5 I believe that my supervisor considers different opinions or disagreements as
something useful.
COMMUNICATION PROCESS
1 Communication with colleagues from other departments is satisfactory.
2 There is a systematic and organised exchange of knowledge and experiences
among employees in this company.
3 There is adequate communication between employees and top managers of this
company. (formal upward feedback mechanism)
4 Organisational changes are communicated adequately to the employees.
5 The company keeps employees informed regarding its decision by involving
them in decision mekinf process (no centralized decision making)
OGANIZATIONAL CULTURE
1 I would not mind to work for a different company if the nature of the job Is
similar
2 I believe that company‟s values and my values are similar.
3 I am proud to say that I am working for this company.
4 This company encourages me to put the maximum effort in order to be more
productive.

NUML Journal of Management & Technology
Vol: 8, No: 1. Janurary, 2013 ISSN 1997-4507
23
5 I am very satisfied with my choice to come and work for this company in
comparison with other opportunities I had when I was looking for a job.
1 I am afraid to raise voice to the top management as a response to procedural
injustice.
2 I don‟t express my disagreement regarding company issues, due to the negative
consequences coming from the top management.
3 If you disagree about company issues, it can be perceived as lack of trust and
loyalty by the top management
4 The norms and the defensive routine of the organization forces not to speak the
truth to the supervisors
EMPLOYEE SILENCE
1 You often express your disagreements to your managers regarding company
issues.
2 You often express your disagreements to your managers regarding
department‟s issues..
3 You often express your disagreements to your managers regarding your job.
4 You often express your disagreements to your managers
regarding issues related to job satisfaction such as salary, working conditions
etc.
NUML Journal of Management & Technology
Vol: 8, No: 1. Janurary, 2013 ISSN 1997-4507
24
The impact of macroeconomic factors on stock market returns: A case
of lead-lag relationship of gold prices and index return Fathima Rasheed
1 , Saadia Mushtaq
1, 1 International Islamic university Islamabad
Abstract
This paper focuses on the long term relationship between the macroeconomic variable
and returns in Karachi stock exchange. The explanatory variable used in this study is
gold prices. This study is conducted with an objective to whether the gold prices serve as
an indicator of changes in stock returns or stock returns determine the hike in gold
prices. For this study data is being analyzed for the time period from July 1997 to
November 2011. Using Unit root test, Johansen and Juselius (1990) co-integration test
and the granger causality (1995) tests, we have examined the long-run as well as the
causal relationship between the gold prices and stock returns. The results confirm a
significant long term and bidirectional causal relationship between gold prices and stock
market returns. It suggests that the changes in gold prices determine changes in stock
market returns. This study is significantly important for investors, financial analyst and
policy makers because gold prices play an important role in determining stock market
returns.
Keywords: Karachi stock exchange, gold prices, APT.
Introduction
The economic activity, financial variables and performance of stock market have been
the center of research after financial crisis and declined output. The relation between the
stock return and the economic growth has been studied. A number of researchers studied
and developed models for the relationship between real economic activity and the
changes in US stock prices (Abdullah & Hayworth 1993; Fama, 1981; Roll, 1983), while
other researchers examined such relation in UK (Poon & Taylor, 1991; Cheng, 1995).
Still other researchers made an attempt to find the relation in Japan (Hamao, 1988;
Mookerjee & Naka, 1995), Singapore (Maysami et. al., 2004) and Canada (Darrat, 1990).
The relationship has been studied in the emerging economies. It has been documented in
the results of all these studies that changes in macroeconomic variables have an impact
on the stock market returns.
Researchers have incorporated different macroeconomic variables in their studies to
examine the relationship. Pilinkus (2010) studied the relationship between stock market
returns and macroeconomic variables like GDP deflator, net export and foreign direct
investment. Intensity of trade relations, the degree of financial integration and the nature
of exchange rate regime is studied in relation to stock market (Walti, 2005).
This paper studies the impact of gold prices on the stock returns in Pakistan. The
variable of gold prices is chosen because any fluctuation in the gold price is important in
determining the performance of stock market. So it is checked in this paper whether any
change in gold prices has an impact on the stock returns. This paper is checking this
relation in Pakistan for the first time.
The rest of the paper is organized as follows. Existing literature has been reviewed in
section 2. Data used and the methodology applied has been discussed in the section 3.
Results and conclusions are given in section 4.
Literature Review
To study stock market returns in relation to macroeconomic variables has been of interest
to researchers and policy makers for so long. It is known that the stock market is very
NUML Journal of Management & Technology
Vol: 8, No: 1. Janurary, 2013 ISSN 1997-4507
25
important in channelizing funds. Arbitrage theory of asset pricing presented by Stephen
Ross in 1976 has been used to analyze the impact of macroeconomic variables on stock
market returns. The impact of macro and micro economic variables has been supported
by empirical testing. The earliest work on this theory is that of Nelson (1976). He studied
the relation between inflation and stock market returns in USA and documented a
negative relation. Chen et al. (1986) tested the APT by taking the macroeconomic
variables and studied their impact on stock market in USA. Chan et al. (1991) used the
earning yield, cash flow, size and book to market ratio of equity to predict stock market
return in Japan. The results have revealed significant relationship between the variables
and market returns. Gan et al. (2006) studied the relation between the macroeconomic
variables and stock market return in New Zealand. They documented that the New
Zealand stock market returns is affected by the macroeconomic variables like interest
rate, money supply and real GDP. The same relation has been studied by incorporating
the macroeconomic variables i-e inflation, interest rate and capital investment by Fama &
Gibbon (1982) and impact of inflation rate and real economic activity has been studied by
Geske & Roll (1983). They found the negative relation of the variables with the stock
returns. Hamao (1988) and Mookherjee and Naka (1995) have analyzed the relationship
in Japan and showed that a short run relation exist between the macroeconomic variables
and the Japan stock market returns. Flannery and Protopapadakis (2002) found inflation
and money growth as important variables in explaining the returns in stock market.
The relationship between stock market returns and the fundamental variables has been
analyzed by the researchers in different countries. Cheung and Ng (1998) studied the
relation in the stock market index of five countries and also checked their relation to the
real variables like oil price, consumption and output. Moradoglu et al. (2000) investigated
the relationship between macroeconomic indicators and stock market returns in nineteen
emerging economies. They documented correlation between variables and returns in
stock markets of these emerging economies. Garcia and Juarez (2010) investigated the
impact of macroeconomic indicators of China and America on the stock market indices
of three countries namely Brazil, Chile and Mexico. They documented that the Chinese
macroeconomic indicators have become more important to influence stock market returns
in Latin America.
The relationship has also been studied in developing economies. Consumer price
index (CPI), industrial production index, foreign remittances, market price to earning P/E
and monthly average growth have been used as macroeconomic variables to study their
impact on stock market returns in Bangladesh by Ali (2011). He documented that the
inflation and foreign remittances have negative relation and other variables have positive
relation with stock returns. There is long run relationship between the Istanbul stock
exchange and the macroeconomic variables used i-e changes in GDP, foreign exchange
rate and current account balance (Acikalin et. al., 2008). Co-integration exists between
money supply and stock market returns in Malaysia (Ibrahim, 1999). Agarwala and
Tuteja (2007) examined the relation of the stock market returns and economic growth in
India. Their result document a long run relation between developments in stock market
and economic growth. Chancharat et al., (2007) investigated whether international stock
market and different macroeconomic variables have an effect on the stock market of
Thai. They found that Thai stock market is affected by the changes on stock markets of
Singapore, Malaysia and Indonesia before the financial crisis and Singapore, Philippines
NUML Journal of Management & Technology
Vol: 8, No: 1. Janurary, 2013 ISSN 1997-4507
26
and korea after the financial crisis of 1997. They also documented that oil prices have a
negative impact on Thai stock market. The relationship has been analyzed in the
Pakistani context by Nishat and shaheen (2004) studied the relationship among
macroeconomic variables and Karachi stock exchange and found that significant positive
relation exist between industrial production and stock market and significant negative
relation between inflation and stock returns. Sohail and Hussain (2009) found that there
exists long run relation between stock returns in Lahore stock exchange and
macroeconomic variables. Significant relationship has been found among different
macroeconomic variables and stock returns in Pakistan (farooq & keung, 2004; Mehar,
2005; Ihsan et. al., 2007).
Small amount of work has been done to examine the impact of changes in gold prices in
stock market returns. Tursoy et al. (2008) has studied in combination with other
macroeconomic variables the impact of gold prices on stock returns in Istanbul. Their
results are consistent with the study of Poon and Taylor (1991) that the pricing relation
between stock returns and macroeconomic variables is not significant. Bayuksalvarci
(2010) examined the relation of macroeconomic variables including gold prices to its
impact on Turkish stock market returns. Mishra et al. (2010) examined the relation
between the domestic prices of gold in India and its impact on stock market returns and
concluded by documenting that a long run equilibrium relation exist between the
variables.
This paper checks the linkage between stock market and the gold prices. The direction of
the causality has also been checked.
Methodology
This study aims to determine the relationship between the changes in gold prices and
stock returns. Monthly data for the variables are taken from 1997 to 2011. The dependent
variable of this study is monthly stock returns of Pakistan. Data for stock returns is taken
from Karachi stock exchange 100 index. The independent variable of the study is
monthly prices of gold. The gold price data is taken in US dollar for the reason that any
change in prices of gold in US dollar has an effect on the prices of gold in Pakistan. The
data for gold is taken from World gold council website. The data is analyzed using ADF,
co-integration, granger causality and impulse response function.
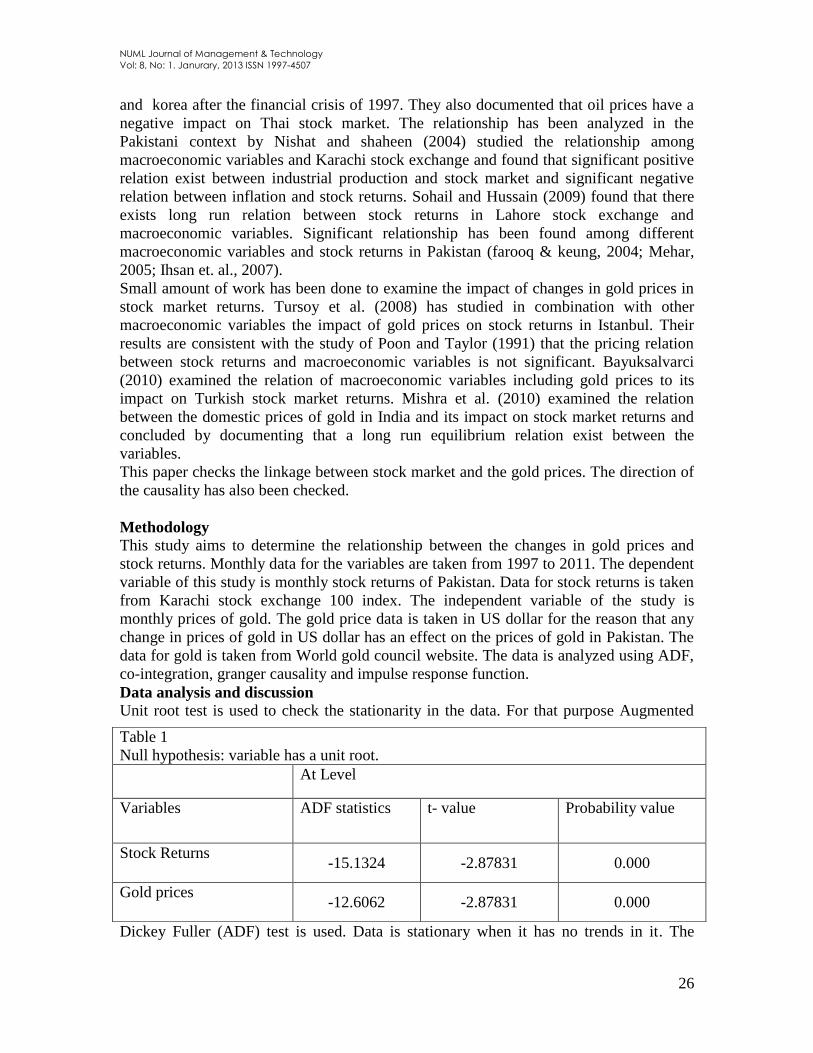
Data analysis and discussion
Unit root test is used to check the stationarity in the data. For that purpose Augmented
Dickey Fuller (ADF) test is used. Data is stationary when it has no trends in it. The
Table 1
Null hypothesis: variable has a unit root.
At Level
Variables ADF statistics t- value Probability value
Stock Returns -15.1324 -2.87831 0.000
Gold prices -12.6062 -2.87831 0.000

NUML Journal of Management & Technology
Vol: 8, No: 1. Janurary, 2013 ISSN 1997-4507
27
results of the ADF test show that variables are stationary at level. It can be seen in table 1
that the t-statistics values are greater than 2 (in absolute terms) and p-value is less than
0.05, so we reject the null hypothesis and document that the data is stationary.
Johansen‟s and Juselius multivariate test is then applied to check the long term relation
between the variables. We find from the results that long term relation exists between the
stock market returns and gold prices.
NUML Journal of Management & Technology
Vol: 8, No: 1. Janurary, 2013 ISSN 1997-4507
28
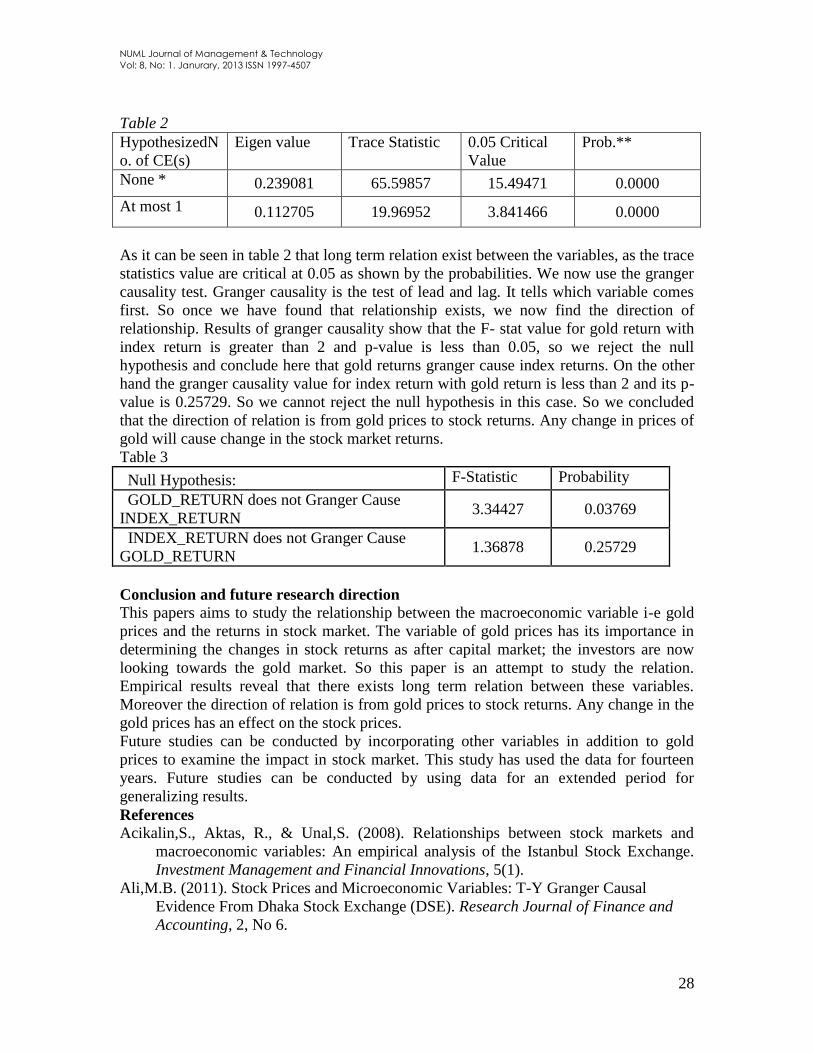
Table 2
HypothesizedN
o. of CE(s)
Eigen value Trace Statistic 0.05 Critical
Value
Prob.**
None * 0.239081 65.59857 15.49471 0.0000
At most 1 0.112705 19.96952 3.841466 0.0000
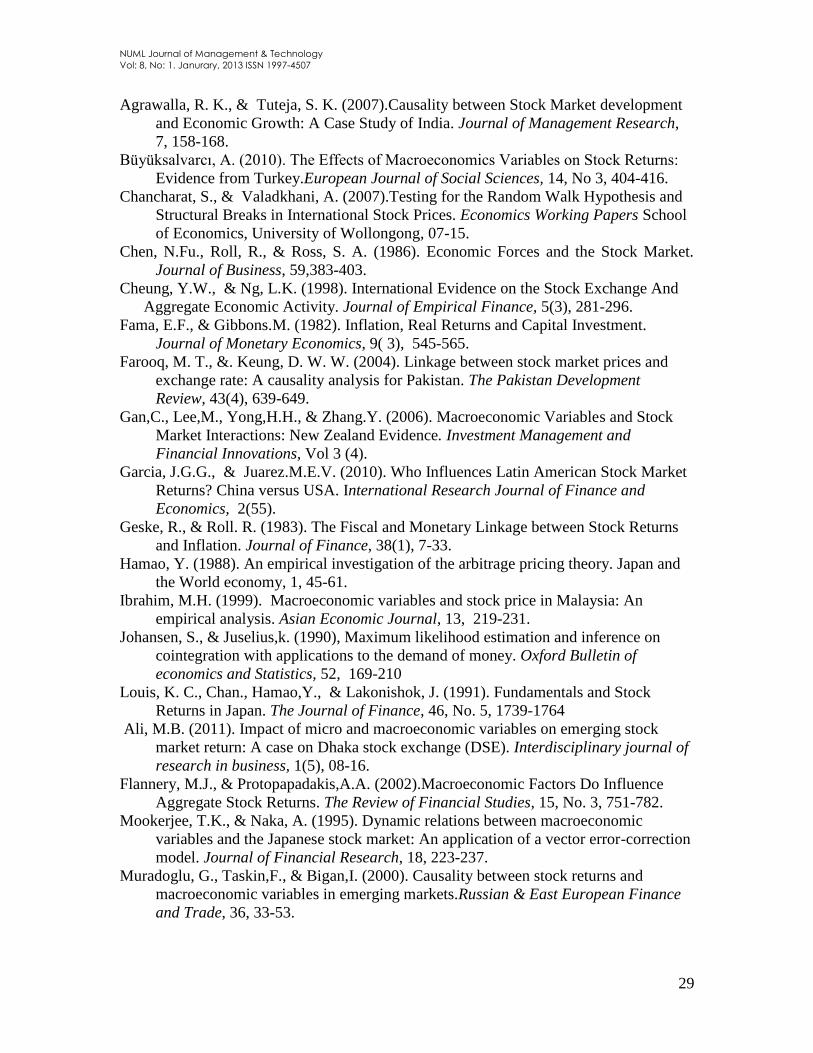
As it can be seen in table 2 that long term relation exist between the variables, as the trace
statistics value are critical at 0.05 as shown by the probabilities. We now use the granger
causality test. Granger causality is the test of lead and lag. It tells which variable comes
first. So once we have found that relationship exists, we now find the direction of
relationship. Results of granger causality show that the F- stat value for gold return with
index return is greater than 2 and p-value is less than 0.05, so we reject the null
hypothesis and conclude here that gold returns granger cause index returns. On the other
hand the granger causality value for index return with gold return is less than 2 and its p-
value is 0.25729. So we cannot reject the null hypothesis in this case. So we concluded
that the direction of relation is from gold prices to stock returns. Any change in prices of
gold will cause change in the stock market returns.
Table 3
Null Hypothesis: F-Statistic Probability
GOLD_RETURN does not Granger Cause
INDEX_RETURN 3.34427 0.03769
INDEX_RETURN does not Granger Cause
GOLD_RETURN 1.36878 0.25729
Conclusion and future research direction
This papers aims to study the relationship between the macroeconomic variable i-e gold
prices and the returns in stock market. The variable of gold prices has its importance in
determining the changes in stock returns as after capital market; the investors are now
looking towards the gold market. So this paper is an attempt to study the relation.
Empirical results reveal that there exists long term relation between these variables.
Moreover the direction of relation is from gold prices to stock returns. Any change in the
gold prices has an effect on the stock prices.
Future studies can be conducted by incorporating other variables in addition to gold
prices to examine the impact in stock market. This study has used the data for fourteen
years. Future studies can be conducted by using data for an extended period for
generalizing results.
References
Acikalin,S., Aktas, R., & Unal,S. (2008). Relationships between stock markets and
macroeconomic variables: An empirical analysis of the Istanbul Stock Exchange.
Investment Management and Financial Innovations, 5(1).
Ali,M.B. (2011). Stock Prices and Microeconomic Variables: T-Y Granger Causal
Evidence From Dhaka Stock Exchange (DSE). Research Journal of Finance and
Accounting, 2, No 6.
NUML Journal of Management & Technology
Vol: 8, No: 1. Janurary, 2013 ISSN 1997-4507
29
Agrawalla, R. K., & Tuteja, S. K. (2007).Causality between Stock Market development
and Economic Growth: A Case Study of India. Journal of Management Research,
7, 158-168.
Büyüksalvarcı, A. (2010). The Effects of Macroeconomics Variables on Stock Returns:
Evidence from Turkey.European Journal of Social Sciences, 14, No 3, 404-416.
Chancharat, S., & Valadkhani, A. (2007).Testing for the Random Walk Hypothesis and
Structural Breaks in International Stock Prices. Economics Working Papers School
of Economics, University of Wollongong, 07-15.
Chen, N.Fu., Roll, R., & Ross, S. A. (1986). Economic Forces and the Stock Market.
Journal of Business, 59,383-403.
Cheung, Y.W., & Ng, L.K. (1998). International Evidence on the Stock Exchange And
Aggregate Economic Activity. Journal of Empirical Finance, 5(3), 281-296.
Fama, E.F., & Gibbons.M. (1982). Inflation, Real Returns and Capital Investment.
Journal of Monetary Economics, 9( 3), 545-565.
Farooq, M. T., &. Keung, D. W. W. (2004). Linkage between stock market prices and
exchange rate: A causality analysis for Pakistan. The Pakistan Development
Review, 43(4), 639-649.
Gan,C., Lee,M., Yong,H.H., & Zhang.Y. (2006). Macroeconomic Variables and Stock
Market Interactions: New Zealand Evidence. Investment Management and
Financial Innovations, Vol 3 (4).
Garcia, J.G.G., & Juarez.M.E.V. (2010). Who Influences Latin American Stock Market
Returns? China versus USA. International Research Journal of Finance and
Economics, 2(55).
Geske, R., & Roll. R. (1983). The Fiscal and Monetary Linkage between Stock Returns
and Inflation. Journal of Finance, 38(1), 7-33.
Hamao, Y. (1988). An empirical investigation of the arbitrage pricing theory. Japan and
the World economy, 1, 45-61.
Ibrahim, M.H. (1999). Macroeconomic variables and stock price in Malaysia: An
empirical analysis. Asian Economic Journal, 13, 219-231.
Johansen, S., & Juselius,k. (1990), Maximum likelihood estimation and inference on
cointegration with applications to the demand of money. Oxford Bulletin of
economics and Statistics, 52, 169-210
Louis, K. C., Chan., Hamao,Y., & Lakonishok, J. (1991). Fundamentals and Stock
Returns in Japan. The Journal of Finance, 46, No. 5, 1739-1764
Ali, M.B. (2011). Impact of micro and macroeconomic variables on emerging stock
market return: A case on Dhaka stock exchange (DSE). Interdisciplinary journal of
research in business, 1(5), 08-16.
Flannery, M.J., & Protopapadakis,A.A. (2002).Macroeconomic Factors Do Influence
Aggregate Stock Returns. The Review of Financial Studies, 15, No. 3, 751-782.
Mookerjee, T.K., & Naka, A. (1995). Dynamic relations between macroeconomic
variables and the Japanese stock market: An application of a vector error-correction
model. Journal of Financial Research, 18, 223-237.
Muradoglu, G., Taskin,F., & Bigan,I. (2000). Causality between stock returns and
macroeconomic variables in emerging markets.Russian & East European Finance
and Trade, 36, 33-53.

NUML Journal of Management & Technology
Vol: 8, No: 1. Janurary, 2013 ISSN 1997-4507
30
Nelson.C. (1976). Inflation and Rates on Return on Common Stock, Journal of Finance,
31 No.2, 471-487.
Mishra,P.K., Das,J.R., & Mishra,S.K. (2010). Gold Price Volatility and Stock Market
Returns in India. American Journal of Scientific Research, 9, 47-55.
Pilinkus, D. (2010). Macroeconomic indicators and their impact on stock market
performance in the short and long run: the case of the Baltic States, Technological
and economic development of Economy: Baltic Journal on Sustainability, 16, 291-
304.
NUML Journal of Management & Technology
Vol: 8, No: 1. Janurary, 2013 ISSN 1997-4507
31
Impact of Macroeconomic Variables on Stock Returns of Chemical Industry in
Pakistan
Sadaf Rahim, MS Scholar, Institute of Management Sciences, Peshawar
Abstract
This study investigates the impact of macroeconomic variables on stock returns at the
industry level. The macroeconomic variables used in this research are interest rate, GDP
growth rate, exchange rate, and inflation rate. This study uses the yearly data of
chemical industry listed in Karachi Stock Exchange. Yearly data has been collected from
2002 -2009. The effect of macroeconomic variables on stock returns is studied with the
help of multiple linear regression analysis. This research reveals a significant positive
relationship between stock returns and exchange rate. It has also been observed that
inflation negatively affects stock returns and the relationship is significant. On the other
hand, GDP positively affects stock returns of chemical industry but relationship is
insignificant. Similarly, it has been found that interest rate negatively affects stock
returns but the relationship does not appear to be significant.
Keywords: Stock returns, Macroeconomic variables, multiple linear regression model,
Karachi Stock Exchange.
Introduction
Finance theory demonstrates that investors put their money in banks or buy stocks to get
something extra for the money invested. Investor always desires for high returns and less
risk (Downs, 2005). Studies prove that high returns are attached with high risk. The
choice of investors regarding which security to invest in depends on their risk preference.
According to Keown, Martin, Petty and Scott (2005) there are two types of risk i.e.
systematic and unsystematic risk. According to CAPM theory, returns which investors
receive are only for the non-diversifiable risk involved. Chiou and Robert (2007) claims
that administration of risk is important for success of the business.
Stock market is a secondary market where investors buy and sell out securities. On the
basis of studies mentioned in the literature section, long list of factors that can affect
stock prices i.e. EPS, DPS, firm size, future plans, profitability, GDP, interest rate, CPI,
exchange rate, and Government regulations, etc are determined.
Previous studies mentioned in the literature show that fluctuations in macroeconomic
variables affect economy either directly or inversely. GDP, inflation, unemployment rate,
interest rate represents current and future performance of the economy. GDP increases
with the growth of the economy and vice versa. Inflation rises when economy is growing
due to increase in demand for goods and it is normally lower down in recession of the
country. But sometimes inflation continues to rise during recession due to growth of
money supply. High real interest rate negatively affects economic growth because it
increases borrowing cost and shrinks profits on investments. Rise in interest rate lower
borrowings and promote savings which leads to little investments and expenditure. Other
consequence of high interest rate is appreciation of the value of domestic currency which
leads to decrease in exports. GDP decreases, currency depreciates, and inflation goes up
in country facing recession. These and other macroeconomic variables affect companies
in negative manner because companies incur losses, incapable to cover their costs of
business due to decrease in sales, high inflation and money supply.
NUML Journal of Management & Technology
Vol: 8, No: 1. Janurary, 2013 ISSN 1997-4507
32
Literature Review
It has always been disputed that macroeconomic factors influence stock prices and in turn
stock return. Government policies (fiscal and monetary) have vast influencing power on
financial activities as well as on stock market. This encourages researchers to explore the
consequence of macroeconomic variables on stock returns.
Cheng (1995) find out that supply of money directly affects stock returns while interest
rate and returns on stocks have inverse relation in UK stock market. While, Hussain and
Tariq (1999) recommend that stock prices is affected by money supply (M2) in short and
long period of time. However, Mukherjee and Naka (1995) examined the relationship
through application of VECM on monthly data of Tokyo Stock Exchange and determined
that share prices react positively to change in exchange rate, industrial production (GDP)
and money supply whereas association between share prices and inflation and interest
rate is negative.
Another study conducted by Nydahl (1999) opines that exchange rate significantly affects
stock returns of 26% of the firms. He further found out that more sensitive to exchange
rate are those companies which are more dependent on outside country‟s transactions
while companies which are employing derivatives are nearly covered from risks of
exchange rate. However, Mansor (2000) explored associations between share prices and
exchange rate in Malaysia stock market. He discovers exchange rate is causal correlated
with share prices in the short run but no relationship in the long run. In another research,
conducted by Griffin and Stulz (2001) determined that there is insignificant economic
importance of variations in exchange rate on stock value of industries because firms use
different techniques to turn away this risk. However, Joseph (2002) studied the outcome
on chemical, Pharmaceuticals, engineering, and electrical industries‟ returns on stocks of
interest and exchange rate in UK. He concluded that interest rate deviations highly affect
firms as compared to exchange rate.
Maysami and Koh (2000) stated that inflation, rise in money supply, change in interest
rate have co-integrating relationship with fluctuations in Singapore stock exchange both
in short and long period of time. While, Ralph and Eriki (2001) determined that Inflation
affect stock prices negatively examined in Nigeria stock market utilized information of
18 years (1980-1997). They also stated that financial deregulations, GDP, interest rate,
and money stock strongly moves share prices. Kimyaz (2003) determined that firms
listed in Istanbul stock exchange are greatly sensitive to exchange rate fluctuations
especially financial, textile, chemical and machinery industries. He further found out that
companies which are highly dependent on exports and imports are extremely sensitive to
exchange rate. Similarly, Tsoukalas (2003) found out that in Cypriot stock market, stock
prices and chosen macroeconomic variables (CPI, GDP, supply of money, and Exchange
rate) are strongly related. But share prices are more volatile with respect to exchange rate
because its economy depends on tourism and foreign banking by analyze stock prices
from 1975 to 1998 through vector Autoregressive model (VAR). However, Maysami,
Howe and Hamzah (2004) used VECM and discover that returns on stock market of
Singapore and property index are affected by all selected macroeconomic variables.
Specifically, he finds that exchange rate, inflation and returns on stock market in
Singapore move in same direction and different sectors behave differently.
Nishat and Shaheen (2004) found that stock values are strongly affected by GDP in
positive direction but inflation significantly depresses prices of stock in Pakistan. Results
NUML Journal of Management & Technology
Vol: 8, No: 1. Janurary, 2013 ISSN 1997-4507
33
of Granger causality show that macroeconomic variables cause variations in stock prices.
Another research conducted by Merikas and Merika (2006) concluded through VAR
model, stock price reacts negatively to variations in real economic variables but stock
prices reacts negatively to inflation. However, Gan, Lee, Yung and Zhang (2006)
determined that movement in stock market and inflation, interest rate, money supply,
exchange rate and GDP in real terms and domestic retail oil prices are linked in New
Zealand. Sohail and Hussain (2009) uncover that in the long run price of stocks react
negatively to consumer price index, while it reacts positively to the rest of the
macroeconomic factors except three month T-bill rate to which it have insignificant
positive reaction.
Gunsel and Çukur (2007) explore the validity of arbitrage Pricing Theory (APT) in
London Stock Market and determine that impact of each factor is different in different
industry. Some industry stock prices are positively affected while others are negatively
affected by the same factor. For example: they discover that exchange rate and returns of
building materials and merchants moves in inverse direction while returns of chemical
industry reacts positively to exchange rate, others have diversified their risk. Hyde (2007)
utilizes data of four European countries and found that stock returns are changed with
variation in stock market in all the four countries. Exchange rate is related to stock
returns and at industry level, it is significant in all the selected European countries while
relation between instability in interest rate and stock returns is significant only in
Germany and France. Kandir (2008) disclose that interest rate, exchange rate (due to rise
in tourism services and overseas trade) and returns on stocks are correlated, whereas
significant inverse affiliation between inflation and portfolio return is only for three
portfolios. On the contrary, shares return and supply of money, oil prices and industrial
production is not significantly linked to each other.
Leon (2008) concluded that interest rate negatively move market return and insignificant
positive impact on conditional variance of returns. He further said that interest rate has
good predictive influence for return on stocks and it has a feeble projecting influence on
volatility. Similarly, Zafar, Urooj and Durrani (2008) took the stock returns data and 3-
month T-bill rate data beginning at January 2002-June 2006. His findings are similar to
N. dri. Konan Leon (2008) in case of impact of interest rate on market returns because
when there is rise in interest rate, people choose to invest in banks instead of stocks due
to which prices of stock decreases.
Vardar, Aksoy and Can (2008) used Generalized Autoregressive Conditional
Heteroscedasticity models (GARCH) and daily data for stock prices from 2001 to 2008.
Each sector behaves differently in response to change in interest and exchange rate
depending on the composition of each sector listed in Istanbul Stock Exchange. Exchange
rate and inflation rate is also negatively related to stock returns. While, Alam and
Salahuddin (2009) found effect of interest rate on share prices for both developed and
developing countries is mixed. They determined that interest rate and movement in
interest rate and stock prices is inversely related in all countries excluding Philippine.
Whereas, Aydemir and Demirhan (2009), Exchange rate affect stock prices. But the
extent and type of their relationship is different in each country. Exchange rate negatively
affects stock market indices in Turkey. On the other hand, Frimpong (2009) used co-
integration analysis for long term and vector error correction model for short term
relationship analysis. He discovered that in the long run stock cost (price) has a
NUML Journal of Management & Technology
Vol: 8, No: 1. Janurary, 2013 ISSN 1997-4507
34
significant negative response to the macroeconomic variables excluding exchange rate
which is positively related to stock returns. In the short run, he found out that all
macroeconomic variables affect GSE All-Share Index negatively except exchange rate
but impact of inflation and money supply is not significant.
Mohammad, Hussain and Ali (2009) unearthed that foreign exchange and stock prices
moves in same direction. Rise in industrial production leads to rise in stock prices.
Rahman and Jashim Uddin, (2009) apply Johansen technique and Granger causality
technique to study the correlation between exchange rate and prices of stocks of firms of
three countries stock exchange in South Asia and found no causal link. On the other
hand, Rahman, Sidek and Tafri (2009) found out that Malaysia stock market is negatively
related with exchange and interest rate and supply of money in the long run.
Significance of the Study
This research is conducted to increase awareness of investors and brokers and it also
endeavor to add to body of literature because little amount of research is focused
specifically on chemical industry. Chemical industry is very important for economic
development of the country because all manufacturers make use of chemicals in different
forms. It is used in almost every industry. Pakistan is agricultural country and agriculture
now a day is greatly reliant on fertilizers, pesticides, soil treatment chemicals,
insecticides, etc. to get better and large amount of products to fulfill demands of people
of the country. Israr khan, (2009) analyzed chemical industry globally and found out that
more than 70,000 products are manufactured in this industry internationally. Chemical
industry is key contributor to economic development of countries worldwide but its role
in Pakistan is insignificant due to shortage of investment.
Stock returns are affected by number of factors. Effects of macroeconomic variables lead
to market risk which has positive or negative effects on all industries but due to firm and
industrial factors the extent may be different. An awareness of the effect of fluctuations
in macroeconomic variables on returns of different industries stocks would be beneficial
for investors, finance practitioners, economists, and for academic purposes. By
discovering the sensitivity of returns of different industries to fluctuations in
macroeconomic variables, investment managers may be able to protect themselves from
losses due to fluctuations in macroeconomic variables. Investors will be unable to get
profit by investing in stocks if they do not know the effects of macroeconomic variables
on industry returns. For example if a company stock returns decreases due to rise in
interest rate, managers can hedge against the loss by shifting his investment to stock that
are less affected or not affected by interest rate fluctuations.
Theoretical Framework
On the basis of previous research, stock returns is selected as dependent variable and four
macroeconomic variables are selected as independent variables i.e. inflation rate,
exchange rate, interest rate and gross domestic product.
NUML Journal of Management & Technology
Vol: 8, No: 1. Janurary, 2013 ISSN 1997-4507
35
Methodology
This research is based on positivistic paradigm in which secondary data was analyzed.
The scope of this study is to deliver practical suggestion to investors and brokers of
Pakistan. Therefore the population of this research includes companies listed in Karachi
Stock Exchange. Due to importance and negligence of chemical industry by previous
researchers, it is selected. 25 companies are selected through simple random sampling
from chemical industry listed in Karachi Stock Exchange (KSE).
Secondary data of five variables employed in this research out of which independent are
four and dependent is one (stock returns) studying the behavior of companies from 2002-
2009. Data was gathered from website of Business recorder, a financial daily KSE
website, and economic survey of Pakistan (various issues), companies‟ website, and
online articles published in different journals.
Purpose of the Research
The purpose of this study is to examine the return on stocks of chemical industry of
Pakistan and their reaction to variations in exchange rate, inflation, interest rate, and GDP
(sources of risk) using companies listed in Karachi Stock Exchange (KSE) in a given
period i.e. 2002 to 2009. It is to help investors and brokers to get high profits and
minimize their risk.
Research Hypothesis
A large and growing body of literature has investigated the relationship of
macroeconomic variables and stock return by investigating different economies with
different statistical models. This research tested the following assumption about stock
return and macroeconomic variables.
H1: Stock returns of chemical industry are significantly positively affected by GDP,
interest rates, exchange rate, and inflation rate.
Model
A multiple regression will be used to analyze the impact of macroeconomic variables on
stock returns on chemical industry. After putting macroeconomic variables as
independent variables on the right side and stock returns on the left side as dependent
variables, the following model is developed;
SR = ɑ + β1 (IFR) + β2 (ITR) + β3 (GDP) + β4 (ER).
Each acronym represents different variable as;
SR= Stock Return
IFR = Inflation Rate
NUML Journal of Management & Technology
Vol: 8, No: 1. Janurary, 2013 ISSN 1997-4507
36
ITR = Interest Rate
GDP = Gross Domestic product
ER = Exchange Rate
b = slope of the variable
a = intercept
Dependent Variable
Return on stocks
Return can be obtained in different forms e.g. interest, profits or loss, net income, capital
gain or loss. Expected return is always positive but realized return can be positive,
negative or zero. Return can be calculated through different methods. But this study‟s
main emphasis is on holding period return of common stocks. Stock returns are most of
the time calculated for holding periods such as a month, a quarter or a year.
Return is usually expressed in the form of percentage. It can be calculated for a single
period (also called annual return) or for multiple periods (also called annualized return).
Return= (Capital Gain +D1)/P1
P2-P1= capital gain
P1= Purchase price of share
P2= current market value
D1 = Dividend (not reinvested)
Independent Variables
1. Gross Domestic Product
GDP is used to determine prices of goods and services manufactured in a year within a
country in market and it is exercised to evaluate economic development of a country.
GDP incorporate all Government and private expenditures, goods and services
manufactured exports less imports, and inflation to correctly represent the goods and
services of a nation (S.E. Smith, 2010). It is easy to evaluate economic health of a
country in a current year against previous year due to obvious calculation of GDP. But
there are some discrepancies in GDP calculation i.e. it doesn‟t consider value of
underground markets transactions (black and gray), quality and purpose of goods and
services for which it is produced ( they may be manufactured to recover the country from
NUML Journal of Management & Technology
Vol: 8, No: 1. Janurary, 2013 ISSN 1997-4507
37
disaster not for economic growth), does not allow for variation in prices and unpaid work
at home GDP incorporate earnings of the foreigner which they have earned domestically,
however it does not incorporate earning of the citizens that they have earned in foreign
countries (S.E. Smith, 2010).
Stock Returns and Output Growth
Industrial production and stock returns are positively related because both share prices
and dividends increase with rise in industrial production due to enhancement of revenue
of firms and industries (Nishat and Shaheen, 2004) and (Mohammad, et al., 2009).
2. Interest Rate
Interest rate is amount of extra money paid by borrower for the use of money (credit) of
someone else or return on deposited money received from someone else (bank) and it is
usually charged on yearly basis (Mike Moffat, 2010). It is expressed as percentage of the
principal on annual basis.
Stock Prices and Interest Rates
Stock prices react negatively to variation in interest rate. Stock prices fall due to two
reasons i.e. Production costs increases with rise in interest rate which leads to decrease
profits and dividends decreases and second reason is opportunity cost increases due to
rising interest rate and people will prefer to invest in banks. Stock prices are negatively
related to (RRR) required rate of return (Nishat and Shaheen, 2004) and (Mohammad, et
al., 2009).
3. Exchange Rate
Mike Moffat “Exchange rate is value of currency at which it can be converted to other
currency e.g. on 4th March, 2010, 85 Rupees is equivalent to one US $.
Exchange rate and stock returns
Due to increase in international trade, any change in exchange rate (depreciation of
currency) affects the profits of firms and in turns stock prices decreases (Günsel and
Çukur). Stock prices decrease due to decrease in the worth of currency due to expected
inflation (Ajayi and Mougoue, 1996). So it means that returns on stocks are positively
related to exchange rate of a country but some researcher think that stock prices is
negatively related to value of currency in terms of another currency because decrease in
worth of currency leads to increased exports which leads to increased profits (Murinde &
Poshakwale,2004).
4. Inflation
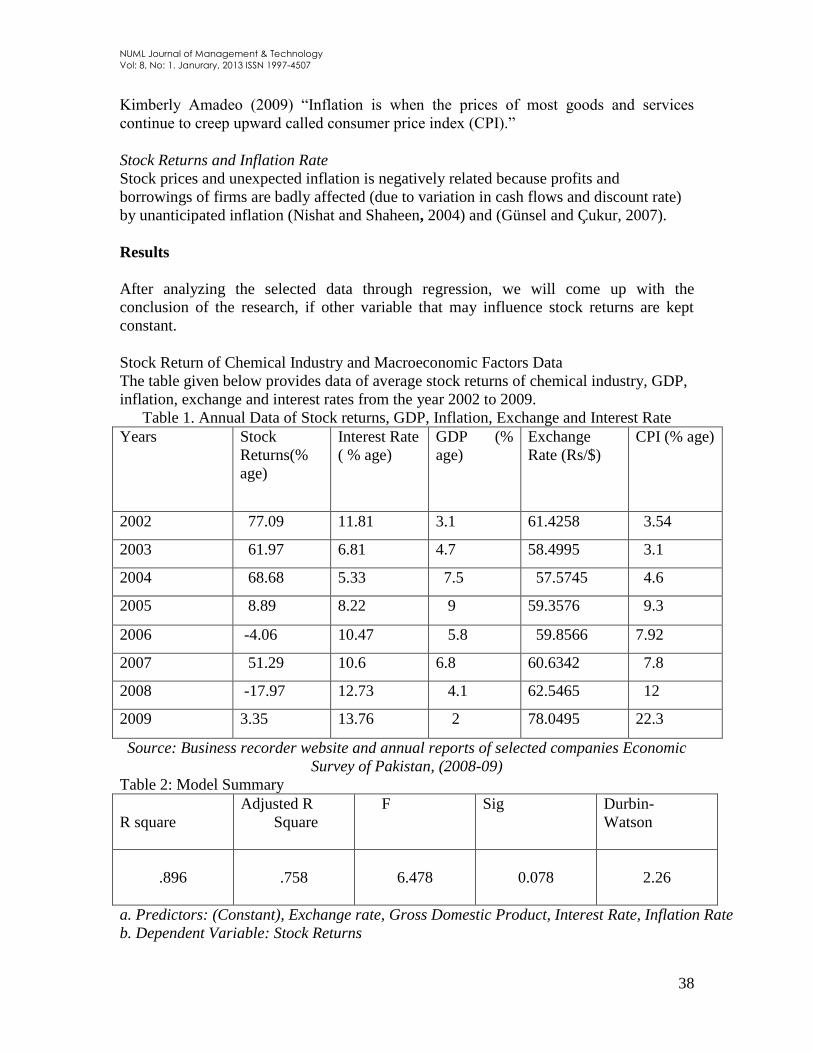
NUML Journal of Management & Technology
Vol: 8, No: 1. Janurary, 2013 ISSN 1997-4507
38
Kimberly Amadeo (2009) “Inflation is when the prices of most goods and services
continue to creep upward called consumer price index (CPI).”
Stock Returns and Inflation Rate
Stock prices and unexpected inflation is negatively related because profits and
borrowings of firms are badly affected (due to variation in cash flows and discount rate)
by unanticipated inflation (Nishat and Shaheen, 2004) and (Günsel and Çukur, 2007).
Results
After analyzing the selected data through regression, we will come up with the
conclusion of the research, if other variable that may influence stock returns are kept
constant.
Stock Return of Chemical Industry and Macroeconomic Factors Data
The table given below provides data of average stock returns of chemical industry, GDP,
inflation, exchange and interest rates from the year 2002 to 2009.
Table 1. Annual Data of Stock returns, GDP, Inflation, Exchange and Interest Rate
Years Stock
Returns(%
age)
Interest Rate
( % age)
GDP (%
age)
Exchange
Rate (Rs/$)
CPI (% age)
2002 77.09 11.81 3.1 61.4258 3.54
2003 61.97 6.81 4.7 58.4995 3.1
2004 68.68 5.33 7.5 57.5745 4.6
2005 8.89 8.22 9 59.3576 9.3
2006 -4.06 10.47 5.8 59.8566 7.92
2007 51.29 10.6 6.8 60.6342 7.8
2008 -17.97 12.73 4.1 62.5465 12
2009 3.35 13.76 2 78.0495 22.3
Source: Business recorder website and annual reports of selected companies Economic
Survey of Pakistan, (2008-09)
Table 2: Model Summary
R square
Adjusted R
Square
F Sig Durbin-
Watson
.896
.758
6.478
0.078
2.26
a. Predictors: (Constant), Exchange rate, Gross Domestic Product, Interest Rate, Inflation Rate
b. Dependent Variable: Stock Returns
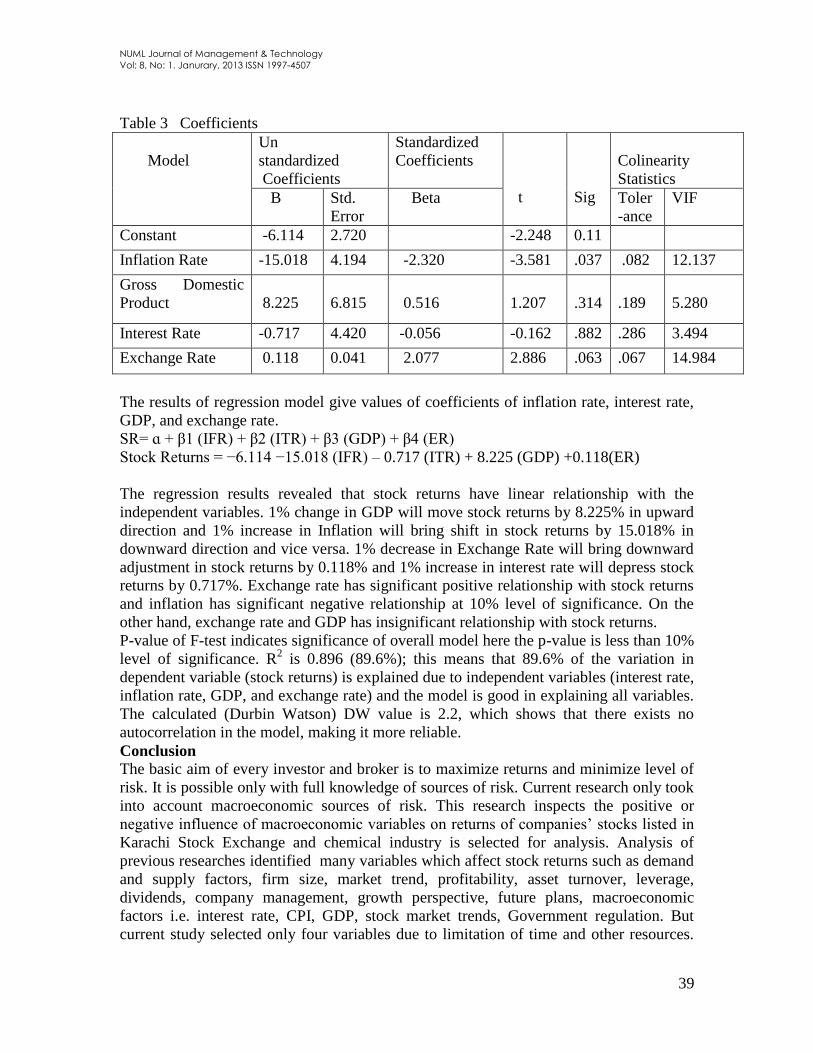
NUML Journal of Management & Technology
Vol: 8, No: 1. Janurary, 2013 ISSN 1997-4507
39
Table 3 Coefficients
Model
Un
standardized
Coefficients
Standardized
Coefficients
t
Sig
Colinearity
Statistics
B Std.
Error
Beta Toler
-ance
VIF
Constant -6.114 2.720 -2.248 0.11
Inflation Rate -15.018 4.194 -2.320 -3.581 .037 .082 12.137
Gross Domestic
Product
8.225
6.815
0.516
1.207
.314
.189
5.280
Interest Rate -0.717 4.420 -0.056 -0.162 .882 .286 3.494
Exchange Rate 0.118 0.041 2.077 2.886 .063 .067 14.984
The results of regression model give values of coefficients of inflation rate, interest rate,
GDP, and exchange rate.
SR= ɑ + β1 (IFR) + β2 (ITR) + β3 (GDP) + β4 (ER)
Stock Returns = −6.114 −15.018 (IFR) – 0.717 (ITR) + 8.225 (GDP) +0.118(ER)
The regression results revealed that stock returns have linear relationship with the
independent variables. 1% change in GDP will move stock returns by 8.225% in upward
direction and 1% increase in Inflation will bring shift in stock returns by 15.018% in
downward direction and vice versa. 1% decrease in Exchange Rate will bring downward
adjustment in stock returns by 0.118% and 1% increase in interest rate will depress stock
returns by 0.717%. Exchange rate has significant positive relationship with stock returns
and inflation has significant negative relationship at 10% level of significance. On the
other hand, exchange rate and GDP has insignificant relationship with stock returns.
P-value of F-test indicates significance of overall model here the p-value is less than 10%
level of significance. R2 is 0.896 (89.6%); this means that 89.6% of the variation in
dependent variable (stock returns) is explained due to independent variables (interest rate,
inflation rate, GDP, and exchange rate) and the model is good in explaining all variables.
The calculated (Durbin Watson) DW value is 2.2, which shows that there exists no
autocorrelation in the model, making it more reliable.
Conclusion
The basic aim of every investor and broker is to maximize returns and minimize level of
risk. It is possible only with full knowledge of sources of risk. Current research only took
into account macroeconomic sources of risk. This research inspects the positive or
negative influence of macroeconomic variables on returns of companies‟ stocks listed in
Karachi Stock Exchange and chemical industry is selected for analysis. Analysis of
previous researches identified many variables which affect stock returns such as demand
and supply factors, firm size, market trend, profitability, asset turnover, leverage,
dividends, company management, growth perspective, future plans, macroeconomic
factors i.e. interest rate, CPI, GDP, stock market trends, Government regulation. But
current study selected only four variables due to limitation of time and other resources.
NUML Journal of Management & Technology
Vol: 8, No: 1. Janurary, 2013 ISSN 1997-4507
40
The macroeconomic variables selected for this research are Inflation (CPI), Interest Rate,
Exchange Rate, and GDP. 25 companies from chemical sector are selected. Literature
show that interest rate and inflation rate negatively influence stock returns and GDP
positively influence stock returns but impact of exchange rate differs from country to
country. In some countries, the relationship is positive whereas in some countries the
relationship is negative.
At 10% level of significance, exchange rate significantly affects stock returns of chemical
industry in positive direction and Inflation significantly negatively influence stock
returns. Other variables relationship of interest rate and GDP with stock returns of
chemical industry is insignificant. After analyzing the findings of the regression, we
reached to the conclusion that “GDP and exchange rate positively affects stock returns
and Interest rate and inflation negatively affects stock returns” and the findings of this
research are analogous to previous researches.
This research covers eight years annual data of share prices and dividends for
investigation and chemical industry and provides base for future researchers to conduct
comparative study covering different companies and different sectors.
References
Ajayi, R.A., and Mougoue, M. (1996) On the dynamic relation between stock prices
and exchange rate. Journal of Financial Research, Vol 19, Issue 2, pp. 193-207.
Alam, M., and Salahuddin, G. (2009). Relationship between Interest Rate and Stock
Price: Empirical Evidence from Developed and Developing Countries.”
International Journal of Business and Management,(0nline), Vol 4, No.3, pp.
43-51. Available at:
www.ccsenet.org/journal/index.php/ijbm/article/view/217/177 (Accessed on
13/02/2010)
Cheng, A. C. S. (1995). The UK stock market and economic factors: a new approach.
Journal of Business Finance and Accounting, Vol 22, No. 1, pp. 129-142.
Chiou, C. & Su. K (2007). On the relation of systematic risk and accounting
variables. Managerial Finance, 33(8), 517-533.
Downs, T.W. (2005). Lesson about the structure of finance (second edition). Pearson
Oxford publishing.
Frimpong, J.M. (2009). Economic forces and the stock market in a developing
economy: Cointegration evidence from Ghana. European Journal of
Economics, Finance and Administrative Sciences,(Online) ISSN 1450-2887,
Issue 16. Available at: www.googlescholar.com
http://www.eurojournals.com/ejefas_16_11.pdf (Accessed on 24/06/09).
Gan, C., Lee, M., Yong, H., and Zhang, J. (2006). Macroeconomic variables and
stock market interactions: New Zealand evidence. Investment Management and
Financial Innovations, (Online) Vol 3, Issue 4, pp. 89-101. Available at:
www.businessperspectives.org/journals_free/imfi/2006_04_Gan.pdf (Accessed
on 23/06/09).
Griffin, J.M. and Stulz, R.M. (2001). International competition and exchange rate
shocks: A cross-country industry analysis of stock returns. The Review of
Financial Studies (Online), Vol 14, No.1, pp.215-241. Available at:
http://www.cob.ohio-state.edu/fin/journal/dice/papers/1998/98-7.pdf (Accessed
on 22/06/09).
NUML Journal of Management & Technology
Vol: 8, No: 1. Janurary, 2013 ISSN 1997-4507
41
Gunsel, N. and Cukur, S. (2007). The effects of macroeconomic factors on the
London stock returns: A Sectoral Approach. International Research Journal of
Finance and Economics,(Online) ISSN 1450-2887, Issue 10. Available at:
http://www.eurojournals.com/irjfe%2010%20nil.pdf (Accessed on 03/02/2010).
Husain, F. and Mahmood, T. (1999). Monetary expansion and stock returns in
Pakistan. The Pakistan Development Review, (Online) 38 (4) part 2, pp. 769-
776. Available at:
www.google.comhttp://mpra.ub.unimuenchen.de/5020/1/MPRA_paper_5020.p
df (Accessed on 07/02/2010).
Hyde, S. (2007). The response of industry stock returns to market, exchange rate and
interest rate risks. Manchester Business School Working Paper no. 491.
Available at: http://papers.ssrn.com/sol3/papers.cfm?abstract_id=970243
(Accessed on 15/02/2010)
Joseph, N. (2002). Modeling the impacts of interest rate and exchange rate changes
on UK stock returns. Derivatives Use, Trading & Regulation, 7, 306-323.
Kandir, S.Y. (2008). Macroeconomic variables, firm characteristics and stock returns:
Evidence from Turkey. International Research Journal of Finance and
Economics,(online) ISSN 1450-2887, Issue 16. Available at:
http://www.eurojournals.com/Pages%20from%20irjfe16serkan.pdf (Accessed
on 23/06/09).
Khan, I. (2009). Govt To Finalize Chemical Vision 2030. THE INTERNATIONAL
NEWS, (Online) 17 December. Available at: www.google.com
http://www.thenews.com.pk/daily_detail.asp?id=213712 (Accessed on
23/02/2010).
Kimyaz, H. (2003). Estimation of foreign exchange exposure: an emerging market
application. Journal of Multinational Financial Management, 13, 71-84.
Leon, N.K. (2008). The Effects of Interest Rates Volatility on Stock Returns and
Volatility: Evidence from Korea. International Research Journal of Finance
and Economics, (0nline) ISSN 1450-2887, Issue 14, 285-290. Available at:
http://www.eurojournals.com/irjfe%2014%20leon3.pdf (Accessed on
03/02/2010).
Mansor, H.I. (2000). Cointegration and Granger causality tests of stock price and
exchange rate interactions in Malaysia. ASEAN Economic Bulletin,(Online) 17,
pp. 36-47. Available at: http://www.allbusiness.com/government/670610-1.html
(Accessed on 04/02/2010).
Maysami, R. C., Koh, T. S. (2000). A Vector Error Correction Model of Singapore
Stock Market. International Review of Economic and Finance, Vol 9, Issue 1,
pp. 79-96.
Maysami, R.C., Howe, L.C., and Hamzah, M.A. (2004). Relationship between
Macroeconomic Variables and Stock Market Indices: Cointegration Evidence
from Stock Exchange of Singapore‟s all-S Sector Indices. Jurnal Pengurusan,
(Online) 24, pp. 47-77. Available at:
http://pkukmweb.ukm.my/~penerbit/jurnal_pdf/Jp24-03.pdf (Accessed on:
21/06/09).
Merikas, A.G., Merika, A. A., (2006). Stock Prices Response to Real Economic
Variables: The case of Germany. Managerial Finance, (Online), Vol 32, Issue
NUML Journal of Management & Technology
Vol: 8, No: 1. Janurary, 2013 ISSN 1997-4507
42
5, pp. 446 – 450. Available at:
http://www.emeraldinsight.com/Insight/viewContentItem.do?contentType=Arti
cle&contentId=1556544 (Accessed on 18/02/2010).
Mohammad, S.D., Husain, A., and Ali, A. (2009). Impact of Macroeconomics
Variables on Stock Prices: Empirical Evidence in Case of KSE. European
Journal of Scientific Research,(Online) ISSN 1450-216X, Vol.38, No.1, pp.96-
103. Available at: http://www.eurojournals.com/ejsr_38_1_10.pdf (Accessed on
06/02/2010).
Mukherjee, Tarun, K; Nake, Atsuyuki (1995). Dynamic relations between
macroeconomic variables and Japanese stock market: an application of vector
error correction model. The Journal of Financial Research, XVIII (2), pp. 223-
237.
Murinde, V., and Poshakwale, S. (2004). Exchange Rate and Stock Price Interaction
in European Emerging Financial Markets Before And After The Euro. Working
paper series prepared for EFMA Annual Meeting held in Basel, Switzerland.
Available at: http://papers.ssrn.com/sol3/papers.cfm?abstract_id=493543
(Accessed date: 4/02/2010).
Nishat, M. and Shaheen, R. (2004). Macroeconomic factors and Pakistani Equity
market. The Pakistan Development Review, (Online) Volume 43 (4), pp. 619-
637. Available at:
www.google.comhttp://www.pide.org.pk/pdf/psde20AGM/MACROECONOMI
C%20FACTORS%20AND%20PAKISTANI%20EQUITY%20MARKET.pdf
(Accessed on 15/02/2010).
Nydahl, S. (1999). Exchange rate exposure, foreign involvement and currency
hedging of firms: Some Swedish evidence. European Financial Management,
(Online), 5, pp. 241-257. Available at:
http://www.riksbank.com/upload/Dokument_riksbank/Kat_publicerat/Working
Papers/WP_81.pdf (Accessed on 23/02/2010).
Rahman, A.A., Sidek, N. Z., and Tafri, F.H. (2009). Macroeconomic determinants of
Malaysian stock market. African Journal of Business Management,(Online)
ISSN 1993-8233, Vol.3 (3), pp. 095-106. Available online:
www.googlescholar.comhttp://www.academicjournals.org/ajbm/PDF/pdf2009/
Mar/Rahman%20et%20al.pdf (Accessed on 23/06/09).
Rahman, L. and Uddin, J. (2009). Dynamic Relationship between Stock Prices and
Exchange Rates: Evidence from Three South Asian Countries.
INTERNATIONAL BUSINESS RESEARCH, (Online) Vol 2, No.2. Available at:
http://ccsenet.org/journal/index.php/ibr/article/viewFile/1143/1139 (Accessed
on 23/06/09).
Sohail, N., and Hussain, Z. (2009). Long-Run and Short-Run Relationship between
Macroeconomic Variables and Stock Prices in Pakistan: The Case of Lahore
Stock Exchange. Pakistan Economic and Social Review, (Online) Volume 47,
No. 2, pp. 183-198. Available at:
http://www.pu.edu.pk/economics/pesr/PDFFILES/3%20ZAKIR%20Macroecon
omic%20Variables%20and%20Stock%20Prices.pdf (Accessed date:
20/02/2010).
NUML Journal of Management & Technology
Vol: 8, No: 1. Janurary, 2013 ISSN 1997-4507
43
Tsoukalas, D. (2003). Macroeconomic Factors and Stock Prices in Emerging Cypriot
Equity Market. Managerial Finance, (online) Vol 29, Issue (4), pp. 87-
92.Available at:
www.emeraldinsight.com/Insight/ViewContentServlet?Filename=/.../pdf
(Accessed on 23/02/2010).
Ralph, U. I., and Eriki, P.O. (2001). Inflation and Stock Price Behavior: Evidence
from Nigerian Stock Market. Journal Of Financial Management And Analysis,
(14) (1), pp. 1-10. Available at: www.googlescholar.com
http://www.ensino.uevora.pt/tf/papers2004/udegbunam.pdf (Accessed on
27/02/2010).
Vardar, G., Aksoy, G., and Can, E. (2008). Effects of Interest and Exchange Rate on
Volatility and Return of Sector Price Indices at Istanbul Stock Exchange.
European Journal of Economics, Finance and Administrative Sciences,(Online)
ISSN 1450-2275, Issue 11, pp. 126-135. Available at:
www.googlescholar.comhttp://www.eurojournals.com/ejefas_11_12.pdf
(Accessed on 09/02/2010).
Zafar, N., Urooj, S.F., and Durrani, T.K. (2008). Interest Rate Volatility and Stock
Return and Volatility. European Journal of Economics, Finance and
Administrative Sciences,(Online) ISSN 1450-2887, Issue 14, pp.135-140.
Available at: http://www.eurojournals.com/ejefas_11_12.pdf (Accessed on
22/06/09)
NUML Journal of Management & Technology
Vol: 8, No: 1. Janurary, 2013 ISSN 1997-4507
44
ANALYZING THE DETERMINANTS OF HOUSEHOLD’S SAVING
BEHAVIOUR IN PAKISTAN
Abdul Mansoor, Lecturer, Economics.
IQRA National University, Peshawar, Pakistan.
Email: [email protected] phone: +923339426436
Supervised by Head Publishing DPT, IIIE, IIU Islamabad, Pakistan.
Abstract:
The paper attempts to investigate the determinants of savings by the households in the
emergent economies like Pakistan. For this rationale the data of five years (time series)
has been collected from different sources likes the Pakistan economic surveys, World
Bank and the annual reports of the State Bank of Pakistan. The major variables have
been selected due to the time constraint and secondary data is used. Simple OLS
regression technique is applied to check the significance of the data. Before running the
regression the data is checked for the stationarity and unit root by the econometric
package Eviews version 5.0. It is found that employment and income of the house holds
have the significant and positive relation on the saving behavior while the tax burden and
the inflation have the significant but negative relation with the savings. The coefficient of
correlation R2 is
found out to be 0.99 which shows that there is a very strong association
among the exogenous and indigenous variables. Keeping in view the key role of national
savings in the micro and macro economic stability government should give importance to
national savings for sustainable and debt free economy by considering the key variables
that are discussed in this paper.
Key Words: Life cycle hypothesis; household savings, savings behavior, national
savings; dependency ratio; family size
Copyright © 2012. NJMT
45
NUML Journal of Management & Technology
Vol: 8, No: 1. January, 2013 ISSN 1997-4507
1. Introduction
According to the economic theory regarding the household‟s saving is the disparity
between household's income and consumption expenditure. A household‟s income is the
earnings from all the possessions during a year. Sources of earnings can be wages from
Job, business turnover, corporate profit, interest earning, earning from farm production,
crop‟s earnings etc. Consumption can be stated as the total quantity of goods and services
that are consumed by the households during a year. In consumption there include the
expenses on food, garments, shelter, rent out, schooling, utility bills, wandering,
occasions, medical, recreation/entertainment and charity etc. Savings might be in the
shape of many other sources like real property, jewelry, bank balances, shares in the
capital markets, live stocks, agricultural fertile land etc.
The “Life Cycle Hypothesis” (LCH) is an economic concept analyzing individual
consumption patterns. The life-cycle hypothesis tells that people plan their consumption
expenditure and savings attitude over the long term period and intend to smooth out their
consumption patterns in the best possible way over their life span. The main hypothesis is
that people choose to maintain even life styles. This suggests that they usually don't save
a lot in one period to spend furiously in the other time period, but maintain their
consumption levels approximately the same in every time period, (Angus Deaton, Franco
Modigliani (2005).
Gersovitz (1988) supposed that in representing the progress of developing countries, the
mediator path is more meaningful than substitute steady states. According to Solow
(1956), suggested that savings persuade the growth of the state‟s economy as in economic
theory postulates that high saving rate lead to capital increase and thus economic
development.
1.1 Saving in Pakistan:
Pakistan is confronted with many serious problems in the present era. The image of the
Pakistan‟s economy is very much apparent from the figures of 1970's in which the
growth rate was 4.80% of the GDP at the mean time total national investment was 17.1%,
general savings was 11.2%, foreign savings were recorded to be 5.8% and domestic
savings were 7.4% percent of the gross domestic product (GDP). In 1980's expansion rate
of Pakistan was very high about 6.5% which was due to relatively more investment from
17.11% to 18.71% of the GDP, similarly comparatively high domestic savings from
11.20% to 14.80% of the GDP and very amusingly less foreign saving rate from 5.8% to
3.9% of the GDP. In the FY 2003, Pakistan had achieved a relatively high growth rate of
7.5% that shows an ideal situation of the country. In that year, foreign saving was
negative and very high domestic saving rate. But after the FY 2003, foreign saving has
happening rising while domestic savings were declined up to 9.91% of GDP and Pakistan
had achieve expansion rate of just 4.10%. That is comparatively low due to less domestic
savings. If we take a bird‟s eye view on the history of Pakistan we come to know that
household savings have played a vital role in capital accrual and attaining high growth. In
Pakistan there is a positive relation between the domestic savings and capital increase. If
one decrease another also decrease and vice-versa.
Many studies regarding Household‟s saving behavior have been carried out at large-scale
level in Pakistan having different demographic and socio-economic variables. The
Copyright © 2012. NJMT
46
NUML Journal of Management & Technology
Vol: 8, No: 1. January, 2013 ISSN 1997-4507
purpose of this study is to examine determinants of the household‟s savings at micro level
(Hafeez 2010).
Apart from the introduction, the remaining part of the research will be set as follows:
section II will describe review of the literature; in section III the data sources and
methodological issues will be discussed while results will be interpreted in section IV and
finally, results and policy recommendations will be stated in section V.
2. Literature Review
In recent years, only some studies have been presented covering the concept of saving
behavior in developing countries, mainly using the data of time series or panel while
some has used the cross- section data. Despite that this topic is necessary to be discussing
more at micro/macro level in order to reach to the solid policy framework in the future.
Keeping in sight the importance of households saving behavior in Pakistan; some
pragmatic evidences from Pakistan‟s Economy are review here.
Keynes (1940) acknowledged that savings depend upon disposable/throwaway income.
Duesenberry (1949), anticipated that saving is a function of the ratio of income to
previous lag year income. Friedman (1957), hypothesize that savings are depends upon
permanent income. Ando and Modigliani (1963) suggested that households did not in
their early age below 16 years and old age i.e. after 65 years, but they saved more in
between these two boundaries.
Davidson and Mackinnon (1983) stated two principle challenging theories of less hike in
prices that affect the saving rates in order to see whether one or both the theories could be
shown to be false. They used adjusted quarterly data in their research from 1st quarter of
fiscal year (FY) 1954 to 4th quarter of FY 1979 for Canada and United States of
America. They test their model by choosing the endogenous variables like individual
consumption, disposable income and individual savings. The study establishes a positive
association between interest rate and savings rates in Canada and US.
Bautista et al. (1990) explained the relative saving manners of rural-urban individuals in
Philippine. Family Income and Expenditure Survey for the FY 1985 was used as data
sources. Random sample of 16971 households were selected from twelve different areas
of Philippines. Their result postulated that income is positively affecting the savings, the
dependency ratio (DP) was found to be influence negatively the savings in almost all
regions and MPS was ranging from 0.334 - 0.775 based on Permanent Income hypothesis
model for the whole country of Philippines. It also recommended that the value of MPS
for permanent income was 0.22 to 0.55 and for temporary income the MPS was ranging
from 0.39 to 0.80.
Burney and Khan (1992) tested the impact of a variety of social, economic and
demographic related factors on individuals‟ savings in Pakistan. They used primary data
source of the household having the sample of 16580 individuals out of which 7443
belongs to urban while 9104 were rural dwellers. The data was gathered from the
Household Integrated Economic Survey (HIES) conducted in FYs of 1984 and 1985. The
Ordinary Least Square Methodology (OLS) was used for estimation because it gives
unbiased estimates. The study resulted that income, household head‟s earning status, type
of profession of household head and the age square of household‟s head were originate to
be positively correlated while the inverse of household‟s income, the dependency ratio,
educational qualification levels of household‟s head, employment level type and
secondary/spouse participation in earnings of the household and the age of individuals
Copyright © 2012. NJMT
47
NUML Journal of Management & Technology
Vol: 8, No: 1. January, 2013 ISSN 1997-4507
were originate to have negative correlation with households saving behavior in both city
and pastoral areas of Pakistan. It was also explained that the propensity to save was 0.221
in urban area while 0.37 in the rural area of Pakistan.
Nasir et al. (2004) checked the behavior of saving and investment in Pakistan using
suitable econometric and statistical technique and tried to generate a model on the
basis of basic theories of saving and investment. They gathered the data from 1971
till 2003, from the Economic Surveys of Pakistan. Ordinary Least square Method
(OLS) was the technique used for model estimation. The study resulted that
Government Expenditures, development rate of Gross Domestic Product of the
country and foreign cash inflow were optimistically and significantly affecting the
national savings.
Brata (1999) analyzed the saving behavior of rural industry workers households. The
author carried out his survey of about 93 households in FY 1996 from the district and
some areas under district of Bantul. Study stated that household disposable income,
education, gender and industry nature had a positive impact on individual savings. age,
age square (for testing long term relationship) and the function of industry in income has
no impact on household‟s saving behavior. It was stated that the government should build
up rural industries in order to increase savings and deliver glory for rural industries.
In my research I will used micro level data collected primarily through pre-tested
questionnaires from the respondents. In order to make my results more accurate a major
variables that might affect the saving behavior of people are included. In contrary to the
other studies I will carry out my research on district level.
3. Hypothesis:
Let assume that there is a household whose expectation is that he might live for next “t”
years from now and will have wealth of “w”. He also expects to earn income “y” until he
retires “r” years from now. In this situation the household resources over his lifetime
made up of his initial transfer of wealth “w’ and his lifetime earnings of “ry”. It has to be
added that the interest rate is assumed to be zero. If the interest rate is a positive figure
then it should be consider for the interest gathered upon savings of the households.
The consumer can disburse his lifetime resources during the remaining “t” years of his
life span. He divides (w + ry) equally among “t” years he consumes:
Con = (w+ry) / t …..(i)
Where “Con” denotes the consumption of the household
The consumption function of this person can be written as:
Con = 1/t. w + r /t .y ……….(ii)
It is considered that every individual plans his consumption expenditure in this way so
the total consumption function will be very similar to the individual function of the
households. Thus, the total consumption function of the economy will be given as
follows:
Copyright © 2012. NJMT
48
NUML Journal of Management & Technology
Vol: 8, No: 1. January, 2013 ISSN 1997-4507
Con = .w +.y ……. (iii)
Where = marginal propensity to save (MPC) of wealth, = MPC of income.
H1 = income and growth variables has a positive impact on savings.
H2 = life cycle hypothesis is well-matched with the saving behavior of the people in
Pakistan.
3.1 Data sources: The major source of data for this study is the Pakistan Integrated Household Survey
(PIHS). It has various issues but my study will be based on the particular year survey
mentioned earlier. It constitutes the total sample of five years time series data. The over
all sample is being divided between rural and urban households. To estimate the model
based on the econometric study the micro level data is taken from the official website of
Federal Bureau of Statistics (FBS), Islamabad, World Bank data series and the State
Bank of Pakistan annual reports. FBS is based on the data sets of the PIHS i.e. Pakistan
Integrated Household survey.
Copyright © 2012. NJMT
49
NUML Journal of Management & Technology
Vol: 8, No: 1. January, 2013 ISSN 1997-4507
3.2 The Model:
Following the previous researches on the saving behavior of people in Pakistan slight
changes in the variables is being made in order to bring about more significant results.
The variables that are taken as endogenous are per capita income of households (PI),
inflation rate (INF), employment status (ER), and tax burden (T) while savings of
households (HS) is taken as the exogenous variable in the model. The econometric model
will be use as following:
HS=0 + 1 PI + 2 INF + 3 ER + 4 T +
3.3 Theoretical explanation of the econometric variables:
a. Per capita income: Income is a very important factor in determining the saving behavior of any household.
Per capita income is the total income earned by the nation divided by the total population
of that nation. In economics more income refers to more saving, keeping other things
remain constant.
In the above equation (DR) is dependency ratio, (HS) is household size and (NE) is
number of earners in the family.
b. Employment:
This factor is also credit worthy in order to measuring the determinants of savings. The
impact of employment is ambiguous on the saving behavior of the households (Burney
and Khan, 1992). Self employed people save more in the countries like Indonesia and
India Snyder (1974). Employment factor is significant in rural population while it is
insignificant in urban population.
c. Inflation Rate:
Inflation means the persistent rise in the prices of the goods. In Pakistan the problem of
inflation is very severe. More inflation people will consume more because of the rise in
the prices of the good and decreasing in the money value, (Fisher Quantity Theory of
Money) and hence the saving will be less. So there is a negative relation between the
inflation and saving rate of the people.
d. Tax burden:
Taxes are the compulsory payments made towards the government in order to make the
expenditure of the government possible. There fore government imposes taxes on the
citizens in many shapes. In Pakistan the tax system is not so smooth so any tax
imposition creates problems for a common man. There is a negative relation between tax
and savings because new tax burden causes an extra expenditure for the household.
3.5 Some other theoretical factors of household’s savings:
a. Age of the household head:
Akhtar (1987) examined that there is a relation between the age of household head and
saving rates. As the age of household id going to increase the head tries to save more for
the old age expenses and keeping in view the expenditures of his children.
b. Dependency ratio:
There are two types of dependencies i.e. of young age and old age. In literature
dependency ratio is the rate of population aged below 14 to that of population aged above
65 years. Leff (1969) was a pioneer in developing negative relationships between the
saving rate and dependency ratio. According to Leff (1969) the children below 14 and
people above 65 years contribute nothing to the saving rather they just consume but his
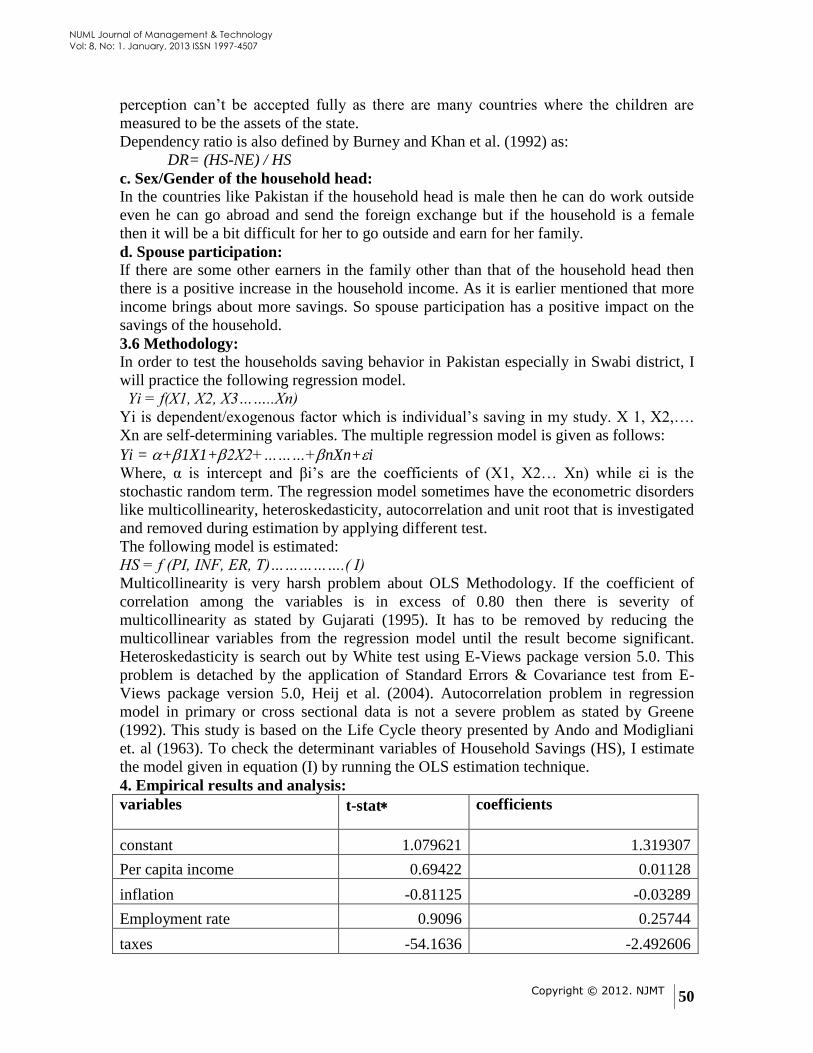
Copyright © 2012. NJMT
50
NUML Journal of Management & Technology
Vol: 8, No: 1. January, 2013 ISSN 1997-4507
perception can‟t be accepted fully as there are many countries where the children are
measured to be the assets of the state.
Dependency ratio is also defined by Burney and Khan et al. (1992) as:
DR= (HS-NE) / HS
c. Sex/Gender of the household head:
In the countries like Pakistan if the household head is male then he can do work outside
even he can go abroad and send the foreign exchange but if the household is a female
then it will be a bit difficult for her to go outside and earn for her family.
d. Spouse participation: If there are some other earners in the family other than that of the household head then
there is a positive increase in the household income. As it is earlier mentioned that more
income brings about more savings. So spouse participation has a positive impact on the
savings of the household.
3.6 Methodology:
In order to test the households saving behavior in Pakistan especially in Swabi district, I
will practice the following regression model.
Yi = f(X1, X2, X3……..Xn)
Yi is dependent/exogenous factor which is individual‟s saving in my study. X 1, X2,….
Xn are self-determining variables. The multiple regression model is given as follows:
Yi = +1X1+2X2+………+nXn+i Where, α is intercept and βi‟s are the coefficients of (X1, X2… Xn) while εi is the
stochastic random term. The regression model sometimes have the econometric disorders
like multicollinearity, heteroskedasticity, autocorrelation and unit root that is investigated
and removed during estimation by applying different test.
The following model is estimated:
HS = f (PI, INF, ER, T)…………….( I)
Multicollinearity is very harsh problem about OLS Methodology. If the coefficient of
correlation among the variables is in excess of 0.80 then there is severity of
multicollinearity as stated by Gujarati (1995). It has to be removed by reducing the
multicollinear variables from the regression model until the result become significant.
Heteroskedasticity is search out by White test using E-Views package version 5.0. This
problem is detached by the application of Standard Errors & Covariance test from E-
Views package version 5.0, Heij et al. (2004). Autocorrelation problem in regression
model in primary or cross sectional data is not a severe problem as stated by Greene
(1992). This study is based on the Life Cycle theory presented by Ando and Modigliani
et. al (1963). To check the determinant variables of Household Savings (HS), I estimate
the model given in equation (I) by running the OLS estimation technique.
4. Empirical results and analysis:
variables t-stat coefficients
constant 1.079621 1.319307
Per capita income 0.69422 0.01128
inflation -0.81125 -0.03289
Employment rate 0.9096 0.25744
taxes -54.1636 -2.492606
Copyright © 2012. NJMT
51
NUML Journal of Management & Technology
Vol: 8, No: 1. January, 2013 ISSN 1997-4507
R²= 0.999921
* All values are checked at 5% level of significance.
The result of OLS regression is highly significant as shown by the R². As stated earlier
that the coefficients of per capita income, and employment rates are significant and
positive. It means that there is a positive relation between the savings and per capita
income of a household. As the income of a person increases the saving rate also increases
and vise versa.
Employment rate also comes up with the positive sign. As the employment in the country
increases people finds more ways to earn and hence they can save as well. In Pakistan
unemployment is a main issue that creates hurdles in the way of savings.
Inflation is one of the major variables that bared the saving nature of the people. With the
increase in the rate of inflation people can‟t afford the commodities in lower prices. They
purchase the same quantity of a product in relatively high prices. Therefore due to the
lower purchasing power of money the people can‟t save up to the extent.
Paying tax is the compulsory duty of each and every citizen of the country but in Pakistan
the tax burden is far more than then a common man can bear. That is why as the tax
burden increases the saving rate will be declining.
Similarly some other theoretical variables like dependency ratio also have a negative
relation with that of saving nature of the households, Siddique (1993). Moreover Leff
(1969) was the first who detect the negative relation between savings and dependency
ratio.
Copyright © 2012. NJMT
52
NUML Journal of Management & Technology
Vol: 8, No: 1. January, 2013 ISSN 1997-4507
5. Conclusion and Recommendations:
Saving is the integral part of the household‟s income. In economic theory a part of
income that is not consumed is saved. The savings play an important role in the economic
prosperity and growth of a country. The growth in the economy requires capital so that it
may be invested and that capital will be provided by the savings. The nation in the long
run rely on domestic savings so our study has high lighten some key factors that highly
affect the saving behavior of the people especially in the developing country like
Pakistan. This paper analyzes the data during 2005-2010 and found that employment and
income has a positive relation with the savings of the people while tax burden and
unemployment reduces the savings of the people. As the savings are the vital factor in the
escalation of any economy, therefore some policy recommendations are given as follows:
1. Government should provide the basic elementary education to the rural residents
so that these people should find better job opportunities in the future.
2. Government should provide micro-level loans to the farmers and also to those
who want to start business of their own.
3. Scholarships should be provided to the students for achieving higher level
education.
4. Tax burden should be reducing by applying the progressive taxation system in the
country.
5. Different population control program should be launched and also the people
must be provided with the basic needs of life.
5.1 Scope & limitation of the study:
In developing countries the people are comparatively belongs to the middle class. Due to
this they are not succeeding in saving more. This study will be carried out considering the
secondary data in order to achieve the best significant result based on the core variables.
Due to the great disparity among the population, two main sectors of the house holds are
selected to test my hypothesis. Because of the almost same living status of the people
existing in the rural regions, this research will also justify that either the results postulated
by the HIES based on the population of developing countries has any similarity with this
study? Although there might be a little ambiguity in some socio-economic variables as
this survey is being conducted on the disperse population. Time constraint is the main
factor as more time is needed to inspect the variables in deep so that there is little chance
of error in the data. These type of uncertainties shall be considered as the limitation of
this research. Some other social and economic variables might be use to sort out more
precise results.
References
Akhtar Sajjad (1986). Saving income relationships in urban Pakistan: evidence from
HIES 1979. Pakistan journal of applied economics 5:1
Ando, Modigliani, F. (1963). The life Cycle hypothesis of saving: Aggregate
Implications and tests. American Economic Review, pg. 55-84.
Azhar, B. A. (1995). Rural Savings, Their Magnitude, Determinants, and
Mobilization. Pakistan Development Review, 34(4), pg. 779-788.
Copyright © 2012. NJMT
53
NUML Journal of Management & Technology
Vol: 8, No: 1. January, 2013 ISSN 1997-4507
Burney and Khan (1992). Socioeconomic Characteristics and Household savings: An
analysis of the Households‟ Saving behavior in Pakistan. Pakistan Development
Review, 31(1), pg: 31-48. Saving and Development. Handbook of development
economics. By Gersovitz, M. (1988). Edited by H. Cheneray and N.T.
Srinivasan. Amsterdam: Elsevier.
Gujarati, D. N. (1995). Basic Econometrics. McGraw Hill, Inc. 3rd Edition. New
York, USA.
Hafeez ur Rehman, Imran S. Chaudhry, M. Zahir Faridi, Farrukh Bashir (2011). A
Research Journal of South Asian Studies Vol. 26, No. 1, pp. 19-35.
Hasnain, M., Atiq, Z., Alam, S. and Butt. M. S. (2006). The impact of demography,
growth and public policy on household savings: A case study of Pakistan. Asia-
Pacific Development Journal, 13(2), pg: 57-71.
Mehboob Ahmad & Tasneem Asghar (2005). The Lahore Journal of Economics,
Vol.9, No.2
Pakistan Economic Survey, Ministry of Finance. Islamabad. (various issues)
Copyright © 2012. NJMT
54
NUML Journal of Management & Technology
Vol: 8, No: 1. January, 2013 ISSN 1997-4507
Impact of Optimism Bias on Investment Decisions in Mutual Funds
Aijaz M. Hashmi, Lecturer National University of Modern Languages, Islamabad
Mohammad Ilyas Khan, Mohammad Ali Jinnah University, Islamabad
Abstract
This research paper examined the impact of optimism biasness on investment in mutual
fund industry comprising a sample size of over 200 investors. The foremost intention of
the study was to explore optimistic level of mutual fund investors related to investment in
mutual funds. Optimism bias was measured by three identified facets as confidence,
hopefulness and over-estimation by using a questionnaire. This research makes use of
primary data, Regression and statistical tool was applied to analyze respondent’s
feedback. The study finds a significant relationship between investment decision in
mutual funds and optimism bias, indicating that optimism bias is one of a good predictor
of investment decision in mutual funds. The study can be useful for the investors and
mutual fund managers in devising policies and making decisions. The results suggested
that optimism bias had a positive impact on investment decision in mutual funds.
Keywords: Optimism, overconfidence, over-estimation, hopefulness, fund managers,
investment decisions in mutual fund.
Introduction This research study aims to evaluate the intensity of fund manager‟s optimism and their
hopefulness, confidence & overestimation are subject to return on investment and
whether or not they change from less contemporary investors in their prospective
susceptibilities. The level to which optimism and relevant character features such as
confidence, hopefulness and over-estimation might well impose any obligation on mutual
funds while determining their outcome. Reaction to such concerns may be significantly
useful in evaluating skills of the fund managers while drawing comparison in evaluation
to success controversy as well as the controversy on efficiency persistence.
A portfolio comprising of a share of resources obtained from multiple investors with sole
objective of investing in such as securities and secondary market instruments. Working
and performance of Mutual funds are managed by experts named as fund managers,
whose task is to identify the avenues in which to invest the money in order to get both
capital gain and principle stated amount at maturity. Portfolio of a mutual fund is
arranged and managed to be aligned with investment objectives as illustrated in the
research. Return on investment in mutual funds depends on expertise and skills of fund
manager. A fund manager ensures healthy returns by investing the pooled amount in
different stocks in order to diversify the risk factor. This helps a great deal in coping with
risks that are associated with financial markets. A mutual fund is managed by a fund
manager on whose discretion buying & selling of stocks takes place. Mutual funds are
mainly considered as open ended, close ended, funds of funds, capital protected funds etc
but here two main types will be elaborated that are traded extensively in financial
markets; Open ended mutual fund are issued by Asset management firms or companies in
primary market at Initial Public Offer and later on in secondary market, while they are
redeemed back to issuing firm in secondary market, while Close Ended Mutual Funds are
issued by Asset Management Firm at time of IPO in primary market while they are
redeemed in secondary market by investor to a buyer other than the issuing firm or
company.
Copyright © 2012. NJMT
55
NUML Journal of Management & Technology
Vol: 8, No: 1. January, 2013 ISSN 1997-4507
Fund Managers of mutual fund over forecasts over estimate the earnings and profitability
of investment in mutual fund due to the optimism bias. Fund managers of Mutual fund
over predict and over calculate the income and success of investment in Mutual fund and
due to the positive outlook tendency the mutual fund may under or over perform in the
market.
Optimism refers to a phenomenon of forecasting expected returns both by investors or
fund managers while dealing in a risk prone market, dynamic and vulnerable markets
completely or partially bypassing the probability of low returns or complete loss.
Discussing biasness in context of mutual fund industry refers to expectations that
investors associate with investments in mutual fund industry ignoring the reality of no
gains or loss of principle amount invested. As mentioned earlier the investment or returns
of mutual funds depends greatly on expertise of a fund manager. Most of the investors
and fund managers are very much biased towards the expected return or risks that are
associated with investments they have undergone. The term optimism mean disposition
or tendency to look on the more favorable side of events or conditions and to accept the
most favorable outcomes or to believe that the good ultimately predominate over evil in
the word and goodness pervades reality.
Optimism is closely related to the variance of prediction, for it shows people appetite to
start overestimating the positives likely to happen to them rather than bad experiences.
This variance of prediction can also be referred as valence as it refers to positivity and
negativity of attitude or behavior of an individual. The net result that is achieved as a
result of valence effects is referred to as thinking as per wishes of an individual. But, in
certain situations, the perception about positive outcome may lead to a bias that may
ultimately vary the outcome of events in one way or other. Lot or research has been done
in this regard that has produced various explanations for these effects. In most of the
cases these aspects have been manipulated in the context of motivational biases, which is
an argument that tend the individuals to be motivated in order to hold unrealized positive
self-perceptions with an aim to improve their own happiness level and well-being. There
may be some assumptions, likely to take place in order to maximize their happiness.
Likewise there have been another theory put forward by group of cognitive thinkers who
claims that people most of the times want to succeed, and more often want to be credited
with responsibility for their expected outcomes. In view of above said discussion
investors tend to be vulnerable over optimism bias.
Literature Review
Psychological biases are very important factors which affect the investor‟s behavior and
stock prices. They may or may not participate in the investment due to their past
experiences. Muhammad (2011) has also discussed factors related to psychological biases
effecting investor behavior and stock prices. The investors make their decisions on the
basis of their participation in asset and security categories, investors individual loss
adverse behavior, past performances as indicator of future performance, investors trading,
status quo, efficient portfolios, investor‟s behavior and influence due to historical high or
low trading stocks.
Investors may have perception that they can eliminate the risk and can safe their interests
due to investment in mutual fund. There are lots of factors that may influence the
investors to release the fund or keep the fund with them. Therefore, they used to switch
towards this type of investment. There are enough evidences that show the investor‟s
Copyright © 2012. NJMT
56
NUML Journal of Management & Technology
Vol: 8, No: 1. January, 2013 ISSN 1997-4507
ability to expose them to risk, financial markets knowledge, sentiments and credibility of
market that influence the willingness of investor for releasing funds Nicolas and Holger
(2011) has highlight the factors that influence the investors to start investment in mutual
funds.
Fund managers play a vital role in the decisions of investors. They are the basic source of
earning for them. Fund managers lead the investors and force them to invest in mutual
fund industry which leads them towards yielding profitability. Funds managers may
forecast the trend of over and undervalued stocks adversely. Malcolm, Lubomir,
Wachter, and Jeffrey (2009), based their research on the assumption that the stocks which
are selected by mutual fund managers usually outperforms the stocks which they dispose
or sell off.
In contrast it is another opinion that in most of the cases the fund managers may invest in
the underperforming mutual fund due to the lack of experience and information and
skills. Malevergne and Sornette (2009) also discussed why investors are purchasing
underperforming mutual funds that investors lack of expertise forced them to rely
investing in underperforming mutual funds enabling the fund managers to charge them a
certain fee. Simona and Massimo in 2007 have discussed the trend followed by
investment banks that tend to force the analysts to develop biased reports to win hearts of
potential investors and enhance credit ratings. They have studied recommendations of
several such institutes spanning over a time period from 1995-2003 indicating that fund
managers personal likings or affiliation with a certain mutual fund may also affects the
ratings. Most of the times analysts prefer to opt for favorable stocks which are further
dependent on other associated mutual funds which in turn affect lot of factors comprising
of the investment banking affiliation. It was further concluded, that greater the size of
portfolio, the risk gets diversified therefore ratings gets more optimistic in comparison to
analysis conducted by unaffiliated analysts. As mutual have a lot of investor‟s money and
stakes therefore it further decreases the optimism shown by the analysts. Nevertheless,
1999- 2001, analysts reported that the recommendations of analysts to select a certain
portfolio always involves optimism particularly when they are referring stocks amongst a
pool of affiliated mutual funds.
Overconfidence of fund managers and investment in mutual fund are closely interrelated.
It affects the skills of fund managers which may influence the decisions of inventors in
the portfolio which is associated with fund manager‟s overconfidence. Investigated by
Arman (2011), and conclude that the impact of overconfidence and behavior that have a
bearing on fund manager skills against the back drop of returns and risk associated with
investing in a certain portfolio. They have further analyzed this phenomenon and derived
the relationship between investment and fund managers overconfidence.
Investor‟s optimism towards financial markets and their belief in economy may be
influenced by political climate. So, it creates behavioral bias among the investors and
they improve their portfolio performance with a lot of faith and belief but they face risk
due to political conditions. Yosef, Claremont, Kumar and Jeremy (2010), have proved
that when opposition party is in power, investors undertake terrible decisions exhibit a lot
of biasness and select funds with greater expense ratios.
The investors do not pay heed to reporter‟s information or analysis but they for sure take
fund managers report seriously they consider the report of fund managers more authentic
and reliable as compare to others report including newspapers and magazines. Gideon
Copyright © 2012. NJMT
57
NUML Journal of Management & Technology
Vol: 8, No: 1. January, 2013 ISSN 1997-4507
and Ronnie (2010) have differentiated equity hedge funds into three sources like
newspapers, magazines and corporate communication. They observed that corporate
covered funds out perform while general covered funds underperformed based on
assumption that fund managers present conservative forecasts while reports present
lenient views.
The decisions of mutual fund managers are often biased and vulnerable to the behavior
and nature of investors. A study carried by Arman (2011) revealed the phenomenon
which manager often faces in decisions which are biased in nature. It partially depends on
fund managers skills, their luck as well as debate on performance. Their findings proved
that fund manager‟s overconfidence diminishes mutual fund returns and are often biased
to behavioral biases and their differences proved after annual report publications. This
fund difference is stronger amongst the growth oriented funds rather than established
funds in the industry.
Business relations among mutual funds and brokerage funds influenced analyst
recommendations. They used a unique data set to disclose brokerage firms and their
income derived from share holders and investors. Michael, Lin, Liu and Xuan (2011), the
analyst keeps stock recommendations which are not only subject to investor‟s sentiments
but also to equally healthy ratings from analysts that are working in financial markets.
The causes of financial crisis on mutual fund industry, and over the world mutual fund
industry was performing exceptional with consistent fruitful returns after 2000 but ever
since the financial crisis deepened it got a toll on mutual funds and with an expected yield
30 percent plunged to such a depth that even a break even seemed to be a distant
possibility. James and John (2008) have further drawn a line that started that caused a
down ward slide in this industry. As in many instances a lot of investors abuse the fund
industry through late and frequent trading thus damaging the true essence of mutual fund
industry. This further led to competition even inside the industry, within the financial
services and revenue sharing, did not led to a conclusive evidence of mutual funds
performing in a better way. As understood in such an industry arbitrage does not exist but
inferior products do exist with a clear sign of prosperity. All this discussion led to
prospects of index funds and the role they play on sentiments related to mutual fund
industry.
In most of cases both close ended mutual funds and stocks tend to be held by individual
investors who pool their amount in a hope to get greater returns. The fluctuations in
returns of mutual funds which were normally based on individual investor sentiments
especially in closed ended mutual fund industry may be vulnerable. Charles, Shleifer, and
Richard (1991) exhibit a trend in which the funds which are performing long ago in
market are being at a premium and sometimes on a very little discount amount which are
interrelated with prices of other securities as well. It is supported by these predictions.
The sell-side analysts have to suffer great competition and pressure from the hedge fund
clients who tend to issue instructions as when to buy or at least sell their funds on the
recommendations of fund managers. Sung and Melvyn (2010) investigates that the hedge
funds take advantage of fluctuating reports by offloading their stock holdings. The
researchers in this paper have found out similar conclusions with analyst upgrades or
downgrades recommendations along with 12 month price targets. The analysts are
somehow driven by brokerage commissions and to create or develop optimistic reports
for stocks being held by high dollar turnover hedge funds over a certain period of fund
Copyright © 2012. NJMT
58
NUML Journal of Management & Technology
Vol: 8, No: 1. January, 2013 ISSN 1997-4507
life. The research also suggest that in recent times the Wall Street research department
have been forced to shed of investment bank revenues and are contend with new fund
related conflicts of interests.
Financial markets are based on reforms aimed at attracting the foreign investors.
Likewise it is an obvious reality that whenever the markets are integrated the funds need
to be assigned or traded in national stock markets in close relation to their market
capitalization. Previously it has also been concluded that lack of diversification will lead
to lankness on part of international investors. Senda (2007), excessively under weighting
of foreign assets is directly termed as equity home bias puzzle. The barriers to capital
movements and subsequently information asymmetries along with behavioral factors
have been studied and concluded that a much lucrative option for the investors is foreign
market where most of people known to him have already invest thus they have studied
the impact of social interaction on international mutual funds investment in the longer
run.
The effect of optimistically biased future totally neglected the time value. Such an
approach is adopted by individuals who focus on orientation. The prediction of future
optimism is not a valid term for focused individuals. Lee and Yoon (2010), it has been
further elaborated that only those individuals show sign optimism who are presented with
an option with a decreased performance as in the past. Such effects are considered into
realism by individuals to certain level of elaboration about potential outcomes of a
contract.
The researchers have used sum of deviations from a certain bench mark that has been
established in backdrop of a proxy serving as rage the fund managers boost up the
confidence to such an extent and degree that they have to decrease it once disconfirming
public signals. There are lots of dynamics of investors who suffers from the phenomenon
of over confidence. Darwin and Dong (2010), this trend or assumption further leads to
poor future underperformance mostly motivated by fund manager‟s choice of portfolios.
The underperformance results from a certain biased attribution due to fund managers
thinking, smartness in stock selection which others are less familiar or unknown.
The mutual fund managers forecast openly or publicly the earnings and in most cases
they over estimate which are then later disclosed at annual earnings announcement. This
is also referred to as untruthful reporting biased and bias somewhat cognitively. Willis
(1998), such explanations draw a sharp contrast about the timings of changes that prevail
between the forecasts alongside annual earnings duly announced. Findings of this paper
are more consistent with optimism explanation; such findings are in matching with
market manipulation resulting from this biasness. This phenomenon was not ideal to get
rid of biasness related to decision making by managers to report a prediction in order to
shrug off this perception that fund managers forecasts are biased.
There exists a close relationship between market and sustainability that is dependent on
this particular design and it defines some of fundamental environmental issues. A lot of
research has been carried out in this aspect that reveals that investors rate the
demographics very high. Researcher has mentioned several issues along with biases
dependent on cognition and the obstacles associated with investor perception. Sebastian
Munteanu and Romania in 2007 concluded in the study that a multiple perception level
and breakdown of profession priorities along with the farming effect tends to offer
investor several choices. Further discussion concluded that when the optimism is lacking
Copyright © 2012. NJMT
59
NUML Journal of Management & Technology
Vol: 8, No: 1. January, 2013 ISSN 1997-4507
the subsequent level of biasness can no more be conclusive, but when brings halo effect
into consideration it becomes much clear. This study further explains some of factors
that not only influences thinking of the investors with an agriculture background but also
intends to acquire long term persistence and sustainability among the fund managers in
order to develop financial instruments.
The difference of opinions and short selling trend in case of mutual funds may cause
differences in opinions and panic or intentional short selling may result in asset over
pricing. This formula is also applicable to criteria required to determine prices of mutual
fund, which ultimately cause short selling of mutual funds. Cheng, Massimo and Zhang
(2004), further concluded that investors often make up opinions about the skills of fund
manager and in order to utilize services of fund manager they have to pay a certain fee
for this service that fund manager offers while buying or selling of mutual funds. Further
analysis of Berk & Green model helps to elaborate some common observations occurring
and associated problems that are prevailing in mutual fund industry involving those funds
that are not fetching any healthy returns along with price difference between actual fee
and estimated fee.
The returns that are based on risk level are defined in light of agency models by defining
beta and thus they are not dependent on Capital Asset Pricing model standards that
maintains price as a set standard to determine the performance of mutual fund. If we
analyze the fund industry we will come to the conclusion that some mutual funds tend to
consistently fetch healthy returns for quite some time keeping in mind market tends.
Jason (2004) discussed that investors have to keep a close look at certain funds by
dividing fund industry in several sections. Further they calculate the aggregate of funds
that translates the inflows from investing into mutual funds. As those funds that bear a
high risk value provides managers with an opportunity to modify their portfolios
venturing into more diverse ventures thus minimizing the beta risk periodic payments in
relation to a greater value of beta. The aggregate of stocks performance is dependent on
equity funds as it is always rated high both in terms of risk as well returns. High beta
value in comparison to the cash trapped by investing in relative stocks is always in sharp
comparison to overall stock market that is statistically not significant in terms of mutual
fund industry.
The dynamics of investors over confidence can be calculated by using the values of
absolute deviations while observing a particular bench mark index. Shares that actively
take part in market are used as a dummy to calculate confidence showing a certain trend
shown by the mutual fund managers by boosting their confidence to such an extent that
seconds public signals rather than to further diminish it. Choi and Dong (2010),
highlighted the performance of fund managers who lack in experience and are more
vulnerable to risk as well as sentiments of investors. Poor performance of funds may
sometime be expressed to this factor as well which is based on motivation provided by
managers who have limited choices to choose from. This paper further discusses that
underperformance that is a result of biasness can be contributed to manager‟s lack of
experience as they stick to a particular industry to invest in their stocks rather than
studying the industrial trends and overall trend.
The behavior of investors is attributed either to redemption fee that is a certain lesser than
then purchasing price. Sometimes it is also, referred to the performance of funds during
economic crisis. But Berk and Green (2004) totally disagreeing with this concept
Copyright © 2012. NJMT
60
NUML Journal of Management & Technology
Vol: 8, No: 1. January, 2013 ISSN 1997-4507
suggested that investor‟s personal attitude and his irregular behavior plays a major role to
explain the issues associated with buying and redemption of mutual funds. This does not
depends on fund fee while truly competitive markets plays a pivotal role considering
mutual fund industry and that is still an unresolved mystery in mutual fund industry
amongst the analysts who conduct qualitative analysis. Several studies such as Coates
and Hubbard (2007) and Grinblatt, Ikheimo, and Keloharju (2008) argue competition do
exist in mutual fund industry moreover charges charged by fund managers are always at
par with prevailing market. Importantly this study reveled that keeping in mind returns on
investment in mutual funds, risk aversion by opting to select a diverse portfolio and
charges incurred by almost all US domestic equity, have always been in market
previously or at present have some additional costs associated with them during the
previous some years. Prior to this these investment in mutual funds renders a competitive
handicap to index funds priced very less. This study also supports findings of School
1982, Freeman 2007, Freeman and Brown 2001 etc. that leads to a conclusion that fund
manager‟s charge relatively more than market competitive prices as recommended by
them. Therefore there is a need for a sterner competition and regulations in mutual funds
industry. A comprehensive research was carried by Palmiter and Taha (2008) that further
explored the studies published by the SEC. It basically depends on a common human
deficiency of unsophisticated response of investors, while the SEC's regulations bound
investors to reveal information is not well defined. This mainly is due to lack of financial
knowledge.
Most of the investors are biased when they are dealing with their domestic markets.
Market exposure, market knowledge and adequate opportunity to understand market
dynamics is also an important issue. Barber, Odean, and Zheng (2005) and Choi,
Laibson, and Madrian (2008) provide evidences that front end load and back end load are
the two important aspects of dealing with buying and selling of stocks that attracts some
seriousness as far as investor is concerned. But majority of investors are least bothered
about ratios associated with mutual funds. Capon, Fitzsimons, and Prince (1996) and
Alexander, Jones, and Nigro (1998) demonstrated in their respective studies that most
common and basic terminologies associated with trading of mutual funds are unknown to
investors, including charges they have to pay to fund managers. These facts clearly
indicate deviation from irrationality which is very much in line with the focus on
investor's expertise of industry. Funds markets are another important aspect investors
lacking in that mostly leads them into self defined benchmarks such as returns on
deposits in banks or other such investment schemes.
Optimism bias is mostly affected by the practices performed in industry that promotes the
trading of fund shares. Since 1980, marketing and distribution fees have been charged by
investors which previously were not directly deducted from returns of investment.
Khorana and Servaes (2004) and Barber, Odean, and Zheng (2005) have identified
another important impact of this fee on funds as it improves performance of mutual
funds. Investment in equity fundseems to be a focus end to for all subsequent mutual
funds as they tend to take advantage keeping in mind the international rules associated
with diversification. This phenomenon is most of the times associated with non
centralized information among local and foreign investments. Murray (1991) explains
several strategies that are used to enhance trading of mutual funds. When comparison is
drawn across borders there is a certain variation in fees paid to fund managers across
Copyright © 2012. NJMT
61
NUML Journal of Management & Technology
Vol: 8, No: 1. January, 2013 ISSN 1997-4507
borders. Elton, Gruber, and Das (1993), Gruber (1996) and Chevalier and Ellison (2002)
showed that funds which high expense ratios from investors do not offer healthy returns
mostly. This may be interpreted as biasness shown in tandem to pool or portfolios of
investors who are least bothered about fund performance.
Sometime there may be funds that charge lower fees in order to compete for and to attract
more investors. This may be based on the theory of optimal contracts between managers
and investors, by considering a variety of factors and mechanisms to explain fee charges
and structure of portfolio services. Das and Sundaramb (2002) made a comparison
amongst some symmetric and asymmetric models by selecting a group of investors.
Stracca (2006) provides an excellent insight on this topic. The relationship between a
manager and an investor formulates a scenario associated with example of the general
principal agent problem. Following the work of Ross (1973) and Holmstrom (1979),
numerous studies have applied the principal-agent model to various scenarios of
economic exchanges between among investors and fund manager. To cut the discussion
short an investor hires services of a fund manager while the structure of payment in case
of mutual fund is the tool that is used in order to safeguard their interest, while
maintaining the existing practices taking part in economic market. Mostly it is assumed
that managers who have complete access to an investor's private information, whereas
investors have no access to a manager's expertise level or his past performance related to
financial markets. Information about fund manager is mostly revealed in fund manager
monthly reports at end of a certain quarter. Optimal portfolio is defined as a mixture of
the mutual fund investment and of other vehicles that investor himself has avoided to
undertake. Sometime the fund manager utilizes the level of understanding of the
investor's decision by utilizing the private sources to know the fee level that maximizes
expected utility. The problems that is associated with additional informational
disadvantage of the investor.
Provision of a common formula in order to conclude a fund's performance, by adjusting
risk associated with fees payable to fund manager for his services. In sharp contrast to
this, results do not require any restriction on in terms of fund's return distribution and the
investor's utility function as long as it is a variant and converging. Over-optimism of
investors translates into decisions which are made on the basis of limited or misguided
information, ultimately leading to investments in funds that are not performing at par
with equity funds. Furthermore, it is shown that investor's over-optimism can be
explained either by the efforts shown by the persons working in sales department or by
the investor's inappropriate selection of benchmarks, or by a combination of both,
possibly due to the lack of sufficient investment knowledge. An innovation in optimism
is also one of the important factors that investors keep in mind while undertaking any
decision. Most of the investors undertake future investment decisions based mostly on
specific information about asset as well as their information about any future economic
growth. Patel studied in 2010 and he investigates the role of investor‟s optimism about
their investment decisions based on future economic growth. The investor investment
decisions are based on economic optimism and macro economic conditions. Investors not
only consider futuristic economic optimism in their decisions but also put greater weight
on it when fund specific information seems uninformative and less valuable.
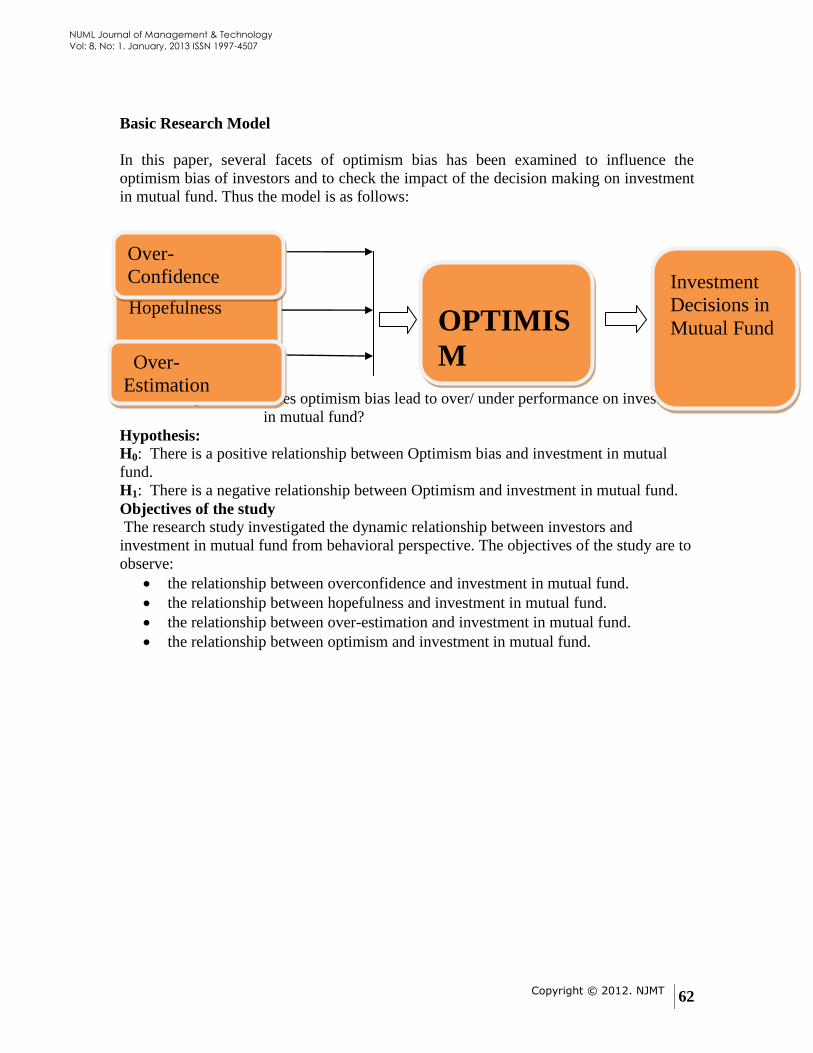
Copyright © 2012. NJMT
62
NUML Journal of Management & Technology
Vol: 8, No: 1. January, 2013 ISSN 1997-4507
Basic Research Model
In this paper, several facets of optimism bias has been examined to influence the
optimism bias of investors and to check the impact of the decision making on investment
in mutual fund. Thus the model is as follows:
Research Question: Does optimism bias lead to over/ under performance on investment
in mutual fund?
Hypothesis:
H0: There is a positive relationship between Optimism bias and investment in mutual
fund.
H1: There is a negative relationship between Optimism and investment in mutual fund.
Objectives of the study
The research study investigated the dynamic relationship between investors and
investment in mutual fund from behavioral perspective. The objectives of the study are to
observe:
the relationship between overconfidence and investment in mutual fund.
the relationship between hopefulness and investment in mutual fund.
the relationship between over-estimation and investment in mutual fund.
the relationship between optimism and investment in mutual fund.
Hopefulness
Over-
Confidence
OPTIMIS
M
Investment
Decisions in
Mutual Fund
Over-
Estimation
Copyright © 2012. NJMT
63
NUML Journal of Management & Technology
Vol: 8, No: 1. January, 2013 ISSN 1997-4507
Significant of the Study
The significant of the study is to highlight the behavior and attitude of fund managers in
the context of overconfidence, over-estimation and hopefulness. Fund managers are
taking decisions on the behalf of the investors while investing in mutual fund and
creating portfolio. Optimism bias is one of the important biases from the other factors of
human behavior which can predict the direction in decision undertaken and in the
selection of portfolio. All this will play a significant role for both the fund manager and
investor simultaneously. The study will help the fund managers while devising policies
regarding the decisions in mutual fund investment.
Theoretical Background of the Study
In generic terms this paper intends to explore the level of mutual fund investors which is
at par to optimism biases and with an insight as to what extent it affects their investment
mindset in a particular way. Specifically, optimism and the behavior associated with e.g.
overconfidence, hopefulness, over-estimation and self-serving attribution bias may lead
to any compulsion on the performance of fund which is of interest. The solution to these
questions is of utmost importance and is informative to enhance the investor‟s skill
minimizing the luck factor along with debate as well as the debate on consistency of
performance. The questionnaire is motivated by the large areas of research, including the
dynamic relationship between investors expressed optimism of with mutual fund and
studies of professional investor psychology. This factor has been discussed in depth in the
psychology literature. Odean, (2001) explained that investors wrongly contribute their
healthy returns and loss to circumstances, this causes a sense of overconfidence in their
approach. Overestimation is also sometime referred to as of one‟s investment skill that
may result in diversified trading with a greater portfolio size, as documented in this
research paper, despite the extensive literature examining optimism and overconfidence
among individual investors, executives, traders, and individual investors.
A behavioral finance model mostly depends on concept of individual investors who are
limited in terms of decision making and judgment to errors. By reviewing prior rational
investors in efficient markets reveals how the psychological biases affect investor
behavior and prices. A research study by Maheran and Muhammad (2007) also observed
the same phenomenon and revealed that behavior exhibited by most investors while
making investment decision is their participation in portfolios dealing in bonds and
securities. Individual investors show a loss-averse behavior by analyzing their past
performance serving as an indicator of future performance in decisions related to stock
purchasing, moreover the investors normally trade too aggressively while keeping in
mind the investors status quo and investors themselves cannot create an efficient
portfolio. This does not necessarily show cost cutting means in order select a certain set
of securities to avail better choices so that the market becomes more competitive and
efficient. This involves regulations, overconfidence, and perhaps there needs to some
steps taken to make advertising of mutual fund to become a standard norm.
A diversified portfolio helps to minimize the uncertainty of future investment plan so unit
trust has become a more attractive option to the investors. The trend has arisen due to
risks associated with over diversification and under diversification as a greater portfolio
is difficult to handle while smaller portfolio does not safeguards against the risk. Zulkifli
and Basaruddin (2007) discussed the risk associated with selection of portfolio on basis
Copyright © 2012. NJMT
64
NUML Journal of Management & Technology
Vol: 8, No: 1. January, 2013 ISSN 1997-4507
of its size. They investigated as to what optimum number of stocks are enough to help
investor maximize its profits in terms of diversification. They used Markowitz theory
along with simplified approach in order to identify the ultimate diversification. By having
a sample of 87-stocks they concluded that in Malaysian market 13 stocks are enough to
avert risk and select a convenient portfolio.
Various researchers have tried to establish model in order to measure the investment
trend along with investors own perception towards risks related to investment. In order to
implement this a survey was carried on based on attitude of Taiwanese investors by
Chou, Huang, and Hsu (2010) to find their previous investment experiences as a
benchmark, with a record of their responses when they have to perform in a perfectly
economic environment. This was used to develop a framework to interpret their relevant
attitudes and behaviors. Extreme levels of perception about risk are indicated by investors
in relation to their own investment experiences. Investors who have little or no
experience working in stock markets and secondary markets are labeled as at highest
echelon of risk. In this context model proposed by researchers is very much in line to find
a positive correlation between experience and intensity of risk, although penalty is
desired to be learnt in order to fully understand this. A deep thought to other financial
instruments operating in financial markets each investor level of risk and expected returns
shows significant but not a positive correlation that may be termed as negative as well.
Eventually, as information is available, their perception on instruments operating in
financial markets is lesser as compared to higher expected remuneration.
Some phenomenon when interpreted in the framework of motivational biases, an
argument arises as the investors who are highly motivated to possess some positive
perceptions with an objective to derive their own pleasure and survival are more
vulnerable to biasness related risks. Some investors opt for a utilitarian way to maximize
their happiness while others may look for cognitive means.
Research Methodology
Population and Sample
Population for the research is mutual funds investors in Pakistan and 200 investors of
mutual funds in Islamabad have been chosen as a sample on the basis of convenient
sampling.
Instruments Utilized
Primary data was used in the research. The study of questionnaire from MichaelF Scheier
& Charles, Carver of Optimism (1985) and Dr. Martin Seligman's book, "Learned
Optimism” (2000) was used and developed. These instruments were distributed to gather
the data for research purpose.
Quantitative Techniques
Regression model has been used to analyze the data. In this paper, researcher intends to
find out the dynamic relationship between optimism biasness and the decisions related to
investment in mutual funds were identified.
Brandt and Schmidt (2011) used an attitude behavior model which was developed by
Schmidt (2010). The model was extended to identify the different predictions of
willingness and interaction towards investment in mutual fund. To measure the
interaction effect the researcher uses the regression model. Analysis through regression
Copyright © 2012. NJMT
65
NUML Journal of Management & Technology
Vol: 8, No: 1. January, 2013 ISSN 1997-4507
model is used as products of the predictors. The predictors must be perfectly reliable to
avoid the biased estimation of the regression co-efficient.
Regression Model
The following regression model was used to test the relation of investment decisions in
mutual fund and optimism bias.
IDMF=f (Optimism bias)
IDMF=f (OC, HOP, OE)
IDMF=α+β1OC+β2 HOP+β3 OE+ Error term
Where:
IDMF = Investment decision in mutual fund.
OC = Overconfidence
HOP = Hopefulness
OE = Over-estimation
The above regression model was used for testing the hypotheses. Investment decision in
mutual fund was used as dependent variable and independence was optimism which was
calculated with three dimensions including overconfidence, hopefulness and Over-
estimation. The measure captures the combined effect of investment in mutual fund and
optimism bias.
Variable Definition and Measurement
There are the three main identified faces of optimism bias which has been incorporated to
obtain level of relationship of optimism with investment in mutual funds. Variables that
are used to measure optimism are given below;
Over-Confidence
Before defining variables it is important to have an insight of facets of optimism. Both
from investor and fund managers perspective the terms “confidence”, “trust” and “belief”
are unanimous to all of them and are somehow synonyms. Investigation further deeper
into this philosophy “confidence is relates to trust. Whenever there are financial crisis
may also be termed as a confidence lacking phenomenon and it is further derived from
the Latin meaning to believe. Cumulative trust and confidence among the investors have
a great significance which directly affects the financial markets. Most interesting aspect
in this regard is dynamism between particular investors trust level varying from person to
person.
This was stated by Akerlof and Shiller (2009), who proposed certain confidence
multipliers that are based on the concept of Keynsian multipliers which further highlights
how marginal propensity to consume spreads between a selected group of investors in
relation to, decisions based on political or regulatory decisions. It is further discussed that
subsequent change in a particular investor‟s level of confidence in the financial markets
also affects other investor‟s confidence level by maintaining all other factors constant
which are closely associated by confidence multiplier. This was further highlighted by a
logical mathematical framework in order to determine a model as to how confidence or
lack of confidence forces an investor and other financial agents to undertake a particular
decision.
Over-Estimation
Copyright © 2012. NJMT
66
NUML Journal of Management & Technology
Vol: 8, No: 1. January, 2013 ISSN 1997-4507
A look at literature related to psychology reveals that two different types of explanation
for overestimation and its associated effects. From one perspective, these phenomena are
in relation to biasness related to motivation, while this discussion leads to the point that
are most of times willing to hold non realistic self-perceptions in order to derive
maximum happiness and their own well-being. This assumption is related to the fact that
investors tend to maximize their happiness in a utilitarian way. Alternatively, a different
perhaps complementary view is put forward by cognitive psychologists who argue that
investors always intend to bear healthy returns, and they intend to be responsible for the
outcomes of their investments. These two factors play a pivotal role in determining
investor‟s vulnerability to self-serving m
Overestimation normally refers to the over valuation of bonds and securities, experience,
expertise, knowledge, competences available information and decision making. Over
estimated value of micro and macro-economic factors influence the decisions of investors
to great extent. It is human nature to learn about themselves and know their strengths by
analyzing the outcomes of their deeds and in doing so, most of the investors overestimate
the extent to which they may contribute to their own success. There are lot of factors
that has to be discussed separately in this discussion. Van den Steen (2002) proved that
investors attribute earnings to their own efforts while losses are attributed to external
forces or bad luck. In the same manner ego-centric or self-centric bias reveals that
investors opting for a joint venture that involves over-estimation that contributes to
profits while overconfidence is related to both investors and general public over-
estimates the accuracy of their expected outcomes and their actions while foremost of all
the illusion of control is based on the fact that investors forecasts they have more saying
rather than the results of a random or partially random event.
Overestimation can lead to overconfidence. This was further studied by Gervais and
Odean (2001) who proved that most of the investors wrongly interpret their good
performance in terms of retruns on investment, and likewise bad performances are
attributed to chance, which is another aspect of being over confident. This overestimation
of investment skill, in this regard sometimes result in excessive trading, as analyzed by
Odean (1999). Regardless of the studies that lead to attribution and overconfidence
among normal investors, professional experts, traders, and small investors, though there
are just few researches that reveal the biases in fund manager performance. It is generally
assumed that most of the investment in financial markets is not done by retail investors as
they are solely responsible for their own investments, in fact it is made by the major
institutes. Any co-relation between fund manager‟s performance and his potential
overconfidence or susceptibility results in biasness which should be of great significance,
not only to literature but also to financial markets as well.
Hopefulness
It is the phenomena of optimism in which the investors always have a positive hope
regarding their investment decision. They think and assume the factors will positively
affect the investment plan. They never compromise on think about the dark sides of the
result. Investors expect that the prices of particular securities will hopefully increase.
Sometime they take decisions in verse condition when the prices are in the diminishing
trend and they invest in these securities with a positive hope.
Forster (2003) investigated about the positive emotions and thoughts of the people. The
researchers indentified some positive assertions based on hopefulness including hopeful
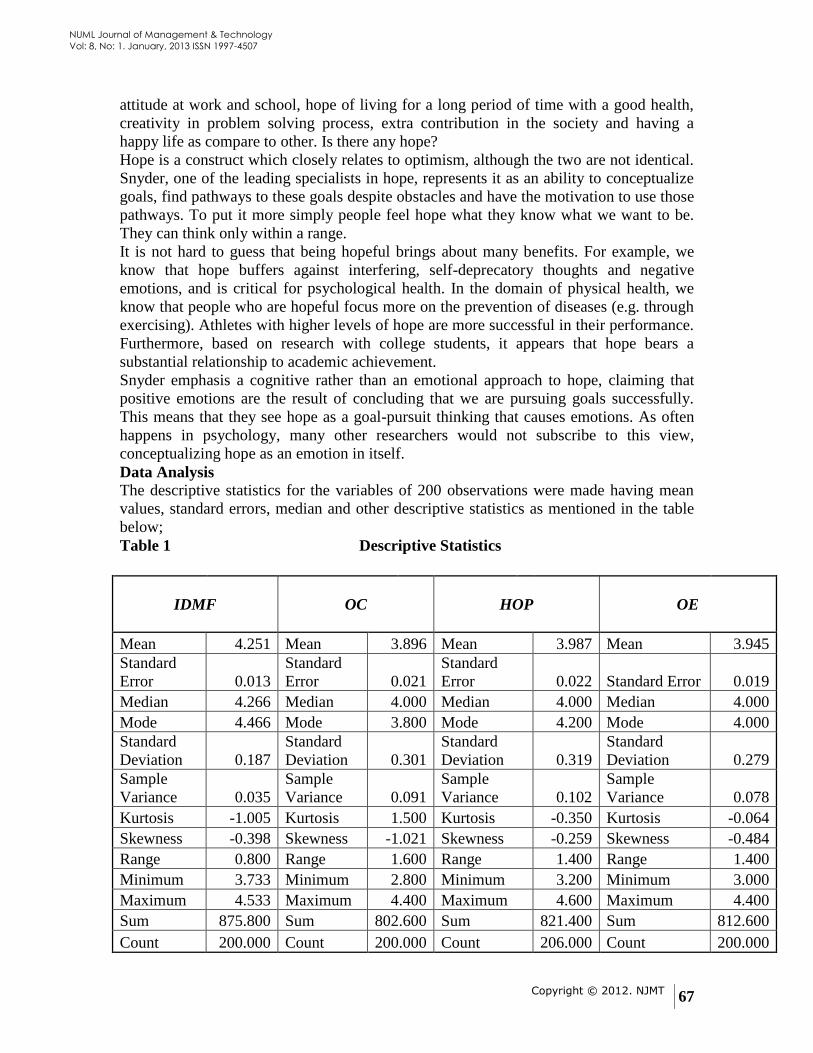
Copyright © 2012. NJMT
67
NUML Journal of Management & Technology
Vol: 8, No: 1. January, 2013 ISSN 1997-4507
attitude at work and school, hope of living for a long period of time with a good health,
creativity in problem solving process, extra contribution in the society and having a
happy life as compare to other. Is there any hope?
Hope is a construct which closely relates to optimism, although the two are not identical.
Snyder, one of the leading specialists in hope, represents it as an ability to conceptualize
goals, find pathways to these goals despite obstacles and have the motivation to use those
pathways. To put it more simply people feel hope what they know what we want to be.
They can think only within a range.
It is not hard to guess that being hopeful brings about many benefits. For example, we
know that hope buffers against interfering, self-deprecatory thoughts and negative
emotions, and is critical for psychological health. In the domain of physical health, we
know that people who are hopeful focus more on the prevention of diseases (e.g. through
exercising). Athletes with higher levels of hope are more successful in their performance.
Furthermore, based on research with college students, it appears that hope bears a
substantial relationship to academic achievement.
Snyder emphasis a cognitive rather than an emotional approach to hope, claiming that
positive emotions are the result of concluding that we are pursuing goals successfully.
This means that they see hope as a goal-pursuit thinking that causes emotions. As often
happens in psychology, many other researchers would not subscribe to this view,
conceptualizing hope as an emotion in itself.
Data Analysis
The descriptive statistics for the variables of 200 observations were made having mean
values, standard errors, median and other descriptive statistics as mentioned in the table
below;
Table 1 Descriptive Statistics
IDMF
OC
HOP
OE
Mean 4.251 Mean 3.896 Mean 3.987 Mean 3.945
Standard
Error 0.013
Standard
Error 0.021
Standard
Error 0.022 Standard Error 0.019
Median 4.266 Median 4.000 Median 4.000 Median 4.000
Mode 4.466 Mode 3.800 Mode 4.200 Mode 4.000
Standard
Deviation 0.187
Standard
Deviation 0.301
Standard
Deviation 0.319
Standard
Deviation 0.279
Sample
Variance 0.035
Sample
Variance 0.091
Sample
Variance 0.102
Sample
Variance 0.078
Kurtosis -1.005 Kurtosis 1.500 Kurtosis -0.350 Kurtosis -0.064
Skewness -0.398 Skewness -1.021 Skewness -0.259 Skewness -0.484
Range 0.800 Range 1.600 Range 1.400 Range 1.400
Minimum 3.733 Minimum 2.800 Minimum 3.200 Minimum 3.000
Maximum 4.533 Maximum 4.400 Maximum 4.600 Maximum 4.400
Sum 875.800 Sum 802.600 Sum 821.400 Sum 812.600
Count 200.000 Count 200.000 Count 206.000 Count 200.000

Copyright © 2012. NJMT
68
NUML Journal of Management & Technology
Vol: 8, No: 1. January, 2013 ISSN 1997-4507
The correlation coefficient shows the relationship between the variables. It has a range
between +1 and -1, where +1 shows perfect positive correlation (moving in same
direction) while -1 shows perfect negative correlation (moving in opposite direction).
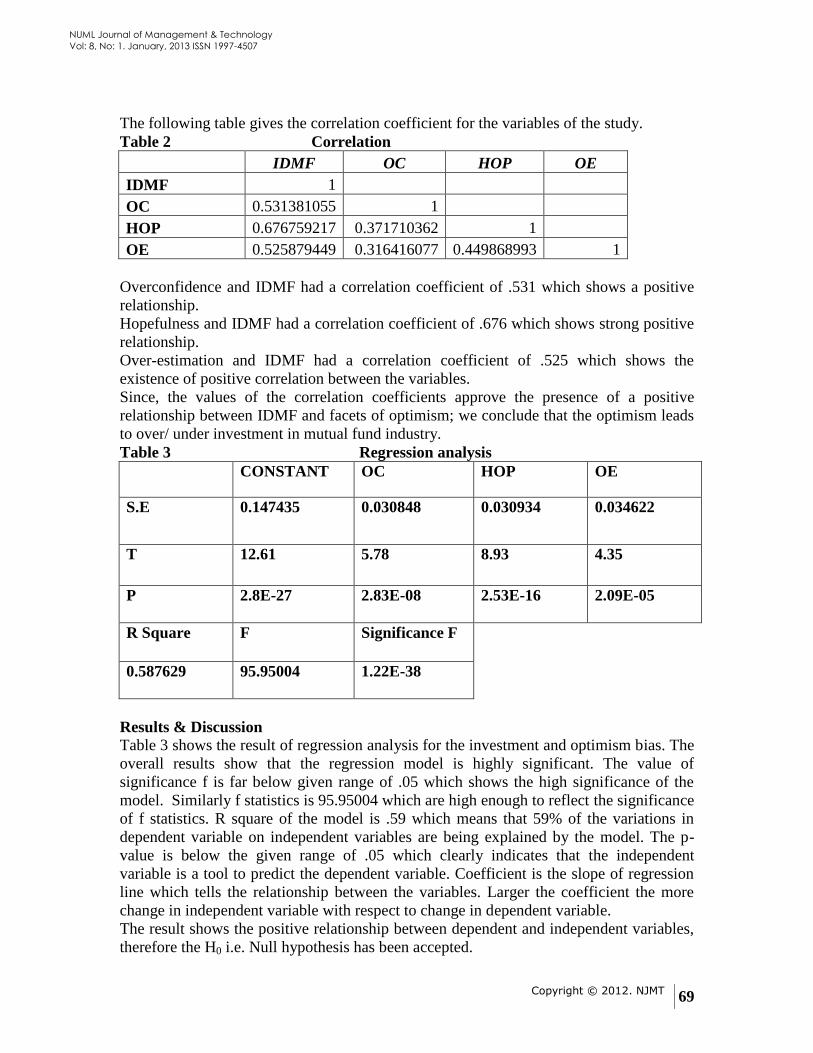
Copyright © 2012. NJMT
69
NUML Journal of Management & Technology
Vol: 8, No: 1. January, 2013 ISSN 1997-4507
The following table gives the correlation coefficient for the variables of the study.
Table 2 Correlation
IDMF OC HOP OE
IDMF 1
OC 0.531381055 1
HOP 0.676759217 0.371710362 1
OE 0.525879449 0.316416077 0.449868993 1
Overconfidence and IDMF had a correlation coefficient of .531 which shows a positive
relationship.
Hopefulness and IDMF had a correlation coefficient of .676 which shows strong positive
relationship.
Over-estimation and IDMF had a correlation coefficient of .525 which shows the
existence of positive correlation between the variables.
Since, the values of the correlation coefficients approve the presence of a positive
relationship between IDMF and facets of optimism; we conclude that the optimism leads
to over/ under investment in mutual fund industry.
Table 3 Regression analysis
CONSTANT OC HOP OE
S.E 0.147435
0.030848
0.030934
0.034622
T 12.61 5.78 8.93 4.35
P 2.8E-27
2.83E-08
2.53E-16
2.09E-05
R Square F Significance F
0.587629
95.95004
1.22E-38
Results & Discussion
Table 3 shows the result of regression analysis for the investment and optimism bias. The
overall results show that the regression model is highly significant. The value of
significance f is far below given range of .05 which shows the high significance of the
model. Similarly f statistics is 95.95004 which are high enough to reflect the significance
of f statistics. R square of the model is .59 which means that 59% of the variations in
dependent variable on independent variables are being explained by the model. The p-
value is below the given range of .05 which clearly indicates that the independent
variable is a tool to predict the dependent variable. Coefficient is the slope of regression
line which tells the relationship between the variables. Larger the coefficient the more
change in independent variable with respect to change in dependent variable.
The result shows the positive relationship between dependent and independent variables,
therefore the H0 i.e. Null hypothesis has been accepted.
Copyright © 2012. NJMT
70
NUML Journal of Management & Technology
Vol: 8, No: 1. January, 2013 ISSN 1997-4507
Conclusion and Limitations
The study carried out to explore the impact of optimism bias on investment in mutual
fund. The facets of optimism bias are confidence, hopefulness and over-estimation where
the investment in mutual fund is dependent variable. The relationship shows the
performance of the dependence variable due to the independent variable. The cross-
sectional variations shows that previous good performance leads to an optimism as
calculated by the regression model by using investor‟s responses which may also be a
result of theoretical as well as market trends being used in mutual fund market.
Regressions has been applied with dependent variable of investment in mutual fund and
independent variable of optimism bias and the results suggesting that optimism does not
indeed diminish the return of mutual fund and Regression coefficient is stronger which
shows the significant change in investment in mutual fund with respect to change
optimism bias.
Limitations
The research is limited to the relationship of mutual funds investors and optimism bias
that investors are more tentative to be overoptimistic about future events and the
subsequent result of their investment plans. This study is only concern with optimism
bias which is a part of several other biases of behavioral finance. Only three different
facets are optimism bias has been incorporated but there may other dimensions of
optimism bias as well. The sample size of 200 investors in Islamabad can be extended
and the research can be implemented on broad area.
Copyright © 2012. NJMT
71
NUML Journal of Management & Technology
Vol: 8, No: 1. January, 2013 ISSN 1997-4507
References
BASRI, Z. B. (2007). A STUDY OF PORTFOLIO DIVERSIFICATION IN
MALAYSIAN STOCK MARKET. UiTM Johor , 300-323.
Brandt, N. S. (2011). Determinants of Mutual Fund Purchasing – Moderating Effects and
Nonlinearity within an Attitude-Behaviour Based Approach . Otto Beisheim School of
Management, Burgplatz2 , 1-45.
Charles M. C. Lee, A. S. (1991). Investor Sentiment and the Closed-End Fund Puzzle.
The Journal of Finance , 75-109.
Eshraghi, A. (2011). How does Mutual Fund Manager Overconfidence Impact Mutual
Fund Investment Performance? University of Edinburgh Business School , 1-27.
JALLOULI-SELLAMI, S. (2007). Equity Home Bias, Herding Behavior and Social
Interaction Mutual Fund Analysis. The University of Paris Dauphine , 1-31.
Lou∗, D. C. (December 2010). A Test of the Self-Serving Attribution Bias:. Singapore
International Conference on Finance .
Malcolm Baker, L. L. (2009). Can Mutual Fund Managers Pick Stocks? Evidence From
Their Trades Prior to Earnings Announcements. Harvard Business School and NBER , 1-
34.
Master‟s, L. U. (may 2007). Achieving sustainability via the market for green funds.
Lund University International Master’s .
Mola, S. (oct 2007). Affiliated Mutual Funds and Analyst Optimism. Federal Reserve
Bank of St. Loui .
Muhammad, N. M. (2003). STUDY ON BEHAVIORAL FINANCE. International
Journal of Economics , 1900-1911.
Muhammad, N. M. (2003). STUDY ON BEHAVIORAL FINANCE: IS THE
INDIVIDUAL INVESTORS RATIONAL?. International Economics , 302-312.
Muhammad, N. M. (2005). STUDY ON BEHAVIORAL FINANCE: IS THE
INDIVIDUAL INVESTORS RATIONAL?. NA , NA.
Patel, S. (2011). Economic Optimism, Information Uncertainty and Future Investment
Decisions: Evidence from the Mutual Fund Industry. Desautels Faculty of Management,
McGill University , 1-43.
S. Hu, Y. M. (2009). Investors' Optimism: A Hidden Source of High Markups in the
Mutual Fund Industry. JEL classification , 1-45.
Copyright © 2012. NJMT
72
NUML Journal of Management & Technology
Vol: 8, No: 1. January, 2013 ISSN 1997-4507
Sadka, G. O. (2010). Media and Investment Management. Carroll School of Management
Chestnut Hill, Massachusetts , 1-29.
Shyan-Rong Chou, G.-L. H.-L. (2010). Investor Attitudes and Behavior towards Inherent
Risk and Potential Returns in Financial Products . International Research Journal of
Finance and Economics , 16-29.
Teo, S.-G. C. (2003). Hedge Funds and Analyst Optimism . Institutional Investor
Magazine , 1-45.
TERRANCEODEAN. (1999). Do Investors Trade Too Much? THE AMERICAN
ECONOMIC REVIEW , 1279-1298.
Warren Bailey, A. K. (5th July 2010 ). Behavioral Biases of Mutual Fund Investors .
Yosef Bonaparte, A. K. (2012 ). Political Climate, Optimism and Investment Decisions.
University of Miami , 1-64.
Michael Firth, Chen Lin, Ping Liu and Yuhai Xuan(2011), The Client is King: Do Mutual
Fund Relationships Bias Analyst Recommendations?, 1-53.
James D.Cox and John W.Payne Mutual Fund Expense Disclousers (2005), Washington
University Law Quarterly, 907-938.
Eunkyung Lee and Yeosun Yoon (2010), The Effects of Regulatory Focus and Past
Performance Information on Temporal Bias of Future Optimism, KAIST Business
School WORKING PAPER SERIES, 1-32
Richard H. Willis (2001), Mutual Fund Manager Forecasting Behavior, Accounting
Research Center, Booth School of Business, University of Chicago, 707-725
Si Cheng, Massimo Massa and Hong Zhang (2007) Short-Sale Constraints and the
Pricing of Mutual Funds, 1-49.
Brickley, James A. and James S. Schallheim, 1985, Lifting the lid on closed-end
investment companies: A case of abnormal returns, Journal of Financial and
Quantitative Analysis 20, 107-118.
Fama, Eugene F. and Michael Gibbon, 1984, A comparison of inflation forecasts,
Journal of Monetary Economics 13, 327-348.
Kenneth R. French, 1988, Dividend yields and expected stock returns, Journal of
Financial Economics 22, 3-26.
Grossman, Sanford J. and Oliver D. Hart, 1980, Takeover bids, the free-rider
problem, and the theory of the corporation, Bell Journal of Economics and
Management Science Spring, 42-64.
Herzfeld, Thomas J., 1980, The Investor's Guide to Closed-end Funds (McGraw-
Hill, New York, NY).
Copyright © 2012. NJMT
73
NUML Journal of Management & Technology
Vol: 8, No: 1. January, 2013 ISSN 1997-4507
Jbbotson, Roger G., Jody L. Sindelar, and Jay R. Ritter, 1988, Initial public
offerings, Journal of Applied Corporate Finance 1, 37-45.
Lee, Charles M. C., Andrei Shleifer, and Richard H. Thaler, 1991, Explaining
closed-end fund discounts, Unpublished manuscript, University of Michigan,
Harvard University, and Cornell University.
Russell, Thomas and Richard H. Thaler, 1985, The relevance of quasi rationality
in competitive markets, American Economic Review 75, 1071-1082.
Sharpe, William F. and Howard B. Sosin, 1975, Closed-end investment companies
in the United States: Risk and return, in B. Jacquillat, ed.: European Finance
Association 1974 Proceedings (North Holland, Amsterdam), 37-63.
Shiller, Robert J., 1984, Stock prices and social dynamics, Brookings Papers on
Economic Activity 2, 457-498.
Shleifer, Andrei and Robert W. Vishny, 1990, Equilibrium short horizons of
investors and firms, American Economic Review Papers and Proceedings 80, 148-
153.
Thompson, Rex, 1978, The information content of discounts and premiums on
closed-end fund shares, Journal of Financial Economics 6, 151-186.
Weiss, Kathleen, 1989, The post-offering price performance of closed-end funds,
Financial Management Autumn, 57-67.
Wiesenberger, A., 1960-1986, Investment Companies Services, annual surveys
(Warren, Gorham, and Lamont, New York, NY)
Jerald R. Forster (2003), focusing on strength and optimism, Washington Counseling
Association, p 1-07.
Copyright © 2012. NJMT
74
NUML Journal of Management & Technology
Vol: 8, No: 1. January, 2013 ISSN 1997-4507
Book Review:
Decision Making & Problem Solving Strategies (2nd
Edition, 2007) By. John Adair.
Kogan Page. London
Reviewer: Dr. Naveed Akhtar, Faculty of Management Sciences, NUML Islamabad
Decision making & Problem Solving is the issue which management faces on
each step of the business development. John Adair has written a very practical guide
book which facilitates reader to understand the nature of decision making and problem
solving. It elaborates different problem solving strategies, directs how to generate ideas
before making the decision, and how to think creatively and how to develop thinking
skills. This book is divided into seven parts.
The introduction part of this book talks about three forms of applied thinking:
decision making, problem solving and creative thinking which are overlapping but are
distinguishable. Decision making is about deciding what action to take; it usually
involves choice between options. The object of problem solving is usually to find a
solution, answer or conclusion. The outcome of creative thinking is to generate new
ideas. The leaders aspire to take best decisions, optimum level of problem solving, and
innovative ideas are generated for growth of businesses. Final step is to master the
process of practical thinking which lie behind all the effective decision making, problem
solving and creative thinking. One cannot guarantee the outcomes but can at least make
sure that you use the well tried-and-tested processes of thinking to some purpose. One
owns that responsibility and this book is aim of this book.
Author sates the words of Roy Thompson, „If I have any advice to pass on, as a
successful man, it is this: if one wants to be successful, one must think; one must think
until it hurts. The book explores l explore some practical ways in which you can improve
your skills in this key area. By the time
you have worked through the book you should: working of mind, clear framework of
decision making and its relationship with problem solving, using a model for decision
making & problem solving, developing creative and thinking skills.
The first chapter discusses that behind the thinking human mind works. It states
the difference between brain and mind. Brain works like chips in the computer and mind
is what appears on the screen. This chapter explains few exercises which makes your
mind work. This chapter also discusses three main functions of the mind; Analyzing,
Synthesizing, and valuing. Analytical thinking is related to logical or step-by-step
reasoning. Logic has two main parts: deduction and induction. It is the process of
deducing a conclusion from what is known or assumed. More specifically, it is a question
of inferring from the general to the particular. Induction works the other way round. It is
the process of inferring or verifying a general law or principle from the observation of
particular instances – the core of the „scientific method‟. Synthesizing is putting or
placing things together to make a whole. It is the reverse process of analysing. Synthesize
means to assemble or make anything. All products and services are the results of
syntheses. Nature is holistic. If analyzed into parts, they lose their essential holistic
quality. Our mind has a holistic dimension. It can think holistically – in terms of wholes –
Copyright © 2012. NJMT
75
NUML Journal of Management & Technology
Vol: 8, No: 1. January, 2013 ISSN 1997-4507
as well as analytically (taking wholes to bits). The third is valuing which means
establishing success criteria, evaluating, appraising performance,
and judging people e.g. in a selection interview. Criticism is a form of valuing. In the end
depth mind exercise is given.
Second chapter talks about the art of effective decision making and explains
classic five step approach to decision making; define the object, collect relevant
information, generate feasible options, make the decision, implement and evaluate.
Third chapter dilates upon the sharing decisions with your teams. Leaders are supposed to
learn three types of needs that play a significant role while sharing and making the
decision: task needs, individual needs, team maintenance needs. Understanding these are
incomplete without thee leadership functions: Defining the task, Planning, Briefing,
Controlling, Evaluating, Motivating, Organizing, and Providing an example.
The Fourth chapter explains the problem solving strategies. A bridge model is
discussed. In fifth chapter different techniques of generating new ideas are discussed.
One of the creative thinking techniques is Brainstorming which works better in groups. In
brainstorming criticism is strictly prohibited and focus is only to generate as much as
wild ideas. Later few workable ideas are chosen. Sixth chapter talks about how to explore
other forms of thinking that is called lateral thinking which emphasizes wider look for
solutions. This chapter discusses two themes Vertical thinking Lateral thinking. Last
chapter takes note of developing thinking skills and states that if you truly want to
develop your thinking skills then your task is essentially one of self-development. This
chapter ends with few key points and one point says that don‟t think of thinking as being
hard, painful or laborious – if you do that you certainly won‟t apply yourself to shaping
and sharpening your thinking skills. Thinking is fun, even when – or especially when –
we are faced with apparently insurmountable difficulties.