Embed Size (px)
Citation preview

http://jom.sagepub.com/Journal of Management
http://jom.sagepub.com/content/31/1/28The online version of this article can be found at:
DOI: 10.1177/0149206304271376
2005 31: 28Journal of ManagementJason D. Shaw, Nina Gupta, Atul Mitra and Gerald E. Ledford, Jr.
Success and Survival of Skill-Based Pay Plans
Published by:
http://www.sagepublications.com
On behalf of:
Southern Management Association
can be found at:Journal of ManagementAdditional services and information for
http://jom.sagepub.com/cgi/alertsEmail Alerts:
http://jom.sagepub.com/subscriptionsSubscriptions:
http://www.sagepub.com/journalsReprints.navReprints:
http://www.sagepub.com/journalsPermissions.navPermissions:
http://jom.sagepub.com/content/31/1/28.refs.htmlCitations:
What is This?
- Jan 21, 2005Version of Record >>
at Magrath Library, University of Minnesota Libraries on March 3, 2012jom.sagepub.comDownloaded from

10.1177/0149206304271376ARTICLEJournal of Management / February 2005Shaw et al. / Skill-Based Pay Plans
Success and Survival of Skill-Based Pay Plans†
Jason D. Shaw*Gatton College of Business and Economics, School of Management,
University of Kentucky, Lexington, KY 40506-0034
Nina GuptaWalton College of Business, Department of Management,
University of Arkansas, Fayetteville, AR 72701
Atul MitraCollege of Business Administration, Department of Management,
University of Northern Iowa, Cedar Falls, IA 50614
Gerald E. Ledford Jr.Ledford Consulting Network, LLC, 2015-B Havemeyer Lane, Redondo Beach, CA 90278
Factors related to the success and survival of skill-based pay (SBP) plans are addressed in a longitudinalstudy of 97 facilities. Results indicate that certain design features and support variables relate to increasedworkforce flexibility and to SBP survival, and supervisor support also relates strongly to SBP survival. Theresults also show that SBP plans are more successful and sustainable in manufacturing facilities than inservice facilities, and SBP survival is less likely in facilities pursuing a technical innovation strategy. Impli-cations of the research for theory and practice regarding SBP plans, compensation systems, and humanresources management innovations are addressed.
Keywords: skill-based pay; survival; innovation; job design
Skill-based pay (SBP) plans entail a fundamental departure from traditional job-based pay to a per-son-based approach that rewards employees for acquiring new skills (Gupta, Jenkins, & Curington,1986; Jenkins, Ledford, Gupta, & Doty, 1992). Under SBP plans, employees are given a pay increasefor learning and demonstrating proficiency in a new skill. The pay increase is granted regardless ofwhether employees actually use the skill in the course of their typical duties at the time of skill acquisi-
†This research was funded by a grant from the American Compensation Association (now WorldatWork). Earlier versions of thisarticle were presented at the 1998 Center for Effective Organizations Seminar Series (Pay for Skills and Competencies: NewResearch and Practice) at the University of Southern California and at the 2000 annual meetings of the Academy of Management,Toronto.
*Corresponding author. Tel.: 859-257-2774; fax: 859-257-3577.
E-mail address: [email protected]
Journal of Management, Vol. 31 No. 1, February 2005 28-49DOI: 10.1177/0149206304271376© 2005 Southern Management Association
28
at Magrath Library, University of Minnesota Libraries on March 3, 2012jom.sagepub.comDownloaded from

tion (Gupta & Shaw, 2001). Lawler, Mohrman, and Ledford (1998) reported that the proportion ofFortune 1000 companies using SBP with at least some employees rose from 40% in 1987 to 62% in1996. Companies use SBP plans presumably to improve workforce flexibility, productivity, and simi-lar outcomes (Murray & Gerhart, 1998). Case reports suggest that some companies do realize thesebenefits, but these assumptions are largely untested empirically (Lee, Law, and Bobko [1999] andMurray and Gerhart [1998] are recent exceptions, but they are conducted within limited organizationalsettings).
We examine SBP plans in terms of several dimensions of their success and long-term survival.Numerous authors note that success can be measured in many ways (e.g., Eaton, 1994; Kim, 1999); wetake a similar multifaceted perspective. Workforce flexibility and increased productivity are consid-ered critical outcomes of SBP plans in the practitioner (e.g., Gupta, Ledford, Jenkins, & Doty, 1992;Lawler & Ledford, 1987) and academic literatures (e.g., Gupta & Shaw, 2001; Murray & Gerhart,1998). The literature also argues that SBP plans reduce overall compensation costs by developing leanfacilities saturated with broadly skilled employees (Jenkins et al., 1992; Ledford, 1991), that is, theyare cost-effective. In short, the literature suggests three dimensions of SBP success—flexibility, pro-ductivity, and cost-effectiveness. We focus on these in the article.
Another critical indicator of a successful administrative innovation is its continued use, that is, itssurvival (Gerhart, Trevor, & Graham, 1996). However, Kim’s (1999) study of the survival of gain-sharing plans is a rare example of this type of investigation; similar studies of other compensationinnovations are vitally needed. Survival issues are especially germane for SBP plans for several rea-sons. First, unlike traditional job-based pay plans, SBP plans are almost always a strategic linchpin forthe organization (Lawler & Jenkins, 1992), implying greater returns on investment and greateraccountability. Second, SBP plans are usually embedded in sweeping changes that encompasssociotechnical, selection, training, performance appraisal, accounting, and other systems, as well asthe facility structure. Lawler (1994) pointed out that the entire human resource management (HRM)infrastructure may need to be altered or replaced to converge with SBP. Third, SBP systems are com-plex and tightly coupled with HRM and other employment practices (Gupta et al. 1992). Highly inte-grated practices increase the costs of failure because problems can spread through the system in unan-ticipated ways (Perrow, 1984). In addition to the other success dimensions, then, we also focus on SBPsurvival.
Theory and Hypotheses
In this section, we examine four facets of SBP success: workforce productivity, workforce flexibil-ity, cost-effectiveness, and SBP survival. We investigate three critical aspects of SBP plans on theseoutcome variables—design characteristics, supervisor/employee support, and facility characteristics.We also explore the mediating role that SBP productivity, flexibility, and cost-effectiveness successmight play between design characteristics, supervisor/employee support, and facility characteristicson one hand and SBP survival on the other hand.
SBP Design Characteristics
Focus on skill breadth. A focus on breadth of skills means that the SBP plan rewards the acquisitionof a repertoire of skills at the same lateral level in the facility (Gupta & Shaw, 2001). Focus on skillbreadth should be positively related to SBP success and survival for many reasons. A breadth focustends to increase job variety in the long run, it enhances task significance because it highlights the roleof each job within the facility context, and it increases autonomy because employees know a range ofdifferent tasks (e.g., Bunning, 1989; Jenkins & Gupta, 1985; Knouse, 1995). The motivating potential
Shaw et al. / Skill-Based Pay Plans 29
at Magrath Library, University of Minnesota Libraries on March 3, 2012jom.sagepub.comDownloaded from

of an SBP plan with a stronger focus on skill breadth should thus be greater. Murray and Gerhart(1998) reported that, compared with a job-based system, a breadth-oriented SBP system increasedproductivity 58%. Thus, an emphasis on skill breadth should facilitate productivity success. A breadthfocus, by definition, diversifies the skill sets of employees and should also predict flexibility success.The inherent skill diversification results in a multiskilled workforce capable of doing different jobs inthe company. As a result, optimal use of human capital is promoted. Breadth plans are generally easierto create and administer, partly because support structures such as formal training and performanceappraisals are often geared for breadth skills (Lawler & Ledford, 1987); most facilities have basictraining programs in place for requisite technical skills. For these reasons, an emphasis on skill breadthshould be positively related to cost-effectiveness.
A focus on breadth of skills should also predict plan survival. Employee acceptance of an innova-tion depends on many factors including simplicity and ease of use. Although SBP plans are inherentlycomplex (Milkovich & Newman, 1999), plans that emphasize skill breadth tend to be simpler and eas-ier to use. As noted, a wide array of observable breadth skills can be easily incorporated into the plan.These factors promote employee acceptance of the plan, which in turn should increase the probabilityof survival (Davis, 1989; Jenkins & Lawler, 1981). Thus,
Hypothesis 1: A focus on skill breadth is positively related to SBP success (productivity, flexibility, and cost-effectiveness) and survival probability.
Total number of skills in plan. An important aspect of SBP design is the number of skills encom-passed by the plan. More skills create internal pay ladders with more rungs, which in turn shouldenhance motivation, goal achievement, and higher order need fulfillment (Gupta et al., 1992). Further-more, a higher skill acquisition and pay raise probability is likely to raise pay satisfaction (Lee et al.,1999) and facilitate changes in career direction. These characteristics of plans with more skills shouldresult in greater productivity and flexibility and greater survival probability. On the other hand, ahigher number of skills is likely to entail greater administrative costs, could burden internal trainingresources, and could increase base pay levels to unacceptably high levels (Murray & Gerhart, 1998).Thus, efficiency and cost-effectiveness may suffer, at least in the short run. Thus,
Hypothesis 2: The total number of skills in the SBP plan is positively related to productivity success, flexibilitysuccess, and survival probability but is negatively related to cost-effectiveness success.
Topped-out percentage. A common concern in SBP plans is that of employees “topping out,” that is,having acquired all available skills and received all available pay increases (Jenkins et al., 1992). Thissituation is analogous to employees reaching the highest level in their pay grade within a traditionalcompensation structure. Ironically, when many employees are topped out, the SBP plan can be viewedas successful in many ways because it yields a highly skilled, highly paid workforce. Logically, then,as more and more employees top out, productivity and flexibility levels should increase.
On the other hand, when many employees are topped out, cost-effectiveness and the probability ofsurvival may be reduced. For example, Eaton (1994) reported that mature employee participation pro-grams were increasingly difficult to maintain and created additional administrative burdens. AmongSBP plans, a high topped-out percentage may signal the later stages of the life cycle of the program. Insuch circumstances, the continued relevance of the multiple skills an employee possesses must beevaluated often, technological obsolescence of skills considered, and refresher training offered. Fur-thermore, the design of alternative compensation structures that enable pay raises for these highlyskilled and highly valued employees becomes urgent. Most facilities have not dealt with these issueseffectively (Gupta et al., 1986, 1992; Jenkins & Gupta, 1985). For these reasons and consistent withEaton (1994), we expect a high topped-out percentage to relate negatively to cost-effectiveness.
30 Journal of Management / February 2005
at Magrath Library, University of Minnesota Libraries on March 3, 2012jom.sagepub.comDownloaded from

Life cycle arguments are also relevant for survival. Gerhart et al. questioned the implicit assumptionthat innovations “are discontinued because objectives went unmet or unanticipated conse-quences . . . created unforeseen problems” (1996: 189). Instead, programs may be terminated whentheir desired goals are met. A high topped-out percentage in many ways signals the end of the life cyclefor a successful program. As Gerhart et al. suggested, then, termination is a reflection, not of manage-rial error or illogical choices, but rather of decision makers “acting shrewdly rather than waiting forprobably problems to emerge from employees with suddenly capped earning potential” (1996: 190).From a sociological point of view, innovations have distinct life cycles that explain their termination.Thus,
Hypothesis 3: Topped-out percentage is positively related to SBP productivity and flexibility success and neg-atively related to cost-effectiveness success and survival probability.
Supervisor/Employee Support
Employee involvement. SBP use is encouraged in facilities that also promote high levels ofemployee involvement (Gupta et al., 1992). Employee involvement in the design of an SBP plan islikely to increase ownership perceptions; an understanding of the mechanics, goals, and opportunitiesavailable in the plan; and perceptions of its fairness. Lee et al. (1999) found that employee understand-ing of SBP was the strongest predictor of fairness perceptions, which in turn related strongly to percep-tions of the benefits of SBP. Thus, involvement in the day-to-day administration of the plan (e.g., skillacquisition decisions, performance appraisals, etc.) should promote success. Involvement enables themaximum return to be obtained from the presence of multiskilled employees (productivity and flexi-bility success); it can also increase suggestions for plan efficiency and mutual monitoring, enhancingcost-effectiveness. Typically, employees are also more committed and react more positively to policiesand change efforts when they are given opportunities for input and provided explanations for decisionsthat affect them (Daly & Geyer, 1994); this fosters survival of the innovation. When SBP is used alongwith ongoing employee involvement, then, the probability of success and survival is higher (Lawler,Ledford, & Chang, 1993). Thus,
Hypothesis 4: The extent of employee involvement in the SBP plan is positively related to SBP success (pro-ductivity, flexibility, and cost-effectiveness) and survival probability.
Supervisor support. Proponents of SBP repeatedly urge caution in adopting these plans withoutstrong commitment from line, middle, and top managers (Gupta et al., 1992; Lawler, 1978). By theirvery nature, the mechanisms and details of innovations are more nebulous than those of traditional sys-tems. An innovation is thus unlikely to be implemented without flaws or “kinks.” When true commit-ment and support are lacking, management can revert back to tried-and-true procedures in the face ofdifficulties. Such regression is particularly pernicious when pay systems are involved—pay systemsare arguably one of the most critical HRM systems. Conversely, learning and problem solving are pro-moted through commitment to an innovation because management is more likely to stick with theinnovation and work out difficulties in these circumstances. Thus,
Hypothesis 5: Supervisor support for the SBP plan is positively related to SBP success (productivity, flexibil-ity, and cost-effectiveness) and survival probability.
Closeness of supervision. SBP is often used to create a broadly skilled workforce that understandsthe entire production or service system and can diagnose and solve nonroutine problems without closesupervision (Lawler, 1981; Lawler, Mohrman, & Ledford, 1992). Thus, SBP changes the nature of the
Shaw et al. / Skill-Based Pay Plans 31
at Magrath Library, University of Minnesota Libraries on March 3, 2012jom.sagepub.comDownloaded from

psychological contract between employees and supervisors and lowers the costs associated with infor-mation asymmetries (Rousseau & Schalk, 2000). Multiskilled employees in SBP plans can generallyuse their talents fully without close supervision (Lawler & Ledford, 1987). The use of SBP alsochanges the way employees think and feel about their work (Lawler, 1994), that is, there are implicitand explicit cues that employees are trusted and qualified team members who can fulfill requiredduties without close supervision. Essentially, SBP plans transform explicit job-based monitoringsystems to implicit person-based systems.
Close supervision is inconsistent with the philosophy and mechanics of SBP systems. When job-based monitoring systems continue to be used, employees fail to realize the benefits associated withSBP plans. Close supervision of SBP employees can lead to alienation (the implicit message being thatemployees cannot be trusted despite their skills). Motivation to perform or to learn additional skills canerode as a consequence. The expenses incurred in adopting and implementing SBP systems are typi-cally offset by the reduction in agency costs associated with a need to supervise employees closely.SBP plans are unlikely to be cost-effective if an organization continues to incur these agency costs.
The arguments above about employee reactions and additional expenses suggest that close supervi-sion is also likely to affect SBP longevity. The incongruence of a pay plan that emphasizes independ-ence and trust with work design features that emphasize close supervision will in all probability createinjustice perceptions among the workforce. Such perceptions are among the primary determinants ofthe termination of an SBP plan (Gerhart et al., 1996). Thus,
Hypothesis 6: Closeness of supervision is negatively related to SBP success (productivity, flexibility, and cost-effectiveness) and survival probability.
Facility Characteristics
Facility type. The theoretical, logical, and anecdotal background (e.g., Jenkins & Gupta, 1985) sug-gests that SBP success and survival are more likely in manufacturing than service facilities. The suc-cess of SBP in promoting productivity, flexibility, and cost-effectiveness largely hinges on the facil-ity’s ability to assess current employee skill and capability levels, to develop relevant skill evaluationand certification procedures, and to design and administer training programs that are linked to pay;these tasks are more easily accomplished for manufacturing jobs where the relevant skills are moreconcrete (e.g., machinery operators, welders, etc.) than in service and knowledge occupations (Gupta& Shaw, 2001). Furthermore, employees tend to react more positively to well-defined innovationsthan they do to complicated programs or programs based on more nebulous skill sets (e.g., Davis,1989; Lee et al., 1999). Facilities typically have, or can easily design, training programs for concreteproduction-oriented skills. This is not always the case for knowledge-based skills. Thus, it is easier andsimpler to implement SBP in manufacturing facilities, and productivity, flexibility, and cost-effectiveness should be higher in these settings.
These arguments suggest that SBP plans should last longer in manufacturing facilities. Survivalprobabilities are increased in manufacturing settings for another reason as well, that is, environmentalinfluences. Mimetic pressures result from uncertainty and force organizations to imitate the practicesof other successful entities (DiMaggio & Powell, 1983). Adoption of or compliance with widely dif-fused “successful or best compensation practices” enhances legitimacy (Barringer & Milkovich,1998). To the extent that SBP is entrenched in particular types of organizations or networks, then, thereis likely to be greater pressure for its continued use. SBP is used most often in manufacturing settings, itis more entrenched as a “best practice” in these settings, and the pressures to continue using it shouldthus be stronger in manufacturing than in service and knowledge-based settings. In other words, struc-tural and administrative advantages strengthen mimetic pressures in manufacturing settings,increasing the probability of SBP survival. Thus,
32 Journal of Management / February 2005
at Magrath Library, University of Minnesota Libraries on March 3, 2012jom.sagepub.comDownloaded from

Hypothesis 7: The use of SBP in manufacturing facilities is positively related to SBP success (productivity,flexibility, and cost-effectiveness) and survival probability.
Technical innovation strategy. SBP is often used in conjunction with a variety of other innovations(Jenkins & Gupta, 1985; Lawler & Ledford, 1985). At first blush, it seems reasonable to argue thatSBP success and survival probability are higher in facilities that emphasize technical (product or ser-vice) innovations. But a closer analysis indicates otherwise for at least two reasons. First, SBP necessi-tates the precise specification of skills and skill units. It promotes workforce flexibility, but only in thecontext of precisely defined skills. Such precision is much more feasible when production processesare well understood; it is also more feasible when production processes can be effectively segmentedinto their component elements. Productivity and flexibility gains from SBP may be wiped out if pro-duction or service-delivery technologies are constantly changing. Second, SBP requires considerableinvestment in the definition, training, assessment, maintenance, compensation, and so on of the skillsencompassed in the system (Gupta & Shaw, 2001; Lawler & Ledford, 1985). These decisions must berevamped frequently in facilities seeking new and different types of business or those focusing ontechnical innovations.
Technically innovative facilities have an “aura of fluidity” (Miles & Snow, 1978: 56). The focus ondevelopment of new products and services creates administrative problems due to the need to managecontradictory information flows and constant feedback from experimental actions (Miles & Snow,1978). The use of SBP by facilities using an innovation strategy is thus problematic. As Greve and Tay-lor (2000: 55) noted, innovation may “change the incumbent skills, standard practices, technology,services, and products of the firm” and cause coordination problems when changes in core technolo-gies are required. SBP offers flexibility in the placement of employees and increased efficiency inmanaging a facility’s core technology, but technical innovators undergo continuous change such that“the comparison of levels of efficiency over time becomes difficult and only partially meaningful”(Miles & Snow, 1978: 64). That is, a technical innovation strategy is incompatible with the dictates ofSBP; a stable external and internal environment is necessary to capitalize on skill development andenhancement. Thus,
Hypothesis 8: The use of a technical innovation strategy is negatively related to SBP success (productivity,flexibility, and cost-effectiveness) and survival probability.
The Mediating Role of SBP Success
Productivity, flexibility, and cost-effectiveness and survival can all be considered aspects of overallSBP performance. It is not surprising that theory and related evidence suggest that their determinantsgenerally overlap. Indeed, most research on HRM innovations treats success and survival as parallelperformance outcomes. There is, however, limited but compelling evidence that dimensions we con-sider aspects of success (productivity, flexibility, cost-effectiveness) are related to survival in a causalsequence and that design and contextual factors have both direct and indirect effects on survival (e.g.,Kim, 1999). That is, SBP success is an intermediate outcome, and survival is a distal but perhaps theultimate performance outcome of SBP design and context variables.
Studies of the survival of compensation innovations are rare. In one exception, Kim (1999) foundthat gain-sharing program performance partially mediated the relationship between plan characteris-tics and context on one hand and survival on the other. Partial mediation is also evident in the resultsobtained in single-organization studies by Petty, Singleton, and Connell (1992) and Pritchard, Jones,Roth, Stuebing, and Ekeberg (1988). In both organizations, seemingly successful compensation pro-grams were terminated because contextual factors ultimately affected discontinuation decisions
Shaw et al. / Skill-Based Pay Plans 33
at Magrath Library, University of Minnesota Libraries on March 3, 2012jom.sagepub.comDownloaded from

directly. In light of these issues, SBP design, supervisor/employee support, and facility context shouldhave direct and indirect effects on survival. In addition, success dimensions should partially mediatethe relationship between SBP design characteristics, supervisor/employee support, and facilitycharacteristics on one hand and survival on the other. Thus,
Hypothesis 9a: Productivity gains partially mediate the relationships of SBP design characteristics, supervi-sor/employee support, and facility characteristics with SBP survival over time.
Hypothesis 9b: Flexibility gains partially mediate the relationships of SBP design characteristics, supervisor/employee support, and facility characteristics with SBP survival over time.
Hypothesis 9c: Gains in cost-effectiveness partially mediate the relationships of SBP design characteristics,supervisor/employee support, and facility characteristics with SBP survival over time.
Method
Sample
Data were obtained at two different time periods from facilities using SBP plans. In 1991, we iden-tified facilities using SBP systems through our own research, through professional and consulting con-tacts, through a review of the literature, through secondary information, and through solicitationsplaced in the three consecutive newsletters of the American Compensation Association. In all, 201facilities were identified through these procedures, of which 182 met our sampling criteria—consul-tants and similar others were excluded. Essentially, these 182 facilities encompassed the population ofSBP facilities in existence at that time. Lengthy (28-page) questionnaires were mailed to top humanresource or compensation managers of these facilities. Of these, 97 facilities from 73 companiesresponded (a 53% response rate), providing the first data set. These data are hereafter referred to asTime 1 data. The average age of SBP plans in the sample at Time 1 was 4.48 years. The standard devia-tion of the SBP age variable was 3.69 years, with a range from 1 to 20 years of age.
In 1998, a member of the research team attempted to contact the key informant in all 97 facilitiesresponding in the original study. In cases where the focal individual no longer worked for the companyor had been transferred to an unrelated assignment, we tried to identify the current highest-rankingcompensation or human resource manager to complete the survey. These individuals were asked tocomplete a short (10- to 15-minute) telephone interview about the status of SBP in their facility. In afew cases, the contact individual indicated a preference for completing a written questionnaire. Inthese instances, a substantively identical written survey was sent and returned by mail or fax.Responses were received from 70 of the original 97 responding facilities, representing 72% of theoriginal responses and 35% of the original sample. These data are hereafter referred to as Time 2 data.Of the 70 facilities included in the follow-up study, 43 (61%) still used SBP, and 27 facilities (39%) haddiscontinued the use of SBP. Although the survival rate of HRM innovations is unknown, the SBP sur-vival proportions correspond well to other estimates and reports in the literature (e.g., Drago, 1988;Eaton, 1994; Kochan & Osterman, 1994). A listing of all of the measures is found in the appendix.
Measures—Independent Variables (Time 1)
Focus on skill breadth. This variable was assessed with the item “To what extent does your SBP sys-tem reward skill breadth (skill or knowledge about more than one step in the production or servicedelivery process, such as all jobs within a work team)?” The item had five response options from 1 (notrewarded at all) to 5 (rewards are based solely on this).
34 Journal of Management / February 2005
at Magrath Library, University of Minnesota Libraries on March 3, 2012jom.sagepub.comDownloaded from

Total number of skills in plan. This was operationalized as the number of skill units available in theplan.
Topped-out percentage. This measure was the percentage of employees in the SBP plan who hadreached the maximum possible pay rate.
Employee involvement. A five-item scale was used to assess involvement (α = .79). One itemassessed the level of nonmanagement employee involvement in the development and installation ofthe plan. Response options ranged from 1 (not at all involved) to 7 (very heavily involved). Two itemsassessed the extent to which the employee himself or herself and coworkers had a say in determining ifan employee has completed a skill unit successfully. Response options ranged from 1 (no say at all) to7 (makes final decision). Two additional items assessed the amount of say the employee himself or her-self and the employee’s work group members had in evaluating the ongoing job performance of SBPemployees. Response options ranged from 1 (no say at all) to 7 (a great deal of say). Because theresponse options were different, the item scores were standardized before calculating the mean value.
Supervisor support. This was a three-item measure with seven Likert-type agree/disagree responseoptions (α = .79). The items were the following: “Our supervisors are very supportive of our SBPplan”; “Using SBP has caused many tensions among our supervisors” (reverse coded); and “Oursupervisors don’t like our SBP plan” (reverse coded).
Closeness of supervision. This variable was measured with a two-item scale. One item assessed theextent to which the facility is “characterized by managers monitoring employees’ activities directly”with seven response options ranging from 1 (not at all) to 7 (to a very great extent). The second item(“Close supervision is common throughout this facility”) had seven Likert-type agree/disagreeresponse options. Item scores were standardized before the mean was taken (α = .72).
Facility type. This variable was coded 1 for a manufacturing facility and 0 for a service facility.
Technical innovation strategy. This variable was a three-item scale (α = .72) that assessed the extentto which the business strategy of the facility was to develop new products and/or services, to provideunique products and services, and to develop new markets. The items had seven response options from1 (not at all) to 7 (to a very great extent).
Measures—Dependent Variables (Time 1)
Productivity success. A four-item scale was used (α = .81). Two items assessed the extent to whichthe SBP plan had been successful in achieving increased output per hour worked and fewer bottle-necks in production or service delivery. The item had response options from 1 (not at all) to 7 (to a verygreat extent). Two items assessed productivity and output per hour worked compared to non-SBPfacilities similar to the focal facility. These items had response options from 1 (ours are much worse) to5 (ours are much better). They were standardized before the mean was taken.
Flexibility success. This variable was a six-item measure about the extent to which the SBP plan hadbeen successful in achieving greater workforce flexibility, more flexibility in job assignments,increased employee versatility, greater adaptability of employees to changing production needs,increased effectiveness of work teams, and better use of work technology (α = .92). The items hadresponse options from 1 (not at all) to 7 (to a very great extent).
Shaw et al. / Skill-Based Pay Plans 35
at Magrath Library, University of Minnesota Libraries on March 3, 2012jom.sagepub.comDownloaded from

Cost-effectiveness success. A four-item scale with response options from 1 (ours are much worse)to 5 (ours are much better) was used. The items assessed unit production/service delivery costs, laborcosts per unit of production or service, nonlabor costs per unit of production or service, and adminis-trative costs compared to non-SBP facilities similar to the focal facility (α = .83).
Measures—Dependent Variables (Time 2)
Because the telephone interview at Time 2 was short and designed to elicit a very high number ofthe responses from the original participants, abbreviated operationalizations of the success dimen-sions that were tailored to a telephone context were used. Whereas the Time 1 measures were averagesof specific aspects of the conceptual variables, Time 2 measures were designed to capture the sameconceptual space with a more global orientation because of space and time constraints. All successitems at Time 2 had 11 (0-10) response options.
Productivity success. A two-item scale that tapped how successful the SBP plan was/is in terms ofimproving employee motivation and improving employee performance was used (α = .74).
Flexibility success. A single item was used. The item assessed the extent to which the SBP plan did/does encourage the development of flexible skills.
Cost-effectiveness success. This variable was measured with two items (α = .70). The first item con-cerned the extent to which the pay rates in the SBP plan creates/created problems with respect to paycosts; the second item assessed whether the SBP plan led to much lower or much higher pay rates thanthose in the local labor market. Because the anchors for the response options were different, theseitems were standardized prior to taking the mean. This measure was reverse scored such that highervalues indicate greater cost-effectiveness.
Survival. A dichotomous variable assessed at Time 2 was used. Facilities with surviving SBP planswere coded 1, and those that had abandoned SBP were coded 0.
Control Variable
We controlled for facility size, operationalized as the natural log of the total number of employeesin the facility at Time 1. Although the conceptual foundation for a relationship between size and SBPplan success and survival is unclear, facility size may be related to the adoption of innovations as wellas performance in general and should be controlled.
Results
Response Bias Check
Characteristics of organizations that did not participate in the Time 2 data collection may be differ-ent from those that did participate. It was therefore necessary to assess the extent to which responsebias may have influenced the results of this study. Of particular importance is the possibility that non-participating organizations discontinued their SBP plans at a greater rate than those who participatedat Time 2. Although we could not address this issue directly, it was possible to compare organizations
36 Journal of Management / February 2005
at Magrath Library, University of Minnesota Libraries on March 3, 2012jom.sagepub.comDownloaded from

that participated only at Time 1 (n = 27) with those participating longitudinally (n = 70) on all the inde-pendent variables included in the study. Following Shaw, Delery, Jenkins, and Gupta (1998), we ran alogistic regression analysis to test for potential differences. The dependent variable was coded 1 if theorganization participated at Time 2 and 0 otherwise. The independent variables were the control andsubstantive variables from Time 1 described above. None of the differences were significant. Thus,although we cannot speak to the rate of discontinuation among the nonresponding organizations, nosystematic differences appeared between responding and nonresponding organizations.
Analysis and Results
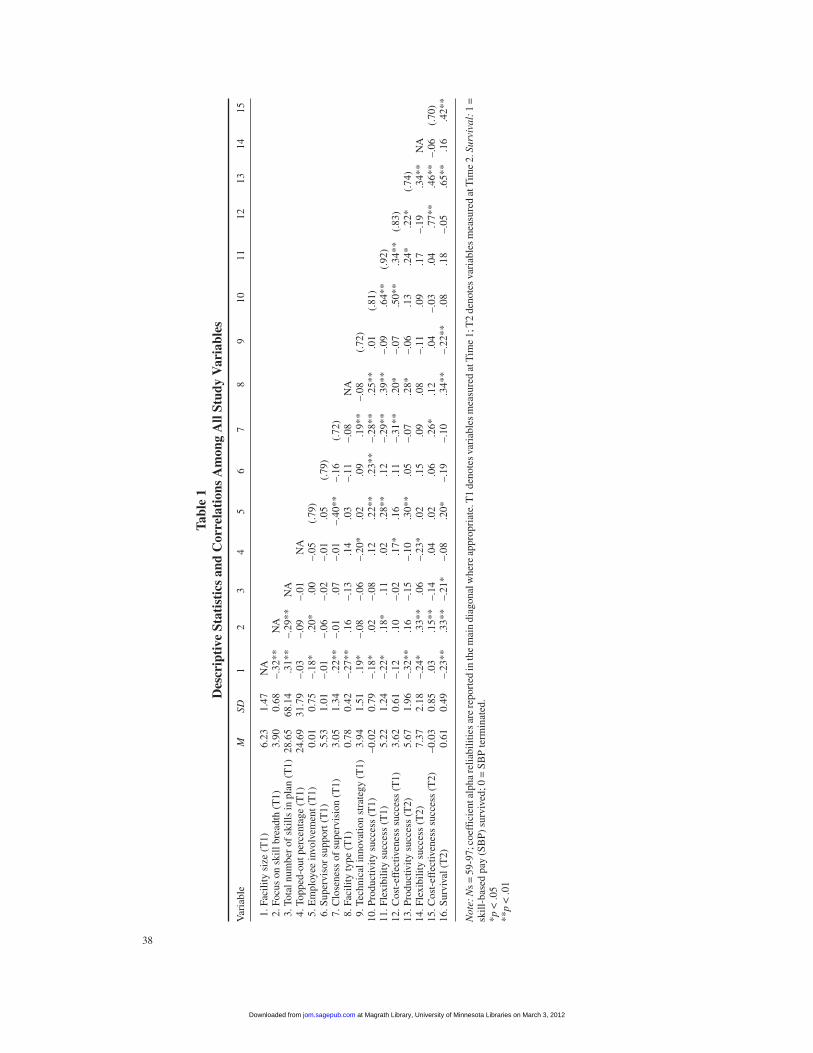
Descriptive statistics for, and correlations among, the variables in the study are shown in Table 1.Coefficient alpha reliability estimates are shown in the main diagonal where appropriate. Table 2 con-tains the results of the regression analyses. We used ordinary least squares regression when the threesuccess dimensions (productivity, flexibility, cost-effectiveness) from Time 1 and Time 2 were thedependent variables and logistic regression when survival was the dependent variable. We reportthe coefficients in the full model, as well as model statistics for the full model and the step beyond thefacility size control.
SBP Design Characteristics (Hypotheses 1-3)
Hypothesis 1 received some support. A greater focus on skill breadth was related to Time 1 SBPflexibility success (β = .15, p < .10), Time 2 flexibility success (β = .47, p < .01), and to survival (b =1.34, p < .05). The Exp(b) or the odds ratio for the significant coefficients in the survival equation pro-vides an estimate of the odds of survival for a unit change in the independent variable, holding constantall other predictors. The likelihood of survival was almost four times greater (Exp[b] = 3.92) for eachunit increase in the focus-on-skill-breadth variable.
Hypothesis 2 predicted a positive relationship between total number of skills and productivity suc-cess, flexibility success, and survival and a negative relationship with cost-effectiveness. This variablewas strongly related to Time 1 flexibility success (β = .24, p < .01) and also to survival (b = .01, p <.10). An additional skill in the program increases the odds of survival by 1% (Exp[b] = 1.01). Totalskills were not related to Time 2 flexibility success or productivity or cost-effectiveness success ineither time period. Thus, Hypothesis 2 is partly supported.
Hypothesis 3 concerned topped-out percentage and was not supported. Topped-out percentagewas related to only one of the seven outcome variables—Time 2 flexibility success. Contrary to expec-tations, the relationship between topped-out percentage and flexibility success at Time 2 was negative(β = –.36, p < .01).
Supervisor/Employee Support (Hypotheses 4-6)
Hypothesis 4 (dealing with employee involvement) received moderate support. Employee involve-ment in SBP was positively related to Time 1 flexibility success (β = .22, p < .05), Time 2 productivitysuccess (β = .42, p < .01), Time 2 flexibility success (β = .24, p < .10), and survival probability (b =1.11, p < .05). A positive unit change in employee involvement was estimated to be associated with athree times greater likelihood of SBP survival (Exp[b] = 3.02).
Hypothesis 5 concerning supervisor support received some support. Supervisor support for SBP waspositively associated with productivity success (β = .23, p < .05) and flexibility success (β = .16, p < .05)
Shaw et al. / Skill-Based Pay Plans 37
at Magrath Library, University of Minnesota Libraries on March 3, 2012jom.sagepub.comDownloaded from
38
Tabl
e 1
Des
crip
tive
Sta
tist
ics
and
Cor
rela
tion
s A
mon
g A
ll St
udy
Var
iabl
es
Var
iabl
eM
SD1
23
45
67
89
1011
1213
1415
1. F
acili
ty s
ize
(T1)
6.23
1.47
NA
2. F
ocus
on
skill
bre
adth
(T
1)3.
900.
68–.
32**
NA
3. T
otal
num
ber
of s
kills
in p
lan
(T1)
28.6
568
.14
.31*
*–.
29**
NA
4. T
oppe
d-ou
t per
cent
age
(T1)
24.6
931
.79
–.03
–.09
–.01
NA
5. E
mpl
oyee
invo
lvem
ent (
T1)
0.01
0.75
–.18
*.2
0*.0
0–.
05(.
79)
6. S
uper
viso
r su
ppor
t (T
1)5.
531.
01–.
01–.
06–.
02–.
01.0
5(.
79)
7. C
lose
ness
of
supe
rvis
ion
(T1)
3.05
1.34
.22*
*–.
01.0
7–.
01–.
40**
–.16
(.72
)8.
Fac
ility
type
(T
1)0.
780.
42–.
27**
.16
–.13
.14
.03
–.11
–.08
NA
9. T
echn
ical
inno
vatio
n st
rate
gy (
T1)
3.94
1.51
.19*
–.08
–.06
–.20
*.0
2.0
9.1
9**
–.08
(.72
)10
. Pro
duct
ivity
suc
cess
(T
1)–0
.02
0.79
–.18
*.0
2–.
08.1
2.2
2**
.23*
*–.
28**
.25*
*.0
1(.
81)
11. F
lexi
bilit
y su
cces
s (T
1)5.
221.
24–.
22*
.18*
.11
.02
.28*
*.1
2–.
29**
.39*
*–.
09.6
4**
(.92
)12
. Cos
t-ef
fect
iven
ess
succ
ess
(T1)
3.62
0.61
–.12
.10
–.02
.17*
.16
.11
–.31
**.2
0*–.
07.5
0**
.34*
*(.
83)
13. P
rodu
ctiv
ity s
ucce
ss (
T2)
5.67
1.96
–.32
**.1
6–.
15–.
10.3
0**
.05
–.07
.28*
–.06
.13
.24*
.22*
(.74
)14
. Fle
xibi
lity
succ
ess
(T2)
7.37
2.18
–.24
*.3
3**
.06
–.23
*.0
2.1
5.0
9.0
8–.
11.0
9.1
7–.
19.3
4**
NA
15. C
ost-
effe
ctiv
enes
s su
cces
s (T
2)–0
.03
0.85
.03
.15*
*–.
14.0
4.0
2.0
6.2
6*.1
2.0
4–.
03.0
4.7
7**
.46*
*–.
06(.
70)
16. S
urvi
val (
T2)
0.61
0.49
–.23
**.3
3**
–.21
*–.
08.2
0*–.
19–.
10.3
4**
–.22
**.0
8.1
8–.
05.6
5**
.16
.42*
*
Not
e:N
s=
59-9
7;co
effi
cien
talp
hare
liabi
litie
sar
ere
port
edin
the
mai
ndi
agon
alw
here
appr
opri
ate.
T1
deno
tes
vari
able
sm
easu
red
atT
ime
1;T
2de
note
sva
riab
les
mea
sure
dat
Tim
e2.
Surv
ival
:1=
skill
-bas
edpa
y(S
BP)
surv
ived
;0=
SBP
term
inat
ed.
*p<
.05
**p
< .0
1
at Magrath Library, University of Minnesota Libraries on March 3, 2012jom.sagepub.comDownloaded from

39
Tabl
e 2
OL
S an
d L
ogis
tic
Reg
ress
ion
Res
ults
for
Skill
-Bas
ed P
ay S
ucce
ss (
Tim
e 1
and
Tim
e 2)
and
Sur
viva
l (T
ime
2)
Tim
e 1
Succ
ess
Mea
sure
sT
ime
2 Su
cces
s M
easu
res
Tim
e 2
Prod
uctiv
ityFl
exib
ility
Cos
t-E
ffec
tiven
ess
Prod
uctiv
ityFl
exib
ility
Cos
t-E
ffec
tiven
ess
Surv
ival
ββ
ββ
ββ
Con
trol
Faci
lity
size
(T
1)–.
06–.
05.0
4–.
29*
–.16
.11
.10
SBP
desi
gn c
hara
cter
istic
sFo
cus
on b
read
th s
kills
(T
1)–.
04.1
5†.1
2.0
1.4
7**
.18
1.34
*To
tal n
umbe
r of
ski
lls in
pla
n (T
1)–.
02.2
4**
.05
–.01
.11
–.11
.01†
Topp
ed-o
ut p
erce
ntag
e (T
1).0
7.0
5.1
3.0
3–.
36**
.07
–.01
Supe
rvis
or/e
mpl
oyee
sup
port
Em
ploy
ee in
volv
emen
t (T
1).1
1.2
2*.0
4.4
2**
.24†
.17
1.11
*Su
perv
isor
sup
port
(T
1).2
3*.1
6*.0
7.1
6†.3
4*.1
5–.
33M
onito
ring
(T
1)–.
17†
–.18
*–.
32**
.24*
.28*
.38*
*–.
24Fa
cilit
y ch
arac
teri
stic
sFa
cilit
y ty
pe (
T1)
.25*
*.4
0**
.14†
.30*
*.2
5*.0
62.
34**
Tech
nica
l inn
ovat
ion
stra
tegy
(T
1).0
6–.
02.0
1–.
02.0
5.0
4–.
36*
Mod
el s
tatis
tics
Tota
lR2
(χ2 )
.20∗
∗.3
3∗∗
.16∗
.31∗
∗.3
7∗∗
.21
27.5
8∗∗
∆R2
(χ2 )
(bey
ond
cont
rol)
.17*
*.2
9**
.15*
.21*
.31*
*.2
022
.86*
*
Not
e:N
=97
fort
heT
ime
1pr
oduc
tivity
,fle
xibi
lity,
and
cost
-eff
ectiv
enes
ssuc
cess
equa
tions
;N=
59fo
rthe
Tim
e2
prod
uctiv
ity,f
lexi
bilit
y,an
dco
st-e
ffec
tiven
esss
ucce
sseq
uatio
ns;a
ndN
=70
fort
hesu
rviv
aleq
uatio
n.O
rdin
ary
leas
tsqu
ares
regr
essi
ons(
OL
S)us
edfo
rthe
Tim
e1
and
Tim
e2
succ
esse
quat
ions
,and
logi
stic
regr
essi
onus
edfo
rthe
Tim
e2
surv
ival
equa
tion.
Stan
dard
ized
regr
essi
onco
effi
cien
ts(β
)are
show
nfo
rthe
OL
Seq
uatio
ns.U
nsta
ndar
dize
dre
gres
sion
coef
fici
ents
(b)a
resh
own
fort
hesu
rviv
aleq
uatio
n.To
tale
xpla
ined
vari
ance
and
expl
aine
dva
rian
ceby
the
hypo
thes
ized
vari
able
sare
the
mod
elst
atis
tics
fort
hesu
cces
seq
uatio
ns.T
otal
and
bloc
k-ch
ange
chi-
squa
rest
atis
tics
are
repo
rted
fort
helo
gist
icre
gres
sion
swhe
nsu
rviv
alis
the
depe
nden
tva
riab
le.
†p<
.10
*p<
.05
**p
< .0
1
at Magrath Library, University of Minnesota Libraries on March 3, 2012jom.sagepub.comDownloaded from
at Time 1 and at Time 2 (productivity success: β = .16, p < .10; flexibility success: β = .34, p < .01).Supervisor support was not significantly related to either measure of cost-effectiveness success or tothe probability of survival.
The results for Hypothesis 6—closeness of supervision—were inconsistent. This hypothesisreceived strong support for Time 1 success, that is, closer supervision was negatively related to Time 1productivity success (β = –.17, p < .10), Time 1 flexibility success (β = –.18, p < .05), and stronglyrelated to Time 1 cost-effectiveness success (β = –.32, p < .01). At Time 2, however, the direction of therelationship between closeness of supervision and success was positive. Closer supervision was posi-tively related to Time 2 productivity success (β = .24, p < .05), Time 2 flexibility success (β = .28, p <.05), and to Time 2 cost-effectiveness success (β = .38, p < .01). Closeness of supervision wasunrelated to survival.
Facility Characteristics (Hypotheses 7-8)
Hypothesis 7 predicted that manufacturing facilities would experience greater success and havehigher SBP survival probabilities. This hypothesis was strongly supported. Facility type (manufactur-ing facility scored higher) was positively related to each Time 1 success measure (productivity: β =.25, p < .01; flexibility: β = .40, p < .01; cost-effectiveness: β = .14, p < .10). Facility type was alsorelated to Time 2 productivity success (β = .30, p < .01) and flexibility success (β = .25, p < .05), but notto Time 2 cost-effectiveness success (β = .06, n.s.). Facility type was strongly related to the probabilityof survival (b = 2.34, p < .01), such that the probability of survival of SBP was 10 times greater inmanufacturing facilities (Exp[b] = 10.11).
Hypothesis 8 concerned technical innovation strategy. It was supported only for SBP survival, thatis, the use of technical innovation strategy was not significantly related to any of the success dimen-sions. There was a significant negative relationship, however, between technical innovation strategyand survival (b = –.36, p < .05), such that the odds of survival were estimated to decrease by 30%(Exp[b] = .70) for every unit increase in the strategy variable.
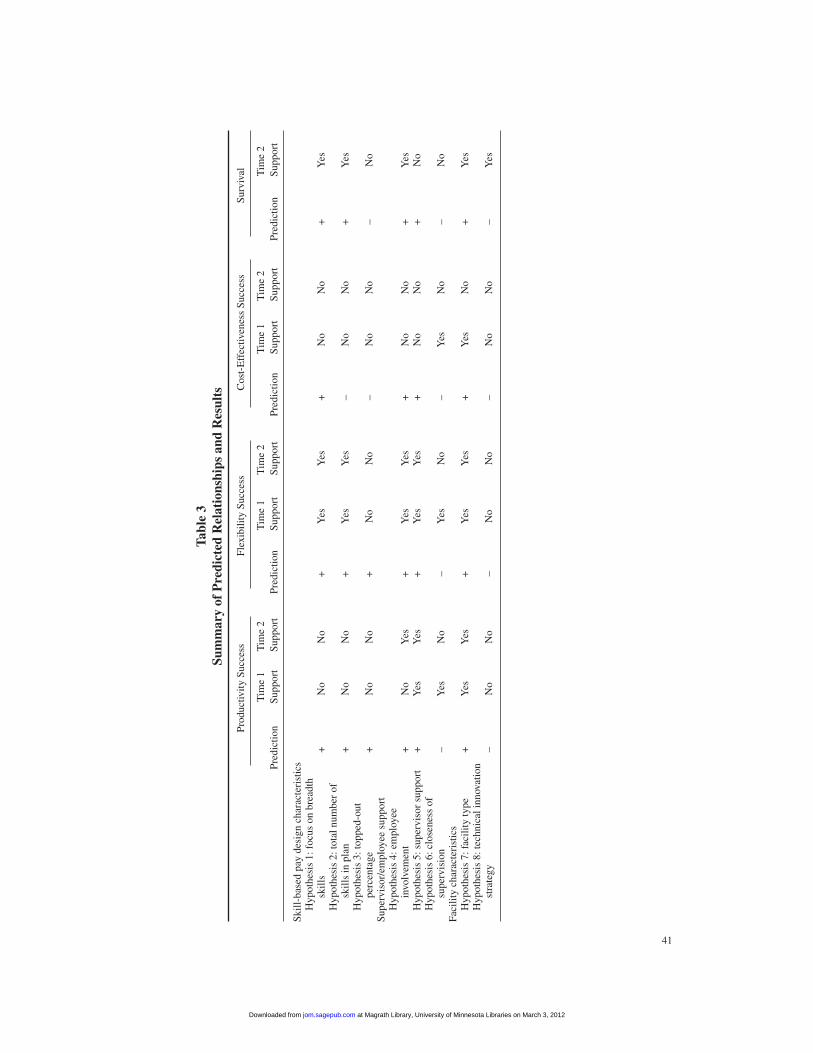
Summary
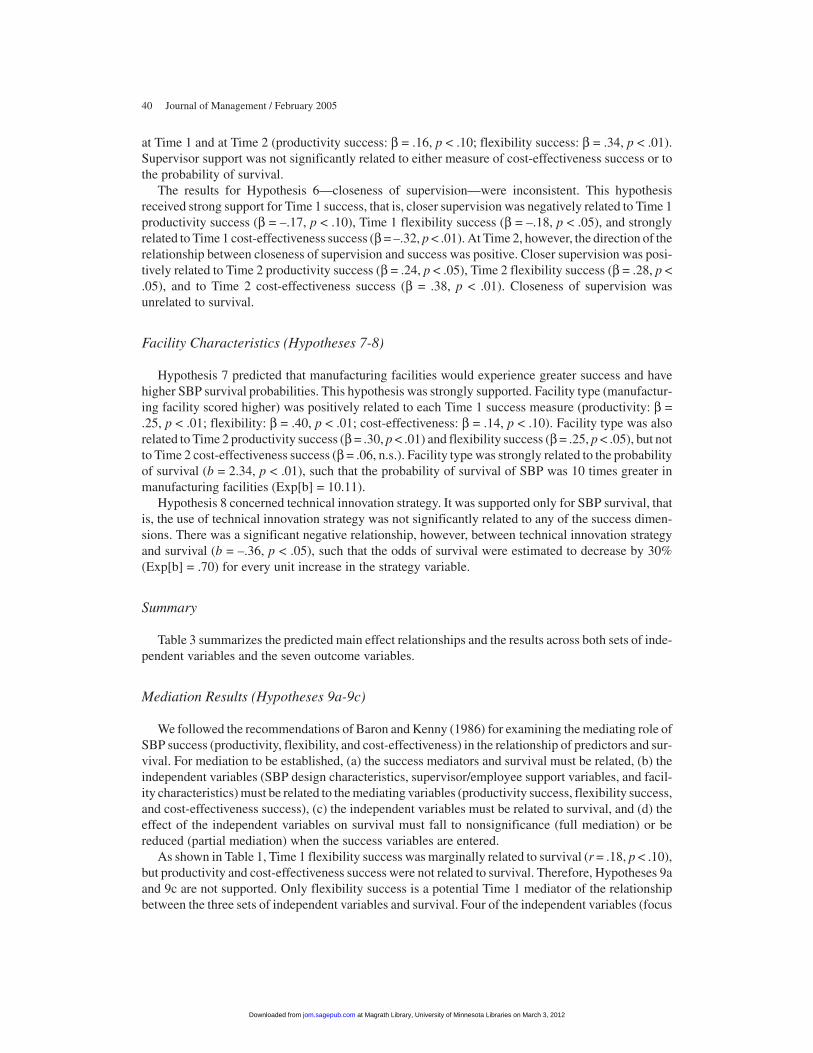
Table 3 summarizes the predicted main effect relationships and the results across both sets of inde-pendent variables and the seven outcome variables.
Mediation Results (Hypotheses 9a-9c)
We followed the recommendations of Baron and Kenny (1986) for examining the mediating role ofSBP success (productivity, flexibility, and cost-effectiveness) in the relationship of predictors and sur-vival. For mediation to be established, (a) the success mediators and survival must be related, (b) theindependent variables (SBP design characteristics, supervisor/employee support variables, and facil-ity characteristics) must be related to the mediating variables (productivity success, flexibility success,and cost-effectiveness success), (c) the independent variables must be related to survival, and (d) theeffect of the independent variables on survival must fall to nonsignificance (full mediation) or bereduced (partial mediation) when the success variables are entered.
As shown in Table 1, Time 1 flexibility success was marginally related to survival (r = .18, p < .10),but productivity and cost-effectiveness success were not related to survival. Therefore, Hypotheses 9aand 9c are not supported. Only flexibility success is a potential Time 1 mediator of the relationshipbetween the three sets of independent variables and survival. Four of the independent variables (focus
40 Journal of Management / February 2005
at Magrath Library, University of Minnesota Libraries on March 3, 2012jom.sagepub.comDownloaded from
41
Tabl
e 3
Sum
mar
y of
Pre
dict
ed R
elat
ions
hips
and
Res
ults
Prod
uctiv
ity S
ucce
ssFl
exib
ility
Suc
cess
Cos
t-E
ffec
tiven
ess
Succ
ess
Surv
ival
Tim
e 1
Tim
e 2
Tim
e 1
Tim
e 2
Tim
e 1
Tim
e 2
Tim
e 2
Pred
ictio
nSu
ppor
tSu
ppor
tPr
edic
tion
Supp
ort
Supp
ort
Pred
ictio
nSu
ppor
tSu
ppor
tPr
edic
tion
Supp
ort
Skill
-bas
ed p
ay d
esig
n ch
arac
teri
stic
sH
ypot
hesi
s 1:
foc
us o
n br
eadt
hsk
ills
+N
oN
o+
Yes
Yes
+N
oN
o+
Yes
Hyp
othe
sis
2: to
tal n
umbe
r of
skill
s in
pla
n+
No
No
+Y
esY
es–
No
No
+Y
esH
ypot
hesi
s 3:
topp
ed-o
utpe
rcen
tage
+N
oN
o+
No
No
–N
oN
o–
No
Supe
rvis
or/e
mpl
oyee
sup
port
Hyp
othe
sis
4: e
mpl
oyee
invo
lvem
ent
+N
oY
es+
Yes
Yes
+N
oN
o+
Yes
Hyp
othe
sis
5: s
uper
viso
r su
ppor
t+
Yes
Yes
+Y
esY
es+
No
No
+N
oH
ypot
hesi
s 6:
clo
sene
ss o
fsu
perv
isio
n–
Yes
No
–Y
esN
o–
Yes
No
–N
oFa
cilit
y ch
arac
teri
stic
sH
ypot
hesi
s 7:
faci
lity
type
+Y
esY
es+
Yes
Yes
+Y
esN
o+
Yes
Hyp
othe
sis
8: te
chni
cal i
nnov
atio
nst
rate
gy–
No
No
–N
oN
o–
No
No
–Y
es
at Magrath Library, University of Minnesota Libraries on March 3, 2012jom.sagepub.comDownloaded from

on skill breadth, total number of skills in plan, employee involvement, and facility type) are commoncorrelates of flexibility success and survival. To examine whether Time 1 flexibility success mediatedthe relationship, we conducted an additional logistic regression analysis with survival as the dependentvariable and the set of four independent variables (and a facility size control) as predictors in Step 1and flexibility success in Step 2. In this analysis, the strengths of the relationships between these fourpredictors and survival were not attenuated by the addition of flexibility success on the final step.Thus, there was no evidence that Time 1 success measures mediated the relationship between thepredictors and survival. Hypothesis 9b is not supported.
We also examined whether the Time 2 success measures provided any evidence of mediationbetween the predictors and survival. Table 1 shows that productivity success (r = .69, p < .01) and cost-effectiveness success (r = .42, p < .01) measured at Time 2 were related to survival, although cost-effectiveness success and survival share no common predictors. Two predictors, employee involve-ment and facility type, were related to Time 2 productivity success and survival. In a logistic regressionwith survival as the dependent variable, the relationship between employee involvement and survivalwas not significant when Time 2 productivity success was entered into the equation. In general, therewas virtually no support for Hypotheses 9a-9c, that is, mediation of the success variables, across theTime 1 and Time 2 measurements of these variables.
Discussion
The popularity of SBP plans continues to mushroom, but the body of research evidence regardingits effectiveness across contexts lags far behind its use in practice. This study adds to the nascent bodyof knowledge by providing insights into the success and survival of SBP plans. Our theoretical frame-work and empirical test, taken together, show that (a) contextual variables (supervisor/employee sup-port and facility characteristics) are fairly consistent predictors of SBP success and survival; (b) SBPdesign characteristics are strong predictors of flexibility success and survival, but not of productivitysuccess and cost-effectiveness success; and (c) SBP success does not seem to mediate the relationshipof design and contextual factors to survival over time. The implications of these findings are addressedbelow.
Contextual Effects—Facility Characteristics andSupervisor/Employee Support
SBP scholars argue that specific design features (e.g., number of skill units) are less important foreffectiveness than are the contextual factors within which an SBP plan is embedded (Gupta & Shaw,2001; Jenkins et al., 1992). Our results are not definitive, but they do show that facility characteristicsand supervisor/employee support variables are consistently related to success outcomes, especially toproductivity success and cost-effectiveness success. The most consistent predictor of SBP success wasfacility type. Manufacturing settings simplify design and implementation issues, and thus, SBP use inservice settings may need to be undertaken with even greater care and support than the use of SBP inmanufacturing settings.
Our predictions regarding technical innovation strategy were supported only for survival. Theseresults are interesting given the propensity of innovative organizations to adopt SBP plans (Jenkins &Gupta, 1985). SBP plans may be successful in some ways in both technically innovative andnoninnovative organizations in the short term. Over time, however, ambiguities inherent in SBP sys-tems can exacerbate the ambiguities inherent in technical innovations, necessitating that either thetechnical or the HRM innovation be terminated.
42 Journal of Management / February 2005
at Magrath Library, University of Minnesota Libraries on March 3, 2012jom.sagepub.comDownloaded from

Our predictions regarding supervisor support were verified empirically for two outcomes—pro-ductivity and flexibility success—at both time periods, but not for cost-effectiveness success or sur-vival. Supervisory support has been emphasized repeatedly in the SBP literature (Gupta et al., 1986,1992; Jenkins & Gupta, 1985); its relationship to productivity and flexibility validates this emphasis.Surprisingly, supervisory support is unrelated to cost-effectiveness or survival. Perhaps the costs ofachieving supervisor support are high. Indeed, for supervisors to function effectively in SBP settingsoften necessitates training in human relations, interpersonal, and similar skills. These costs couldcounterbalance SBP benefits. Likewise, survival is likely determined by many factors, to whichsupervisory support may contribute only marginally.
The predictions regarding closeness of supervision were supported for all three Time 1 outcomes;however, contrary to expectation, closeness of supervision was positively related to success measuresat Time 2. The inconsistency between synchronous and longitudinal effects is puzzling. The synchro-nous results, which conform to prediction, are easily explicable in terms of consistency between HRMsystems and work design (Shaw, Gupta, & Delery, 2001). The contradictory findings might be tracedto the different operationalizations of our cost-effectiveness measures at Time 1 and Time 2. It is alsopossible that changes in the SBP plans between our measurements were not captured effectively. Wehope that researchers will examine these issues more thoroughly in the future.
SBP Design Characteristics
The SBP design characteristics results are mixed. The pattern in Table 3 highlights two majorissues—(a) design characteristics tended to relate to flexibility success and survival, but not to produc-tivity and cost-effectiveness success, and (b) focus on skill breadth and the total number of skills in theplan were much more consistent predictors than topped-out percentage.
That productivity and cost-effectiveness success are less consistently related to SBP design charac-teristics than flexibility success is noteworthy. Obviously, companies design HRM systems that areintended to promote productivity and profit. They incorporate different kinds of design elements underdifferent conditions to meet these goals. The same design element may thus be effective in some set-tings but not in others. This is consistent with the argument that a “cookie-cutter” approach to SBPdesign is fruitless—SBP plans must be specifically tailored to meet specific organizational dictatesand constraints (Gupta & Shaw, 2001). Despite this, a plan incorporating breadth skills is likely toengender a multiskilled workforce. These arguments encourage careful consideration of the outcomessought by a given innovation (e.g., flexibility) as opposed to outcomes almost universally sought byinnovations in general (e.g., productivity).
Our hypotheses regarding focus on skill breadth and total skills were supported for flexibility suc-cess and survival, but topped-out percentage was not significantly related. That topped-out percentagewas unrelated to outcome measures is interesting, but an examination of Table 1 offers a clue. On aver-age, only about one quarter of the employees were topped out. Topped-out percentage is likely tobecome problematic, not when only some employees are topped out, but when many employees aretopped out. Our measure may suffer from range restriction in that many SBP plans were still relativelyyoung (about 4 years old on average) at the Time 1 data collection point (when predictor measureswere obtained). Topped-out percentage may be of concern only at higher levels of topping out. Thisissue merits further investigation as SBP plans mature.
Mediating Role of SBP Success
We predicted that the relationship of SBP design and context to survival would be partially medi-ated by the success dimensions. This hypothesis was not supported. Survival did bear strong zero-
Shaw et al. / Skill-Based Pay Plans 43
at Magrath Library, University of Minnesota Libraries on March 3, 2012jom.sagepub.comDownloaded from

order correlations with both productivity success and cost-effectiveness success (but not flexibilitysuccess) at Time 2, confirming intuitive assumptions. Still, logically, one would expect that, at least tosome extent, SBP design and context would lead to success outcomes, which in turn would promoteretention of SBP. This was not the case in the empirical analysis, although, in open-ended responses,some facilities did report this chain. So why were the results not supportive?
Two relatively straightforward explanations come to mind immediately. One, of course, is that themediation effect may be theoretically appealing but does not occur in actuality. The second is that oursmall sample did not possess the statistical power to demonstrate complex effects. Furthermore, thereare many reasons why facilities could discontinue SBP use. In some open-ended responses at Time 2, afew respondents elaborated on reasons for termination—that the plan was too complex, that there weretechnological changes, that the plan was not cost-effective, and so on. Reasons for termination weregiven by only a few respondents, and thus we were unable to analyze these statistically. But facilitiesthat terminate SBP due to a merger are likely to display different dynamics than those that terminateSBP due to excessive complexity, for example. It may also be, however, that our theoretical perspec-tive was limited. There is likely to be a complex network of dynamics between specific success out-comes and survival. For instance, employees could be quite productive and flexible, but external fac-tors such as a merger or changes in management necessitate SBP termination. To understand thiscomplex interplay, it is necessary to develop a more comprehensive theoretical framework.
Implications
This study has broader implications for compensation and HRM systems in general. First, it rein-forces the idea that detailed specifics of an innovation in isolation are not the sole predictors of successand survival; rather, the care with which these details are designed, the commitment with which theyare implemented, and the extent of their fit with the organizational context relate to the success of suchinnovations. This issue is highlighted elsewhere (Gupta et al., 1992; Jenkins et al., 1992).
Beyond this, the study also highlights the nuanced nature of compensation system effects. Practi-tioner-oriented publications, for example, often debate the merits of merit pay or the importance (orlack thereof) of financial incentives (Gupta & Shaw, 1998; Kohn, 1998). What our study underscores,however, is that within-organization variations in compensation approaches are also critical. It is notsimply whether a particular compensation system (in our case SBP) is used. Rather, it is the specificcharacteristics within that broad compensation approach that predict effectiveness. The use of SBPwas a constant in our sample, yet there were many variations in SBP dynamics. It would be misleadingfor us to argue, with no qualifications, that SBP is effective (although many facilities reported suc-cess). It is the particular way that the system is operationalized and implemented and the particular fitof the plan within the organizational context that are critical. We hope that this study leads us towardthe adoption of more nuanced approaches to compensation and HRM dynamics.
Second, our results are also illustrative of the broader-ranging phenomena of administrative inno-vations and organizational change. Worthy of note here is the validation of the counterintuitivehypothesis that SBP plans are less likely to survive in organizations following a technically innovativestrategy. This result is particularly interesting in light of the discussion in the literature about the pro-pensity of innovative plants to adopt SBP plans (e.g., Jenkins & Gupta, 1985). However, a carefulexamination of this literature reveals that when innovative organizations are discussed in the manage-ment literature, the focus is often on other administrative innovations—employee empowerment, sur-vey feedback, job enrichment, self-managed teams, and so on. Rarely do these innovations addresstechnological issues. It is hardly surprising, then, that when the entire organizational technologydemands flexibility, SBP with its precisely defined skills, skill blocks, progressions, and so forth,would be problematic. Some administrative innovations (such as SBP) mandate stability in the techni-
44 Journal of Management / February 2005
at Magrath Library, University of Minnesota Libraries on March 3, 2012jom.sagepub.comDownloaded from

cal core, but other administrative innovations could indeed support the demands of technicalinnovations.
Limitations and Conclusions
The limitations of this study should be addressed in future research. The data were obtainedthrough key informant reports, and the reliability and accuracy of these reports are a subject of consid-erable debate in the management literature (e.g., Wright, Gardner, Moynihan, Park, Gerhart, & Delery,2001). Common method variance and consistency effects could have biased our results, especially inthe cross-sectional analyses. Our sample size was quite small, and some of the hypothesized relation-ships failed to reach significance perhaps due to low statistical power. In addition, although dataobtained at two time periods were a strength of the study, the length of time between these data collec-tion efforts, our dichotomous definition of survival, and the possibility that the SBP plan underwentsignificant changes in the interim may limit the detection of complex effects.
Our inclusion of SBP design variables was necessarily limited. Of particular concern here is thatSBP plans have many features and can be described on many other dimensions than the three designcharacteristics included in this study. Although we found strong support for the manufacturing versusservice facility predictions, our dichotomous categorization was coarse. Measuring the difficulty indefining skills and developing certification systems for them, rather than assuming that these differ-ences covary perfectly with facility type, would be a substantial step forward. Because of space andtime constraints, we used different operationalizations of the Time 2 success constructs and had sev-eral single-item measures in our study. The ability to assess reliability for all measures and consistencyof measurement across time periods are issues that should be addressed in future research.
In sum, this study represents one of the first comprehensive examinations of SBP systems. It vali-dates some commonly held beliefs about SBP—that design and context affect success andsustainability. It also offers some new insights, for example, with respect to success and survivaldynamics. Thus, this study is a beginning that, we hope, leads to more comprehensive innovationresearch in the future.
APPENDIXVariable List and Time Period Collected
Independent Variables (Time 1)
Focus on breadth skills (Hypothesis 1)To what extent does your skill-based pay (SBP) system reward skill breadth (skill or knowledge about morethan one step in the production or service delivery process, such as all jobs within a work team)? (1 = notrewarded at all, 5 = rewards based solely on this)
Total number of skills in plan (Hypothesis 2)How many skill units does your SBP plan include?
Topped-out percentage (Hypothesis 3)Approximately what percentage of employees on the SBP plan has reached the maximum possible pay rate?
Employee involvement (Hypothesis 4)How involved were employees in the development and installation of your SBP plan? (1 = not at all involved,7 = very heavily involved)
Shaw et al. / Skill-Based Pay Plans 45
at Magrath Library, University of Minnesota Libraries on March 3, 2012jom.sagepub.comDownloaded from

How much say do the following people have in determining if an employee has completed a skill unit success-fully? (1 = no say at all, 7 = makes final decision)
The employeeCoworkers
How much say do the following have in evaluating the ongoing job performance of SBP employees? (1 = nosay at all, 7 = a great deal of say)
Employee himself or herselfEmployee’s work group members
Supervisor support (Hypothesis 5)Our supervisors are very supportive of our SBP plan. (1 = strongly disagree, 7 = strongly agree)Using SBP has caused many tensions among our supervisors. (1 = strongly disagree, 7 = strongly agree;reverse coded)Our supervisors don’t like our SBP plan. (1 = strongly disagree, 7 = strongly agree; reverse coded)
Closeness of supervision (Hypothesis 6)To what extent is your facility characterized by managers monitoring employees’activities directly? (1 = not atall, 7 = to a very great extent)Close supervision is common throughout this facility. (1 = strongly disagree, 7 = strongly agree)
Facility type (Hypothesis 7)1 = manufacturing facility, 0 = service facility
Technical innovation strategy (Hypothesis 8)To what extent is the business strategy of your facility to develop new products and/or services? (1 = not at all,7 = to a very great extent)To what extent is the business strategy of your facility to provide unique products and services? (1 = not at all,7 = to a very great extent)To what extent is your facility currently characterized by the development of new markets? (1 = not at all, 7 = toa very great extent)
Dependent Variables (Time 1 and Time 2)
Productivity success (Time 1)To what extent has your SBP plan been successful in achieving increased output per hour worked? (1 = not atall, 7 = to a very great extent)To what extent has your SBP plan been successful in achieving fewer bottlenecks in production of servicedelivery? (1 = not at all, 7 = to a very great extent)Compared to non-SBP facilities similar to yours, have your facility’s experiences in the following areas beenbetter, worse, or about the same? (1 = ours are much worse, 5 = ours are much better)
ProductivityOutput per hour worked
Flexibility success (Time 1)To what extent has your SBP plan been successful in achieving greater workforce flexibility? (1 = not at all, 7 =to a very great extent)To what extent has your SBP plan been successful in achieving more flexibility in job assignments? (1 = not atall, 7 = to a very great extent)To what extent has your SBP plan been successful in achieving increased employee versatility? (1 = not at all,7 = to a very great extent)To what extent has your SBP plan been successful in achieving greater adaptability of employees to changingproduction needs? (1 = not at all, 7 = to a very great extent)
46 Journal of Management / February 2005
at Magrath Library, University of Minnesota Libraries on March 3, 2012jom.sagepub.comDownloaded from

To what extent has your SBP plan been successful in achieving increased effectiveness of work teams? (1 = notat all, 7 = to a very great extent)To what extent has your SBP plan been successful in achieving better use of technology? (1 = not at all, 7 = to avery great extent)
Cost-effectiveness success (Time 1)Compared to non-SBP facilities similar to yours, have your facility’s experiences in the following areas beenbetter, worse, or about the same? (1 = ours are much worse, 5 = ours are much better)
Unit production/service delivery costsLabor costs per unit of production or serviceNonlabor costs per unit of production or serviceAdministrative costs
Productivity success (Time 2)How successful was/is your SBP plan in improving employee motivation? (0 = very unsuccessful, 10 = verysuccessful)How successful was/is your SBP plan in improving employee performance? (0 = very unsuccessful, 10 = verysuccessful)
Flexibility success (Time 2)To what extent did/does the SBP plan encourage the development of flexible skills? (0 = not at all, 10 = to avery great extent)
Cost-effectiveness success (Time 2)To what extent did/do the wage rates in your SBP plan create problems with respect to your payroll costs? (0 =not at all; 10 = to a very great extent; reverse coded)Overall, did/does the SBP plan lead to much lower or much higher wage rates than those in your local labormarket? (0 = much lower; 10 = much higher; reverse coded)
Survival1 = SBP survived, 0 = SBP abandoned
References
Baron, R. M., & Kenny, D. A. 1986. The moderator-mediator variable distinction in social psychological research: Conceptual,strategic and statistical considerations. Journal of Personality and Social Psychology, 51: 1173-1182.
Barringer, M. W., & Milkovich, G. T. 1998. A theoretical exploration of the adoption and design of flexible benefit plans: A caseof human resource innovation. Academy of Management Review, 20: 305-324.
Bunning, R. L. 1989. Skill-based pay: Restoring incentives to the workplace. Personnel Administrator, 34: 65-70.Daly, J. P., & Geyer, D. 1994. The role of fairness in implementing large-scale change: Employee evaluations of process and out-
come in seven facility relocations. Journal of Organizational Behavior, 15: 623-638.Davis, F. D. 1989. Perceived usefulness, perceived ease of use, and user acceptance of information technology. MIS Quarterly,
13: 319-340.DiMaggio, P., & Powell, W. 1983. The iron cage revisited: Institutional isomorphism and collective rationality in organizational
fields. American Sociological Review, 1: 147-160.Drago, R. 1988. Quality circle survival: An exploratory analysis. Industrial Relations, 27: 336-351.Eaton, A. E. 1994. The survival of employee participation programs in unionized settings. Industrial and Labor Relations
Review, 47: 371-389.Gerhart, B., Trevor, C. O., & Graham, M. E. 1996. New directions in compensation research: Synergies, risk, and survival.
Research in Personnel and Human Resources Management, 14: 143-203.Greve, H. R., & Taylor, A. 2000. Innovations as catalysts for organizational change: Shifts in organizational cognition and
search. Administrative Science Quarterly, 45: 54-80.Gupta, N., Jenkins, G. D., Jr., & Curington, W. P. 1986. Paying for knowledge: Myths and realities. National Productivity
Review, 5: 107-123.
Shaw et al. / Skill-Based Pay Plans 47
at Magrath Library, University of Minnesota Libraries on March 3, 2012jom.sagepub.comDownloaded from

Gupta, N., Ledford, G. E., Jr., Jenkins, G. D., Jr., & Doty, D. H. 1992. Survey-based prescriptions for skill-based pay. ACA Jour-nal, 1(1): 48-59.
Gupta, N., & Shaw, J. D. 1998. Let the evidence speak: Financial incentives are effective!! Compensation and Benefits Review,30(2): 26, 28-32.
Gupta, N., & Shaw, J. D. 2001. Successful skill-based pay plans. In C. H. Fay, D. Knight, & M. A. Thompson (Eds.), The execu-tive handbook on compensation: Linking strategic rewards to business performance: 513-526. New York: Free Press.
Jenkins, G. D., Jr., & Gupta, N. 1985. The payoffs of paying for knowledge. National Productivity Review, 4(2): 121-130.Jenkins, G. D., Jr., & Lawler, E. E., III. 1981. Impact of employee participation in pay plan development. Organizational Behav-
ior and Human Performance, 28: 111-128.Jenkins, G. D., Jr., Ledford, G. E., Gupta, N., & Doty, D. H. 1992. Skill-based pay: Practices, payoffs, pitfalls, and prescriptions.
Phoenix, AZ: American Compensation Association.Kim, D. 1999. Determinants of the survival of gainsharing programs. Industrial and Labor Relations Review, 53: 21-42.Knouse, S. B. 1995. Variations on skill-based pay for total quality management. SAM Advanced Management Journal, 60(1): 34-
38.Kochan, T. A., & Osterman, P. 1994. The mutual gains enterprise: Forging a winning partnership among labor, management,
and government. Boston: Harvard Business School Press.Kohn, A. 1998. Challenging behaviorist dogma: Myths about money and motivation. Compensation and Benefits Review, 26(2):
27, 33-37.Lawler, E. E., III. 1978. The new plant revolution. Organizational Dynamics, 6: 2-12.Lawler, E. E., III. 1981. Pay and organizational development. Reading, MA: Addison-Wesley.Lawler, E. E., III. 1994. From job-based to competency-based organizations. Journal of Organizational Behavior, 15: 3-15.Lawler, E. E., III, & Jenkins, G. D., Jr. 1992. Strategic reward systems. In M. D. Dunnette & L. M. Hough (Eds.), Handbook of
industrial and organizational psychology, Vol. 3: 1009-1055. Palo Alto, CA: Consulting Psychologists Press.Lawler, E. E., III, & Ledford, G. E., Jr. 1985. Skill-based pay. Personnel, 62(9): 30-37.Lawler, E. E., III., & Ledford, G. E., Jr. 1987. Skill-based pay: A concept that’s catching on. Management Review, 76(2): 46-51.Lawler, E. E., III, Ledford, G. E., Jr., & Chang, L. 1993. Who uses skill-based pay and why. Compensation and Benefits Review,
25: 22-26.Lawler, E. E., III., Mohrman, S. A., & Ledford, G. E., Jr. 1992. Employee involvement and total quality management. San Fran-
cisco: Jossey-Bass.Lawler, E. E., III, Mohrman, S. A., & Ledford, G. E., Jr. 1998. Strategies for high performance organizations. San Francisco:
Jossey-Bass.Ledford, G. E., Jr. 1991. The design of skill-based pay systems. In M. L. Rock & L. A. Berger (Eds.), The compensation hand-
book (3rd ed.): 199-217. New York: McGraw-Hill.Lee, C., Law, K., & Bobko, P. 1999. The importance of justice perceptions on pay effectiveness: A two-year study of a skill-based
pay plan. Journal of Management, 25: 851-873.Miles, R. E., & Snow, C. C. 1978. Organizational strategy, structure, and process. New York: McGraw-Hill.Milkovich, G. T., & Newman, J. M. 1999. Compensation (6th ed.). Burr Ridge, IL: Irwin.Murray, B., & Gerhart, B. 1998. An empirical analysis of a skill-based pay program and plant performance outcomes. Academy
of Management Journal, 41: 68-78.Perrow, C. 1984. Normal accidents: Living with high-risk technologies. New York: Basic Books.Petty, M. M., Singleton, B., & Connell, D. W. 1992. An experimental evaluation of an organizational incentive plan in the electric
utility industry. Journal of Applied Psychology, 77: 427-436.Pritchard, R. D., Jones, S. D., Roth, P. L., Stuebing, K. K., & Ekeberg, S. E. 1988. Effects of group feedback, goal setting, and
incentives on organizational productivity. Journal of Applied Psychology, 73: 337-358.Rousseau, D. M., & Schalk, R. 2000. Psychological contracts in employment. Thousand Oaks, CA: Sage.Shaw, J. D., Delery, J. E., Jenkins, G. D., Jr., & Gupta, N. 1998. An organizational-level analysis of voluntary and involuntary
turnover. Academy of Management Journal, 41: 511-525.Shaw, J. D., Gupta, N., & Delery, J. E. 2001. Congruence between technology and compensation systems: Implications for strat-
egy implementation. Strategic Management Journal, 22: 379-386.Wright, P. M., Gardner, T. M., Moynihan, L. M., Park, H. J., Gerhart, B., & Delery, J. E. 2001. Measurement error in research on
human resource management and firm performance: Additional data and suggestions for future research. Personnel Psychol-ogy, 54: 875-901.
Biographical Notes
Jason D. Shaw is an associate professor and the Clark Material Handling Company Professor of Management at the Universityof Kentucky. He received his Ph.D. in management from the University of Arkansas. His research interests include individual and
48 Journal of Management / February 2005
at Magrath Library, University of Minnesota Libraries on March 3, 2012jom.sagepub.comDownloaded from

organizational consequences of compensation decisions, voluntary turnover and performance, and person-environmentcongruence issues.
Nina Gupta is a professor and the Raymond F. Orr Chair in Management at the University of Arkansas. She received her Ph.D.in organizational psychology from the University of Michigan. Her current research interests include the behavioral and organi-zational consequences of reward systems, political aspects of human resource management, and the dynamics of absenteeismand turnover.
Atul Mitra is an associate professor at the University of Northern Iowa. He received his Ph.D. in management from the Univer-sity of Arkansas. His current research interests include skill-based pay, psychophysical analysis of pay issues, and global com-pensation strategies.
Gerald E. Ledford Jr. researches and consults on strategic human capital issues, especially employee compensation. He is pres-ident of the Ledford Consulting Network, LLC. He received his Ph.D. and M.A. in psychology from the University of Michigan.He is the author of 75 articles and of 10 books and monographs, including The Rewards of Work: The Employment Deal in aChanging Economy (2003).
Shaw et al. / Skill-Based Pay Plans 49
at Magrath Library, University of Minnesota Libraries on March 3, 2012jom.sagepub.comDownloaded from