Embed Size (px)
Citation preview
Contents lists available at ScienceDirect
Journal of Sound and Vibration
Journal of Sound and Vibration 333 (2014) 1079–1095
0022-46http://d
n CorrE-m
journal homepage: www.elsevier.com/locate/jsvi
Suppression of thermoelastic damping in MEMS beamresonators by piezoresistivity
X. Guo, Y.B. Yi n
Department of Mechanical and Materials Engineering, University of Denver, Colorado 80208, USA
a r t i c l e i n f o
Article history:Received 4 March 2013Received in revised form23 September 2013Accepted 28 September 2013
Handling Editor: A.V. Metrikinetaking advantage of the piezoresistive effect. Such a method is implemented by applying
Available online 30 October 2013
0X/$ - see front matter & 2013 Elsevier Ltd.x.doi.org/10.1016/j.jsv.2013.09.041
esponding author. Tel.: þ1 3038712228.ail address: [email protected] (Y.B. Yi).
a b s t r a c t
Microelectronic mechanical (MEM) beam resonators with high quality factors are alwayspreferred in practical applications. As one of the damping sources, thermoelastic damping(TED) caused by irreversible heat flows is usually considered as an upper limit of theoverall damping effect. A new method is proposed in this work to compensate TED by
an electrostatic field along the beam length with a negative piezoresistive coefficient.During a resonance, the stretched part of the beam generates a higher electrical powerdensity and thus a higher temperature, while the compressed region leads to a lowertemperature. Such a temperature distribution is opposite to the temperature changecaused by the thermoelastic effect. The working principle is described by a set of coupleddifferential equations, which are subsequently solved by the finite element method. Theresult indicates that the TED in the beam resonators can be completely compensatedwhen the strength of electrical field is tuned to a critical value, namely CEF. The value ofthe CEF is further analyzed by a series of parametric studies on various material propertiesand geometric factors.
& 2013 Elsevier Ltd. All rights reserved.
1. Introduction
Silicon microelectronic mechanical (MEM) beam resonators are being developed aggressively for a variety of applicationsnowadays, such as sensing [1–3], time application and frequency controls [4,5] due to their advantages of high frequencyand high quality factor. The miniaturized scale is also capable of batched fabrication for cost reduction. As one of the mostimportant design characters, a high mechanical quality factor (i.e. Q-factor or Q-value) or less energy loss in a resonatormeans a better precision to operate as a sensor or a frequency filter. Therefore, it is of great importance to understand thedominating energy loss in the mechanical vibration to identify those factors that impose an upper limit of the Q-value andthose factors that could be eliminated to improve the design. The dominant mechanisms fromwhich the resonator dissipateenergy include air damping, support loss [6,7] and thermoelastic damping (TED) [8–14]. Among them, air damping can beeliminated by packaging in vacuum because of the small size of the devices. But the support loss and TED can impose anupper limit on the design of micro resonators with high quality factors.
In vibrations of resonators, the non-equilibrium state of the temperature field is generated by the change of the strainfield. Hence, the irreversible heat conduction between domains with different temperatures leads to the energy dissipationof TED. Zener [8,9] first studied TED in reeds and wires long time ago. However, the modern application of the theory to
All rights reserved.

X. Guo, Y.B. Yi / Journal of Sound and Vibration 333 (2014) 1079–10951080
micro/nanoelectronic mechanical systems should be attributed to Lifshitz and Roukes [10] whose work predicated thequality factor of TED for micro and nanobeam resonators based on thermal conduction along the height direction.By applying Green's function, Prabhakar and Srikar [11] analyzed TED by solving the two-dimensional heat transfer equationto obtain the thermoelastic temperature gradients along both the beam length and height simultaneously. The sameresearch group [12] also analyzed the frequency shifts due to TED. Wong [13] presented an analytical solution for TED ina ring gyroscope based on Zener's method. However, these works were restricted to the flexural mode vibrations. Hao [14]derived the solution of quality factor for disk resonators vibrating in a contour mode by calculating the entropy increase percycle of vibration. Sun [15,16] derived the analytical solution for out-of-plane vibrations of circular plate resonators throughthe thin plate theory in the cylindrical coordinates. In more complex conditions, TED under residual stresses is investigatedby Zamanian [17] and Vahdat [18] for beam resonators. Kim [19] applied the simplified shell equations and utilized iterativeschemes to analyze TED of nano-mechanical tube resonators with initial stresses. Tunvir [20] studied the nonlinear effectinduced by a large vibration amplitude and found that there are opposite trends of the change in TED under adiabatic andisothermal surface thermal conditions. Vengallatore [21] and Prabhakar [22] presented an analytical solution to compute thefrequency dependence of TED in bilayered beam resonators. In addition to the analytical methods, the finite elementformulation [23–28] is a more efficient tool to determine the quality factor of TED for those systems with complexgeometries [24–27] and mixed boundary conditions [28].
To enhance the quality factor, Pourkamali and Ayazi [29,30] utilized HARPSS process to decrease the gap between theMEMS resonator and the electrodes while TED still showed an upper limit to the total energy loss. Candler and Duwel [24]applied slot cuts in the beam resonator to disrupt the heat flow and then decrease TED based on both experimental workand numerical analysis, while a more comprehensive numerical study on TED and frequency shift in the beamwith slot cutswas investigated by Guo et al. [27]. However, either the HARPSS method or adding slot cuts to the beam not only increasesthe fabrication cost, but also has a fabrication limit for nanoscale devices. Compared with these methods, utilizing thepiezoresistive effect by applying an electrostatic field on the structure is a more flexible and cost-effective way toattenuate TED.
The current work is inspired by the research of Steeneken and Phan [31,32] who applied a direct voltage througha nanoscale silicon beam to generate self-sustained longitudinal vibration. They showed that the damping loss of vibrationwas fully compensated by the energy supplied by an electro-thermo-mechanical feedback in the system. In this paper,a similar energy supply mode by utilizing the piezoresistivity is applied to compensate TED in the flexural mode vibration.The mechanism is firstly explained by a series of differential equations for the couplings among the electrical, thermal andmechanical processes. Thereafter a set of finite element equations are derived and the quality factor is computed from aneigenvalue analysis.
2. Methods
As a key design parameter of resonators, the Q-value is used to describe the energy loss in each cycle of vibration. Lessenergy loss is preferred to maintain the vibration with higher amplitude or a sharper peak in the frequency response. TheQ-value is defined as the following ratio:
Q ¼ 2πWΔW
(1)
where W is the maximum vibration energy stored in the system and ΔW is the energy dissipation over one cycle.
2.1. Physical mechanism
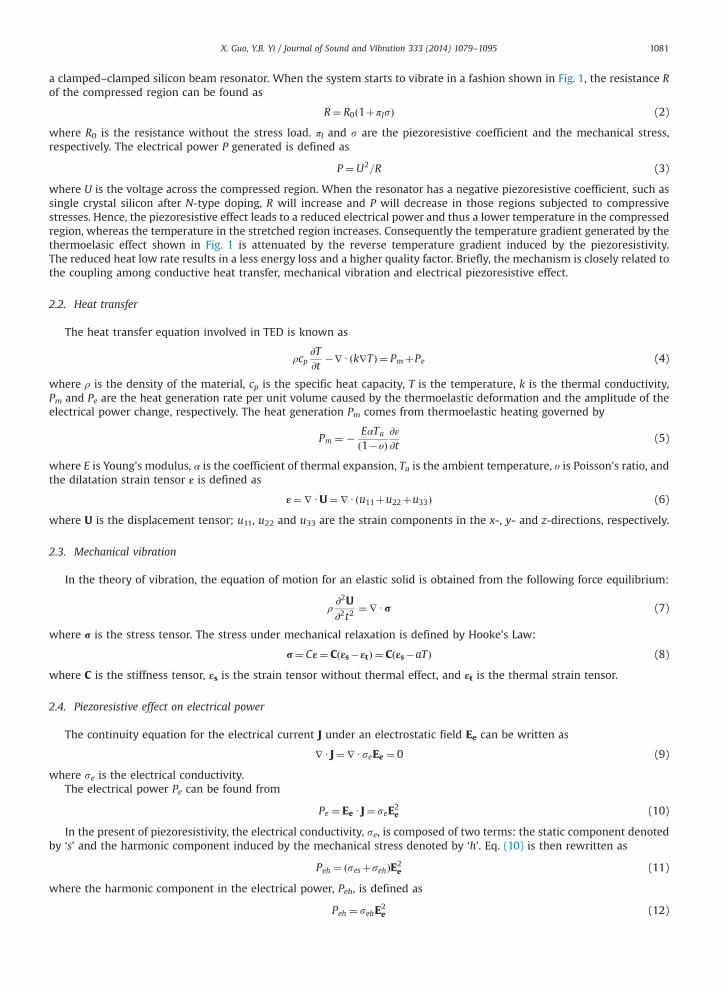
The energy loss due to the relaxation of mechanically induced temperature gradients and the resulting irreversible heatflow is show in Fig. 1. The compression in the beam leads to a higher temperature (hot) regionwhile the tensile stress on theopposite side of the beam results in a lower temperature (cold) region. We assume that an electrostatic field is applied on
Hot/Compressed
Cold/Stretched
Fig. 1. Temperature contour plot of the clamped–clamped MEMS beam resonator in flexural vibration. The heat flow, illustrated by the arrows, is caused bythe temperature gradient and contributes to TED.
X. Guo, Y.B. Yi / Journal of Sound and Vibration 333 (2014) 1079–1095 1081
a clamped–clamped silicon beam resonator. When the system starts to vibrate in a fashion shown in Fig. 1, the resistance Rof the compressed region can be found as
R¼ R0ð1þπlsÞ (2)
where R0 is the resistance without the stress load. πl and s are the piezoresistive coefficient and the mechanical stress,respectively. The electrical power P generated is defined as
P ¼U2=R (3)
where U is the voltage across the compressed region. When the resonator has a negative piezoresistive coefficient, such assingle crystal silicon after N-type doping, R will increase and P will decrease in those regions subjected to compressivestresses. Hence, the piezoresistive effect leads to a reduced electrical power and thus a lower temperature in the compressedregion, whereas the temperature in the stretched region increases. Consequently the temperature gradient generated by thethermoelasic effect shown in Fig. 1 is attenuated by the reverse temperature gradient induced by the piezoresistivity.The reduced heat low rate results in a less energy loss and a higher quality factor. Briefly, the mechanism is closely related tothe coupling among conductive heat transfer, mechanical vibration and electrical piezoresistive effect.
2.2. Heat transfer
The heat transfer equation involved in TED is known as
ρcp∂T∂t
�∇U ðk∇TÞ ¼ PmþPe (4)
where ρ is the density of the material, cp is the specific heat capacity, T is the temperature, k is the thermal conductivity,Pm and Pe are the heat generation rate per unit volume caused by the thermoelastic deformation and the amplitude of theelectrical power change, respectively. The heat generation Pm comes from thermoelastic heating governed by
Pm ¼ � EαTa
ð1�υÞ∂ε∂t
(5)
where E is Young's modulus, α is the coefficient of thermal expansion, Ta is the ambient temperature, υ is Poisson's ratio, andthe dilatation strain tensor ε is defined as
ε¼∇UU¼∇Uðu11þu22þu33Þ (6)
where U is the displacement tensor; u11, u22 and u33 are the strain components in the x-, y- and z-directions, respectively.
2.3. Mechanical vibration
In the theory of vibration, the equation of motion for an elastic solid is obtained from the following force equilibrium:
ρ∂2U∂2t2
¼∇Ur (7)
where r is the stress tensor. The stress under mechanical relaxation is defined by Hooke's Law:
r¼ Cε¼ Cðεs�εtÞ ¼ Cðεs�aTÞ (8)
where C is the stiffness tensor, εs is the strain tensor without thermal effect, and εt is the thermal strain tensor.
2.4. Piezoresistive effect on electrical power
The continuity equation for the electrical current J under an electrostatic field Ee can be written as
∇UJ¼∇UseEe ¼ 0 (9)
where se is the electrical conductivity.The electrical power Pe can be found from
Pe ¼ Ee UJ¼ seE2e (10)
In the present of piezoresistivity, the electrical conductivity, se, is composed of two terms: the static component denotedby ‘s’ and the harmonic component induced by the mechanical stress denoted by ‘h’. Eq. (10) is then rewritten as
Peh ¼ ðsesþsehÞE2e (11)
where the harmonic component in the electrical power, Peh, is defined as
Peh ¼ sehE2e (12)
X. Guo, Y.B. Yi / Journal of Sound and Vibration 333 (2014) 1079–10951082
As indicated in Eq. (9), the electrostatic field Ee is obtained from
∇UsesEe ¼ 0 (13)
The change in the conductivity seh is defined by
seh ¼ πlrses
(14)
where r the mechanical stress aforementioned. The resistance R0 in Eq. (2) is defined as
R0 ¼ ρesLA¼ L
sesA(15)
where ρes is the static electrical resistivity; L and A are the length and cross-sectional area of conductor, respectively. Theharmonic component of the electrical resistivity ρeh in the matrix form due to the mechanical stress r is defined by thefollowing equation [33]:
ρeh ¼
ρeh11ρeh22ρeh33ρeh23ρeh31ρeh12
26666666664
37777777775¼ ρesπijr¼ ρes
π11 π12 π12 0 0 0π12 π11 π12 0 0 0π12 π12 π11 0 0 00 0 0 π44 0 00 0 0 0 π44 00 0 0 0 0 π44
26666666664
37777777775
s11s22s33s23s31s12
26666666664
37777777775
(16)
where πij is the piezoresistive tensor; s11, s22 and s33 are the stress components in the x-, y- and z-directions, respectively.The electrical conductivity, se, is defined as
se ¼ 1=ðρesþρehÞ (17)
which can be expressed as the following matrix form [31]
re ¼ resþreh ¼ 1ρes
1 0 00 1 00 0 1
264
375� 1
ρ2es
ρeh11 ρeh12 ρeh31ρeh12 ρeh22 ρeh23ρeh31 ρeh23 ρeh33
264
375 (18)
For two-dimensional problems, Eqs. (16) and (18) degenerate to
ρeh ¼ρeh11ρeh22ρeh12
264
375¼ ρes
π11 π12 0π12 π11 00 0 π44
264
375
s11s22s12
264
375 (19)
and
re ¼ resþreh ¼1ρes
1 00 1
� �� 1
ρ2es
ρeh11 ρeh12ρeh12 ρeh22
" #(20)
Therefore,
reh ¼ � 1ρ2es
ρeh11 ρeh12ρeh12 ρeh22
" #(21)
Substituting Eqs. (19)–(21) results in
seh ¼ � 1ρes
π11s11þπ12s22 π44s12π44s12 π12s11þπ11s22
" #(22)
2.5. Finite element formulations
In harmonic vibration, the temperature and displacement have the following forms
T ¼ T0eiωt (23)
U ¼U0eiωt (24)
V ¼ V0eiωt ¼∂U∂t
eiωt ¼ iωV0eiωt (25)
X. Guo, Y.B. Yi / Journal of Sound and Vibration 333 (2014) 1079–1095 1083
where ω is the angular frequency and generally complex when damping is present; V is the velocity; T0, U0, and V0 are theamplitudes of temperature, displacement and velocity, respectively.
By applying the interpolating function N (i.e. the shape function) to Eqs. (4)–(6), we obtain the following finite elementequations:
ðKþωHÞTþωFUþPeh ¼ 0 (26)
where K, H and F are the coefficient matrices; T is the nodal temperature; U is the nodal displacement and Peh is theharmonic electrical power change. The nodal strain is given by
ε¼ BU ¼∇U ðNUÞ (27)
where B is the strain–displacement function in finite element method.Similarly, Eqs. (7) and (8) are converted into the following form using the same interpolating function,
LU�GTþωMV ¼ 0 (28)
where L, G, and M are the coefficient matrices, and V is the nodal velocity. In addition to Eqs. (26) and (28), one moreequation is needed to solve for the three unknowns U, T and V. The third equation has already been shown in Eq. (25). That is
V ¼ iωU (29)
where the method to compute the coefficient matrices K, H, F, L, G and M has been described in Refs. [25,27].The vector form of Eq. (12) can be expressed as
Peh ¼ ðrehEeÞ′UEe (30)
where Ee is obtained from Eq. (13) and
Ee ¼Ee11Ee22
" #(31)
Substituting Eqs. (22) and (31) into (30) yields
Peh ¼ Yr¼ � 1ρes
π11E2e11þπ12E
2e22
π12E2e11þπ11E
2e22
2π44Ee11Ee22
2664
3775
�1s11s22s12
264
375 (32)
Meanwhile substituting Eqs. (8) and (27) into (32) leads to
Peh ¼ Yr¼ YCε¼ YCBU (33)
In an elemental domain,
Peh ¼ SU (34)
where
S¼∬NTYCB dxdy (35)
2.6. Eigenvalue equations
Combining Eqs. (26), (28), (29) and (34) yields,
�K S 0G �L 00 0 I
264
375
T
U
V
264
375¼ iω
H F 00 0 M0 I 0
264
375
T
U
V
264
375 (36)
where I is an identity matrix. This is a standard eigenvalue equation. The eigenvalue of the equation is the angular frequency ω(i.e. the eigenfrequency) whose corresponding eigenmode is denoted by the eigenvectors U, V, and T. When the electrical fieldis absent, S equals zero and Eq. (36) degenerates to the situation involving TED alone, which was already studied in Refs.[25,27]. By formulating the velocity field to be independent of the displacement, the originally quadratic Eq. (7) is reduced totwo first-order equations, i.e. Eqs. (28) and (29).
The quality factor of the system can be evaluated from
Q ¼ 12
ReðωÞImðωÞ
�������� (37)
where Re(ω) is the real part of ω giving the angular frequency in the presence of both thermoelasticity and piezoresisitivity;Im(ω) is the imaginary part of ω representing the attenuation of vibration. The finite element algorithm is developed in theform of a customized MATLAB code.
X. Guo, Y.B. Yi / Journal of Sound and Vibration 333 (2014) 1079–10951084
3. Results and discussions
3.1. Power change by piezoresistive effect
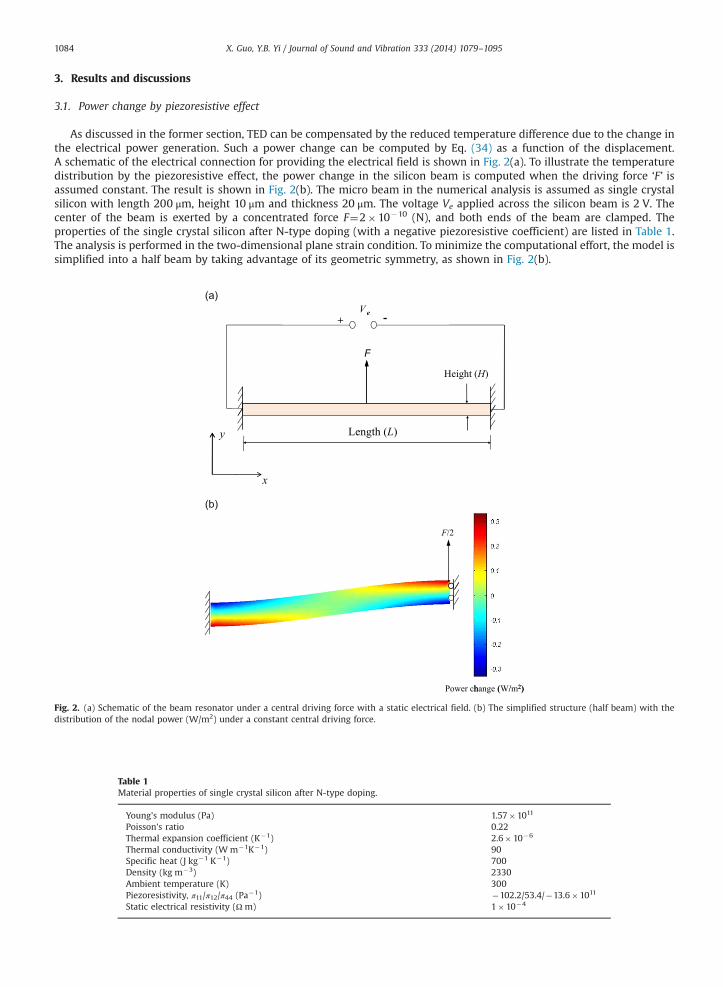
As discussed in the former section, TED can be compensated by the reduced temperature difference due to the change inthe electrical power generation. Such a power change can be computed by Eq. (34) as a function of the displacement.A schematic of the electrical connection for providing the electrical field is shown in Fig. 2(a). To illustrate the temperaturedistribution by the piezoresistive effect, the power change in the silicon beam is computed when the driving force ‘F’ isassumed constant. The result is shown in Fig. 2(b). The micro beam in the numerical analysis is assumed as single crystalsilicon with length 200 μm, height 10 μm and thickness 20 μm. The voltage Ve applied across the silicon beam is 2 V. Thecenter of the beam is exerted by a concentrated force F¼2�10�10 (N), and both ends of the beam are clamped. Theproperties of the single crystal silicon after N-type doping (with a negative piezoresistive coefficient) are listed in Table 1.The analysis is performed in the two-dimensional plane strain condition. To minimize the computational effort, the model issimplified into a half beam by taking advantage of its geometric symmetry, as shown in Fig. 2(b).
V ee
F
+ -
Height (H)
Length (L)y
x
F/2
h ( / 2)Power change (W/m2)
Fig. 2. (a) Schematic of the beam resonator under a central driving force with a static electrical field. (b) The simplified structure (half beam) with thedistribution of the nodal power (W/m2) under a constant central driving force.
Table 1Material properties of single crystal silicon after N-type doping.
Young's modulus (Pa) 1.57�1011
Poisson's ratio 0.22Thermal expansion coefficient (K�1) 2.6�10�6
Thermal conductivity (Wm�1K�1) 90Specific heat (J kg�1 K�1) 700Density (kg m�3) 2330Ambient temperature (K) 300Piezoresistivity, π11/π12/π44 (Pa�1) �102.2/53.4/�13.6�1011
Static electrical resistivity (Ω m) 1�10�4
3.14
3.06
3.02
2.98
Tran
sver
sal
disp
lace
men
t (××1
0-14 m
)
Q4-5 Q4-9
Q4-13 Q9-5
Q9-9 Q9-13
2.945 25 45 65 85 105
Node number along the length of the half beam
3.2
2.8
2.4
2Pow
er c
hang
e (×
10-1
W/m
2 )
Q4-5 Q4-9
Q4-13 Q9-5
Q9-9 Q9-13
1.65 25 45 65 85 105
Node number along the length of the half beam
3.1
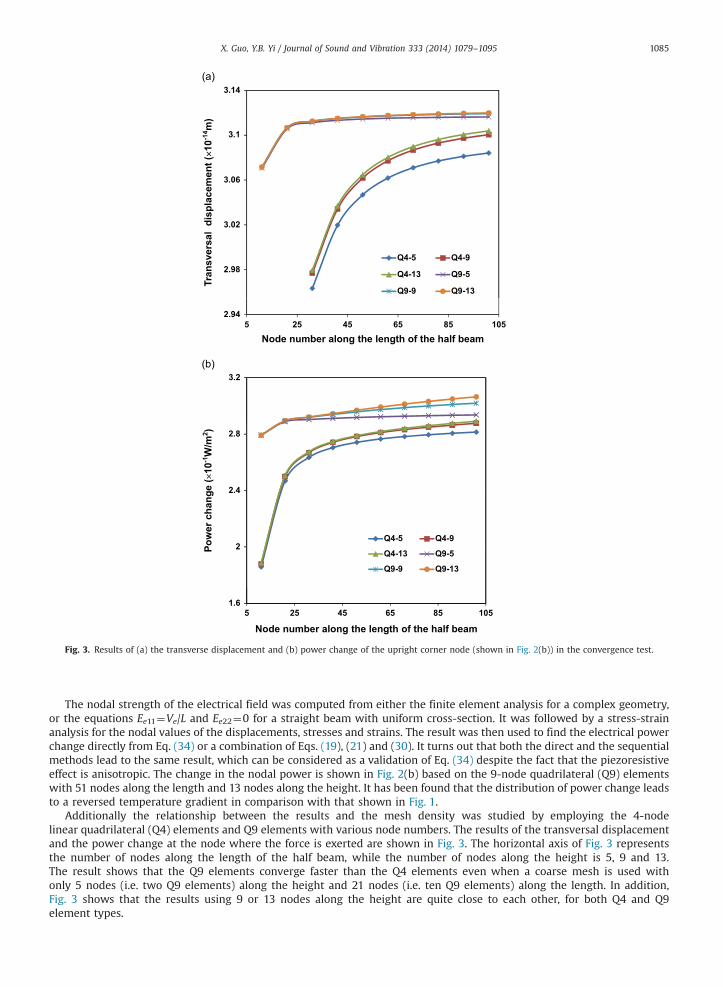
Fig. 3. Results of (a) the transverse displacement and (b) power change of the upright corner node (shown in Fig. 2(b)) in the convergence test.
X. Guo, Y.B. Yi / Journal of Sound and Vibration 333 (2014) 1079–1095 1085
The nodal strength of the electrical field was computed from either the finite element analysis for a complex geometry,or the equations Ee11¼Ve/L and Ee22¼0 for a straight beam with uniform cross-section. It was followed by a stress-strainanalysis for the nodal values of the displacements, stresses and strains. The result was then used to find the electrical powerchange directly from Eq. (34) or a combination of Eqs. (19), (21) and (30). It turns out that both the direct and the sequentialmethods lead to the same result, which can be considered as a validation of Eq. (34) despite the fact that the piezoresistiveeffect is anisotropic. The change in the nodal power is shown in Fig. 2(b) based on the 9-node quadrilateral (Q9) elementswith 51 nodes along the length and 13 nodes along the height. It has been found that the distribution of power change leadsto a reversed temperature gradient in comparison with that shown in Fig. 1.
Additionally the relationship between the results and the mesh density was studied by employing the 4-nodelinear quadrilateral (Q4) elements and Q9 elements with various node numbers. The results of the transversal displacementand the power change at the node where the force is exerted are shown in Fig. 3. The horizontal axis of Fig. 3 representsthe number of nodes along the length of the half beam, while the number of nodes along the height is 5, 9 and 13.The result shows that the Q9 elements converge faster than the Q4 elements even when a coarse mesh is used withonly 5 nodes (i.e. two Q9 elements) along the height and 21 nodes (i.e. ten Q9 elements) along the length. In addition,Fig. 3 shows that the results using 9 or 13 nodes along the height are quite close to each other, for both Q4 and Q9element types.
3.7
4.2
Q4-5 Q4-9
Q4-13 Q9-5
3.2
Qua
lity
fact
or (××
104 ) Q9-9 Q9-13
2.2
2.7
1.7
1.25 25 45 65 85 105
Node number along the length of the half beam
1 34
1.35
Q4-5 Q4-9
Q4-13 Q9-5
1.33
.Q9-9 Q9-13
1.32Re(
ω) (×1
07 )
1.31
1.35 25 45 65 85 105
Node number along the length of the half beam
43
49
Q4 5 Q4 9 Q4 13
37
Q4-5 Q4-9 Q4-13
Q9-5 Q9-9 Q9-13
31
Im(ω
)
25
195 25 45 65 85 105
Node number along the length of the half beam
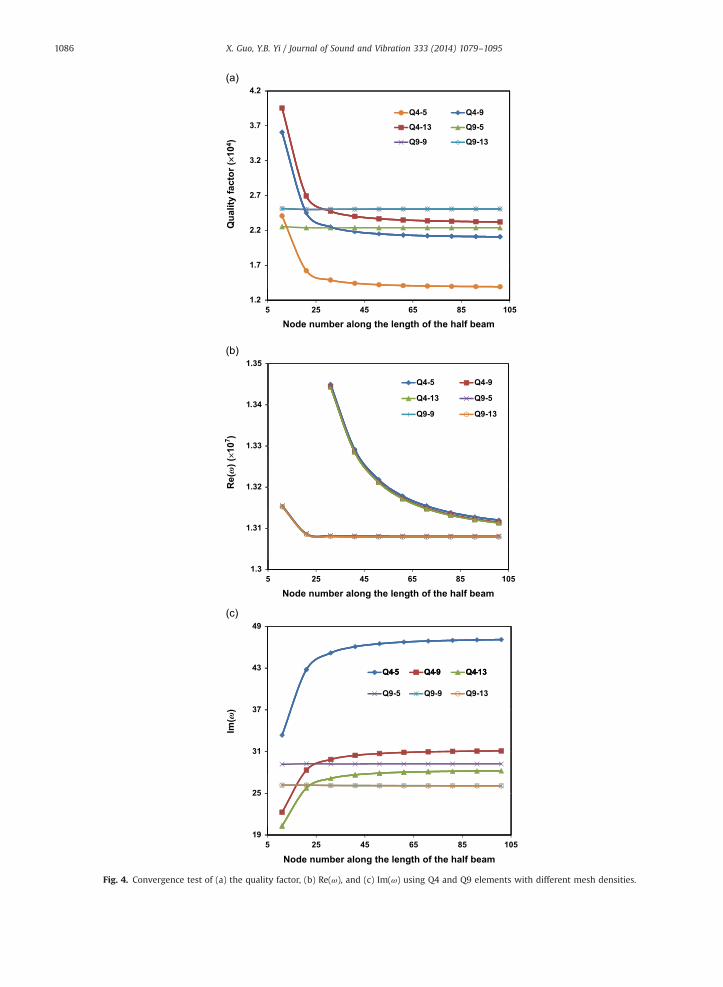
Fig. 4. Convergence test of (a) the quality factor, (b) Re(ω), and (c) Im(ω) using Q4 and Q9 elements with different mesh densities.
X. Guo, Y.B. Yi / Journal of Sound and Vibration 333 (2014) 1079–10951086

X. Guo, Y.B. Yi / Journal of Sound and Vibration 333 (2014) 1079–1095 1087
3.2. Convergence studies
The convergence studies on the quality factor along with Re(ω) and Im(ω) were also performed by using both Q4 and Q9elements. When the electrical field is absent (i.e. Ve¼0), the system degenerates to a standard TED problem and a number ofanalytical methods exist in the literature. In order to compare the numerical results of TED with the analytical resultsreported in Ref. [10], we set Poisson's ratio to zero. The geometry and material properties of the silicon beam remain the
Table 2Results from the convergence studies.
Ve Result 9�41 mesh 13�101 mesh Error (%)n
0V Q 14,723.65 14,721.06 0.0176Im(ω) 444.156 444.215 �0.0133Re(ω) 13,079,200 13,078,640 0.00428
2V Q 250,470.9 250,866.6 �0.158Im(ω) 26.10957 26.06727 0.162Re(ω) 13,079,380 13,078,810 0.00436
n The error is estimated by comparing the result of 9�41 with that of 13�101.
350
420
Quality factor
280
Qua
lity
fact
or (××
104 )
140
210
70
00 1 2 3 4 5
Electrical field strength (×104V/m)
Electrical field strength (×104V/m)
y = -1.3494x2- 0.0014x + 7.1243R² = 1
1.3387610
1.33868
1.338720
0 1 2 3 4 5
Im (ω)
1.33864
-10
Re(
ω) ×
107 )
Im(ω
) (×1
02 )
Re (ω)
Data Fitting Function
1.3386-20
1.33856-30
Fig. 5. (a) Quality factor, and (b) Re(ω) and Im(ω) as functions of the strength of the electrical field.
X. Guo, Y.B. Yi / Journal of Sound and Vibration 333 (2014) 1079–10951088
same as those used in the previous section. The analysis was performed under the following two conditions: the appliedvoltage, Ve, was set to (i) 0 V (standard TED) and (ii) 2 V through the beam (i.e. 1 V through the half beam).
The analytical solution [10] of the quality factor for the standard TED problem is 14,646.7 while the numerical analysis yields14,721.1 by the Q9 elements with a 13�101 finite element mesh (13 nodes along the height and 101 nodes along the length).The error in the numerical result is approximately 0.508 percent compared to the analytical solution. The results of the qualityfactor along with both Re(ω) and Im(ω) are also shown in Fig. 4 where the applied voltage is set to 2 V. Similar to the convergencetest of the power change discussed previously, the Q9 elements show a faster speed of convergence than the Q4 elements. Theresults using 9 nodes and 13 nodes along the height are noticeably close to each other when Q9 elements are used. To balancethe effort of computation and accuracy, the results based on Q9 elements with two different mesh densities have been comparedin Table 2. The numerical error shows that the accuracy based on the 9�41 mesh is more favorable in the current study. Theanalyses involved in the following sections are therefore based on this mesh density alone.
3.3. Parametric studies
3.3.1. Strength of electrostatic fieldThe quality factors of the beam resonator under different strengths of the electrical field, Ees11 (Ees22 is always zero in the
present study), are obtained and shown in Fig. 5(a). The geometric parameters and material properties remain the same.
10
20
0
10
0 1 2 3 4 5
-10
Im(ω
) (××1
02 )
-30
-20
Poisson's ratio 0Poisson's ratio 0.25
-40
Strength of electrical field (×104V/m)
2.6
2.7
2.4
2.5
2.3
CEF
(×10
4 V/m
)
2.1
2.2
20 1 2 3 4 5
Poisson's ratio (×10-1)
Poisson s ratio 0.45'
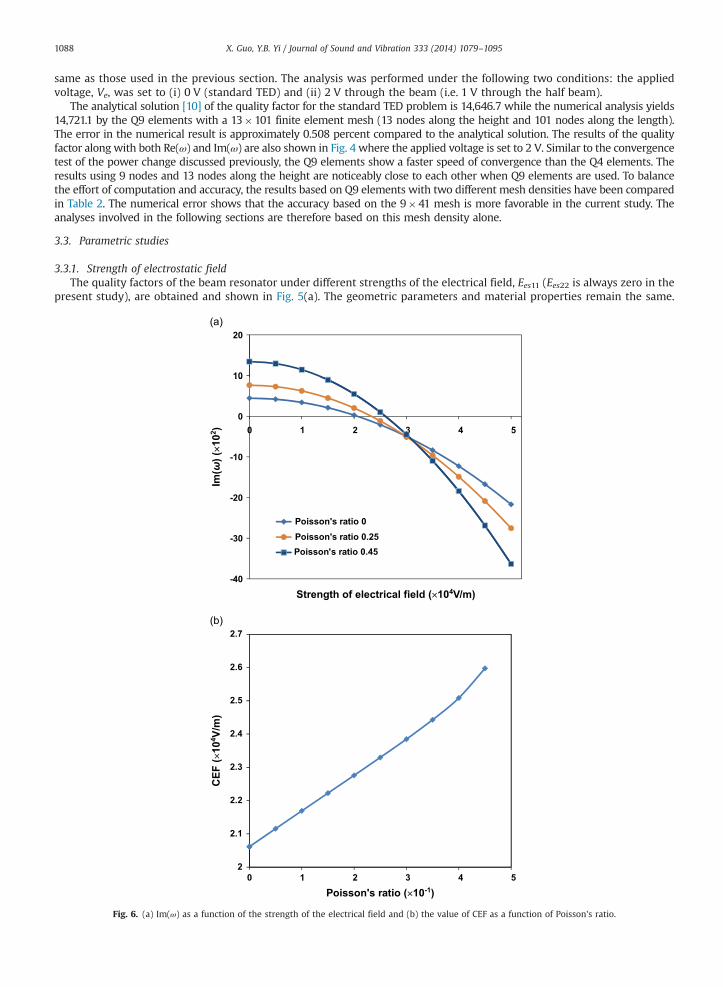
Fig. 6. (a) Im(ω) as a function of the strength of the electrical field and (b) the value of CEF as a function of Poisson's ratio.

X. Guo, Y.B. Yi / Journal of Sound and Vibration 333 (2014) 1079–1095 1089
A sharp peak is seen in Fig. 5(a) when the electrical field has a strength of 2.3�104 V/m. To explain the reason for this peak,the angular frequency of vibration, Re(ω), accompanied by the attenuation, Im(ω), are also presented in Fig. 5(b). It showsthat the peak of the quality factor in Fig. 5(a) is caused by the value of Im(ω), which is approaching zero. In addition, Im(ω)decreases with the strength of the electrical field applied on the system. This trend confirms that the electrical field canindeed reduce the energy loss caused by TED.
The regression analysis shows that there exists a strong correlation between Im(ω) and the electrical field since thecoefficient of determination is equal to 1. Hence, an interpolating function can be obtained from curve fitting based ona limited number of data points. Furthermore, the fitted function shows that Im(ω) equals zero when the electrical field hasa strength of 2.2972�104 V/m. According to Eq. (37), in that situation the quality factor approaches infinity and TED iscompletely compensated by the piezoresistive effect. In the current work we define the strength of the electrical field at zeroIm(ω) to be the critical value of the electrical field (CEF). The corresponding applied voltage is denoted as VCEF. The VCEF isobviously the counterpart of the threshold voltage mentioned in Refs. [31,32]. The values of CEF and VCEF are dependent onthe beam geometry and material properties.
When the strength of the electrical filed is greater than CEF, Im(ω) will have a negative value. It implies that the change inthe electrical power acts as a driving force for the kinetic energy in vibration. By introducing piezoresistivity, the energy lossdue to TED can be compensated, leading to a higher quality factor in resonance. Theoretically, the amplitude of vibration
12
-4
4
0 1 2 3 4 5
-12
Im(ω
) (××1
02 )
-28
-20
Young's modulus 100GPa
-36
Strength of electrical field (×104V/m)
Young's modulus 200GPa
2.299
2.3
2.298
2.296
2 297.
CEF
(×10
4 V/m
)
2.294
2.295
2.2930.9 1.2 1.5 1.8 2.1
Young's modulus (×102GPa)
Young's modulus 150GPa
Fig. 7. (a) Im(ω) as a function of the strength of the electrical field and (b) the value of CEF as a function of Young's modulus.

X. Guo, Y.B. Yi / Journal of Sound and Vibration 333 (2014) 1079–10951090
would increase indefinitely, leading to material failure if the system had a sufficiently high input energy. However, in realitythe increased vibration amplitude with sufficiently high quality factor will trigger the nonlinear dynamic status of thesystem [34,35]. The change in the angular frequency Re(ω) as a function of the strength of the electrical field is also shownin Fig. 5(b). Contrary to the result of Im(ω), Re(ω) rises as the electrical field increases its strength. However, the change inRe(ω) is merely 0.001 percent given the present range of the electrical field, which is negligible compared to the changein Im(ω).
3.3.2. Material propertiesThe parametric study in the following sections is focused on the value of CEF when TED is entirely compensated by the
piezoresistive effect. The CEF is estimated from the curving fitting on the results of Im(ω) under the different electrical fieldstrengths. Fig. 6(a) indicates the change in the quality factor as a function of the electrical field strength through the beamfor different values of Poisson's ratio. The estimated CEF from curve fitting is shown in Fig. 6(b) as a function of Poisson'sratio. The change is almost linear and the rate is approximately 1.14�103 V/m. On the other hand, Fig. 7 shows the effect ofYoung's modulus when Poisson's ratio is set to 0.22 as denoted in Table 1. Quite different from the effect of Poisson's ratio,when Young's modulus varies, the values of CEF do not differ significantly as seen in Fig. 7(a). However, a more extensiveinvestigation (shown in Fig. 7(b)) has revealed that the change rate of the CEF remains as a linear function of Young'smodulus. Nevertheless, such a change rate is only 0.5 V/m/GPa and apparently negligible.
3.3.3. Beam aspect ratioThe studies on the geometric effects are shown in Figs. 8–10. Fig. 8(a) shows the quality factor as a function of the
electrical field with different beam lengths while the height, H, is maintained as 10 μm. Fig. 8(b) shows the CEF decreases
4
12
-4
4
0 1 2 3 4 5
-12
Im(ω
) (××1
02 )
-28
-20
Length 120 μm
-36
Electrical field strength (×104V/m)
Length 320 μm
7.52.44
CEF
6.52.4
4.5
5.5
2.32
2.36
V CEF
(V)
CEF
( ×10
4 V/m
)
3.52.28
2.52.240.9 1.4 1.9 2.4 2.9 3.4
Beam length (×10-4m)
Length 220 μm
VCEF
Fig. 8. (a) Im(ω) as a function of the strength of the electrical field and (b) the value of CEF as a function of the beam length.
X. Guo, Y.B. Yi / Journal of Sound and Vibration 333 (2014) 1079–1095 1091
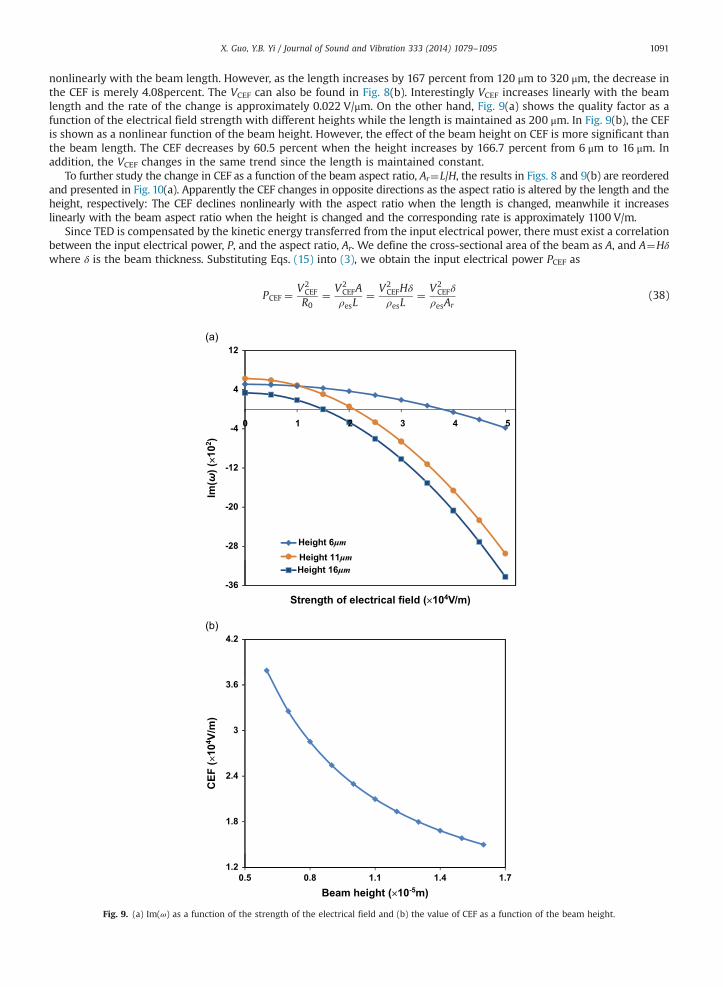
nonlinearly with the beam length. However, as the length increases by 167 percent from 120 μm to 320 μm, the decrease inthe CEF is merely 4.08percent. The VCEF can also be found in Fig. 8(b). Interestingly VCEF increases linearly with the beamlength and the rate of the change is approximately 0.022 V/μm. On the other hand, Fig. 9(a) shows the quality factor as afunction of the electrical field strength with different heights while the length is maintained as 200 μm. In Fig. 9(b), the CEFis shown as a nonlinear function of the beam height. However, the effect of the beam height on CEF is more significant thanthe beam length. The CEF decreases by 60.5 percent when the height increases by 166.7 percent from 6 μm to 16 μm. Inaddition, the VCEF changes in the same trend since the length is maintained constant.
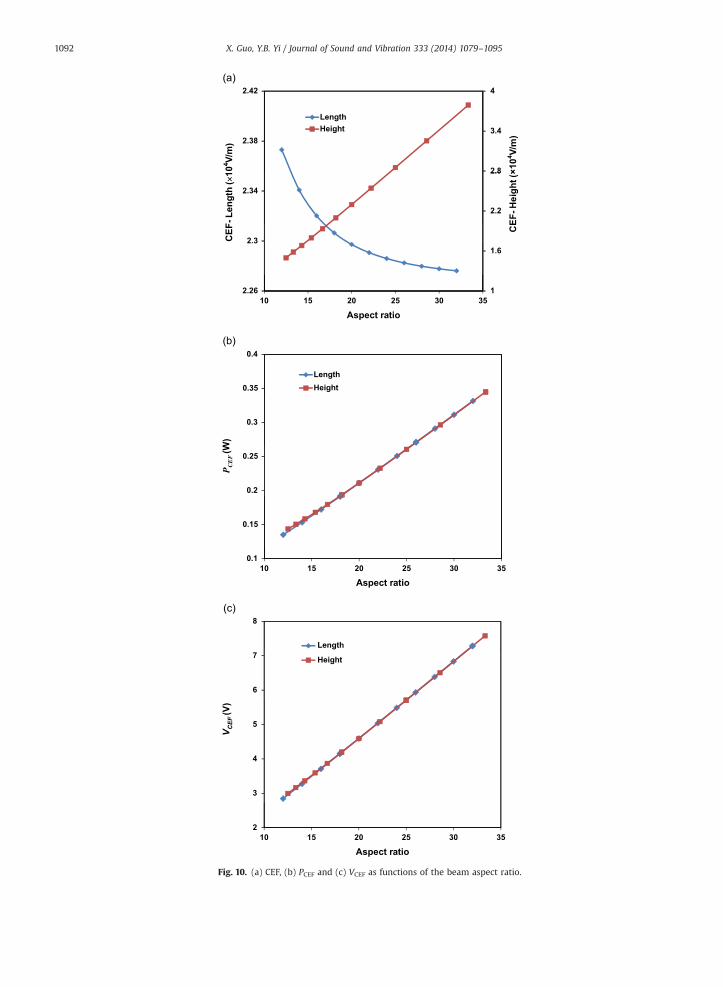
To further study the change in CEF as a function of the beam aspect ratio, Ar¼L/H, the results in Figs. 8 and 9(b) are reorderedand presented in Fig. 10(a). Apparently the CEF changes in opposite directions as the aspect ratio is altered by the length and theheight, respectively: The CEF declines nonlinearly with the aspect ratio when the length is changed, meanwhile it increaseslinearly with the beam aspect ratio when the height is changed and the corresponding rate is approximately 1100 V/m.
Since TED is compensated by the kinetic energy transferred from the input electrical power, there must exist a correlationbetween the input electrical power, P, and the aspect ratio, Ar. We define the cross-sectional area of the beam as A, and A¼Hδwhere δ is the beam thickness. Substituting Eqs. (15) into (3), we obtain the input electrical power PCEF as
PCEF ¼V2CEF
R0¼ V2
CEFAρesL
¼ V2CEFHδρesL
¼ V2CEFδ
ρesAr(38)
12
-4
4
0 1 2 3 4 5
-12
Im(ω
) (××1
02 )
-28
-20
Height 11μm
-36Strength of electrical field (×104V/m)
Height 16μm
4.2
3
3.6
2.4
CEF
(×10
4 V/m
)
1.8
1.20.5 0.8 1.1 1.4 1.7
Beam height (×10-5m)
Height 6μm
Fig. 9. (a) Im(ω) as a function of the strength of the electrical field and (b) the value of CEF as a function of the beam height.
42.42
Length
2.8
3.42.38
Height
2.2
2.8
2.34
1.62.3
CEF
-Hei
ght(
×104 V/
m)
CEF
-Len
gth
(××10
4 V/m
)
12.26
10 15 20 25 30 35
10 15 20 25 30 35
10 15 20 25 30 35
Aspect ratio
0.35
0.4
Length
0.3
0.2
0.25
P CEF
(W)
0.15
0.1
Aspect ratio
8
Length
6
7 Height
5
V CEF
(V)
3
4
2
Aspect ratio
Height
Fig. 10. (a) CEF, (b) PCEF and (c) VCEF as functions of the beam aspect ratio.
X. Guo, Y.B. Yi / Journal of Sound and Vibration 333 (2014) 1079–10951092
X. Guo, Y.B. Yi / Journal of Sound and Vibration 333 (2014) 1079–1095 1093
The result is presented in Fig. 10(b) and apparently PCEF is a linear function of the beam aspect ratio alone. It indicates thatmore electrical input power is required to compensate TED when the beam resonator has a greater aspect ratio and thecorresponding rate is approximately 0.009W per unit aspect ratio of beam when the thickness is set to δ¼20 μm.
In addition, for a beam resonator with the same material property and thickness, VCEF is a linear function of the beamaspect ratio alone, as seen in both Eq. (38) and Fig. 10(b). In fact, the slope of the linear regression of the data in Fig. 10(c)indicates that the corresponding rate is approximately 0.22 V per unit aspect ratio of the beam.
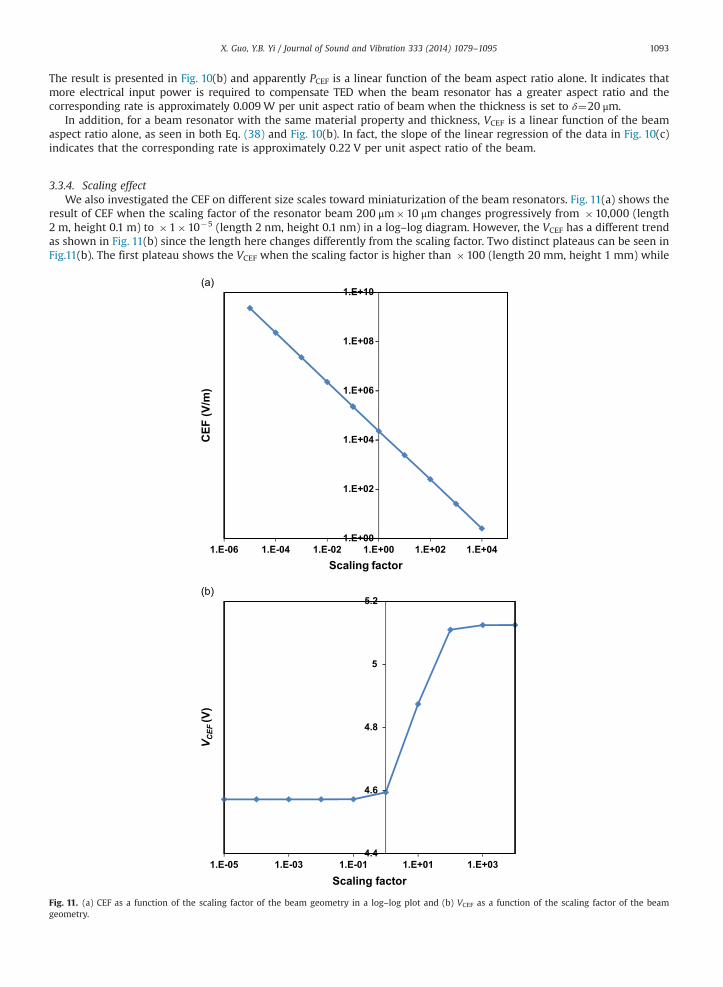
3.3.4. Scaling effectWe also investigated the CEF on different size scales toward miniaturization of the beam resonators. Fig. 11(a) shows the
result of CEF when the scaling factor of the resonator beam 200 μm�10 μm changes progressively from �10,000 (length2 m, height 0.1 m) to �1�10�5 (length 2 nm, height 0.1 nm) in a log–log diagram. However, the VCEF has a different trendas shown in Fig. 11(b) since the length here changes differently from the scaling factor. Two distinct plateaus can be seen inFig.11(b). The first plateau shows the VCEF when the scaling factor is higher than �100 (length 20 mm, height 1 mm) while
CEF
(V/m
)
1.E+001.E-06 1.E-04 1.E-02 1.E+00 1.E+02 1.E+04
Scaling factor
5.2
V CEF
(V)
4.6
4.41.E-05 1.E-03 1.E-01 1.E+01 1.E+03
Scaling factor
4.8
5
1.E+10
1.E+08
1.E+06
1.E+04
1.E+02
Fig. 11. (a) CEF as a function of the scaling factor of the beam geometry in a log–log plot and (b) VCEF as a function of the scaling factor of the beamgeometry.
X. Guo, Y.B. Yi / Journal of Sound and Vibration 333 (2014) 1079–10951094
the second plateau emerges when the scaling factor is lower than �1 (length 200 μm, height 10 μm). Moreover, the changein the VCEF from the higher plateau to the lower plateau is only about 10 percent from 5.12 V to 4.60 V, meanwhile the sizechanges dramatically from the meter scale to the nanometer scale.
4. Conclusions
The current work presents a method to enhance the quality factor of MEMS beam resonators vibrating in their flexuralmodes by applying an electrostatic field on the system with a negative piezoresistive coefficient. During the vibration, thetemperature distribution caused by the electrical power change can attenuate the thermoelastic temperature difference thatleads to the conductive heat flow from TED. To predict the thermomechanical responses of the system in the presence ofpiezoresistivity, a set of coupled differential equations for the relevant thermal, mechanical and electrical processes areconstructed. These equations are then solved by the Galerkin finite element method. The quality factor is evaluated by aneigenvalue analysis.
A series of convergence studies have been performed using both linear and nonlinear interpolating functions in the finiteelement method for achieving better accuracy and less computational effort. The quality factor is computed as a function ofthe strength of the electrical field. The result demonstrates that the quality factor increases with the electrical field strength.Further analysis reveals that an infinite quality factor is possible when the attenuation of vibration, Im(ω), equals zero,i.e. TED is completely suppressed. The study also shows that the relationship between the attenuation in the energy loss andthe electrical field strength can be presented by a mathematical function from curve fitting. Such a function is alsoimplemented to estimate the value of CEF.
In addition, other parametric studies have indicated the impacts of a variety of material properties and geometricparameters on the CEF and VCEF. For example, the CEF increases linearly with Poisson's ratio whereas Young's modulus has anegligible effect. It has also been found that PCEF and VCEF are functions of the beam aspect ratio alone. On the other hand,the CEF changes linearly with the scaling factor of the miniature model in a log–log diagram, meanwhile there exist twodistinct plateaus of CEF in the plot as a function of VCEF.
References
[1] M.F. Zaman, A. Sharma, Z. Hao, F. Ayazi, A mode-matched silicon-yaw tuning-fork gyroscope with subdegree-per-hour allan deviation bias instability,Journal of Microelectromechanical Systems 17 (6) (2008) 1526–1536.
[2] C. Comi, A. Corigliano, G. Langfelder, A. Longoni, A. Tocchio, B. Simoni, A resonant microaccelerometer with high sensitivity operating in an oscillatingcircuit, Journal of Microelectromechanical Systems 19 (5) (2010) 1140–1152.
[3] R.A. Barton, B. Ilic, S.S. Verbridge, B.R. Cipriany, J.M. Parpia, H.G. Craighead, Fabrication of a nanomechanical mass sensor containing a nanofluidicchannel, Nano Letters 10 (6) (2010) 2058–2063.
[4] C.T.C. Nguyen, MEMS technology for timing and frequency control, IEEE Transactions on Ultrasonics, Ferroelectrics and Frequency Control 54 (2) (2007)251–270.
[5] J.T.M. van Beek, R. Puers, A review of MEMS oscillators for frequency reference and timing applications, Journal of Micromechanics and Microengineering22 (1) (2011) 013001.
[6] Z. Hao, E. Ahmet, A. Farrokh, An analytical model for support loss in micromachined beam resonators with in-plane flexural vibrations, Sensors andActuators A: Physical 109 (1) (2003) 156–164.
[7] D. Bindel, S. Govindjee, Elastic PMLs for resonator anchor loss simulation, International Journal for Numerical Methods in Engineering 64 (6) (2005)789–818.
[8] C. Zener, Internal friction in solids. I. Theory of internal friction in reeds, Physical Review 52 (3) (1937) 230–235.[9] C. Zener, Internal friction in solids II. General theory of thermoelastic internal friction, Physical Review 53 (1) (1938) 90–99.
[10] R. Lifshitz, M.L. Roukes, Thermoelastic damping in micro-and nanomechanical systems, Physical Review B 61 (8) (2000) 5600–5609.[11] S. Prabhakar, V. Srikar, Theory of thermoelastic damping in micromechanical resonators with two-dimensional heat conduction, Journal of
Microelectromechanical Systems 17 (2) (2008) 494–502.[12] S. Prabhakar, M.P. Païdoussis, S. Vengallatore, Analysis of frequency shifts due to thermoelastic coupling in flexural-mode micromechanical and
nanomechanical resonators, Journal of Sound and Vibration 323 (1) (2009) 385–396.[13] S.J. Wong, C.H.J. Fox, S. McWilliam, Thermoelastic damping of the in-plane vibration of thin silicon rings, Journal of Sound and Vibration 293 (1) (2006)
266–285.[14] Z. Hao, Thermoelastic damping in the contour-mode vibrations of micro-and nano-electromechanical circular thin-plate resonators, Journal of Sound
and Vibration 313 (1) (2008) 77–96.[15] Y. Sun, T. Hironori, Thermoelastic damping of the axisymmetric vibration of circular plate resonators, Journal of Sound and Vibration 319 (1) (2009)
392–405.[16] Y. Sun, S. Masumi, Thermoelastic damping in micro-scale circular plate resonators, Journal of Sound and Vibration 329 (3) (2010) 328–337.[17] M. Zamanian, S.E. Khadem, Analysis of thermoelastic damping in microresonators by considering the stretching effect, International Journal of
Mechanical Sciences 52 (10) (2010) 1366–1375.[18] A.R. Vahdat, R. Ghader, Effects of axial and residual stresses on thermoelastic damping in capacitive micro-beam resonators, Journal of the Franklin
Institute 348 (4) (2011) 622–639.[19] S.B. Kim, J.H. Kim, Quality factors for the nano-mechanical tubes with thermoelastic damping and initial stress, Journal of Sound and Vibration 330 (7)
(2011) 1393–1402.[20] K. Tunvir, C.Q. Ru, A. Mioduchowski, Large-deflection effect on thermoelastic dissipation of microbeam resonators, Journal of Thermal Stresses 35 (12)
(2012) 1076–1094.[21] S. Vengallatore, Analysis of thermoelastic damping in laminated composite micromechanical beam resonators, Journal of Micromechanics and
Microengineering 15 (12) (2005) 2398.[22] S. Prabhakar, S. Vengallatore, Thermoelastic damping in bilayered micromechanical beam resonators, Journal of Micromechanics and Microengineering
17 (3) (2007) 532.[23] M.J. Silver, L.D. Peterson, R.S. Erwin, Predictive elastothermodynamic damping in finite element models using a perturbation formulation, AIAA Journal
43 (12) (2005) 2646–2653.
X. Guo, Y.B. Yi / Journal of Sound and Vibration 333 (2014) 1079–1095 1095
[24] R.N. Candler, A. Duwel, M. Varghese, S. Chandorkar, M. Hopcroft, W.T. Park, B. Kim, G. Yama, A. Partridge, M. Lutz, T.W. Kenny, Impact of geometry onthermoelastic dissipation in micromechanical resonant beams, Journal of Microelectromechanical Systems 15 (4) (2006) 927–934.
[25] Y.B. Yi, Geometric effects on thermoelastic damping in MEMS resonators, Journal of Sound and Vibration 309 (3) (2008) 588–599.[26] Y.B. Yi, Finite element analysis of thermoelastic damping in contour-mode vibrations of micro-and nanoscale ring, disk, and elliptical plate resonators.,
ASME Journal of Vibration and Acoustics 132 (4) (2010) 41015.[27] X. Guo, Y.B. Yi, S. Pourkamali, A finite element analysis of thermoelastic damping in vented MEMS beam resonators, International Journal of Mechanical
Science 74 (2013) 73–82.[28] Y.B. Yi, A. Rahafrooz, S. Pourkamali, Modeling and testing of the collective effects of thermoelastic and fluid damping on silicon MEMS resonators,
Journal of Micro/Nanolithography, MEMS, and MOEMS 8 (2) (2009) 023010.[29] S. Pourkamali, A. Hashimura, R. Abdolvand, G.K. Ho, A. Erbil, F. Ayazi, High-Q single crystal silicon HARPSS capacitive beam resonators with self-
aligned sub-100-nm transduction gaps, Journal of Microelectromechanical Systems 12 (4) (2003) 487–496.[30] S. Pourkamali, Z. Hao, A. Farrokh, VHF single crystal silicon capacitive elliptic bulk-mode disk resonators—Part II: implementation and characteriza-
tion, Journal of Microelectromechanical Systems 13 (6) (2004) 1054–1062.[31] K.L. Phan, P.G. Steeneken, M.J. Goossens, G.E.J. Koops, G.J.A.M. Verheijden, J.T.M. van Beek, Spontaneous mechanical oscillation of a DC driven single
crystal (2009). Nature Physics, 2011, http://dx.doi.org/10.1038/NPHYS1871.[32] P.G. Steeneken, K.L. Phan, M.J. Goossens, G.E.J. Koops, G.J.A.M. Brom, C. van der Avoort, J.T.M. van Beek, Piezoresistive heat engine and refrigerator,
Nature Physics 7 (4) (2011) 354–359.[33] C.S. Smith, Piezoresistance effect in germanium and silicon, Physical Review 94 (1) (1954) 42–49.[34] N. Kacem, S. Hentz, D. Pinto, B. Reig, V. Nguyen, Nonlinear dynamics of nanomechanical beam resonators: improving the performance of NEMS-based
sensors, Nanotechnology 20 (27) (2009) 275501.[35] N. Kacem, S. Baguet, S. Hentz, R. Dufour, Computational and quasi-analytical models for non-linear vibrations of resonant MEMS and NEMS sensors,
International Journal of NonLinear Mechanics 46 (3) (2011) 532–542.