Embed Size (px)
Citation preview
1
Journal of the College of Optometrists in Vision Development
ISSN 2374-6416 • Volume 1, Issue 1
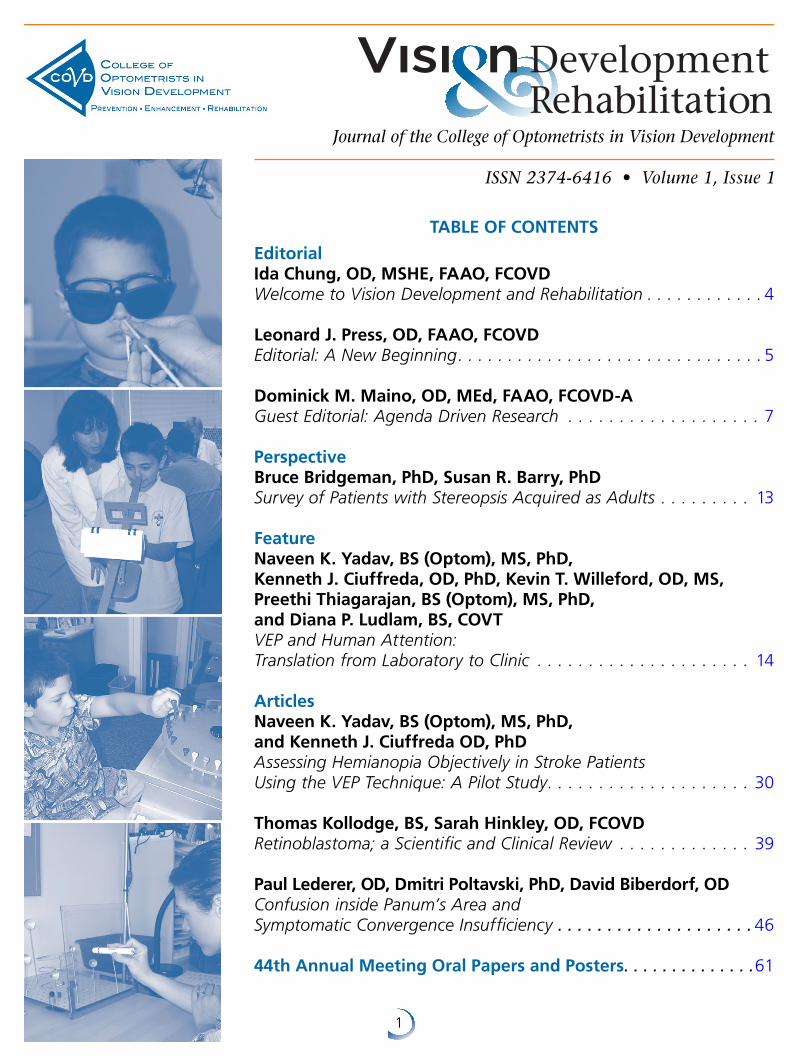
TABLE OF CONTENTS
EditorialIda Chung, OD, MSHE, FAAO, FCOVDWelcome to Vision Development and Rehabilitation . . . . . . . . . . . . 4
Leonard J. Press, OD, FAAO, FCOVDEditorial: A New Beginning . . . . . . . . . . . . . . . . . . . . . . . . . . . . . . . 5
Dominick M. Maino, OD, MEd, FAAO, FCOVD-AGuest Editorial: Agenda Driven Research . . . . . . . . . . . . . . . . . . . 7
PerspectiveBruce Bridgeman, PhD, Susan R. Barry, PhDSurvey of Patients with Stereopsis Acquired as Adults . . . . . . . . . 13
FeatureNaveen K. Yadav, BS (Optom), MS, PhD, Kenneth J. Ciuffreda, OD, PhD, Kevin T. Willeford, OD, MS, Preethi Thiagarajan, BS (Optom), MS, PhD, and Diana P. Ludlam, BS, COVTVEP and Human Attention: Translation from Laboratory to Clinic . . . . . . . . . . . . . . . . . . . . . 14
ArticlesNaveen K. Yadav, BS (Optom), MS, PhD, and Kenneth J. Ciuffreda OD, PhDAssessing Hemianopia Objectively in Stroke Patients Using the VEP Technique: A Pilot Study . . . . . . . . . . . . . . . . . . . . 30
Thomas Kollodge, BS, Sarah Hinkley, OD, FCOVDRetinoblastoma; a Scientific and Clinical Review . . . . . . . . . . . . . 39
Paul Lederer, OD, Dmitri Poltavski, PhD, David Biberdorf, ODConfusion inside Panum’s Area and Symptomatic Convergence Insufficiency . . . . . . . . . . . . . . . . . . . . 46 44th Annual Meeting Oral Papers and Posters. . . . . . . . . . . . . .61
2Vision Development & Rehabilitation Volume 1, Issue 1 • April 2015
Journal of the College of Optometrists in Vision DevelopmentISSN 2374-6416 • Volume 1, Issue 1
Vision Development & Rehabilitation Editorial Staff
Editor-in-Chief Leonard J. Press, OD, FAAO, FCOVD
Managing Editor Katie Kirschner, MS
Advertising Manager Jackie Cencer, CMP
Graphic Design & ProductionAverill & Associates Creative Lab, Inc.
Mary B. Averill, President
College of Optometrists in Vision Development Board of Directors
President Ida Chung, OD, MHSE, FAAO, FCOVD
President-Elect Kara Heying, OD, FCOVD
Vice President Christine Allison, OD, FCOVD
Secretary-Treasurer Barry Tannen, OD, FCOVD
Immediate Past President David Damari, OD, FCOVD
Directors Marie Bodack, OD, FCOVD
Jennifer Dattolo, OD, FCOVD
Pat Pirotte, OD, FCOVD
Daniel Press, OD, FCOVD
Executive Director Pamela R. Happ, MSM, CAE
Vision Development & Rehabilitation (VDR) is published quarterly by the College of Optometrists in Vision Development. All rights reserved. No part of this publication may be reproduced or utilized in any form without permission in writing from the Editor. ISSN 2374-6416. All expressions of opinions and statements of supposed fact published in signed articles do not necessarily reflect the views or policies of the College of Optometrists in Vision Development (COVD), which does not endorse any specific educational program or products advertised in VDR. Letters to the Editor may be edited for content and space availability. Acceptance of advertising or optical industry news for publication in VDR does not imply approval or endorsement of any product or service by either VDR or COVD. Editorial Office: Journal correspondence regarding manuscripts, letters, and reports should be addressed to: Editor-in-Chief, Leonard Press, OD, FCOVD, and send to [email protected]. Please contact the editor for a copy of the VDR Guidelines for Authors or download at http://www.covd.org/?page=VDR. Production: Averill & Associates Creative Lab, Inc., 17654 Walnut Trail, Chagrin Falls, OH 44023. Any article, editorial, column or other item submitted to the VDR by an author for review and eventual publication indicates the authors’ approval for publication and assignment of copyright to VDR. VDR is indexed in the Directory of Open Access Journals.
SUBMISSION OF MANUSCRIPTS
The entire manuscript submission and review process is conducted through Editorial Manager. All manuscripts are submitted at www.editorialmanager.com/vdr. A copy of Guidelines for Authors is available on the home page of the VDR Editorial Manager site or on the COVD website http://www.covd.org/?page=VDR. Editorial Manager will require you, as an Author and/or Reviewer, to create an account the first time you access the site. If you have questions with the site or the process please contact Managing Editor, Katie Kirschner at [email protected].
If access to Editorial Manager is not available please e-mail the Editor with your request for the Guidelines and submit your manuscripts to [email protected].
Beta Sigma Kappa Application Guidelines . . . . . . . 12
Thanks to Our Sponsors for the COVD 45th Annual Meeting . . . . . . . . . . . . . . 38
Are You Connected?. . . . . . . . . . . . . . . . . . . . . . . . 45
Thanks to the Exhibitors for Their Support of our COVD 45th Annual Meeting . . . . . . . . . . . . . . 60
COVD PSAs Available in High Definition . . . . . . . . .91
46th Annual Meeting . . . . . . . . . . . . . . . . . . . . . . .93
Event Calendar . . . . . . . . . . . . . . . . . . . . . . . . . . . .94
Thank You to our Advertisers:Bernell Expansion Consultants NuSquared

3Vision Development & Rehabilitation Volume 1, Issue 1 • April 2015
Journal Review Board
Editor’s Advisory Board
Curtis Baxstrom, OD, FCOVD, FNORA
Chris Chase, PhD, FAAO
Kenneth Ciuffreda, OD, PhD, FCOVD-A
Michael Gallaway, OD, FAAO, FCOVD
Sarah Hinkley, OD, FAAO, FCOVD
Neera Kapoor, OD, MS, FAAO, FCOVD-A
Diana Ludlam, COVT
W.C. Maples, OD, MS, FAAO, FACBO, FCOVD
Paul Freeman, OD, FAAO, FCOVD Former Editor of Optometry
Dominick Maino, OD, MEd, FAAO, FCOVD-A Former Editor of Optometry and Vision Development
Irwin Suchoff, OD, DOS Former Editor of Journal of Behavioral Optometry
Marc Taub, OD, FAAO, FCOVD Current Editor of Optometry and Visual Performance
Mark Mintz, MD
G. Lynn Mitchell, MAS, FAAO
Maureen Powers, PhD, FCOVD-A
Beth Rolland, OTR, CDRS
Jack Richman, OD, FAAO, FCOVD
Mitchell Scheiman, OD, FAAO, FCOVD
Samantha Slotnick, OD, FAAO, FCOVD
Barry Tannen, OD, FAAO, FCOVD
Journal of the College of Optometrists in Vision DevelopmentISSN 2374-6416 • Volume 1, Issue 1
4Vision Development & Rehabilitation Volume 1, Issue 1 • April 2015
The College of Optometrists in Vision Development is extremely pleased to present to our readers Vision Development and Rehabilitation (VDR), for this journal advances the mission of COVD — improving lives by advancing excellence in optometric vision therapy through education and board certification. VDR also exemplifies the vision of COVD — To facilitate ongoing progress in developmental vision care, advocate for wider adoption of optometric vision therapy, and increase recognition of its integral role in enhancing learning, rehabilitation, productivity, and overall quality of life. As such, VDR embodies the advancement of developmental vision care, vision therapy and vision rehabili-tation to improve patient’s quality of life through a better understanding of vision and multi-sensory rehabilitation.
The COVD board wishes to recognize the many people whose unwavering enthusiasm, persistence, and support made this first issue of VDR a reality. These individuals include our friend and colleague Dr. Leonard J. Press and his editorial review board, and the COVD international office.
Thank you for reading the first issue of Vision Development and Rehabilitation, with the promise of many more issues to come.
“ Dr . Press is a close friend and colleague whom I have known since I was a student at the Pennsylvania College of Optometry and he was the Chief of the Binocular Vision Clinic . I knew he was the perfect person to become the Founding Editor of “Vision Development and Rehabilitation,” but I had some trepidation in asking him to take on such a large commitment . After due thought and consideration, he answered in the affirmative and I knew that our journal was off to a great start .”
— Barry Tannen, OD, FCOVD
“ I am so excited to have a new journal highlighting this area of Optometry . I look forward to it as an academic because it will give me more options of places to publish . As a reader, I am excited to read about more interesting cases from which I can learn new management strategies to help my patients . I can’t wait to read this first issue!”
— Christine Allison, OD, FCOVD
Editorial: Welcome to Vision Development and Rehabilitation Ida Chung, OD, MHSE, FAAO, FCOVD
5Vision Development & Rehabilitation Volume 1, Issue 1 • April 2015
It is my distinct pleasure to introduce our new journal, Vision Development and Rehabilitation (VDR), the official journal of the College of Optometrists in Vision Development. Before addressing the contents of the journal, I’d like to share a little bit of history with you. The quarterly journal known as the Journal of Optometric Vision Development was introduced in 1975. Its first editor was Dr. Robert Wold, who seeded many beginnings in our organization, followed one year later by Dr. Martin Kane and subsequently by Drs. James Bosse, Sidney Groffman, and Dominick Maino.
Each editor has had an impact on the evolution of the Journal. These distinctions have been transformative, and served as a bridge to where we are today. Dr. Kane incorporated ERIC abstracts and an Annual Review of the Literature. Dr. Bosse commissioned Annual Topical Subject Reviews, and I had the privilege of writing a number of them. Dr. Groffman added thought-provoking editorials and a wide-ranging style. Dr. Maino engineered the online presence of the journal and a name change to Optometry and Vision Development . For a period of one year in 2013, COVD and OEPF combined their respective journals into Optometry and Vision Development of which Drs. Maino and Taub were co-editors.
Vision Development & Rehabilitation is a quarterly journal featuring scientific, peer-reviewed articles in the fields of vision development and vision rehabilitation. Our mission is to serve as an authoritative source of information in vision development and rehabilitation through peer reviewed articles. The editor and journal review board will consider manuscripts in fields related to development and rehabilitation, including but not limited to: optometric vision therapy,
cognitive rehabilitation, behavioral vision care, visual impairment, applied cognitive and visual neuroscience, behavioral medicine, occu pa tional and physical therapy, learning and education. Reviews, case reports, and perspective pieces will be considered, but priority will be accorded to manuscripts of original research. Appealing to a trans-disciplinary view of vision, the journal’s review board is comprised of professionals from the disciplines of Optometry, Vision Science, Medicine, Occupational Therapy, and Biostatistics.
This inaugural issue leads with a Guest Editorial on Agenda Driven Research from Dr. Dominick Maino, which is thought provoking in a constructive way. You’ll see what I mean when you read it, and our intent in publishing it is to catalyze further dialogue in the clinical, didactic and research communities.
A unique opportunity for crowd sourcing will occur through the Perspective Piece on Stereoscopic Vision from Drs. Bruce Bridgeman and Susan Barry. Sue is well known to of our readership through prior authorship and presentations, so permit me to introduce you to Bruce with whom you may not be as familiar. Dr. Bridgeman holds a PhD in physiological psychology from Stanford and is a Professor of Psychology and Psychobiology at U.C. Santa Cruz. He is an individual with strabismus who has collaborated with U.C. Berkeley College of Optometry and published an article in the Academy journal last year about his stereo scopic experiences after watching the movie Hugo.
Editorial: A New Beginning Leonard J. Press, OD, FAAO, FCOVD, Editor-in-Chief
6Vision Development & Rehabilitation Volume 1, Issue 1 • April 2015
The survey that he and Sue have designed has a weblink so that it can be completed and analyzed online. You can be instrumental in encouraging patients who have developed stereoscopic vision to complete the survey.
Our featured paper is VEP and Human Attention: Translation from Laboratory to Clinic, by Yadav, Ciuffreda, Willeford, Thiagarajan, and Ludlam, which I believe is destined to become a classic in the field. Ciuffreda and colleagues at SUNY College of Optometry have consistently been at the cutting edge of research in our field. There is a second paper from Yadav and Ciuffreda that is a pilot study, in which hemianopia is assessed objectively in stroke patients using the VEP Technique. Thomas Kollodge and Dr. Sarah Hinkley have contributed a review article on Retinoblastoma. Dr. Hinkley is a Professor and Chief of Vision Rehabilitation Services at Michigan College of Optometry. Rounding out our original papers is the article by Lederer, Poltavsi, and Biberdorf looking at nearpoint fixation disparity in the context of convergence insufficiency.
In this issue you will also find abstracts of papers and posters presented at last year’s Annual Meeting of the College of Optometrists in Vision Development. This will be an annual feature of our journal. I will be attending other meetings such as NORA (Neuro-Optometric
Rehabilitation Association). Although COVD does not have a formal relationship with NORA, the link between vision development in COVD and vision rehabilitation in NORA sets the stage for a natural synergy in pooled scholarly activities.
I plan to maintain close ties with the AOA (the American Optometric Association), the AAO (American Academy of Optometry) and OEPF (the Optometric Extension Program Foundation) and to lend voice to other organizations with whom you may not be as familiar. Our journal will pursue being listed in indices such as PMC (PubMed Central) to complement our trans-disciplinary vision. PMC is a full-text archive of biomedical and life sciences journal literature at NIH/NLM, the U.S. National Institutes of Health’s National Library of Medicine. As your editor-in-chief, I will tap into the wisdom of former and current journal editors, rely on input from our journal review board and reviewers, and welcome feedback from you - our members and readership.
Many individuals have been instrumental in creating VDR, but one who stands out is Ms. Katie Kirschner, our Managing Editor. My thanks and appreciation is extended to the COVD board and staff for their support in this endeavor as we look forward to our journal as an innovative, informative, and educational venture.
7Vision Development & Rehabilitation Volume 1, Issue 1 • April 2015
Last summer I was present at a meeting hosted by the School of Optometry at the University of Waterloo. This meeting was attended by the best and the brightest of Europe’s researchers with expertise in pediatric eye problems, amblyopia, strabismus, and issues adversely affecting vision development. I decided to attend the Child Vision Research Society’s meeting for a number of reasons including the outstanding keynote speakers. Another reason I wanted to attend was that one of the attendees was an individual that I had collaborated with on a project whom I had never met in person. She was delightful to work with and was also a very well-known and respected researcher. Researchers, faculty, clinicians, and orthoptists from New Zealand, Nepal, Korea, Israel, the UK and the USA were in attendance.
Besides the great keynote speakers (Drs. Susan Cotter, Professor, Southern California College of Optometry; Daphne Maurer, Professor, Department of Psychology, McMaster University; Saint-Amour, Associate Professor, Department of Psychology at the Université du Québec a Montréal), this exceptional program featured various paper and poster presentations. The final day we were all bussed to The Hospital for Sick Children in Toronto for additional lectures and tours of the facility. I soon realized that this particular meeting was somewhat different than those I usually attend. For instance, I noticed that several of the research projects did not appear to be completed but rather ongoing in nature.
When one of these not quite completed research papers was presented to the 100+ member audience, something rare occurred. The audience, in a non-critical, helpful, “let me be your friendly advisor” way offered constructive criticism on how the project could be improved,
altered and/or changed to make it more meaningful and robust. None of the meetings I usually go to allow uncompleted research to be presented and do not often have this friendly critique assistance for the researcher. I found this an excellent way to introduce new researchers into the peer research relationship that allows a much gentler approach then what I’ve experienced in the past.
During the meeting a paper entitled “Does – And How Does – Vision Therapy (Orthoptic Treatment) Work?” was then presented. No constructive criticism was offered even though there were some serious flaws in the research design and interpretation of the outcomes. The conclusion of this research was “While vergence exercises have some effect, effort and possibly voluntary influences are a major factor in effecting change … Very careful attention should be paid to these effects when studying eye exercises.” The impression given and actually stated was that “eye exercises” did not cause the improvement and all the subject had to do was to “try harder” .
At noon the group broke for lunch and I deliberately sought out the presenter. She was a dedicated, excellent researcher. She had a sharp mind and congenial demeanor. I did not discuss my concerns about her research over lunch. I wanted to use that time primarily to get to know her in a friendly non-antagonistic environment. Since this presentation was made to a small
Guest Editorial: Agenda Driven Research Dominick M. Maino, OD, MEd, FAAO, FCOVD-A Professor of Pediatrics/Binocular Vision Illinois College of Optometry;
Lyons Family Eye Care, Chicago, Illinois
8Vision Development & Rehabilitation Volume 1, Issue 1 • April 2015
group, during a single meeting, I figured this was not a fight worth fighting at this time.
I was wrong.Several months later, the article “Change in
convergence and accommodation after two weeks of eye exercises in typical young adults” by Horwood, Tor, and Riddle appeared digitally as a Major Article in press for the Journal of the American Academy of Pediatric Ophthalmology and Strabismus.1 It was obvious to me that the peer review system of AAPOS either broke down or was a willing partner in this agenda driven research publication. This was not the first time I had seen what appears to be a deliberate misuse of the peer review system resulting in the publication of an article with significant problems and/or questionable conclusions.2 [I addressed many of these problems in an editorial that is available online of your review (Ophthalmology Causes Myopia!) .3 http://goo.gl/n0RONA]
Specific Problems with the PaperTo the authors’ credit they did list several
areas of concern that could have affected the outcomes and conclusions of this article. However they did not point out many of the most important shortcomings of this particular publication. These areas are discussed below:
1) Poor or a total absence of under stand ing what optometric vision therapy is and/or does. Terms used such as eye exercises and the use of quotations around the phrase vision therapy, clearly demonstrate this lack of knowledge and experience and the disdain the researchers have for this form of intervention.
2) They single out optometric vision therapy as too time consuming and intensive. This shows a lack of understanding of the concept of therapy. Physical therapy, occupational therapy, speech and language therapy and psychological therapeutic intervention often require weeks, months and in some situations,
years to be effective. I have not heard from our medical and scientific colleagues that this a major burden for their patients when these therapists help their patients, it appears that only vision therapy is judged in this manner.
3) The researchers failed to include a single individual (unlike the CITT study) that had the training, knowledge and perhaps an opposing viewpoint promoted by this agenda driven article. If all researchers start with the same assumptions, biases and predispositions; what is the possibility that the research conclusions would be something other than a reflection of these assumptions, biases and predispositions?
Tavris and Aronson, in their text, Mistakes were made, but not by Me: Why we justify foolish beliefs, bad decisions and hurtful acts, nicely reviews why we find it so difficult to admit when we are wrong. Unfor-tunately, even when the facts are present ed, we choose to ignore them and hold on to these erroneous beliefs.4 We do not respond well to cognitive dissonance and often use any available mechanism to resolve this intellectual conflict in a way that preserves the status quo.5
4) The researchers stated in their introduction that the “Research [CITT] concentrated on relief of symptoms … without changes to the ocular responses…”. This, of course, is incorrect. The CITT study not only showed an improvement in symptoms (as a primary outcome) but also in the measures of vergence, accommodation and other areas (a stated secondary outcome) with in office vision therapy with home vision therapy being the most efficacious.
5) The methods used in this study, have no, to little relationship to the actual procedures utilized by optometrists while
9Vision Development & Rehabilitation Volume 1, Issue 1 • April 2015
conducting vision therapy, nor to those methods used in the CITT clinical trials.
a. The subjects in this study were self-reported asymptomatic college stu-dents, 18-25 years of age. The CITT subjects were symptomatic and were shown clearly to have convergence insufficiency using a mutually agreed upon set of criteria. The CITT study utilized a research supported survey to determine if symptoms were present. This study depended upon subjects who considered themselves to have “normal” eyes.
b. The CITT study used those diagnostic and therapeutic tools frequently utilized in clinical practice. This study used Gabor images and other tools usually not utilized when conducting diagnostic testing or a program of therapy.
c. They stated that “Instructions [to the subjects] were minimal…”. The clinician usually gives fairly detailed instructions so that the patient knows exactly what to do and how to perform the therapy. Did these subjects have an appropriate understanding of the tasks and how to respond?
d. The 156 subjects were divided into 2 control groups or to one of six “eye exercise” groups. The second control group was just asked to “try harder” at performing the task. This resulted in 8 experimental groups among 156 test subjects resulting in a study with a very small number of individuals assigned to each of the experimental groups.
e. There was no description of any of the home “eye exercises”. Depending upon the experimental group, the subjects were asked to do the exercise 3 times/day for 5 minutes each time. The home therapy included monocular push-ups, monocular “jump accom-mo dation”, monocular accom mo da-
tive facility (they did note that they used +/-2.00 D); binocular vergence/accommodation activities (they do not state if there were any suppression controls) and placebo therapy (“Snakes” illusion, Necker cube, yoked prisms). No rational was given for using these placebo therapies. Unlike the CITT clinical trials, no research was conducted to show that these placebo therapies were appropriate to use.
f. The researchers depended upon the honesty of their subjects to report missed therapy sessions. They also used cell phone alarms and diaries which were “informally” examined to determine if therapy was done. Anytime you are conducting therapy at home as part of a research study, you must have an appropriate mechanism to determine if therapy was actually conducted or not. The CITT study had such protocols. This study was obviously lacking in this area.
g. One of the most significant and major flaws of this study was the total lack of understanding of therapy and how it is conducted in the real clinical world. They used the phrase “try harder” with only one group of subjects and then were surprised that that group had such good results. In the real world of therapy, encouragement, asking the patient to try harder, and other mechanisms that improve outcomes and to achieve success are always utilized.
h. Finally, as noted initially, but worth repeating, these subjects were asymp-to matic, apparently had no binocular vision problems and did not require any therapy whatsoever.
One of the statements they made and one I cannot disagree with was “It is clear that the
10Vision Development & Rehabilitation Volume 1, Issue 1 • April 2015
greatest influence in changing responses to an approaching target is how the participant is instructed and the amount of effort exerted.” Functional optometrists and their therapists use a well-crafted instruction set when conducting diagnostic and therapeutic activities and like all therapists always encourage the very best efforts from their patients.
One of the statements at the very end of the paper that has little to no scientific support or justification was “In the view of the importance of effort in comparison to true treatment effects of different exercises and the costs in terms of professional time, loss schooling, and many office visits of a long course of in-office vision therapy, maximizing motivation and feedback strat e gies or less costly home exercises seems desirable.” Is it really less costly to recommend a home therapy procedure, when the CITT studies clearly showed in-office therapy was the most efficacious? Out of office therapy often involves multiple trips to the office for progress evaluations and in the end a recommendation for in-office therapy in most instances.
This paper failed on many different levels when trying to answer the question, “Does – And How Does – Vision Therapy (Orthoptic Treatment) Work?” If they had reviewed Ciuffreda’s 2002 paper (The scientific basis for and efficacy of Optometric vision therapy in nonstrabismic accommodative and vergence disorders)6 they would have had a better understanding of the science supporting vision therapy.
Why did this paper appear in print? The answer is perhaps both simple and complex. Medicine, various researchers and others may fear that functional optometry has been right all along.
Functional optometry was right about amblyopia.a We have always supported the concept that neuroplasticity is present at all ages.7 We have always known clinically that amblyopia could be treated at any age. We have always known that amblyopia was a
binocular vision problem and not just a problem of visual acuity and used binocular vision therapy to treat this dysfunction. We have always known that the research of Hubel and Wiesel was inappropriately interpreted and that this resulted in delayed or no treatment for tens of thousands of patients.
Research supports the ability to treat amblyopia at any age.b Research supports that treating amblyopia as a binocular vision problem using binocular therapy is appropriate.8,9,10,11
Ophthalmology and those who supported ophthalmology should have known this as well. They should have known this since those adult patients who were amblyopic and then lost vision in the better seeing eye, almost always had an improved visual acuity in the amblyopic eye over time. They chose to ignore what they were seeing clinically, in large part, because it did not fit their beliefs and biases and because it supported the views of functional optometry.
We were right about refractive error. The environment does influence its development and that if that environment is manipulated appropriately, you can alter refractive error outcomes.12,13,14
We were right about learning related vision problems. Well, this one has support on both sides of the issue. The CITT-ART study15 should help resolve some of the questions regarding vision therapy and how it affects academic performancec,d.
The more complex reason has to do with agenda driven research and the mechanisms involved when these papers are presented and published. Agenda driven research does not promote good science. It does not promote honest inquiry and it does not support better patient care.
It is time for all to put aside our agendas, our biases, our preconceived notions. It is time to work together to determine best practices even if it is contrary to prevailing opinion. The world is not flat. Amblyopia can be treated at any age. And optometric vison therapy is an

11Vision Development & Rehabilitation Volume 1, Issue 1 • April 2015
appropriate treatment modality for disorders of he binocular vision system.
Footnotesa. For a review of many of the PEDIG study see this Slideshare
presentation: http://goo.gl/3WjN4p
b. For a review of articles dealing with vision and learning see: http://goo.gl/aZcY8S
c. Joint Statement on Vision, Learning and Dyslexia: http://goo.gl/izyROZ
d. Care of the Patient with Learning Related Vision Problems: http://goo.gl/gfuvpP
REFERENCES1. Horwood AM, Tor SS, Riddle PM. Change in convergence
and accommodation after two weeks of eye exercises in typical youg adults. Journal of the Amer Acad Pediat Ophthal Strab. 2014;1-7.
2. Donahue S. How often are spectacles prescribed to “normal” preschool children? JAAPOS; 2004: 8(3):224–229. (available from http://goo.gl/zRJEn3)
3. Maino D. Ophthalmology Causes Myopia! J Optom Vis Dev 2004;35 (2):67-69.
4. Maino D. Mistakes were made (Yes by you!). Optom Vis Dev 2011;42(2):66-69
5. Maino D. An Open Letter to David K Wallace, MD, MPH (and other disbelievers and holders of outdated and biased opinions and beliefs). Optom Vis Dev 2008;39(4):178-180.
6. Ciuffreda KJ. The scientific basis for and efficacy of optometric vision therapy in nonstrabismic accommodative and vergence disorders. Optometry. 2002;73(12):735-62.
7. Maino D, Donati, R, Pang, Viola S, Barry S. Neuroplasticity. In Taub M, Bartuccio M, Maino D. (Eds) Visual Diagnosis and Care of the Patient with Special Needs; Lippincott Williams & Wilkins. New York, NY;2012:275-288.
8. Levi DW, Li RW. Perceptual learning as a potential treat ment for amblyopia: A mini-review. Vis Research 2009;49(21): 2535–2549
9. Bavelier D, Levi DW, Li RW et al. Removing brakes on adult brain plasticity: from molecular to behavioral interventions. J Neuroscience 2010 30(45):14964-14971
10. Li RW, Ngo C, Nguyen J, Levi DM. Video-game play induces plasticity in the visual system of adults with amblyopia. 2011;PLoS Biol 9(8): e1001135. doi: 10.1371/journal.pbio.1001135. available from http://goo.gl/ewpyuQ accessed 1/2015
11. Astle AT, Webb BS, McGraw PV. Can perceptual learning be used to treat amblyopia beyond the critical period of visual development? Ophthalmic Physiol Opt 2011;31:564-573.
12. Sankaridurg P, Holden B, Smith E, et al. Decrease in rate of myopia progression with a contact lens designed to reduce relative peripheral hyperopia: one-year results. Invest. Ophthalmol. Vis. Sci. 2011;52(13): 9362-9367.
13. Cheng D, Woo GC, Schmid KL. Bifocal lens control of myopic progression in children. Clin Experimental Optom 2011; 94(1):24–32
14. Rose KA, Morgan IG, Ip J. Outdoor activity reduces the prevalence of myopia in children. Ophthalmology 2008; 115(8):1279–1285
15. CITT-ART information: http://citt-art.com/
12Vision Development & Rehabilitation Volume 1, Issue 1 • April 2015
Beta Sigma Kappa — COVD Research Grant Application GuidelinesBackground
The Beta Sigma Kappa (BSK) – COVD Research Grant program administered by the College of Optometrists in Vision Development (COVD) supports optometric and vision science faculty research and optometric resident research. The fund will provide support for optometric faculty research and/or optometric resident research in binocular vision and/or visual performance issues. Annual grant will consist up to $2,000.
Award and EligibilityAll optometric related faculty and optometry
residents at an accredited school or college of optometry, irrespective of membership in BSK or COVD, are eligible to apply for a BSK-COVD Research Grant.
One grant will be awarded up to $2,000 annually. Funds support research conducted for a period up to one year.
Both BSK and COVD are 501(c)(3) non-profit organiza tions; our policy is not to cover any indirect costs associated with research grants for any other of our programs. This policy applies uniformly to all award recipients.
Recipients must submit a final report of their research findings no later than one year post award or the applicant and/or institution become ineligible for funding the subsequent year. The preferred submission is an article in a form suitable for publication.
Recipients are encouraged to present at the annual meeting of COVD and to submit a manuscript to an optometric journal for publication. Any manuscript or publication material produced must acknowl edge Beta Sigma Kappa International Optometric Honor Society and the College of Optometrists in Vision Development.
DeadlineThe deadline for applications is August 1st.
Submission and Review ProceduresSubmissions should consist of 6 pages or less, preferably in PDF format and contain the following:
a. Cover page with project title, institution and address, name (including degree(s)), and title for faculty member with contact information.
b. Research plan •Statementofproblem •Experimentaldesign
•Institutionandotherresourcesavailable •Relevance of problem to clinical optometry,
vision science, or eye related public health •Plansforpublication •Timetablec. Budget explanation •Stateamountofgrantrequest •Describe/Itemizecosts •Justification for equipment, supplies and
other expenses
Note: Nominal research subject payments are allowable.d. Helsinki declaration (required only if human
subjects involved)
e. Letter of endorsement by faculty advisor, Dean or President/Director of the school/college that also indicates the proposal was reviewed and meets with the standards of the institution.
Submissions and supporting materials should be emailed to [email protected] and include the words BSK + last name of applicant in the subject line of the email.
Submissions will receive a confirmation receipt by e-mail from COVD within 3 business days of receipt. If you do not receive a confirmation, contact Jackie Cencer at [email protected] or 330.995.0718 office to ensure the application is on file.
Submissions will be reviewed by the BSK Board of Regents and the BSK Central World Council, both in collaboration with the COVD.
Recognition of AwardeesThe award recipient(s) and an institution
represent ative will be invited to attend the COVD Annual Meeting where at the COVD Awards Luncheon, the recipient(s) will be recognized.
All award recipients by application and acceptance of an award agree to allow the COVD and the program sponsor, Beta Sigma Kappa International Honor Society, to publish their name, image, institution information, and any statement or quote provided by the recipient. These may appear in a variety of media formats that will announce and promote the program including, but not limited to, the COVD and/or sponsor annual report, website, social media, newsletters, and annual meeting promotional materials.
For additional information about this award and the College of Optometrists in Vision Development, contact Jackie Cencer, at [email protected] or 330.995.0718.
13Vision Development & Rehabilitation Volume 1, Issue 1 • April 2015
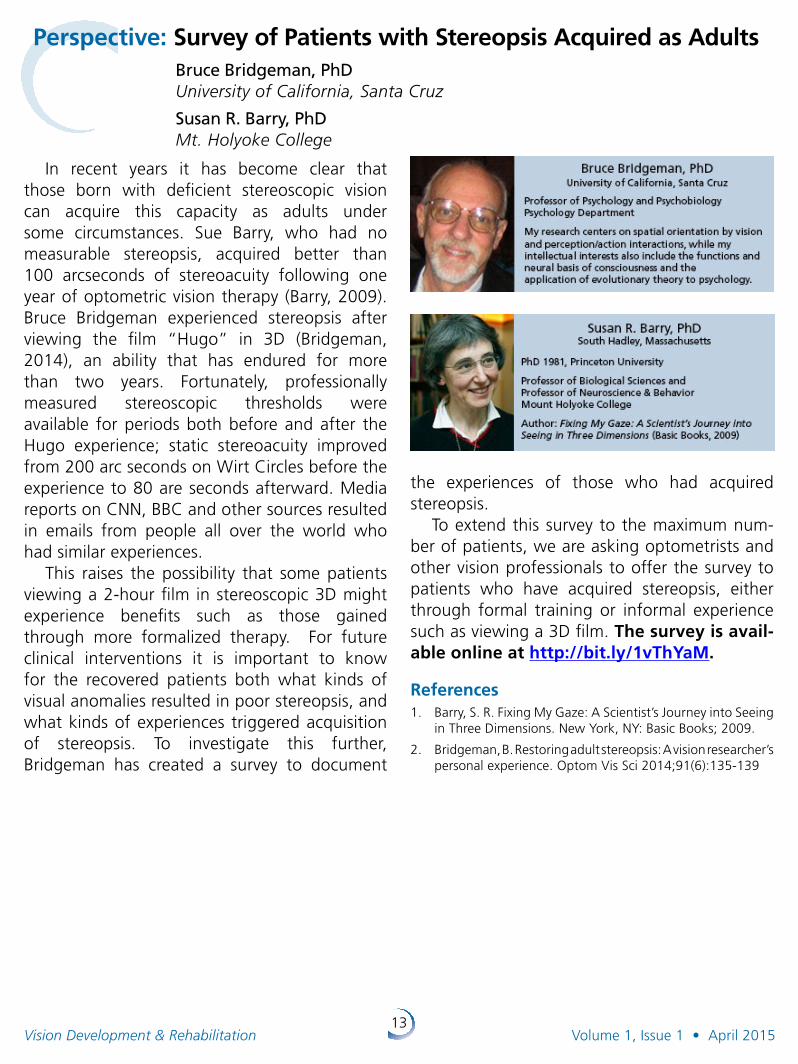
In recent years it has become clear that those born with deficient stereoscopic vision can acquire this capacity as adults under some circumstances. Sue Barry, who had no measurable stereopsis, acquired better than 100 arcseconds of stereoacuity following one year of optometric vision therapy (Barry, 2009). Bruce Bridgeman experienced stereopsis after viewing the film “Hugo” in 3D (Bridgeman, 2014), an ability that has endured for more than two years. Fortunately, professionally measured stereoscopic thresholds were available for periods both before and after the Hugo experience; static stereoacuity improved from 200 arc seconds on Wirt Circles before the experience to 80 are seconds afterward. Media reports on CNN, BBC and other sources resulted in emails from people all over the world who had similar experiences.
This raises the possibility that some patients viewing a 2-hour film in stereoscopic 3D might experience benefits such as those gained through more formalized therapy. For future clinical interventions it is important to know for the recovered patients both what kinds of visual anomalies resulted in poor stereopsis, and what kinds of experiences triggered acquisition of stereopsis. To investigate this further, Bridgeman has created a survey to document
the experiences of those who had acquired stereopsis.
To extend this survey to the maximum num-ber of patients, we are asking optometrists and other vision professionals to offer the survey to patients who have acquired stereopsis, either through formal training or informal experience such as viewing a 3D film. The survey is avail-able online at http://bit.ly/1vThYaM.
References1. Barry, S. R. Fixing My Gaze: A Scientist’s Journey into Seeing
in Three Dimensions. New York, NY: Basic Books; 2009.
2. Bridgeman, B. Restoring adult stereopsis: A vision researcher’s personal experience. Optom Vis Sci 2014;91(6):135-139
Perspective: Survey of Patients with Stereopsis Acquired as Adults Bruce Bridgeman, PhD University of California, Santa Cruz
Susan R. Barry, PhD Mt . Holyoke College
14Vision Development & Rehabilitation Volume 1, Issue 1 • April 2015
traumatic brain injury (mTBI), the most common variety of TBI (~70-80%), occurs as a result of injury to the brain due to blunt or penetrating head insult.2 It produces widespread damage to the underlying brain tissues. This occurs due to the initial and immediate biomechanical effects3 (e.g., coup-countrecoup, shearing, etc.), as well as the subsequent adverse biomolecular/biochemical changes that occur over the next days and weeks.4,5 These effects produce diffuse axonal injury (DAI). The DAI is responsible for slowing and delaying cortical information processing.6
mTBI results in a constellation of adverse effects. These are of a sensory, motor, perceptual, ling uistic, cognitive, attentional, and/or behavioral nature.7-9 Most of the cranial nerves (i.e., II, III, IV, V, VI, VII, VIII, and XI) are involved in vision and visual processing in some way.10 In addition, 30-40 distinct cortical areas of the brain receive and/or process visual information.11 Thus, it is not surprising that a range of visual deficits frequently occur following mTBI.7,8,12,13
Featured Article: VEP and Human Attention: Translation from Laboratory to Clinic
Naveen K. Yadav, B.S. (Optom), MS, PhD
Kenneth J. Ciuffreda, OD, PhD
Kevin T. Willeford, OD, MS
Preethi Thiagarajan, B.S. (Optom), MS, PhD
Diana P. Ludlam, BS, COVT
SUNY State College of Optometry, Department of Biological and Vision Sciences
INTRODUCTIONTraumatic brain injury (TBI) is a major health
issue in the United States.1 Approx imately 1.7 million people suffer from a TBI annually. Mild
Correspondence regarding this article should be emailed to Naveen K . Yadav at [email protected] or call 212-938-5774. All state ments are the author’s personal opinion and may not reflect the opinions of the College of Optometrists in Vision Development, Vision Development & Rehabilitation or any institution or organization to which the author may be affiliated . Permission to use reprints of this article must be obtained from the editor . Copyright 2015 College of Optometrists in Vision Development . VDR is indexed in the Directory of Open Access Journals . Online access is available at covd.org . https://doi.org/10.31707/VDR2015.1.1.p14
Yadav N, Ciuffreda K, Willeford K, Thiagarajan P, Ludlam, D. Vep and human attention: translation from laboratory to clinic. Vision Dev & Rehab 2015;1(1):14-29.
Keywords: attention, visual-evoked potential (VEP), mild traumatic brain injury (mTBI)
ABSTRACTThe purpose is to review recent studies from our laboratory that used the visual-evoked
potential (VEP) to assess attention in both the visually-normal (VN) and mild traumatic brain injury (mTBI) populations. The VEP (amplitude and latency), and attention-related alpha band responses, were assessed. The alpha responses were abnormal in those with mTBI. Furthermore, these values differentiated well between mTBI with versus without an attentional deficit. Following oculomotor vision rehabilitation, the alpha and VEP responses increased significantly. The VEP technique can be used reliably in both clinic and laboratory settings to detect attention objectively in both VN and mTBI populations.
15Vision Development & Rehabilitation Volume 1, Issue 1 • April 2015
One of the most common problems in mTBI is a presence of a general/visual attentional deficit .8,14-16 Attentional deficits, both general and visual, occur in approx imately 50-60% of the TBI population.17,18 Symptoms include problems reading and slow visual information processing, as well as visual distractibility.12-14,19
Thus, such a deficit will adversely effect activities of daily living (ADLs),18 as well as rehabilitative progress.20
Different cortical (i.e., visual cortex, frontal, and parietal lobes) and subcortical (i.e., thalamus) areas of the brain are involved in general and visual attentional processing,16,21 with visual attentional processing initiated in the primary visual cortex (V1).22,23 Disruption to any of these regions following a concussion/mTBI will likely cause an attentional deficit.8,14-16 Therefore, using the visual evoked potential (VEP) technique to assess attention objectively and rapidly at the V1 level provides critical, as well as very early, information regarding the human attentional state.24-28
There is a long history of using objective techniques to assess human visual/general attention, with emphasis on the attentionally-related alpha band activity (8-13 Hz) of the electro-encephalograph (EEG). Berger29 was the first to investigate the alpha band electrophysiologically in the human brain. More
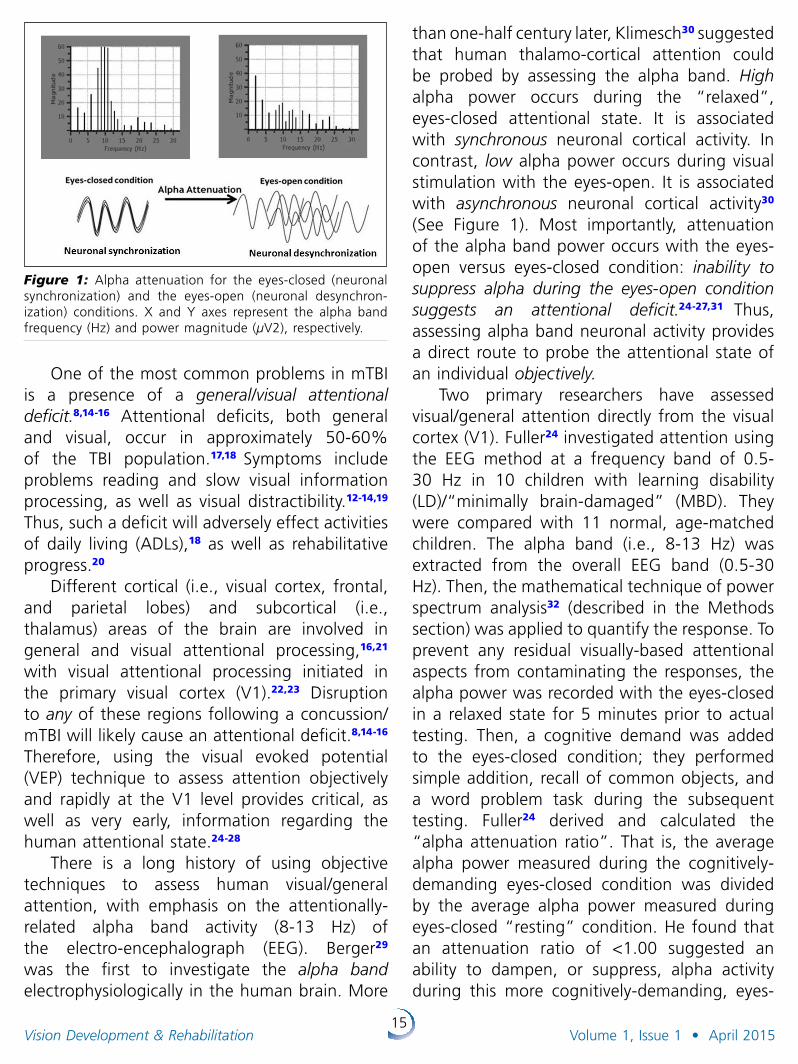
than one-half century later, Klimesch30 suggested that human thalamo-cortical attention could be probed by assessing the alpha band. High alpha power occurs during the “relaxed”, eyes-closed attentional state. It is associated with synchronous neuronal cortical activity. In contrast, low alpha power occurs during visual stimulation with the eyes-open. It is associated with asynchronous neuronal cortical activity30 (See Figure 1). Most importantly, attenuation of the alpha band power occurs with the eyes-open versus eyes-closed condition: inability to suppress alpha during the eyes-open condition suggests an attentional deficit .24-27,31 Thus, assessing alpha band neuronal activity provides a direct route to probe the attentional state of an individual objectively .
Two primary researchers have assessed visual/general attention directly from the visual cortex (V1). Fuller24 investigated attention using the EEG method at a frequency band of 0.5-30 Hz in 10 children with learning disability (LD)/“minimally brain-damaged” (MBD). They were compared with 11 normal, age-matched children. The alpha band (i.e., 8-13 Hz) was extracted from the overall EEG band (0.5-30 Hz). Then, the mathematical technique of power spectrum analysis32 (described in the Methods section) was applied to quantify the response. To prevent any residual visually-based attentional aspects from contaminating the responses, the alpha power was recorded with the eyes-closed in a relaxed state for 5 minutes prior to actual testing. Then, a cognitive demand was added to the eyes-closed condition; they performed simple addition, recall of common objects, and a word problem task during the subsequent testing. Fuller24 derived and calculated the “alpha attenuation ratio”. That is, the average alpha power measured during the cognitively-demanding eyes-closed condition was divided by the average alpha power measured during eyes-closed “resting” condition. He found that an attenuation ratio of <1.00 suggested an ability to dampen, or suppress, alpha activity during this more cognitively-demanding, eyes-
Figure 1: Alpha attenuation for the eyes-closed (neuronal synchronization) and the eyes-open (neuronal desynchron-ization) conditions. X and Y axes represent the alpha band frequency (Hz) and power magnitude (µV2), respectively.
16Vision Development & Rehabilitation Volume 1, Issue 1 • April 2015
closed condition, as predicted to be the case for those with normal attention. Fuller24 found that 81% of the normal children exhibited an average attenuation ratio of 0.91, whereas 80% of the LD/MBD children had an average attenuation ratio of 1.01. Thus, as compared to the normal children, those with LD/MBD were not able to suppress their alpha activity as well during the cognitively-demanding, eyes-closed condition. Similar results were found by Ludlam.25 He used the VEP method to assess two children with clinically-diagnosed “reading disability”. Alpha-band attenuational ability was assessed under two conditions before and after conventional, oculomotor-based, vision therapy. First, with the eyes closed, and second with the eyes open as they read from a book. Before therapy, neither child was able to attenuate alpha activity during the reading task, as would be the case in normal children without reading disability. This suggested the presence of an attentional deficit. Then, they underwent vision therapy to remediate their oculomotor-based reading deficit, which indirectly acts to improve general and visual attention.33,34 After therapy,
they were able to attenuate their alpha activity during reading. This suggested improvement in visual attention, which appeared to be related with an improvement in reading ability and basic oculomotor control.
The purpose of the present paper is to review recent studies from our laboratory on the topic of human attention as assessed objectively using the VEP approach. Three experiments will be reviewed, with details provided in the original references:
Experiment #1: Objective assessment of the human visual attentional state.26
Experiment #2: Objective assessment of attention in mild traumatic brain injury (mTBI) using the visual-evoked potential (VEP).35
Experiment #3: Effect of oculomotor vision rehabilitation on the visual-evoked poten tial and visual attention in mild traumatic brain injury (mTBI).28
METHODSSubjects
Subjects participating in each experiment were as follows: Experiment #1 included 18 visually-normal adults (mean = 24.0 years, SEM = 0.5 years); Experiment #2 included 16 adults with mTBI, 11 with a self-reported attentional deficit18 (mean age = 38.0 years, SEM = 4.8 years) and 5 without (mean age = 29.8 years, SEM = 2.2 years); and Experiment #3 included 7 adults with mTBI (mean age = 29.5 years, SEM = 4.3 years), 4 with a self-reported attentional deficit (See Table 1 of Reference #28). The attentional information of the subjects was consistent with their clinical case history taken by an experienced neuro-optometrist and a social worker in the college’s brain injury clinic, as well as with other supporting medical and neuropsychological documentation. All individuals with mTBI received their head injury at least nine months prior to testing, which exceeded the natural recovery period.36 Visually-normal subjects were recruited from the student, faculty, and staff at the State University of New York (SUNY), State
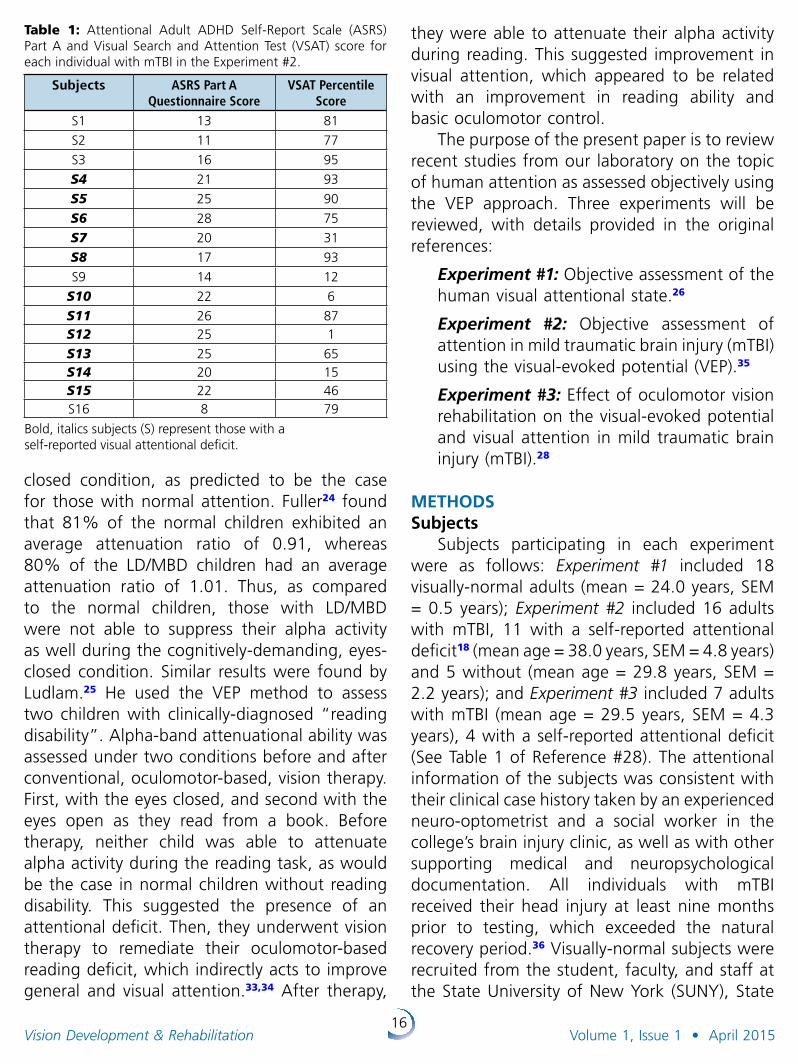
Table 1: Attentional Adult ADHD Self-Report Scale (ASRS) Part A and Visual Search and Attention Test (VSAT) score for each individual with mTBI in the Experiment #2.
Subjects ASRS Part A Questionnaire Score
VSAT Percentile Score
S1 13 81
S2 11 77
S3 16 95
S4 21 93
S5 25 90
S6 28 75
S7 20 31
S8 17 93
S9 14 12
S10 22 6
S11 26 87S12 25 1
S13 25 65S14 20 15S15 22 46S16 8 79
Bold, italics subjects (S) represent those with a self-reported visual attentional deficit.
17Vision Development & Rehabilitation Volume 1, Issue 1 • April 2015
College of Optometry. Individuals with mTBI were obtained from the Raymond J. Greenwald Rehabilitation Center (RJGRC)/Brain Injury Clinic at the SUNY, State College of Optometry with full medical documentation. Both visually-normal individuals and those with mTBI had corrected visual acuity of 20/20 or better in each eye at both distance and near. Exclusion criteria included a history of seizures, constant strabismus, and amblyopia, as well as any type of ocular, systemic, or neurological disease. These studies were approved by the Institutional Review Board (IRB) at the SUNY, State College of Optometry. All subjects provided written informed consent.
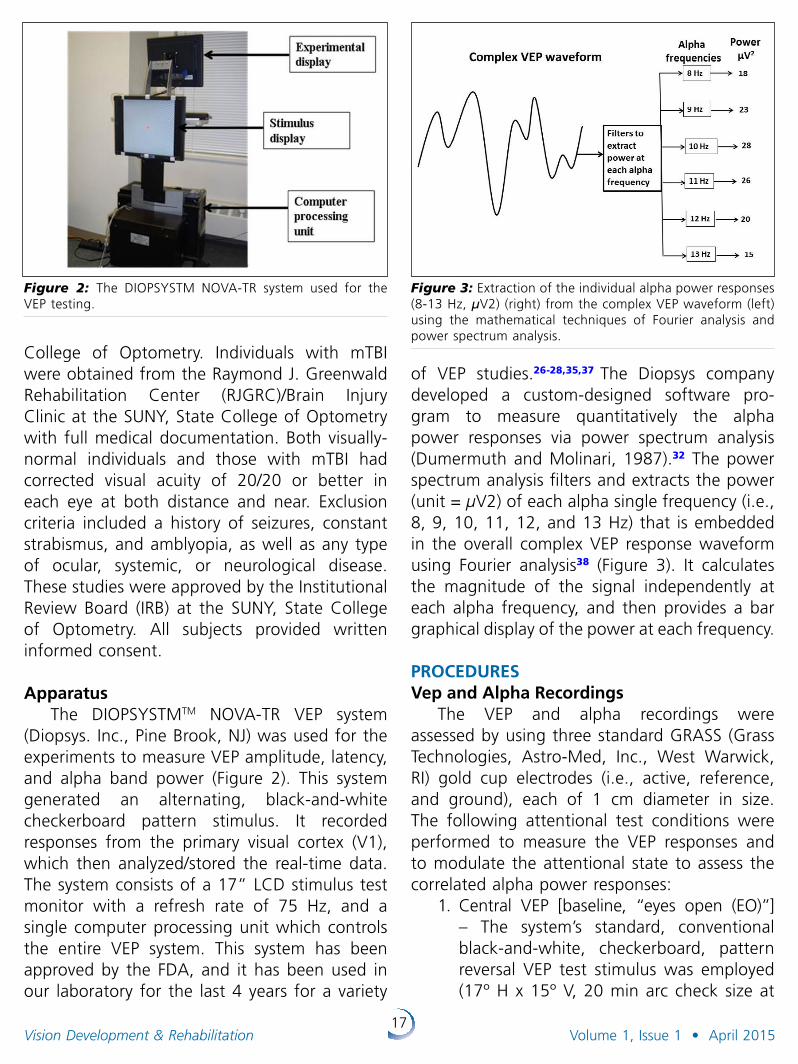
ApparatusThe DIOPSYSTMTM NOVA-TR VEP system
(Diopsys. Inc., Pine Brook, NJ) was used for the experiments to measure VEP amplitude, latency, and alpha band power (Figure 2). This system generated an alternating, black-and-white checker board pattern stimulus. It recorded responses from the primary visual cortex (V1), which then analyzed/stored the real-time data. The system consists of a 17” LCD stimulus test monitor with a refresh rate of 75 Hz, and a single computer processing unit which controls the entire VEP system. This system has been approved by the FDA, and it has been used in our laboratory for the last 4 years for a variety
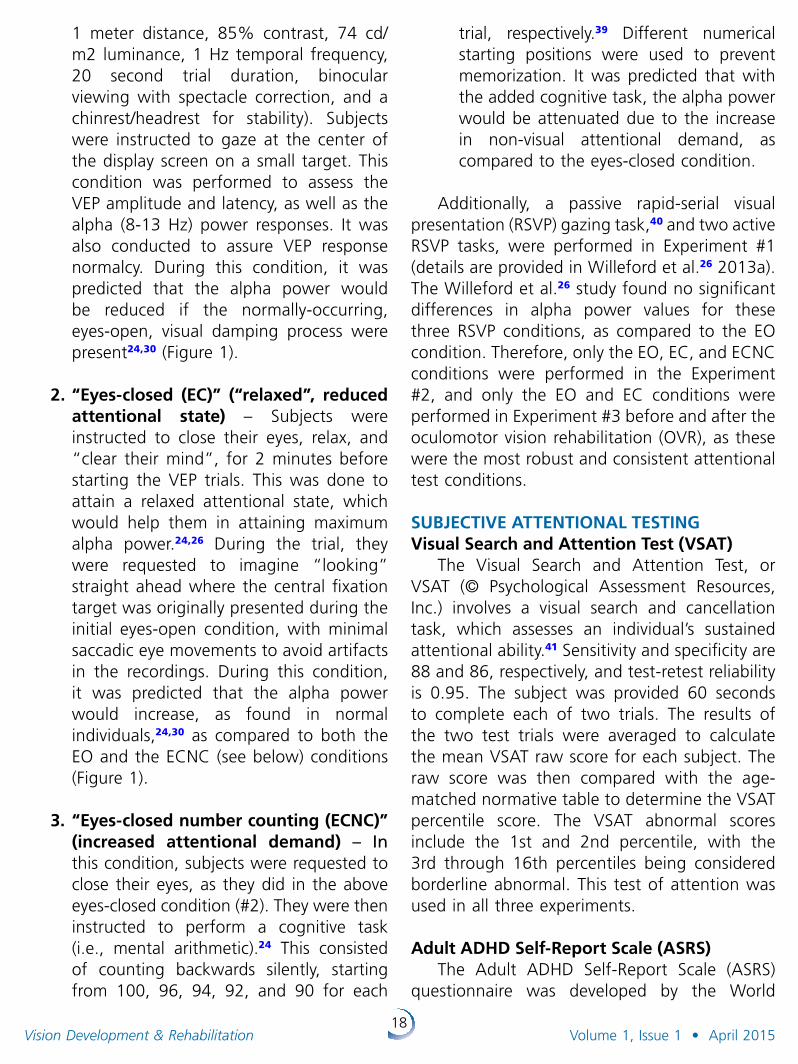
of VEP studies.26-28,35,37 The Diopsys company developed a custom-designed software pro-gram to measure quantitatively the alpha power responses via power spectrum analysis (Dumermuth and Molinari, 1987).32 The power spectrum analysis filters and extracts the power (unit = µV2) of each alpha single frequency (i.e., 8, 9, 10, 11, 12, and 13 Hz) that is embedded in the overall complex VEP response waveform using Fourier analysis38 (Figure 3). It calculates the magnitude of the signal independently at each alpha frequency, and then provides a bar graphical display of the power at each frequency.
PROCEDURESVep and Alpha Recordings
The VEP and alpha recordings were assessed by using three standard GRASS (Grass Technologies, Astro-Med, Inc., West Warwick, RI) gold cup electrodes (i.e., active, reference, and ground), each of 1 cm diameter in size. The following attentional test conditions were performed to measure the VEP responses and to modulate the attentional state to assess the correlated alpha power responses:
1. Central VEP [baseline, “eyes open (EO)”] – The system’s standard, conventional black-and-white, checkerboard, pattern reversal VEP test stimulus was employed (17º H x 15º V, 20 min arc check size at
Figure 2: The DIOPSYSTM NOVA-TR system used for the VEP testing.
Figure 3: Extraction of the individual alpha power responses (8-13 Hz, µV2) (right) from the complex VEP waveform (left) using the mathematical techniques of Fourier analysis and power spectrum analysis.
18Vision Development & Rehabilitation Volume 1, Issue 1 • April 2015
1 meter distance, 85% contrast, 74 cd/m2 luminance, 1 Hz temporal frequency, 20 second trial duration, binocular viewing with spectacle correction, and a chinrest/headrest for stability). Subjects were instructed to gaze at the center of the display screen on a small target. This condition was performed to assess the VEP amplitude and latency, as well as the alpha (8-13 Hz) power responses. It was also conducted to assure VEP response normalcy. During this condition, it was predicted that the alpha power would be reduced if the normally-occurring, eyes-open, visual damping process were present24,30 (Figure 1).
2. “Eyes-closed (EC)” (“relaxed”, reduced attentional state) – Subjects were instructed to close their eyes, relax, and “clear their mind”, for 2 minutes before starting the VEP trials. This was done to attain a relaxed attentional state, which would help them in attaining maximum alpha power.24,26 During the trial, they were requested to imagine “looking” straight ahead where the central fixation target was originally presented during the initial eyes-open condition, with minimal saccadic eye movements to avoid artifacts in the recordings. During this condition, it was predicted that the alpha power would increase, as found in normal individuals,24,30 as compared to both the EO and the ECNC (see below) conditions (Figure 1).
3. “Eyes-closed number counting (ECNC)” (increased attentional demand) – In this condition, subjects were requested to close their eyes, as they did in the above eyes-closed condition (#2). They were then instructed to perform a cognitive task (i.e., mental arithmetic).24 This con sisted of counting backwards silently, starting from 100, 96, 94, 92, and 90 for each
trial, respectively.39 Different numerical starting positions were used to prevent memorization. It was predicted that with the added cognitive task, the alpha power would be attenuated due to the increase in non-visual attentional demand, as compared to the eyes-closed condition.
Additionally, a passive rapid-serial visual presentation (RSVP) gazing task,40 and two active RSVP tasks, were performed in Experiment #1 (details are provided in Willeford et al.26 2013a). The Willeford et al.26 study found no significant differences in alpha power values for these three RSVP conditions, as compared to the EO condition. Therefore, only the EO, EC, and ECNC conditions were performed in the Experiment #2, and only the EO and EC conditions were performed in Experiment #3 before and after the oculomotor vision rehabilitation (OVR), as these were the most robust and consistent attentional test conditions.
SUBJECTIVE ATTENTIONAL TESTINGVisual Search and Attention Test (VSAT)
The Visual Search and Attention Test, or VSAT (© Psychological Assessment Resources, Inc.) involves a visual search and cancellation task, which assesses an individual’s sustained attentional ability.41 Sensitivity and specificity are 88 and 86, respectively, and test-retest reliability is 0.95. The subject was provided 60 seconds to complete each of two trials. The results of the two test trials were averaged to calculate the mean VSAT raw score for each subject. The raw score was then compared with the age-matched normative table to determine the VSAT percentile score. The VSAT abnormal scores include the 1st and 2nd percentile, with the 3rd through 16th percentiles being considered borderline abnormal. This test of attention was used in all three experiments.
Adult ADHD Self-Report Scale (ASRS)The Adult ADHD Self-Report Scale (ASRS)
questionnaire was developed by the World
19Vision Development & Rehabilitation Volume 1, Issue 1 • April 2015
Health Organization (WHO) to screen adults for attention-deficit/hyperactivity disorder.42
Sensitivity and specificity are 56 and 98, respectively, and test-retest reliability is 0.87. Part A (9 questions) of this questionnaire dealing with attention was used in Experiment #2 to detect and differentiate mTBI with versus without an attentional deficit. Each question is scored based on “how they have felt and conducted themselves” over the past 6 months. The rating scale ranged from 0-4, with 0 signifying “never felt and conducted” to 4 signifying “very often felt and conducted”. Scores can fall into three pre-specified categories: 0-16, 17-23, and 24 or greater, signifying that the subject was unlikely, likely, and highly likely to manifest an attentional deficit, respectively. The ASRS was performed only in Experiment #2.
Alpha Attenuation Ratio (AR)Two alpha attenuation ratios (ARs) related
to the attentional state were calculated.24,26 The first was the measured alpha power (µV2) during the “eyes-closed (EC)” condition divided by the measured alpha power during the “eyes-open (EO)” condition. An EC ÷ EO AR value of ≥2.00 suggested the presence of normal attention.26,27 The second AR was calculated as the measured alpha power during the “eyes-closed number counting (ECNC)” condition divided by the measured alpha power during the “eyes-closed (EC)” condition. Fuller24 found that an ECNC ÷ EC AR of <1.00 suggested the presence of normal attention.
Oculomotor Vision Rehabilitation (OVR) and the VEP
Oculomotor vision rehabilitation (OVR), i.e., vision therapy, was provided to the seven individuals with mTBI in Experiment #3 using a crossover, interventional experimental design clinical trial. The OVR consisted of training each of the three oculomotor systems, i.e., version, vergence, and accommodation, with such training indirectly including an attentional
component.34,35 OVR was performed twice a week for six weeks for a total of 9 hours, 3 hours for each oculomotor system. There was also a similar placebo arm to the protocol (see Thiagarajan43-48 for details).
DATA ANALYSISGraphPad Prism 5.04 software was used to
perform the graphical and data analyses. One-way and two-way ANOVAs were performed, as well as t-tests, to analyze the data. The coefficient of variation (CV = standard deviation ÷ mean) of the alpha wave responses was calculated to assess repeatability.26,27 The CV value can range from 0.00 to 1.00.49 This value represents the intra-subject variability: the smaller the value, the less the variability, and the better the repeatability.
RESULTSExperiment #1: Objective assessment of the human visual attentional state.26
VEP responsesThe group mean VEP amplitude (18.27 µV,
SEM = 1.80) and latency (104.10 ms, SEM = 0.68) values were found to be within normal limits for our laboratory.
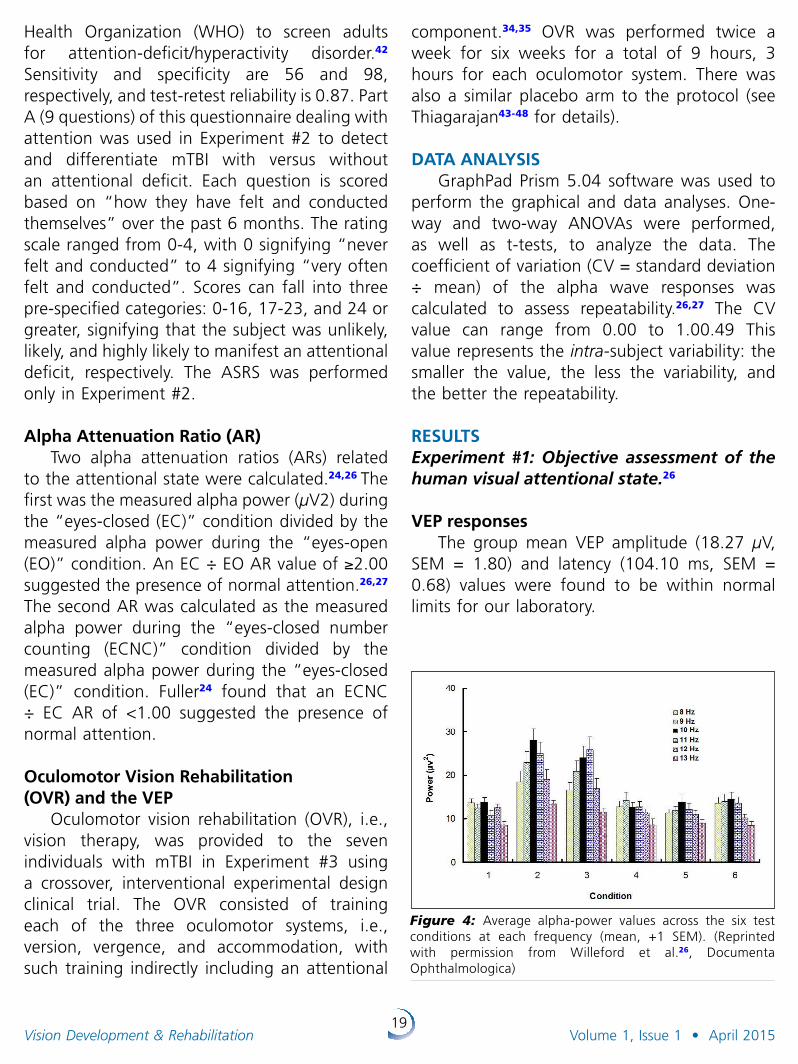
Figure 4: Average alpha-power values across the six test conditions at each frequency (mean, +1 SEM). (Reprinted with permission from Willeford et al.26, Documenta Ophthalmologica)
20Vision Development & Rehabilitation Volume 1, Issue 1 • April 2015
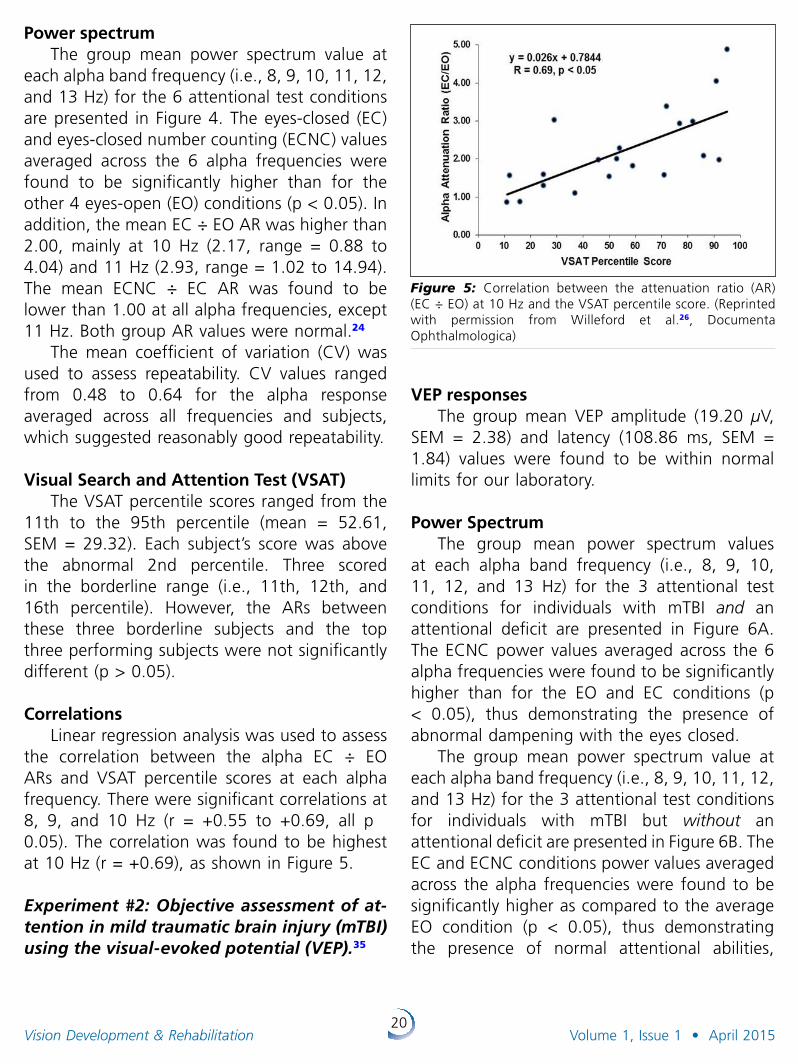
Power spectrumThe group mean power spectrum value at
each alpha band frequency (i.e., 8, 9, 10, 11, 12, and 13 Hz) for the 6 attentional test conditions are presented in Figure 4. The eyes-closed (EC) and eyes-closed number counting (ECNC) values averaged across the 6 alpha frequencies were found to be significantly higher than for the other 4 eyes-open (EO) conditions (p < 0.05). In addition, the mean EC ÷ EO AR was higher than 2.00, mainly at 10 Hz (2.17, range = 0.88 to 4.04) and 11 Hz (2.93, range = 1.02 to 14.94). The mean ECNC ÷ EC AR was found to be lower than 1.00 at all alpha frequencies, except 11 Hz. Both group AR values were normal.24
The mean coefficient of variation (CV) was used to assess repeatability. CV values ranged from 0.48 to 0.64 for the alpha response averaged across all frequencies and subjects, which suggested reasonably good repeatability.
Visual Search and Attention Test (VSAT)The VSAT percentile scores ranged from the
11th to the 95th percentile (mean = 52.61, SEM = 29.32). Each subject’s score was above the abnormal 2nd percentile. Three scored in the borderline range (i.e., 11th, 12th, and 16th percentile). However, the ARs between these three borderline subjects and the top three performing subjects were not significantly different (p > 0.05).
Correlations Linear regression analysis was used to assess
the correlation between the alpha EC ÷ EO ARs and VSAT percentile scores at each alpha frequency. There were significant correlations at 8, 9, and 10 Hz (r = +0.55 to +0.69, all p ˂ 0.05). The correlation was found to be highest at 10 Hz (r = +0.69), as shown in Figure 5.
Experiment #2: Objective assessment of atten tion in mild traumatic brain injury (mTBI) using the visualevoked potential (VEP).35
Figure 5: Correlation between the attenuation ratio (AR) (EC ÷ EO) at 10 Hz and the VSAT percentile score. (Reprinted with permission from Willeford et al.26, Documenta Ophthalmologica)
VEP responsesThe group mean VEP amplitude (19.20 µV,
SEM = 2.38) and latency (108.86 ms, SEM = 1.84) values were found to be within normal limits for our laboratory.
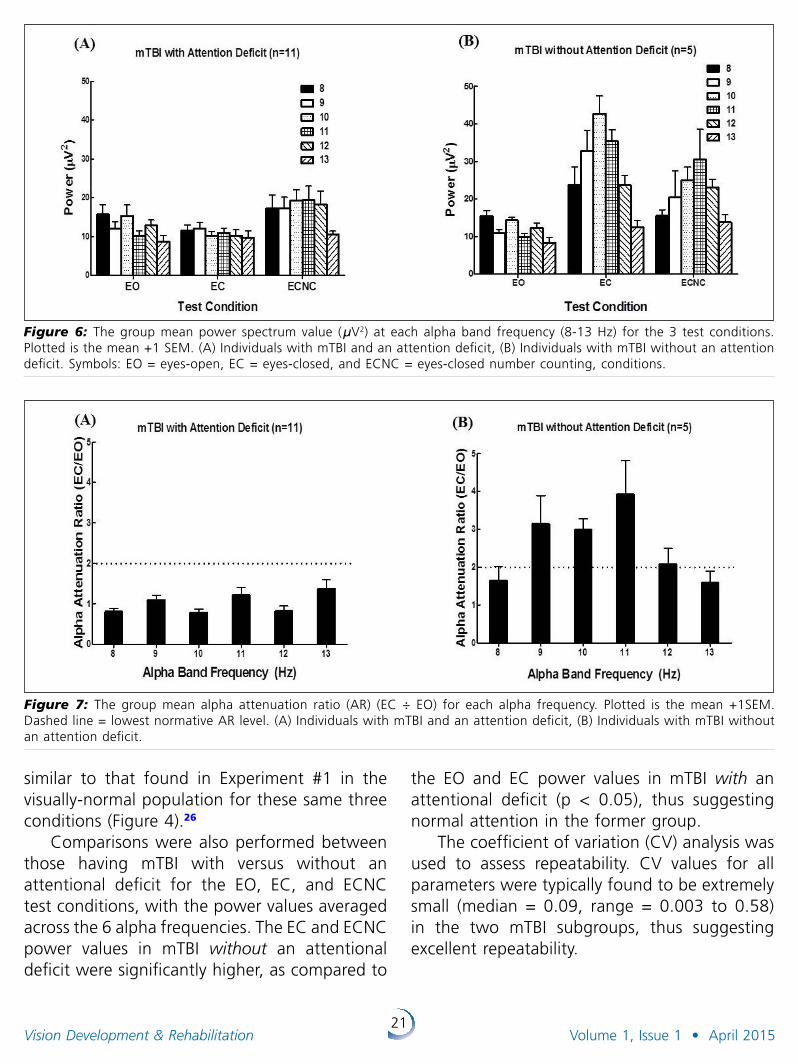
Power SpectrumThe group mean power spectrum values
at each alpha band frequency (i.e., 8, 9, 10, 11, 12, and 13 Hz) for the 3 attentional test conditions for individuals with mTBI and an attentional deficit are presented in Figure 6A. The ECNC power values averaged across the 6 alpha frequencies were found to be significantly higher than for the EO and EC conditions (p < 0.05), thus demonstrating the presence of abnormal dampening with the eyes closed.
The group mean power spectrum value at each alpha band frequency (i.e., 8, 9, 10, 11, 12, and 13 Hz) for the 3 attentional test conditions for individuals with mTBI but without an attentional deficit are presented in Figure 6B. The EC and ECNC conditions power values averaged across the alpha frequencies were found to be significantly higher as compared to the average EO condition (p < 0.05), thus demonstrating the presence of normal attentional abilities,
21Vision Development & Rehabilitation Volume 1, Issue 1 • April 2015
similar to that found in Experiment #1 in the visually-normal population for these same three conditions (Figure 4).26
Comparisons were also performed between those having mTBI with versus without an attentional deficit for the EO, EC, and ECNC test conditions, with the power values averaged across the 6 alpha frequencies. The EC and ECNC power values in mTBI without an attentional deficit were significantly higher, as compared to
the EO and EC power values in mTBI with an attentional deficit (p < 0.05), thus suggesting normal attention in the former group.
The coefficient of variation (CV) analysis was used to assess repeatability. CV values for all parameters were typically found to be extremely small (median = 0.09, range = 0.003 to 0.58) in the two mTBI subgroups, thus suggesting excellent repeatability.
Figure 7: The group mean alpha attenuation ratio (AR) (EC ÷ EO) for each alpha frequency. Plotted is the mean +1SEM. Dashed line = lowest normative AR level. (A) Individuals with mTBI and an attention deficit, (B) Individuals with mTBI without an attention deficit.
Figure 6: The group mean power spectrum value (µV2) at each alpha band frequency (8-13 Hz) for the 3 test conditions. Plotted is the mean +1 SEM. (A) Individuals with mTBI and an attention deficit, (B) Individuals with mTBI without an attention deficit. Symbols: EO = eyes-open, EC = eyes-closed, and ECNC = eyes-closed number counting, conditions.
22Vision Development & Rehabilitation Volume 1, Issue 1 • April 2015
Alpha Attenuation Ratio (AR): Individual Alpha Frequencies
The group mean EC ÷ EO AR for each alpha frequency for individuals with mTBI and an attentional deficit is presented in Figure 7A. The mean EC ÷ EO AR at each alpha frequency was significantly lower (i.e., abnormal, all p < 0.05) than the normative AR value of ≥2.00 (range = 0.81 to 1.36). In addition, the mean ECNC ÷ EC AR at each alpha frequency was significantly higher (i.e., abnormal, all p < 0.05) than the normative AR value of <1.00 (range = 1.27 to 2.24).
The group mean EC ÷ EO AR for each alpha frequency for individuals with mTBI but without an attention deficit is presented in Figure 7B. The mean EC ÷ EO AR at 9, 10, 11, and 12 Hz was ≥2.00 (range = 1.59 to 3.92), which was normal.26 In addition, the mean ECNC ÷ EC AR at 8, 9, 10, 11, and 12 Hz was <1.00 (range = 0.59 to 1.10), which was also normal.24,26
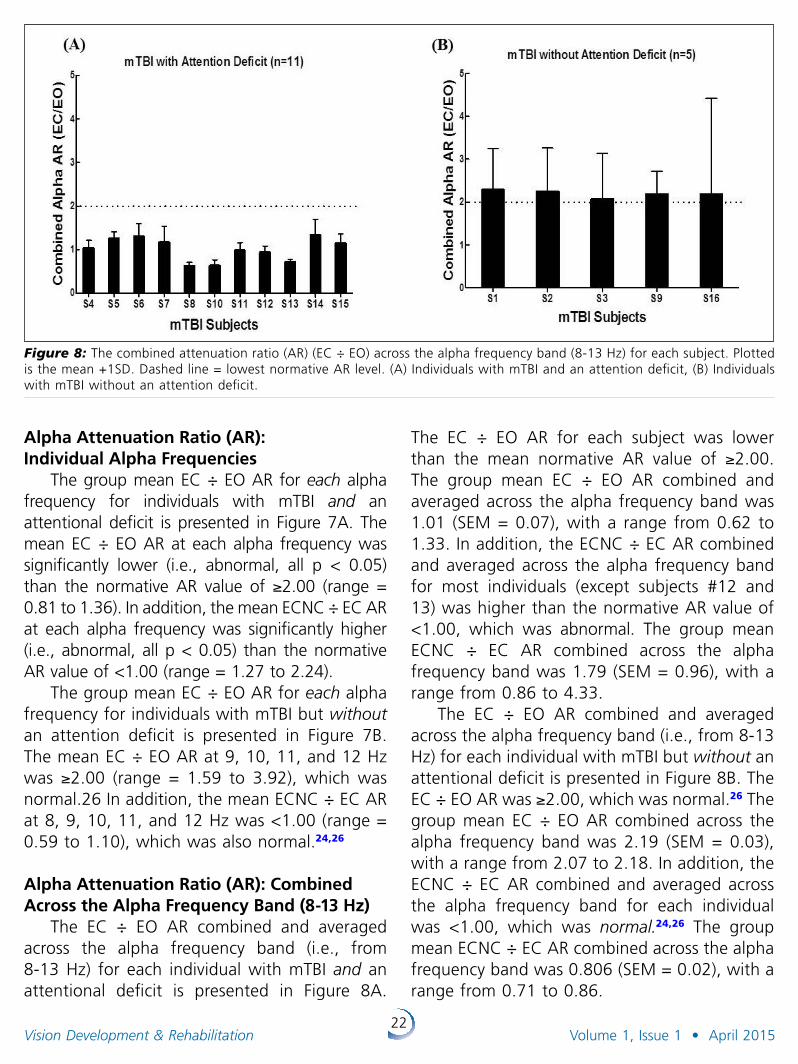
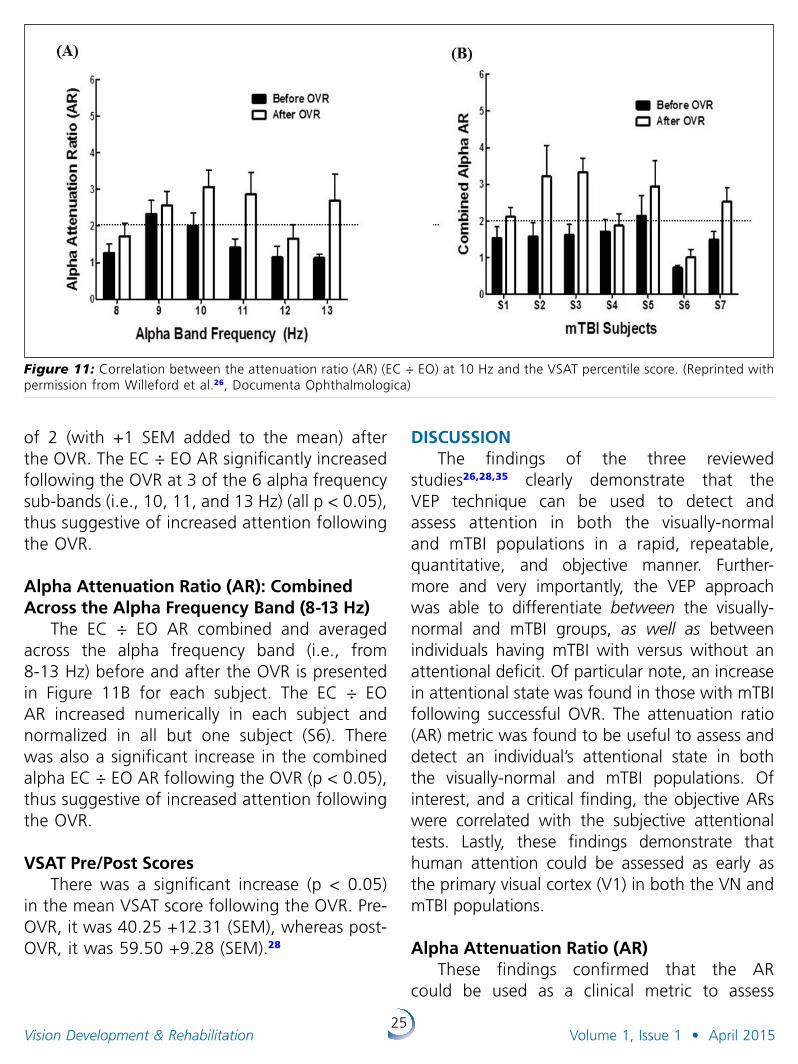
Alpha Attenuation Ratio (AR): Combined Across the Alpha Frequency Band (8-13 Hz)
The EC ÷ EO AR combined and averaged across the alpha frequency band (i.e., from 8-13 Hz) for each individual with mTBI and an attentional deficit is presented in Figure 8A.
The EC ÷ EO AR for each subject was lower than the mean normative AR value of ≥2.00. The group mean EC ÷ EO AR combined and averaged across the alpha frequency band was 1.01 (SEM = 0.07), with a range from 0.62 to 1.33. In addition, the ECNC ÷ EC AR combined and averaged across the alpha frequency band for most individuals (except subjects #12 and 13) was higher than the normative AR value of <1.00, which was abnormal. The group mean ECNC ÷ EC AR combined across the alpha frequency band was 1.79 (SEM = 0.96), with a range from 0.86 to 4.33.
The EC ÷ EO AR combined and averaged across the alpha frequency band (i.e., from 8-13 Hz) for each individual with mTBI but without an attentional deficit is presented in Figure 8B. The EC ÷ EO AR was ≥2.00, which was normal.26 The group mean EC ÷ EO AR combined across the alpha frequency band was 2.19 (SEM = 0.03), with a range from 2.07 to 2.18. In addition, the ECNC ÷ EC AR combined and averaged across the alpha frequency band for each individual was <1.00, which was normal .24,26 The group mean ECNC ÷ EC AR combined across the alpha frequency band was 0.806 (SEM = 0.02), with a range from 0.71 to 0.86.
Figure 8: The combined attenuation ratio (AR) (EC ÷ EO) across the alpha frequency band (8-13 Hz) for each subject. Plotted is the mean +1SD. Dashed line = lowest normative AR level. (A) Individuals with mTBI and an attention deficit, (B) Individuals with mTBI without an attention deficit.

23Vision Development & Rehabilitation Volume 1, Issue 1 • April 2015
There was a significant difference between those having mTBI with versus without an attentional deficit for the EC ÷ EO AR combined across subjects and averaged across the alpha frequency band. It was significantly higher in the mTBI subgroup without an attentional deficit (p ˂ 0.05), thus suggesting normalcy in this subgroup.
There was a significant difference between those having mTBI with versus without an atten-tional deficit for the ECNC ÷ EC AR combined across subjects and averaged across the alpha frequency band. It was significantly smaller in mTBI without an attentional deficit (p > 0.05), thus suggesting normalcy in this subgroup.
Visual Search and Attention Test (VSAT)The VSAT percentile scores for each subject
are presented in Table 1. In mTBI with a self-reported attentional deficit (n=11), the mean VSAT percentile score was 54.72 (SEM = 10.95), with a range from 1 to 93. In contrast, in mTBI without a self-reported attentional deficit (n=5), the mean VSAT percentile score was 68.80 (SEM = 14.54), with a range from 12 to 95. Subjects S10 and S9 had borderline 6th and 12th percentile scores, respectively, and subject S12 had an abnormal 1st percentile score. Comparison between the two groups for the VSAT scores revealed no significant difference (p > 0.05).
Adult ADHD Self-Report Scale (ASRS) The Part A questionnaire scores for the ASRS
test for each subject are presented in Table 1. In mTBI with a self-reported attentional deficit (n=11), the mean score was abnormal, i.e., 22.81 (SEM = 0.97), with a range from 17 to 28. In contrast, in mTBI without a self-reported attentional deficit (n=5), the mean score was normal, i.e., 12.40 (SEM = 1.36), with a range from 8 to 16. None of the scores for those with mTBI and an attentional deficit fell within the normal range. Comparison between the two groups for the ASRS scores revealed that it was significantly higher in those having mTBI and an
attentional deficit (p < 0.05), thus suggesting presence of an attentional deficit.
CorrelationLinear regression analysis was performed
to assess the correlation between the AR, ASRS, and VSAT for all individuals with mTBI (n=16). The following correlations were found be significant. First, the correlations between EC ÷ EO AR and the ASRS score at most alpha frequencies were significant: 8, 9, 10, 11, and 12 Hz (r = -0.62 to -0.83, all p <˂ 0.05). The correlation was highest at 10 Hz (r = -0.83) (Figure 9). Second, the correlations were also significant between the EC ÷ EO AR combined and averaged across the alpha frequency band and the ASRS scores (r = -0.76, p < 0.05). Lastly, the correlation between the ECNC ÷ EO AR and the ASRS was significant only at 8 Hz (r = -0.53, p < 0.05). In contrast, there were no significant correlations with the VSAT percentile scores. Thus, the objective ARs were correlated with the subjective ASRS, but not with the subjective VSAT, attentional scores.
Experiment #3: Effect of oculomotor vision rehabilitation (OVR) on the visualevoked potential and visual attention in mild traumatic brain injury.28
Figure 9: Correlation between the attenuation ratio (AR) (EC ÷ EO) at 10 Hz and the Adult ADHD Self-Report Scale (ASRS) Part A questionnaire scores.
24Vision Development & Rehabilitation Volume 1, Issue 1 • April 2015
VEP ResponsesThe group mean VEP amplitude was signifi-
cantly increased (i.e., from 17.40 to 19.15 µV), and its variability was significantly decreased (i.e., from 1.89 to 1.03 µV), following the OVR. There was no change in mean latency (i.e., before = 105.53 ms and after = 105.63 ms) and its variability (i.e., before = 1.35 ms and after = 1.64 ms) following the OVR. Latency values were the same and within the normal limits before (105 ms) and after OVR (105 ms).
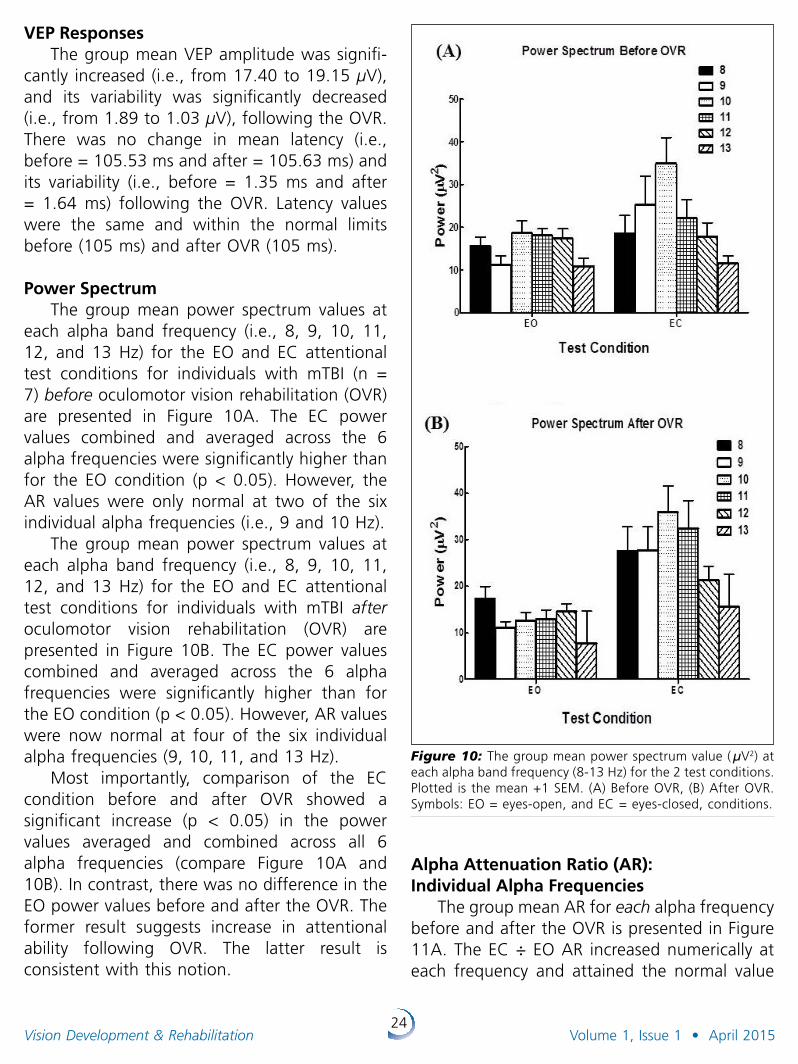
Power SpectrumThe group mean power spectrum values at
each alpha band frequency (i.e., 8, 9, 10, 11, 12, and 13 Hz) for the EO and EC attentional test conditions for individuals with mTBI (n = 7) before oculomotor vision rehabilitation (OVR) are presented in Figure 10A. The EC power values combined and averaged across the 6 alpha frequencies were significantly higher than for the EO condition (p < 0.05). However, the AR values were only normal at two of the six individual alpha frequencies (i.e., 9 and 10 Hz).
The group mean power spectrum values at each alpha band frequency (i.e., 8, 9, 10, 11, 12, and 13 Hz) for the EO and EC attentional test conditions for individuals with mTBI after oculomotor vision rehabilitation (OVR) are presented in Figure 10B. The EC power values combined and averaged across the 6 alpha frequencies were significantly higher than for the EO condition (p < 0.05). However, AR values were now normal at four of the six individual alpha frequencies (9, 10, 11, and 13 Hz).
Most importantly, comparison of the EC condition before and after OVR showed a significant increase (p < 0.05) in the power values averaged and combined across all 6 alpha frequencies (compare Figure 10A and 10B). In contrast, there was no difference in the EO power values before and after the OVR. The former result suggests increase in attentional ability following OVR. The latter result is consistent with this notion.
Alpha Attenuation Ratio (AR): Individual Alpha Frequencies
The group mean AR for each alpha frequency before and after the OVR is presented in Figure 11A. The EC ÷ EO AR increased numerically at each frequency and attained the normal value
Figure 10: The group mean power spectrum value ( µV2) at each alpha band frequency (8-13 Hz) for the 2 test conditions. Plotted is the mean +1 SEM. (A) Before OVR, (B) After OVR. Symbols: EO = eyes-open, and EC = eyes-closed, conditions.
25Vision Development & Rehabilitation Volume 1, Issue 1 • April 2015
of 2 (with +1 SEM added to the mean) after the OVR. The EC ÷ EO AR significantly increased following the OVR at 3 of the 6 alpha frequency sub-bands (i.e., 10, 11, and 13 Hz) (all p < 0.05), thus suggestive of increased attention following the OVR.
Alpha Attenuation Ratio (AR): Combined Across the Alpha Frequency Band (8-13 Hz)
The EC ÷ EO AR combined and averaged across the alpha frequency band (i.e., from 8-13 Hz) before and after the OVR is presented in Figure 11B for each subject. The EC ÷ EO AR increased numerically in each subject and normalized in all but one subject (S6). There was also a significant increase in the combined alpha EC ÷ EO AR following the OVR (p < 0.05), thus suggestive of increased attention following the OVR.
VSAT Pre/Post ScoresThere was a significant increase (p < 0.05)
in the mean VSAT score following the OVR. Pre-OVR, it was 40.25 +12.31 (SEM), whereas post-OVR, it was 59.50 +9.28 (SEM).28
DISCUSSIONThe findings of the three reviewed
studies26,28,35 clearly demonstrate that the VEP technique can be used to detect and assess attention in both the visually-normal and mTBI populations in a rapid, repeatable, quantitative, and objective manner. Further-more and very importantly, the VEP approach was able to differentiate between the visually-normal and mTBI groups, as well as between individuals having mTBI with versus without an attentional deficit. Of particular note, an increase in attentional state was found in those with mTBI following successful OVR. The attenuation ratio (AR) metric was found to be useful to assess and detect an individual’s attentional state in both the visually-normal and mTBI populations. Of interest, and a critical finding, the objective ARs were correlated with the subjective attentional tests. Lastly, these findings demonstrate that human attention could be assessed as early as the primary visual cortex (V1) in both the VN and mTBI populations.
Alpha Attenuation Ratio (AR)
These findings confirmed that the AR could be used as a clinical metric to assess
Figure 11: Correlation between the attenuation ratio (AR) (EC ÷ EO) at 10 Hz and the VSAT percentile score. (Reprinted with permission from Willeford et al.26, Documenta Ophthalmologica)
26Vision Development & Rehabilitation Volume 1, Issue 1 • April 2015
one’s attentional state objectively. Willeford et al.26 found that an EC ÷ EO AR of ≥2 and an ECNC ÷ EC AR of <1 was suggestive, and even predictive, of having normal attention. The ARs in our studies were consistently found to be abnormal in those with mTBI and an attentional deficit, and normal in individuals with mTBI but without an attentional deficit. Furthermore, the significant increase in the EC ÷ EO AR found following OVR suggests a positive impact on the mTBI attentional state, as well as demonstrating residual visual neuroplasticity, even in an adult, compromised brain.
Subjective Attention Test (VSAT and ASRS)Two subjective attentional tests were
performed: VSAT and ASRS. The VSAT per centile scores were correlated with the AR values in the visually-normal group, but not in the mTBI population; rather here the ASRS scores were correlated with the AR values in the mTBI group. This discrepancy might be attributed to one or more of the following reasons. Due to larger spread of AR values in the visually-normal as compared to the mTBI group, there would be more likelihood of a significant correlation. However, we believe that other factors are more likely to be involved. Both the AR values and the VSAT percentile scores were found to be within normal limits in the visually-normal group. In contrast, the AR values were in the abnormal range, whereas the VSAT scores were in the normal range, in those with mTBI having an attentional deficit. The ASRS questionnaire was able to differentiate between mTBI with versus without an attentional deficit 100% of the time, but this was only true 18% of the time with the VSAT. In addition, the EC ÷ EO AR values were correlated with the ASRS score at nearly all frequencies (except at 13 Hz), whereas the ECNC ÷ EC AR values were correlated only at the 8 Hz alpha frequency. Overall, these findings suggest that the ASRS questionnaire and the EC ÷ EO AR are better to detect and assess individuals with mTBI for presence of a general/visual attentional deficit.
Oculomotor Vision Rehabilitation (OVR): VEP and Alpha Responses
Yadav et al.28 demonstrated objectively the positive effect of OVR at the visuo-cortical level in those with mTBI. There was enhancement in both the VEP and alpha responses following the OVR. The VEP amplitude increased, and its variability decreased, with correlated improvement in alpha-based attentional state. As mentioned earlier, all OVR has an embedded attentional training component by its very nature:33,34 patients were instructed to remain vigilant during the specified vision therapy tasks involving both detection and discrimination of the visual stimulus attributes (e.g., blur). Therefore, an increase in alpha power during the EC condition following the OVR was not surprising, and in fact, expected. Furthermore, the subjective VSAT percentile scores also increased significantly following the OVR. Improvement in the objectively-based attentional parameters at the V1 cortical level was consistent with the clinically-based subjective attentional test results, thus lending credibility to each approach.
Neurophysiological MechanismA possible neurophysiological mechanism
underlying these findings is based on the concept of synchronous versus asynchronous neuronal activity. Such activity occurs at the primary visual cortex (V1) level during modulation of one’s attentional state (e.g., eyes-closed versus eyes-open condition).
What might occur during the EC relaxed/low attentional demand condition? Klimesch30
(1999), and others,50,51 suggested that in individuals with normal attention, synchronous neuronal activity occurs. This was presumably due to oscillation of a large number of neurons having the same phase and frequency. These synchronous oscillations can be appreciated quantitatively as reflective of increased alpha band power. This oscillatory activity is believed to “block” information processing from occurring. In contrast, it was suggested that in
27Vision Development & Rehabilitation Volume 1, Issue 1 • April 2015
those individuals with mTBI and an attentional deficit, asynchronous activity occurs during the EC (“relaxed”) attentional state, and thus these individuals cannot “block” information processing from occurring. The asynchronous neuronal activity would cause attenuation, or suppression/damping, of the alpha band power via signal cancellation.52
The opposite is believed to occur in the EO condition. In individuals with normal attention, asynchronous neuronal activity is believed to occur during the EO condition, whereas synchronous neural activity is believed to occur during the ECNC condition. This asynchrony during the former condition is believed to be due to oscillation of a large number of neurons with different phases and frequencies, which occurs due to processing of the more visually-based and cognitively-demanding information. This asynchrony causes attenuation of the alpha band power, again via signal cancellation.52 In individuals with mTBI and an attentional deficit, asynchronous activity occurs during all three conditions, and thus presence of relative attenuation. The findings of the present studies are consistent with the proposed mechanism of Klimesch,30 and others.50,51
Neurophysiological SubstratesThere are several neural substrates that are
likely to contribute to the VEP/alpha response. For the EO condition, the contributors include V1-V4 and the thalamus.53 For the EC condition, the contributors include the thalamo-cortical pathway.30 Other neural regions may participate, but this remains speculative.
Clinical ImplicationsThe findings of these three studies were
instrumental in formulating a clinical attentional test protocol in those with mTBI, as described below:
1. Case history – A detailed case history regarding visual/general attention should be taken.
2. Subjective test – The Adult ADHD Self-Report Scale (ASRS) Part A attention questionnaire should be administered to assess the attentional state.
3. Objective attentional test – The following two test condition should be performed to measure the VEP and alpha band power responses to calculate the AR value:A. Eyes open (EO) B. Eyes-closed (EC)
Number of trails – 5 trials, each of 20 seconds, per test condition should be performed and averaged.
The EC ÷ EO AR should be quantified at each alpha band, as well as combined and averaged across the alpha frequency bands. These objective findings should be consistent with the individual’s case history and the ASRS Part A questionnaire scores, and furthermore assistive in making the final diagnosis with a high degree of certainty. Our proposed objective protocol would be beneficial to clinicians in assessing and detecting one’s attentional state rapidly, quantitatively, reliably, and objectively. Due to its objective nature, the proposed attentional test protocol may also be helpful in the cognitively-impaired and non-verbal populations, as well as in the pediatric population, in which attentional deficit (e.g., ADHD) is suspected. The software for the alpha-band assessment of attention is available from the Diopsys company (www.diopsys.com).
Study Limitations
There were two possible study limitations. First, there were a relatively few number of sub-jects with mTBI in the OVR experiment. Second, these studies included only those with mTBI, and not individuals with moderate or severe TBI.
CONCLUSIONSThe present findings clearly demonstrate
that the VEP, an objective approach, can be used clinically to rapidly and quantitatively detect and
28Vision Development & Rehabilitation Volume 1, Issue 1 • April 2015
assess attention in the mTBI population. This was achieved by measuring the alpha power under different attentional states and calculating the respective alpha AR values, which were correlated with the subjective attentional tests scores. The AR values were found to be beneficial in differentiating between the visually-normal and mTBI populations, as well as between those having mTBI with versus without an attentional deficit. The increase in the mean VEP amplitude following the OVR suggested enhanced and more synchronized neural activity within V1. Similarly, the increase in the mean VSAT score following the OVR suggested enhancement in attentional ability, which is consistent with the notion that OVR has an embedded attentional component. The VEP technique has the potential to become an additional tool in the clinician’s diagnostic armamentarium for objectively-based attentional assessment in the optometric practice.
ACKNOWLEDGMENTSWe would like to thank the College of
Optometrists in Vision Development (COVD) for funding to K.J.C and N.K.Y, the Army/DoD for Awards (W81XWH-10-1-1041 and W81XWH-12-1-0240) to K.J.C, and the SUNY, Graduate Program for funding this project. We would also like to thank the American Optometric Foundation (AOF) for awarding the Ezell Fellowship to N.K.Y and P.T. Lastly, we are grateful to DIOPSYS Inc., Pine Brook, New Jersey for providing the VEP system for these studies.
REFERENCES1. Okie S. Traumatic brain injury in the war zone. N Engl J
Med 2005;352:2043-2047.
2. Marr AL, Coronado VG, ed. Central Nervous System Injury Surveillance Data Submission Standards - 2002. Atlanta, GA: Dept. of Health and Human Services (US), Centers for Disease Control and Prevention, National Center for Injury Prevention and Control; 2004.
3. Thiabault LE, Gennareli TA. Brain injury: an analysis of neural and neurovascular trauma in the non-human primate. Annu Proc Assoc Adv Automot Med 1990;34:337-351.
4. Werner C, Englehard K. Pathophysiology of traumatic brain Injury. Br J Anaesth 2007;99:97-104.
5. Greve MW, Zink BJ. Pathophysiology of traumatic brain injury. Mt Sinai J Med 2009;76:97-104.
6. Hurley RA, McGowan JC, Arfanakis K, et al. Traumatic axonal injury: novel insights into evolution and identifi-cation. J Neuropsychiatry Clin Neurosci 2004;16:1-7.
7. Suchoff IB, Ciuffreda KJ, Kapoor N, eds. Visual and Vestibular Consequences of Acquired Brain Injury. Santa Ana, CA: Optometric Extension Program Foundation; 2001.
8. Suter PS, Harvey LH, eds. Vision Rehabilitation. Multidisciplinary Care of the Patient Following Brain Injury. New York, NY: Taylor and Francis Group; 2011.
9. Zasler ND, Katz DI, Zafonte RD, eds. Brain Injury Medicine, Principles, and Practice New York, NY: Demos Medical Publishing; 2007.
10. Moore KL, Dalley AF, Agur AMR. Clinically Oriented Anatomy. Philadelphia, PA: Wolters Kluwer Health/Lippincott Williams and Wilkins; 2010.
11. Helvie R. Neural substrates of vision. In: Suter PS, Harvey LH, eds. Vision Rehabilitation. Multidisciplinary Care of the Patient Following Brain Injury. New York, NY: Taylor and Francis Group; 2011: 45-76.
12. Ciuffreda KJ, Ludlam DP. Conceptual model of optometric vision care in mild traumatic brain injury. J Behav Optom 2011;22:10-12.
13. Ciuffreda KJ, Ludlam DP, Thiagarajan P. Oculomotor diagnostic protocol for the mTBI population. Optometry 2011;82:61-63.
14. Cicerone KD. Attention deficits and dual task demands after mild traumatic brain injury. Brain Inj 1996;10:79-89.
15. Chan RC. Attentional deficits in patients with persisting concussive complaints: a general deficit or specific component deficit? J Clin Exp Neuropsychol 2002;24:1081-1093.
16. Halterman CI, Langan J, Drew A, et al. Tracking the recovery of visuospatial attention deficits in mild traumatic brain injury. Brain 2006;129:747-753.
17. Lew HL, Poole JH, Guillory SB et al. Guest editorial: Persistent problems after traumatic brain injury: The need for long-term follow-up and coordinate care. J Rehabil Res Dev 2006;43:vii-x.
18. Barlow-Ogden K, Poynter W. Mild traumatic brain injury and posttraumatic stress disorder: Investigation of visual attention in Operation Iraqi Freedom/Operation Enduring Freedom Veterans. J Rehabil Res Dev;49:1101-1114.
19. Whyte J, Fleming M, Polansky M et al. The effects of visual distraction following traumatic brain injury. J Int Neuropsychol Soc 1998;4:127-136.
20. Ylvisaker M. Context-sensitive cognitive rehabilitation after brain injury: Theory and practice. Brain Impair 2003;4:1-16.
29Vision Development & Rehabilitation Volume 1, Issue 1 • April 2015
21. Fan J, McCandliss BD, Sommer T et al. Testing the efficiency and independence of attentional networks. J Cogn Neurosci 2002;14:340-347.
22. Somers DC, Dale AM, Seiffert AE et al. Functional MRI reveals spatially specific attentional modulation in human primary visual cortex. Proc Natl Acad Sci U.S.A. 1999;96;1663-1668.
23. Kastner S, Ungerleider LG. Mechanism of visual attention in the human visual cortex. Annu Rev Neurosci 2000;23:315-341.
24. Fuller, P. Attention and the EEG alpha rhythm in learning disabled children. J Learn Disabil 1978;11:303-312.
25. Ludlam WM. Visual training, the alpha activation cycle, and reading. J Am Optom Assoc 1979;50:111-115.
26. Willeford KT, Ciuffreda KJ, Yadav NK et al. Objective assessment of the human visual attentional state. Doc Ophthalmol 2013;126:29-44.
27. Willeford KT, Ciuffreda KJ, Yadav NK. Effect of test duration on the visual-evoked potential (VEP) and alpha-wave responses. Doc Ophthalmol 2013;126:105-115.
28. Yadav NK, Thiagarajan P, Ciuffreda KJ. Effect of oculomotor vision rehabilitation on the visual-evoked potential and visual attention in mild traumatic brain injury. Brain Inj 2014;28:922-929.
29. Berger, H. Ueber des elektrenkephelogramm des menschen. Archiv fur Psychiatrie und Nervenkrankheiten 1929;87:527-570.
30. Klimesch W. EEG alpha and theta oscillations reflect cognitive and memory performance: a review and analysis. Brain Res Brain Res Rev 1999;29:169-195.
31. Legewie H, Simonova O, Creutzfeldt OD. EEG changes during performance of various tasks under open- and closed-eyed conditions. Electroencephalogr Clin Neurophysiol 1969;27:470-479.
32. Dumermuth G, Molinari L. Spectral analysis of the EEG. Neuropsychobiology 1987;17:85-99.
33. Ciuffreda KJ. The scientific basis for and efficacy of optometric vision therapy in nonstrabismic accommodative and vergence disorders. Optometry 2002;73:735-762.
34. 34. Solan HA, Larson S, Shelley-Tremblay J, Ficcara A, Silverman M. Effect of attention therapy on reading comprehension. J Learn Disabil 2003;36:556-563.
35. Yadav NK, Ciuffreda KJ. Objective assessment of visual attention in mild traumatic brain injury (mTBI) using the visual-evoked potentials (VEP). Brain Inj 2014 (available online).
36. Nakamura T, Hillary FG, Biswal BB. Resting network plasticity following brain injury. PLoS One 2009;4:e8220.
37. Yadav NK, Ludlam DP, Ciuffreda KJ. Effect of different stimulus configurations on the visual evoked potential (VEP). Doc Ophthalmol 2012;124:177-196.
38. Terras A. Fourier analysis on finite groups and applications. New York, NY: Cambridge University Press; 2001.
39. Smith A. The serial sevens subtraction tests. Arch Neurol 1967;17:78-80.
40. Jing Xu, Ciuffreda KJ, Chen H et al. Effect of retinal defocus on rapid serial visual presentation (RSVP). J Behav Optom 2009;20:67-69.
41. Trenerry MR, Crosson B, DeBoe J, Leber WR. Professional manual: visual search and attention test. Lutz, FL: Psychological Assessment Resources; 1989.
42. Kessler RC, Adler L, Ames M et al. The World Health Organization Adult ADHD Self-Report Scale (ASRS): a short screening scale for use in the general population. Psychol Med 2005;35:245-256.
43. Thiagarajan P. Oculomotor rehabilitation for reading dysfunction in mild traumatic brain injury [Ph.D. dissertation]. New York (NY): State University of New York; 2012. [cited 2014, June 26] Available from: http://bit.ly/2MSZ66V
44. Thiagarajan P, Ciuffreda KJ. Effect of oculomotor rehabilitation on vergence responsivity in mild traumatic brain injury (mTBI). J Rehabil Res Dev 2013;50:1223-1240.
45. Thiagarajan P, Ciuffreda KJ. Effect of oculomotor rehabilitation on accommodative responsivity in mild traumatic brain injury (mTBI). J Rehabil Res Dev 2014;51:175-192.
46. Thiagarajan P, Ciuffreda KJ. Versional eye tracking in mild traumatic brain injury (mTBI): effect of oculomotor training (OMT). Brain Inj 2014;28:930-943.
47. Thiagarajan P, Ciuffreda KJ, Capo-Aponte JE et al. Oculomotor neurorehabilitation for reading in mild traumatic brain injury (mTBI): an integrative approach. NeuroRehabilitation 2014;34:129-146.
48. Thiagarajan P, Ciuffreda KJ. Accommodative and vergence dysfunctions in mTBI: Treatment effects and systems correlations. Optom Vis Perf (in press).
49. Abdi H. Coefficient of variation. In: Salkind N ed. Encyclopedia of research design. Thousand Oaks: CA Sage; 2010:1-5.
50. Pfurtscheller G, Lopes da Silva FH. Event-related EEG/MEG synchronization and desynchronization: basic principles. Clin Neurophysiol 1999;110:1842-1857.
51. Rihs TA, Michel CM et al. Mechanisms of selective inhibition in visual spatial attention are indexed by alpha-band EEG synchronization. Eur J Neurosci 2007;25:603-610.
52. Hansen CH. Understanding active noise cancellation. New York, NY: Taylor and Francis Group; 2001.
53. Di Russo F, Pitzalis S, Spitoni G et al. Identification of the neural sources of the pattern-reversal VEP. NeuroImage 2005;24:874-886.
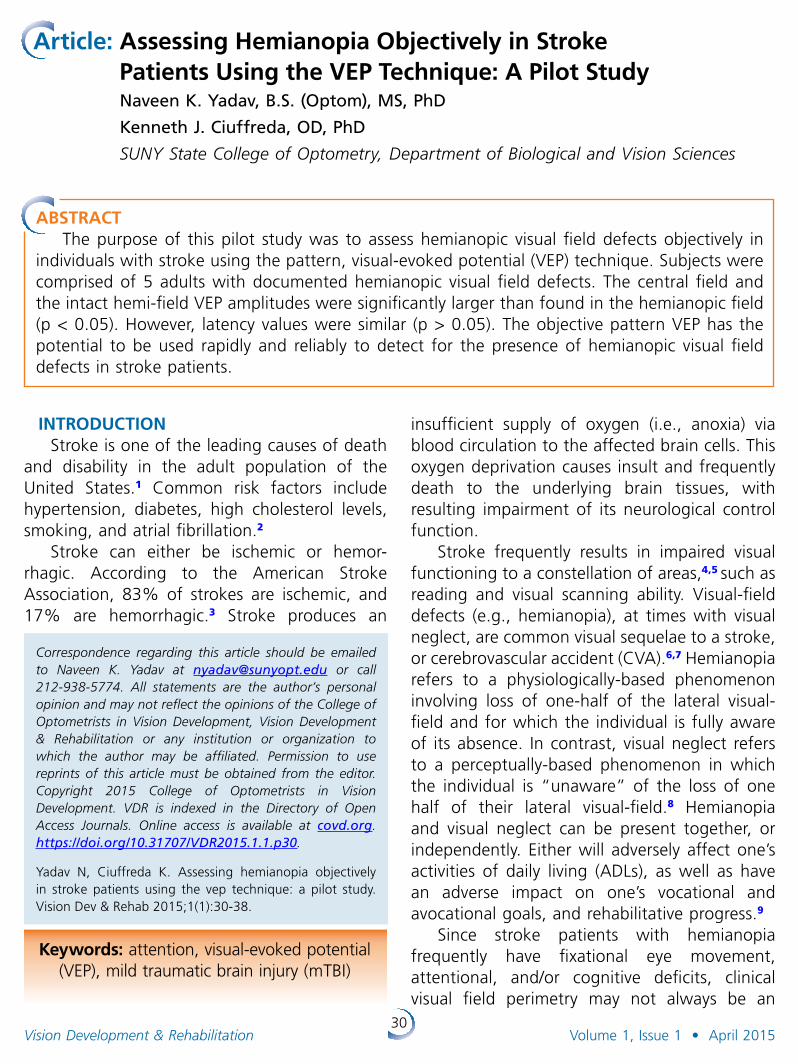
30Vision Development & Rehabilitation Volume 1, Issue 1 • April 2015
Article: Assessing Hemianopia Objectively in Stroke Patients Using the VEP Technique: A Pilot Study
Naveen K. Yadav, B.S. (Optom), MS, PhD
Kenneth J. Ciuffreda, OD, PhD
SUNY State College of Optometry, Department of Biological and Vision Sciences
INTRODUCTIONStroke is one of the leading causes of death
and disability in the adult population of the United States.1 Common risk factors include hypertension, diabetes, high cholesterol levels, smoking, and atrial fibrillation.2
Stroke can either be ischemic or hemor-rhagic. According to the American Stroke Association, 83% of strokes are ischemic, and 17% are hemorrhagic.3 Stroke produces an
Correspondence regarding this article should be emailed to Naveen K . Yadav at [email protected] or call 212-938-5774 . All state ments are the author’s personal opinion and may not reflect the opinions of the College of Optometrists in Vision Development, Vision Development & Rehabilitation or any institution or organization to which the author may be affiliated . Permission to use reprints of this article must be obtained from the editor . Copyright 2015 College of Optometrists in Vision Development . VDR is indexed in the Directory of Open Access Journals . Online access is available at covd.org . https://doi.org/10.31707/VDR2015.1.1.p30 .
Yadav N, Ciuffreda K. Assessing hemianopia objectively in stroke patients using the vep technique: a pilot study. Vision Dev & Rehab 2015;1(1):30-38.
insufficient supply of oxygen (i.e., anoxia) via blood circulation to the affected brain cells. This oxygen deprivation causes insult and frequently death to the underlying brain tissues, with resulting impairment of its neurological control function.
Stroke frequently results in impaired visual functioning to a constellation of areas,4,5 such as reading and visual scanning ability. Visual-field defects (e.g., hemianopia), at times with visual neglect, are common visual sequelae to a stroke, or cerebrovascular accident (CVA).6,7 Hemianopia refers to a physiologically-based phenomenon involving loss of one-half of the lateral visual-field and for which the individual is fully aware of its absence. In contrast, visual neglect refers to a perceptually-based phenomenon in which the individual is “unaware” of the loss of one half of their lateral visual-field.8 Hemianopia and visual neglect can be present together, or independently. Either will adversely affect one’s activities of daily living (ADLs), as well as have an adverse impact on one’s vocational and avocational goals, and rehabilitative progress.9
Since stroke patients with hemianopia frequently have fixational eye movement, attentional, and/or cognitive deficits, clinical visual field perimetry may not always be an
Keywords: attention, visual-evoked potential (VEP), mild traumatic brain injury (mTBI)
ABSTRACTThe purpose of this pilot study was to assess hemianopic visual field defects objectively in
individuals with stroke using the pattern, visual-evoked potential (VEP) technique. Subjects were comprised of 5 adults with documented hemianopic visual field defects. The central field and the intact hemi-field VEP amplitudes were significantly larger than found in the hemianopic field (p < 0.05). However, latency values were similar (p > 0.05). The objective pattern VEP has the potential to be used rapidly and reliably to detect for the presence of hemianopic visual field defects in stroke patients.

31Vision Development & Rehabilitation Volume 1, Issue 1 • April 2015
optimal method to investigate for the presence of hemianopia.10,11 The VEP is a logical adjunct technique to assess for hemianopia in the CVA population. It is an objective, rapid, and repeatable method.11,12 Furthermore, it circumvents, or at least minimizes, many of the inherent problems associated with clinical visual field testing. The VEP method does not demand prolonged attention or highly accurate fixation, as compared to conventional perimetry, especially over a relatively long test duration (i.e., 5 minutes or more for perimetry versus 20 seconds for each VEP trial).
There are a paucity of relevant studies which have used the VEP method to assess hemianopia in CVA patients. The results are equivocal, as described below.
Viggiano et al13 studied 10 individuals with CVA having left-field hemianopia and visual neglect, 11 individuals with CVA having left-field hemianopia only, and 6 visually-normal subjects. In the first experiment, they used different check sizes (12, 14, 36, 48, and 72 min arc) with a constant temporal frequency of 4.76 Hz. In the second experiment, they used different temporal frequencies (1.96, 3.03, 4.76, 6.66, 8.33, and 16.66 Hz) with a constant check size of 48 min arc. Contrast was 87%, and luminance was 120 cd/m2. The circular checkerboard stimulus (radius = 7.5 degrees) was presented both centrally, and in the near retinal periphery (8.5 degrees laterally). For both the central and near peripheral stimulus, there were no significant differences in the VEP amplitude between those hemianopes with versus without visual neglect. They speculated that the phenomenon of visual neglect was the result of damage to higher-level cortical areas, and not to early primary cortical areas encompassed by the underlying VEP signal region. However, they did not investigate latency, which may provide additional information regarding any delay in visual processing in these patients, as latency is typically slowed based on other test findings.14
Similarly, Spinelli et al.15 used the steady-state VEP in 16 right-brain-injured, hemianopic stroke
patients (i.e., 9 with left-visual field neglect, 7 without neglect), and 16 visually-normal subjects. Vertical sinusoidal gratings of 0.56 cycles per degree were used with a field size of 12.8H X 32.8V degrees. The gratings were sinusoidally-reversed at temporal frequencies ranging from 4-11Hz. Contrast was 32%, and luminance was 150 cd/m2. They assessed both VEP amplitude and latency. There was no significant effect on either parameter in the neglected and normal hemifields. The same was true in hemianopic patients without neglect, as well as in the visually-normal subjects. However, they did find that the VEP amplitude was slightly lower at higher temporal frequencies (e.g., 8 Hz) in those with a neglected left-visual field, as compared to their normal right-visual field. Furthermore, with increase in temporal frequency, they found markedly delayed latencies of ~30-40 ms in patients with visual neglect, as compared to those without neglect. This study demonstrated that individuals with visual neglect did exhibit slowed visual processing in the visually-neglected field only, at least under highly specific stimulus conditions, in the primary visual cortex.
In contrast, Angelelli et al.16 measured steady-state VEP responses in 19 right brain-damaged (RBD) patients with left-sided hemianopia and visual neglect. They also had two controls groups: 15 left brain-damaged (LBD) patients and 12 right brain-damaged (RBD) patients, all with hemianopia but without visual neglect. They used vertical sinusoidal gratings of 0.56 cycles per degree with a central field size of 6H X 16V degrees. The gratings were sinusoidally-reversed at 10 temporal frequencies ranging from 4-10.5 Hz, with a central fixation target present. Contrast was 32%, and luminance was 150 cd/m2. They assessed both amplitude and latency. Stimuli were presented either in the right (RVF) or left (LVF) visual field. They too found that the mean latency was significantly delayed by approximately 25 ms in the neglected LVF, as compared to the normal RVF, in those with RBD. In contrast, there was no significant difference in latency in either the right or left

32Vision Development & Rehabilitation Volume 1, Issue 1 • April 2015
hemifield in the RBD and LBD groups who did not have neglect. The VEP amplitudes were reduced in the hemianopic hemified in the RBD patients, with or without neglect. However, the VEP amplitudes were similar in both hemifields in the LBD group. These results suggested that both visual-neglect and hemianopia could be detected, even at the level of the primary visual cortex (V1). These findings supported the notion that the VEP can be used clinically to detect and assess hemianopia and/or visual neglect in patients with CVA.
Based on the above 3 studies, the results are equivocal. Viggiano et al.13, and Spinelli et al.,15 showed that the VEP could not differentiate between the hemianopic and intact visual field, which is surprising. In contrast, Angelelli
et al.16 found that it could. Furthermore, none of the studies used either low luminance and/or low contrast stimuli to assess hemianopia, which might be more sensitive to elicit presence of a visual field defect and/or visual neglect. Therefore, this area deserves to be explored, which might reveal more subtle differences early in the afferent visual pathway.
Thus, the purpose of the present pilot study was to determine if the VEP technique could be used to detect and assess hemianopia objectively and reliably in individuals with CVA/stroke. More specifically, the hypothesis is that the VEP approach will be able to detect and assess hemianopia objectively in individuals with stroke using more subtle stimuli, such as low contrast and low luminance patterns, which has never been tested before in this population.
METHODSSubjects
Five individuals with CVA/stroke and hemian opia (mean age = 46.6 years, age range = 29 to 62 years) participated in this study: three with complete right hemianopia, one with complete left hemianopia, and one with incomplete left hemianopia. None had visual neglect; this diagnosis was as specified in the referring clinician’s record, and it was not reassessed by us in the present investigation. See Table 1 for subject demographics. They were referred with full medical documentation to the Raymond J. Greenwald Rehabilitation Center (RJGRC)/Brain Injury Clinic at the SUNY, State College of Optometry from rehabilitation professionals at the following institutions: Rusk Institute of Rehabilitative Medicine at NYU Medical Center, Bellevue Hospital at NYU Medical Center, Department of Rehabilitative Medicine at Mount Sinai Medical Center, Lenox Hill Hospital, New York Hospital, and the International Center for the Disabled. All had corrected visual acuity of 20/20 or better in each eye at both distance and near. Exclusion criteria included a history of seizures, constant strabismus, and amblyopia, as well as any
Table 1: Demographics of stroke patients.
Subject/Age (years)/
Gender
Years since last stroke
Type of hemianopia
Visual Symptoms
S1/47/M 23 years(stroke at 2 years of age due to
arteriovenous malformation)
Right hemianopia
• Reading problems
S2/29/F 1 year Left incomplete-hemianopia
• Reading problems• Migraines
S3/39/F 1 year Left hemianopia
• Reading problems
• Migraines• Photosensitivity• Visual motion
sensitivity
S4/56/F 24 years Right hemianopia
• Reading problems
• Visual motion sensitivity
S5/62/F 2 years(first stroke 25
years ago)
Right hemianopia
• Reading problems
• Visual-attention deficit
• Visual fatigue• Distance
perception problem
• Photosensitivity• Visual motion
sensitivity
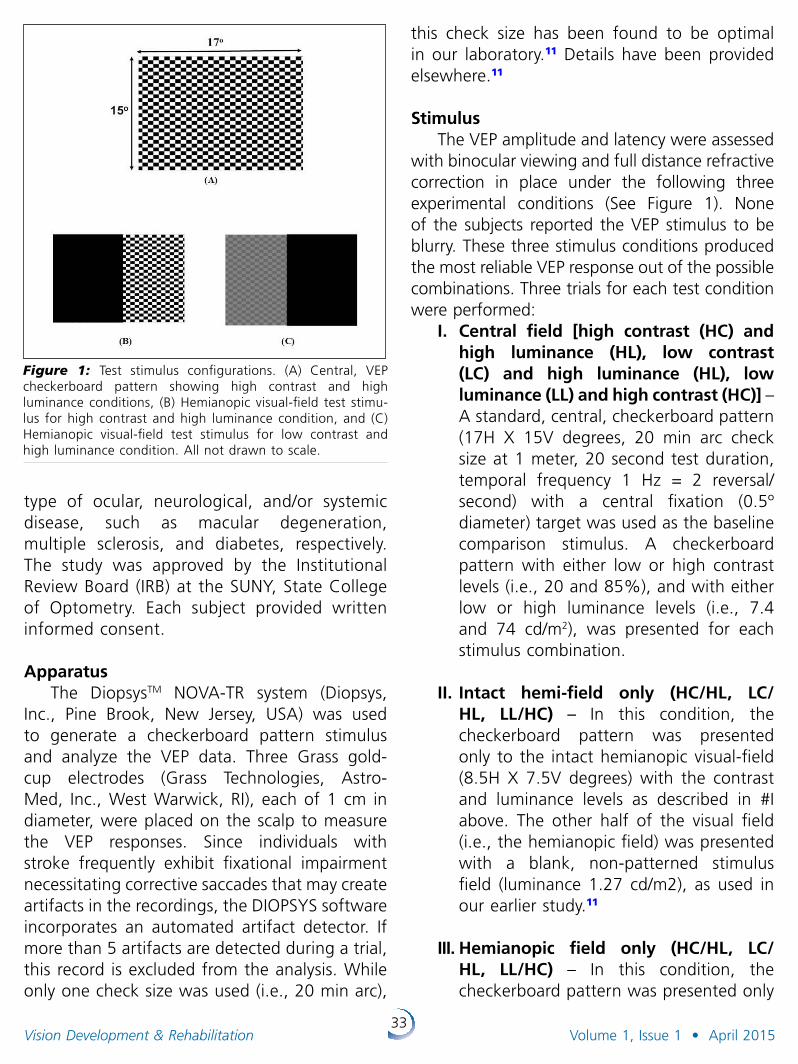
33Vision Development & Rehabilitation Volume 1, Issue 1 • April 2015
type of ocular, neurological, and/or systemic disease, such as macular degeneration, multiple sclerosis, and diabetes, respectively. The study was approved by the Institutional Review Board (IRB) at the SUNY, State College of Optometry. Each subject provided written informed consent.
Apparatus The DiopsysTM NOVA-TR system (Diopsys,
Inc., Pine Brook, New Jersey, USA) was used to generate a checkerboard pattern stimulus and analyze the VEP data. Three Grass gold-cup electrodes (Grass Technologies, Astro-Med, Inc., West Warwick, RI), each of 1 cm in diameter, were placed on the scalp to measure the VEP responses. Since individuals with stroke frequently exhibit fixational impairment necessitating corrective saccades that may create artifacts in the recordings, the DIOPSYS software incorporates an automated artifact detector. If more than 5 artifacts are detected during a trial, this record is excluded from the analysis. While only one check size was used (i.e., 20 min arc),
Figure 1: Test stimulus configurations. (A) Central, VEP checkerboard pattern showing high contrast and high luminance conditions, (B) Hemianopic visual-field test stimu-lus for high contrast and high luminance condition, and (C) Hemianopic visual-field test stimulus for low contrast and high luminance condition. All not drawn to scale.
this check size has been found to be optimal in our laboratory.11 Details have been provided elsewhere.11
StimulusThe VEP amplitude and latency were assessed
with binocular viewing and full distance refractive correction in place under the following three experimental conditions (See Figure 1). None of the subjects reported the VEP stimulus to be blurry. These three stimulus conditions produced the most reliable VEP response out of the possible combinations. Three trials for each test condition were performed:
I. Central field [high contrast (HC) and high luminance (HL), low contrast (LC) and high luminance (HL), low luminance (LL) and high contrast (HC)] – A standard, central, checkerboard pattern (17H X 15V degrees, 20 min arc check size at 1 meter, 20 second test duration, temporal frequency 1 Hz = 2 reversal/second) with a central fixation (0.5º diameter) target was used as the baseline comparison stimulus. A checkerboard pattern with either low or high contrast levels (i.e., 20 and 85%), and with either low or high luminance levels (i.e., 7.4 and 74 cd/m2), was presented for each stimulus combination.
II. Intact hemi-field only (HC/HL, LC/HL, LL/HC) – In this condition, the checkerboard pattern was presented only to the intact hemianopic visual-field (8.5H X 7.5V degrees) with the contrast and luminance levels as described in #I above. The other half of the visual field (i.e., the hemianopic field) was presented with a blank, non-patterned stimulus field (luminance 1.27 cd/m2), as used in our earlier study.11
III. Hemianopic field only (HC/HL, LC/HL, LL/HC) – In this condition, the checkerboard pattern was presented only
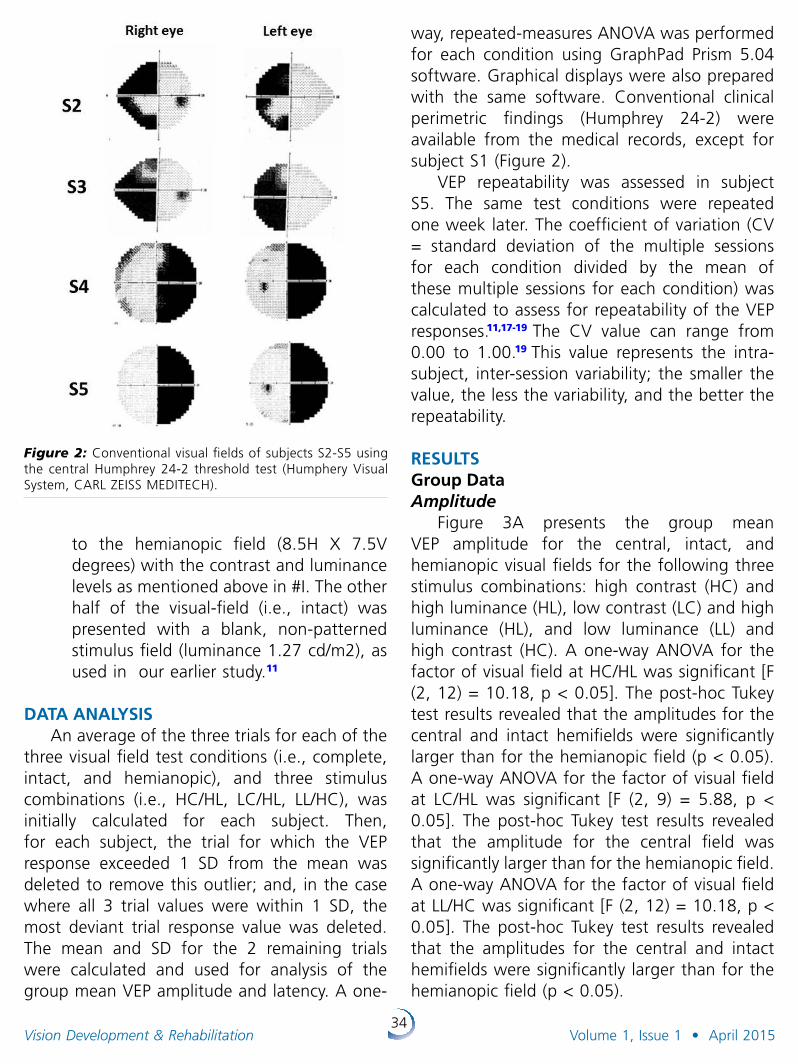
34Vision Development & Rehabilitation Volume 1, Issue 1 • April 2015
to the hemianopic field (8.5H X 7.5V degrees) with the contrast and luminance levels as mentioned above in #I. The other half of the visual-field (i.e., intact) was presented with a blank, non-patterned stimulus field (luminance 1.27 cd/m2), as used in our earlier study.11
DATA ANALYSISAn average of the three trials for each of the
three visual field test conditions (i.e., complete, intact, and hemianopic), and three stimulus combinations (i.e., HC/HL, LC/HL, LL/HC), was initially calculated for each subject. Then, for each subject, the trial for which the VEP response exceeded 1 SD from the mean was deleted to remove this outlier; and, in the case where all 3 trial values were within 1 SD, the most deviant trial response value was deleted. The mean and SD for the 2 remaining trials were calculated and used for analysis of the group mean VEP amplitude and latency. A one-
Figure 2: Conventional visual fields of subjects S2-S5 using the central Humphrey 24-2 threshold test (Humphery Visual System, CARL ZEISS MEDITECH).
way, repeated-measures ANOVA was performed for each condition using GraphPad Prism 5.04 software. Graphical displays were also prepared with the same software. Conventional clinical perimetric findings (Humphrey 24-2) were available from the medical records, except for subject S1 (Figure 2).
VEP repeatability was assessed in subject S5. The same test conditions were repeated one week later. The coefficient of variation (CV = standard deviation of the multiple sessions for each condition divided by the mean of these multiple sessions for each condition) was calculated to assess for repeatability of the VEP responses.11,17-19 The CV value can range from 0.00 to 1.00.19 This value represents the intra-subject, inter-session variability; the smaller the value, the less the variability, and the better the repeatability.
RESULTS Group DataAmplitude
Figure 3A presents the group mean VEP amplitude for the central, intact, and hemianopic visual fields for the following three stimulus combinations: high contrast (HC) and high luminance (HL), low contrast (LC) and high luminance (HL), and low luminance (LL) and high contrast (HC). A one-way ANOVA for the factor of visual field at HC/HL was significant [F (2, 12) = 10.18, p < 0.05]. The post-hoc Tukey test results revealed that the amplitudes for the central and intact hemifields were significantly larger than for the hemianopic field (p < 0.05). A one-way ANOVA for the factor of visual field at LC/HL was significant [F (2, 9) = 5.88, p < 0.05]. The post-hoc Tukey test results revealed that the amplitude for the central field was significantly larger than for the hemianopic field. A one-way ANOVA for the factor of visual field at LL/HC was significant [F (2, 12) = 10.18, p < 0.05]. The post-hoc Tukey test results revealed that the amplitudes for the central and intact hemifields were significantly larger than for the hemianopic field (p < 0.05).
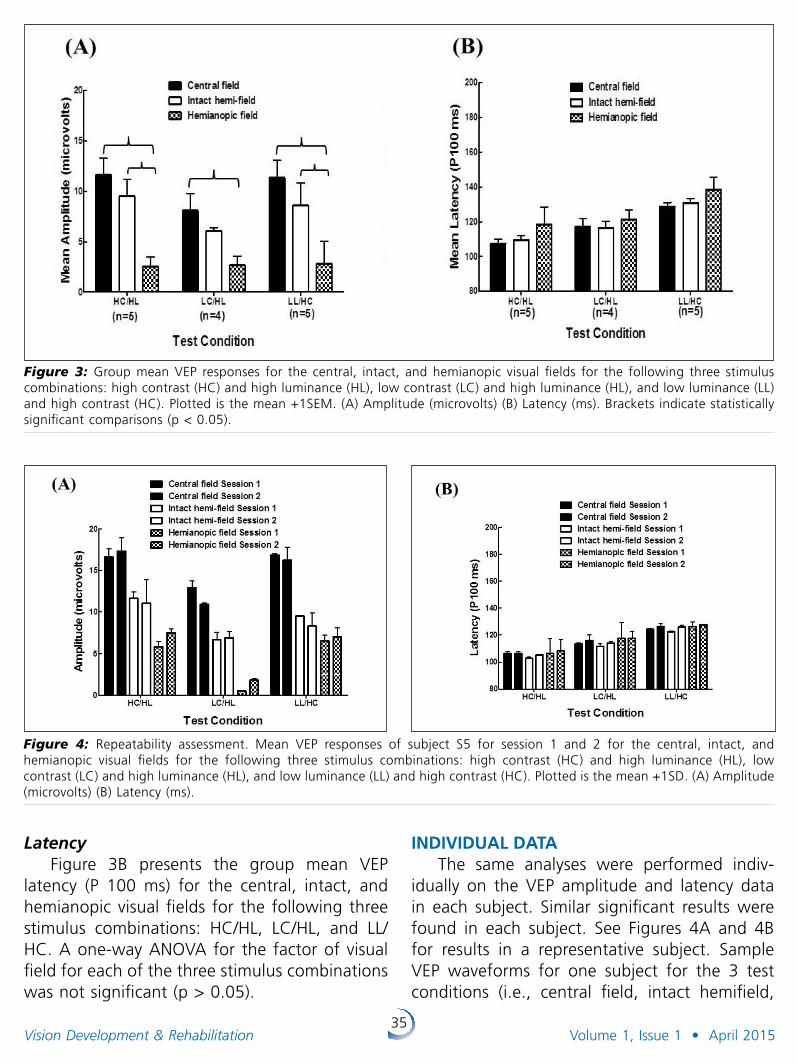
35Vision Development & Rehabilitation Volume 1, Issue 1 • April 2015
Figure 3: Group mean VEP responses for the central, intact, and hemianopic visual fields for the following three stimulus combinations: high contrast (HC) and high luminance (HL), low contrast (LC) and high luminance (HL), and low luminance (LL) and high contrast (HC). Plotted is the mean +1SEM. (A) Amplitude (microvolts) (B) Latency (ms). Brackets indicate statistically significant comparisons (p < 0.05).
Figure 4: Repeatability assessment. Mean VEP responses of subject S5 for session 1 and 2 for the central, intact, and hemianopic visual fields for the following three stimulus combinations: high contrast (HC) and high luminance (HL), low contrast (LC) and high luminance (HL), and low luminance (LL) and high contrast (HC). Plotted is the mean +1SD. (A) Amplitude (microvolts) (B) Latency (ms).
LatencyFigure 3B presents the group mean VEP
latency (P 100 ms) for the central, intact, and hemianopic visual fields for the following three stimulus combinations: HC/HL, LC/HL, and LL/HC. A one-way ANOVA for the factor of visual field for each of the three stimulus combinations was not significant (p > 0.05).
INDIVIDUAL DATAThe same analyses were performed indiv-
idually on the VEP amplitude and latency data in each subject. Similar significant results were found in each subject. See Figures 4A and 4B for results in a representative subject. Sample VEP waveforms for one subject for the 3 test conditions (i.e., central field, intact hemifield,
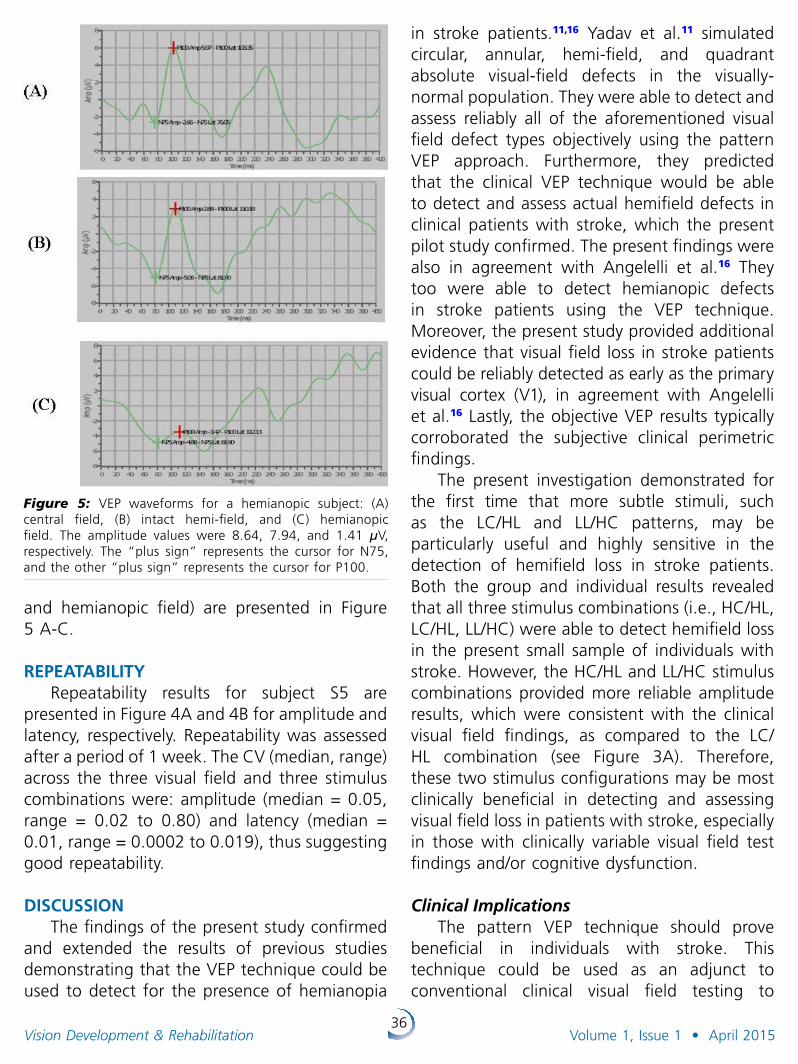
36Vision Development & Rehabilitation Volume 1, Issue 1 • April 2015
and hemianopic field) are presented in Figure 5 A-C.
REPEATABILITY Repeatability results for subject S5 are
presented in Figure 4A and 4B for amplitude and latency, respectively. Repeatability was assessed after a period of 1 week. The CV (median, range) across the three visual field and three stimulus combinations were: amplitude (median = 0.05, range = 0.02 to 0.80) and latency (median = 0.01, range = 0.0002 to 0.019), thus suggesting good repeatability.
DISCUSSIONThe findings of the present study con firmed
and extended the results of previous studies demonstrating that the VEP technique could be used to detect for the presence of hemianopia
in stroke patients.11,16 Yadav et al.11 simulated circular, annular, hemi-field, and quadrant absolute visual-field defects in the visually-normal population. They were able to detect and assess reliably all of the aforementioned visual field defect types objectively using the pattern VEP approach. Furthermore, they predicted that the clinical VEP technique would be able to detect and assess actual hemifield defects in clinical patients with stroke, which the present pilot study confirmed. The present findings were also in agreement with Angelelli et al.16 They too were able to detect hemianopic defects in stroke patients using the VEP technique. Moreover, the present study provided additional evidence that visual field loss in stroke patients could be reliably detected as early as the primary visual cortex (V1), in agreement with Angelelli et al.16 Lastly, the objective VEP results typically corroborated the subjective clinical perimetric findings.
The present investigation demonstrated for the first time that more subtle stimuli, such as the LC/HL and LL/HC patterns, may be particularly useful and highly sensitive in the detection of hemifield loss in stroke patients. Both the group and individual results revealed that all three stimulus combinations (i.e., HC/HL, LC/HL, LL/HC) were able to detect hemifield loss in the present small sample of individuals with stroke. However, the HC/HL and LL/HC stimulus combinations provided more reliable amplitude results, which were consistent with the clinical visual field findings, as compared to the LC/HL combination (see Figure 3A). Therefore, these two stimulus configurations may be most clinically beneficial in detecting and assessing visual field loss in patients with stroke, especially in those with clinically variable visual field test findings and/or cognitive dysfunction.
Clinical ImplicationsThe pattern VEP technique should prove
beneficial in individuals with stroke. This technique could be used as an adjunct to conventional clinical visual field testing to
Figure 5: VEP waveforms for a hemianopic subject: (A) central field, (B) intact hemi-field, and (C) hemianopic field. The amplitude values were 8.64, 7.94, and 1.41 µV, respectively. The “plus sign” represents the cursor for N75, and the other “plus sign” represents the cursor for P100.
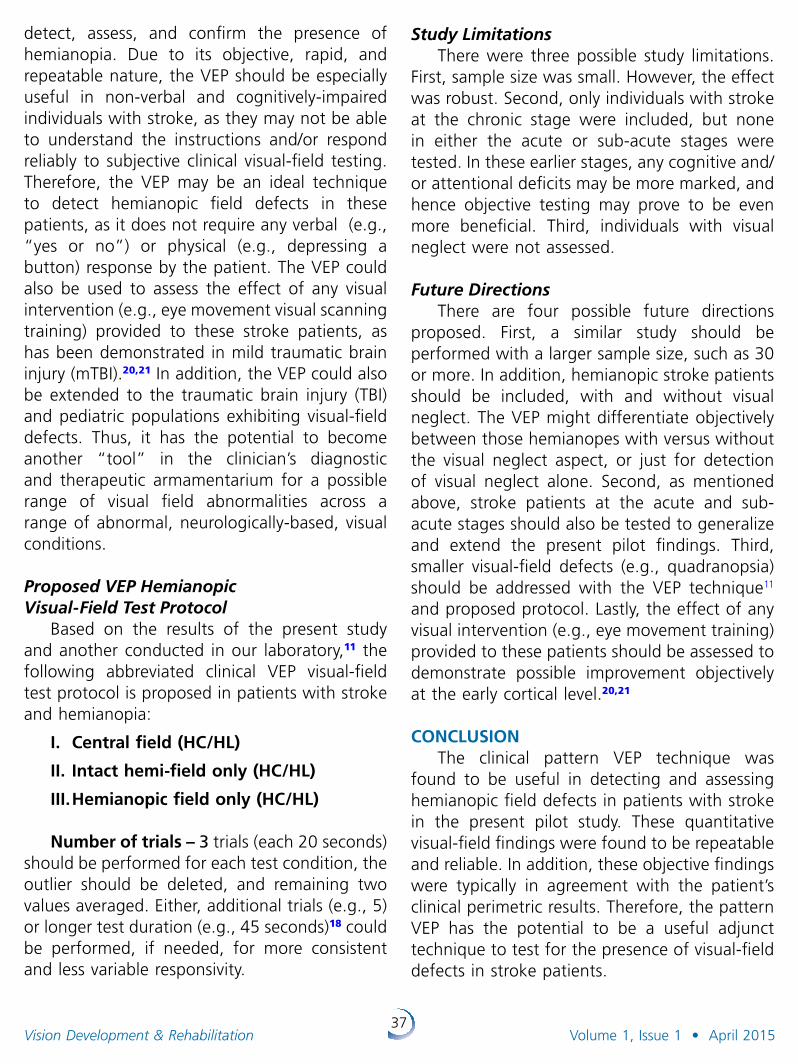
37Vision Development & Rehabilitation Volume 1, Issue 1 • April 2015
detect, assess, and confirm the presence of hemianopia. Due to its objective, rapid, and repeatable nature, the VEP should be especially useful in non-verbal and cognitively-impaired individuals with stroke, as they may not be able to understand the instructions and/or respond reliably to subjective clinical visual-field testing. Therefore, the VEP may be an ideal technique to detect hemianopic field defects in these patients, as it does not require any verbal (e.g., “yes or no”) or physical (e.g., depressing a button) response by the patient. The VEP could also be used to assess the effect of any visual intervention (e.g., eye movement visual scanning training) provided to these stroke patients, as has been demonstrated in mild traumatic brain injury (mTBI).20,21 In addition, the VEP could also be extended to the traumatic brain injury (TBI) and pediatric populations exhibiting visual-field defects. Thus, it has the potential to become another “tool” in the clinician’s diagnostic and therapeutic armamentarium for a possible range of visual field abnormalities across a range of abnormal, neurologically-based, visual conditions.
Proposed VEP Hemianopic VisualField Test Protocol
Based on the results of the present study and another conducted in our laboratory,11 the following abbreviated clinical VEP visual-field test protocol is proposed in patients with stroke and hemianopia:
I. Central field (HC/HL)
II. Intact hemi-field only (HC/HL)
III. Hemianopic field only (HC/HL)
Number of trials – 3 trials (each 20 seconds) should be performed for each test condition, the outlier should be deleted, and remaining two values averaged. Either, additional trials (e.g., 5) or longer test duration (e.g., 45 seconds)18 could be performed, if needed, for more consistent and less variable responsivity.
Study LimitationsThere were three possible study limita tions.
First, sample size was small. However, the effect was robust. Second, only individuals with stroke at the chronic stage were included, but none in either the acute or sub-acute stages were tested. In these earlier stages, any cognitive and/or attentional deficits may be more marked, and hence objective testing may prove to be even more beneficial. Third, individuals with visual neglect were not assessed.
Future DirectionsThere are four possible future directions
proposed. First, a similar study should be performed with a larger sample size, such as 30 or more. In addition, hemianopic stroke patients should be included, with and without visual neglect. The VEP might differentiate objectively between those hemianopes with versus without the visual neglect aspect, or just for detection of visual neglect alone. Second, as mentioned above, stroke patients at the acute and sub-acute stages should also be tested to generalize and extend the present pilot findings. Third, smaller visual-field defects (e.g., quadranopsia) should be addressed with the VEP technique11 and proposed protocol. Lastly, the effect of any visual intervention (e.g., eye movement training) provided to these patients should be assessed to demonstrate possible improvement objectively at the early cortical level.20,21
CONCLUSIONThe clinical pattern VEP technique was
found to be useful in detecting and assessing hemianopic field defects in patients with stroke in the present pilot study. These quantitative visual-field findings were found to be repeatable and reliable. In addition, these objective findings were typically in agreement with the patient’s clinical perimetric results. Therefore, the pattern VEP has the potential to be a useful adjunct technique to test for the presence of visual-field defects in stroke patients.
38Vision Development & Rehabilitation Volume 1, Issue 1 • April 2015
ACKNOWLEDGEMENTS This study was funded by the SUNY/
Optometry graduate program. We thank DIOPSYS Inc., Pine Brook, New Jersey, USA, for providing the VEP system.
REFERENCES1. Feigin VL. Stroke epidemiology in the developing world.
Lancet 2005;365:2160–2161.
2. Donnan GA, Fisher M, Macleod M et al. Stroke. Lancet 2008;371:1612–1623.
3. Goldstein LB, Bushnell CD, Adams RJ et al.; American Heart Association Stroke Council; Council on Cardiovascular Nursing; Council on Epidemiology and Prevention; Council for High Blood Pressure Research; Council on Peripheral Vascular Disease, and Interdisciplinary Council on Quality of Care and Outcomes Research. Guidelines for the primary prevention of stroke: guidelines for healthcare profession from the American Heart Association/American Stroke Association. Stroke 2011;42:517-584
4. Hibbard MR, Gordon WA, Kenner B. The neuro psychological evaluation: a pathway to understanding the sequelae of brain injury. In: Suchoff IB, Ciuffreda KJ, Kapoor N eds Visual and Vestibular Consequences of Acquired Brain Injury. Santa Ana, CA: Optometric Extension Program Foundation; 2001:32-45.
5. Kapoor N, Ciuffreda KJ. Vision disturbances following traumatic brain injury. Curr Treat Options Neurol 2002;4:271-280.
6. Suchoff IB, Ciuffreda KJ, Kapoor N. (eds.) Visual and Vestibular Consequences of Acquired Brain Injury. Santa Ana, CA: Optometric Extension Program Foundation; 2001.
7. Suter PS, Harvey LH. (eds.) Vision Rehabilitation. Multidisciplinary Care of the Patient Following Brain Injury. New York, NY: Taylor and Francis Group; 2011.
8. Ciuffreda KJ, Ludlam DP. Egocentric localization: Normal and abnormal aspects. In: Suter PS, Harvey LH eds. Vision Rehabilitation. Multidisciplinary Care of the Patient Following Brain Injury. New York, NY: Taylor and Francis Group; 2011:193-211.
9. Reding MJ, Potes E. Rehabilitation outcome following initial unilateral hemispheric stroke: life table analysis approach. Stroke 1988;19:1354–1358.
10. Bradnam MS, Montgomery AMI, Evans AL et al. Objective detection of hemifield and quadrantic field defects by visual evoked cortical potentials. Br J Ophthalmol 1996;80:297-303.
11. Yadav NK, Ludlam DP, Ciuffreda KJ. Effect of different stimulus configuration on the visual evoked potential (VEP). Doc Ophthalmol 2012;124:177-196.
12. Odom JV, Bach M, Brigell M et al. ISCEV standard for clinical visual evoked potentials (2009) update. Doc Ophthalmol 2010;120:111-119.
13. Viggiano MP, Spinelli D, Mecacci L. Pattern reversal visual evoked potentials in patients with hemineglect syndrome. Brain Cogn 1995;27:17-35.
14. Kaizer F, Korner-Bitensky N, Mayo N. Response time of stroke patients to a visual stimulus. Stroke 1988;19:335-339.
15. Spinelli D, Burr DC, Morrone C. Spatial neglect is associated with increased latencies of visual evoked potentials. Vis Neurosci 1994;11:909-918.
16. Angelelli P, De Luca M, Spinelli D. Early visual processing in neglect patients: A study with steady-state VEPs. Neuropsychologia 1996;34:1151-1157.
17. Willeford KT, Ciuffreda KJ, Yadav NK et al. Objective assessment of the human visual attentional state. Doc Ophthalmol 2013;126:29-44.
18. Willeford KT, Ciuffreda KJ, Yadav NK. Effect of test duration on the visual-evoked potential (VEP) and alpha-wave responses. Doc Ophthalmol 2013;126:105-115.
19. Abdi H. Coefficient of variation. In: Salkind N ed. Encyclopedia of Research Design. Thousand Oaks, CA: Sage; 2010:1-5.
20. Freed S, Hellerstein LF. Visual electrodiagnostic findings in mild traumatic brain injury. Brain Inj 1997;11:25-36.
21. Yadav NK, Thiagarajan P, Ciuffreda KJ. Effect of oculomotor vision rehabilitation on the visual-evoked potential and visual attention in mild traumatic brain injury. Brain Inj 2014;28:922-929.
COVD wishes to thank the following for their continued sponsorship of special events during the COVD 45th Annual Meeting:
Good-Lite Hospitality Suite
HOYA Vision Care Student Mixer • Virtual Event Bag
HTS, Inc. Wednesday Evening Open Reception Thursday Evening Membership Social
Miraflex Meeting Badges & Holders
Thursday Morning Attendee Breakfast
39Vision Development & Rehabilitation Volume 1, Issue 1 • April 2015
Article: Retinoblastoma; a Scientific and Clinical Review Thomas Kollodge, BS
Biomedical Science, Doctor of Optometry Candidate, Expected 05/15
Sarah Hinkley, OD, FCOVD Associate Professor, Michigan College of Optometry at Ferris State University Chief of Vision Rehabilitation Services Professor, University Eye Center, Big Rapids, Michigan
ABSTRACT Introduction: Retinoblastoma is a devas tating autosomal dominant genetic disease usually seen in children. It causes tumors of the retina which can lead to severe visual impairments and in some cases death.
Body: A defective or absent pRB protein, from a mutated or deleted RB1 gene, causes genomic instability and allows retinoblasts to undergo rapid mitosis. This can lead to the formation of tumors within the retina. As retinoblastoma usually affects infants and young children, they may not notice any changes in their vision or ocular discomfort. The most commonly observed sign of retinoblastoma is leukocoria, caused by the light colored tumor within the eye. There are many treatment options available, some of which include chemotherapy, enucleation, external beam radiation, and radioactive plaques. If caught early, the prognosis is usually very good in the United States. Unfortunately, in second and third world countries the outlook can be significantly worse.
Discussion: Retinoblastoma is a complex disease which can have severe health impacts and endanger the life of the afflicted child. Although this disease is rare, it is the most common
primary ocular malignancy in children. Retinoblastoma is caused by a disruption of the RB1 gene. Research has led to the triple hit hypothesis that three mutations are required for retinoblastoma formation. Tumors often appear early as translucent thickenings of the retina and evolve into dome-shaped, white, vascularized masses. The most common treatments include chemotherapy, radiation and enuclea tion. Early detection is best accom plished when young children receive comprehensive eye examinations. Catching the disease before it metastasizes greatly improves a child’s chance of survival. Early diagnosis and subsequent treatment could ultimately save a child’s vision or even his or her life.
Correspondence regarding this article should be emailed to Thomas Kollodge at [email protected] or call 763-222-7832 . All state ments are the author’s personal opinion and may not reflect the opinions of the College of Optometrists in Vision Development, Vision Development & Rehabilitation or any institution or organization to which the author may be affiliated . Permission to use reprints of this article must be obtained from the editor . Copyright 2015 College of Optometrists in Vision Development . VDR is indexed in the Directory of Open Access Journals . Online access is available at covd.org . https://doi.org/10.31707/VDR2015.1.1.p39.
Kollodge T, Hinkley S. Retinoblastoma; a scientific and clinical review. Vision Dev & Rehab 2015;1(1):39-45
Keywords: Retinoblastoma, RB1, pRB, malignancy, tumor, cancer
40Vision Development & Rehabilitation Volume 1, Issue 1 • April 2015
INTRODUCTIONRetinoblastoma is the most common primary
intraocular malignancy in children, and can have devastating effects on a child’s vision and health.1,2 It is an autosomal dominant cancer of the retina which typically develops in children under the age of five or six.1,3 In the case of retinoblastoma, autosomal dominance does not guarantee that the affected person will develop retinoblastoma; it only indicates an increased risk.3 It is caused by mutations or deletions of the RB1 gene, located on chromosome 13.3,4 Retinoblastoma is typically unilateral with a hallmark sign of leukocoria, noted in the affected eye.1,3 If caught early, especially before it metastasizes, the prognosis for patients can be very good, but if not, the patient’s life may be at risk. This review is intended to inform the reader of the scientific and clinical aspects of retinoblastoma.
EpidemiologyRetinoblastoma affects approximately 1
in 15,000 to 20,000 people.1,2,3 In the United States, 250-350 children are diagnosed with retinoblastoma each year.5 It is responsible for approximately 11% of all cancers during the first year of life, and 4% of cancers during the first 15 years of life.5,6 After 6 years of age, its incidence is extremely low, peaking during the first few months of life. It is normally diagnosed around 12 months of age in children who have bilateral retinoblastoma, compared to 24 months for children with unilateral cases.1 The survival rate in the United States is very high, nearing 100%.2,7 Unfortunately, the prognosis in second and third world countries is not nearly as good, which is likely associated with lack of detection and poor access to medical care. The survival rate is 81% in China, 48% in India, and as low as 20-46% in Africa. Worldwide, it is estimated that 3,000-4,000 deaths occur annually due to retinoblastoma.2 There is no known racial or gender predilection.1,7
Genetics & PathogenesisThe tumor suppressor gene associated with
retinoblastoma, RB1, is located on 13q14.2, meaning that is found on the q (long) arm of chromosome 13, in band number 14, and within sub band 2.1,3,5 The RB1 gene codes for the protein pRB, a nuclear protein, which is important for regulating cellular growth.4,8 The pRB protein normally binds to the E2F transcription factor complex, inactivating it, and thus prevents the movement of the cell from the G1 phase to the S phase of mitosis. Recent studies also suggest that pRB has roles in controlling cellular differentiation, regulating apoptosis, sustaining cell cycle arrest, and chromatin remodling.8 The inactivation of the RB1 gene is also seen in some other forms of second cancers.3 Typically, retinoblastoma is caused by a biallelic loss of function or deletion of RB1 leading to genomic instability.3,4 Studies have demonstrated that at minimum a third mutation in a separate gene is required, beyond the biallelic mutations of the RB1 gene, in order for retinoblastoma tumors to form. This third hit can occur in another a tumor suppressor gene or oncogene, such as MYCN (2p24.3), E2F3 and DEK (6p22), CDH11 (16q21), or p75NTR (17q21) and potentially allow for the transformation of retinomas to malignant retinoblastoma tumors.4 The genomic instability from the defect in RB1 can also lead to problems in other genes, such as the ones listed above. Affecting other genes can help enable tumor growth within the eye and other tissues throughout the body.
The vast majority of the human genome is identical from person-to-person. However, differences exist in the parts of deoxy ribonucleic acid (DNA) encoding for genes. The differences in DNA bases are known as single nucleotide polymorphisms (SNPs). Human somatic cells are normally diploid, meaning that they have two copies of each chromosome. SNPs permit cells to have different nucleotide bases within each chromosome allowing for heterozygosity, or having different copies of genes, as opposed to being homozygous. Deletion or inactivation
41Vision Development & Rehabilitation Volume 1, Issue 1 • April 2015
of the RB1 gene, as seen in the case of retinoblastoma, is termed loss of heterozygosity (LOH), since there is only one functional RB1 gene remaining.4 People who have LOH are at a much higher risk for developing retinoblastoma as it may only take one mutation to occur in the remaining RB1 gene within a retinoblast to begin the formation of a retinoblastoma.
Alfred Knundson proposed the two-hit theory of retinoblastoma carcinogenesis in 1971. His theory states that a cell needs to have two damaged alleles in order for a tumor to form. There are two forms of retinoblastoma based off of this model, inherited (familial) or sporadic. The first hit, or mutation, of inherited retinoblastoma is acquired from the germ cell of a parent. Thus, all the cells of the child would have one normal and one altered RB1 gene. Due to this LOH, the developing fetus requires only a single mutational event in one of its retinoblasts in order to initiate a tumor.9 As these individuals have a defective RB1 gene throughout all of their cells, they are also more prone to other second cancers such as osteosarcoma, melanoma, and various soft tissue cancers, depending on which gene(s) the third or any additional hits affect.3,5 Although very rare, trilateral retinoblastoma can occur when there is a pinealblastoma associated with bilateral ocular retinoblastoma.1,3 This is thought to occur because certain retinal and pineal gland tissues are similar.3 The trilateral form has a much higher mortality rate, accounting for over half of all retinoblastoma deaths during the first decade of life.7
Sporadic retinoblastoma is when the germ cell from each parent has a normal, functional RB1 gene, but two somatic mutations occur in the RB1 genes during fetal development, also known as Knudson’s two-hit theory. A distinguishing factor between the two is that inherited retinoblastoma is frequently bilateral as all cells are more prone to acquiring the 2nd hit needed to form retinoblastoma, whereas the sporadic variety is usually unilateral.9 Approximately 60-70% of retinoblastoma cases
are unilateral, with the remaining 30-40% being bilateral.1
Signs & SymptomsThe hallmark sign of retinoblastoma is
leukocoria, defined as a white reflex in the pupil.1,3 This is caused by the reflection of light off the yellow-white colored retinoblastoma tumor.1,10 The second most common sign of retinoblastoma is strabismus, which can manifest as either exotropia or esotropia.1,3
Strabismus is most likely caused by macular compromise so proper binocular fixation cannot be maintained in the affected eye. Other ocular signs of retinoblastoma include red eye, excessive tearing, buphthalmos, and corneal clouding.1 Iris discoloration from neovascularization, loss of fundus reflection secondary to intraocular bleeding of the tumor, clumping of white tumor cells on the iris or in the aqueous humor, hyphema, glaucoma, and sterile orbital cellulitis may also be observed.1,3 Symptoms may consist of ocular pain, redness, irritation, and decreased visual acuity.5 Young children are most often affected by retinoblastoma and may be less likely to notice or report any ocular discomfort or blurred vision.
Figure 1 shows a photograph of typical large retinoblastoma. Tumors associated with retinoblastoma vary greatly in appearance. Discrete intraretinal tumors appear as white, dome shaped masses with blood vessels growing towards them. Small tumors often appear as translucent thickenings of the retina.1 Exophytic (growing outward towards the retinal pigment epithelium) retinoblastoma tumors are typically larger, and are associated with rhegmatogenous retinal detachments.1,10 On the other hand, endophytic (growing towards the vitreous) tumors are usually smaller, and their cells may accumulate in the vitreous.1 Occasionally, some tumors may have a mixed endophytic-exophytic growth pattern. Diffuse infiltrating retinoblastoma is a rare form which occurs when the tumor grows horizontally within the retina, as opposed to growing vertically as seen
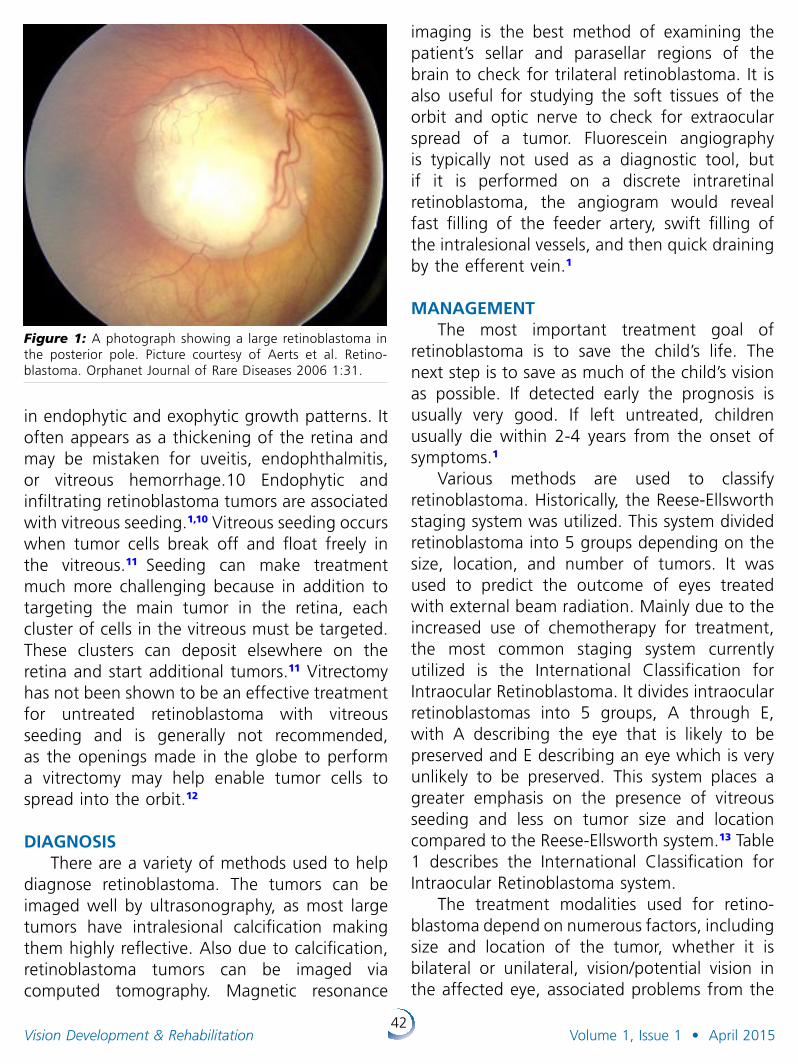
42Vision Development & Rehabilitation Volume 1, Issue 1 • April 2015
Figure 1: A photograph showing a large retinoblastoma in the posterior pole. Picture courtesy of Aerts et al. Retino-blastoma. Orphanet Journal of Rare Diseases 2006 1:31.
in endophytic and exophytic growth patterns. It often appears as a thickening of the retina and may be mistaken for uveitis, endophthalmitis, or vitreous hemorrhage.10 Endophytic and infiltrating retinoblastoma tumors are associated with vitreous seeding.1,10 Vitreous seeding occurs when tumor cells break off and float freely in the vitreous.11 Seeding can make treatment much more challenging because in addition to targeting the main tumor in the retina, each cluster of cells in the vitreous must be targeted. These clusters can deposit elsewhere on the retina and start additional tumors.11 Vitrectomy has not been shown to be an effective treatment for untreated retinoblastoma with vitreous seeding and is generally not recommended, as the openings made in the globe to perform a vitrectomy may help enable tumor cells to spread into the orbit.12
DIAGNOSIS There are a variety of methods used to help
diagnose retinoblastoma. The tumors can be imaged well by ultrasonography, as most large tumors have intralesional calcification making them highly reflective. Also due to calcification, retinoblastoma tumors can be imaged via computed tomography. Magnetic resonance
imaging is the best method of examining the patient’s sellar and parasellar regions of the brain to check for trilateral retinoblastoma. It is also useful for studying the soft tissues of the orbit and optic nerve to check for extraocular spread of a tumor. Fluorescein angiography is typically not used as a diagnostic tool, but if it is performed on a discrete intraretinal retinoblastoma, the angiogram would reveal fast filling of the feeder artery, swift filling of the intralesional vessels, and then quick draining by the efferent vein.1
MANAGEMENTThe most important treatment goal of
retinoblastoma is to save the child’s life. The next step is to save as much of the child’s vision as possible. If detected early the prognosis is usually very good. If left untreated, children usually die within 2-4 years from the onset of symptoms.1
Various methods are used to classify retinoblastoma. Historically, the Reese-Ellsworth staging system was utilized. This system divided retinoblastoma into 5 groups depending on the size, location, and number of tumors. It was used to predict the outcome of eyes treated with external beam radiation. Mainly due to the increased use of chemotherapy for treatment, the most common staging system currently utilized is the International Classification for Intraocular Retinoblastoma. It divides intraocular retino blastomas into 5 groups, A through E, with A describing the eye that is likely to be preserved and E describing an eye which is very unlikely to be preserved. This system places a greater emphasis on the presence of vitreous seeding and less on tumor size and location compared to the Reese-Ellsworth system.13 Table 1 describes the International Classification for Intraocular Retinoblastoma system.
The treatment modalities used for retino-blastoma depend on numerous factors, including size and location of the tumor, whether it is bilateral or unilateral, vision/potential vision in the affected eye, associated problems from the
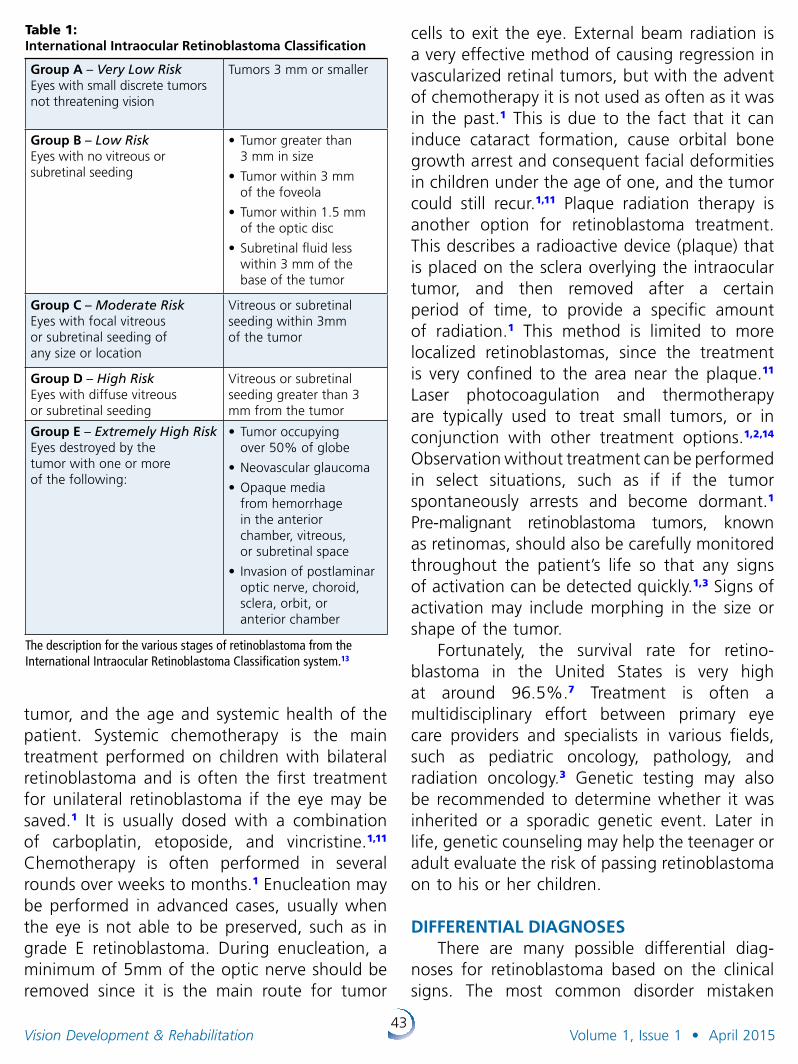
43Vision Development & Rehabilitation Volume 1, Issue 1 • April 2015
tumor, and the age and systemic health of the patient. Systemic chemotherapy is the main treatment performed on children with bilateral retinoblastoma and is often the first treatment for unilateral retinoblastoma if the eye may be saved.1 It is usually dosed with a combination of carboplatin, etoposide, and vincristine.1,11 Chemotherapy is often performed in several rounds over weeks to months.1 Enucleation may be performed in advanced cases, usually when the eye is not able to be preserved, such as in grade E retinoblastoma. During enucleation, a minimum of 5mm of the optic nerve should be removed since it is the main route for tumor
cells to exit the eye. External beam radiation is a very effective method of causing regression in vascularized retinal tumors, but with the advent of chemotherapy it is not used as often as it was in the past.1 This is due to the fact that it can induce cataract formation, cause orbital bone growth arrest and consequent facial deformities in children under the age of one, and the tumor could still recur.1,11 Plaque radiation therapy is another option for retinoblastoma treatment. This describes a radioactive device (plaque) that is placed on the sclera overlying the intraocular tumor, and then removed after a certain period of time, to provide a specific amount of radiation.1 This method is limited to more localized retinoblastomas, since the treatment is very confined to the area near the plaque.11 Laser photocoagulation and thermotherapy are typically used to treat small tumors, or in conjunction with other treatment options.1,2,14 Observation without treatment can be performed in select situations, such as if if the tumor spontaneously arrests and become dormant.1 Pre-malignant retinoblastoma tumors, known as retinomas, should also be carefully moni tored throughout the patient’s life so that any signs of activation can be detected quickly.1,3 Signs of activation may include morphing in the size or shape of the tumor.
Fortunately, the survival rate for retino-blastoma in the United States is very high at around 96.5%.7 Treatment is often a multidisciplinary effort between primary eye care providers and specialists in various fields, such as pediatric oncology, pathology, and radiation oncology.3 Genetic testing may also be recommended to determine whether it was inherited or a sporadic genetic event. Later in life, genetic counseling may help the teenager or adult evaluate the risk of passing retinoblastoma on to his or her children.
DIFFERENTIAL DIAGNOSESThere are many possible differential diag-
noses for retinoblastoma based on the clinical signs. The most common disorder mistaken
Table 1: International Intraocular Retinoblastoma Classification
Group A – Very Low RiskEyes with small discrete tumors not threatening vision
Tumors 3 mm or smaller
Group B – Low Risk Eyes with no vitreous or subretinal seeding
•Tumor greater than 3 mm in size
•Tumor within 3 mm of the foveola
•Tumor within 1.5 mm of the optic disc
•Subretinal fluid less within 3 mm of the base of the tumor
Group C – Moderate RiskEyes with focal vitreous or subretinal seeding of any size or location
Vitreous or subretinal seeding within 3mm of the tumor
Group D – High RiskEyes with diffuse vitreous or subretinal seeding
Vitreous or subretinal seeding greater than 3 mm from the tumor
Group E – Extremely High Risk Eyes destroyed by the tumor with one or more of the following:
•Tumor occupying over 50% of globe
•Neovascular glaucoma
•Opaque media from hemorrhage in the anterior chamber, vitreous, or subretinal space
• Invasion of postlaminar optic nerve, choroid, sclera, orbit, or anterior chamber
The description for the various stages of retinoblastoma from the International Intraocular Retinoblastoma Classification system.13
44Vision Development & Rehabilitation Volume 1, Issue 1 • April 2015
for retinoblastoma is Coat’s disease, which can also present with leukocoria.1 Coat’s disease is a condition in which faulty blood vessels leak in the retina allowing lipids to accumulate, forming lesions similar to that of retinoblastoma. Other differentials of leukocoria include persistent hyperplastic primary vitreous, ocular toxocariasis, cicatri cial retinopathy of prematurity, familial exudative vitreoretinopathy, incontinentia pigmenti retinopathy, and Norrie’s disease. Intermediate uveitis, microbial endo-phthal mitis or retinitis, and leukemic infiltra-tion are all possible differential diagnoses of vitreous seeds. Some differential diagnoses of discrete retinal tumors include astrocytoma of retina, medulloepithelioma, retinal capillary hemangioma, and areas of myelinated retinal nerve fibers.1
DISCUSSIONRetinoblastoma is the most common
intraocular malignancy of childhood. It is a devastating disease with severe visual impacts and even the possibility of death. Having a basic understanding of the genetics and pathophysiology ultimately leads to better care for the patient as appropriate referrals can be made to specialists for treatment, and to be examined for second cancers associated with retinoblastoma. Providers should be able to discuss the genetics of the disease, allowing parents to better understand retinoblastoma and potentially help determine if other family members may be at risk as well.
Since young children do not usually notice problems with their eyes, dilated eye exams should be performed on a regular basis to catch any problems early. While vision screenings may be effective at catching advanced cases of retinoblastoma, screenings lacking red reflex testing or internal examination and may miss the disease. All children who have an immediate family history of retinoblastoma should also have an eye examination shortly after birth, and at regular intervals thereafter. The trademark sign of retinoblastoma is leukocoria. Other diseases
may also present with leukocoria in children, but regardless of the cause, leukocoria warrants a swift, complete, dilated eye examination. With early detection, a child’s prognosis for survival is usually very good. Many treatment modalities are available, and numerous factors need to be taken into consideration when choosing an appropriate treatment plan. Fortunately, the survival rate in the United States is very high. Pediatric eye exams need to be stressed so diseases such as retinoblastoma and other conditions can be identified early. The InfantSEE® program, created by the American Optometric Association (AOA), is an excellent start to educating the public on the importance of comprehensive eye exams for infants and children. This public health program provides complimentary exams to children between 6 and 12 months of age by a participating provider. The AOA recommends children without high risk factors to be examined at 6 months, 3 years, before the first grade, and every 2 years thereafter.15 Optometrists and ophthalmologists play a key role in the detection of retinoblastoma through comprehensive eye exams and collaboration with other specialists for its treatment and management. It is critical that eye care professionals have a thorough understanding of the clinical signs and symptoms of retinoblastoma, particularly in its early stages. Thorough knowledge of the genetics and treatment options for the disease are critical when educating parents stunned by their child’s diagnosis.
REFERENCES1. Augsburger J, Bornfeld N, and Giblin N. “Retinoblastoma.”
Ophthalmology. By Yanoff M and Duker J. Edinburgh: Mosby Elsevier, 2009. 887-93. Print Edition.
2. Villegas V, Hess D, Wildner A, Gold A, Murray T. Retinoblastoma. Curr Opin in Ophthalmol. 2013;24(6):581-588.
3. Lohmann, D., and B. Gallie. “Retinoblastoma.” GeneReviews®. Ed. R. Pagon, M. Adam, H. Ardinger, S. Wallace, A. Amemiya, L. Bean, T. Bird, C. Dolan, C. Fong, R. Smith, and K. Stephens. U of Washington. Seattle, National Center for Biotechnology Information, 18 July 2000. Web. Nov. 2013.
45Vision Development & Rehabilitation Volume 1, Issue 1 • April 2015
4. Ganguly A, Nichols K, Grant G, Rappaport E, Shields C. Molecular Karyotype of Sporadic Unilateral Retinoblastoma Tumors. Retina. 2009; 29(7):1002-1012.
5. “Retinoblastoma.” Genetics Home Reference. U.S. Library of Medicine, Apr. 2009. Web. Nov. 2013. <http://goo.gl/wK1fWB>.
6. Ries L, Smith M, Gurney J, et al (Eds). Cancer Incidence and Survival among Children and Adolescents: United States SEER Program 1975-1995, National Cancer Institute, SEER Program. NIH Pub. No. 99-4649. Bethesda, MD, 1999.
7. Broaddus E, Topham A, Singh A. Survival with retinoblastoma in the USA: 1975-2004. Br J Ophthalmol 2009; 93:24.
8. Khidr L, Chen P. RB, the conductor that orchestrates life, death and differentiation. Oncogene. 2006 Aug 28;25(38):5210-9.
9. Jorde L, Carey J, and Bamshad M. Medical Genetics. Philadelphia: Mosby/Elsevier, 2010. Print Edition.
10. Shields C, Ghassemi F, Tuncer S, et al. Clinical spectrum of diffuse infiltrating retinoblastoma in 34 consecutive eyes. Ophthalmology 2008;115:2253.
11. Kaneko A, Suzuki S. Eye-Preservation Treatment of Retinoblastoma with Vitreous Seeding. Jpn J Clin Oncol. 2003;33(12):601-607.
12. Shields C, Honavar S, Shields J, Demirci H, Meadows A. Vitrectomy in Eyes with Unsuspected Retinoblastoma. Ophthalmology. 2000; 107:2250–2255.
13. Shields C, Mashayekhi A, Au A, Czyz C, Leahey A, Meadows A, Shields J. The International Classification of Retinoblastoma predicts chemoreduction success. Ophthalmology. 2006 Dec;113(12):2276-80.
14. Rodriguez-Galindo C, Orbach D, VanderVeen D. Retinoblastoma. Pediatr Clin North Am. 2015 Feb;62(1):201-23.
15. Scheiman, M., C. Amos, E. Ciner, W. Marsh-Tootle, B. Moore, and M. Rouse. “Pediatric Eye and Vision Examination.” Ed. J. Townsend, J. Amos, K. Beebe, J. Cavalleron, J. Lahr, H. McAlister, S. Miller, and R. Wallingford. Optometric Clinical Practice Guideline. St. Louis, MO: American Optometric Association, 2002.
Are you connected? If not, check us out and join us today!
COVD Blog
46Vision Development & Rehabilitation Volume 1, Issue 1 • April 2015
Article: Confusion Inside Panum’s Area and Symptomatic Convergence Insufficiency
Paul Lederer, OD
Dmitri Poltavski, PhD, University of North Dakota, Grand Forks, North Dakota
David Biberdorf, OD
ABSTRACTIn the present study we compared the ability of commonly used diagnostic criteria for CI to
discriminate between symptomatic pediatric patients and normal controls with corresponding sensitivity and specificity parameters of a novel test of Near Point of Fixation Disparity (NPFD) and a measure of Associated Positive Fusional Convergence (APFC). The results yielded 95% sensitivity and 100% specificity for the NPFD-based criteria, while common Near Point of Convergence and Positive Fusional Convergence criteria were no better than chance. Supplemental use of NPFD and APFC are expected to increase the sensitivity of optometric evaluation to CI without compromising its specificity.
Convergence Insufficiency (CI) is a bino cular vision disorder that represents a specific type of decompensated hetero phoria. Evans1 classified the symptoms of decompensated heterophoria into three categories: visual symptoms (blur, diplopia, distorted vision); binocular difficulties and asthenopia. Convergence Insufficiency is typically characterized by exophoria that is greater at near than distance, a remote near point of convergence (NPC) or decreased
positive fusional convergence (PFC) at near.2 It is often associated with symptoms such as double vision, eyestrain, headaches, blurred vision, and loss of place while reading or performing near work. Not all patients with CI, however, present with symptoms possibly due to either suppression, avoidance of near visual tasks, high pain threshold or monocular occlusion.2 Yet symptoms associated with CI may negatively affect a person’s quality of life by interfering with school, work, and leisure activities performed at near. The presence of CI may contribute to parental reports of difficulty with their child’s ability to complete schoolwork efficiently,3 whereas a successful or improved outcome after CI treatment has been shown to be associated with a reduction in the frequency of adverse academic behaviors and parental concern associated with reading and school work as reported by parents4.
The diagnostic criteria for CI have been neither consistently applied by investigators and clinicians nor have been particularly accurate in identification of CI in the presence of asthenopia. For example, Rouse5 reported that 93.8% of the optometrist’s surveyed in their study used reduced NPC for the diagnosis of convergence insufficiency. Others believe that an exophoria
Correspondence regarding this article should be emailed to Paul Lederer, OD, at [email protected] . All state-ments are the authors’ personal opinion and may not reflect the opinions of the College of Optometrists in Vision Development, Vision Development & Rehabilitation or any institu tion or organization to which the author may be affiliated . Permission to use reprints of this article must be obtained from the editor . Copyright 2015 College of Optometrists in Vision Development . VDR is indexed in the Directory of Open Access Journals . Online access is available at covd.org . https://doi.org/10.31707/VDR2015.1.1.p46.
Lederer P, Poltavski D, Biberdorf D. Confusion inside panum’s area and symptomatic convergence insufficiency. Vision Dev & Rehab 2015;1(1):46-60.
Keywords: fixation disparity, NPFD, Convergence Insufficiency
47Vision Development & Rehabilitation Volume 1, Issue 1 • April 2015
greater at near must be present, along with either a reduced NPC or PFC. Yet there are many who believe that all three criteria need to be satisfied (both the NPC and PFC should be reduced in the presence of an exophoria) before CI can be diagnosed.6
On the other hand, in some cases, none of the 3 criteria may be abnormal, yet CI may be diagnosed in the presence of asthenopia associated with convergence.2,7,8 Rouse et al.6 further reported that out of 206 children between 8 and 12 years of age whose records showed none of the 3 classic signs of CI (were classified as “no CI”), 25% had symptoms consistent with Convergence Insufficiency including the presence of symptoms when reading or writing, such as headache, diplopia, eye fatigue, or print running together when reading. Furthermore, because convergence in the pre-presbyopic population is never independent of the accommodative system, due to the interactive negative feedback loop between accommodation and vergence, a convergence problem may be secondary to a primary accommodative problem, and vice versa.9 These issues of inconsistency and inaccuracy of CI diagnosis continue to thwart attempts to estimate CI prevalence in pediatric and adult populations, impede development of effective treatment strategies and interfere with evaluation of treatment outcomes.
Another reason for difficulty in establishing clear diagnostic criteria for convergence insuf-ficiency may be related to the fact that classic vergence and near point of convergence measures used by clinicians can underestimate binocular dysfunction. The classic Divergence- to- Convergence Recovery range (VRR) and Near Point of Convergence (NPC) measures evaluate when the burden of fusion demand placed upon binocular vision becomes too great and diplopia becomes manifest as fusion limits are exceeded (break point) and when fusion recovers (recovery point). In its turn diplopia occurs when retinal fixation disparity falls outside of Panum’s area. In 1858 Panum described Panum’s fusional area
defined for a stimulus at a fixed retinal locus as the retinal area, upon which a target can be imaged in the other eye and appears fused.10 Disparities that exceed this limit result in diplopia or binocular rivalry. Hence Panum’s area is also a threshold measure of diplopia.11
Within Panum’s area, however, double vision is not experienced, and yet a significant binocular disparity dysfunction can be present and can manifest itself as asthenopia.12 In a review of literature on visual discomfort and visual fatigue Lambooij and Ijsselsteijn13 contend that under natural viewing condi tions retinal disparities within Panum’s fusion area beyond 1° are assumed to cause visual discomfort. The authors equate this 1° area around Donder’s line with Percival’s zone of comfort defined as the middle third of the amount of binocular vergence with almost no change in accommodation, i.e., the middle third of “the zone of clear, single binocular vision.”
At the same time while NPC and VRR measures may not be sensitive to asthenopia-inducing vergence issues occurring within Panum’s fusion area, traditional measures of fixation disparity using dichoptic targets and binocular fusion locks are assumed to address retinal disparity within PFA, when the object is still seen singly.14,12 The angular value of fixation disparity is a measure of the degree to which the images have slipped.15 The conventional view is that fixation disparity typically measures between 5 and 10 min of arc and rarely exceeds 10 min of arc.16
Yekta and Pickwell17 investigated fixation disparity in relation to symptomatic convergence insufficiency using the Mallett fixation disparity unit, in which at near the central fixation target OXO is seen with both eyes and the two monocular markers (nonius strips) in line with the ‘X’ are seen one with each eye using cross polarizing filters. Symptomatic participants had significantly higher degrees of fixation disparity than asymptomatic ones. This finding was consistent with Mallett’s18 and later Sheedy and Saladin’s19 suggestion that fixation disparity is a
48Vision Development & Rehabilitation Volume 1, Issue 1 • April 2015
better indicator of decompensated heterophoria than the degree of heterophoria. Similar findings were reported by Yekta et al.20 and Pickwell et al.21 for decompensated heterophoria at near. Jenkins et al.22 also reported that the sensitivity of the Mallett’s test to decompensated heterophoria in pre-presbyopes was 75% with specificity of 78%, if an aligning prism at near of 1Δ or greater was used as a cutoff for failing the test.
The location of the fusion lock in a clinical target may be an important factor in the measurement of fixation disparity. Because it is important to orient the fusion lock to be most sensitive to such “stressful” near tasks as reading, it is important to make this central target contain a letter in order to help draw one’s attention toward letter identification. Ciuffreda23 demonstrated that in visually normal individuals, accommodative interactions with vergence accounted for up to 50% of the measured fixation disparity found under normal viewing conditions. He also found that the use of an accommodative target, such as a letter, showed less vergence variability as compared to a penlight stimulus. Therefore, attention to the clarity of the accommodative target facilitates a better evaluation of focal binocular fusion as target identification is now more intimately involved with its orientation.
Similarly with the use of the same central fusion lock, measures of associated vergence can be evaluated by recording reported fixation disparity that is induced when vergence eye movements lag behind a changing vergence demand, either by moving the target inward and outward or by creating gradual increases in convergence (BO prism) or divergence (BI prism), respectively. These measures of associated vergence responses may be more sensitive to thresholds of binocular dysfunction than classic vergence measures and can thus complement diagnostic criteria for CI. For example Yekta et al.20 investigated phoria, associated phoria, fixation disparity and stereopsis for near vision in a sample of 187 subjects ranging in age
from 10 to 65 years. The authors reported a statistically significant relationship between visual symptoms for near and the magnitude of fixation disparity and associated phoria for all age groups. They did not, however, find any relationship between the presence of symptoms and phoria measurement. Similarly, exo fixation disparity (FD) (or the related associated phoria) at 40 cm indicated visual symptoms in the studies of Sheedy and Saladin24,19,25 and the of Pickwell group.26,22,17,21 Additionally Jaschinski27 also reported that in nonpresbyopic subjects with normal vision but who differed in near vision fatigue at a 50cm viewing distance, higher fatigue was significantly associated with a steeper proximity-FD curve (more exo FD and near vision).
The additional use of associated vergence measurements in nearpoint binocular assessment will determine how well an individual’s vergence response may keep up with a changing vergence demand (prism adaptation time). The traditional “blur”, “break” and “recovery” patient responses created when classic vergence measurements alone are performed may now reveal, under associated measurements, when a vergence demand-response mismatch occurs, characterized by misalignment of the vertical nonius lines. In addition, the larger the difference between the classic and associated vergence findings, the more these patients can encounter visual stress without the presence of double vision.
In the present study we evaluated a novel test of near point fixation disparity used in two ways:
1. as a relatively quick and easy assessment of fixation disparity to an incoming and outgoing dichoptic target, similar to NPC, where an exo fixation disparity was induced as the target approached a patient’s nose and a reduction in exo fixation disparity occurred as it receded. This is called the Nearpoint of Fixation Disparity Test (NPFD) and is a measure of vergence response to the combined
49Vision Development & Rehabilitation Volume 1, Issue 1 • April 2015
changes in proximal, accommodation and fusional vergence demand.
2. As a test, where the NPFD target remained at a fixed nearpoint (40 cm.) distance while associated vergence ranges were measured with prism. This is called the Associated Vergence Ranges, which measures vergence response to changes in fusional vergence demand alone, with no direct changes in accommodative vergence or proximal vergence.
We compared these measurements made under associated, dichoptic conditions to classic measures of near point of convergence (NPC) and positive fusional convergence at near (PFC). We then evaluated the sensitivity of the diagnostic criteria using traditional NPC and PFC measures to the symptoms of CI with the corresponding sensitivity of the statistically derived criteria for NPFD and associated measures. We hypothesized that the latter would show much greater sensitivity to CI as these measures would not only capture those patients whose symptoms are driven by binocular dysfunction measured outside of Panum’s area, but also those whose binocular deficits could be measured as occurring within PFA.
METHODS Participants
This was a retrospective study using records of 60 pediatric patients between 6 and 17 years of age (M= 10.56, SD=3,61), who were seen as part of a normal private practice in a Midwestern optometric clinic. Thirty-five of the patients did not report any symptoms of convergence insufficiency and had normal binocular vision, while 25 of them reported significant asthenopia consistent with symptoms of some binocular disorders including convergence insufficiency. Specific symptoms included unusual visual fatigue during near-work tasks such as reading, slow and inaccurate reading and poor comprehension, loss of focus and concentration, limited visual attention
span for critical visual activities at near point, intermittent blurring and double vision, loss of place during sustained near visual tasks and ocular headaches following sustained near visual tasks, well as motion sickness. Symptom reports were obtained from an entrance history form and from the Doctor’s interview.
In their review of Convergence Insufficiency Cooper and Jamal2 noted that up to 18% of patients with CI may be asymptomatic because of either suppression, avoidance of near visual tasks, high pain threshold, or monocular occlusion. For this reason during the selection special attention was also paid to those patients who reported avoiding near work (especially reading) and, therefore, originally did not report any symptoms. For many, symptoms were present but revealed through follow-up questions that were specifically aimed at situations, which required sustained visual performance. This is well represented by the standardized testing often experienced in school. It is their adaptation to this challenge or conflict to stay in visual focus despite the presence of increasing symptoms, which can be insightful regarding their visual history. Other probing questions relate to their having to read out loud as they begin to show an increasing trend toward the misreading or substituting of primarily the small words. The reading out loud of unfamiliar material presents a situation that makes their visual issue public and embarrassing. As a result they develop behavioral adaptations of avoidance regarding reading out loud and often tend to do the minimal amount of near work (i.e. reading) required. These characteristics complicate the process of discovery when investigating clinical history. They also reflect the emotional collateral damage that often occurs as a result of Convergence Insufficiency going undiagnosed and untreated. When questioning these patients the first author (Lederer) often indicated to them that he could attempt to get them accommodations that would provide extended time on those tests and asked them whether they would use the extended time
50Vision Development & Rehabilitation Volume 1, Issue 1 • April 2015
if they had it. Their answer was often “NO”. These types of questions are clinically insightful and provide additional clues to the performance for those who have made avoidance adaptations to their visual dysfunction. These behavioral avoidance characteristics can make the presence of symptoms more difficult to reveal. In contrast, those who tend to fight against visual stress to perform well typically reveal symptoms more overtly,
Exclusionary criteria included presence of amblyopia, convergence excess, divergence excess exotropia, constant strabismus and accommodative insufficiency as defined by a reduction in accommodative amplitude during monocular minus lens bar amplitude assessment done at 13” using a .62M acuity target.
Similarly case histories for the control group were selected from the pool of pediatric patients who were not identified as having any oculomotor problems, who did not report any symptoms of asthenopia and typically reported being good readers and liking near work (computer work, reading etc). Patient histories were thus assigned to either symptomatic or asymptomatic groups. Furthermore, this was a single-blind design as the data analyst was unaware of the association between symptoms (group membership was coded with either 1 or 2) and test values until all analyses were completed.
The likelihood of CI was estimated using some of the well-established conservative diagnostic criteria for CI as well as estimates of fixation disparity and associated phoria. The former included presence of both reduced NPC (break ≥ 5cm and recovery ≥ 7) and PFC (less than 15 Δ BO break). These criteria were based on a number of previous research reports. Specifically, Maples and Hoenes28 suggested that the criterion for the NPC break score to differentiate symptomatic from less symptomatic elementary school children should be 5 cm or greater. We chose this cut-off instead of 6 cm used by the CITT group with children between 9 and 18 years of age (see Scheiman et al.29)
to increase sensitivity of the NPC-based criteria to symptomatic CI (easier to classify someone as having CI). Consistent with other CITT group’s eligibility criteria for their CI treatment trial, we used a 7cm clinical cutoff for NPC recovery and a PFC criterion of 15 Δ BO break when estab-lishing diagnostic criteria for CI in their study of school-aged children between 9 and 18.
Diagnostic criteria for fixation disparity and associated phoria were statistically derived (see results section below) and included reduced NPFD (≥ 5cm break and ≥ 6cm recovery) and reduced associated vergence (< 16 Δ BO break).
In our study we did not look at exophoria at near as a predictor of asthenopia as in their review Cooper and Jamal2 did not consider presence of abnormal exophoria at near a necessary condition for the diagnosis of common CI. In research studies presence of exophoria at near in patients with CI ranges between 63% 30 and 79%.31
MATERIALS Near Point of Convergence (NPC)
The near point of convergence (NPC) measure has been shown to be a useful tool in assessing convergence insufficiency.32 The fixated target is gradually moved toward the patient until it becomes double. The target is then moved back until it has become single again. The break and recovery findings are recorded. The repetition of this test is a useful modification to the single measure and can reveal more subtle diagnostic issues regarding reduced stamina.32 A variety of targets have been used such as a penlight, a penlight with red/green glasses, and an identification target to engage accommodation. Ciuffreda33 and later Scheiman et al.32 showed that an accommodative target showed less variability as compared to the penlight stimuli. This type of target (a single 20/30 letter) was used in the present study. The Bernell Accommodative Rule (Bernell Corp., Mishawaka, IN) was placed just above the nose at the brow between the two eyes of the participant. The target was then
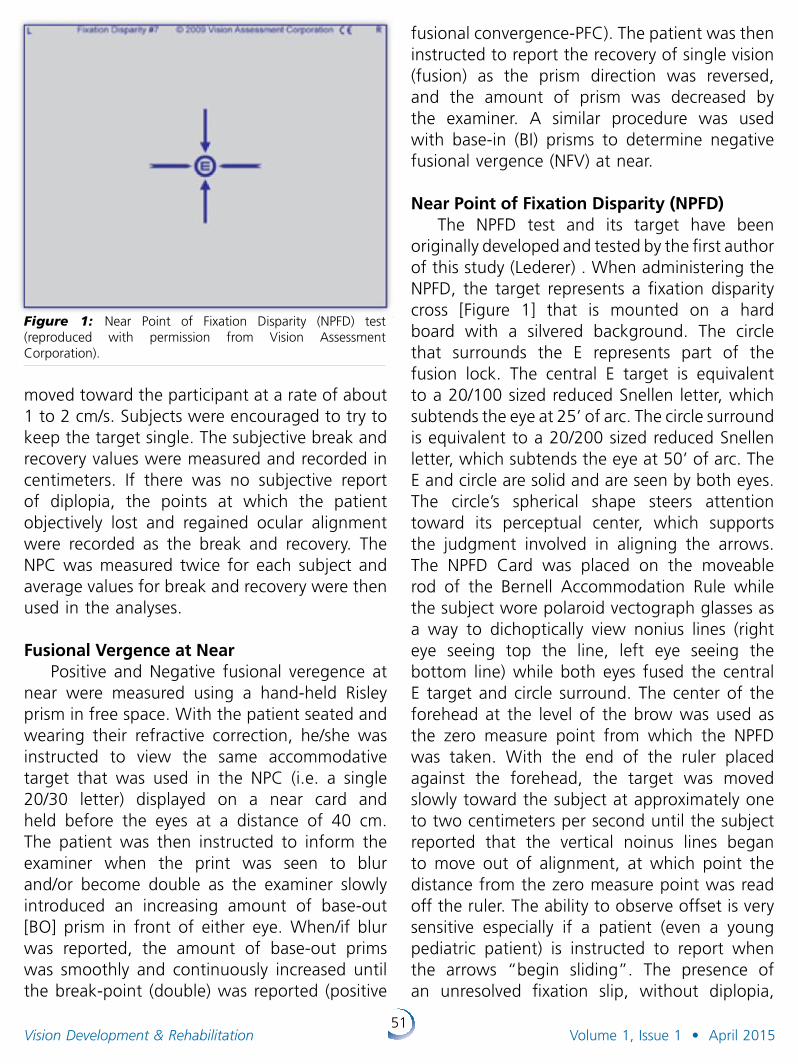
51Vision Development & Rehabilitation Volume 1, Issue 1 • April 2015
moved toward the participant at a rate of about 1 to 2 cm/s. Subjects were encouraged to try to keep the target single. The subjective break and recovery values were measured and recorded in centimeters. If there was no subjective report of diplopia, the points at which the patient objectively lost and regained ocular alignment were recorded as the break and recovery. The NPC was measured twice for each subject and average values for break and recovery were then used in the analyses.
Fusional Vergence at NearPositive and Negative fusional veregence at
near were measured using a hand-held Risley prism in free space. With the patient seated and wearing their refractive correction, he/she was instructed to view the same accommodative target that was used in the NPC (i.e. a single 20/30 letter) displayed on a near card and held before the eyes at a distance of 40 cm. The patient was then instructed to inform the examiner when the print was seen to blur and/or become double as the examiner slowly introduced an increasing amount of base-out [BO] prism in front of either eye. When/if blur was reported, the amount of base-out prims was smoothly and continuously increased until the break-point (double) was reported (positive
fusional convergence-PFC). The patient was then instructed to report the recovery of single vision (fusion) as the prism direction was reversed, and the amount of prism was decreased by the examiner. A similar procedure was used with base-in (BI) prisms to determine negative fusional vergence (NFV) at near.
Near Point of Fixation Disparity (NPFD)The NPFD test and its target have been
originally developed and tested by the first author of this study (Lederer) . When administering the NPFD, the target represents a fixation disparity cross [Figure 1] that is mounted on a hard board with a silvered background. The circle that surrounds the E represents part of the fusion lock. The central E target is equivalent to a 20/100 sized reduced Snellen letter, which subtends the eye at 25’ of arc. The circle surround is equivalent to a 20/200 sized reduced Snellen letter, which subtends the eye at 50’ of arc. The E and circle are solid and are seen by both eyes. The circle’s spherical shape steers attention toward its perceptual center, which supports the judgment involved in aligning the arrows. The NPFD Card was placed on the moveable rod of the Bernell Accommodation Rule while the subject wore polaroid vectograph glasses as a way to dichoptically view nonius lines (right eye seeing top the line, left eye seeing the bottom line) while both eyes fused the central E target and circle surround. The center of the forehead at the level of the brow was used as the zero measure point from which the NPFD was taken. With the end of the ruler placed against the forehead, the target was moved slowly toward the subject at approximately one to two centimeters per second until the subject reported that the vertical noinus lines began to move out of alignment, at which point the distance from the zero measure point was read off the ruler. The ability to observe offset is very sensitive especially if a patient (even a young pediatric patient) is instructed to report when the arrows “begin sliding”. The presence of an unresolved fixation slip, without diplopia,
Figure 1: Near Point of Fixation Disparity (NPFD) test (reproduced with permission from Vision Assessment Corporation).
52Vision Development & Rehabilitation Volume 1, Issue 1 • April 2015
represents the associated phoria for that specific distance. Disparity break and recovery findings were recorded as the break/recovery of the NPFD. While viewing the target the patient was asked to maintain the fusion lock clear and as the target is moved from a far point distance (often started outside 50”) toward the patient they were to indicate when a fixation disparity slip developed and could not be resolved in the time it took to ask “Is it still sliding?”. Other diagnostic questions commonly used during the administration of the NPFD include: “Is it shifting?”; “Is it still off or did it line up again?”; “Is it blurring?”; “Is either of the arrows fading out?” Once there is a better understanding of test parameters that are to be attended to, it then becomes easier to just integrate these questions into: “Is it breaking up?”; “Did it come back together or is it still breaking up?” The term “breaking up” represents a disruption to binocular vision that is reflected as a fixation disparity, or a blurring of the letter “E” fusion lock or suppression.
The target was then moved back to the distance until the nonius lines appeared to be both aligned and clear. While the NPC evaluates the distance at which double vision is seen as fusion breaks and when single vision is seen as fusion recovers, the NPFD evaluates when the two eyes, prior to separating, begin to “argue” and misalign due to the increased vergence and accommodative demand and then become re-aligned as the vergence and accommodative demand is gradually reduced and the binocular argument is resolved. Although both of the measures involve a significant degree of proximal, accommodative and fusional vergence responses, the NPFD yields a more sensitive perceptual indication of the breakdown of one or more of these mechanisms.
Associated Vergence Associated vergence was measured with the
fixation disparity target as used for NPFD (Figure 1) and rotary Risley prism. This testing can be done in free space or in the phoropter. In the
present study all testing was done is free space. The patient was instructed to maintain clarity of the central fusion lock “E” during testing and to indicate when an unresolved fixation disparity became apparent as the convergence (BO) or divergence (BI) prism demand was gradually increased at a rate of approximately 1 second/ 5pd. During this testing the patient was asked “are they still straight and clear?” This question was meant to aid arousal and visual discrimination. The prism demand was increased until the patient reported that the arrows were “sliding.” They were then immediately asked “are they STILL sliding?” The time necessary for recovery is the time it took to ask this question. When the patient indicated that the arrows were still offset, the prism demand was rapidly increased another 5pd and then gradually decreased until the patient recovered both alignment and clarity. This information provided measures of associated BO and BI vergence break and recovery recorded in prism diopters.
Statistical AnalysesTo determine the best cutoff values for
break and recovery points on the NPFD test as well as the BO break point for the associated convergence measure we first calculated 25th, 50th, and 75th percentiles for each measure and then used each of the percentile scores to discriminate between patients with symptoms of CI and asymptomatic control patients using a series of Receiver Operating Characteristic (ROC) Curves. ROC curves are graphs of sensitivity of a particular measure to CI symptoms plotted against the false positive rate of CI diagnosis (1 – specificity). Specificity refers to the measure’s ability to identify patients, who do not have a target characteristic (i.e. CI symptoms). The ability of two or more variables to diagnose an outcome can be compared using ROC curves and their associated areas under the curve (AUROCs) that the ROC tests also provide. The ideal test would have an AUROC of 1, whereas a random guess would have an AUROC of 0.5. According to Hoshmer and Lemeshow’s
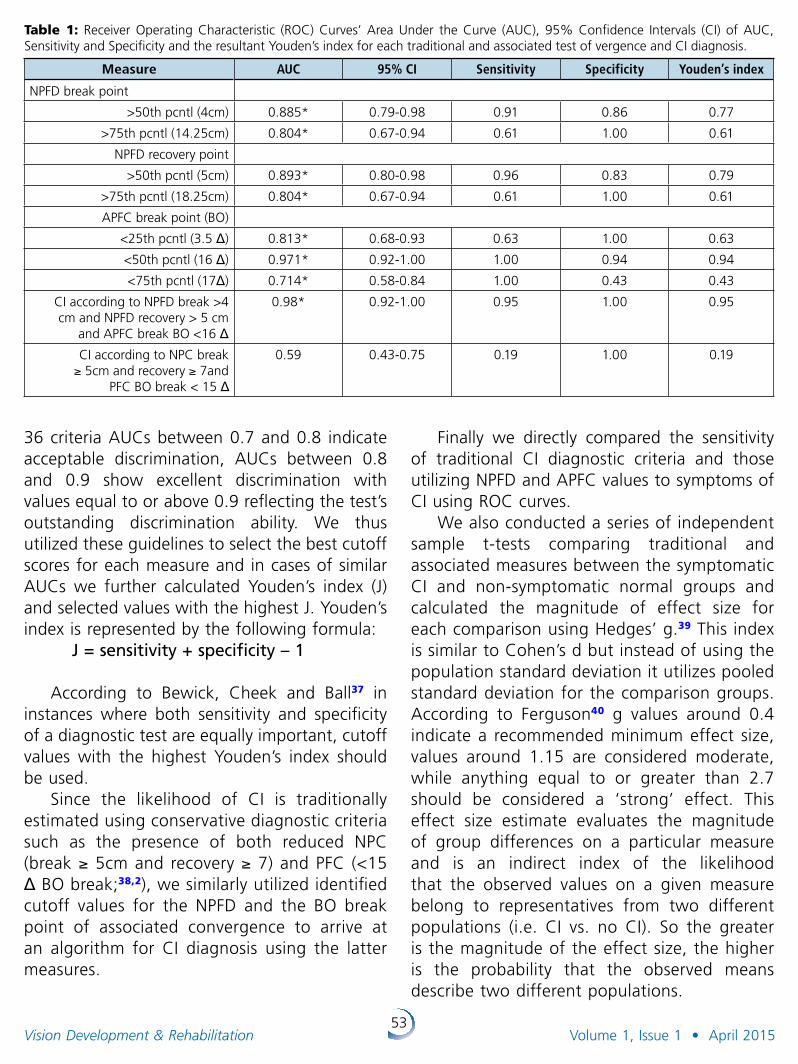
53Vision Development & Rehabilitation Volume 1, Issue 1 • April 2015
36 criteria AUCs between 0.7 and 0.8 indicate acceptable discrimination, AUCs between 0.8 and 0.9 show excellent discrimination with values equal to or above 0.9 reflecting the test’s outstanding discrimination ability. We thus utilized these guidelines to select the best cutoff scores for each measure and in cases of similar AUCs we further calculated Youden’s index (J) and selected values with the highest J. Youden’s index is represented by the following formula:
J = sensitivity + specificity – 1
According to Bewick, Cheek and Ball37 in instances where both sensitivity and specificity of a diagnostic test are equally important, cutoff values with the highest Youden’s index should be used.
Since the likelihood of CI is traditionally estimated using conservative diagnostic criteria such as the presence of both reduced NPC (break ≥ 5cm and recovery ≥ 7) and PFC (<15 Δ BO break;38,2), we similarly utilized identified cutoff values for the NPFD and the BO break point of associated convergence to arrive at an algorithm for CI diagnosis using the latter measures.
Finally we directly compared the sensitivity of traditional CI diagnostic criteria and those utilizing NPFD and APFC values to symptoms of CI using ROC curves.
We also conducted a series of independent sample t-tests comparing traditional and associated measures between the symptomatic CI and non-symptomatic normal groups and calculated the magnitude of effect size for each comparison using Hedges’ g.39 This index is similar to Cohen’s d but instead of using the population standard deviation it utilizes pooled standard deviation for the comparison groups. According to Ferguson40 g values around 0.4 indicate a recommended minimum effect size, values around 1.15 are considered moderate, while anything equal to or greater than 2.7 should be considered a ‘strong’ effect. This effect size estimate evaluates the magnitude of group differences on a particular measure and is an indirect index of the likelihood that the observed values on a given measure belong to representatives from two different populations (i.e. CI vs. no CI). So the greater is the magnitude of the effect size, the higher is the probability that the observed means describe two different populations.
Table 1: Receiver Operating Characteristic (ROC) Curves’ Area Under the Curve (AUC), 95% Confidence Intervals (CI) of AUC, Sensitivity and Specificity and the resultant Youden’s index for each traditional and associated test of vergence and CI diagnosis.
Measure AUC 95% CI Sensitivity Specificity Youden’s index
NPFD break point
>50th pcntl (4cm) 0.885* 0.79-0.98 0.91 0.86 0.77
>75th pcntl (14.25cm) 0.804* 0.67-0.94 0.61 1.00 0.61
NPFD recovery point
>50th pcntl (5cm) 0.893* 0.80-0.98 0.96 0.83 0.79
>75th pcntl (18.25cm) 0.804* 0.67-0.94 0.61 1.00 0.61
APFC break point (BO)
<25th pcntl (3.5 Δ) 0.813* 0.68-0.93 0.63 1.00 0.63
<50th pcntl (16 Δ) 0.971* 0.92-1.00 1.00 0.94 0.94
<75th pcntl (17Δ) 0.714* 0.58-0.84 1.00 0.43 0.43
CI according to NPFD break >4 cm and NPFD recovery > 5 cm
and APFC break BO <16 Δ
0.98* 0.92-1.00 0.95 1.00 0.95
CI according to NPC break ≥ 5cm and recovery ≥ 7and
PFC BO break < 15 Δ
0.59 0.43-0.75 0.19 1.00 0.19
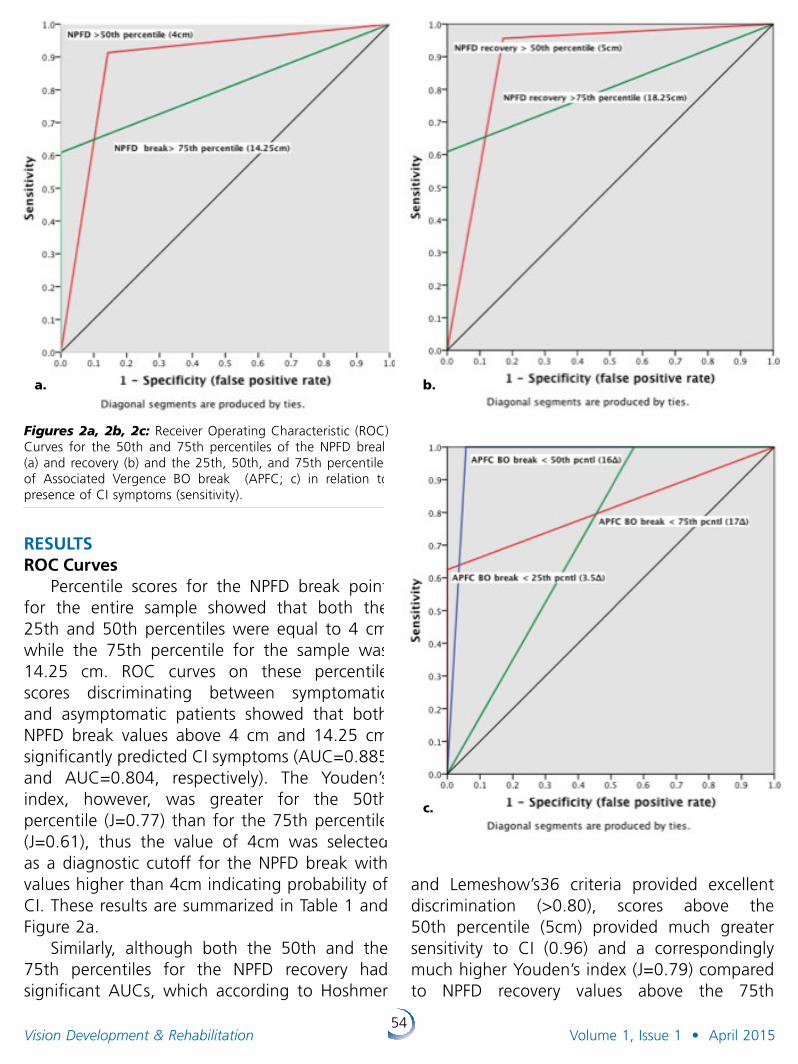
54Vision Development & Rehabilitation Volume 1, Issue 1 • April 2015
RESULTSROC Curves
Percentile scores for the NPFD break point for the entire sample showed that both the 25th and 50th percentiles were equal to 4 cm while the 75th percentile for the sample was 14.25 cm. ROC curves on these percentile scores discriminating between symptomatic and asymptomatic patients showed that both NPFD break values above 4 cm and 14.25 cm significantly predicted CI symptoms (AUC=0.885 and AUC=0.804, respectively). The Youden’s index, however, was greater for the 50th percentile (J=0.77) than for the 75th percentile (J=0.61), thus the value of 4cm was selected as a diagnostic cutoff for the NPFD break with values higher than 4cm indicating probability of CI. These results are summarized in Table 1 and Figure 2a.
Similarly, although both the 50th and the 75th percentiles for the NPFD recovery had significant AUCs, which according to Hoshmer
and Lemeshow’s36 criteria provided excellent discrimination (>0.80), scores above the 50th percentile (5cm) provided much greater sensitivity to CI (0.96) and a correspondingly much higher Youden’s index (J=0.79) compared to NPFD recovery values above the 75th
Figures 2a, 2b, 2c: Receiver Operating Characteristic (ROC) Curves for the 50th and 75th percentiles of the NPFD break (a) and recovery (b) and the 25th, 50th, and 75th percentiles of Associated Vergence BO break (APFC; c) in relation to presence of CI symptoms (sensitivity).
a. b.
c.
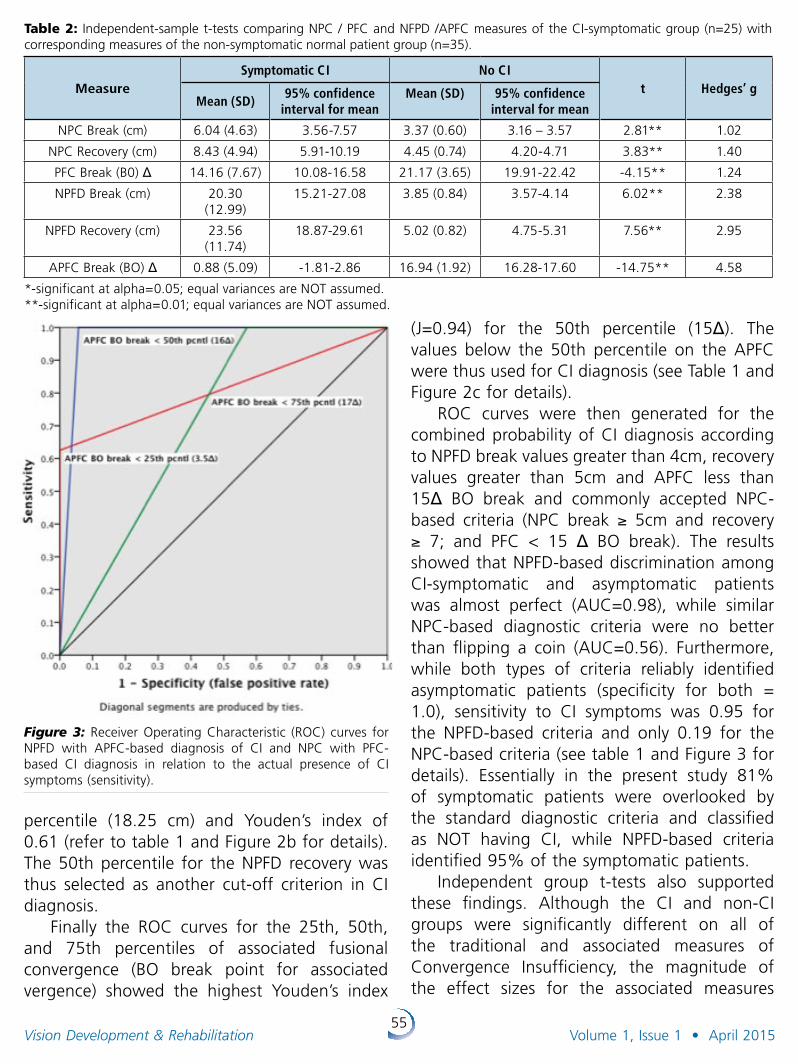
55Vision Development & Rehabilitation Volume 1, Issue 1 • April 2015
percentile (18.25 cm) and Youden’s index of 0.61 (refer to table 1 and Figure 2b for details). The 50th percentile for the NPFD recovery was thus selected as another cut-off criterion in CI diagnosis.
Finally the ROC curves for the 25th, 50th, and 75th percentiles of associated fusional convergence (BO break point for associated vergence) showed the highest Youden’s index
(J=0.94) for the 50th percentile (15Δ). The values below the 50th percentile on the APFC were thus used for CI diagnosis (see Table 1 and Figure 2c for details).
ROC curves were then generated for the combined probability of CI diagnosis according to NPFD break values greater than 4cm, recovery values greater than 5cm and APFC less than 15Δ BO break and commonly accepted NPC-based criteria (NPC break ≥ 5cm and recovery ≥ 7; and PFC < 15 Δ BO break). The results showed that NPFD-based discrimination among CI-symptomatic and asymptomatic patients was almost perfect (AUC=0.98), while similar NPC-based diagnostic criteria were no better than flipping a coin (AUC=0.56). Furthermore, while both types of criteria reliably identified asymptomatic patients (specificity for both = 1.0), sensitivity to CI symptoms was 0.95 for the NPFD-based criteria and only 0.19 for the NPC-based criteria (see table 1 and Figure 3 for details). Essentially in the present study 81% of symptomatic patients were overlooked by the standard diagnostic criteria and classified as NOT having CI, while NPFD-based criteria identified 95% of the symptomatic patients.
Independent group t-tests also supported these findings. Although the CI and non-CI groups were significantly different on all of the traditional and associated measures of Convergence Insufficiency, the magnitude of the effect sizes for the associated measures
Table 2: Independent-sample t-tests comparing NPC / PFC and NFPD /APFC measures of the CI-symptomatic group (n=25) with corresponding measures of the non-symptomatic normal patient group (n=35).
MeasureSymptomatic CI No CI
t Hedges’ gMean (SD)
95% confidence interval for mean
Mean (SD) 95% confidence interval for mean
NPC Break (cm) 6.04 (4.63) 3.56-7.57 3.37 (0.60) 3.16 – 3.57 2.81** 1.02
NPC Recovery (cm) 8.43 (4.94) 5.91-10.19 4.45 (0.74) 4.20-4.71 3.83** 1.40
PFC Break (B0) Δ 14.16 (7.67) 10.08-16.58 21.17 (3.65) 19.91-22.42 -4.15** 1.24
NPFD Break (cm) 20.30 (12.99)
15.21-27.08 3.85 (0.84) 3.57-4.14 6.02** 2.38
NPFD Recovery (cm) 23.56 (11.74)
18.87-29.61 5.02 (0.82) 4.75-5.31 7.56** 2.95
APFC Break (BO) Δ 0.88 (5.09) -1.81-2.86 16.94 (1.92) 16.28-17.60 -14.75** 4.58
*-significant at alpha=0.05; equal variances are NOT assumed.**-significant at alpha=0.01; equal variances are NOT assumed.
Figure 3: Receiver Operating Characteristic (ROC) curves for NPFD with APFC-based diagnosis of CI and NPC with PFC-based CI diagnosis in relation to the actual presence of CI symptoms (sensitivity).
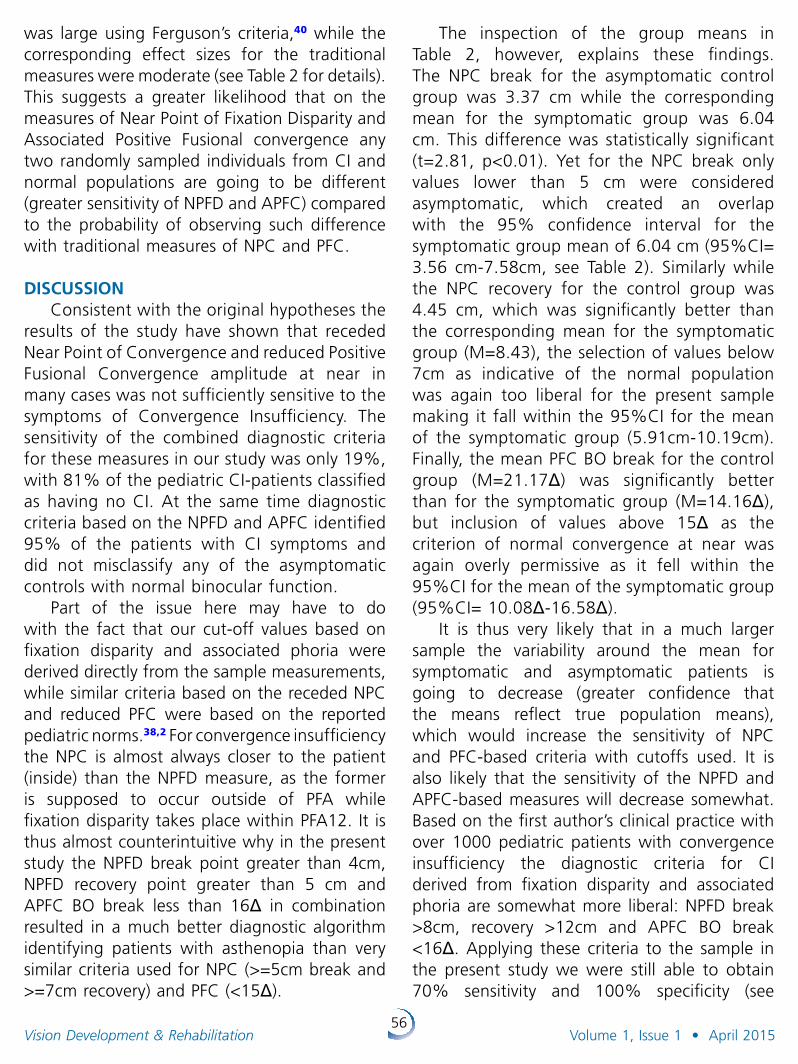
56Vision Development & Rehabilitation Volume 1, Issue 1 • April 2015
was large using Ferguson’s criteria,40 while the corresponding effect sizes for the traditional measures were moderate (see Table 2 for details). This suggests a greater likelihood that on the measures of Near Point of Fixation Disparity and Associated Positive Fusional convergence any two randomly sampled individuals from CI and normal populations are going to be different (greater sensitivity of NPFD and APFC) compared to the probability of observing such difference with traditional measures of NPC and PFC.
DISCUSSION
Consistent with the original hypotheses the results of the study have shown that receded Near Point of Convergence and reduced Positive Fusional Convergence amplitude at near in many cases was not sufficiently sensitive to the symptoms of Convergence Insufficiency. The sensitivity of the combined diagnostic criteria for these measures in our study was only 19%, with 81% of the pediatric CI-patients classified as having no CI. At the same time diagnostic criteria based on the NPFD and APFC identified 95% of the patients with CI symptoms and did not misclassify any of the asymptomatic controls with normal binocular function.
Part of the issue here may have to do with the fact that our cut-off values based on fixation disparity and associated phoria were derived directly from the sample measurements, while similar criteria based on the receded NPC and reduced PFC were based on the reported pediatric norms.38,2 For convergence insufficiency the NPC is almost always closer to the patient (inside) than the NPFD measure, as the former is supposed to occur outside of PFA while fixation disparity takes place within PFA12. It is thus almost counterintuitive why in the present study the NPFD break point greater than 4cm, NPFD recovery point greater than 5 cm and APFC BO break less than 16Δ in combination resulted in a much better diagnostic algorithm identifying patients with asthenopia than very similar criteria used for NPC (>=5cm break and >=7cm recovery) and PFC (<15Δ).
The inspection of the group means in Table 2, however, explains these findings. The NPC break for the asymptomatic control group was 3.37 cm while the corresponding mean for the symptomatic group was 6.04 cm. This difference was statistically significant (t=2.81, p<0.01). Yet for the NPC break only values lower than 5 cm were considered asymptomatic, which created an overlap with the 95% confidence interval for the symptomatic group mean of 6.04 cm (95%CI= 3.56 cm-7.58cm, see Table 2). Similarly while the NPC recovery for the control group was 4.45 cm, which was significantly better than the corresponding mean for the symptomatic group (M=8.43), the selection of values below 7cm as indicative of the normal population was again too liberal for the present sample making it fall within the 95%CI for the mean of the symptomatic group (5.91cm-10.19cm). Finally, the mean PFC BO break for the control group (M=21.17Δ) was significantly better than for the symptomatic group (M=14.16Δ), but inclusion of values above 15Δ as the criterion of normal convergence at near was again overly permissive as it fell within the 95%CI for the mean of the symptomatic group (95%CI= 10.08Δ-16.58Δ).
It is thus very likely that in a much larger sample the variability around the mean for symptomatic and asymptomatic patients is going to decrease (greater confidence that the means reflect true population means), which would increase the sensitivity of NPC and PFC-based criteria with cutoffs used. It is also likely that the sensitivity of the NPFD and APFC-based measures will decrease somewhat. Based on the first author’s clinical practice with over 1000 pediatric patients with convergence insufficiency the diagnostic criteria for CI derived from fixation disparity and associated phoria are somewhat more liberal: NPFD break >8cm, recovery >12cm and APFC BO break <16Δ. Applying these criteria to the sample in the present study we were still able to obtain 70% sensitivity and 100% specificity (see
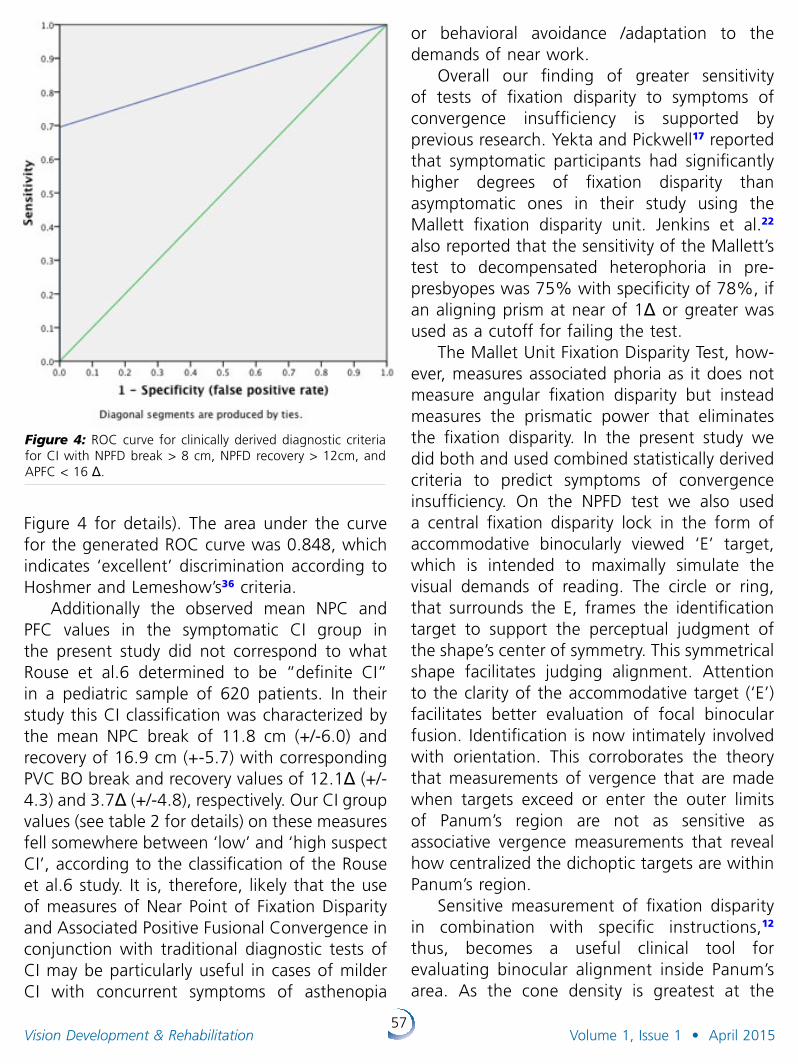
57Vision Development & Rehabilitation Volume 1, Issue 1 • April 2015
Figure 4 for details). The area under the curve for the generated ROC curve was 0.848, which indicates ‘excellent’ discrimination according to Hoshmer and Lemeshow’s36 criteria.
Additionally the observed mean NPC and PFC values in the symptomatic CI group in the present study did not correspond to what Rouse et al.6 determined to be “definite CI” in a pediatric sample of 620 patients. In their study this CI classification was characterized by the mean NPC break of 11.8 cm (+/-6.0) and recovery of 16.9 cm (+-5.7) with corresponding PVC BO break and recovery values of 12.1Δ (+/- 4.3) and 3.7Δ (+/-4.8), respectively. Our CI group values (see table 2 for details) on these measures fell somewhere between ‘low’ and ‘high suspect CI’, according to the classification of the Rouse et al.6 study. It is, therefore, likely that the use of measures of Near Point of Fixation Disparity and Associated Positive Fusional Convergence in conjunction with traditional diagnostic tests of CI may be particularly useful in cases of milder CI with concurrent symptoms of asthenopia
or behavioral avoidance /adaptation to the demands of near work.
Overall our finding of greater sensitivity of tests of fixation disparity to symptoms of convergence insufficiency is supported by previous research. Yekta and Pickwell17 reported that symptomatic participants had significantly higher degrees of fixation disparity than asymptomatic ones in their study using the Mallett fixation disparity unit. Jenkins et al.22 also reported that the sensitivity of the Mallett’s test to decompensated heterophoria in pre-presbyopes was 75% with specificity of 78%, if an aligning prism at near of 1Δ or greater was used as a cutoff for failing the test.
The Mallet Unit Fixation Disparity Test, how-ever, measures associated phoria as it does not measure angular fixation disparity but instead measures the prismatic power that eliminates the fixation disparity. In the present study we did both and used combined statistically derived criteria to predict symptoms of convergence insufficiency. On the NPFD test we also used a central fixation disparity lock in the form of accommodative binocularly viewed ‘E’ target, which is intended to maximally simulate the visual demands of reading. The circle or ring, that surrounds the E, frames the identification target to support the perceptual judgment of the shape’s center of symmetry. This symmetrical shape facilitates judging alignment. Attention to the clarity of the accommodative target (‘E’) facilitates better evaluation of focal binocular fusion. Identification is now intimately involved with orientation. This corroborates the theory that measurements of vergence that are made when targets exceed or enter the outer limits of Panum’s region are not as sensitive as associative vergence measurements that reveal how centralized the dichoptic targets are within Panum’s region.
Sensitive measurement of fixation disparity in combination with specific instructions,12 thus, becomes a useful clinical tool for evaluating binocular alignment inside Panum’s area. As the cone density is greatest at the
Figure 4: ROC curve for clinically derived diagnostic criteria for CI with NPFD break > 8 cm, NPFD recovery > 12cm, and APFC < 16 Δ.
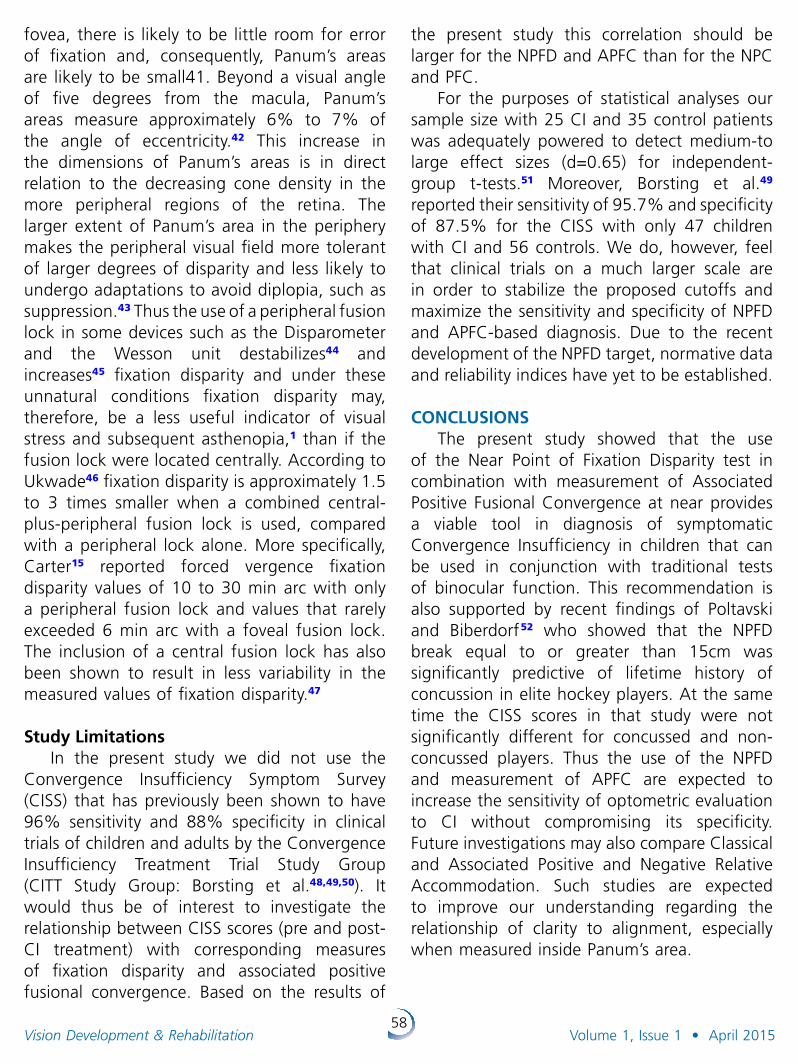
58Vision Development & Rehabilitation Volume 1, Issue 1 • April 2015
fovea, there is likely to be little room for error of fixation and, consequently, Panum’s areas are likely to be small41. Beyond a visual angle of five degrees from the macula, Panum’s areas measure approximately 6% to 7% of the angle of eccentricity.42 This increase in the dimensions of Panum’s areas is in direct relation to the decreasing cone density in the more peripheral regions of the retina. The larger extent of Panum’s area in the periphery makes the peripheral visual field more tolerant of larger degrees of disparity and less likely to undergo adaptations to avoid diplopia, such as suppression.43 Thus the use of a peripheral fusion lock in some devices such as the Disparometer and the Wesson unit destabilizes44 and increases45 fixation disparity and under these unnatural conditions fixation disparity may, therefore, be a less useful indicator of visual stress and subsequent asthenopia,1 than if the fusion lock were located centrally. According to Ukwade46 fixation disparity is approximately 1.5 to 3 times smaller when a combined central-plus-peripheral fusion lock is used, compared with a peripheral lock alone. More specifically, Carter15 reported forced vergence fixation disparity values of 10 to 30 min arc with only a peripheral fusion lock and values that rarely exceeded 6 min arc with a foveal fusion lock. The inclusion of a central fusion lock has also been shown to result in less variability in the measured values of fixation disparity.47
Study Limitations
In the present study we did not use the Convergence Insufficiency Symptom Survey (CISS) that has previously been shown to have 96% sensitivity and 88% specificity in clinical trials of children and adults by the Convergence Insufficiency Treatment Trial Study Group (CITT Study Group: Borsting et al.48,49,50). It would thus be of interest to investigate the relationship between CISS scores (pre and post-CI treatment) with corresponding measures of fixation disparity and associated positive fusional convergence. Based on the results of
the present study this correlation should be larger for the NPFD and APFC than for the NPC and PFC.
For the purposes of statistical analyses our sample size with 25 CI and 35 control patients was adequately powered to detect medium-to large effect sizes (d=0.65) for independent-group t-tests.51 Moreover, Borsting et al.49 reported their sensitivity of 95.7% and specificity of 87.5% for the CISS with only 47 children with CI and 56 controls. We do, however, feel that clinical trials on a much larger scale are in order to stabilize the proposed cutoffs and maximize the sensitivity and specificity of NPFD and APFC-based diagnosis. Due to the recent development of the NPFD target, normative data and reliability indices have yet to be established.
CONCLUSIONS
The present study showed that the use of the Near Point of Fixation Disparity test in combination with measurement of Associated Positive Fusional Convergence at near provides a viable tool in diagnosis of symptomatic Convergence Insufficiency in children that can be used in conjunction with traditional tests of binocular function. This recommendation is also supported by recent findings of Poltavski and Biberdorf52 who showed that the NPFD break equal to or greater than 15cm was significantly predictive of lifetime history of concussion in elite hockey players. At the same time the CISS scores in that study were not significantly different for concussed and non-concussed players. Thus the use of the NPFD and measurement of APFC are expected to increase the sensitivity of optometric evaluation to CI without compromising its specificity. Future investigations may also compare Classical and Associated Positive and Negative Relative Accommodation. Such studies are expected to improve our understanding regarding the relationship of clarity to alignment, especially when measured inside Panum’s area.
59Vision Development & Rehabilitation Volume 1, Issue 1 • April 2015
REFERENCES1. Evans BJW. Pickwell’s Binocular Vision Anomalies.
Investigation and Treatment, 4th edn. Butterworth-Heinemann: Oxford; 2002.
2. Cooper J, Jamal N. Convergence insufficiency – a major review. Optometry 2012; 83(4):137-58.
3. Rouse M, Borsting E, Mitchell GL, Kulp MT, Scheiman M et al. Academic behaviors in children with convergence insufficiency with and without parent-reported ADHD. Optom Vis Sci 2009; 86(10):1169-77.
4. Borsting E, Mitchell GL, Kulp MT, Scheiman M, Amster DM et al. Improvement in academic behaviors after successful treatment of convergence insufficiency. Optom Vis Sci 2012; 89(1):12-8.
5. Rouse M, Hyman L, Hussein M. How do you male the diagnosis of Convergence Insufficiency? Survey Results. JOVD 1997; 28: Volume 28: 91-97
6. Rouse MW, Hyman L, Hussein M, et al. Frequency of convergence insufficiency in optometry clinic settings. Convergence Insufficiency and Reading Study (CIRS) Group. Optom Vis Sci 1998; 75(2):88-96.
7. Cooper J, Duckman R. Convergence insufficiency: incidence, diagnosis, and treatment. J Am Optom Assoc 1978; 49(6):673-80.
8. Shippman S, Infantino J, Cimbol D, et al. Convergence insufficiency with normal parameters. J Pediatr Ophthalmol Strabismus 1983; 20(4): 158-61.
9. Schor CM and Ciuffreda KJ. Vergence Eye Movements: Basic and Clinical Aspects. Boston: Butterworths; 1983
10. Panum P. Physiologische Untersuchungen uber das Sehen mil zwei Augen. Schwerssche Buchhandlung: Kiel; 1858.
11. Mitchell D. E. (1966). A review of the concept of “Panum’s fusional areas”. Am J Optom 1966; 43: 387-401.
12. Karania R, Evans BJW. The Mallett Fixation Disparity Test: influence of test instructions and relationship with symptoms. Ophthal Physiol Opt 2006; 26: 507-522.
13. Lambooij M, Ijsselsteijn W. Visual discomfort and visual fatigue of stereoscopic displays: A review. J Imaging Sci Technology 2009; 53(3): 030201-14.
14. Cline, D., Hofsteller, H. W. and Griffin, J. R. (1989) Dictionary Of Visual Science, 4th edn. Radnor, PA Chilton, p. 205.
15. Carter DB. Fixation disparity with and without foveal fusion contours. Am J Optom Arch Am Acad Optom 1964; 41:729–36.
16. Sheedy JE (1980) Actual measurements of fixation disparity and its use in diagnosis and treatment. J Am Optom Assoc 1980; 51:1079–1084.
17. Yekta AA and Pickwell LD. The relationship between heterophoria and fixation disparity. Clin Exp Optom 1986; 69: 228–231.
18. Mallett RF. Fixation disparity-its genesis and relation to asthenopia. Ophthalmic Optician 1974; 30: 1159–1168.
19. Sheedy JE, Saladin JJ. Association of symptoms with measures of oculomotor deficiencies. Am J Optom Physiol Opt 1978;55:670–6.
20. Yekta AA, Pickwell LD, Jenkins TC. Binocular vision, age and symptoms. Ophthalmic Physiol Opt 1989;9:115–20.
21. Pickwell LD, Kaye NA, Jenkins TC. Distance and near readings of associated heterophoria taken on 500 patients. Ophthalmic Physiol Opt 1991;11:291–6
22. Jenkins TC, Pickwell LD, Yekta AA. Criteria for decompensation in binocular vision. Ophthalmic Physiol Opt 1989;9:121–5.
23. Ciuffreda KJ. Components of clinical near vergence testing. J Behav Optom 1992; 3:3-13.
24. Sheedy JE, Saladin JJ. Phoria, vergence, and fixation disparity in oculomotor problems. Am J Optom Physiol Opt 1977;54:474–8.
25. Sheedy JE, Saladin JJ. Validity of diagnostic criteria and case analysis in binocular vision disorders. In Schor CM, Ciuffreda KJ, eds. Vergence Eye Movements: Basic and Clinical Aspects. Boston: Butterworth; 1983:517–40.
26. Pickwell LD, Yekta AA, Jenkins TC. Effect of reading in low illumination on fixation disparity. Am J Optom Physiol Opt 1987;64: 513–8.
27. Jaschinski W. The Proximity-Fixation-Disparity curve and the preferred viewing distance at a visual display as an indicator of near vision fatigue. Optom Vis Sci 2002; 79(3): 158-169.
28. Maples WC, Hoenes R. Near point of convergence norms measured in elementary school children. Optom Vis Sci 2007;84(3):224-8.
29. Scheiman, Mitchell, et al. “A randomized clinical trial of treatments for convergence insufficiency in children.” Archives of ophthalmology 123.1 (2005): 14-24.
30. Cushman N, Burri C. Convergence insufficiency. Am J Ophthalmol. 1941;24:1044-52.
31. Passmore JW, MacLean F. Convergence insufficiency and its managements: an evaluation of 100 patients receiving a course of orthoptics. Am J Ophthalmol 1957;43(3):448-56.
32. Scheiman M, Gallaway M, Frantz K et al. Nearpoint of convergence: test procedures, target and normative data. Optom Vis Sci 2003; 80(3):214-25.
33. Cuiffreda KJ. Near point of convergence as a function of target accommodative demand. Optical Journal and Review of Optometry 1974; 111(3).
34. Scheiman M, Wick B. Clinical Management of Binocular Vision: Heterophoric, Accommodative and Eye Movement Disorders. Philadelphia, Pa: LippincottWilliams & Wilkins; 2002.
35. Vision Assessment Corporation. www.visionassessment.com
36. Hosmer DW and Lemeshow S. Applied Logistic Regression. 2nd ed. John Wiley & Sons, Inc; 2000.
37. Bewick V, Cheek L, Ball J. Statistics review 13: Receiver operating characteristic curves. Critical Care 2004; 8(6): 508-12.
38. Borsting E, Rouse MW, Deland PN, et al. Association of symptoms and convergence and accommodative insufficiency in school-age children. Optometry. 2003; 74:25-34.
39. Hedges L. Distributional theory for Glass’ estimator of effect size and related estimators. Journal of Educational Statistics 1981; 6: 107–128.
60Vision Development & Rehabilitation Volume 1, Issue 1 • April 2015
40. Ferguson CJ. An effect size primer: A guide for clinicians and researchers. Professional Psychology: Research and Practice 2009; 40(5): 532-538.
41. Carter, D. B. Studies of fixation disparity-historical review. Am J Optom Physiol Opt 1957; 34: 320–329.
42. Ogle KN. Researches in Binocular Vision. New York: Hafner; 1964.
43. Steinman SB, Steinman BA and Garzia RP. Foundations of Binocular Vision. A Clinical Perspective. McGraw Hill Companies, New York; 2000.
44. Wildsoet CF and Cameron KD. The effect of illumination and foveal fusion lock on clinical fixation disparity measurements with the Sheedy disparometer. Ophthalmic Physiol Opt 1985; 5: 171–178.
45. Brownlee GA and Goss DA. Comparisons of commercially available devices for the measurement of fixation disparity and associated phorias. J Am Optom Assoc 1988; 59: 451–460.
46. Ukwade MT. Effects of nonius line and fusion lock parameters on fixation disparity. Optom Vis Sci 2000; 77 (6): 309-320.
47. Debysingh SJ, Orzech PL, Sheedy JE. Effect of a central fusion stimulus on fixation disparity. Am J Optom Physiol Opt 1986; 63: 277–80.
48. Borsting E, Rouse MW, De Land PN. Prospective comparison of convergence insufficiency and normal binocular children on CIRS symptom surveys. Convergence Insufficiency and Reading Study (CIRS) group. Optom Vis Sci 1999;76(4):221-8.
49. Borsting EJ, Rouse MW, Mitchell GL, et al. Validity and reliability of the revised convergence insufficiency symptom survey in children aged 9 to 18 years. Optom Vis Sci 2003; 80(12):832-8.
50. Rouse MW, Borsting EJ, Mitchell GL, et al. Validity and reliability of the revised convergence insufficiency symptom survey in adults. Ophthalmic Physiol Opt 2004;24(5):384-90.
51. Faul F, Erdfelder E, Lang AG, Buchner A. G*Power 3: A flexible statistical power analysis program for the social, behavioral, and biomedical sciences. Behavior Research Methods 2007; 39: 175-191
52. Poltavski DV & Biberdorf D. Screening for lifetime concussion in athletes: Importance of oculomotor measures. Brain Inj 2014; 28(4) 475-485.
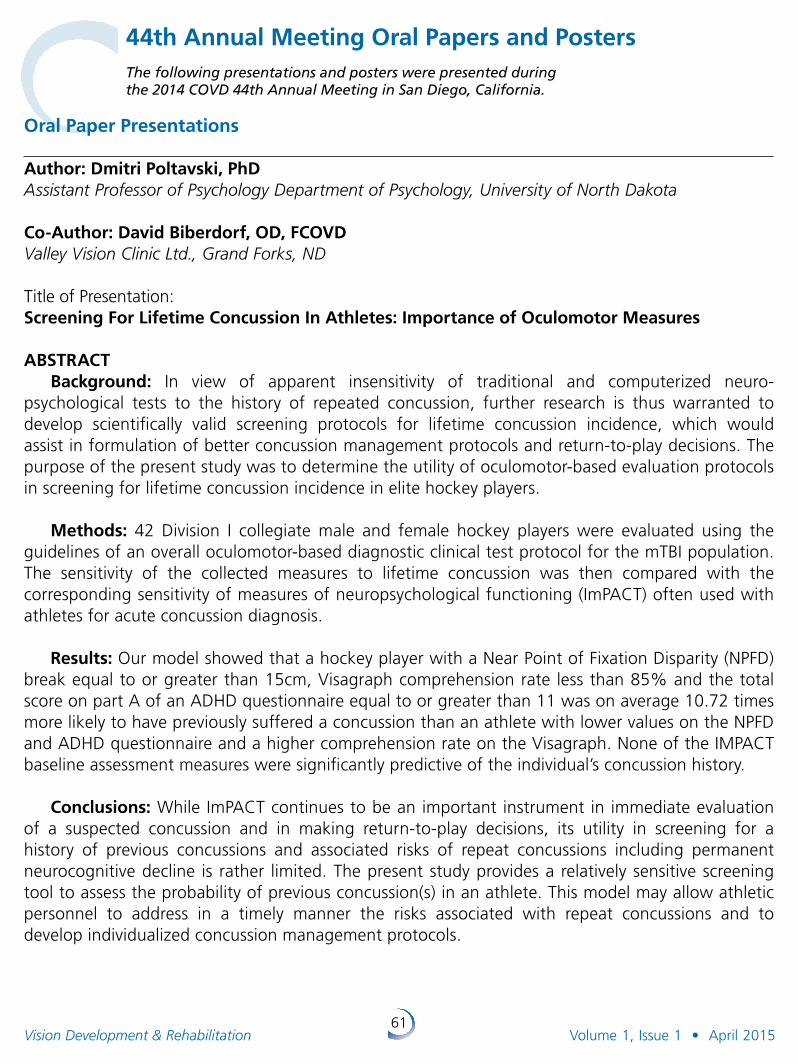
61Vision Development & Rehabilitation Volume 1, Issue 1 • April 2015
44th Annual Meeting Oral Papers and Posters
Oral Paper Presentations
Author: Dmitri Poltavski, PhDAssistant Professor of Psychology Department of Psychology, University of North Dakota
Co-Author: David Biberdorf, OD, FCOVDValley Vision Clinic Ltd ., Grand Forks, ND
Title of Presentation: Screening For Lifetime Concussion In Athletes: Importance of Oculomotor Measures
ABSTRACTBackground: In view of apparent insensi tivity of traditional and computerized neuro-
psychological tests to the history of repeated concussion, further research is thus warranted to develop scientifically valid screening protocols for lifetime concussion incidence, which would assist in formulation of better concussion management protocols and return-to-play decisions. The purpose of the present study was to determine the utility of oculomotor-based evaluation protocols in screening for lifetime concussion incidence in elite hockey players.
Methods: 42 Division I collegiate male and female hockey players were evaluated using the guidelines of an overall oculomotor-based diagnostic clinical test protocol for the mTBI population. The sensitivity of the collected measures to lifetime concussion was then compared with the corresponding sensitivity of measures of neuropsychological functioning (ImPACT) often used with athletes for acute concussion diagnosis.
Results: Our model showed that a hockey player with a Near Point of Fixation Disparity (NPFD) break equal to or greater than 15cm, Visagraph comprehension rate less than 85% and the total score on part A of an ADHD questionnaire equal to or greater than 11 was on average 10.72 times more likely to have previously suffered a concussion than an athlete with lower values on the NPFD and ADHD questionnaire and a higher comprehension rate on the Visagraph. None of the IMPACT baseline assessment measures were significantly predictive of the individual’s concussion history.
Conclusions: While ImPACT continues to be an important instrument in immediate evaluation of a suspected concussion and in making return-to-play decisions, its utility in screening for a history of previous concussions and associated risks of repeat concussions including permanent neurocognitive decline is rather limited. The present study provides a relatively sensitive screening tool to assess the probability of previous concussion(s) in an athlete. This model may allow athletic personnel to address in a timely manner the risks associated with repeat concussions and to develop individualized concussion management protocols.
The following presentations and posters were presented during the 2014 COVD 44th Annual Meeting in San Diego, California.
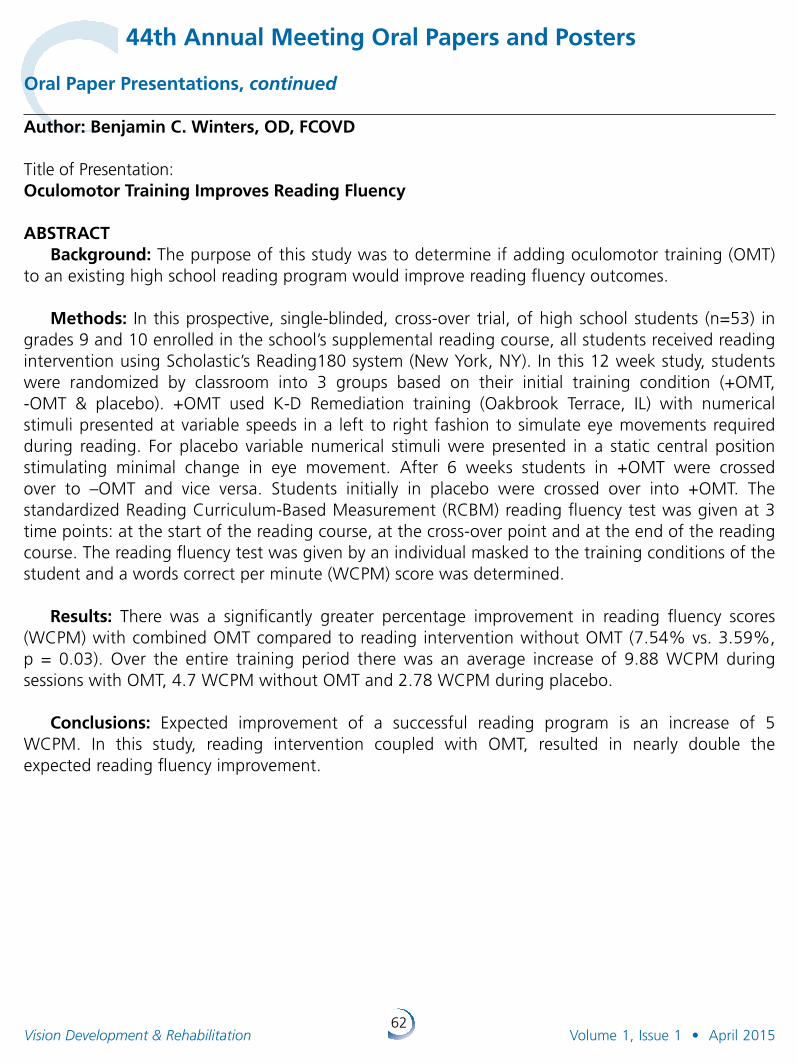
62Vision Development & Rehabilitation Volume 1, Issue 1 • April 2015
44th Annual Meeting Oral Papers and Posters
Author: Benjamin C. Winters, OD, FCOVD
Title of Presentation: Oculomotor Training Improves Reading Fluency
ABSTRACTBackground: The purpose of this study was to determine if adding oculomotor training (OMT)
to an existing high school reading program would improve reading fluency outcomes.
Methods: In this prospective, single-blinded, cross-over trial, of high school students (n=53) in grades 9 and 10 enrolled in the school’s supplemental reading course, all students received reading intervention using Scholastic’s Reading180 system (New York, NY). In this 12 week study, students were randomized by classroom into 3 groups based on their initial training condition (+OMT, -OMT & placebo). +OMT used K-D Remediation training (Oakbrook Terrace, IL) with numerical stimuli presented at variable speeds in a left to right fashion to simulate eye movements required during reading. For placebo variable numerical stimuli were presented in a static central position stimulating minimal change in eye movement. After 6 weeks students in +OMT were crossed over to –OMT and vice versa. Students initially in placebo were crossed over into +OMT. The standardized Reading Curriculum-Based Measurement (RCBM) reading fluency test was given at 3 time points: at the start of the reading course, at the cross-over point and at the end of the reading course. The reading fluency test was given by an individual masked to the training conditions of the student and a words correct per minute (WCPM) score was determined.
Results: There was a significantly greater percentage improvement in reading fluency scores (WCPM) with combined OMT compared to reading intervention without OMT (7.54% vs. 3.59%, p = 0.03). Over the entire training period there was an average increase of 9.88 WCPM during sessions with OMT, 4.7 WCPM without OMT and 2.78 WCPM during placebo.
Conclusions: Expected improvement of a successful reading program is an increase of 5 WCPM. In this study, reading intervention coupled with OMT, resulted in nearly double the expected reading fluency improvement.
Oral Paper Presentations, continued
63Vision Development & Rehabilitation Volume 1, Issue 1 • April 2015
44th Annual Meeting Oral Papers and Posters
Author: Eric S. Hussey, OD, FCOVDPrivate Practice
Co-Authors: Bruce Moore, ODNew England College of Optometry
David Spivey, ODPrivate Practice
Fuensanta A. Vera-Diaz, OD, PhDNew England College of Optometry
William GleasonForesight Regulatory Strategies
Title of Presentation: The Eyetronix Flicker Glass Amblyopia Treatment Study: Acuity, Binocularity, Compliance and Satisfaction
ABSTRACTPurpose: Conventional amblyopia treatment includes refractive correction and penalization by
patching or drops, which challenge binocu larity and compliance. Current research and emerging clinical treatment of amblyopia are moving beyond simple penalization towards concurrent promotion of both improved binocularity and acuity. However, treatment still requires repetitive tasks and a high level of compliance. This Eyetronix Flicker Glass (EFG) clinical trial evaluates a novel amblyopia therapy that is more adaptable to daily activities, promotes binocularity, improves compliance, and maintains quality of life.
Methods: 24 subjects, ages 6-17 (mean 11±4 years), with mild to moderate aniso metropic amblyopia (most having been previously and unsuccessfully patched), across 3 clinical sites wore the Eyetronix Flicker Glass (EFG) for near tasks of their choice, e.g., homework, video games, coloring. Eyetronix Flicker Glass (EFG) are glasses with liquid crystal lenses that rapidly alternate occlusion between the two eyes at a prescribed “flicker” frequency. For this study, subjects wore the EFG for 1-2 hours daily over their optical correction. Subjects were asked to wear EFG daily for 1-2 hours daily for a 12-week treatment period. Outcome measures were 1) change in logMAR acuity, 2) change in stereopsis, 3) compliance trackers, and 4) quality of life surveys.
Results: Visual acuity improved -0.12±0.11 logMAR. 92% improved in global and/or local stereopsis. Compliance, ease of use, parent-child relationship, comfort and preference over conventional (often prior) therapies were hugely positive. No adverse events reported.
Conclusions: Binocularity and compliance appear to be significant drivers of successful amblyopia therapy. The integrated design and task-unrestrictive nature of Eyetronix Flicker Glass improved acuity, promoted binocularity and was accepted by children needing therapy, suggesting a promising new treatment that lets kids be kids.
Oral Paper Presentations, continued
64Vision Development & Rehabilitation Volume 1, Issue 1 • April 2015
44th Annual Meeting Oral Papers and Posters
Author: Michael Gallaway, ODAssociate Professor, Pennsylvania College of Optometry at Salus University
Co-Authors: Mitchell Scheiman, OD2, Christina L. Master, MD, CAQSM1, Arlene Goodman, MD, CAQSM1, Roni Robinson RN, MSN, CRNP1, Stephen R. Master, MD, PhD1, Matthew F. Grady, MD, CAQSM1, Lynn Mitchell, MS3
1Department of Pediatrics, The Children’s Hospital of Philadelphia, Philadelphia, PA;2Pennsylvania College of Optometry at Salus University, 3Ohio State University College of Optometry
Title of Presentation: The Impact of Concussion on the Visual System of Children 11 to 17 Years Old
ABSTRACTBackground: Although there are data describing the prevalence of concussion-related vision
disorders in adults, there are currently no data in childrenMethods: In a prospective study, a con secutive sample of children 11 to 17 years old with a
medical diagnosis of concussion were evaluated in a children’s hospital concussion program. Accommodative, vergence, and sac ca dic testing was performed. Diagnosis of concussion was based on history, physical examination and neurocognitive testing with the ImPACT Test. Vision diagnoses were based on predetermined diagnostic criteria. Symptoms were assessed using the Convergence Insufficiency Symptom Survey (CISS).
Results: One hundred patients were exam ined, with a mean age of 14.5, 58% were females and 65% had sports-related concussion. 29% were seen within a month of injury, 26% between 1 to 3 months, and 45% > 3 months. 69% had a diagnosis of one or more vision problems. The most common were accommodative disorders (51%), convergence insufficiency (49%), and saccadic dysfunction (29%). 46% of the subjects had more than one disorder with combined convergence and accommodative dysfunction the most common (23%). 70% of subjects had a medical diagnosis of vestibular dysfunction and 54% had both vision and vestibular dysfunction.
The CISS correctly classified 81% of children with a vision disorder diagnosis (63 of 69 with disorder; 18 of 31 without disorder). Patients who were evaluated within 30 days after injury were more likely to have a vision diagnosis. Poor verbal memory (p=0.002) and visual motor speed scores (p=0.005) on the ImPACT Test were significantly correlated with the presence of a vision problem.
Conclusions: The prevalence of ocular motor disorders in children after concussion is much higher than in a clinical population without a history of concussion. Clinicians should perform appropriate ocular motor testing in children who have had concussion. Further study is needed to determine optimal treatment methods.
Funded by COVD, and the AMSSM Young Investigator Grant
Oral Paper Presentations, continued

65Vision Development & Rehabilitation Volume 1, Issue 1 • April 2015
44th Annual Meeting Oral Papers and Posters
Poster Presentations
Author: Curtis Baxstrom, OD, FCOVDAdjunct faculty PUCO
Co-Authors: Graham Erickson, ODJill Schultz, OD
Title of Presentation: Pacific University Vision Therapy, Rehabilitation and Pediatric Optometry Residencies
The purpose of this poster is to share with new students and members the three pediatric/VT and Rehabilitation Residencies.
Author: Marc B. Taub, OD, MS Southern College of Optometry Associate Professor
Co-Authors: Pamela Schnell, OD Southern College of Optometry
Title of Presentation: Optometry & Visual Performance: An International, Peer Reviewed Journal
ABSTRACT Optometry & Visual Performance (OVP) is an international, peer reviewed journal dedicated
to the advancement of the role of optometry in enhancing and rehabilitating visual performance. The mission of OVP is to increase the awareness and availability of clinically relevant information in functional, developmental, behavioral, and vision therapy aspects of optometry through an internet-based, open-access format. OVP, a collaborative effort of the Australasian College of Behavioural Optometry and the Optometric Extension Program Foundation, has an international circulation of more than 6000, including the membership of the representative organ izations, optometry students, and residents. OVP covers a wide variety of topics, including clinical and scientific research, case reports and studies, reviews of new or adapted diagnostic or therapeutic methods, and editorials. Enhanced content such as author interviews, video demonstrations, and links to further resources can be found in the digital version.
In addition to the scientific journal, OVP also publishes a regular blog, Visual Performance Today, which highlights current topics in behavioral vision, practice management topics, member news for the sponsoring organizations, book reviews, and much more!
66Vision Development & Rehabilitation Volume 1, Issue 1 • April 2015
44th Annual Meeting Oral Papers and Posters
Author: Patricia Cisarik Associate Professor, Southern College of Optometry
Title of Presentation: Vergence Facility: Testing Clinical Utility of 12 Bo / 3 Bi Prism Flipper Test
ABSTRACTBackground: Gall, et al, (1998) found that vergence facility with 12 BO / 3 BI prism flippers
differentiated between symptomatic and asymp to matic gradate students and staff at an optometry college (Vision Quality Scale, McKeon, et al., 1997), suggesting that vergence facility could be used to screen for nonstrabismic binocular disorders. This study investigated the relationship between horizontal vergence facility with 12 BO / 3 BI prism flippers and patient visual symptoms in a large clinical population.
Methods: Sixty-five nonstrabismic, nonam bly opic patients between the ages of 12-40 years who consecutively presented for vision exams were included if they were without ocular disease OU and not on medications known to affect ocular motility or accommodation. Symptomatic (score ≥ 27) and asymptomatic/borderline (score ≤ 26) subjects were defined using the Vision Quality Scale survey. Vergence facility with 12 BO/ 3BI at 40 cm was recorded using the subject’s habitual near Rx or no near Rx while the patient viewed a high contrast vertical line target.
Results: VQS scores identified 34 “asympto matic/borderline” (mean VSQ score = 16.6; SD = 5.8) and 31 “symptomatic” patients (mean VSQ score = 37.8; SD = 9). A two-tailed t-test for independent samples showed that the difference in mean VQS score between the two groups was significant (p<.0001). Mean horizontal vergence facilities were 13.2 (± 7.8) cpm and 15.2 (± 6.4) cpm respectively for the “asymptomatic/borderline” and “symptomatic” groups. Neither a one-tailed or two-tailed t-test for independent samples indicated a significant difference in horizontal vergence facility between the two groups.
Conclusion: Near horizontal vergence facil ity measured with 12 BO / 3 BI prism flippers did not correlate with symptoms on the Vision Quality Scale survey in a sample of patients from a large clinic population. Correlation of horizontal vergence facility with other near symptom surveys remains to be tested.
Poster Presentations, continued
67Vision Development & Rehabilitation Volume 1, Issue 1 • April 2015
44th Annual Meeting Oral Papers and Posters
Author: Audra Steiner, OD, FCOVDAssistant Clinical Professor, SUNY College of Optometry
Title of Presentation: Subjective Sensory Testing as a Predictor for Successful Surgical Intervention
ABSTRACTBackground: The decision to refer a patient with strabismus for surgical intervention should be
made with gravity. All involved desire a positive outcome. Residual or consecutive strabismus represents surgical
failure from the patient’s point of view; the optometrist finds this result objectionable as it inhibits development of high-quality binocular vision. Appropriate subjective sensory testing performed before surgical referral can help clarify case prognosis. With better understanding, patients can make informed decisions about their care.
Case Summary: Four patients presented for evaluation of strabismus: two with esotropia and two with exotropia. Each expressed an interest in vision therapy and strabismus surgery.
Results: Three patients were referred for surgery. Two had a positive outcome, with good alignment and binocularity. One was left with constant diplopia. The fourth was deemed a poor surgical candidate. Evaluation of subjective findings was a strong predictor of good alignment and development of binocular vision post-surgically.
Discussion: The major amblyoscope is often considered first for sensory testing in a strabismic patient, but, even in a vision therapy office, not everyone has one, and doctors who do not practice vision therapy also refer patients for strabismus surgery. Presence of sensory fusion is a strong predictor for success in vision therapy and surgery, though patients with very large deviations might not be able to develop the vergence ranges required to maintain fusion. Having a basic battery of tests that can be done in many settings, without highly specialized equipment, and understanding the implications of correspondence patterns allows doctors to better educate patients. Optometrists should partner with surgeons who are receptive to our understanding of the cortical intricacies of binocular vision and who welcome our opinions.
The author of this poster needs report no conflicts of interest.
Poster Presentations, continued
68Vision Development & Rehabilitation Volume 1, Issue 1 • April 2015
44th Annual Meeting Oral Papers and Posters
Author: Christina Grosshans, ODResident, Southern College of Optometry
Co-Author: Kelley Dasinger, OD, FAAO
Title of Presentation: Spasm of the Near Reflex: 2 Case Reviews with Psychogenic Factors as Etiology of SNR
ABSTRACTBackground: Spasm of the near reflex (SNR) presents with intermittent and variable
esotropia, miosis, and accommodative spasm. The condition is infrequently diagnosed, and often misdiagnosed with differentials including lateral rectus palsy, myasthenia gravis, and latent hyperopia. The etiology of SNR is often a psychogenic factor although organic causes must also be considered. Diagnosis is difficult due to the intermittent nature of the spasm causing fluctuating results on acuities, cover test, retinoscopy, and refraction. The treatment of SNR is prolonged and often very difficult and includes a multi-disciplinary approach.
Case Summary: A 22 year old female pre sented for a vision therapy evaluation complaining of constant double vision and daily headaches for the last several years. The patient demonstrated cover test results from 8^ exophoria to 40^ alternating esotropia with -7.00 DS myopia on retinoscopy OU. Humphrey visual fields revealed a constricted field characteristic of psychogenic factors. These findings combined with pre and post-dilation miotic pupils confirmed the diagnosis of SNR. Treatment over the past 3 years has included multiple pharmacologic agents with unsuccessful results, and ophthalmic lenses with yoked vertical prism and low plus lenses ultimately providing resolution of symptoms.
A 13 year old female with a history of juvenile delinquency, bipolar disorder, and emotional outbursts presented complaining of blurred vision and ocular discomfort. Over two examinations, acuity fluctuated from 20/250 to 20/20 with a variable 20^ intermittent alternating esotropia coinciding with miotic pupils and -4.00 DS myopia. Plus lenses were prescribed and the patient is to return for follow up in the coming weeks.
Discussion: These cases demonstrate the presence of psychogenic factors as the etiology of SNR. There are multiple proposed treatments for SNR that have shown modest success. Therefore, it is possible that the most important aspect of treatment is psychological and this aspect must not be overlooked.
Poster Presentations, continued

69Vision Development & Rehabilitation Volume 1, Issue 1 • April 2015
44th Annual Meeting Oral Papers and Posters
Author: Mosaad Alhassan, BSc (Optometry), MSc, PhD CandidateSchool of Optometry and Vision Science, University of Waterloo
Co-Author: Jeffery Hovis , OD, PhD, FAAOSchool of Optometry and Vision Science, University of Waterloo
B.Ralph Chou, OD, MSc, FAAOSchool of Optometry and Vision Science, University of Waterloo
Title of Presentation: Rebeatability and Validity Measurements of Associated Phoria Tests: MKH-Haase Charts and Other Commercially Available Tests
ABSTRACTBackground: H.J.-Haase developed a sys tem atic set of tests for evaluating binocular vision
called the Pola Test. The Pola test measures associated phoria and stereo acuity at distance and near using a variety of different targets for each. This testing method and interpretation is referred to as MKH-Haase method. The MKH method is more commonly used in Germany and other European countries than English speaking countries.
Purpose: To investigate the test-retest repeatability of near horizontal associated phoria tests using MKH-Haase charts and other common clinical tests.
Methods: Near horizontal associated phorias values were measured for 34 symptomatic and 40 asymptomatic participants using 11 different tests on two different occasions. Symptomatic and asymptomatic was determined by a questionnaire regarding visual symptoms at near.
Results: Except for the Sheedy Disparometer, the mean differences between sessions for the near horizontal associated phoria tests was not statistically significant different from zero based on the 95% confidence interval. The mean between-session difference for the Sheedy Disparometer was significantly more exo at the second session for the asymptomatic group. The 95% limits of agreement for Mallet Unit and AO Card for both groups, and Saladin Card for the asymptomatic group were within ± 1.00 D and for most of the other tests were about ± 2.00 D. The exceptions were the symptomatic groups Disparometer limits, which were -4.25 to 5.75 D. The linear regression (r) between the first and second session results were about 0.7 and significant for most tests. Again the exception was the Sheedy Disparometer where the regression was about 0.3 for both groups.
Discussion & Conclusions: Most of tests showed good repeatability for both subject groups at near, except the Sheedy Disparometer. The reason for the lower repeatability could be the design of the test due to the lack of central fusion locks.
Poster Presentations, continued
70Vision Development & Rehabilitation Volume 1, Issue 1 • April 2015
44th Annual Meeting Oral Papers and Posters
Author: Poonam NathuResident, Dr . Shidlofsky, SCO
Title of Presentation: Measuring Efficacy of Therapeutic Prism Lenses with the Computerized Dynamic Posturography In Patients with TBI and a Learning Related Vision Problem.
ABSTRACTBackground: Computerized Dynamic Pos tur ography (CDP) is a technique used to objectively
quantify the variety of sensory, motor and central adaptive impairments involved in balance control. The objective of the case report is to demonstrate the impact of therapeutic prism lenses on posture and perception, measured with CDP, in traumatic brain injury and learning related vision problem patients.
Case Reports: A 16 year old male, who suffered a traumatic brain injury during a football game, initially presented with the following symptoms: headaches with any visual stimulation, photophobia, trouble converging, non-specific eye pain, blurred vision, and postural changes. A series of chair procedures and baseline neuro-sensory testing, including CPD, showed visual spatial disorientation, binocular vision dysfunction, imbalance, ocular motor dysfunction, and convergence insufficiency. Therapeutic lenses (2 base down, with a BPI FL-41 tint) was prescribed for full time wear based on the initial examination results; testing was repeated.
A 9 year boy presented with complaints of holding material close, headaches and eye rubbing associated with desk work, moving print, light sensitivity, loss of reading comprehension, loss of place and skipping lines when reading, and difficulty with concentrating. After a series of chair procedures and the neuro-sensory testing were performed, the data showed binocular vision dysfunction, convergence insufficiency and accommodative dysfunction. Therapeutic lenses (3 base down) were prescribed for full time wear.
The results of both cases show improvement in all areas of testing, especially the CDP results. Looking at the sway velocity when isolating sensory integration function, primary proprioception, primary visual, and primary vestibular, there was a significant improvement in each of these sensory areas with the use of therapeutic prisms.
Discussion: These cases demonstrate the benefit of therapeutic prism lenses. Postural and perceptual changes, which can be quantified by the CDP, will be highlighted.
Poster Presentations, continued
71Vision Development & Rehabilitation Volume 1, Issue 1 • April 2015
44th Annual Meeting Oral Papers and Posters
Author: Susan Evans, ODResident, Southern College of Optometry
Co-Author: Glen Steele, OD Southern College of Optometry
Title of Presentation: Promoting Visual Development in Infants with Hydrocephalus
ABSTRACTBackground: Hydrocephalus is associated with refractive errors, strabismus, increased
intraocular pressure, and cortical blindness in children Visual perceptual problems associated with hydrocephalus include visuospatial performance, material organization, and visual attention deficits. Hydrocephalus can impact the child’s visual as well as overall development. This case report serves to review the visual performance and visual perceptual deficits that can occur in hydrocephalic infants.
Case Report: A twelve month old male with a history of hydrocephalus reported to The Eye Center at Southern College of Optometry on February 20th, 2013. Although all ocular health was observed to be normal, the child was unable to fix and follow any lights or objects. He was diagnosedwith oculomotor dysfunction, and his grandmother was instructed begin at-home activities to stimulate visual development. Proceeding multiple follow-up examinations and continuous at-home visual stimulation activities for one year, the child was exhibiting excellent visual fixation, oculomotor function, and convergence abilities.
Conclusion: The American Optometric Association recommends visually stimulating activities for all infants to promote appropriate visual development; however, stimulating activities may be especially important in the development of appropriate visual function in hydrocephalic children. This poster will highlight the hydrocephalus, as well as the activities performed to enhance visual development.
Poster Presentations, continued
72Vision Development & Rehabilitation Volume 1, Issue 1 • April 2015
44th Annual Meeting Oral Papers and Posters
Author: Chrissy Ulrich, BS3rd year student, Southern College of Optometry
Co-Author: Marc B. Taub OD, MS, FAAO, FCOVDSouthern College of Optometry
Title of Presentation: A Comparison of Accommodative Amplitude with Multifocal Contact Lenses to Bifocals
ABSTRACTBackground: Spectacle plus lenses are commonly used to alleviate symptoms of near
tasks caused by lack of accommodative ability of the visual system. Multifocal contact lenses offer another treatment option for those not wanting bifocal spectacles. This study compared accommodative lag and amplitude between the Bausch & Lomb Pure Vision low addition multifocal contact lens and +1.25D lenses in bifocal spectacles.
Methods: This study was a randomized cross-over experiment with established spher ical soft contact lens wearers (N=40; ages 21-35). Subject’s accommodative lag (Grand Seiko WR-5100K Auto Refractor) and accommodative amplitude (Push-up method and Minus lens to blur method) was measured on the subject’s dominant eye under three conditions: baseline measurement through subject’s habitual spherical soft contact lens, after three days of wear through +1.25D bifocal glasses over subject’s habitual distance contact lens, and after three days of wear through Bausch & Lomb Pure Vision low addition multifocal contact lens. The order of procedures (multi-focal contact lens or spectacle) and testing was randomized. Data were analyzed using repeated measures regression methods.
Results: There were no significant between-condition differences on the Push-up method. There was a significant difference between Baseline and Multifocal conditions for the Minus lens to blur method (p= .04). For the Grand Seiko spherical reading, there was a significant overall Condition effect (p< .001), and significant differences between Baseline and Multifocal (p= .003) and Bifocal and Multifocal (p< .001) conditions.
Conclusion: This study confirms a multi focal contact lens produces differences in accommodative lag compared to a traditional flat top bifocal. This study also demonstrates differences in accommodative amplitude between multifocal and no lens. In both cases, the multifocal lenses cause the desired response of increasing accommodative amplitude and decreasing accommodative lag. Further research is needed with various lens designs to determine the most appropriate choice for patient care related to accommodative problems.
Poster Presentations, continued
73Vision Development & Rehabilitation Volume 1, Issue 1 • April 2015
44th Annual Meeting Oral Papers and Posters
Author: Kristen Davis, BSSouthern College of Optometry
Co-Author: Marc B. Taub OD, MS, FAAO, FCOVDSouthern College of Optometry
Title of Presentation: Contrast Sensitivity Testing in Normal Vision: Performance with Letter vs. Continuous Text
ABSTRACT Purpose: Contrast sensitivity is an essential feature of vision that provides information about
visual function. There are numerous commercially available tests to measure contrast sensitivity. The present investigation compared contrast sensitivity measured with letter stimuli to contrast sensitivity measured with paragraph stimuli in a non-low vision based population.
Methods: Participants consisted of adults (22-35 yo) with best-corrected vision of 20/32 at near and stereocuity ≥ 30 seconds of arc. The study was conducted using the Adult Near Contrast Test, consisting of both EDTRS format letter charts and continuous text charts at five different contrast levels. The total number of letters (EDTRS chart) and words (continuous text chart) was recorded at each contrast level. Testing proceeded in decreasing order of level of contrast for each chart type. Repeated measures ANOVAs were conducted to examine the effects of contrast level on (a) total letters (EDTRS letters format) and (b) total words (continuous text format).
Results: Significant differences based on contrast level were found for total letters (p< 0.001) and for total words (p< 0.001). A Pearson correlation was performed between total letters and total words for each contrast level. High and statistically significant correlations between words and letters occurred at all contrast levels (p< 0.001), except for the 100% contrast targets (p= 0.69).
Conclusion: A positive correlation was found between the two testing formats contained in the Adult Near Contrast Test for measuring contrast sensitivity in adults with normal vision. Further testing will explore this relationship in a low vision patient population.
Poster Presentations, continued
74Vision Development & Rehabilitation Volume 1, Issue 1 • April 2015
44th Annual Meeting Oral Papers and Posters
Author: Lindsay Wettergreen, ODVision Rehabilitation Resident at Southern College of Optometry
Co-Authors: Glen T. Steele, OD, FCOVD, FAAO Southern College of Optometry
Marc B. Taub OD, MS, FAAO, FCOVDSouthern College of Optometry
Title of Presentation: Unique Retinoscopy Findings in A-pattern Esotropia
ABSTRACTBackground: The pathophysiology of A-pattern esotropia is not fully understood. Without
complete understanding of a condi tion, it is difficult to determine proper testing necessary to identify accompanying characteristics. Retinoscopy is a critical tool in the examination of the pediatric population and can be used for more than determining refractive error. The purpose of our paper is to report on a patient with A-pattern esotropia and the abnormal retinoscopy findings.
Case Summary: We report a 3-year-old female with a history of congenital nystagmus and esotropia noted by her mother, especially in up-gaze. Upon examination, A-pattern esotropia was observed. Retinoscopy findings showed equal and low plus reflex in right, left and down gaze. Up-gaze revealed inward deviation of the left eye and marked equal darkening of the reflex in both eyes, equal pupil constriction of both eyes and equal against-motion reflex of both eyes of approximately 2 diopters. We prescribed monocular home eye stretches, emphasizing upward and outward directions, and recommended 3-month follow-up evaluation.
Discussion: The cause of the unusual retin o scopy findings associated with the A-pattern esotropia is unknown. We hope that this case report will encourage the use of retinoscopy for other reasons than determination of refractive error and inspire further investigation and monitoring of A and V-pattern strabismus.
Poster Presentations, continued
75Vision Development & Rehabilitation Volume 1, Issue 1 • April 2015
44th Annual Meeting Oral Papers and Posters
Author: Jae-do KimAssociated Professor/School of Optometry Kyungwoon University
Co-Author: Kenneth CiuffredaSUNY State College of Optometry
Title of Presentation: Effect of Partial Presnel Prisms for Exotropia with Suppression at Distance: Pilot Study
ABSTRACTBackground: Most exotropes have fusion at near, but frequently exhibit suppression at
distance. Until now, anaglyphs for fusion training, or patching of the dominant eye, have typically been used for anti-suppres sion.However, these methods can pose problems, such as limitation of gaze range and/or return of the suppression. We used a novel approach in such patients with good success in a small sample of children.
Methods: 5 patients with exotropia with out history of strabismus surgery or ocular disease participated. Ages were 6-10 years. Mean deviation at distance was XT 20+/-3pd (range 18-25pd) and XP 18+/-15pd (range 3-39pd) at near, as assessed by the cover test. Two suppressed in the RE and 3 in the LE at distance as assessed by the Worth-4-Dot test. For vision rehabilitation, all patients wore their distance spectacle prescription in conjunction with sector, base-in Fresnel prisms equivalent to the distance deviation in the upper region of the non-suppressing eye’s spectacle lens. In addition, vergence-based vision rehabilitation was added once the suppression reduced/dissipated.
Results: After 3.8 +/- 2.2 (range 1-6 mos.) months of wearing the spectacles, suppression was not present at distance, and fusion was now readily evident. This was followed by conventional fusion training ( 9+/-3 mos., range 6-12 mos.) to enhance/embed the earlier positive prism effect, with positive results.
Conclusions: This simple, sequential, two-pronged approach to distance suppression and fusion in children with XT/XP resulted in excellent results in this small sample of children. The first phase appears to facilitate the second. This should now be tested in a larger sample of such patients.
Poster Presentations, continued
76Vision Development & Rehabilitation Volume 1, Issue 1 • April 2015
44th Annual Meeting Oral Papers and Posters
Author: Tanya Polec OD, FCOVDHead Administrator / Visual IntelligenceTM
Co-Author: Amy Schlessman, PhDRose Academies
Title of Presentation: Vision Development as Innovation at a Public High School
ABSTRACTBackground: The Educator’s Guide to Classroom Vision Problems emphasizes the importance
of vision development for young children and through elementary school. Almost all traditional high schools do not develop visual intelligence as a fundamental element for academic and life success. We explored how a credit-bearing course on Vision Development might open options for students at a high school serving a high-risk student population.
Methods: A neuro-optometric medicine practice and alternative education campus conducted a pilot research study using a quasi-experimental research design. Data were collected using an extensive pre-post battery of assessments, e.g. TVPS, King Devick, Binocular Vision Assessment Program’s fusional ranges, Woodcock-Johnson visual memory subtests. Purposive sampling assigned students to treat ment/control. Treatment group participated in a 3 month high school course with state standard aligned curriculum on “science” of vision plus vision therapy lab sessions featuring base in-out activities, space matching, yoked prism, etc.
Results: Assessment of students at school before sampling showed 82% (80/98) of the student population in need of vision therapy.
Despite attrition, students receiving treat ment (n = 13) showed statistically significant improvement on multiple assessments:
Discussion: Results of this study indicate that offering vision development at a public high school may significantly increase students’ visual capabilities and skills that are fundamental to academic success thereby expanding life options.
TVPS mean 19.5 pts. higher than control, p < .001
Fusional Ranges, Binocular Vision Assessment ProgramBI Break mean 6 pts. higher, p <.01
BI Recovery 7 pts higher, p <.01BO Break 14 pts. higher, p<.05
BO Recovery 17 pts higher, p = .05King Devick mean lower time, 12 sec, p<.05
less errors, 1.2, p<.05Woodcock-Johnson Visual
Memory, subtestmean 11 pt. decrease in
errors, p<.01
Poster Presentations, continued
77Vision Development & Rehabilitation Volume 1, Issue 1 • April 2015
44th Annual Meeting Oral Papers and Posters
Author: Tyler PhanPrimary Eye Care/Acquired Brain Injury & Vision Rehabilitation Resident
Co-Author: Carl Garbus, ODFamily Vision Care, Valencia, California
Title of Presentation: Stress Induced Diplopia: A Case Report
ABSTRACTBackground: Emotional stress and increase near work demand are well described triggers for
developing a decompensated phoria. One explanation is through the binocular imbalance resulting in psychological and behavioral changes. This case describes the use of Fresnel prism for immediate relief of symptoms, in addition to stress control and vision therapy, and gradual removal of prism dependency.
Case Summary: An 18-year-old Caucausian female college student experienced sudden onset of horizontal binocular diplopia accompanied by mild headache post viral-like upper respiratory illness and one month after starting college. Neuro-opthalmic testings two months after initial onset revealed 15 diopter of intermittent comitant right esotropia at distance and near. General neurologic exam was otherwise unremarkable, including pupils and oculomotility. MRI of the orbit and brain was negative. All blood work for various systemic diseases were normal. Patient was diagnosed with stress induced decompensated phoria with possible inciting factors of viral-like illness and increase near work demand.
Results: Patient was prescribed 10 diopter of Fresnel prism over right eye for immediate relief of symptoms. Additionally, patient underwent active home therapy to increase fusional vergence reserves. Patient was educated about inciting factors and had special accommodations at school to keep stress level down. At 3, 5 and 6 months follow-up, the amount of prism was reduced to 6, 2 and 0 diopter, respectively, with patient maintaining clear and comfortable single vision.
Discussion: This report demonstrates the importance of a thorough case history with complete work-up to rule out potentially life-threatening etiologies. Equally important is to inquire about associated factors because stress can cause many visual disturbance, which may include diplopia. This case shows that with proper stress management, a motivated patient can regain control of her binocular system. Intermittent prisms and vision therapy are also important treatment modalities to consider in addition to lifestyle changes.
Poster Presentations, continued
78Vision Development & Rehabilitation Volume 1, Issue 1 • April 2015
44th Annual Meeting Oral Papers and Posters
Author: Gale OrlanskyOptometrist/Assistant Professor/Salus University
Title of Presentation: Longitudinal Study of Vision Screenings of Preschoolers: What Happened to Those Children who Failed Their Screening?
ABSTRACTBackground: In the US more than 12.1 million school-age children have a vision problem;
only one in three children receive eye care services before six years. The NEI reports that the most prevalent and significant vision disorders of preschoolers are amblyopia, strabismus, and significant refractive error.1 Preschool vision screenings identify children who may have a vision disorder which can lead to permanent visual impairment unless treated in early childhood. For vision screenings to be effective, a “follow-up” vision care plan needs to be in place.
Methods: From 1999 to 2013, children who were enrolled in an inner city Head Start program underwent vision screenings. The vision screening was based on the Modified Clinical Technique and included: visual acuity, cover test, non-cycloplegic static retinoscopy, and direct ophthalmoscopy. Children who had reduced visual acuities, strabismus, high phorias or any observable ophthalmic abnormalities were referred for further eye care.
A longitudinal review of encounter records was made, and the following information was recorded: the number of children who had their vision screened, the number who failed the screening, and the number of children who received follow-up care.
Results: Over 15 years, 36,156 Head Start preschoolers had their vision screened, and 5409 were identified as failing their screening. Of those children who failed the screening, only 30.9% received follow-up care. A review of a subset of records from 2010-13, showed 15,484 children were screened and 2344 failed the screening. Of those who failed 22.4% received follow-up care; 55.8% received eyeglasses, 31% were told to return for eye care in 6 months, 20.6% were given no optical treatment, 1.3% had surgery.
Conclusions: As optometrists we need to make a commitment ensuring continuing eye care for preschoolers post screening by improving eye health literacy, and accessibility to comprehensive vision care services.
1www.HHS.gov
Poster Presentations, continued
79Vision Development & Rehabilitation Volume 1, Issue 1 • April 2015
44th Annual Meeting Oral Papers and Posters
Author: Derek Tong, OD, FAAO, FCOVD, FNORAAdjunct Clinical Assistant Professor, Southern California College of Optometry
Title of Presentation: Private-Practice Residency Program in Pediatric Optometry & Vision Therapy/Neuro-Optometry
ABSTRACTThis residency program is a full-time, formal, supervised program consisting of direct patient
care, didactic education, teaching experience, and scholarly activities. It is based at the Center for Vision Development Optometry, the private practice of Dr. Derek Tong located in Pasadena, California. The learning objectives are achieved through patient care, case studies, and seminars which will facilitate the resident’s development into an expert clinician in the areas of pediatric optometry, binocular vision, vision development, neuro-optometry, and vision enhancement.
A unique component of this program is equipping the resident with the necessary practice management skills to operate a private practice and successfully market its unique services. The resident will also learn to interact and co-manage patients with other optometrists, child development specialists, educators, and rehabilitation professionals.
This program provides qualified graduate optometrists with advanced clinical experience in the diagnosis and management of pediatric eye diseases, binocular vision disorders, visual-perceptual dysfunctions, acquired brain injury, and other functional vision deficits.
Link to residency website: http://tinyURL.com/VisionResidency
Poster Presentations, continued
80Vision Development & Rehabilitation Volume 1, Issue 1 • April 2015
44th Annual Meeting Oral Papers and Posters
Author: Tomohito Okumura, MSOptom, MEd, FAAO, FCOVD-IOsaka Medical College LD Center
Co-Authors: Hiroshi Watanabe, PhD1
Eiji Wakamiya M.D. PhD.2,3 Hiroshi Tamai M.D. PhD2,4
1National Institute of Advanced Industrial Science and Technology, 2Osaka Medical College, LD Center, 3Aino University, Faculty of Nursing and Rehabilitations, 4Osaka Medical College, Department of Pediatrics
Title of Presentation: Relationship Between Topographical Orientation and Visual Perception in Young Adults
ABSTRACTBackground: Topographical orientation is the ability to orient and navigate in both familiar and
unfamiliar environment (Wang and Spelke 2002). This complex function relies on several perceptual and cognitive processes such as attention, memory, perception and decision-making skills, all of which play important roles in spatial orientation (Lepsien and Nobre, 2006). Topograophical orientation is possibly related to basic visual perception such as visual discrimination skill. The present study is aimed at investigating whether visual perception is related to topographical orientation perform ance in young adults.
Methods: 17 young adults with normal visual acuities and stereopsis served as subjects and devided into two groups; good (GVD) and poor visual discrimination (PVD) groups, by using visual discrimination subtest in Test of Visual Perception Skills (TVPS-3). A immersive virtual reality system, CAVE (Computer Assised Virtual Environment) was used to assess topographical orientation performance of all subjects. The CAVE is contained a cube-shaped room in which the walls (3m x 3m) are rear-projection screens. 3D images within the CAVE appear to float in mid-air. The subjects, who wears polarization glasses, can walk around in the room for assigned tasks. Sensors within the room track the subject’s position to align the perspective correctly and measured subject’s walking trajectory. The subjects were asked to find a target as quick as possible in 2, 4, or 8 square poles arranged in the virtual reality room which is randomly roteted around a vertical axis for each trial. The durations to find a target were measured and analyzed to investigate the relationship between topographical orientation and visual perception.
Results: Compared to the GVD group, durations to find a target in the PVD group were significantly longer. Discussion: Our results indicate that visual discrimination skill, one of basic visual perception, was related to topographical orientation performance in young adults.
Poster Presentations, continued
81Vision Development & Rehabilitation Volume 1, Issue 1 • April 2015
44th Annual Meeting Oral Papers and Posters
Author: Rochelle Mozlin, OD, MPHAssociate Clinical Professor, SUNY State College of Optometry
Title of Presentation: Hyperopic Children and the Application of Evidence-Based Optometry
ABSTRACTBackground: Hyperopia is the most com mon refractive error in children. In the past 10 years,
significant research on hyperopia has been conducted. The addition of these studies to the evidence-base should help optometrists make better decisions about when and what to prescribe for hyperopic children.
Case Summary: TJ, a 2 year old girl presented to the Pediatric Service of the University Eye Center with her mother. TJ’s mother had no concerns about TJ’s vision but thought an eye exam would be a good idea. TJ was in good health. Her overall development was normal. There was no family history of significant visual conditions.
Uncorrected visual acuities at both distance and near, measured with pictures were 20/30 right eye, left eye and both eyes. Pupils and EOMs were normal. Cover testing at both distance and near was ortho. Retinoscopy was +2.00 in each eye. With cycloplegia, retinoscopy was +3.00 in each eye. Ocular health assessment was completely normal.
Results: What would you do?
Discussion: The results of 4 recent studies will be summarized:
Cotter SA, Varma R, Tarczy-Hornoch K, McKean-Cowdin R, et al. Risk factors associated with childhood strabismus. (2011)
Kulp MT, Ying G, Huang J, Maguire M, et al. Associations between hyperopia and other vision and refractive error characteristics. (2014)
Van Rijn LJ, Krijnen JSM, Nefkens-Molster E, Wensing K, et al. Spectacles may improve reading speed in children with hyperopia. (2014)
Ciner EB, Ying GS, Kulp MT, Maguire MG, et al. Stereoacuity of preschool children with and without vision disorders. (2014)
Conclusion: In the management of hyper opia in young children, evidence-based optometry is focusing on risks associated with uncorrected hyperopia and the potential benefits of intervention. Optometrists are likely to continue to practice with a variety of prescribing philosophies, but incorporating an evidence-based perspective into management strategies will enhance outcomes for these young patients.
Poster Presentations, continued
82Vision Development & Rehabilitation Volume 1, Issue 1 • April 2015
44th Annual Meeting Oral Papers and Posters
Author: Ruth Y. ShogeAssistant Professor, Salus UniversityChief, Pediatric and Binocular Vision Services
Title of Presentation: Caring For Invisible Wounds: Vision, The Brain, and Beyond – A Case of an Adolescent Recovering from an mTBI
ABSTRACTBackground: Mild traumatic brain injuries (mTBI) are a common occurrence in children and
adolescents. Postconcussive symptoms are complaints that tend to occur more often following TBI and include a range of somatic (e.g., headache, fatigue), cognitive (e.g., inattention, forgetfulness, slowed processing), and affective symptoms (e.g., irritability, disinhibition). Neurological, psychological, and physical factors are seen as interacting in complex ways, and appropriate evaluation allows for selecting individualized treatments for different patients depending on the particular dynamics of their disability. This case reviews the management of one such patient.
Case Summary: A 17 year old female presented with symptoms including reduced vision, diplopia, headaches, and photophobia. Most concerning was her reported inability to read and write. She had plans to sit for the SATs, graduate from high school, and attend college. Subsequent treatment of her visual symptoms with VT, direct and constant communication with her parents, and coordination with her care team resulted in this patient being able to graduate on time, and successfully gain acceptance to several colleges.
Discussion: Vision: Visual problems follow ing an mTBI have been well documented over the years. Many of the common symptoms include oculomotor dysfunction, diplopia, blurry vision, and photophobia.
The Brain: mTBI can affect all aspects of brain function. In this case, we had to confront the patient’s visual symptoms, psychosomatic issues, and visual apperceptive agnosia-like symptoms.
Beyond: Compounding these problems were also the social aspects of her recovery – being out of school and away from friends, and the uncertainty of her future.
As professional and media awareness con tinues to increase, optometrists will find themselves at the forefront of caring for these patients. It is our responsibility to provide vision care, and to be a team-player in the integrated treatment of the mental, emotional, and social health of these patients.
Poster Presentations, continued
83Vision Development & Rehabilitation Volume 1, Issue 1 • April 2015
44th Annual Meeting Oral Papers and Posters
Author: Derek Tong, OD, FAAO, FCOVD, FNORAAdjunct Clinical Assistant Professor, Southern California College of Optometry
Co-Authors: WC Maples OD, MS, FAAO, FACBO, FCOVDProfessor Emeritus, Northeastern State University: Oklahoma College of OptometryResearch Professor, William Carey University: College of Osteopathic Medicine
Judy Tong OD, FAAO Associate Professor & Assistant Dean of Residencies, Southern California College of Optometry at Marshall B . Ketchum University
Title of Presentation: 10 Key Steps to Start a Private Practice Vision Therapy Residency
ABSTRACTBackground: The first private practice vision therapy residency program was launched in 2008.
Since then, many new programs have been established. Due to the on-going demand, a huge need for additional program positions is anticipated.
Methods: This article provides an overview of the process involved to start and receive accreditation for such residency programs.
Results: Resources and links are included.
Discussion: The 10 key steps to starting a residency includes goals & intention, feasibility analysis, initial proposal, optometry school affiliation & adjunct faculty appointment, self study preparation, recruitment of initial resident, ACOE site visit, accreditation report, accreditation approval, annual review & next accreditation visit.
Poster Presentations, continued
84Vision Development & Rehabilitation Volume 1, Issue 1 • April 2015
44th Annual Meeting Oral Papers and Posters
Author: Lynn H. Trieu, OD, MS, FAAOAssistant Professor at Salus University
Co-Author: Ruth Y. Shoge, OD, FAAOSalus University
Title of Presentation: The Pediatric/Vision Therapy Residency at Salus University
ABSTRACTBackground: The Pediatric/Vision Therapy Residency at The Eye Institute of the Pennsylvania
College of Optometry (PCO) at Salus University, one of the first such residencies in the country, was established in 1977. It is a challenging 54-week educational program that is designed to train entry-level graduate optometrists to provide competent and efficient care to pediatric and infant populations, vision therapy, and neuro-optometric vision rehabilitation.
One of the biggest attractions of PCO is its exceptionally strong clinical program. From day one, residents get invaluable experience with our diverse patient population. The Pediatric/Vision Therapy Residency provides the foundation for the management of binocular disorders, strabismus, amblyopia, traumatic brain injuries, learning-related vision problems, and vision therapy. Additionally, our Pediatric/Vision Therapy residents rotate through our affiliated hospital vision clinics, which specialize in pediatric ocular disease and neuro-optometric vision rehabilitation. Residents also have the opportunity to enhance their skills in the diagnosis and management of ocular disease through our specialty services, such as emergency eye care, neuro-optometry, and retina service. The science-and research-driven atmosphere provides a unique learning and teaching experience for the residents as they work closely with faculty and students in the clinic.
The Pediatric/Vision Therapy Residency at PCO is a comprehensive program that assiduously prepares residents for the fields of pediatrics, vision therapy, and neuro-optometric vision rehabilitation. The residency employs an appropriate level of supervision and support from highly-trained faculty and eventually leads residents to clinical independence. With the recent renovation of The Eye Institute, the introduction of The Brain Injury Clinic, and new affiliated hospital sites, it has never been a more exciting time for residents at this institution.
Poster Presentations, continued
85Vision Development & Rehabilitation Volume 1, Issue 1 • April 2015
44th Annual Meeting Oral Papers and Posters
Author: Helena TzouPediatrics and Vision Therapy Resident at Southern College of Optometry
Title of Presentation: Vision Therapy for Children With Non-Verbal Autism: Uploading and Downloading for Success
ABSTRACTBackground: Vision therapy for children with non-verbal autism can enhance quality of life.
Adaptability during planning and implementing of therapy sessions can allow patients to increase visual ability as well as develop skills that can influence all facets of life.
Case Summary and Results: An eleven-year-old male with non-verbal autism and history of psychological and neurological conditions, learning problems, and refusal to wear glasses was evaluated. Case history revealed that the patient often loses his place while reading, reads slowly, uses his finger as a marker, is bothered by light, experiences difficulty catching or hitting a ball, writes poorly, and has an awkward or immature pencil grip. The child was diagnosed with intermittent exotropia, oculomotor dysfunction, binocular dysfunction, accommodative dysfunction, strabismic amblyopia, and hyperopia astigmatism. Eight weeks of two sessions a week of optometric vision therapy was prescribed. Throughout therapy, various tech niques were simplified in order for the patient to understand the task and to enhance visual skills. Additional aspects of the techniques were added when possible. The patient wore glasses more frequently at home and tolerated an eye patch for monocular activities; the patient participated in home vision therapy sessions more willingly and repetitive behaviors decreased. The patient’s mother reported greatly improved handwriting, verbal skills, and initiative to attempt new tasks. Mild improvement in ocular motilities, convergence, and binocular ranges were measured at the progress evaluation.
Discussion: Children with non-verbal autism or other significant deficits due to autism can benefit from optometric vision therapy. It is often more effective if patient’s ability level is gauged and activities are modified for success.
Poster Presentations, continued
86Vision Development & Rehabilitation Volume 1, Issue 1 • April 2015
44th Annual Meeting Oral Papers and Posters
Author: Eric S. Hussey, OD, FCOVDPrivate Practice
Title of Presentation: Development of Stereopsis Using Eyetronix Flicker Glass to Treat Amblyopia in a Congenital Unilateral Post-Cataract-Surgery Aphake
ABSTRACTBackground: Early or congenital cataract is treated with early surgery, commonly without
pseudophakic implants. Surgery is often followed with patching and optical correction, including extended wear contact lenses. Some level of amblyopia is expected to persist depending on how early surgery was performed and what post-surgical therapies are accomplished.
Case Summary: As a parallel case study to the Eyetronix Flicker Glass Amblyopia Treatment Study, a 5-year old white female unilateral (post-surgical) aphake was treated with the novel therapy. Eyetronix Flicker Glass (EFG) are glasses with liquid crystal lenses that rapidly alternate occlusion between the two eyes at a prescribed “flicker” frequency. The patient had been previously fit with an extended wear pediatric aphakic contact lens and had been faithfully patching for 4 hours daily. In this case study, we followed the Eyetronix study protocol of wearing EFG for near activities (e.g., coloring) for 1-2 hours daily for a 12-week treatment period. Given positive results and strong interest in continuing treatment by the patient parents and doctor, therapy has been extended for an additional 12 weeks. At this time (12-weeks as of this abstract), acuity in the amblyopic aphakic eye has improved from LogMAR 0.34 to 0.26. In addition, stereopsis has improved from <500 seconds (no response on stereo tests) to a reliable 63 arcseconds (Random dot 2).
Discussion: In addition to being considered “a treat” compared to 4 hours daily patching, Eyetronix Flicker Glass therapy has improved visual acuity and stereopsis over what had been attained with conventional patching. This novel therapy holds promise in treating early post-surgical aphakic amblyopia by improving binocular vision, improving visual acuity, and being well-accepted during use.
Poster Presentations, continued
87Vision Development & Rehabilitation Volume 1, Issue 1 • April 2015
44th Annual Meeting Oral Papers and Posters
Author: Angela To, ODAssistant Professor, Illinois College of Optometry
Title of Presentation: Idiopathic Intracranial Hypertension in a Teenager with a Complaint of Diplopia
ABSTRACTBackground: Pseudotumor cerebri or idio pathic intracranial hypertension (IIH) is a disease
which presents as papilledema secondary to increased intracranial pressure, with a negative cranial MRI/V and increased opening pressure upon lumbar puncture. It occurs predominately in obese women of child-bearing age and may cause visual field and central visual acuity loss if the underlying cause is not addressed.
Case Summary: A 16 year old African American female presented with sudden onset diplopia, tinnitus and headaches. She was found to have a constant esotropia and hyper deviation that was not present at her last eye exam, one year prior. She also showed dramatic optic disc edema in both eyes. She was prescribed a fresnel prism for temporary, yet immediate, diplopia relief. After ordering a visual field, OCT and posterior pole photos, she was sent to a Neuro-ophthalmologist for a workup including lumbar puncture, MRV and MRI. She was diagnosed with IIH and placed on a regiment of Diamox. When she returned one month later, there was a significant decrease in swelling and her diplopia had disappeared.
Discussion: This case demonstrates the importance of striking a balance between relieving the patient’s symptoms while still ensuring that referrals are made to properly diagnose and manage the underlying condition. This patient was able to leave our office with single, clear, comfortable binocular vision while still understanding the severity of her condition. This case also shows that a careful optic nerve evaluation with imaging is warranted, despite being outside the expected demographic.
Poster Presentations, continued
88Vision Development & Rehabilitation Volume 1, Issue 1 • April 2015
44th Annual Meeting Oral Papers and Posters
Author: Katherine GreenStudent, Illinois College of Optometry Class of 2015
Co-Author: Angela To, OD FAAO
Title of Presentation: Atypical Stargardt’s Disease in a Vision Therapy Patient
ABSTRACTBackground: Stargardt’s Disease is the number one inherited macular disorder among patients
10-20 years old, occurring in approximately 1 in 8,000 patients. This degenerative maculopathy is known for rapidly decreasing VAs to between 20/200-20/400, central visual field defects, and a characteristic fundus appearance of golden “fish tail” shaped flecks throughout the macula.
Case Summary: An 11 year old African American female was referred to the IEI Pediatrics and Binocular Vision department for a visual efficiancy exam. The patient was diagnosed with accomodative insufficiency, convergence insufficiency, and essential emmetropia. After completing two months of therapy, a cycloplegic exam was performed due to continued patient complaints of decreased vision at distance. Upon examining the posterior pole, the macula was found to contain bull’s eye maculopathy and pinpoint drusenoid-appearing disruptions concentrically around the fovea. Visual field testing revealed a central vision defect, and a clear disruption between the inner and outer segments of the macular photreceptors was seen on OCT. The patient was referred to a specialist in inherited retinal disorders and was diagnosed with atypical Stargardt’s degenerative maculopathy. Through continued vision therapy, the patient was able to obtain age appropriate accommodative skills and compensating vergence abilities. After two years of maintenance home vision therapy and regular follow-ups, the patient has maintained appropriate binocular vision skills, and the vision is stable.
Discussion: The present case shows the value of auxiliary testing in diagnosing retinal disorders, particularly those with atypical presentations. This case also highlights the importance of dilated fundus exams for all patients, even when referred in for therapy only. Finally, this case demonstrates the ability to use vision therapy to maximize the remaining vision in a patient with pathological vision loss.
Poster Presentations, continued
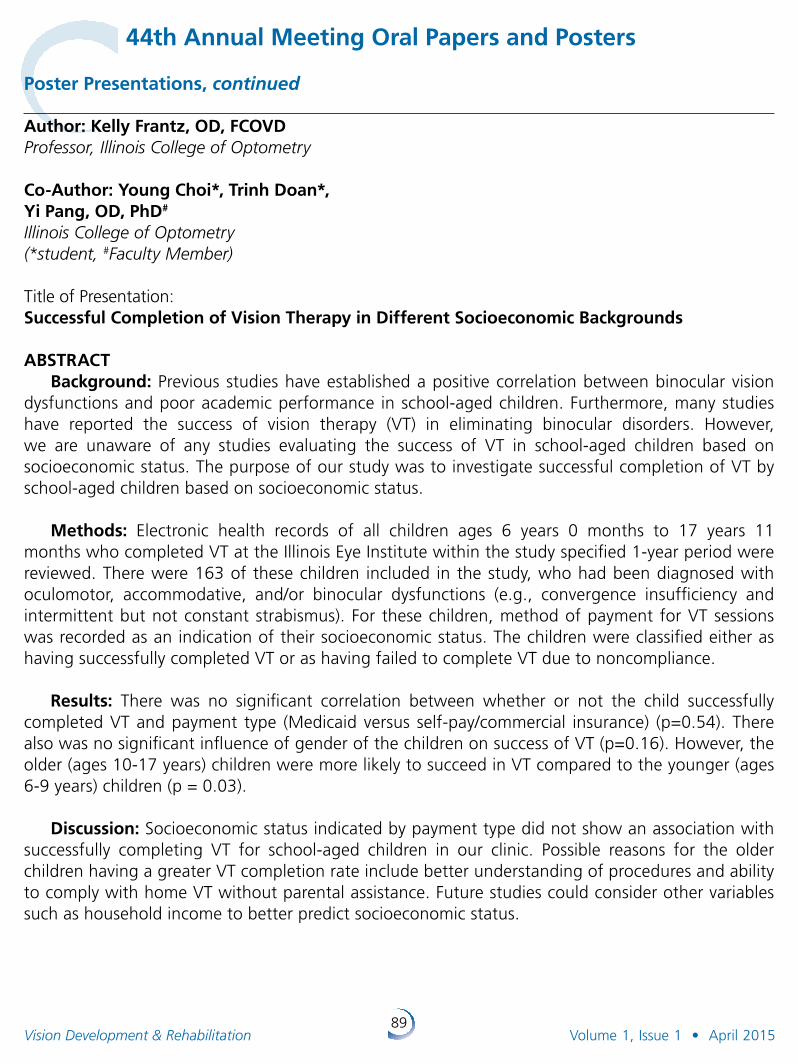
89Vision Development & Rehabilitation Volume 1, Issue 1 • April 2015
44th Annual Meeting Oral Papers and Posters
Author: Kelly Frantz, OD, FCOVDProfessor, Illinois College of Optometry
Co-Author: Young Choi*, Trinh Doan*, Yi Pang, OD, PhD#
Illinois College of Optometry (*student, #Faculty Member)
Title of Presentation: Successful Completion of Vision Therapy in Different Socioeconomic Backgrounds
ABSTRACTBackground: Previous studies have estab lished a positive correlation between binocular vision
dysfunctions and poor academic perform ance in school-aged children. Furthermore, many studies have reported the success of vision therapy (VT) in eliminating binocular disorders. However, we are unaware of any studies evaluating the success of VT in school-aged children based on socioeconomic status. The purpose of our study was to investigate successful completion of VT by school-aged children based on socioeconomic status.
Methods: Electronic health records of all children ages 6 years 0 months to 17 years 11 months who completed VT at the Illinois Eye Institute within the study specified 1-year period were reviewed. There were 163 of these children included in the study, who had been diagnosed with oculomotor, accommo dative, and/or binocular dysfunctions (e.g., convergence insuf ficiency and intermittent but not constant strabismus). For these children, method of payment for VT sessions was recorded as an indication of their socio economic status. The children were classified either as having successfully completed VT or as having failed to complete VT due to noncompliance.
Results: There was no significant correlation between whether or not the child successfully completed VT and payment type (Medicaid versus self-pay/commercial insurance) (p=0.54). There also was no significant influence of gender of the children on success of VT (p=0.16). However, the older (ages 10-17 years) children were more likely to succeed in VT compared to the younger (ages 6-9 years) children (p = 0.03).
Discussion: Socioeconomic status indicated by payment type did not show an association with successfully completing VT for school-aged children in our clinic. Possible reasons for the older children having a greater VT completion rate include better understanding of procedures and ability to comply with home VT without parental assistance. Future studies could consider other variables such as household income to better predict socioeconomic status.
Poster Presentations, continued

90
Visit us at www.bernell.com to see our full line of products, which includes hundreds of items not found in our catalog! Note: Please ensure your Bernell online account is registered as a Healthcare Professional for full access to products and professional pricing. Email [email protected] for assistance.
Phone: 800-348-2225Fax: (574)259-2102 or 2103Online: www.bernell.com
Since 1954, we have proudly served the Behavioral Optometric community with the largest selection of Vision Therapy products in the world!
We carry a full line of:- VT Starter Kits- Accommodative Flippers- Anti-Suppression Training- Binocular Training- Cheiroscopic Training- Eye-Hand & Balance Training - Fixation & Fusion Training- Phy-Dip Training- Prisms - Vectograms & Tranaglyphs- and much more!!!
2015 Catalog is availableIf you have not received your copy yet, contact us [email protected] and we will send you a free copy.
Over 40 New Products Inside!
2609 Honolulu Avenue, Suite 203, Montrose, California 91020 • Toll-free: 877.248.3823 • www.expansionconsultants.com
Consulting services customized to your specific needs:
Specializing in Vision Therapy Practice Management, Marketing and Public Relations since 1988.
Practice GrowthProfessional Referrals
Patient Communications
Customized Brochures
Practice Newsletters
VT Marketing Systems
Easy-to-Present CE
Social Media Strategies
In-Office Digital Advertising
Case PresentationIncrease Case Acceptance
Effectively Explain the Diagnosis
Empower Your Patients to Get the Care They Need
Practice ManagementPractice Growth Strategies
Solutions to Staff Challenges
Management Tools to Create the Practice You’ve Always Wanted
Schedule your Free Initial Consultation to learn how we might help you with your unique situation. Call 877.248.3823 or email [email protected]
Streamline VT scheduling, session recording, reporting, and billing with Nu Squared Vision Therapy Software.
Completely manage your VT practice with one software.
Comprehensive Vision Therapy Software
Sign up for Nu Squared at the conference and save.
Get your COVD discount atwww.NuSquared.com/COVD
Attend our seminar for additional savings:
Saturday, April 18, 7 a.m.in DaVinci 1.
Special COVD Pricing
COVD PSAs Available in High DefinitionIt is our goal to reach the individuals who are struggling needlessly with undiagnosed
and untreated vision disorders that interfere with reading, learning, and other activities of daily living. Our HD PSAs cover a broad range of topics and are available in 30-second and 60-second prerecorded spots with captions available.
Please join our campaign by donating to COVD and airing these PSAs on your radio station or sharing them through social media.
• With a donation of $150.00 you can receive all 6 of our 30-second HD PSAs.
• With a donation of $350.00 you can receive all 7 of our 60-second HD PSAs.
• With a donation of $400.00 you can request ALL of our PSAs PLUS a DVD that plays the PSA videos on a loop to be used in waiting rooms and offices.
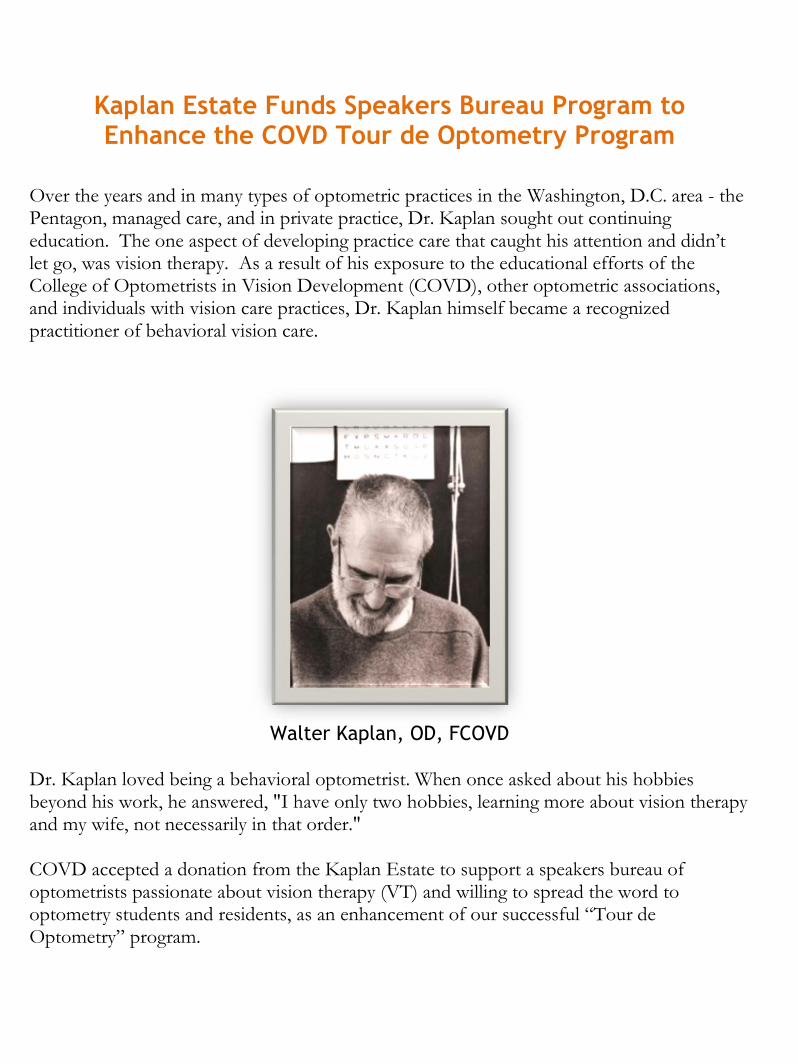
Kaplan Estate Funds Speakers Bureau Program to Enhance the COVD Tour de Optometry Program
Over the years and in many types of optometric practices in the Washington, D.C. area - the Pentagon, managed care, and in private practice, Dr. Kaplan sought out continuing education. The one aspect of developing practice care that caught his attention and didn’t let go, was vision therapy. As a result of his exposure to the educational efforts of the College of Optometrists in Vision Development (COVD), other optometric associations, and individuals with vision care practices, Dr. Kaplan himself became a recognized practitioner of behavioral vision care.
Walter Kaplan, OD, FCOVD
Dr. Kaplan loved being a behavioral optometrist. When once asked about his hobbies beyond his work, he answered, "I have only two hobbies, learning more about vision therapy and my wife, not necessarily in that order." COVD accepted a donation from the Kaplan Estate to support a speakers bureau of optometrists passionate about vision therapy (VT) and willing to spread the word to optometry students and residents, as an enhancement of our successful “Tour de Optometry” program. "Dr. Kaplan was an active COVD Fellow member and we are honored that his family wanted to give back to the specialty that is in such great need of more private practice VT optometrists. There is a growing demand for VT and COVD is doing its best to increase the number of certified optometrists to fill the demand,” said President, Ida Chung, OD, FCOVD.

april 2015COVD 45Th annual meeTingApril 14-18, 2015The BellagioLas Vegas, NevadaEvent Information
2015 Spring ConventionArkansas Optometric AssociationApril 23-26, 2015The Peabody, Little Rock, ArkansasVicki Farmer501/661-7675FAX: 501/[email protected]
MAY 2015COVD Applied Concepts Course: Vision Therapy 101Tom Headline, COVTMay 12-13, 2015 Manila, PhilippinesEvent Information
IV International CongressSIODEC (International Society for Developmental and Behavioral Optometry) May 14-17th, 2015Palacio de Congresos de GijónGijón, Asturias, SpainEvent InformationRegistration Information
24th Annual NORA Multi-Disciplinary ConferenceMay 14-17, 2015Renaissance Denver HotelDenver, ColoradoEvent Information
JUNE 2015COVD Critical Concepts Course: Theory and Methods of Vision Therapy Part I Dr. Angela PeddleJune 5-6, 2015Calgary, Alberta, CanadaEvent Information
JULY 2015Global Summit on Innovations in Health and Intellectual and Developmental Disabilities (IDD)AADMD (American Academy of Developmental Medicine and Dentistry)July 27-29, 2015Los Angeles, CaliforniaEvent Information
C A L E N D A R O F E V E N T S
College of Optometrists in Vision Development 215W.GarfieldRoad•Suite200•Aurora,OH44202330.995.0718(voice)•330.995.0719(fax)[email protected] • www.covd.org