Embed Size (px)
Citation preview
Journal of Theoretical Biology 452 (2018) 56–68
Contents lists available at ScienceDirect
Journal of Theoretical Biology
journal homepage: www.elsevier.com/locate/jtbi
Modeling triple-negative breast cancer heterogeneity: Effects of
stromal macrophages, fibroblasts and tumor vasculature
Kerri-Ann Norton
a , ∗, Kideok Jin
a , c , Aleksander S. Popel a , b
a Department of Biomedical Engineering b Department of Oncology and the Sidney Kimmel Comprehensive Cancer Center, School of Medicine, Johns Hopkins University, USA c Department of Pharmaceutical Science, Albany College of Pharmacy and Health Science, USA
a r t i c l e i n f o
Article history:
Received 6 December 2017
Revised 13 April 2018
Accepted 3 May 2018
Available online 8 May 2018
Keywords:
Tumor
Microenvironment
Immune cells
Angiogenesis
Cancer stem cells
Hypoxia
a b s t r a c t
A hallmark of breast tumors is its spatial heterogeneity that includes its distribution of cancer stem cells
and progenitor cells, but also heterogeneity in the tumor microenvironment. In this study we focus on
the contributions of stromal cells, specifically macrophages, fibroblasts, and endothelial cells on tumor
progression. We develop a computational model of triple-negative breast cancer based on our previ-
ous work and expand it to include macrophage infiltration, fibroblasts, and angiogenesis. In vitro studies
have shown that the secretomes of tumor-educated macrophages and fibroblasts increase both the migra-
tion and proliferation rates of triple-negative breast cancer cells. In vivo studies also demonstrated that
blocking signaling of selected secreted factors inhibits tumor growth and metastasis in mouse xenograft
models. We investigate the influences of increased migration and proliferation rates on tumor growth,
the effect of the presence on fibroblasts or macrophages on growth and morphology, and the contri-
butions of macrophage infiltration on tumor growth. We find that while the presence of macrophages
increases overall tumor growth, the increase in macrophage infiltration does not substantially increase
tumor growth and can even stifle tumor growth at excessive rates.
© 2018 Elsevier Ltd. All rights reserved.
t
i
c
c
c
c
T
s
e
m
h
(
e
n
l
i
f
1
1. Introduction
Tumor-associated macrophages (TAMs) play a significant role
in breast cancer growth, invasion, and metastasis ( Condeelis and
Pollard, 2006 ). TAMs are involved in a range of processes that
affect cancer growth, such as regulating angiogenesis ( Junttila
and de Sauvage, 2013; Lewis et al., 1995; Leek et al., 1996 ),
inflammation ( Solinas et al., 2009; Qian et al., 2015; Comito
et al., 2014 ), and therapy resistance ( Straussman et al., 2012 ).
Macrophage colony-stimulating factor 1 (CSF1) secreted by breast
cancer cells is a major factor for macrophage recruitment into
the tumor ( Chaturvedi et al., 2014 ). Hypoxia was found to stimu-
late macrophage recruitment in MDA-MB-231 (MB231 for brevity)
cells through signaling loops between the MB231 cells and
macrophages leading to macrophage recruitment ( Semenza, 1863 ).
Once macrophages are recruited to the breast tumor, they are in-
fluenced by breast cancer secreted factors. Triple-negative breast
cancer cells secrete factors, such as C
–C motif chemokine ligand 2
(CCL2), that differentiate recruited macrophages from immune sys-
∗ Corresponding author. Present address: Computer Science Program, Department
of Science, Mathematics, and Computing, Bard College, Annandale-on-Hudson, NY
12504, USA.
E-mail address: [email protected] (K.-A. Norton).
e
(
(
b
t
https://doi.org/10.1016/j.jtbi.2018.05.003
0022-5193/© 2018 Elsevier Ltd. All rights reserved.
em enhancing M1-like macrophages ( Hollmén et al., 2015 ), into
mmunosuppressive M2-like macrophages ( Sousa et al., 2015 ). This
onversion from M1-like to M2-like is often mediated by hypoxic
ancer cells ( Tripathi et al., 2014 ). High levels of macrophage re-
ruitment in triple-negative breast cancer are associated with in-
reased metastasis and lower overall survival ( Yuan et al., 2014 ).
AM populations are also involved in mediating tumor cell extrava-
ation and intravasation ( Qian et al., 2009; Su et al., 2014; Chen
t al., 2011; Dovas et al., 2013; Pignatelli et al., 2016 ) . Due to their
any roles in cancer progression and metastasis, several papers
ave investigated their use as prognostic or diagnostic biomarkers
Tang, 2013; Mahmoud et al., 2012; Sparano et al., 2016 ). The influ-
nce of macrophages on tumor growth is a complex process that
eeds to be better understood.
Fibroblasts are part of the connective tissue, secrete extracel-
ular matrix (ECM) and also play a large role in wound heal-
ng ( Darby et al., 2014 ). Cancer associated fibroblasts (CAFs) are
ound in many different types of cancer ( Rønnov-Jessen et al.,
995 ), including breast ( Takai et al., 2016 ), pancreatic ( Sugimoto
t al., 2006 ), prostate ( Comito et al., 2014 ), and ovarian cancer
Corvigno et al., 2016 ) and are associated with poor prognosis
Korkaya et al., 2011 ). One of the prominent effects of CAFs in
reast cancer is that they cause the epithelial-to-mesenchymal
ransition to a more invasive type cancer cell through the trans-
K.-A. Norton et al. / Journal of Theoretical Biology 452 (2018) 56–68 57
f
2
l
i
e
t
l
m
b
t
(
i
p
t
2
2
b
b
i
g
c
m
d
s
s
a
m
A
o
o
e
m
m
s
n
M
p
e
A
c
(
b
a
e
a
i
p
v
p
e
p
w
l
c
o
a
o
e
s
v
d
w
l
h
g
2
b
f
a
s
c
A
c
s
t
d
t
o
(
i
i
2
w
(
l
g
c
h
t
a
m
a
g
c
c
c
d
P
b
i
i
t
a
e
f
m
c
2
m
c
a
m
p
b
t
m
v
p
a
l
c
2
2
n
orming growth factor beta (TGF- β) pathway ( Bhowmick et al.,
004; Yu et al., 2014; Zeisberg et al., 2007 ). CAFs display higher
evels of ECM secretions and are involved in ECM remodeling, lead-
ng to increased deposition of ECM ( Bochet et al., 2013; Gilkes
t al., 2014 ). CAFs are activated by breast cancer secreted fac-
ors such as interleukin 6 (IL6), TGF- β , and CXC-motif chemokine
igand 12 (CXCL12) ( Mao et al., 2013 ). CAFs can promote tu-
or growth through stromal-cell derived factor 1 (SDF-1) which
inds to CXCR4 receptors and stimulates tumor cell prolifera-
ion ( Diao et al., 2016 ). CAFs also secrete several metalloproteases
MMPs) that degrade the extracellular matrix (ECM) and allow for
ncreased cancer cell migration ( Luo et al., 2014 ). There is a com-
lex interplay between heterogenous CAFs and breast cancer cells
hat have numerous effects on cancer progression ( Bauer et al.,
010; Peng et al., 2013; Orimo and Weinberg, 2007; Ishii et al.,
016 ). Thus, stromal cells are an important aspect that needs to
e included in computational models of tumor growth.
While macrophages and fibroblasts are important aspects of
reast tumor growth, there are few computational models that
nvestigate their contribution. One notable model that investi-
ated macrophages was Knutsdottir et al. which examined the
ontributions of macrophages in a 3D agent-based model of tu-
or growth ( Knutsdottir et al., 2016 ). They incorporated epi-
ermal growth factor (EGF)/CSF-1 paracrine signaling using a
ystem of differential equations; they showed how paracrine
ignaling is necessary for the co-migration of macrophages
nd tumor cells ( Knutsdottir et al., 2016 ). They found that
acrophages contributed to cancer cell motility and invasion.
n earlier paper developed a continuous and discrete 2D model
f macrophage/tumor signaling ( Knútsdóttir et al., 2014 ). An-
ther agent-based model examined the transition from immune-
nhancing to immuno-suppressive macrophages within the tu-
or environment ( Wells et al., 2015 ). They included M1 and M2
acrophage states with M1 macrophages secreting tumor lethality
ignals and converting to an M2 state with exposure to M2 sig-
als (M2S). All macrophages migrate by chemotaxis towards the
2S gradient. They included non-evolving tumor vasculature and
roliferating but non-migrating tumor cells. They then predicted
ngineered cell-based therapies based on their modeling results.
different multiscale model of tumor growth included geneti-
ally engineered macrophages as a delivery tool for therapeutics
Owen et al., 2011 ). Owen and Sharrot modeled the interactions
etween macrophages and tumors as an immune response ( Owen
nd Sherratt, 1998, 1997 ). A model based on partial differential
quations (PDE) investigated the cell cycle in normal fibroblasts
nd in cancer cells ( Alarcón et al., 2004 ). Another PDE-based model
nvestigated fibroblast secretion of EGF and its influence on tumor
rogression ( Kim and Friedman, 2010 ). An agent-based model in-
estigated the effects of macrophages on angiogenesis using Com-
uCell3D software platform and found that macrophages facilitated
ndothelial tip cell bridging ( Kleinstreuer et al., 2013 ). These im-
ortant studies provide a background for the present study where
e investigate the combined interactions of macrophages, fibrob-
asts, and angiogenesis on tumor growth and morphology.
Another important aspect of the host stroma is the tumor vas-
ulature. In order for tumors to grow past the diffusion limit of
xygen, they need to recruit new blood vessels in a process called
ngiogenesis ( Folkman, 1996 ). Briefly, when tumor cells are in low
xygen environments they become hypoxic and secrete vascular
ndothelial growth factors (VEGF) ( Ferrara, 2002 ). This initiates
prouting angiogenesis where a branch forms off a mature blood
essel headed by a tip cell, which migrates along the VEGF gra-
ient towards higher VEGF; the tip cell is followed by stalk cells
hich proliferate to extend the sprout ( Hellström et al., 2007 ) fol-
owed by quiescent phalanx cells that support the sprout. There
as been a large body of mathematical models investigating an-
iogenesis across different scales, for reviews see ( Scianna et al.,
013; Perfahl et al., 2017 ). Here we focus on models that com-
ine angiogenesis with tumor development and their interactions,
or a review see ( Oden et al., 2016 ). Stephanou et al. developed
2D on-lattice agent-based model of tumor-induced angiogene-
is with a dorsal skinfold chamber and investigated how vascular
hanges could lead to tumor dormancy ( Stéphanou et al., 2017 ).
nother 2D cellular automata model investigated radiation effi-
acy in a hybrid model combining tumor growth and angiogene-
is ( Scott et al., 2016 ). Frieboes et al. have developed models of
umor induced angiogenesis to assess the efficacy of nanoparticle
rug delivery on tumor regression ( Curtis and Frieboes, 2016; Cur-
is et al., 2015 ). 3D models have investigated the interplay between
xygen and VEGF secretion levels on tumor and vascular growth
Bloch and Harel, 2016 ). Earlier 3D models have investigated the
nterplay between tumor growth and angiogenesis using an exper-
mentally derived vasculature ( Alarcón et al., 2004; Perfahl et al.,
011 ) and analyzed the changes in the morphology of the tumor
ith angiogenesis from spherical to cylindrical to paddle-shaped
Shirinifard et al., 2009 ). Another 3D mathematical model simu-
ated the effects of an anti-angiogenic agent, endostatin, on tumor
rowth and angiogenesis ( Cai et al., 2016 ). A hybrid model of can-
er cell growth looked at the interplay between stalk cells, tip cells,
ealthy cells, and cancer cells and the several factors contributing
o the cell growth, such as oxygen, glucose, VEGF, and the EGFR
nd TGF signaling pathways ( Zangooei and Habibi, 2017 ). These
odels investigated the interplay between blood vessel growth
nd tumor expansion and are the basis for our agent-based an-
iogenesis model which includes the interplay between endothelial
ells and macrophages and fibroblasts.
Our laboratory has been building multiscale models of can-
er including the interactions between tumor cells, tumor vas-
ulature, fibroblasts and immune cells. Agent-based models were
eveloped examining tumor-associated angiogenesis ( Norton and
opel, 2016 ), cancer stem cells and CCR5 + cells in triple-negative
reast cancer ( Norton and Popel, 2014; Norton et al., 2017 ) and
mmuno-infiltrates in tumors ( Gong et al., 2017 ). Receptor-ligand
nteractions and intracellular signaling models have been used
o study the dynamics of VEGF and thrombospondin (TSP) lig-
nds and their receptors and their effects on angiogenesis ( Bazzazi
t al., 2017; Bazzazi and Popel, 2017 ). Our laboratory has also
ound experimentally that macrophages and fibroblasts in the tu-
or microenvironment (TME) increase triple-negative breast can-
er (TNBC) cells proliferation and migration in vitro ( Jin et al.,
017 ).
There is a complex crosstalk between immune cells such a
acrophages and tumor vasculature ( Huang et al., 2011 ), that
an promote or hinder cancer development. Combination anti-
ngiogenic therapies and immunotherapies are now in develop-
ent ( Ramjiawan et al., 2017 ). In this work, we develop a com-
utational agent-based model which combines a triple-negative
reast cancer model with an angiogenesis model and investigates
he contributions of cancer-associated stromal cells to the develop-
ent of triple-negative breast cancer. The model combines a de-
eloping breast tumor, tumor vasculature which responds to hy-
oxic cancer cells and develops through sprouting angiogenesis,
nd considers monocyte recruitment through the evolving vascu-
ature that differentiate into macrophages in the tissue, as well as
ancer-associated fibroblasts.
. Methods
.1. Computational
This study develops an agent-based model of triple-
egative breast cancer growth based on our previous studies
58 K.-A. Norton et al. / Journal of Theoretical Biology 452 (2018) 56–68
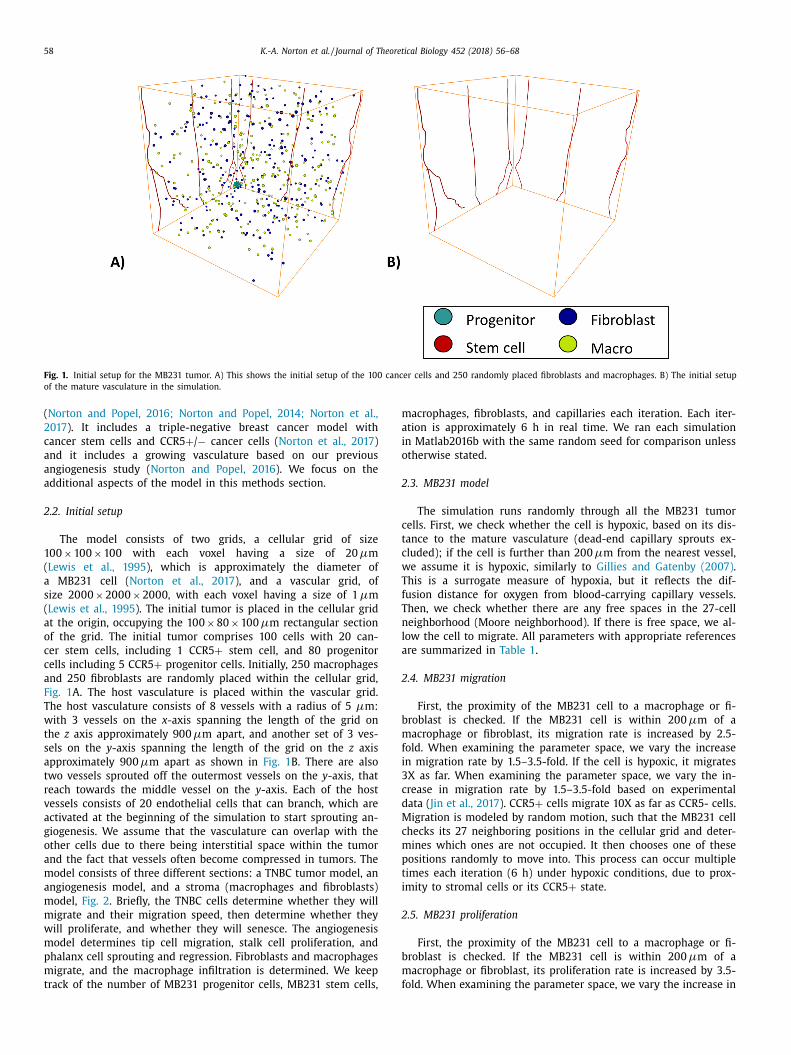
Fig. 1. Initial setup for the MB231 tumor. A) This shows the initial setup of the 100 cancer cells and 250 randomly placed fibroblasts and macrophages. B) The initial setup
of the mature vasculature in the simulation.
m
a
i
o
2
c
t
c
w
T
f
T
n
l
a
2
b
m
f
i
3
c
d
M
c
m
p
t
i
2
b
m
f
( Norton and Popel, 2016; Norton and Popel, 2014; Norton et al.,
2017 ). It includes a triple-negative breast cancer model with
cancer stem cells and CCR5 + / − cancer cells ( Norton et al., 2017 )
and it includes a growing vasculature based on our previous
angiogenesis study ( Norton and Popel, 2016 ). We focus on the
additional aspects of the model in this methods section.
2.2. Initial setup
The model consists of two grids, a cellular grid of size
100 × 100 × 100 with each voxel having a size of 20 μm
( Lewis et al., 1995 ), which is approximately the diameter of
a MB231 cell ( Norton et al., 2017 ), and a vascular grid, of
size 20 0 0 × 20 0 0 × 20 0 0, with each voxel having a size of 1 μm
( Lewis et al., 1995 ). The initial tumor is placed in the cellular grid
at the origin, occupying the 100 × 80 × 100 μm rectangular section
of the grid. The initial tumor comprises 100 cells with 20 can-
cer stem cells, including 1 CCR5 + stem cell, and 80 progenitor
cells including 5 CCR5 + progenitor cells. Initially, 250 macrophages
and 250 fibroblasts are randomly placed within the cellular grid,
Fig. 1 A. The host vasculature is placed within the vascular grid.
The host vasculature consists of 8 vessels with a radius of 5 μm:
with 3 vessels on the x -axis spanning the length of the grid on
the z axis approximately 900 μm apart, and another set of 3 ves-
sels on the y -axis spanning the length of the grid on the z axis
approximately 900 μm apart as shown in Fig. 1 B. There are also
two vessels sprouted off the outermost vessels on the y -axis, that
reach towards the middle vessel on the y -axis. Each of the host
vessels consists of 20 endothelial cells that can branch, which are
activated at the beginning of the simulation to start sprouting an-
giogenesis. We assume that the vasculature can overlap with the
other cells due to there being interstitial space within the tumor
and the fact that vessels often become compressed in tumors. The
model consists of three different sections: a TNBC tumor model, an
angiogenesis model, and a stroma (macrophages and fibroblasts)
model, Fig. 2 . Briefly, the TNBC cells determine whether they will
migrate and their migration speed, then determine whether they
will proliferate, and whether they will senesce. The angiogenesis
model determines tip cell migration, stalk cell proliferation, and
phalanx cell sprouting and regression. Fibroblasts and macrophages
migrate, and the macrophage infiltration is determined. We keep
track of the number of MB231 progenitor cells, MB231 stem cells,
acrophages, fibroblasts, and capillaries each iteration. Each iter-
tion is approximately 6 h in real time. We ran each simulation
n Matlab2016b with the same random seed for comparison unless
therwise stated.
.3. MB231 model
The simulation runs randomly through all the MB231 tumor
ells. First, we check whether the cell is hypoxic, based on its dis-
ance to the mature vasculature (dead-end capillary sprouts ex-
luded); if the cell is further than 200 μm from the nearest vessel,
e assume it is hypoxic, similarly to Gillies and Gatenby (2007) .
his is a surrogate measure of hypoxia, but it reflects the dif-
usion distance for oxygen from blood-carrying capillary vessels.
hen, we check whether there are any free spaces in the 27-cell
eighborhood (Moore neighborhood). If there is free space, we al-
ow the cell to migrate. All parameters with appropriate references
re summarized in Table 1 .
.4. MB231 migration
First, the proximity of the MB231 cell to a macrophage or fi-
roblast is checked. If the MB231 cell is within 200 μm of a
acrophage or fibroblast, its migration rate is increased by 2.5-
old. When examining the parameter space, we vary the increase
n migration rate by 1.5–3.5-fold. If the cell is hypoxic, it migrates
X as far. When examining the parameter space, we vary the in-
rease in migration rate by 1.5–3.5-fold based on experimental
ata ( Jin et al., 2017 ). CCR5 + cells migrate 10X as far as CCR5- cells.
igration is modeled by random motion, such that the MB231 cell
hecks its 27 neighboring positions in the cellular grid and deter-
ines which ones are not occupied. It then chooses one of these
ositions randomly to move into. This process can occur multiple
imes each iteration (6 h) under hypoxic conditions, due to prox-
mity to stromal cells or its CCR5 + state.
.5. MB231 proliferation
First, the proximity of the MB231 cell to a macrophage or fi-
roblast is checked. If the MB231 cell is within 200 μm of a
acrophage or fibroblast, its proliferation rate is increased by 3.5-
old. When examining the parameter space, we vary the increase in
K.-A. Norton et al. / Journal of Theoretical Biology 452 (2018) 56–68 59
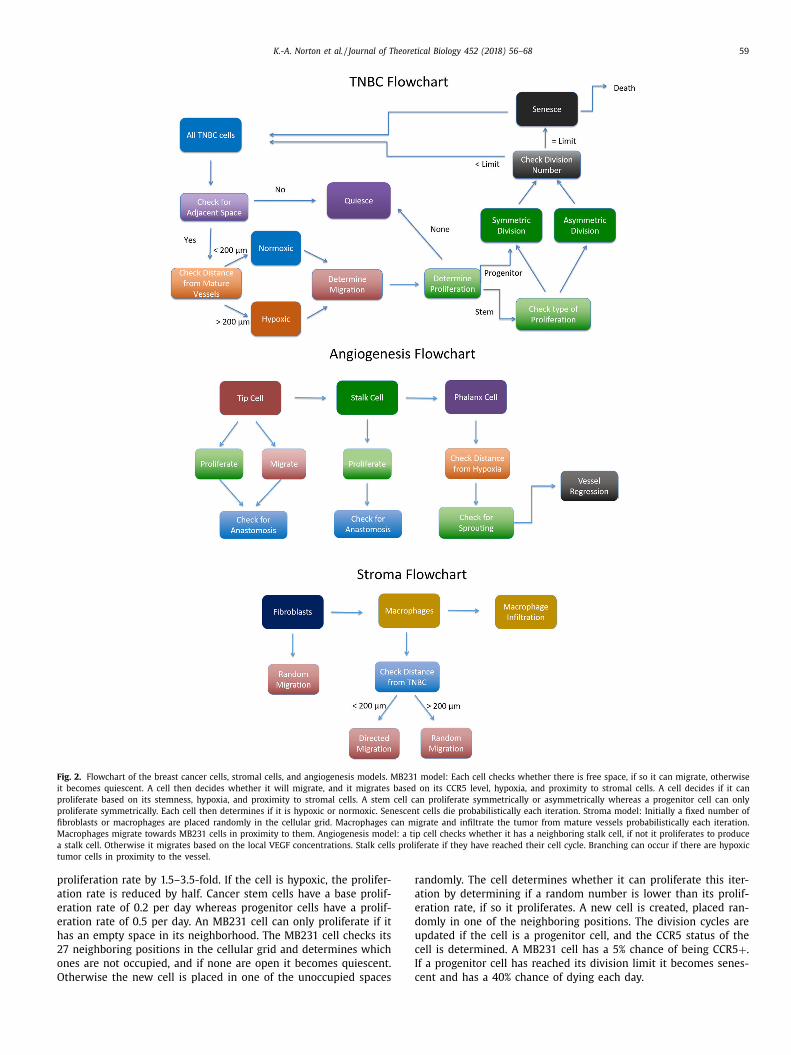
Fig. 2. Flowchart of the breast cancer cells, stromal cells, and angiogenesis models. MB231 model: Each cell checks whether there is free space, if so it can migrate, otherwise
it becomes quiescent. A cell then decides whether it will migrate, and it migrates based on its CCR5 level, hypoxia, and proximity to stromal cells. A cell decides if it can
proliferate based on its stemness, hypoxia, and proximity to stromal cells. A stem cell can proliferate symmetrically or asymmetrically whereas a progenitor cell can only
proliferate symmetrically. Each cell then determines if it is hypoxic or normoxic. Senescent cells die probabilistically each iteration. Stroma model: Initially a fixed number of
fibroblasts or macrophages are placed randomly in the cellular grid. Macrophages can migrate and infiltrate the tumor from mature vessels probabilistically each iteration.
Macrophages migrate towards MB231 cells in proximity to them. Angiogenesis model: a tip cell checks whether it has a neighboring stalk cell, if not it proliferates to produce
a stalk cell. Otherwise it migrates based on the local VEGF concentrations. Stalk cells proliferate if they have reached their cell cycle. Branching can occur if there are hypoxic
tumor cells in proximity to the vessel.
p
a
e
e
h
2
o
O
r
a
e
d
u
c
I
cent and has a 40% chance of dying each day.
roliferation rate by 1.5–3.5-fold. If the cell is hypoxic, the prolifer-
tion rate is reduced by half. Cancer stem cells have a base prolif-
ration rate of 0.2 per day whereas progenitor cells have a prolif-
ration rate of 0.5 per day. An MB231 cell can only proliferate if it
as an empty space in its neighborhood. The MB231 cell checks its
7 neighboring positions in the cellular grid and determines which
nes are not occupied, and if none are open it becomes quiescent.
therwise the new cell is placed in one of the unoccupied spaces
andomly. The cell determines whether it can proliferate this iter-
tion by determining if a random number is lower than its prolif-
ration rate, if so it proliferates. A new cell is created, placed ran-
omly in one of the neighboring positions. The division cycles are
pdated if the cell is a progenitor cell, and the CCR5 status of the
ell is determined. A MB231 cell has a 5% chance of being CCR5 + .
f a progenitor cell has reached its division limit it becomes senes-
60 K.-A. Norton et al. / Journal of Theoretical Biology 452 (2018) 56–68
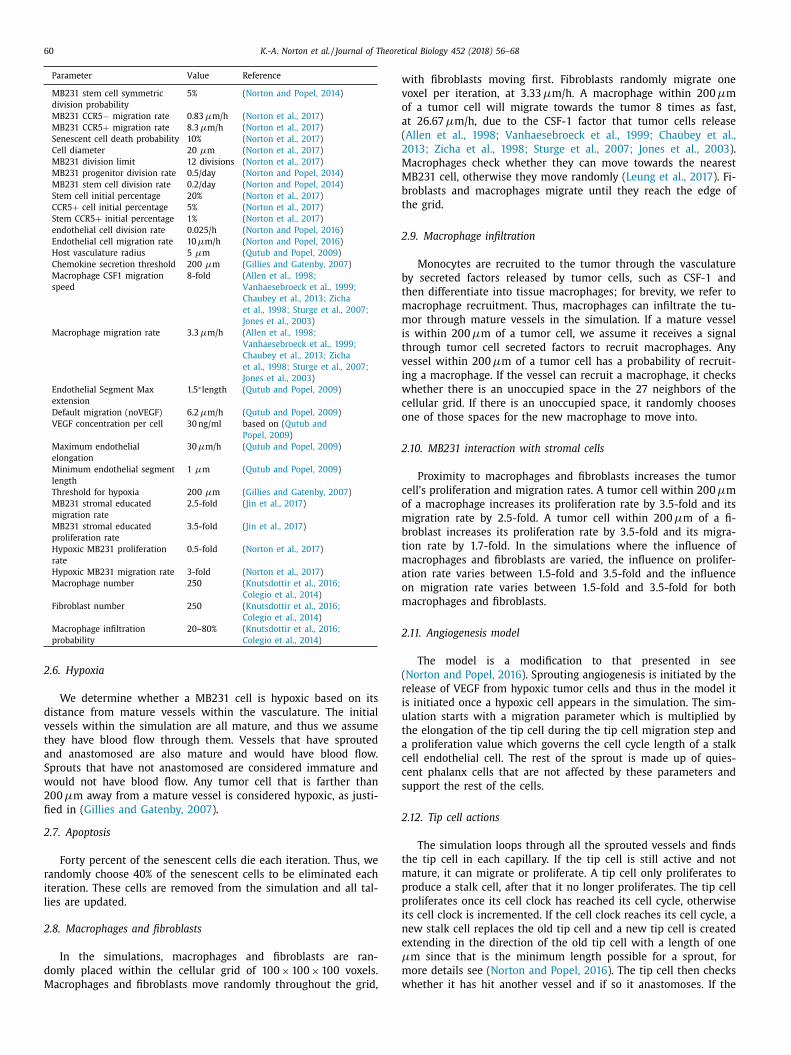
Parameter Value Reference
MB231 stem cell symmetric
division probability
5% ( Norton and Popel, 2014 )
MB231 CCR5 − migration rate 0.83 μm/h ( Norton et al., 2017 )
MB231 CCR5 + migration rate 8.3 μm/h ( Norton et al., 2017 )
Senescent cell death probability 10% ( Norton et al., 2017 )
Cell diameter 20 μm ( Norton et al., 2017 )
MB231 division limit 12 divisions ( Norton et al., 2017 )
MB231 progenitor division rate 0.5/day ( Norton and Popel, 2014 )
MB231 stem cell division rate 0.2/day ( Norton and Popel, 2014 )
Stem cell initial percentage 20% ( Norton et al., 2017 )
CCR5 + cell initial percentage 5% ( Norton et al., 2017 )
Stem CCR5 + initial percentage 1% ( Norton et al., 2017 )
endothelial cell division rate 0.025/h ( Norton and Popel, 2016 )
Endothelial cell migration rate 10 μm/h ( Norton and Popel, 2016 )
Host vasculature radius 5 μm ( Qutub and Popel, 2009 )
Chemokine secretion threshold 200 μm ( Gillies and Gatenby, 2007 )
Macrophage CSF1 migration
speed
8-fold ( Allen et al., 1998;
Vanhaesebroeck et al., 1999;
Chaubey et al., 2013; Zicha
et al., 1998; Sturge et al., 2007;
Jones et al., 2003 )
Macrophage migration rate 3.3 μm/h ( Allen et al., 1998;
Vanhaesebroeck et al., 1999;
Chaubey et al., 2013; Zicha
et al., 1998; Sturge et al., 2007;
Jones et al., 2003 )
Endothelial Segment Max
extension
1.5 ∗length ( Qutub and Popel, 2009 )
Default migration (noVEGF) 6.2 μm/h ( Qutub and Popel, 2009 )
VEGF concentration per cell 30 ng/ml based on ( Qutub and
Popel, 2009 )
Maximum endothelial
elongation
30 μm/h ( Qutub and Popel, 2009 )
Minimum endothelial segment
length
1 μm ( Qutub and Popel, 2009 )
Threshold for hypoxia 200 μm ( Gillies and Gatenby, 2007 )
MB231 stromal educated
migration rate
2.5-fold ( Jin et al., 2017 )
MB231 stromal educated
proliferation rate
3.5-fold ( Jin et al., 2017 )
Hypoxic MB231 proliferation
rate
0.5-fold ( Norton et al., 2017 )
Hypoxic MB231 migration rate 3-fold ( Norton et al., 2017 )
Macrophage number 250 ( Knutsdottir et al., 2016;
Colegio et al., 2014 )
Fibroblast number 250 ( Knutsdottir et al., 2016;
Colegio et al., 2014 )
Macrophage infiltration
probability
20–80% ( Knutsdottir et al., 2016;
Colegio et al., 2014 )
w
v
o
a
(
2
M
M
b
t
2
b
t
m
m
i
t
v
i
w
c
o
2
c
o
m
b
t
m
a
o
m
2
(
r
i
u
t
a
c
c
s
2
t
m
p
p
i
n
e
μ
m
w
2.6. Hypoxia
We determine whether a MB231 cell is hypoxic based on its
distance from mature vessels within the vasculature. The initial
vessels within the simulation are all mature, and thus we assume
they have blood flow through them. Vessels that have sprouted
and anastomosed are also mature and would have blood flow.
Sprouts that have not anastomosed are considered immature and
would not have blood flow. Any tumor cell that is farther than
200 μm away from a mature vessel is considered hypoxic, as justi-
fied in ( Gillies and Gatenby, 2007 ).
2.7. Apoptosis
Forty percent of the senescent cells die each iteration. Thus, we
randomly choose 40% of the senescent cells to be eliminated each
iteration. These cells are removed from the simulation and all tal-
lies are updated.
2.8. Macrophages and fibroblasts
In the simulations, macrophages and fibroblasts are ran-
domly placed within the cellular grid of 100 × 100 × 100 voxels.
Macrophages and fibroblasts move randomly throughout the grid,
ith fibroblasts moving first. Fibroblasts randomly migrate one
oxel per iteration, at 3.33 μm/h. A macrophage within 200 μm
f a tumor cell will migrate towards the tumor 8 times as fast,
t 26.67 μm/h, due to the CSF-1 factor that tumor cells release
Allen et al., 1998; Vanhaesebroeck et al., 1999; Chaubey et al.,
013; Zicha et al., 1998; Sturge et al., 2007; Jones et al., 2003 ).
acrophages check whether they can move towards the nearest
B231 cell, otherwise they move randomly ( Leung et al., 2017 ). Fi-
roblasts and macrophages migrate until they reach the edge of
he grid.
.9. Macrophage infiltration
Monocytes are recruited to the tumor through the vasculature
y secreted factors released by tumor cells, such as CSF-1 and
hen differentiate into tissue macrophages; for brevity, we refer to
acrophage recruitment. Thus, macrophages can infiltrate the tu-
or through mature vessels in the simulation. If a mature vessel
s within 200 μm of a tumor cell, we assume it receives a signal
hrough tumor cell secreted factors to recruit macrophages. Any
essel within 200 μm of a tumor cell has a probability of recruit-
ng a macrophage. If the vessel can recruit a macrophage, it checks
hether there is an unoccupied space in the 27 neighbors of the
ellular grid. If there is an unoccupied space, it randomly chooses
ne of those spaces for the new macrophage to move into.
.10. MB231 interaction with stromal cells
Proximity to macrophages and fibroblasts increases the tumor
ell’s proliferation and migration rates. A tumor cell within 200 μm
f a macrophage increases its proliferation rate by 3.5-fold and its
igration rate by 2.5-fold. A tumor cell within 200 μm of a fi-
roblast increases its proliferation rate by 3.5-fold and its migra-
ion rate by 1.7-fold. In the simulations where the influence of
acrophages and fibroblasts are varied, the influence on prolifer-
tion rate varies between 1.5-fold and 3.5-fold and the influence
n migration rate varies between 1.5-fold and 3.5-fold for both
acrophages and fibroblasts.
.11. Angiogenesis model
The model is a modification to that presented in see
Norton and Popel, 2016 ). Sprouting angiogenesis is initiated by the
elease of VEGF from hypoxic tumor cells and thus in the model it
s initiated once a hypoxic cell appears in the simulation. The sim-
lation starts with a migration parameter which is multiplied by
he elongation of the tip cell during the tip cell migration step and
proliferation value which governs the cell cycle length of a stalk
ell endothelial cell. The rest of the sprout is made up of quies-
ent phalanx cells that are not affected by these parameters and
upport the rest of the cells.
.12. Tip cell actions
The simulation loops through all the sprouted vessels and finds
he tip cell in each capillary. If the tip cell is still active and not
ature, it can migrate or proliferate. A tip cell only proliferates to
roduce a stalk cell, after that it no longer proliferates. The tip cell
roliferates once its cell clock has reached its cell cycle, otherwise
ts cell clock is incremented. If the cell clock reaches its cell cycle, a
ew stalk cell replaces the old tip cell and a new tip cell is created
xtending in the direction of the old tip cell with a length of one
m since that is the minimum length possible for a sprout, for
ore details see ( Norton and Popel, 2016 ). The tip cell then checks
hether it has hit another vessel and if so it anastomoses. If the
K.-A. Norton et al. / Journal of Theoretical Biology 452 (2018) 56–68 61
t
l
o
o
t
t
w
v
c
w
t
d
d
M
a
c
c
t
c
e
f
g
m
2
t
c
c
p
P
p
t
i
a
c
v
2
l
l
a
t
P
a
o
3
e
w
s
i
P
n
s
3
3
I
c
(
t
n
M
m
B
1
(
3
i
i
b
5
t
t
f
a
V
3
m
2
u
t
t
t
l
s
“
“
t
c
t
0
i
b
t
t
t
s
c
l
d
4
4
i
s
m
m
d
b
s
t
i
i
v
t
ip cell leaves the grid, the capillary becomes mature and can no
onger migrate or proliferate.
The main function for a tip cell is to migrate in the direction
f VEGF gradients. The tip cell searches the 27 grid spaces near it
n the cell grid to find whether there are cells occupying any of
hose grid spaces. We assume that all cells produce approximately
he same amount of VEGF, resulting in a concentration 30 ng/ml
ithin their cellular grid space. This is based on the constant VEGF
alue of 20 ng/ml in ( Norton and Popel, 2016 ) considering tumors
ell death is around 40% of senescent cells, thus 30 ng/ml per cell
ould approximately result in between 12–30 ng/ml in a packed
umor. The tip cell finds the positions with cells near it and ran-
omly chooses to migrate towards one of these cells, such that is
oes not move backwards. The formula for elongation distance is
= T2[ VEGF ] + migNoVegfMatrix, where T2 and migNoVegfMatrix
re constants ( Qutub and Popel, 2009 ). VEGF concentration is cal-
ulated by searching the 27 grid spaces near the end of the tip
ell on the cell grid to find how many cells are occupying any of
hose grid spaces. We multiply the number of cells occupying the
ell grid by 30 ng/ml to find VEGF concentration. The cell cannot
longate greater than 1.5X of its current length nor can it migrate
arther than 60 μm ( Qutub and Popel, 2009 ). The cell does not mi-
rate if migration would cause it to leave the vascular grid. After
igration, the cell checks whether it anastomoses.
.13. Stalk cell actions
After tip cell actions, we find the adjacent stalk cell and de-
ermine whether it proliferates. The stalk cell proliferates once its
ell clock has reached its cell cycle, otherwise its cell clock is in-
remented. Only immature stalk cells proliferate, and they do not
roliferate if proliferating would make the tip cell leave the grid.
roliferation causes a new stalk cell to be produced, replacing the
revious tip cell location and a new tip cell is created extending in
he direction of the old tip cell with a length of one μm to initial-
ze the start of the sprout. The cell clock is reset after proliferation
nd the new cell is added to the capillary. The new tip cell then
hecks whether stalk cell proliferation has caused it to hit another
essel and if so it anastomoses.
.14. Branching
Only phalanx cells, those following the stalk or tip cell are al-
owed to branch. Branching is triggered by hypoxic cells, so a pha-
anx cell can only branch if one of its nodes is within 250 μm of
hypoxic MB231 cell ( Gillies and Gatenby, 2007 ). If these condi-
ions are met, it has a 20% probability to branch, see ( Norton and
opel, 2016 ). The phalanx cell finds the closest hypoxic MB231 cell
nd branches in that direction, specifically the new sprout’s sec-
nd node is equal to the second node of the phalanx cell plus
∗(normalized vector of the phalanx cell’s second node to the near-
st hypoxic cell). Branching only occurs if the resulting branch is
ithin the vascular grid boundary. We include vascular cell regres-
ion if the new branch is within 50 μm of a mature vessel, not
ncluding the parent vessels, for more information see ( Norton and
opel, 2016 ). Once branching occurs, a new tip cell is created, its
odes are updated, and it is given a new cycle length based on the
imulation proliferation value with random noise.
. Experimental
.1. Mouse xenografts
Animal protocols described in this study were approved by the
nstitutional Care and Use Committee at the Johns Hopkins Medi-
al Institutions. Before tumor cell inoculation, athymic nude mice
female, 5–6 weeks, 18–20 g) were pre-treated by injecting 50 μl
umor-conditioned media (TCM) of MDA-MB-231 cells subcuta-
eously for two weeks daily. After two weeks of induction, 2 × 10 6
DA-MB-231 cells were injected into the upper inguinal mam-
ary fat pad of the animals with 100 ul of 1:1 PBS/Matrigel (BD
iosciences, San Jose, CA). When tumors grow to approximately
.5 cm diameter, they will be excised for immunohistochemistry
IHC) analysis ( Jin et al., 2017 )).
.2. Immunohistochemistry analysis
Immunohistochemical analysis of Iba-1 was performed us-
ng monoclonal antibodies against Iba-1 (Ionized calcium bind-
ng adaptor molecule 1), a microglia/macrophage-specific calcium-
inding protein (Wako). For the IHC staining, after blocking with
% goat serum in PBST for 1 h at room temperature, the sec-
ions were treated with the Iba-1 antibody overnight at 4 °C, then
he peroxidase-conjugated streptavidin complex method was per-
ormed, followed by the 3, 3 ′ diaminobenzidine (DAB) procedure
ccording to manufacturer’s protocols (VECTASTAIN Elite ABC Kit,
ector Lab, Burlingame, CA) ( Jin et al., 2017 ).
.3. Image processing
To estimate the number of macrophages in the xenograft tu-
or sample, standard image processing in imageJ ( Schneider et al.,
012 ) was used. First, we binarized the image in the RGB channel,
sing threshold ranges of 104–154 in the red channel, 91–141 in
he green channel, and 95–150 in the blue channel to segment out
he areas stained brown, i.e. the macrophages. We then performed
he following morphological functions on the binarized image: “di-
ate” which increases the region to fill in any gaps due to incon-
istent staining, “fill holes” which fills in any holes in the region,
erode” which decreases the region back to its original size, and
convert to mask” which creates a mask which will be applied to
he original image to segment out the macrophages or tumor. To
ount the number of macrophages, we used the “mask” to remove
he tumor region and binarized the masked image using ranges of
–103 in the red channel, 0–122 in the green channel, and 55–193
n the blue channel to segment out the nuclei. We then dilated the
inarized image to seal any holes, used the watershed algorithm
o find individual nuclei and erode the binarized image to bring
he image back to its original size. Lastly, we analyzed particles
o count the number of nuclei that are greater than 100 pixels in
ize. The same algorithm was used on the masked tumor image to
alculate the number of tumor nuclei in the image. We then calcu-
ated the number of macrophages/ (macrophages + tumor cells) to
etermine the ratio of macrophages to total cells within the tumor.
. Results
.1. An agent-based model of triple-negative breast cancer stromal
nteractions
In Fig. 3 , we show an example of an in silico tumor progres-
ion from 25 days to 75 days. The top row shows the entire tu-
or progression with progenitor cells, stem cells, fibroblasts, and
acrophages. The middle row shows the progression with a re-
uced tumor cell size to show the interior of the tumor. The
ottom row shows tumor vasculature. In panel A the tumor has
tarted to grow but remains fairly solid with few extensions off
he tumor. There were many cells shed from the tumor but overall
t did not demonstrate any clear finger-like projections. In panel D,
t is clear that macrophages have started to infiltrate out of the
asculature close to the tumor; more accurately, monocytes ex-
ravasate from the vasculature and differentiate into macrophages.
62 K.-A. Norton et al. / Journal of Theoretical Biology 452 (2018) 56–68
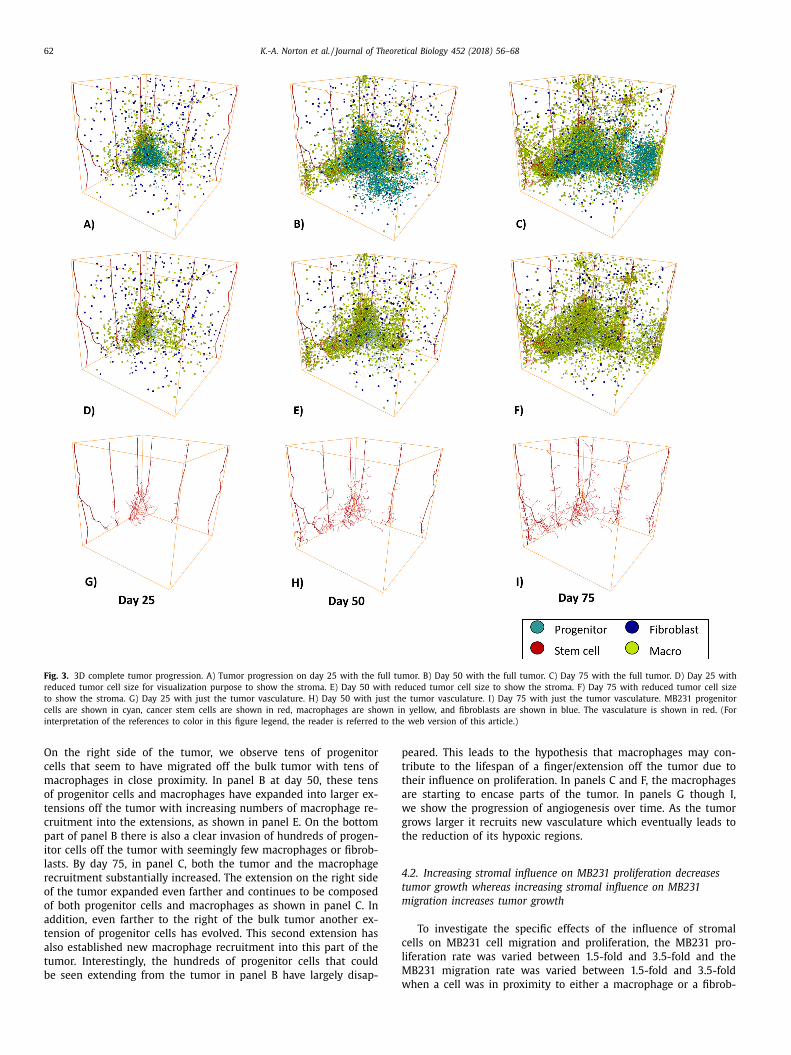
Fig. 3. 3D complete tumor progression. A) Tumor progression on day 25 with the full tumor. B) Day 50 with the full tumor. C) Day 75 with the full tumor. D) Day 25 with
reduced tumor cell size for visualization purpose to show the stroma. E) Day 50 with reduced tumor cell size to show the stroma. F) Day 75 with reduced tumor cell size
to show the stroma. G) Day 25 with just the tumor vasculature. H) Day 50 with just the tumor vasculature. I) Day 75 with just the tumor vasculature. MB231 progenitor
cells are shown in cyan, cancer stem cells are shown in red, macrophages are shown in yellow, and fibroblasts are shown in blue. The vasculature is shown in red. (For
interpretation of the references to color in this figure legend, the reader is referred to the web version of this article.)
p
t
t
a
w
g
t
4
t
m
c
l
M
On the right side of the tumor, we observe tens of progenitor
cells that seem to have migrated off the bulk tumor with tens of
macrophages in close proximity. In panel B at day 50, these tens
of progenitor cells and macrophages have expanded into larger ex-
tensions off the tumor with increasing numbers of macrophage re-
cruitment into the extensions, as shown in panel E. On the bottom
part of panel B there is also a clear invasion of hundreds of progen-
itor cells off the tumor with seemingly few macrophages or fibrob-
lasts. By day 75, in panel C, both the tumor and the macrophage
recruitment substantially increased. The extension on the right side
of the tumor expanded even farther and continues to be composed
of both progenitor cells and macrophages as shown in panel C. In
addition, even farther to the right of the bulk tumor another ex-
tension of progenitor cells has evolved. This second extension has
also established new macrophage recruitment into this part of the
tumor. Interestingly, the hundreds of progenitor cells that could
be seen extending from the tumor in panel B have largely disap-
weared. This leads to the hypothesis that macrophages may con-
ribute to the lifespan of a finger/extension off the tumor due to
heir influence on proliferation. In panels C and F, the macrophages
re starting to encase parts of the tumor. In panels G though I,
e show the progression of angiogenesis over time. As the tumor
rows larger it recruits new vasculature which eventually leads to
he reduction of its hypoxic regions.
.2. Increasing stromal influence on MB231 proliferation decreases
umor growth whereas increasing stromal influence on MB231
igration increases tumor growth
To investigate the specific effects of the influence of stromal
ells on MB231 cell migration and proliferation, the MB231 pro-
iferation rate was varied between 1.5-fold and 3.5-fold and the
B231 migration rate was varied between 1.5-fold and 3.5-fold
hen a cell was in proximity to either a macrophage or a fibrob-
K.-A. Norton et al. / Journal of Theoretical Biology 452 (2018) 56–68 63
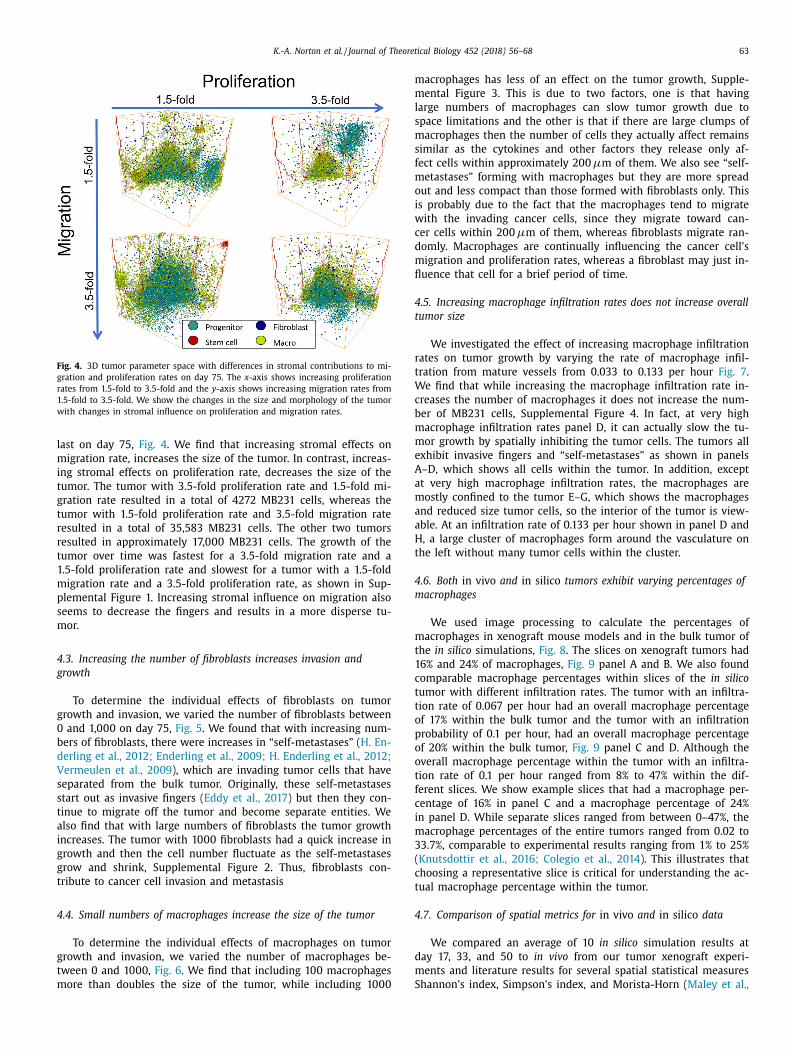
Fig. 4. 3D tumor parameter space with differences in stromal contributions to mi-
gration and proliferation rates on day 75. The x -axis shows increasing proliferation
rates from 1.5-fold to 3.5-fold and the y -axis shows increasing migration rates from
1.5-fold to 3.5-fold. We show the changes in the size and morphology of the tumor
with changes in stromal influence on proliferation and migration rates.
l
m
i
t
g
t
r
r
t
1
m
p
s
m
4
g
g
0
b
d
V
s
s
t
a
i
g
g
t
4
g
t
m
m
m
l
s
m
s
f
m
o
i
w
c
d
m
fl
4
t
r
t
W
c
b
m
m
e
A
a
m
a
a
H
t
4
m
m
t
1
c
t
t
o
p
o
o
t
f
c
i
m
3
(
c
t
4
d
m
S
ast on day 75, Fig. 4 . We find that increasing stromal effects on
igration rate, increases the size of the tumor. In contrast, increas-
ng stromal effects on proliferation rate, decreases the size of the
umor. The tumor with 3.5-fold proliferation rate and 1.5-fold mi-
ration rate resulted in a total of 4272 MB231 cells, whereas the
umor with 1.5-fold proliferation rate and 3.5-fold migration rate
esulted in a total of 35,583 MB231 cells. The other two tumors
esulted in approximately 17,0 0 0 MB231 cells. The growth of the
umor over time was fastest for a 3.5-fold migration rate and a
.5-fold proliferation rate and slowest for a tumor with a 1.5-fold
igration rate and a 3.5-fold proliferation rate, as shown in Sup-
lemental Figure 1. Increasing stromal influence on migration also
eems to decrease the fingers and results in a more disperse tu-
or.
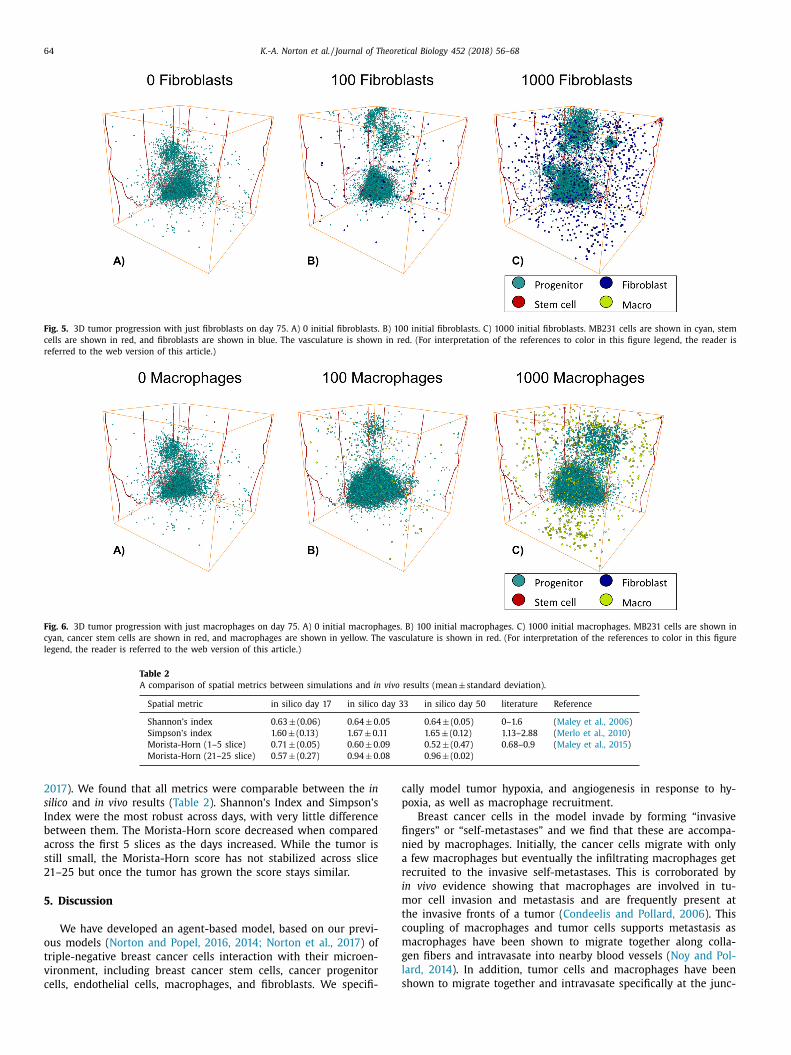
.3. Increasing the number of fibroblasts increases invasion and
rowth
To determine the individual effects of fibroblasts on tumor
rowth and invasion, we varied the number of fibroblasts between
and 1,0 0 0 on day 75, Fig. 5 . We found that with increasing num-
ers of fibroblasts, there were increases in “self-metastases” ( H. En-
erling et al., 2012; Enderling et al., 2009; H. Enderling et al., 2012;
ermeulen et al., 2009 ), which are invading tumor cells that have
eparated from the bulk tumor. Originally, these self-metastases
tart out as invasive fingers ( Eddy et al., 2017 ) but then they con-
inue to migrate off the tumor and become separate entities. We
lso find that with large numbers of fibroblasts the tumor growth
ncreases. The tumor with 10 0 0 fibroblasts had a quick increase in
rowth and then the cell number fluctuate as the self-metastases
row and shrink, Supplemental Figure 2. Thus, fibroblasts con-
ribute to cancer cell invasion and metastasis
.4. Small numbers of macrophages increase the size of the tumor
To determine the individual effects of macrophages on tumor
rowth and invasion, we varied the number of macrophages be-
ween 0 and 10 0 0, Fig. 6 . We find that including 100 macrophages
ore than doubles the size of the tumor, while including 10 0 0
acrophages has less of an effect on the tumor growth, Supple-
ental Figure 3. This is due to two factors, one is that having
arge numbers of macrophages can slow tumor growth due to
pace limitations and the other is that if there are large clumps of
acrophages then the number of cells they actually affect remains
imilar as the cytokines and other factors they release only af-
ect cells within approximately 200 μm of them. We also see “self-
etastases” forming with macrophages but they are more spread
ut and less compact than those formed with fibroblasts only. This
s probably due to the fact that the macrophages tend to migrate
ith the invading cancer cells, since they migrate toward can-
er cells within 200 μm of them, whereas fibroblasts migrate ran-
omly. Macrophages are continually influencing the cancer cell’s
igration and proliferation rates, whereas a fibroblast may just in-
uence that cell for a brief period of time.
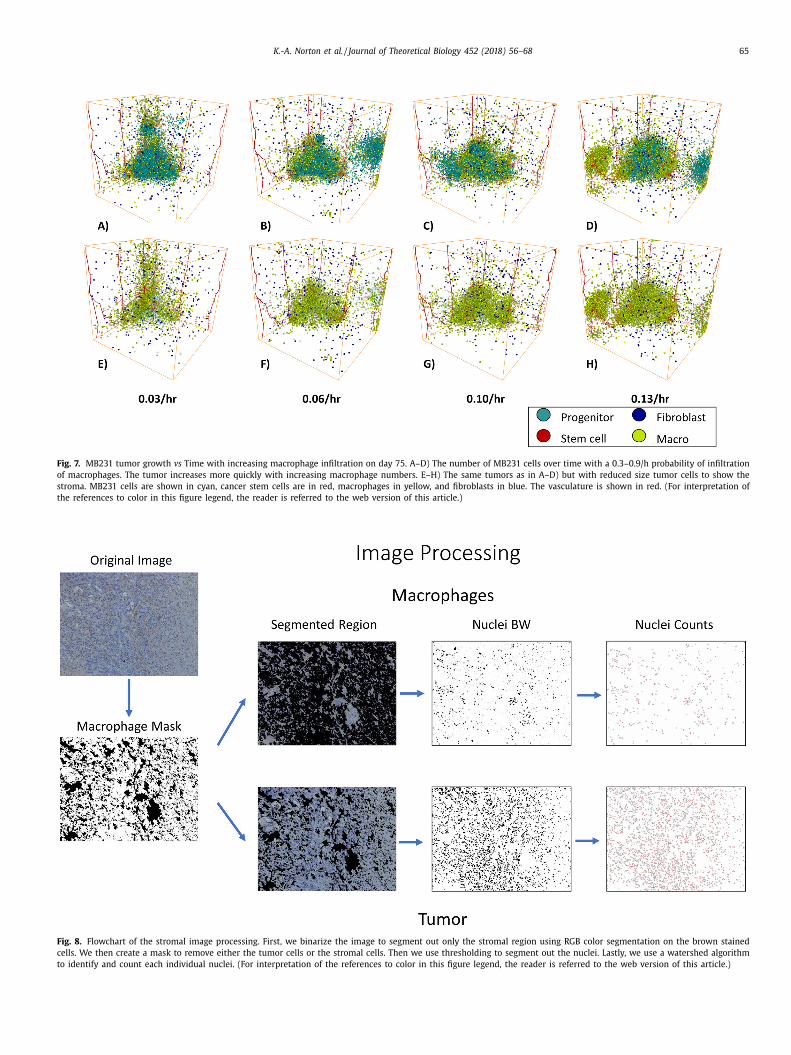
.5. Increasing macrophage infiltration rates does not increase overall
umor size
We investigated the effect of increasing macrophage infiltration
ates on tumor growth by varying the rate of macrophage infil-
ration from mature vessels from 0.033 to 0.133 per hour Fig. 7 .
e find that while increasing the macrophage infiltration rate in-
reases the number of macrophages it does not increase the num-
er of MB231 cells, Supplemental Figure 4. In fact, at very high
acrophage infiltration rates panel D, it can actually slow the tu-
or growth by spatially inhibiting the tumor cells. The tumors all
xhibit invasive fingers and “self-metastases” as shown in panels
–D, which shows all cells within the tumor. In addition, except
t very high macrophage infiltration rates, the macrophages are
ostly confined to the tumor E–G, which shows the macrophages
nd reduced size tumor cells, so the interior of the tumor is view-
ble. At an infiltration rate of 0.133 per hour shown in panel D and
, a large cluster of macrophages form around the vasculature on
he left without many tumor cells within the cluster.
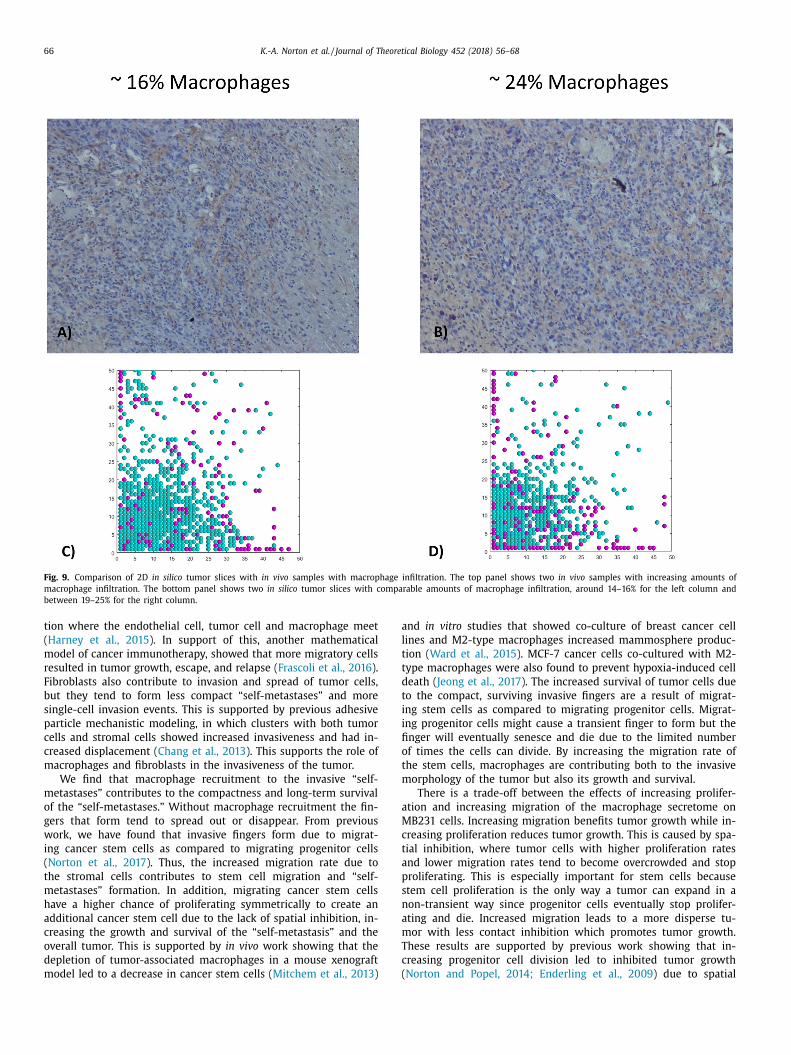
.6. Both in vivo and in silico tumors exhibit varying percentages of
acrophages
We used image processing to calculate the percentages of
acrophages in xenograft mouse models and in the bulk tumor of
he in silico simulations, Fig. 8 . The slices on xenograft tumors had
6% and 24% of macrophages, Fig. 9 panel A and B. We also found
omparable macrophage percentages within slices of the in silico
umor with different infiltration rates. The tumor with an infiltra-
ion rate of 0.067 per hour had an overall macrophage percentage
f 17% within the bulk tumor and the tumor with an infiltration
robability of 0.1 per hour, had an overall macrophage percentage
f 20% within the bulk tumor, Fig. 9 panel C and D. Although the
verall macrophage percentage within the tumor with an infiltra-
ion rate of 0.1 per hour ranged from 8% to 47% within the dif-
erent slices. We show example slices that had a macrophage per-
entage of 16% in panel C and a macrophage percentage of 24%
n panel D. While separate slices ranged from between 0–47%, the
acrophage percentages of the entire tumors ranged from 0.02 to
3.7%, comparable to experimental results ranging from 1% to 25%
Knutsdottir et al., 2016; Colegio et al., 2014 ). This illustrates that
hoosing a representative slice is critical for understanding the ac-
ual macrophage percentage within the tumor.
.7. Comparison of spatial metrics for in vivo and in silico data
We compared an average of 10 in silico simulation results at
ay 17, 33, and 50 to in vivo from our tumor xenograft experi-
ents and literature results for several spatial statistical measures
hannon’s index, Simpson’s index, and Morista-Horn ( Maley et al.,
64 K.-A. Norton et al. / Journal of Theoretical Biology 452 (2018) 56–68
Fig. 5. 3D tumor progression with just fibroblasts on day 75. A) 0 initial fibroblasts. B) 100 initial fibroblasts. C) 10 0 0 initial fibroblasts. MB231 cells are shown in cyan, stem
cells are shown in red, and fibroblasts are shown in blue. The vasculature is shown in red. (For interpretation of the references to color in this figure legend, the reader is
referred to the web version of this article.)
Fig. 6. 3D tumor progression with just macrophages on day 75. A) 0 initial macrophages. B) 100 initial macrophages. C) 10 0 0 initial macrophages. MB231 cells are shown in
cyan, cancer stem cells are shown in red, and macrophages are shown in yellow. The vasculature is shown in red. (For interpretation of the references to color in this figure
legend, the reader is referred to the web version of this article.)
Table 2
A comparison of spatial metrics between simulations and in vivo results (mean ± standard deviation).
Spatial metric in silico day 17 in silico day 33 in silico day 50 literature Reference
Shannon’s index 0.63 ± (0.06) 0.64 ± 0.05 0.64 ± (0.05) 0–1.6 ( Maley et al., 2006 )
Simpson’s index 1.60 ± (0.13) 1.67 ± 0.11 1.65 ± (0.12) 1.13–2.88 ( Merlo et al., 2010 )
Morista-Horn (1–5 slice) 0.71 ± (0.05) 0.60 ± 0.09 0.52 ± (0.47) 0.68–0.9 ( Maley et al., 2015 )
Morista-Horn (21–25 slice) 0.57 ± (0.27) 0.94 ± 0.08 0.96 ± (0.02)
c
p
fi
n
a
r
i
m
t
c
m
g
l
s
2017 ). We found that all metrics were comparable between the in
silico and in vivo results ( Table 2 ). Shannon’s Index and Simpson’s
Index were the most robust across days, with very little difference
between them. The Morista-Horn score decreased when compared
across the first 5 slices as the days increased. While the tumor is
still small, the Morista-Horn score has not stabilized across slice
21–25 but once the tumor has grown the score stays similar.
5. Discussion
We have developed an agent-based model, based on our previ-
ous models ( Norton and Popel, 2016, 2014; Norton et al., 2017 ) of
triple-negative breast cancer cells interaction with their microen-
vironment, including breast cancer stem cells, cancer progenitor
cells, endothelial cells, macrophages, and fibroblasts. We specifi-
ally model tumor hypoxia, and angiogenesis in response to hy-
oxia, as well as macrophage recruitment.
Breast cancer cells in the model invade by forming “invasive
ngers” or “self-metastases” and we find that these are accompa-
ied by macrophages. Initially, the cancer cells migrate with only
few macrophages but eventually the infiltrating macrophages get
ecruited to the invasive self-metastases. This is corroborated by
n vivo evidence showing that macrophages are involved in tu-
or cell invasion and metastasis and are frequently present at
he invasive fronts of a tumor ( Condeelis and Pollard, 2006 ). This
oupling of macrophages and tumor cells supports metastasis as
acrophages have been shown to migrate together along colla-
en fibers and intravasate into nearby blood vessels ( Noy and Pol-
ard, 2014 ). In addition, tumor cells and macrophages have been
hown to migrate together and intravasate specifically at the junc-
K.-A. Norton et al. / Journal of Theoretical Biology 452 (2018) 56–68 65
Fig. 7. MB231 tumor growth vs Time with increasing macrophage infiltration on day 75. A–D) The number of MB231 cells over time with a 0.3–0.9/h probability of infiltration
of macrophages. The tumor increases more quickly with increasing macrophage numbers. E–H) The same tumors as in A–D) but with reduced size tumor cells to show the
stroma. MB231 cells are shown in cyan, cancer stem cells are in red, macrophages in yellow, and fibroblasts in blue. The vasculature is shown in red. (For interpretation of
the references to color in this figure legend, the reader is referred to the web version of this article.)
Fig. 8. Flowchart of the stromal image processing. First, we binarize the image to segment out only the stromal region using RGB color segmentation on the brown stained
cells. We then create a mask to remove either the tumor cells or the stromal cells. Then we use thresholding to segment out the nuclei. Lastly, we use a watershed algorithm
to identify and count each individual nuclei. (For interpretation of the references to color in this figure legend, the reader is referred to the web version of this article.)
66 K.-A. Norton et al. / Journal of Theoretical Biology 452 (2018) 56–68
Fig. 9. Comparison of 2D in silico tumor slices with in vivo samples with macrophage infiltration. The top panel shows two in vivo samples with increasing amounts of
macrophage infiltration. The bottom panel shows two in silico tumor slices with comparable amounts of macrophage infiltration, around 14–16% for the left column and
between 19–25% for the right column.
a
l
t
t
d
t
i
i
fi
o
t
m
a
M
c
t
a
p
s
n
a
m
T
c
(
tion where the endothelial cell, tumor cell and macrophage meet
( Harney et al., 2015 ). In support of this, another mathematical
model of cancer immunotherapy, showed that more migratory cells
resulted in tumor growth, escape, and relapse ( Frascoli et al., 2016 ).
Fibroblasts also contribute to invasion and spread of tumor cells,
but they tend to form less compact “self-metastases” and more
single-cell invasion events. This is supported by previous adhesive
particle mechanistic modeling, in which clusters with both tumor
cells and stromal cells showed increased invasiveness and had in-
creased displacement ( Chang et al., 2013 ). This supports the role of
macrophages and fibroblasts in the invasiveness of the tumor.
We find that macrophage recruitment to the invasive “self-
metastases” contributes to the compactness and long-term survival
of the “self-metastases.” Without macrophage recruitment the fin-
gers that form tend to spread out or disappear. From previous
work, we have found that invasive fingers form due to migrat-
ing cancer stem cells as compared to migrating progenitor cells
( Norton et al., 2017 ). Thus, the increased migration rate due to
the stromal cells contributes to stem cell migration and “self-
metastases” formation. In addition, migrating cancer stem cells
have a higher chance of proliferating symmetrically to create an
additional cancer stem cell due to the lack of spatial inhibition, in-
creasing the growth and survival of the “self-metastasis” and the
overall tumor. This is supported by in vivo work showing that the
depletion of tumor-associated macrophages in a mouse xenograft
model led to a decrease in cancer stem cells ( Mitchem et al., 2013 )
nd in vitro studies that showed co-culture of breast cancer cell
ines and M2-type macrophages increased mammosphere produc-
ion ( Ward et al., 2015 ). MCF-7 cancer cells co-cultured with M2-
ype macrophages were also found to prevent hypoxia-induced cell
eath ( Jeong et al., 2017 ). The increased survival of tumor cells due
o the compact, surviving invasive fingers are a result of migrat-
ng stem cells as compared to migrating progenitor cells. Migrat-
ng progenitor cells might cause a transient finger to form but the
nger will eventually senesce and die due to the limited number
f times the cells can divide. By increasing the migration rate of
he stem cells, macrophages are contributing both to the invasive
orphology of the tumor but also its growth and survival.
There is a trade-off between the effects of increasing prolifer-
tion and increasing migration of the macrophage secretome on
B231 cells. Increasing migration benefits tumor growth while in-
reasing proliferation reduces tumor growth. This is caused by spa-
ial inhibition, where tumor cells with higher proliferation rates
nd lower migration rates tend to become overcrowded and stop
roliferating. This is especially important for stem cells because
tem cell proliferation is the only way a tumor can expand in a
on-transient way since progenitor cells eventually stop prolifer-
ting and die. Increased migration leads to a more disperse tu-
or with less contact inhibition which promotes tumor growth.
hese results are supported by previous work showing that in-
reasing progenitor cell division led to inhibited tumor growth
Norton and Popel, 2014; Enderling et al., 2009 ) due to spatial
K.-A. Norton et al. / Journal of Theoretical Biology 452 (2018) 56–68 67
i
c
o
w
i
t
g
m
t
i
m
2
t
r
s
o
t
t
s
p
a
(
c
b
2
t
m
W
o
w
c
n
c
i
a
a
A
h
f
a
g
c
C
S
f
R
A
A
B
B
B
B
B
B
C
C
C
C
C
C
C
C
C
C
C
D
D
D
E
E
E
E
E
F
F
F
G
G
G
H
H
H
H
I
nhibition and that increased cancer cell migration leads to in-
reased tumor growth ( Norton and Popel, 2014 ). Small numbers
f macrophages seem to be enough to increase the tumor growth,
hereas large numbers can inhibit growth due to overcrowd-
ng. A computational model of colorectal cancer also predicted
hat high numbers of immune cells contributed to reduced tumor
rowth and improved treatment ( Kather et al., 2017 ). Inhibiting
acrophage recruitment has shown variable success, anti-CSF-1
reatment early in the primary tumor growth (before macrophage
nfiltration) decreases primary tumor growth but the effects was
odest ( Lohela et al., 2014 ) while others failed ( MacDonald et al.,
010 ). Other immunotherapies, specifically monoclonal antibodies
argeting checkpoint inhibitors on T-cells, have been tested in a va-
iety of cancers ( Ott et al., 2017 ). Normally, the adaptive immune
ystem targets cancer cells by releasing cytotoxic T-cells that rec-
gnize and eliminates cancer cells as threats due to mutations in
heir genes ( Gong et al., 2017 ). Unfortunately, some cancers evade
he immune system by tricking them into recognizing them as
elf through checkpoint inhibitors such as programmed cell death
rotein-1 (PD-1) and its ligand (PD-L1) ( Gong et al., 2017 ). Ther-
pies targeting PD-1/PD-L1 and cytotoxic T lymphocyte antigen-4
CTLA-4) have been shown to be effective in melanoma, bladder
ancer, and non-small cell lung cancer and are in clinical trials for
reast cancer, especially triple-negative breast cancer ( Emens et al.,
017 ).
There are several limitations and future directions that could be
aken from this work. It has been shown that macrophages pro-
ote stem cell expansion ( Wan et al., 2014; Williams et al., 2016 ).
hile we focused on the effects on macrophages and fibroblasts
n overall proliferation rate, which includes stem cell proliferation,
e did not specifically incorporate the effects on symmetric stem
ell division. This can be examined in further research. We also did
ot consider an immune response to the tumor and the effects on
ytotoxic T cells on tumor death. In future studies it would be of
nterest to investigate the effects on therapies targeting the MB231
nd stromal secretomes to determine how these would affect over-
ll tumor growth and macrophage recruitment.
cknowledgments
The authors would like to acknowledge Dr. Chang Gong for his
elp in visualizations of the in silico tumors and Dr. Adam Mirando
or his help in analyzing the macrophage percentages using Im-
geJ. This work was supported by the National Institutes of Health
rants R01 CA138264 and R01 CA196701 (ASP) and American Can-
er Society postdoctoral fellowship PF-13-174-01-CSM (KAN).
onflict of interest
The authors declare no competing interest.
upplementary materials
Supplementary material associated with this article can be
ound, in the online version, at doi:10.1016/j.jtbi.2018.05.003 .
eferences
larcón, T. , Byrne, H.M. , Maini, P.K. , 2004. A mathematical model of the effects of
hypoxia on the cell-cycle of normal and cancer cells. J. Theor. Biol. 229, 395–411 .llen, W.E. , Zicha, D. , Ridley, A.J. , Jones, G.E. , 1998. A role for Cdc42 in macrophage
chemotaxis. J. Cell Biol. 141, 1147–1157 . auer, A.L. , Jackson, T.L. , Jiang, Y. , Rohlf, T. , 2010. Receptor cross-talk in angiogene-
sis: mapping environmental cues to cell phenotype using a stochastic, Boolean
signaling network model. J. Theor. Biol. 264, 838–846 . azzazi, H. , Isenberg, J.S. , Popel, A.S. , 2017. Inhibition of VEGFR2 activation and its
downstream signaling to erk1/2 and calcium by thrombospondin-1 (tsp1): Insilico investigation. [Front. Physiol. 8, 48(2017)] DOI: 10.3389/fphys.2017.0 0 048.
Front. Physiol. 8, 48 .
azzazi, H. , Popel, A.S. , 2017. Computational investigation of sphingosine kinase 1(SphK1) and calcium dependent ERK1/2 activation downstream of VEGFR2 in
endothelial cells. PLOS Comput. Biol. 13, e1005332 . howmick, N.A. , et al. , 2004. TGF-beta signaling in fibroblasts modulates the onco-
genic potential of adjacent epithelia. Science 303, 848–851 . loch, N. , Harel, D. , 2016. The tumor as an organ: comprehensive spatial and tem-
poral modeling of the tumor and its microenvironment. BMC Bioinf. 17, 317 . ochet, L. , et al. , 2013. Adipocyte-derived fibroblasts promote tumor progression
and contribute to the desmoplastic reaction in breast cancer. Cancer Res. 73,
5657–5668 . ai, Y. , Zhang, J. , Li, Z. , 2016. Multi-scale mathematical modelling of tumour growth
and microenvironments in anti-angiogenic therapy. Biomed. Eng. Online 15, 155 .hang, W.K. , Carmona-Fontaine, C. , Xavier, J.B. , 2013. Tumour-stromal interactions
generate emergent persistence in collective cancer cell migration. Interface Fo-cus 3, 20130017 .
haturvedi, P. , Gilkes, D.M. , Takano, N. , Semenza, G.L. , 2014. Hypoxia-inducible fac-
tor-dependent signaling between triple-negative breast cancer cells and mes-enchymal stem cells promotes macrophage recruitment. Proc. Natl. Acad. Sci.
USA 111, E2120–E2129 . haubey, S. , Jones, G.E. , Shah, A.M. , Cave, A.C. , Wells, C.M. , 2013. Nox2 is required
for macrophage chemotaxis towards CSF-1. PLoS One 8, e54869 . hen, J. , et al. , 2011. CCL18 from tumor-associated macrophages promotes breast
cancer metastasis via PITPNM3. Cancer Cell 19, 541–555 .
olegio, O.R. , et al. , 2014. Functional polarization of tumour-associated macrophagesby tumour-derived lactic acid. Nature 513, 559–563 .
omito, G. , et al. , 2014. Cancer-associated fibroblasts and M2-polarized macrophagessynergize during prostate carcinoma progression. Oncogene 33, 2423–2431 .
ondeelis, J. , Pollard, J.W. , 2006. Macrophages: Obligate partners for tumor cell mi-gration, invasion, and metastasis. Cell 124, 263–266 .
orvigno, S. , et al. , 2016. Markers of fibroblast-rich tumor stroma and perivascular
cells in serous ovarian cancer: Inter- and intra-patient heterogeneity and impacton survival. Oncotarget 7, 18573–18584 .
urtis, L.T. , Frieboes, H.B. , 2016. The tumormicroenvironment as a barrier to cancernanotherapy. Adv. Exp. Med. Biol. 936, 165–190 .
urtis, L.T. , Wu, M. , Lowengrub, J. , Decuzzi, P. , Frieboes, H.B. , 2015. Computationalmodeling of tumor response to drug release from vasculature-bound nanoparti-
cles. PLoS One 10, e0144888 .
arby, I.A. , Laverdet, B. , Bonté, F. , Desmoulière, A. , 2014. Fibroblasts and myofibrob-lasts in wound healing. Clin. Cosmet. Investig. Dermatol. 7, 301–311 .
iao, X.-W. , Feng, J.-Y. , Wang, Q.-W. , Sun, J.-G. , Chen, Z.-T. , 2016. SDF-1/CXCR4 axispromotes prostate cancer cell invasion and bone metastasis through p38, NF- κB
and HIF-1 α pathways. Int. J. Clin. Exp. Pathol. 9, 2706–2717 . ovas, A. , Patsialou, A. , Harney, A.S. , Condeelis, J. , Cox, D. , 2013. Imaging interactions
between macrophages and tumour cells that are involved in metastasis in vivo
and in vitro . J. Microsc. 251, 261–269 . ddy, R.J. , Weidmann, M.D. , Sharma, V.P. , Condeelis, J.S. , 2017. Tumor cell in-
vadopodia: invasive protrusions that orchestrate metastasis. Trends Cell Biol. 27,595–607 .
mens, L.A. , et al. , 2017. Cancer immunotherapy: opportunities and challenges inthe rapidly evolving clinical landscape. Eur. J. Cancer 81, 116–129 .
nderling, H. , Hlatky, L. , Hahnfeldt, P. , 2012a. The promoting role of a tumour-se-creted chemorepellent in self-metastatic tumour progression. Math. Med. Biol.
29, 21–29 .
nderling, H. , Hlatky, L. , Hahnfeldt, P. , 2009. Migration rules: tumours are conglom-erates of self-metastases. Br. J. Cancer 100, 1917–1925 .
nderling, H. , Hlatky, L. , Hahnfeldt, P. , 2012b. Immunoediting: evidence of the multi-faceted role of the immune system in self-metastatic tumor growth. Theor. Biol.
Med. Model. 9, 31 . errara, N. , 2002. VEGF and the quest for tumour angiogenesis factors. Nat. Rev.
Cancer 2, 795–803 .
olkman, J. , 1996. Fighting cancer by attacking its blood supply. Sci. Am. 275,150–154 .
rascoli, F. , Flood, E. , Kim, P.S. , 2016. A model of the effects of cancer cell motilityand cellular adhesion properties on tumour-immune dynamics. Math. Med. Biol.
34, dqw004 . ilkes, D.M. , Semenza, G.L. , Wirtz, D. , 2014. Hypoxia and the extracellular matrix:
drivers of tumour metastasis. Nat. Rev. Cancer 14, 430–439 .
illies, R.J. , Gatenby, R.A. , 2007. Adaptive landscapes and emergent phenotypes: whydo cancers have high glycolysis? J Bioenerg. Biomembr. 39, 251–257 .
ong, C. , et al. , 2017. A computational multiscale agent-based model for simulatingspatio-temporal tumour immune response to PD1 and PDL1 inhibition. J. R. Soc.
Interface 14, 20170320 . arney, A.S. , et al. , 2015. Real-time imaging reveals local, transient vascular perme-
ability, and tumor cell intravasation stimulated by TIE2hi macrophage–derived
VEGFA. Cancer Discov. 5, 932–943 . ellström, M. , Phng, L.K. , Gerhardt, H. , 2007. VEGF and Notch signaling: the yin and
yang of angiogenic sprouting. Cell Adhes. Migration 1, 133–136 . ollmén, M. , Roudnicky, F. , Karaman, S. , Detmar, M. , 2015. Characterization of
macrophage–cancer cell crosstalk in estrogen receptor positive and triple-nega-tive breast cancer. Sci. Rep. 5, 9188 .
uang, Y. , Snuderl, M. , Jain, R.K. , 2011. Polarization of tumor-associated
macrophages: a novel strategy for vascular normalization and antitumorimmunity. Cancer Cell 19, 1–2 .
shii, G. , Ochiai, A. , Neri, S. , 2016. Phenotypic and functional heterogeneity of can-cer-associated fibroblast within the tumor microenvironment. Adv. Drug Deliv-
ery Rev. 99, 186–196 .
68 K.-A. Norton et al. / Journal of Theoretical Biology 452 (2018) 56–68
P
P
Q
Q
Q
R
R
S
S
S
S
S
S
S
S
S
S
S
T
T
T
V
W
W
W
W
Y
Z
Z
Z
Jeong, S.K. , et al. , 2017. Tumor associated macrophages provide the survival resis-tance of tumor cells to hypoxic microenvironmental condition through IL-6 re-
ceptor-mediated signals. Immunobiology 222, 55–65 . Jin, K. , Pandey, N.B. , Popel, A.S. , 2017. Crosstalk between stromal components and
tumor cells of TNBC via secreted factors enhances tumor growth and metastasis.Oncotarget 8, 60210–60222 .
Jones, G.E. , et al. , 2003. Requirement for PI 3-kinase γ in macrophage migration toMCP-1 and CSF-1. Exp. Cell Res. 290, 120–131 .
Junttila, M.R. , de Sauvage, F.J. , 2013. Influence of tumour micro-environment hetero-
geneity on therapeutic response. Nature 501 . Kather, J.N. , et al. , 2017. In silico modeling of immunotherapy and stroma-targeting
therapies in human colorectal cancer. Cancer Res. 77, 6442–6452 . Kim, Y. , Friedman, A. , 2010. Interaction of tumor with its micro-environment: a
mathematical model. Bull. Math. Biol. 72, 1029–1068 . Kleinstreuer, N. , et al. , 2013. A computational model predicting disruption of blood
vessel development. PLoS Comput. Biol. 9, e1002996 .
Knutsdottir, H. , Condeelis, J.S. , Palsson, E. , 2016. 3-D individual cell based computa-tional modeling of tumor cell-macrophage paracrine signaling mediated by EGF
and CSF-1 gradients. Integr. Biol. (Camb) 8, 104–119 . Knútsdóttir, H. , Pálsson, E. , Edelstein-Keshet, L. , 2014. Mathematical model of
macrophage-facilitated breast cancer cells invasion. J. Theor. Biol. 357, 184–199 . Korkaya, H. , Liu, S. , Wicha, M.S. , 2011. Breast cancer stem cells, cytokine networks,
and the tumor microenvironment. J. Clin. Invest. 121, 3804–3809 .
Leek, R.D. , et al. , 1996. Association of macrophage infiltration with angiogenesis andprognosis in invasive breast carcinoma. Cancer Res. 56, 4625–4629 .
Leung, E. , et al. , 2017. Blood vessel endothelium-directed tumor cell streamingin breast tumors requires the HGF/C-met signaling pathway. Oncogene 36,
2680–2692 . Lewis, C.E. , Leek, R. , Harris, A. , McGee, J.O. , 1995. Cytokine regulation of angiogen-
esis in breast cancer: the role of tumor-associated macrophages. J. Leukoc. Biol.
57, 747–751 . Lohela, M. , et al. , 2014. Intravital imaging reveals distinct responses of depleting
dynamic tumor-associated macrophage and dendritic cell subpopulations. Proc.Natl. Acad. Sci. USA 111, E5086–E5095 .
Luo, H. , Tu, G. , Liu, Z. , Liu, M. , 2014. Tumor-associated macrophages: from mecha-nisms to therapy. Immunity 41, 49–61 .
MacDonald, K.P.A. , et al. , 2010. An antibody against the colony-stimulating factor 1
receptor depletes the resident subset of monocytes and tissue- and tumor-asso-ciated macrophages but does not inhibit inflammation. Blood 116, 3955–3963 .
Mahmoud, S.M.A. , et al. , 2012. Tumour-infiltrating macrophages and clinical out-come in breast cancer. J. Clin. Pathol. 65, 159–163 .
Maley, C.C. , et al. , 2006. Genetic clonal diversity predicts progression to esophagealadenocarcinoma. Nat. Genet. 38, 468–473 .
Maley, C.C. , et al. , 2017. Classifying the evolutionary and ecological features of neo-
plasms. Nat. Rev. Cancer 17, 605–619 . Maley, C.C. , Koelble, K. , Natrajan, R. , Aktipis, A. , Yuan, Y. , 2015. An ecological mea-
sure of immune-cancer colocalization as a prognostic factor for breast cancer.Breast Cancer Res. 17, 131 .
Mao, Y. , Keller, E.T. , Garfield, D.H. , Shen, K. , Wang, J. , 2013. Stromal cells in tumormicroenvironment and breast cancer. Cancer Metastasis Rev. 32, 303–315 .
Merlo, L.M.F. , et al. , 2010. A comprehensive survey of clonal diversity measuresin Barrett’s esophagus as biomarkers of progression to esophageal adenocarci-
noma. Cancer Prev. Res. 3, 1388–1397 .
Mitchem, J.B. , et al. , 2013. Targeting tumor-infiltrating macrophages decreases tu-mor-initiating cells, relieves immunosuppression, and improves chemotherapeu-
tic responses. Cancer Res. 73, 1128–1141 . Norton, K.-A. , Popel, A.S. , 2016. Effects of endothelial cell proliferation and migration
rates in a computational model of sprouting angiogenesis. Sci. Rep. 6, 36992 . Norton, K.A. , Popel, A.S. , 2014. An agent-based model of cancer stem cell initiated
avascular tumour growth and metastasis: the effect of seeding frequency and
location. J. R. Soc. Interface 11, 20140640 . Norton, K.-A. , Wallace, T. , Pandey, N.B. , Popel, A.S. , 2017. An agent-based model of
triple-negative breast cancer: the interplay between chemokine receptor CCR5expression, cancer stem cells, and hypoxia. BMC Syst. Biol. 11 .
Noy, R. , Pollard, J.W. , 2014. Tumor-associated macrophages: from mechanisms totherapy. Immunity 41, 49–61 .
Oden, J.T. , et al. , 2016. Toward predictive multiscale modeling of vascular tumor
growth: computational and experimental oncology for tumor prediction. Arch.Comput. Methods Eng. 23, 735–779 .
Orimo, A. , Weinberg, R.A. , 2007. Heterogeneity of stromal fibroblasts in tumor. Can-cer Biol. Ther. 6, 618–619 .
Ott, P.A. , Hodi, F.S. , Kaufman, H.L. , Wigginton, J.M. , Wolchok, J.D. , 2017. Combinationimmunotherapy: a road map. J. Immunother. Cancer 5, 16 .
Owen, M.R. , et al. , 2011. Mathematical modeling predicts synergistic antitumor ef-
fects of combining a macrophage-based, hypoxia-targeted gene therapy withchemotherapy. Cancer Res. 71, 2826–2837 .
Owen, M.R. , Sherratt, J.A. , 1997. Pattern formation and spatiotemporal irregularity ina model for macrophage-tumour interactions. J. Theor. Biol. 189, 63–80 .
Owen, M.R. , Sherratt, J.A. , 1998. Modelling the macrophage invasion of tumours:effects on growth and composition. IMA J. Math. Appl. Med. Biol. 15, 165–185 .
Peng, Q. , et al. , 2013. Biological characteristics and genetic heterogeneity between
carcinoma-associated fibroblasts and their paired normal fibroblasts in humanbreast cancer. PLoS One 8, e60321 .
Perfahl, H. , et al. , 2011. Multiscale modelling of vascular tumour growth in 3D: theroles of domain size and boundary conditions. PLoS One 6, e14790 .
erfahl, H. , et al. , 2017. 3D hybrid modelling of vascular network formation. J. Theor.Biol. 414, 254–268 .
ignatelli, J. , et al. , 2016. Macrophage-dependent tumor cell transendothelial mi-gration is mediated by Notch1/MenaINV-initiated invadopodium formation. Sci.
Rep. 6, 37874 . ian, B. , et al. , 2009. A distinct macrophage population mediates metastatic breast
cancer cell extravasation, establishment and growth. PLoS One 4, e6562 . ian, B.-Z. , et al. , 2015. FLT1 signaling in metastasis-associated macrophages acti-
vates an inflammatory signature that promotes breast cancer metastasis. J. Exp.
Med. 212, 1433–1448 . utub, A .A . , Popel, A .S. , 2009. Elongation, proliferation & migration differentiate en-
dothelial cell phenotypes and determine capillary sprouting. BMC Syst. Biol. 3,13 .
amjiawan, R.R. , Griffioen, A.W. , Duda, D.G. , 2017. Anti-angiogenesis for cancer re-visited: is there a role for combinations with immunotherapy? Angiogenesis 20,
185–204 .
ønnov-Jessen, L. , Petersen, O.W. , Koteliansky, V.E. , Bissell, M.J. , 1995. The originof the myofibroblasts in breast cancer. Recapitulation of tumor environment
in culture unravels diversity and implicates converted fibroblasts and recruitedsmooth muscle cells. J. Clin. Invest. 95, 859–873 .
chneider, C.A. , Rasband, W.S. , Eliceiri, K.W. , 2012. NIH image to imageJ: 25 years ofimage analysis. Nat. Methods 9, 671–675 .
cianna, M. , Bell, C.G. , Preziosi, L. , 2013. A review of mathematical models for the
formation of vascular networks. J. Theor. Biol. 333, 174–209 . Scott, J.G. , Fletcher, A.G. , Anderson, A .R.A . , Maini, P.K. , 2016. Spatial metrics of tu-
mour vascular organisation predict radiation efficacy in a computational model.PLoS Comput. Biol. 12, e1004712 .
emenza, G.L. , 2016. The hypoxic tumor microenvironment: a driving force forbreast cancer progression. Biochim. Biophys. Acta Mol. Cell Res. 1863, 382–391 .
hirinifard, A. , et al. , 2009. 3D multi-cell simulation of tumor growth and angiogen-
esis. PLoS One 4, e7190 . olinas, G. , Germano, G. , Mantovani, A. , Allavena, P. , 2009. Tumor-associated
macrophages (TAM) as major players of the cancer-related inflammation. J.Leukoc. Biol. 86, 1065–1073 .
ousa, S. , et al. , 2015. Human breast cancer cells educate macrophages toward theM2 activation status. Breast Cancer Res 17, 101 .
Sparano, J.A., et al., 2016. The tumor microenvironment as a metastasis biomarker in
breast cancer. In: Molecular Pathology of Breast Cancer. Springer InternationalPublishing, pp. 153–165. doi: 10.1007/978- 3- 319- 41761- 5 _ 11 .
téphanou, A. , et al. , 2017. How tumour-induced vascular changes alter angiogene-sis: insights from a computational model. J. Theor. Biol. 419, 211–226 .
traussman, R. , et al. , 2012. Tumour micro-environment elicits innate resistance toRAF inhibitors through HGF secretion. Nature 487 .
turge, J. , Todd, S.K. , Kogianni, G. , McCarthy, A. , Isacke, C.M. , 2007. Mannose receptor
regulation of macrophage cell migration. J. Leukoc. Biol. 82, 585–593 . u, S. , et al. , 2014. A positive feedback loop between mesenchymal-like cancer
cells and macrophages is essential to breast cancer metastasis. Cancer Cell 25,605–620 .
ugimoto, H. , Mundel, T.M. , Kieran, M.W. , Kalluri, R. , 2006. Identification of fi-broblast heterogeneity in the tumor microenvironment. Cancer Biol. Ther. 5,
1640–1646 . akai, K. , Le, A. , Weaver, V.M. , Werb, Z. , 2016. Targeting the cancer-associated fibrob-
lasts as a treatment in triple-negative breast cancer. Oncotarget 7, 82889–82901 .
ang, X. , 2013. Tumor-associated macrophages as potential diagnostic and prognos-tic biomarkers in breast cancer. Cancer Lett. 332, 3–10 .
ripathi, C. , et al. , 2014. Macrophages are recruited to hypoxic tumor areas and ac-quire a pro-angiogenic M2-polarized phenotype via hypoxic cancer cell derived
cytokines oncostatin M and eotaxin. Oncotarget 5, 5350–5368 . anhaesebroeck, B. , et al. , 1999. Distinct PI(3)Ks mediate mitogenic signalling and
cell migration in macrophages. Nat. Cell Biol. 1, 69–71 .
Vermeulen, P.B. , Van Laere, S.J. , Dirix, L.Y. , 2009. Inflammatory breast carcinoma asa model of accelerated self-metastatic expansion by intravascular growth. Br. J.
Cancer 101, 1028–1029 author reply 1030 . an, S. , et al. , 2014. Tumor-associated macrophages produce interleukin 6 and sig-
nal via STAT3 to promote expansion of human hepatocellular carcinoma stemcells. Gastroenterology 147, 1393–1404 .
ard, R. , et al. , 2015. Monocytes and macrophages, implications for breast cancer
migration and stem cell-like activity and treatment. Oncotarget 6, 14687–14699 .ells, D.K. , et al. , 2015. Spatial and functional heterogeneities shape collective be-
havior of tumor-immune networks. PLOS Comput. Biol. 11, e1004181 . illiams, C.B. , Yeh, E.S. , Soloff, A.C. , 2016. Tumor-associated macrophages: unwitting
accomplices in breast cancer malignancy. NPJ Breast Cancer 2, 15025 . Yu, Y. , et al. , 2014. Cancer-associated fibroblasts induce epithelial-mesenchymal
transition of breast cancer cells through paracrine TGF- β signalling. Br. J. Cancer
110, 724–732 . uan, Z.-Y. , Luo, R.-Z. , Peng, R.-J. , Wang, S.-S. , Xue, C. , 2014. High infiltration of tu-
mor-associated macrophages in triple-negative breast cancer is associated witha higher risk of distant metastasis. Onco. Targets Ther. 7, 1475–1480 .
angooei, M.H. , Habibi, J. , 2017. Hybrid multiscale modeling and prediction of cancercell behavior. PLoS One 12, e0183810 .
eisberg, E.M. , Potenta, S. , Xie, L. , Zeisberg, M. , Kalluri, R. , 2007. Discovery of en-
dothelial to mesenchymal transition as a source for carcinoma-associated fi-broblasts. Cancer Res. 67, 10123–10128 .
icha , et al. , 1998. Chemotaxis of macrophages is abolished in the Wiskott–Aldrichsyndrome. Br. J. Haematol. 101, 659–665 .