Embed Size (px)
Citation preview

Version 3.2/Dec 08
JOINT PRIMARY AIRCRAFT TRAINING SYSTEM
(JPATS)
JPATS AVIATION WEATHER BOOKLET
December 2008
DISTRIBUTION STATEMENT – Distribution authorized to the Department of Defense and US DoD contractors only for Administrative or Operational Use. Other requests shall be referred to ASC/YTLJ, Wright-Patterson AFB, Ohio 45433-7211.
WARNING – This document contains technical data whose export is restricted by the Arms Export Control Act (Title 22, U.S.C., Sec 2751 et seq) or the Export Administration Act of 1979, as amended (Title 50, U.S.C., App 2401 et seq). Violations of these export laws are subject to severe criminal penalties.

Version 3.2/Dec 08 ii
This page intentionally left blank

JPATS AVIATION WEATHER BOOKLET
i Version 3.2/Dec 08
JPATS AVIATION WEATHER BOOKLET
TABLE OF CONTENTS
TABLE OF CONTENTS ............................................................................................................. i.
LIST OF FIGURES ..................................................................................................................... ii.
TABLE OF TABLES .................................................................................................................. iii.
JX101 - ATMOSPHERIC STRUCTURE ............................................................................... 1-1
THE ATMOSPHERE ........................................................................................................... 1-1
ALTITUDE MEASUREMENT ........................................................................................... 1-5
JX102 - ATMOSPHERIC MECHANICS ............................................................................... 2-1
WINDS ................................................................................................................................... 2-1
ATMOSPHERIC MOISTURE .......................................................................................... 2-11
CLOUDS .............................................................................................................................. 2-13
ATMOSPHERIC STABILITY .......................................................................................... 2-17
JX103 FRONTAL MECHANICS ............................................................................................ 3-1
AIR MASSES ........................................................................................................................ 3-1
COLD FRONTS .................................................................................................................... 3-9
WARM FRONTS ................................................................................................................ 3-12
OCCLUDED FRONTS ....................................................................................................... 3-14
JX104 WEATHER HAZARDS ................................................................................................ 4-1
TURBULENCE DEFINED AND CLASSIFIED ............................................................... 4-1
AIRCRAFT ICING ............................................................................................................. 4-10
EFFECTS AND HAZARDS OF STRUCTURAL ICING .............................................. 4-12
OTHER TYPES OF AIRCRAFT ICING ......................................................................... 4-13
MINIMIZING OR AVOIDING ICING HAZARDS ....................................................... 4-14
VISIBILITY DEFINITIONS ............................................................................................. 4-17
SKY COVERAGE AND CEILINGS ................................................................................ 4-19

JPATS AVIATION WEATHER BOOKLET
Version 3.2/Dec 08 ii
VOLCANIC ASH CLOUDS .............................................................................................. 4-24
JX105 - THUNDERSTORMS .................................................................................................. 5-1
THUNDERSTORM DEVELOPMENT .............................................................................. 5-1
THUNDERSTORM WEATHER HAZARDS .................................................................... 5-1
MICROBURSTS ................................................................................................................... 5-5
RADAR THUNDERSTORM INFORMATION ................................................................ 5-7
FLIGHT TECHNIQUES IN THE VICINITY OF THUNDERSTORMS ...................... 5-9
JX106 - METARS AND TAFS ................................................................................................. 6-1
THE AVIATION ROUTINE WEATHER REPORT (METAR) ..................................... 6-1
THE TERMINAL AERODROME FORECAST (TAF) ................................................. 6-14
APPENDIX A GLOSSARY OF SELECTED METEROLOGICAL TERMS ................... A-1
APPENDIX B COMMON WEATHER CONTRACTIONS ................................................ B-1
APPENDIX C LOCATION IDENTIFIERS .......................................................................... C-1
APPENDIX D SELECTED WEATHER INFORMATION RESOURCES ....................... D-1
APPENDIX E ANSWER KEY ................................................................................................ E-1

JPATS AVIATION WEATHER BOOKLET
iii Version 3.2/Dec 08
LIST OF FIGURES
Figure 1-1 — Thickness of the Earth’s Atmosphere .............................................................. 1-1 Figure 1-2 — Atmospheric Layers and Lapse Rates .............................................................. 1-2 Figure 1-3 — Pressure Systems ............................................................................................... 1--4 Figure 1-4 — Barometric Altimeter ......................................................................................... 1-5 Figure 1-5 — Altitudes .............................................................................................................. 1-7 Figure 1-6 — Constant Indicated Altitude with Decreasing Surface Pressure .................... 1-8 Figure 1-7 — Constant Indicated Altitude with Decreasing Temperature ........................ 1-10 Figure 1-8 — Temperature Deviation vs. Indicated and MSL Altitude ............................. 1-10 Figure 2-1 — Station Model ...................................................................................................... 2-3 Figure 2-2 — Major Station Model Symbols .......................................................................... 2-3 Figure 2-3 — Typical Surface Analysis Chart ........................................................................ 2-4 Figure 2-4 — Pressure Gradient Force .................................................................................... 2-5 Figure 2-5 — Pressure Gradient Force .................................................................................... 2-6 Figure 2-6 — Gradient Winds Flow Parallel to Isobars (Found Aloft) ................................ 2-6 Figure 2-7 — Surface Winds Are Deflected Across Isobars Toward Lower Pressure ....... 2-7 Figure 2-8 — Jet Stream ........................................................................................................... 2-8 Figure 2-9 — Sea Breeze ........................................................................................................... 2-9 Figure 2-10 — Land Breeze ...................................................................................................... 2-9 Figure 2-11 — Mountain and Valley Winds ......................................................................... 2-10 Figure 2-12 — Example of Increased Water Vapor Capacity of Warmer Air .................. 2-11 Figure 2-13 — Stratus Clouds ................................................................................................ 2-14 Figure 2-14 — Altocumulus Clouds ....................................................................................... 2-15 Figure 2-15 — Cirrus Clouds.................................................................................................. 2-16 Figure 2-16 — Cumulonimbus Clouds .................................................................................. 2-16 Figure 2-17 — Stable Equilibrium and Neutrally Stable Equilibrium ............................... 2-17 Figure 2-18 — Unstable ........................................................................................................... 2-18 Figure 2-19 — Stable, Unstable, and Neutral Stability ........................................................ 2-18 Figure 2-20 — The Four Lifting Methods ............................................................................. 2-19 Figure 2-21 — Clouds in Stable and Unstable Air ............................................................... 2-19 Figure 3-1 — Air Mass Profile .................................................................................................. 3-1 Figure 3-2 — Uniform Temperature and Moisture of Air Masses ....................................... 3-4 Figure 3-3 — Frontal Zone Structure ...................................................................................... 3-5 Figure 3-4 — General Model of a Frontal System .................................................................. 3-6 Figure 3-5 — Pressure Changes Across a Front ..................................................................... 3-7 Figure 3-6 — Wind Shift Across a Cold Front ........................................................................ 3-7 Figure 3-7 — Frontal Slope ....................................................................................................... 3-8 Figure 3-8 — Cold Front ........................................................................................................... 3-9 Figure 3-9 — Cold Front Cloud Formation .......................................................................... 3-10

JPATS AVIATION WEATHER BOOKLET
Version 3.2/Dec 08 iv
Figure 3-10 — Squall Line Formation ................................................................................... 3-11 Figure 3-11 — Warm Front .................................................................................................... 3-12 Figure 3-12 — Warm Front Cloud Formation ..................................................................... 3-13 Figure 3-13 — Stationary Front ............................................................................................. 3-14 Figure 3-14 — Occluded Front ............................................................................................... 3-15 Figure 3-15 — Occluded Wave Formation ............................................................................ 3-15 Figure 4-1 — Strength of Convective Currents Vary With Composition of Surface .......... 4-3 Figure 4-2 — Airflow Over Irregular Terrain ........................................................................ 4-4 Figure 4-3 — Mountain Wave Turbulence ............................................................................. 4-5 Figure 4-4 — Lenticular Clouds ............................................................................................... 4-5 Figure 4-5 — Frontal Turbulence ............................................................................................ 4-7 Figure 4-6 — Jet Stream Diagram ........................................................................................... 4-8 Figure 4-7 — Wind Shear Associated With a Temperature Inversion ................................. 4-9 Figure 4-8 — Cumulative Effects of Icing ............................................................................. 4-12 Figure 4-9 — Pitot Tube Icing ................................................................................................ 4-13 Figure 4-10 — Options to Escape Icing ................................................................................. 4-14 Figure 4-11 — Prevailing Visibility Determination .............................................................. 4-17 Figure 4-12 — Surface vs. Flight Visibility ........................................................................... 4-18 Figure 4-13 — Wind Causing Eddy Currents, Cooling Air to Saturation ......................... 4-22 Figure 4-14 — Radiation Fog .................................................................................................. 4-22 Figure 4-15 — Dissipation of Radiation Fog ......................................................................... 4-23 Figure 4-16 — Advection Fog ................................................................................................. 4-24 Figure 5-1 — Gust Front ........................................................................................................... 5-2 Figure 5-2 — Roll Cloud ........................................................................................................... 5-2 Figure 5-3 — Hailstones ............................................................................................................ 5-3 Figure 5-4 — Lightning Hazards.............................................................................................. 5-4 Figure 5-5 — Vortex Ring of a Microburst ............................................................................. 5-5 Figure 5-6 — Cross Section of a Microburst ........................................................................... 5-5 Figure 5-7 — Attitude Changes with Microburst Penetration .............................................. 5-6 Figure 5-9 — Around a Thunderstorm ................................................................................. 5-10 Figure 5-10 — Over the Top ................................................................................................... 5-10 Figure 5-11 — Under the Thunderstorm............................................................................... 5-11 Figure 5-12 — Through the Thunderstorm .......................................................................... 5-12 Figure 5-13 — Thunderstorm Penetration ............................................................................ 5-12 Figure 6-1 — Sample METAR Printout .................................................................................. 6-2 Figure 6-2 — METAR Code Groups ....................................................................................... 6-3 Figure 6-3 — Type of Report: METAR or SPECI ................................................................. 6-3 Figure 6-4 — Station Identifier in METAR ............................................................................ 6-4 Figure 6-5 — DTG in METAR ................................................................................................. 6-4 Figure 6-6 — Wind Direction and Speed in METAR ............................................................ 6-5

JPATS AVIATION WEATHER BOOKLET
v Version 3.2/Dec 08
Figure 6-7 — Visibility in METAR .......................................................................................... 6-5 Figure 6-8 — RVR in METAR ................................................................................................. 6-6 Figure 6-9 — Present Weather in METAR ............................................................................. 6-7 Figure 6-10 — Sky Condition in METAR ............................................................................... 6-8 Figure 6-11 — Temperature and Dew Point in METAR ..................................................... 6-10 Figure 6-12 — Altimeter Setting in METAR ........................................................................ 6-10 Figure 6-13 — Remarks Section of METAR ......................................................................... 6-10 Figure 6-14 — TAF Groups .................................................................................................... 6-15 Figure 6-15 — TAF Example .................................................................................................. 6-15 Figure 6-16 — TAF Heading .................................................................................................. 6-15 Figure 6-17 — TAF Time Group ............................................................................................ 6-16 Figure 6-18 — TAF Winds ...................................................................................................... 6-16 Figure 6-19 — TAF Visibility Group ..................................................................................... 6-16 Figure 6-20 — TAF Sky Condition Group ............................................................................ 6-17 Figure 6-21 — TAF Altimeter Group .................................................................................... 6-19 Figure 6-22 — TAF Change Groups ...................................................................................... 6-20 Figure 6-23 — TAF BECMG Group ..................................................................................... 6-21 Figure 6-24 — TAF TEMPO Group ...................................................................................... 6-22 Figure 6-25 — From/To Example .......................................................................................... 6-23 Figure 6-26 — Civilian TAF Examples .................................................................................. 6-24 Figure 6-27 — Military TAF Example................................................................................... 6-25 Figure 6-28 — TAF Timeline Example .................................................................................. 6-26 Figure 6-29 — METAR for Questions 1-6 ............................................................................. 6-27 Figure 6-30 — METAR for Questions 7-12 ........................................................................... 6-28 Figure 6-31 — METAR for Questions 13-19 ......................................................................... 6-30 Figure 6-32 — METAR for Questions 20-25 ......................................................................... 6-31 Figure 6-33 — TAF for Questions 26-50................................................................................ 6-34

JPATS AVIATION WEATHER BOOKLET
Version 3.2/Dec 08 vi
TABLE OF TABLES
Table 1-1 — Density Altitude Effects on Aircraft Performance ........................................... 1-8
Table 1-2 — Pressure Change vs. Indicated and MSL Altitude ............................................ 1-9
Table 1-3 — Temperature Deviation vs. Indicated and MSL Altitude ................................ 1-9
Table 2-1 — Cloud Families ................................................................................................... 2-17
Table 2-2 — Atmospheric Stability and Flight Conditions .................................................. 2-20
Table 3-1 — Frontal Symbols ................................................................................................... 3-2
Table 4-1 — PIREP Turbulence Reporting Table ................................................................. 4-2
Table 4-2 — Air Florida Mishap Abstract ............................................................................ 4-10
Table 4-3 — Icing Reporting Criteria .................................................................................... 4-16
Table 5-4 — Sky Coverage Contractions .............................................................................. 5-20
Table 6-1 — Visibility Values Reportable in METAR ........................................................... 6-6
Table 6-2 — Present Weather Codes Reportable in METAR ............................................... 6-8
Table 6-3 — Sky Coverage ........................................................................................................ 6-9
Table 6-4 — RCR Values and Corresponding Braking Action ........................................... 6-13
Table 6-5 — Reportable Visibility Values for TAFs............................................................. 6-17
Table 6-6 — TAF Icing and Turbulence Codes .................................................................... 6-18
Table 6-7 — Differences Between Military and International TAFs .................................. 6-24

JPATS AVIATION WEATHER BOOKLET
1-1 Version 3.2/Dec 08
JX101 - ATMOSPHERIC STRUCTURE
OVERVIEW This lesson will discuss the basic building blocks of the atmosphere, beginning with the lower layers in which most flight activity occurs. These layers have particular temperature characteristics that affect many aspects of weather, and thus are important to the understanding of later chapters. Pressure is another characteristic of the atmosphere which enables meteorologists to track weather phenomena as they move across the surface of the earth. Additionally, pressure is important to the aviation community since one of the most basic flight instruments, the barometric altimeter, operates from the action of atmospheric pressure upon its sensors. In order to gain a complete understanding of the altimeter, the effects of temperature and pressure variations on altimeter readings will also be discussed.
REFERENCES AFH 11-203, Weather for Aircrews, Volume 1, Chapters 1, 3, and 4.
THE ATMOSPHERE The atmosphere is the gaseous covering of the Earth. This envelope of air rotates with the Earth but also has a continuous motion relative to the Earth’s surface, called circulation. It is created primarily by the large temperature difference between the tropics and the polar regions, and is complicated by uneven heating of land and water areas by the Sun.
Atmospheric Layers If the Earth were compared to a baseball, the gaseous covering would be about as thick as the baseball’s cover (Figure 1-1).
Figure 1-1 — Thickness of the Earth’s Atmosphere
It is divided into layers that have certain properties and characteristics (Figure 1-2). The troposphere is the layer adjacent to the Earth’s surface. It varies in height from an average 55,000 feet over the equator to 28,000 feet over the poles.

JPATS AVIATION WEATHER BOOKLET
Version 3.2/Dec 08 1-2
Figure 1-2 — Atmospheric Layers and Lapse Rates The average height of the troposphere over the United States is 36,000 feet MSL, but pressure systems and seasonal differences cause a variance in the height. Due to heating, the troposphere extends to a greater height in summer than in winter. The atmosphere becomes less dense with altitude, and roughly 50% of it, by weight, lies below 18,000 feet and 90% within 53,000 feet. Within the troposphere, the temperature normally decreases with increasing altitude. Large amounts of moisture and condensation nuclei are found in the troposphere because of its closeness to the Earth’s surface, and nearly all weather occurs here. Winds are generally light near the Earth’s surface and increase with altitude. Wind speeds over 200 knots may occur near the top of the troposphere. An abrupt change in the rate of temperature decrease with increasing altitude marks the boundary, called the tropopause.
The tropopause is a transition zone between the troposphere and the stratosphere. The temperature in this layer is constant with altitude. The tropopause is important to aviators for several reasons. The strongest winds, those of the jet stream, occur just below the tropopause. Moderate to severe turbulence is sometimes associated with the wind shear caused by the jet stream. Contrails frequently form and persist near the tropopause since it is normally the coldest area within the lower atmosphere. While clouds and weather are generally confined to the troposphere, severe thunderstorm tops may penetrate the tropopause into the stratosphere. You can sometimes identify the tropopause while in-flight by the following characteristics: the average height of the tropopause over the US is 36,000 feet MSL, anvil tops of thunderstorms will spread out at the base of the tropopause, and a haze layer with a definite top frequently exists at the tropopause.
The stratosphere is characterized by increasing temperature with increasing altitude. This increase in temperature is due to the gas ozone, which plays a major part in heating the air at this altitude. Flying in the stratosphere is generally smooth with excellent visibility. The air is thin and offers very little resistance to the aircraft. The general lack of weather in this layer makes for outstanding flying.
JPATS AVIATION WEATHER BOOKLET
1-3 Version 3.2/Dec 08
Composition Air is a mixture of gases having weight, elasticity, and compressibility. Pure, dry air contains 78% nitrogen, 21% oxygen, a 1% mixture of 10 other gases. The atmosphere also contains water vapor amounting to 0% to 5% by volume. Water vapor (for ordinary considerations) acts as an independent gas mixed with air.
The atmosphere appears clear, but it contains many nongaseous substances such as dust and salt particles, pollen, etc, which are referred to as condensation nuclei. When these particles are relatively numerous, they appear as haze and reduce visibility.
Lapse Rates The decrease in atmospheric temperature with increasing altitude is called the temperature lapse rate. In order to determine how temperature changes with increasing altitude, meteorologists send up a weather balloon to take the temperature (among other readings) at different altitudes. The resulting temperature profile is known as the environmental lapse rate (a.k.a. the existing lapse rate, or ELR). The average or standard lapse rate is 2° Celsius (3.5° Fahrenheit) per 1000 feet. Even though this is the average lapse rate of the troposphere, close to the surface of the earth the ELR may indicate an increase, decrease, or a constant temperature when measured at increasing altitudes. These different ELRs give meteorologists a clue to the type of weather that exists, and there are names for these various types of ELRs, as well. The standard lapse rate is actually a shallow lapse rate (between 1.5 and 3.0° C/1000 ft). Any lapse rate greater than 3 °C/ 1,000 feet is called a steep lapse rate. An isothermal lapse rate indicates the temperature is the same at different altitudes, and an inversion is a lapse rate where the temperature increases with increasing altitude, such as occurs in the stratosphere. Inversions can be anywhere from a few hundred to a few thousand feet thick, and stable conditions are generally found within them. These three major types of lapse rates–the standard, isothermal, and inverted–are shown in Figure 1-2 as a graph of temperature vs. altitude overlaid on a profile of the atmosphere.
There is also a pressure lapse rate, which indicates the decrease in atmospheric pressure with increasing altitude, to be discussed next. Notice that the values used for lapse rates assume that a decrease is normal, thus positive lapse rates actually indicate a decrease in the value measured, and a negative lapse rate (only temperature has this characteristic) would indicate an increase.
Atmospheric Pressure
Pressure is force per unit area. Atmospheric (barometric) pressure is the pressure exerted on a surface by the atmosphere due to the weight of the column of air directly above that surface. For example, the average weight of air on a square inch of the Earth’s surface at sea level under standard conditions is 14.7 pounds. Pressure, unlike temperature, always decreases with altitude. In the lower layers of the atmosphere pressure decreases much more rapidly than it does at higher altitudes because density decreases as altitude increases.
Units of Measurement In the U.S., two units are used to measure and report atmospheric pressure: inches of mercury (in-Hg) and millibars (mb). Inches of mercury is a measure of the height of a column of mercury that can be supported by atmospheric pressure. The millibar is a direct representation of pressure,

JPATS AVIATION WEATHER BOOKLET
Version 3.2/Dec 08 1-4
which is defined as force per unit area. Normal sea level pressures in the atmosphere vary from as low as 28 in-Hg (about 960 mb) to as high as 31 in-Hg (about 1060 mb).
Some countries, particularly those using the metric system, use millibars for altimeter settings. However, in the United States and Canada altimeter settings are reported in inches of mercury.
The Standard Atmosphere For a standard reference, a concept called a standard day is used. In aviation, everything is related to standard day conditions at sea level, which are 29.92 in-Hg (1013.2 mb) and 15° C (59° F). In the lower atmosphere, and thus for most aviation applications, a 1000 foot increase in altitude will result in a pressure decrease of approximately 1 in-Hg (34 mb) and a temperature decrease of 2° C (3.5° F). These values are the standard day pressure and temperature lapse rates.
Pressure Charts The pressure at the Earth’s surface changes for several reasons. The most noted reason for this change is the movements of high and low pressure systems. The temperature and moisture content of air also affect surface pressures.
Meteorologists track these different weather systems by noting the pressure each time a weather observation is made and then forwarding all observations to the national weather service (NWS). The NWS then plots the weather on various charts. The resulting horizontal distribution of pressure across the Earth’s surface is depicted on weather charts by isobars, or lines of equal barometric pressure (Figure 1-3).
Figure 1-3 — Pressure Systems There are several standard types of pressure distribution patterns found on weather charts (Figure 1-3). A high-pressure area (or high)–where the pressure in the center is higher than the surrounding areas–may be thought of as a mountain on a surface pressure chart. Similarly, a low-pressure area–where the pressure in the center is lower than the surrounding areas–may be thought of as a basin or valley. A ridge is an extension of a high-pressure area, and a trough is an extension of a low-pressure area. There are certain characteristic winds and weather systems

JPATS AVIATION WEATHER BOOKLET
1-5 Version 3.2/Dec 08
associated with these pressure systems. For example, poor weather such as found with fronts and squall lines are generally associated with troughs and lows, while good weather is associated with highs and ridges.
Station and Sea Level Pressure Station pressure is the atmospheric pressure measured directly at an airfield or other weather station. Sea level pressure is the pressure that would be measured from the existing weather if the station were at mean sea level (MSL). This can be measured directly at sea level, or calculated if the station is not at sea level using the standard pressure lapse rate.
Surface analysis charts, such as the one in Figure 1-3, use MSL as the reference level for the depicted isobars (to provide a common reference), even though the pressure was first measured at a weather station. This is done so that daily pressure variations associated with weather systems can be tracked as they move across the country, as mentioned above. If, instead, station pressures were used, the pressure charts would depict the inverse of the land topography, reflecting the contour lines of a map. Mountain tops would always have lows over them, and valleys would have highs. In other words, high altitude stations such as Denver would always reflect lower pressure than surrounding stations at lower altitudes regardless of the day to day pressure variations that occur with passing weather systems. Thus, for pressure to be meaningful, all stations–even those far from the ocean–will report sea level pressure.
ALTITUDE MEASUREMENT Altitude is defined as the height above a given reference. The instrument that displays altitude in the cockpit is called an altimeter. The barometric altimeter is an aneroid barometer that is calibrated to display altitude in feet, as opposed to pressure in inches of mercury (Figure 1-4).
Figure 1-4 — Barometric Altimeter Since an altitude includes not only the height number, but also the reference, altimeters have a Kollsman window that shows the reference pressure, known as the altimeter setting. The altimeter setting is the value to which the scale of the pressure altimeter is set so the altimeter indicates true altitude at field elevation. It is very nearly equal to the station pressure corrected to mean sea level

JPATS AVIATION WEATHER BOOKLET
Version 3.2/Dec 08 1-6
pressure (not exact, but close enough for instructional purposes). An adjustment knob allows the altimeter setting to be changed. If the local altimeter setting is dialed in to the Kollsman window, the altimeter will indicate the altitude in feet above mean sea level (ft MSL). If 29.92 is set, the altimeter will indicate the altitude above the standard datum plane. These are the two altitudes most often displayed on the altimeter, MSL and pressure altitudes, and both are discussed in the next section.
Altitudes Indicated altitude is the altitude read directly from the altimeter. Since altimeters need no power (except for lighting–they operate by measuring the outside pressure), they will always indicate some value. Figure 1-4 shows an altitude of 5635 feet indicated. For an indicated altitude to be useful, however, the altimeter needs to have the correct reference for the situation by dialing either the local altimeter setting or 29.92 in to the Kollsman window. This way, the indicated altitude will be equal to either the MSL or the pressure altitude, which will be discussed later.
To illustrate, if an aircraft is parked at Sherman Field with the local altimeter setting in the Kollsman window, the indicated altitude should be the same as the airfield elevation, and the indicated altitude will be an MSL altitude. Therefore, the altimeter should indicate approximately 30 feet MSL since Sherman Field is 30 feet above mean sea level.
Altimeters are subject to mechanical errors caused by installation, misalignment, and positioning of the static ports that measure the pressure. Collectively, these errors are referred to as instrument error. Instrument error is determined prior to takeoff by noting the difference between field elevation and indicated altitude. For example, an aircraft taking off from Sherman Field (elevation +30 ft MSL) with an indicated altitude of 70 ft would have an instrument error of +40 ft. If the instrument error is in excess of 75 ft, the aircraft is considered unsafe for instrument flight. Calibrated altitude is indicated altitude corrected for instrument error.
Mean Sea Level (MSL) or True altitude is the actual height above mean sea level (MSL). It is found by correcting calibrated altitude for temperature deviations from the standard atmosphere. On a standard day, MSL/true altitude is equal to calibrated altitude. If there is no instrument error, true altitude would also be equal to indicated altitude. Mean Sea Level/MSL altitude is very important since airfields, hazards, and terrain elevations are stated in feet above mean sea level.
AGL or absolute altitude is the aircraft’s height above the terrain directly beneath the aircraft and is measured in feet above ground level (AGL). Absolute altitude is not normally displayed on an altimeter, but it can be calculated by subtracting the terrain elevation from the true altitude. Additionally, it can be displayed directly on a radar altimeter.
Pressure altitude is the height above the standard datum plane. The standard datum plane is the actual elevation above or below the earth’s surface at which the barometric pressure is 29.92 in-Hg. Federal Aviation Rules (FAR) require that all aircraft operating above 18,000 feet MSL set 29.92 in to the altimeter to ensure consistent altitude separation. Since most mountains in the U.S. are well below 18,000 feet MSL, there is less concern with terrain avoidance than with aircraft separation above that altitude. Thus, a pilot flying a pressure altitude will have an altimeter setting of 29.92 instead of the local altimeter setting. In short, a pressure altitude is the height above the place in the atmosphere where the pressure is 29.92 in-Hg. Whether this place is above, below, or coincides with sea level is of little concern.

JPATS AVIATION WEATHER BOOKLET
1-7 Version 3.2/Dec 08
When aircraft fly pressure altitudes, they are assigned a flight level (FL) of three digits, representing hundreds of feet above 29.92. As an example, an aircraft assigned FL250 (pronounced “flight level two five zero”) would be flying a pressure altitude, and the pilot would fly the aircraft so that the altimeter reads 25,000 feet with 29.92 in the Kollsman window. These above altitude definitions are illustrated in Figure 1-5.
Figure 1-5 — Altitudes Density altitude (DA) is pressure altitude corrected for nonstandard temperature deviations. On a hot day, air molecules are farther apart, decreasing the air density and increasing the density altitude. In this situation, the DA of an airfield would be higher than both the published field elevation and the pressure altitude. The opposite is true on a colder day: Increased air density causes a decreased density altitude and a DA lower than the published field elevation and the pressure altitude.
Density altitude is not a height reference; rather, it is an index to aircraft performance. It affects airfoil, engine, propeller, and rotor performance. Thrust is reduced because a jet engine has less mass (air) to compress. Lift is also reduced due to thinner air. Additionally, higher density altitudes result in longer takeoff and landing distances and a reduced rate of climb. Takeoff distances are longer since reduced thrust requires a longer distance to accelerate to takeoff speed. Landing distances are longer since a higher true airspeed is required to land at the same indicated airspeed. Climb rate is decreased because of reduced available thrust. At certain high density altitudes, takeoffs and/or single-engine flight (loss of one engine after becoming airborne) are not possible due to limitations of thrust, lift, and runway length. Table 1-1 summarizes the effects of temperature on aircraft performance. Moisture affects aircraft performance in the same manner as temperature, but to a much lesser degree.
HIGH TEMPERATURE OR MOISTURE LOW TEMPERATURE OR MOISTURE
Lower Air Density Higher Air Density

JPATS AVIATION WEATHER BOOKLET
Version 3.2/Dec 08 1-8
Higher Density Altitude Lower Density Altitude
Decreased Thrust and Lift Increased Thrust and Lift
Longer Takeoffs and Landings Shorter Takeoffs and Landings
Table 1-1 — Density Altitude Effects on Aircraft Performance
Altimeter Errors
When an aircraft flies from one place to another at a constant indicated altitude (by referencing the barometric altimeter), it is flying along a surface of constant pressure. Figure 1-6 shows the path of an aircraft as it follows such a constant pressure surface–done by flying a constant indicated altitude. As the sea level pressure on the surface decreases (all other conditions remaining the same), the whole column of air aloft is lowered, causing an aircraft flying at an assigned MSL altitude to descend to a lower AGL altitude. Only by updating the reference of the altimeter setting can this potential problem be eliminated, and a more constant AGL altitude can be maintained.
Figure 1-6 — Constant Indicated Altitude with Decreasing Surface Pressure This updating is accomplished via radio throughout the flight. Usually, when switching to a different air traffic controller–about every 50-100 miles–an updated altimeter setting will also be passed to the aircrew. This ensures that all aircraft in a given area are flying at the correct altitudes (up to FL180). A change in pressure of 0.10 in-Hg will change the altimeter reading 100 feet. Therefore, it is imperative to receive a current altimeter setting at your destination prior to landing. If the altimeter is not adjusted and your flight path takes you into an area of lower MSL pressure the aircraft will be lower than the altimeter indicates. Conversely, if your flight path takes you into an area of higher MSL pressure, the aircraft will be higher than the altimeter indicates. These events are summarized by a set of rhymes, as well as by Table 1-2.
Rule: High to Low, Look Out Below
The aircraft is lower than indicated, thus the indicated altitude is higher than the aircraft.
Pressure

JPATS AVIATION WEATHER BOOKLET
1-9 Version 3.2/Dec 08
Rule: Low to High, Plenty of Sky
The aircraft is higher than indicated, thus the indicated altitude is lower than the aircraft.
PRESSURE CHANGE ALTIMETER ACTUAL MSL ALTITUDE
Flying toward lower MSL pressure
Indicates higher than actual Lower than indicated by the altimeter
Flying toward higher MSL pressure
Indicates lower than actual Higher than indicated by the altimeter
Table 1-2 — Pressure Change vs. Indicated and MSL Altitude
Aircraft altimeters are calibrated for a standard lapse rate. An incorrect altitude indication will result if the temperature deviates from the standard. For every 11 °C that the temperature varies from the standard, the altimeter will be in error by 4%. If the air is colder than the standard atmosphere, the aircraft will be lower than the altimeter indicates. If the air is warmer than standard, the aircraft will be higher than the altimeter indicates (Table 1-3, and Figures 1-7 and 1-8). You may notice that the rules presented in the pressure section, above, also apply to temperature deviations.
TEMPERATURE CHANGE ALTIMETER ACTUAL MSL ALTITUDE
Flying from standard temp. toward lower temp.
Indicates higher than actual lower then indicated
Flying from standard temp. toward higher temp.
Indicates lower than actual Higher than indicated
Table 1-3 — Temperature Deviation vs. Indicated and MSL Altitude
Temperature

JPATS AVIATION WEATHER BOOKLET
Version 3.2/Dec 08 1-10
Figure 1-7 — Constant Indicated Altitude with Decreasing Temperature
Figure 1-8 — Temperature Deviation vs. Indicated and MSL Altitude Figures 1-7 and 1-8 show that as you fly from warm to cold air, an altimeter will read too high–the aircraft is lower than the altimeter indicates. Over flat terrain, this lower true reading is no great problem; other aircraft in the vicinity are also flying indicated altitudes resulting from the same temperature and pressure conditions, and the altimeter readings are compatible because the errors result from the same conditions.
Since these deviations due to temperature are usually relatively small, these errors are often ignored in the early stages of flight training, and calibrated altitude is often treated directly as true altitude. However, toward the advanced stages, tactical accuracy becomes paramount, and temperature effects cannot be ignored. For example, when flying in cold weather over mountainous terrain, you must take this difference between indicated and true altitude into account by calculating a correction to the indicated altitude.

JPATS AVIATION WEATHER BOOKLET
1-11 Version 3.2/Dec 08
ATMOSPHERIC STRUCTURE REVIEW QUESTIONS
1. At the top of the troposphere, there is a transition zone called the ______.
a. tropopause
b. ozone layer
c. atmospheric layer
d. stratosphere
2. The two lower layers of the atmosphere are the ______ and ______,
a. tropopause; mesosphere
b. troposphere; stratosphere
c. tropopause; stratopause
d. mesosphere; thermosphere
3. Which one of the following best describes the flight conditions found in the stratosphere?
a. The strongest winds occur in the stratosphere.
b. Contrails frequently form and persist in this part of the atmosphere.
c. 50% of the atmosphere, by weight, is found in the stratosphere.
d. Flying in the stratosphere is generally smooth with excellent visibility.
4. What is the standard temperature lapse rate of the atmosphere in °Celsius per 1000 feet?
a. 1.5
b. 2.0
c. 3.0
d. 3.5
5. Using the standard lapse rate, a pilot flying at 10,000 ft MSL and at a temperature of -8° C should do what to find an altitude at which the temperature is +4 °C?
a. Descend to approximately 2000 feet MSL
b. Descend to approximately 4000 feet MSL
c. Descend to approximately 6000 feet MSL
d. Climb to find an inversion
JPATS AVIATION WEATHER BOOKLET
Version 3.2/Dec 08 1-12
6. A condition where the air temperature aloft is higher than that of the lower atmosphere is generally referred to as ______,
a. a low-pressure area
b. turbulence
c. a temperature inversion
d. convection currents
7. Which one of the following best describes the change in atmospheric pressure with increasing altitude?
a. Increases
b. Decreases
c. May increase or decrease, depending on weather conditions
d. Remains constant
8. Which one of the following correctly lists the standard day conditions of sea level pressure, temperature, pressure lapse rate, and temperature lapse rate?
a. 30.00 in-Hg, 15° C, 1.5 in-Hg/1000', 3.0° C/1000'
b. 29.92 in-Hg, 59° C, 34 in-Hg/100', 5° C/100'
c. 29.92 in-Hg, 15° C, 1 in-Hg/1000', 2° C/1000'
d. 30.02 in-Hg, 20° C, 2 in-Hg/1000', 1° C/1000'
9. The horizontal distribution of pressure on the Earth’s surface is depicted on weather charts by ______.
a. isotherms
b. isotachs
c. isogonic lines
d. isobars
10. The weight of the air mass over any point on the Earth’s surface defines ______.
a. density altitude
b. atmospheric pressure
c. pressure altitude
d. true weight

JPATS AVIATION WEATHER BOOKLET
1-13 Version 3.2/Dec 08
11. The quantities 1013.2 mb and 29.92 in-Hg are two different expressions for the ______.
a. atmospheric density at a standard air temperature of 15° C
b. atmospheric pressure at sea level at an air temperature of 0° C
c. standard atmospheric pressure at mean sea level and at a standard air temperature of
15° C
d. weight of the atmosphere at the surface of the Earth
12. In the lower 5000 feet of the atmosphere, a decrease of one inch of mercury in atmospheric pressure would cause a change in an altimeter reading of approximately ________ feet (assuming constant elevation and altimeter setting).
a. minus 100
b. plus 100
c. minus 1000
d. plus 1000
13. Which one of the following correctly describes the meteorological feature of a trough?
a. An elongated area of relatively low pressure
b. An elongated area of relatively high pressure that extends from the center of a High pressure area.
c. An area where the pressure in the center is higher than the surrounding areas
d. A long shallow often V-shaped receptacle for the drinking water or feed of domestic animals
14. Which one of the following items would have a value closest to that used as a Kollsman window setting for an altimeter in the U.S. (assuming an airfield above sea level)?
a. Station pressure
b. Station temperature
c. AGL pressure
d. Sea level pressure
15. The height of an aircraft above the ground is known as ______.
a. MSL/True altitude
b. AGL/absolute altitude
c. indicated altitude (IA)
d. pressure altitude (PA)

JPATS AVIATION WEATHER BOOKLET
Version 3.2/Dec 08 1-14
16. Which one of the following types of altitudes would be assigned in the U.S. above 18,000 feet MSL?
a. MSL/True altitude
b. AGL/absolute altitude
c. Indicated altitude (IA)
d. Pressure altitude (PA)
17. Density altitude is ______.
a. the same as an MSL/True altitude.
b. pressure altitude corrected for nonstandard field elevations.
c. an indicator of aircraft performance.
d. the height above the standard datum plane.
SITUATION FOR ITEMS 18-20: The altimeter setting at Randolph AFB is 29.85 in-Hg, and at Vance AFB, the altimeter setting is 30.15 in-Hg. A pilot sets the altimeter correctly at Randolph and flies to Vance at an indicated altitude of 5000 feet without changing the altimeter setting.
18. Assuming a standard lapse rate, what is the MSL/true altitude when flying over Vance at the assigned indicated altitude?
a. 4700 feet
b. 5000 feet
c. 5030 feet
d. 5300 feet
19. If Vance’s elevation is 1307' MSL, what is the AGL/absolute altitude over Vance?
a. 3393 feet
b. 3693 feet
c. 3723 feet
d. 3993 feet
20. If the pilot lands successfully at Vance (elevation 1307' MSL) without resetting the altimeter, what altitude will the altimeter indicate?
a. 0 feet
b. 1007 feet
c. 1307 feet
d. 1607 feet

JPATS AVIATION WEATHER BOOKLET
Version 3.2/Dec 08 2-1
JX102 - ATMOSPHERIC MECHANICS
OVERVIEW This chapter covers a wide range of topics that are basic to the understanding of weather phenomena. After an introduction to the meteorological station model, which will be used in this chapter mainly to show wind direction in diagrams, we build upon the pressure basics presented in Chapter 1 to determine why winds blow in the particular direction that they do. To keep our analysis as simple as possible, we will focus only on winds in the Northern Hemisphere. Since winds and some forces in the Southern Hemisphere are a mirror image, discussing both patterns at this stage would unnecessarily complicate things for a first-time introduction to weather.
The next topic covered is atmospheric moisture. Since most weather hazards have something to do with moisture, it is important to understand how air becomes saturated, and how this will affect the formation of clouds, fog, and precipitation. In fact, the two main types of precipitation match up with two types of clouds. Clouds are additionally classified according to the altitude of their bases, and we cover four major cloud types in this chapter. Eventually–and usually more often than desired–all aviators will fly into clouds, and thus an understanding of cloud composition and activity will be essential to this course.
Additionally, cloud types can be a visual signal of atmospheric stability or instability. These two conditions can be a further indication to meteorologists as well as to aircrew regarding the various weather and flight conditions that may be encountered. As you will read, there can be great differences in the expected weather found between stable and unstable conditions, each with their own particular hazards to flight. Consequently, knowing the relationships between atmospheric stability and flight conditions could prove invaluable to an aviator.
REFERENCES AFH 11-203, Weather for Air Crews, Volume 1, Chapters 2, 5, 6, and 9
WINDS Understanding the causes of wind and wind direction is essential to the safe operation of an aircraft. Takeoffs and landings are best performed into a headwind, whereas landing with a strong crosswind can be dangerous, to say the least. In addition, the circulation of air brings about changes in weather by transporting water vapor, and, therefore, wind plays an important role in the formation of fog, clouds, and precipitation.
So how does one determine the wind direction? Wind direction is always expressed in terms of the direction from which it is blowing. This convention holds throughout the world–civilian or military, weather or navigation, aviation or sailing–wind always blows from a particular direction. Thus, it would be best for a student to master this particular concept as early as possible in a career where wind is an everyday concern.
There are many different ways that weather phenomenon, such as wind, are annotated on charts or in print. One of these methods is the use of a station model. Since the basics of station models will be used throughout this course, they will be discussed in the next section. In Chapter 7, when other chart features are explained, it will be assumed that station models are understood.

JPATS AVIATION WEATHER BOOKLET
2-2 Version 3.2/Dec 08
Station Models Some weather charts display the information gathered from individual weather stations through the use of the station model, shown in Figure 2-1. This model begins with a circle (or a square for automated stations) at the center to represent the location of the station that issued the weather report. Around the station symbol, data describing wind, temperatures, weather, and pressures are displayed in a pictorial shorthand (Figure 2-2) to provide the maximum amount of data in a minimum of space.
Another noticeable feature of the station model is a line coming out of the circle indicating the wind direction. Since the station models are aligned for ease of reading, north is at the top of the page. Therefore, in Figure 2-1, the winds are from the northwest. At the end of this stick are any numbers of barbs, which come in three shapes, to indicate the wind speed. A long barb represents 10 knots, short barbs are 5 knots, and pennants are 50 knots.
The numbers to the left of the station symbol indicate the temperature (top left) and dew point (bottom left). In between the temperature and dew point, there may be a symbol from Figure 2-2 representing the present weather at the station. Additionally, the circle (or square) may be filled in to represent the amount of sky that is covered by clouds, in eighths. An empty circle would mean clear skies, while a fully darkened circle would indicate a completely overcast sky (also from Figure 2-2).
The right-hand side of the station model describes the pressure at the station. On the top right, there will be three digits to represent the sea level pressure (SLP) in millibars and tenths. Since SLP will always be somewhere around 1000 millibars, the hundreds digit (and thousands, if present) is dropped, and the decimal point is also omitted. Thus, depicted pressures beginning with large numbers (such as a 9) really start with a hidden “9”, and pressures beginning with small numbers (such as a 1) actually have a “10” in front of them. Below the current SLP is the pressure tendency over the last 3 hours, beginning with a (+) or (-) sign to denote an overall rise or fall, and then the value of that total pressure change. After this notation is a set of two connected line segments that graphically show the pressure change over those three hours, as indicated on the right-hand side of Figure 2-2.

JPATS AVIATION WEATHER BOOKLET
Version 3.2/Dec 08 2-3
Figure 2-1 — Station Model
Figure 2-2 — Major Station Model Symbols

JPATS AVIATION WEATHER BOOKLET
2-4 Version 3.2/Dec 08
Large Scale Wind Patterns Now that we have presented an understanding of station models, it may be easier to understand how pressure and wind fit together by imagining how a surface analysis chart is constructed, such as the one pictured in Figure 2-3. While most of these are built automatically by computer, picture a meteorologist at the National Weather Service starting with a U.S. map covered only with station models. The first thing she would do is to start playing “connect the dots” by finding stations with the same pressures, and drawing isobars between them (as discussed in Chapter 1). These isobars are drawn, as a standard, with 4 millibars of space between each line, and they are labeled accordingly. At this point, it would become clear where the low and high pressure systems are located, and she could draw either a big red “L” or a blue “H” to signify these locations. Finally, she could draw other symbols, such as fronts and troughs, as needed, depending on the chart type. However, we now have enough of a picture to move onward in the discussion of winds.
Figure 2-3 — Typical Surface Analysis Chart

JPATS AVIATION WEATHER BOOKLET
Version 3.2/Dec 08 2-5
Notice that the winds in Figure 2-3 are moving in generally the same direction in the areas between each of the pressure systems. If you look closely, you may even notice that the winds are moving almost parallel to the isobars, in most situations. After enough observation, you may also recognize a pattern of air circulation around high and low- pressure systems. In fact, each of these characteristics is a result of pressure differences causing the air to circulate in a consistent pattern: parallel (or almost parallel) to isobars, clockwise around high pressure, and counterclockwise around low pressure. Next, we will discuss why winds blow in this fashion.
Pressure Gradients The spacing of isobars indicates the rate of pressure change over a horizontal distance. In Figure 2-4, the isobars are more closely spaced to the east than they are to the west, indicating that pressure changes more rapidly on the eastern side. The rate of pressure change in a direction perpendicular to the isobars (horizontal distance) is called the pressure gradient, and this isobar spacing represents the size of the pressure gradient force (PGF). The PGF is steep, or strong, when isobars are close together, and is shallow, or weak, when the isobars are far apart–the steeper the gradient, the stronger the winds. The PGF is the initiating force for all winds.
Figure 2-4 — Pressure Gradient Force Atmospheric circulation moves air in mainly two ways: ascending and descending currents. When the air descends, the downward force against the Earth creates a high- pressure system on the surface. The air then can only spread out and diverge, moving across the surface of the earth, producing the horizontal flow of air known as wind. Likewise, air moving upward, away from the Earth results in a low at the surface, and air tries to converge toward the center of the low, also producing wind.
However, the wind cannot and does not blow straight out of a high and into a low. These motions are only the result of the pressure gradient force, pictured for each pressure system in Figure 2-5.

JPATS AVIATION WEATHER BOOKLET
2-6 Version 3.2/Dec 08
Figure 2-5 — Pressure Gradient Force
Gradient Winds While the pressure gradient force causes air to flow from high pressure to low pressure across the isobar pattern, another force acts upon the wind to determine its direction. The Coriolis force, created by the Earth’s rotation, diverts the air to the right–with respect to its initial direction of motion–regardless of whether the air is near a high or a low pressure system. The result of these two forces is the gradient winds, which flow perpendicular to the pressure gradient force. This also means that gradient winds flow parallel to the isobars (Figure 2-6), and the resulting circulation flows clockwise around highs, and counterclockwise around lows. Finally, gradient winds are found above 2000 feet AGL.
Figure 2-6 — Gradient Winds Flow Parallel to Isobars (Found Aloft)

JPATS AVIATION WEATHER BOOKLET
Version 3.2/Dec 08 2-7
Surface Winds When we consider winds below 2000 feet AGL, we cannot ignore the role of surface friction in the analysis of wind direction. Surface friction reduces the speed of the wind, which causes a reduction in the Coriolis force. This results in a different set of forces that must be balanced: the PGF, Coriolis force, and friction. When the new balance of forces is reached, the air blows at an angle across the isobars from high pressure to low pressure. This angle varies as a result of the type of terrain, but for our purposes, we will assume a 45° angle (Figure 2-7). Another way to think of this effect is that the Coriolis force still tries to turn the wind to the right, from its initial intended direction of the PGF, but it does not turn to the right quite as much as with gradient winds. Thus, surface winds still move clockwise around highs, and counterclockwise around lows, but since they blow across the isobars at a 45° angle, they also have a component of motion that moves air out of the high pressure and into the low.
Figure 2-7 — Surface Winds Are Deflected Across Isobars Toward Lower Pressure
Movement of Pressure Systems and Large Scale Wind Patterns Weather in the Temperate Zone (which includes the U.S.) and farther north, changes almost constantly with the passage of highs and lows. These migrating systems move from west to east with the prevailing westerly winds. They are accompanied by wind shifts, and with some exceptions, large and rapid changes in temperature and broad areas of precipitation. These systems furnish the most significant means of heat transfer between high and low latitudes.
The Jet Stream
Wind speeds generally increase with height through the troposphere, reaching a maximum near the tropopause, and often culminating in the jet stream. The jet stream is a narrow band of strong winds of 50 knots or more that meanders vertically and horizontally around the hemisphere in wave-like patterns. The jet streams (polar and subtropical) have a profound influence on weather patterns.

JPATS AVIATION WEATHER BOOKLET
2-8 Version 3.2/Dec 08
These winds average about 100-150 knots but may reach speeds in excess of 250 knots (Figure 2-8). Since the jet stream is stronger in some places than in others, it rarely encircles the entire hemisphere as a continuous river of wind. More frequently, it is found in segments from 1000 to 3000 miles in length, 100 to 400 miles in width, and 3000 to 7000 feet in depth.
The average height of jet stream winds is about 30,000 feet MSL, but they can be above or below this level depending on the latitude and the season. During the winter, the position of the jet stream is further south, the core descends to lower altitudes, and its speed is faster than in the summer.
Figure 2-8 — Jet Stream The existence of jet streams at operational altitudes requires additional aircrew flight planning consideration. The greater headwind component for westbound aircraft will increase fuel consumption and may require additional alternate landing fields along the route. Wind shear associated with the jet stream may also cause turbulence, forcing the aircrew to change altitude or course.
Local Winds The term “local,” in the case of wind systems, applies to areas whose sizes range from tens of miles across, to long, geographically thin areas. The local wind systems created by mountains, valleys, and water masses are superimposed on the general wind systems and may cause significant changes in the weather.
The differences in the specific heat of land and water cause land surfaces to warm and cool more rapidly than water surfaces through insulation and terrestrial radiation. Therefore, land is normally warmer than the ocean during the day and colder at night. This difference in
Sea and Land Breezes

JPATS AVIATION WEATHER BOOKLET
Version 3.2/Dec 08 2-9
temperature is more noticeable during the summer and when there is little horizontal transport of air in the lower levels of the atmosphere. In coastal areas, this difference of temperature creates a tendency for the warmer, less dense air to rise, and the cooler, denser air to sink, which produces a pressure gradient. During the day, the pressure over the warm land becomes lower than that over the colder water. The cool air over the water moves toward the lower pressure, replacing the warm air over the land that moved upward. The resulting onshore wind, blowing from the sea, is called a sea breeze, with speeds sometimes reaching 15 to 20 knots (Figure 2-9).
Figure 2-9 — Sea Breeze
Figure 2-10 — Land Breeze At night, the circulation is reversed so that the air movement is from land to sea, producing an offshore wind called the land breeze (Figure 2-10). The sea breezes are usually stronger than the land breezes, but they seldom penetrate far inland. Both land and sea breezes are shallow in depth, and their existence should be considered during takeoff and landing near large lakes and oceans.

JPATS AVIATION WEATHER BOOKLET
2-10 Version 3.2/Dec 08
In the daytime, mountain slopes are heated by the Sun’s radiation, and in turn, they heat the adjacent air through conduction. This air usually becomes warmer than air farther away from the slope at the same altitude, and, since warmer air is less dense, it begins to rise (Figure 2-11). It cools while moving away from the warm ground, increasing its density. It then settles downward, towards the valley floor, completing a pattern of circulation (not shown in Figure 2-11). This downward motion forces the warmer air near the ground up the mountain, and since it is then flowing from the valley, it is called a valley wind.
Figure 2-11 — Mountain and Valley Winds At night, the air in contact with the mountain slope is cooled by outgoing terrestrial radiation and becomes more dense than the surrounding air. As the denser air flows downhill, from the top of the mountain, it is called the mountain wind, and a circulation opposite to the daytime pattern forms.
These winds are of particular importance for light aircraft, helicopter, and low-level operations. In mountainous areas where the performance of some fixed-wing aircraft or helicopters is marginal, the location of mountain and valley winds can be critical.
Mountain and Valley Winds

JPATS AVIATION WEATHER BOOKLET
Version 3.2/Dec 08 2-11
ATMOSPHERIC MOISTURE Moisture is water in any of its three states: solid, liquid, or gas. As water changes from one state to another, it releases (or absorbs) heat to (or from) the atmosphere. For example, when water in the atmosphere freezes, it releases heat into the air, and the air becomes warmer. Air can hold only a certain amount of water, however, depending on the air temperature. The higher the temperature, the more water vapor the air can hold (Figure 2-12). The air reaches saturation when it contains the maximum amount of water vapor it can hold for that temperature.
Figure 2-12 — Example of Increased Water Vapor Capacity of Warmer Air The dew point temperature (TD) is the temperature at which saturation occurs. The dew point is a direct indication of the amount of moisture present in the air. The higher the dew point, the greater chances for clouds, fog, or precipitation.
If there is a difference between the air temperature and the dew point temperature, this is known as the dew point depression, or dew point spread, and the dew point will always be the lower of the two. The dew point can never be higher than the air temperature: only equal to or less than. This spread provides a good indication of how close the atmosphere is to the point of saturation. When the dew point depression reaches about 4° F, the air is holding close to the maximum amount of water vapor possible. If this spread continues to decrease, moisture will begin to condense from the vapor state to the liquid (or solid) state, and become visible. This visible moisture can form dew or frost on exposed surfaces, fog near the ground, or clouds higher in the atmosphere.
Another measure of atmospheric moisture is the relative humidity (RH), which is the percent of saturation of the air. The air can become saturated (RH = 100%) by one of two ways. If the air is cooled, the falling air temperature decreases the dew point spread closer to zero, while the RH rises closer to 100%. If evaporation occurs, this adds moisture to the atmosphere, increasing the dew point, which again lowers the dew point spread and increases the RH. Once the dew point spread reaches 4° F, the RH will be 90%, and the water vapor will begin to condense into fog or clouds. Any further cooling or evaporation will produce precipitation, as there will be more water present in the air than it can hold.

JPATS AVIATION WEATHER BOOKLET
2-12 Version 3.2/Dec 08
Characteristics and Types of Precipitation The characteristics and types of precipitation reveal information about various atmospheric processes. The nature of precipitation may give a clue about a cloud’s vertical and horizontal structure, or indicate the presence of another cloud deck aloft. The three characteristics of precipitation are:
1. Showers - Characterized by a sudden beginning and ending, and abruptly changing intensity and/or sky conditions. Showers are associated with cumuliform clouds.
2. Continuous - Also known as steady (not showery). Intensity changes gradually, if at all. Continuous precipitation is associated with stratiform clouds.
3. Intermittent - Stops and restarts at least once during the hour. Intermittent precipitation may be showery or steady, and therefore may be associated with cumuliform or stratiform clouds.
Precipitation takes many forms. Only a few of the more common types of precipitation are mentioned here.
1. Drizzle – Very small droplets of water that appear to float in the atmosphere.
2. Freezing drizzle – Drizzle that freezes on impact with objects.
3. Rain – Precipitation in the form of water droplets that are larger than drizzle and fall to the ground.
4. Freezing rain – Rain that freezes on impact with objects.
5. Hail or graupel – A form of precipitation composed of irregular lumps of ice that develop in severe thunderstorms, consisting of alternate opaque and clear layers of ice in most cases. Water drops, which are carried upward by vertical currents, freeze into ice pellets, start falling, accumulate a coating of water, and are carried upward again, causing the water to freeze. A repetition of this process increases the size of the hailstone. It does not lead to the formation of structural ice, but it can cause structural damage to aircraft.
6. Ice pellets or sleet – Small translucent and irregularly shaped particles of ice. They form when rain falls through air with temperatures below freezing. They usually bounce when hitting hard ground and make a noise on impact. Ice pellets do not produce structural icing unless mixed with super-cooled water.
7. Snow – White or translucent ice crystals, usually of branched hexagonal or star-like form that connect to one another forming snowflakes. When condensation takes place at temperatures below freezing, water vapor changes directly into minute ice crystals. A number of these crystals unite to form a single snowflake. Partially melted, or “wet” snow, can lead to structural icing.
8. Snow grains – Very small white, opaque grains of ice. When the grains hit the ground, they do not bounce or shatter. They usually fall in small quantities from stratus-type clouds, never as showers.
9. Precipitation, depending on the type and intensity, affects aviation in many ways:
Visibility in light rain or drizzle is somewhat restricted. In heavy rain or drizzle, it may drop to a few hundred feet. Rain or drizzle streaming across a windscreen further restricts forward visibility. Snow can greatly reduce visibility and can lead to a total lack of forward vision.

JPATS AVIATION WEATHER BOOKLET
Version 3.2/Dec 08 2-13
Very heavy rain falling on a runway may cause hydroplaning. During hydroplaning, the tires are completely separated from the runway surface by a thin film of water. Tire traction becomes negligible, and the wheels may stop rotating. The tires now provide no braking capability and do not contribute to directional control of the aircraft. Loss of control may result.
If there is enough wet snow on the runway, it tends to pile up ahead of the tires during takeoff. This can create sufficient friction to keep the aircraft from reaching rotation speed and becoming airborne.
Heavy rain ingested into the engines of a jet or turboprop aircraft in flight can cause power loss or even flameout.
Hail can cause serious damage to any aircraft, but so can rain if it is penetrated at very high speed.
CLOUDS Clouds may be defined as the visible manifestation of weather. With some knowledge of the weather conditions that cause clouds to develop, a pilot can get an excellent picture of the weather environment and can make a reasonable forecast of the weather conditions to follow. The most important element in the formation of clouds is water vapor.
General Theory of Clouds Clouds are condensed water vapor, consisting of water droplets or ice crystals. They form when the air becomes saturated either by being cooled to the dew point or through the addition of moisture. Most clouds are the result of cooling from some lifting process, such as surface heating. The excess moisture condenses on minute particles in the atmosphere, thus forming droplets.
Condensation Nuclei Water vapor requires a surface on which to condense. An abundance of microscopic solid particles, called condensation nuclei, are suspended in the air and provide condensation surfaces. Condensation nuclei consist of dust, salt crystals from the sea, acid salts from industrial waste, ash and soot from volcanoes and forest fires, rock particles from wind erosion, and organic matter from forests and grass lands. The most effective condensation nuclei are the various salts since they can induce condensation or sublimation even when air is almost, but not completely, saturated.
Types of Clouds Clouds provide visible evidence of the atmosphere’s motions, water content, and degree of stability and are therefore weather signposts in the sky. They can be numerous or widespread, form at very low levels, or show extensive vertical development.
Knowledge of principal cloud types helps the aircrew member when being briefed to visualize expected weather conditions. Knowledge of cloud types will also help the pilot recognize potential weather hazards in flight. Clouds are classified according to their appearance, form, and altitude of their bases, and may be divided into four groups:
1. Low clouds, ranging from just above the surface to 6500 feet AGL.

JPATS AVIATION WEATHER BOOKLET
2-14 Version 3.2/Dec 08
2. Middle clouds with bases between 6500 and 20,000 feet AGL.
3. High clouds found above 20,000 feet AGL.
4. Special clouds with extensive vertical development.
The height of the cloud base, not the top, determines the classification. A cloud with a base at 5000 feet AGL and a top at 8000 feet AGL is classified as a low cloud. Each group is subdivided by appearance. There are two principal cloud forms:
1. Cumuliform – A lumpy, billowy cloud with a base showing a definite pattern or structure.
2. Stratiform – A cloud with a uniform base, formed in horizontal, sheet-like layers.
Cloud bases in this category range from just above the surface to 6500 feet AGL (Figure 2-13). Low clouds are mainly composed of water droplets. The low clouds have no special prefix attached to their name. However, if the word nimbo or nimbus appears, beware that these clouds are producing violent, or heavy, precipitation.
Figure 2-13 — Stratus Clouds
Low clouds frequently present serious hazards to flying. The most serious hazard is the proximity of the cloud base to the surface of the Earth. Some of the low cloud types hide hills, making a collision with the terrain a very real danger, and visibility within low clouds is very poor. Low clouds may also hide thunderstorms. If the clouds are at or below freezing temperatures, icing may result. Icing accumulates faster in low clouds since they are generally
Low Clouds

JPATS AVIATION WEATHER BOOKLET
Version 3.2/Dec 08 2-15
denser than middle and high clouds. Turbulence varies from none at all to moderate turbulence. Expect turbulence in and below the clouds. Precipitation from low clouds is generally light rain or drizzle.
In this category, cloud bases form between 6500 and 20,000 feet AGL. The names of the middle clouds will contain the prefix alto- (Figure 2-14). They are composed of ice crystals, water droplets, or a mixture of the two.
Figure 2-14 — Altocumulus Clouds A special cloud, nimbostratus, produces continuous rain, snow, or ice pellets. The cloud base will extend down to about 1000 feet AGL, and fog is often present. Expect poor visibility and low ceilings with very slow clearing.
Visibility in middle clouds varies depending on cloud density from ½ mile to a few feet. Turbulence may be encountered in middle clouds. Frequently these clouds are dark and turbulent enough to make formation flying difficult. Icing is common due to the presence of super-cooled water droplets. Rain, rain and snow mixed, or snow can be encountered in thick middle clouds.
Virga, which is rain or snow that evaporates before reaching the ground, may be encountered below these clouds.
In this category, cloud bases average 20,000 to 40,000 feet AGL. The names of the high clouds will contain the prefix cirro- or the word cirrus (Figure 2-15).
High clouds have little effect on flying except for moderate turbulence and limited visibility associated with dense jet stream cirrus. Since high clouds are composed mostly of ice crystals, they have no precipitation and do not constitute an icing hazard. Severe or extreme turbulence is often found in the anvil cirrus of thunderstorms.
Middle Clouds
High Clouds

JPATS AVIATION WEATHER BOOKLET
2-16 Version 3.2/Dec 08
Figure 2-15 — Cirrus Clouds
This category consists of towering cumulus and cumulonimbus clouds. The bases of these clouds are found at the low to middle cloud heights and their tops extend through the high cloud category. Figure 2 - 16 shows cumulonimbus clouds.
Figure 2-16 — Cumulonimbus Clouds Towering cumulus are clouds nearing the thunderstorm stage. They can produce heavy rain showers and moderate turbulence in and near the cloud. Icing is common above the freezing level.
Special Clouds with Extensive Vertical Development

JPATS AVIATION WEATHER BOOKLET
Version 3.2/Dec 08 2-17
Cumulonimbus clouds are thunderstorm clouds. A cumulonimbus cloud is sometimes referred to as a “CB.” Cumulonimbus is an exceedingly dangerous cloud, with numerous hazards to flight such as severe to extreme turbulence, hail, icing, lightning, and other hazards to be discussed in Chapter 4. Table 2-1 summarizes the weather conditions found in the various types of clouds.
Cloud Groups
High Clouds
Middle Clouds
Low Clouds
Clouds with Extensive Vertical Development
Visibility Good to Fair ½ mile to a few feet A few feet A few feet
Icing None to Light None to Moderate None to Moderate Severe
Turbulence None to Light None to Moderate None to Moderate Severe
Table 2-1 — Cloud Families
ATMOSPHERIC STABILITY One of the most important meteorological considerations to a pilot is that of stability or instability. Atmospheric stability is one of the primary determinants of weather encountered in flight. In some cases, a pilot may be able to determine if stable or unstable conditions exist along the route of flight.
There are three conditions of stability: stable, neutral stable, and unstable. We will consider each of these individually by observing a ball inside a bowl. If the ball is displaced, and tends to return to its original position, the ball is said to be stable (Figure 2-17).
Figure 2-17 — Stable Equilibrium and Neutrally Stable Equilibrium If a ball on a flat table is displaced, it will tend to remain in its new position and is said to be neutrally stable (Figure 2-17). It will not have a tendency to return to its original position, or move away from its final position.
Now, consider an inverted bowl with a ball balanced on top. Once the ball is displaced, it will tend to move away from its original position, never to return, and the ball is said to be in an unstable condition (Figure 2-18).

JPATS AVIATION WEATHER BOOKLET
2-18 Version 3.2/Dec 08
Figure 2-18 — Unstable In weather, parts, or parcels, of an air mass become displaced through one of four methods of lifting. The stability of a quantity of air after it is lifted is determined by the temperature of the surrounding air. Lifted air that is colder than the surrounding air settles when the lifting action is removed, since it is denser. This indicates a stable condition. Lifted air that is warmer than the surrounding air continues to rise when the lifting action is removed because it is less dense indicates an unstable condition. This lifted air that continues to rise has reached the point of free convection, which occurs when the lifted air rises with no external lifting force, due only to the parcel’s warmer temperature. Lifted air that has the same temperature as the surrounding air after it is lifted will simply remain at the point where the lifting action was removed. This is an example of a neutrally stable atmosphere. If the air behaves in one of these three ways, then we can say that the atmosphere has that same condition of stability (Figure 2-19).
Figure 2-19 — Stable, Unstable, and Neutral Stability

JPATS AVIATION WEATHER BOOKLET
Version 3.2/Dec 08 2-19
Methods of Lifting The four methods of lifting are convergence, frontal, orographic, and thermal (Figure 2-20). Convergence of two air masses, or parts of a single air mass, force the air upward because it has no where else to go. Because of the shape of cold fronts, as they move through an area, they will lift the air ahead of the cold air mass. Orographic lifting is a term indicating that the force of the wind against a mountainside pushes the air upward. Thermal lifting, also known as convective lifting, is caused when cool air is over a warm surface, and it is heightened by intense solar heating.
Figure 2-20 — The Four Lifting Methods
Stability and Flight Conditions Cloud types are helpful in identifying conditions of stability or instability. Cumuliform clouds develop with unstable conditions and stratiform clouds develop with stable conditions (Figure 2-21), assuming sufficient moisture exists for cloud development.
Figure 2-21 — Clouds in Stable and Unstable Air

JPATS AVIATION WEATHER BOOKLET
2-20 Version 3.2/Dec 08
There are a significant number of flight conditions associated with atmospheric stability, as depicted in Table 2-2. If one or more of these conditions is encountered, the stability of the atmosphere can be easily determined, and other flight conditions can be predicted. Thus, understanding the relationships among stability and flight conditions provides aircrew with a key that unlocks many of the mysteries of weather phenomena.
Flight Conditions Stable Atmosphere Unstable Atmosphere
Cloud type Stratus Cumulus
Turbulence Smooth Rough
Visibility Poor Good (outside clouds)
Winds Steady Gusty
Precipitation Steady Showery
Icing Rime Clear
Table 2-2 — Atmospheric Stability and Flight Conditions
Being able to recognize the stability of the air while flying will help prepare you for the various flight conditions you are experiencing. When encountering a change in weather conditions–apart from what was briefed–the relationships in Table 2-2 can also be a guide to understanding the different options available, and to making better decisions for avoiding weather hazards. Here are some additional “signs in the sky” that indicate stable air: temperature inversions, low fog and stratus, and rising air temperature while climbing. Thunderstorms, showers, towering clouds, dust devils, and rapidly decreasing air temperature while climbing all indicate unstable atmospheric conditions.

JPATS AVIATION WEATHER BOOKLET
Version 3.2/Dec 08 2-21
ATMOSHPHERIC MECHANICS REVIEW QUESTIONS
1. Which one of the following types of isobar spacing would indicate a weak pressure gradient force?
a. Narrow
b. Deep
c. Wide
d. Tight
2. Which one of the following types of pressure gradients would indicate the presence of strong winds?
a. Steep
b. Low pressure
c. Weak
d. Shallow
3. The initial movement of air toward a low-pressure area is caused by the ______.
a. pressure gradient force
b. Coriolis force
c. centrifugal force
d. force of friction
4. The forces that determine the wind direction in the atmosphere are weakened at the Earth’s surface by the ______.
a. pressure gradient force
b. Coriolis force
c. centrifugal force
d. force of friction
5. Gradient winds move parallel to the isobars above 2000 feet AGL because they are NOT affected by the ______.
a. pressure gradient force
b. Coriolis force
c. centrifugal force
d. force of friction

JPATS AVIATION WEATHER BOOKLET
2-22 Version 3.2/Dec 08
6. The surface wind, when compared with the gradient wind is of ______.
a. lesser speed and blows parallel to the isobars
b. lesser speed and blows across the isobars toward low pressure
c. greater speed and blows across the isobars toward high pressure
d. greater speed and blows across the isobars toward low pressure
7. In the Northern Hemisphere, the wind blows ______.
a. from low to high pressure
b. clockwise around a low
c. counterclockwise around a low
d. perpendicular to the isobars
8. Gradient winds blow parallel to the isobars because of the ______.
a. Coriolis force
b. frictional force
c. centrifugal force
d. wind force
9. The sea breeze blows from the _______ to the _______ during the _______, and the land breeze blows from the _______ to the _______ during the _______.
a. water, land, day; water, land, night
b. land, water, day; land, water, night
c. land, water, day; water, land, night
d. water, land, day; land, water, night
10. ______ and water vapor must be present in the atmosphere for precipitation to occur.
a. Carbon dioxide
b. Condensation nuclei
c. Wind
d. Nitrogen
11. When air contains the maximum moisture possible for a given temperature, the air is ______.
12. The temperature to which air must be cooled to become saturated is called the ______.

JPATS AVIATION WEATHER BOOKLET
Version 3.2/Dec 08 2-23
13. Which one of the following conditions could produce fog, clouds, or precipitation?
a. Dew point spread of 5° C
b. Dew point greater than air temperature
c. RH of 0%
d. RH of 100%
14. Stratiform clouds are associated with ______ flight conditions.
a. stable
b. unstable
15. At which altitude could an altostratus cloud be found?
a. 5000' MSL
b. 5000'AGL
c. 10,000' AGL
d. 25,000' AGL
16. Cumulonimbus clouds typically produce which type of precipitation?
a. Drizzle
b. Light steady
c. Heavy showers
d. Fog
17. Nimbostratus clouds will produce ______ precipitation.
a. heavy showery
b. light showery
c. heavy steady
d. light steady
18. ______ defines air with the same temperature as the surrounding air.
a. Unstable
b. Neutrally stable
c. Stable
d. Displaced

JPATS AVIATION WEATHER BOOKLET
2-24 Version 3.2/Dec 08
19. Which one of the following correctly lists the four methods of lifting?
a. Convergence; frontal; orographic; and thermal
b. Convergence; subsidence; orographic; and thermal
c. Convergence; convection; adiabatic; and katabatic
d. Divergence; subsidence; frontal; and convective
20. If lifted air is warmer than the surrounding air, then ______ clouds will form resulting in ______ flight conditions.
21. If stratus clouds are present, which of the following flight conditions could be expected?
a. Rough turbulence, good visibility, showery precipitation, and clear icing
b. Smooth flight, good visibility, steady winds, and no precipitation
c. Poor visibility, steady winds, continuous precipitation, and rime icing
d. Smooth flight, turbulent flight, good visibility, and showery precipitation
22. Which one of the following types of clouds could be produced by unstable conditions?
a. Cirrus
b. Cumulonimbus
c. Stratus
d. Nimbostratus

JPATS AVIATION WEATHER BOOKLET
Version 3.2/Dec 08 3-1
JX103 FRONTAL MECHANICS
OVERVIEW The main purpose of this chapter is to introduce frontal systems, since most of the active weather is concentrated along fronts. The goal of this chapter is to present a broad description of each of the frontal types, along with the general flight conditions associated with each. With this knowledge, an aviator is in a much better position to carry on a conversation about flight conditions with the meteorologist during the weather brief, as opposed to having a one-way conversation. Because only the flight crew understands the details and ramifications of the mission, it would be impossible to expect a meteorologist to foresee all the possibilities and to brief the weather accordingly.
REFERENCES AFH 11-203, Weather for Aircrews, Volume 1, Chapter 8
AIR MASSES The weather in the mid-latitude regions is a direct result of the continuous alternation of warm and cold air masses. Warm air masses predominate in the summer and cold air masses predominate in the winter. However, both cold and warm air may prevail almost anywhere in the temperate zone–the region between 30 and 40 degrees North latitude, which covers the continental United States–at any season.
An air mass is a large body of air that has essentially uniform temperature and moisture conditions in a horizontal plane, meaning that there are no abrupt temperature or dew point changes within the air mass at a given altitude. It may vary in size from several hundred to more than several thousand square miles (Figure 3-1).
Figure 3-1 — Air Mass Profile

JPATS AVIATION WEATHER BOOKLET
3-2 Version 3.2/Dec 08
Air masses are named according to their moisture content, location, and temperature. The location of an air mass has a large influence over the other two properties. Naturally, moist air masses will have a greater potential for producing clouds and precipitation than dry air masses. Most importantly, though, its temperature indicates the stability of the air mass. Warm air masses bring stable conditions, while cold air masses are inherently unstable.
Frontal Systems A front is an area of discontinuity that forms between two contrasting air masses when they are adjacent to each other. A front can be thought of as a border, boundary, or line between the air masses. These air masses must have sufficiently different temperature and moisture properties–the defining characteristics of an air mass–otherwise there would be little reason to distinguish between them. Since air masses cover many thousands of square miles, the boundary between them can be hundreds of miles long. As air masses are three-dimensional, fronts are, as well. The point where a front comes in contact with the ground is called the surface front. The surface front is the line that is plotted on surface analysis charts with different colors and shapes representing each type of front, as pictured in Table 3-1.
Type of Front Color Scheme Symbol
Cold front Blue
Warm front Red
Occluded front Purple
Stationary front Blue and Red
Trough Brown or Black
Ridge Yellow or Black
Squall line Purple
Table 3-1 — Frontal Symbols
The frontal zone is that area that encompasses the weather located on either side of the front. The depth of this frontal zone depends on the properties of the two air masses. When the properties differ greatly, the resulting narrow frontal zone can include sudden and severe weather changes. It is often impossible to determine the exact outer boundaries of a frontal zone.
Most active weather is focused along and on either side of the surface front and frontal zone. Likewise, most aviation weather hazards are also found in the vicinity of fronts. In the mid-latitudes, fronts usually form between the warmer, tropical air to the south and the cooler, polar air to the north.
When a pilot passes through a front, or a front moves past a station, the atmospheric conditions change from one air mass to those of the other. Abrupt changes indicate that the frontal zone is

JPATS AVIATION WEATHER BOOKLET
Version 3.2/Dec 08 3-3
narrow, and in some cases, the zone can be less than a mile wide. On the other hand, gradual changes indicate the frontal zone is broad and diffuse, often over 200 miles in width. Abrupt changes will bring more severe weather than gradual changes.
Aviation weather hazards are not limited to the area of frontal zones. Some fronts do not produce clouds or precipitation. Additionally, weather associated with one section of a front is frequently different from the weather in other sections of the same front. Do not conclude that all adverse weather occurs along fronts. In some cases, very large areas of low ceilings and poor visibility occur in areas that are far removed from a front.
Now that we have introduced the basics of both air masses and fronts, an analysis of a real-world situation can help show how these pieces fit together. Figure 3-2 shows the weather across the U.S. at the same time from three different points of view. From the frontal systems shown on the Current Surface chart, we can see that there are three major air masses over the nation: one over the West, one over the Midwest and the East, and one over the Deep South. For simplicity, we will compare only the two eastern air masses.
Looking at the Current Temperatures chart, the Midwest air mass (centered approximately on the “H” of the high pressure) has temperatures in the 50s, give or take a few degrees. So far, this shows a relatively uniform temperature across the air mass, matching with what we would expect from the discussion above. The southern air mass, on the other hand, has much warmer temperatures, generally in the 70s and 80s. Even so, these temperatures are still relatively uniform throughout the air mass.
The dew points are also different between the two air masses. Even though the Dew Point chart only indicates dew points above 50° F, it is clear that the southern air mass contains much more moisture than the air mass to its north. Thus, these charts indeed show two air masses over the eastern U.S., each with temperature and moisture properties different from the other. Accordingly, a front has been drawn between the two. From the “L” to just south of the “H,” there is a warm front, and to the east of that position, all the way to the next “L” over New England, it is a cold front.
Air Masses and Fronts

JPATS AVIATION WEATHER BOOKLET
3-4 Version 3.2/Dec 08
Figure 3-2 — Uniform Temperature and Moisture of Air Masses
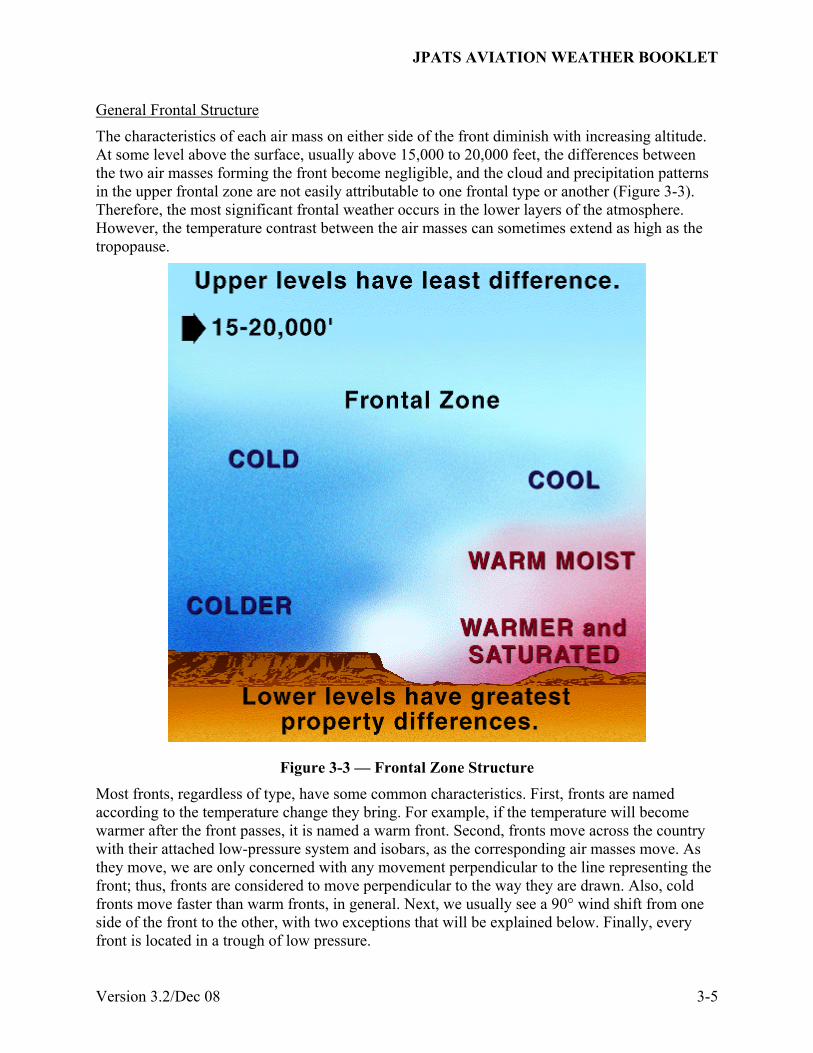
JPATS AVIATION WEATHER BOOKLET
Version 3.2/Dec 08 3-5
The characteristics of each air mass on either side of the front diminish with increasing altitude. At some level above the surface, usually above 15,000 to 20,000 feet, the differences between the two air masses forming the front become negligible, and the cloud and precipitation patterns in the upper frontal zone are not easily attributable to one frontal type or another (Figure 3-3). Therefore, the most significant frontal weather occurs in the lower layers of the atmosphere. However, the temperature contrast between the air masses can sometimes extend as high as the tropopause.
Figure 3-3 — Frontal Zone Structure
Most fronts, regardless of type, have some common characteristics. First, fronts are named according to the temperature change they bring. For example, if the temperature will become warmer after the front passes, it is named a warm front. Second, fronts move across the country with their attached low-pressure system and isobars, as the corresponding air masses move. As they move, we are only concerned with any movement perpendicular to the line representing the front; thus, fronts are considered to move perpendicular to the way they are drawn. Also, cold fronts move faster than warm fronts, in general. Next, we usually see a 90° wind shift from one side of the front to the other, with two exceptions that will be explained below. Finally, every front is located in a trough of low pressure.
General Frontal Structure

JPATS AVIATION WEATHER BOOKLET
3-6 Version 3.2/Dec 08
Figure 3-4 — General Model of a Frontal System This course will use the general frontal model presented in Figure 3-4 to illustrate the different characteristics of the various fronts. Remembering the basics of this model can aid in the comprehension of how the various fronts usually move, as well as the characteristic changes in weather from one side of a front to the other. Once this model is understood, it can easily be modified to fit the appropriate real-world situation by rotating the system, by changing the angle between the fronts, or by considering a curvature to any of the frontal lines. As we discuss each frontal type, imagine zooming in on this model to study the particular characteristics of that front. These frontal characteristics will be discussed in depth for each type of front, and as a group in the next section, which explains how meteorologists determine where to place fronts on weather charts.
Frontal Discontinuities Differences in the various properties of adjacent air masses–in particular, their temperature, moisture (indicated by the dew point), winds, and pressure–are used to locate and classify fronts. For example, when comparing two dissimilar air masses, one will be colder than the other. Because of this, the colder one will be denser and drier (it must have a lower dew point). Cloud types are also useful indicators of the type of front and will be discussed in connection with each individual front.
Temperature is one of the most easily recognizable differences across a front. In the lower layers of the atmosphere a greater temperature change will be noticed with frontal passage or when flying through a front. The amount and rate of change partially indicates the front’s intensity. Strong and weak fronts are accompanied by abrupt and gradual changes in temperature, respectively.
The dew point temperatures reported from weather observing stations are helpful in locating the position of a front. The dew point temperature and the air temperature give an indication of the
Temperatures
Dew Points

JPATS AVIATION WEATHER BOOKLET
Version 3.2/Dec 08 3-7
relative humidity of the air. Cold air masses will usually have lower dew point temperatures than warm air masses. Higher dew points indicate a greater amount of moisture available to produce clouds, fog, or precipitation.
Figure 3-5 — Pressure Changes Across a Front All fronts are located in troughs of low pressure. The arrows in Figure 3-5 indicate the trough (where low pressure extends outward from the center of the low), as well as the direction of movement of the low-pressure system. Therefore, when a front approaches a station, or a pilot flies toward a front, the pressure decreases. Pressure then rises immediately following frontal passage. Figure 3-5 illustrates this pressure fall and rise with the time-sequence of the weather at station NSE. The earliest time is pictured in the upper right, when the pressure is 1011 mb, and the last point in time is at the lower left, with a pressure of 1007 mb. Because of this pressure change, it is extremely important to obtain a new altimeter setting when flying in the vicinity of a front.
Figure 3-6 — Wind Shift Across a Cold Front
Pressures

JPATS AVIATION WEATHER BOOKLET
3-8 Version 3.2/Dec 08
Near the Earth’s surface, the wind changes direction across a front. In the Northern Hemisphere, as the front approaches and passes a station the wind changes direction in a clockwise rotation. When flying across a front, because of this wind shift you must adjust heading to the right to maintain your original ground track (Figure 3-6). This wind shift often creates a hazardous wind shear when departing or approaching an airfield. For example, winds at 220 degrees at 10 knots ahead of the front can rapidly change to 330 degrees at 20 knots gusting to 30 knots immediately after the front.
Factors Influencing Frontal Weather The weather along fronts is not always severe. Flying conditions can vary from insignificant weather to situations that are extremely hazardous. The hazardous situations can include thunderstorms, turbulence, icing, low ceilings, and poor visibility. The severity of the clouds and precipitation occurring along a front are dependent on the following factors:
1. The amount of moisture available (shown by the dew point)
2. The degree of stability of the lifted air
3. The slope of the front
4. The speed of the frontal movement
5. The contrast in the amounts of temperature and moisture between the two air masses.
The amount of moisture available, as indicated by the dew point, greatly determines the amount of weather associated with a front. Often little or no significant weather is associated with a front or a portion of a front because of a lack of moisture, despite the presence of all other factors.
The degree of stability of the air that is lifted determines whether cloudiness will be predominantly stratiform or cumuliform. With stratiform clouds, there is usually steady precipitation and little or no turbulence. Precipitation from cumuliform clouds is showery and the clouds indicate turbulence.
1MILE
100 MILES
200 MILES
47° F
60° F57° F54° F51° F48° F42° F50° F
COLDAIR MASS
WARMAIR MASS
COLDAIR MASS
WARMAIR MASS
SLOPE 100 : 1
SLOPE 200 : 1
1MILE
60° F57° F54° F51° F48° F52° F49° F
Figure 3-7 — Frontal Slope
Winds

JPATS AVIATION WEATHER BOOKLET
Version 3.2/Dec 08 3-9
The slope is the ratio of the vertical rise to horizontal distance. The slope of a warm front is generally shallow, while the slope of a cold front can be quite steep (Figure 3-7). Shallow frontal slopes tend to produce extensive cloudiness with large areas of steady precipitation, while steep frontal slopes tend to move rapidly producing narrow bands of cloudiness and showery precipitation. Steep frontal slopes normally separate air masses of vastly different properties, indicating the potential for more severe weather.
The speed of the frontal movement affects the weather associated with it. Faster moving fronts are generally accompanied by a narrow band of more severe weather. On the other hand, slower moving fronts have less severe weather, but the frontal zone is more extensive.
COLD FRONTS The greater the contrast in temperature and moisture between the colliding air masses, the greater the possibility of weather associated with a front, particularly severe weather. For example, most tornadoes occur in the spring due to very cold, dry air from Canada colliding with very warm, moist air from the Gulf of Mexico.
Figure 3-8 — Cold Front A cold front is the leading edge of an advancing cold air mass. In this case, the colder (more dense) air mass is overtaking and wedging underneath a relatively warmer (less dense) air mass. As the cold air pushes the warm air upward, this motion sometimes produces very violent and unstable conditions, to include strong thunderstorms (cumulonimbus clouds) and severe turbulence. Figure 3-8 shows the manner in which a cold front is depicted on a surface weather chart. Cold fronts move toward the SE at 20kts, on average, and the wind shift is from the SW to the NW.
Cold front weather can vary greatly depending on the speed of the front and the characteristics of the air masses. Usually, though, as the cold front approaches, the southwesterly winds in the

JPATS AVIATION WEATHER BOOKLET
3-10 Version 3.2/Dec 08
warm air mass ahead of the front begin to increase in speed. Meanwhile, the barometric pressure decreases, and altocumulus clouds appear on the horizon. Next, the cloud bases lower, and rain or snow showers begin as the cumulonimbus clouds move into the area. The precipitation increases in intensity and may persist as the front nears the station. As the front passes, the pressure rises sharply and the wind shifts approximately 90° from SW to NW. The postfrontal weather includes rapidly clearing skies, fair weather cumulus clouds, and decreasing temperature and dew point. The extent of postfrontal cloudiness depends on the degree of stability and moisture content of the cold air mass. In some cases, the sequence of events described here may be considerably different, depending on the specific atmospheric conditions (Figure 3-9).
Figure 3-9 — Cold Front Cloud Formation Weather with fast-moving cold fronts occurs in a narrow band, is usually severe, and clears rapidly behind the front. Cumuliform clouds, showers, or thunderstorms may form near the front position. Lines of fast-moving thunderstorms, or squall lines, can form well ahead of the front. Weather with slow-moving cold fronts (usually from late fall through early spring) occurs over a large area, is less severe, but may persist for hours, even after the front is past.
Recognizing Cold Fronts During Flights During a flight over flat terrain, you may see a long line of cumuliform clouds on the horizon. These clouds may indicate you are flying toward an approaching active cold front. When flying above an altocumulus layer extending ahead of the front, the lower frontal clouds are often hidden. Stratus or stratocumulus decks extending many miles ahead of a front may conceal the main clouds from a low flying aircraft.
Cold Fronts Flight Problems Wind shifts — Expect an abrupt wind shift when passing through a frontal zone, especially when flying at lower altitudes. Turbulence is often associated with the wind shift. The wind generally shifts from SW to NW with greater speeds behind the front.
Ceiling and visibility — If an active cold front moves at a moderate or rapid speed (15-30 knots), its weather zone is generally less than 50 miles wide. If the front moves slower, its weather zone may be broad enough to seriously affect flight operations for many hours. Ceilings and

JPATS AVIATION WEATHER BOOKLET
Version 3.2/Dec 08 3-11
visibilities are generally visual meteorological conditions (VMC), but isolated instrument meteorological conditions (IMC) exist in heavy precipitation and near thunderstorms. Wider areas of IMC conditions can exist in winter due to snow showers.
Turbulence — Many active cold fronts have turbulent cloud systems associated with them, but thunderstorms may not always be present. Even when there are no clouds, turbulence may still be a problem. As a rule, expect a rough flight in the vicinity of an active cold front, even when flying at a considerable altitude.
Precipitation and icing conditions — Active cold fronts usually have a relatively narrow belt of precipitation, especially if the precipitation is showery. Icing may be severe in cumuliform clouds. Slow-moving cold fronts may have a broader area of precipitation and a greater threat of remaining in icing conditions for a longer period.
Thunderstorms and squall lines — Severe weather is implied to exist in areas of reported thunderstorms. Chapter 4 will detail the hazards associated with thunderstorms.
Squall Lines
Figure 3-10 — Squall Line Formation A squall line is a line of violent thunderstorms. They are indicated on surface charts by a dashed, double-dotted purple line. They develop 50 to 300 miles ahead of the cold front and roughly parallel to it. They form when cold air downdrafts flowing ahead of a cold front lift additional warm, unstable air. The uplifted air develops its own updrafts and downdrafts and starts the thunderstorm development cycle (Figure 3-10). Sometimes, however, squall lines can be located nowhere near a cold front, possibly from the convergence of air flows at one location. Squall lines are usually the most intense during the late afternoon and early evening hours, just after maximum daytime heating.
It is often impossible to fly through squall lines, even with radar, since the storms are extremely close to one another. Similar to cold fronts, Squall lines will also have a 90° wind shift from the SW to the NW.

JPATS AVIATION WEATHER BOOKLET
3-12 Version 3.2/Dec 08
Figure 3-11 — Warm Front
WARM FRONTS A warm front is the boundary of the advancing warm air mass that is overtaking and replacing a colder air mass. To do so, the warmer, less dense air must ride up and over the top of the cold air mass. Figure 3-11 shows the manner in which a warm front is depicted on a surface weather chart. The warm air mass gradually moves up over the frontal surface creating a broad area of cloudiness. This cloud system extends from the front’s surface position to about 500 to 700 miles in advance of it (Figure 3-12).
A warm front typically moves at a slower speed than a cold front–15 knots on average–and produces a more gradual frontal slope, as well as sloping forward, ahead of the surface front. Because of this slower speed and gradual slope, warm fronts are not as well defined as cold fronts. The winds shift across a warm front from the SE to the SW.
Recognizing Warm Fronts During Flight The most common cloud found along a warm front is the stratiform cloud. If one were to approach the front from the east, the sequence of clouds would be cirrus, cirrostratus, altostratus, nimbostratus, and stratus, rain and fog (Figure 3-12). Steady precipitation gradually increases with the approach of this type of warm front and usually continues until the front passes.

JPATS AVIATION WEATHER BOOKLET
Version 3.2/Dec 08 3-13
Figure 3-12 — Warm Front Cloud Formation
Warm Front Flight Problems Wind Shift — Warm front wind shifts are not as sudden as those of a cold front, and therefore, turbulence isn’t likely. The wind generally shifts from SE to SW.
Ceiling and Visibility — The widespread precipitation ahead of a warm front is often accompanied by low stratus and fog. In this case, the precipitation raises the moisture content of the cold air until saturation is reached. This produces low ceilings and poor visibility covering thousands of square miles. Ceilings are often in the 300 to 900-foot range during steady, warm frontal rain situations. Just before the warm front passes the station, ceilings and visibilities can drop to zero with drizzle and fog. The worst conditions often occur in the winter when the ground is cold and the air is warm; the best scenario for dense fog and low ceilings.
Turbulence and Thunderstorms — If the advancing warm air is moist an unstable, altocumulus and cumulonimbus clouds can be embedded in the cloud masses normally accompanying the warm front. These embedded thunderstorms are quite dangerous, because their presence is often unknown to aircrews until encountered. Even with airborne radar, it can be difficult to distinguish between the widespread areas of precipitation normally found with a warm front and the severe showers from the embedded thunderstorms. The only turbulence along a warm front would be found in such embedded thunderstorms. Otherwise, little to no turbulence exists in warm front systems.
Precipitation and Icing — Approaching an active warm front from the cold air side (from the east), precipitation will begin where the middle cloud deck is from 8000 to 12,000 feet AGL. Often, this precipitation will not reach the ground–a phenomenon called virga. As you near the front, precipitation gradually increases in intensity and becomes steadier. Occasional heavy showers in the cold air beneath the frontal surface indicate that thunderstorms exist in the warm air aloft. Drizzle, freezing drizzle, rain, freezing rain, ice pellets (sleet), and snow are all possible in a warm front, depending on the temperature. The shallow slope and widespread thick stratiform clouds lead to large areas of icing. It may take a long time to climb out of the icing area, and you may need to descend into warmer air to avoid the icing.

JPATS AVIATION WEATHER BOOKLET
3-14 Version 3.2/Dec 08
Figure 3-13 — Stationary Front
Stationary Fronts Sometimes the frontal border between the air masses shows little or no movement. Since neither air mass is replacing the other, the front is called a stationary front (Figure 3-13). Stationary fronts are indicated on surface charts by an alternating warm and cold front symbols, retaining their original red and blue colors, but pointing in opposite directions. Even though the front may not be moving, winds can still be blowing. Surface winds tend to blow parallel on both sides of the front rather than against and or away from it. Therefore, a stationary front has a 180° wind shift. The wind shift may be from any one direction to the opposite direction, as stationary fronts are less likely to be aligned in any one particular direction.
The weather conditions occurring with a stationary front are similar to those found with the warm front, but are usually less intense. The weather pattern of a stationary front may persist in one area for several days, until other, stronger weather systems are able to push the stationary front weather along its way.
OCCLUDED FRONTS Occluded fronts form when a faster moving cold front overtakes a slower moving warm front. There are two types of occluded fronts, cold and warm. The type of occlusion that forms depends on which front remains in contact with the ground. For example, if the cold front remains in contact with the ground, then it is named a cold front occlusion.
Occlusions are shown on surface charts with both cold and warm frontal symbols pointing in the same direction, but colored purple. Both types of occlusions tend to be aligned from NW to SE, and hence move toward the NE at the speed of the front that remains on the ground. The wind shift across either type of occlusion will be a 180° shift, as there are actually two fronts in the same location. Therefore, ahead of the occlusion, the winds will be the same as those ahead of the warm front, and behind the occlusion, the wind will be from the same direction as behind the cold front: the wind shift is SE to NW. Because the occluded front is the result of the meeting of

JPATS AVIATION WEATHER BOOKLET
Version 3.2/Dec 08 3-15
both a cold front and a warm front, the weather associated with the occlusion will be a combination of both types of frontal weather.
Figure 3-14 — Occluded Front Figure 3-14 depicts a profile of an occluded front. If either type of occlusion is approached from the east, you would first encounter warm front type weather which may extend for several hundred miles to the east of the surface front. On the other hand, if it were approached from the west you would first encounter cold front type weather. The location of the occluded front is significant to aircrews because the most severe weather, including ceilings and visibilities, is generally located in an area 100 NM south to 300 NM north of the frontal intersection. Figure 3-15 illustrates the stages of development of an occlusion.
Figure 3-15 — Occluded Wave Formation
Inactive Fronts

JPATS AVIATION WEATHER BOOKLET
3-16 Version 3.2/Dec 08
Clouds and precipitation do not accompany inactive fronts. Sometimes the warm air mass is too dry for clouds to form even after the air is lifted and cooled. Inactive fronts may also be referred to as dry fronts.
The reason for showing an inactive front on the weather chart is to indicate the boundary of the opposing air masses. Additionally, it displays the location of potentially unfavorable flying weather. The warm air mass may gradually become more moist and lead to the formation of clouds and precipitation in the frontal zone. In many cases the inactive front only has a shift in the wind direction and a change in the temperature and pressure.

JPATS AVIATION WEATHER BOOKLET
Version 3.2/Dec 08 3-17
FRONTAL MECHANICS REVIEW QUESTIONS
1. Which one of the following parameters of an air mass are generally uniform when measured across any horizontal direction?
a. Pressure and stability
b. Pressure and moisture
c. Temperature and pressure
d. Temperature and moisture
2. Which one of the following correctly indicates the four frontal properties used to locate and classify fronts?
a. Pressure, wind, stability, and slope
b. Pressure, temperature, dew point, and wind
c. Pressure, temperature, dew point and slope
d. Pressure, wind, dew point, and stability
3. Which one of the following indicates two of the five factors that influence frontal weather?
a. Slope and stability
b. Slope and pressure change
c. Stability and winds
d. Stability and pressure change
4. With frontal passage, the winds of a cold front will shift from the ______to the ______, and the winds of a warm front will shift from the ______ to the ______.
a. southeast to the northwest, southeast to the northwest
b. southeast to the southwest, southwest to the northwest
c. southwest to the northwest, southeast to the southwest
d. northwest to the southwest, southwest to the southeast
5. In one respect, embedded warm-front thunderstorms present a greater flying hazard than cold-front thunderstorms because the warm-front cumulonimbus clouds ______.
a. may be hidden in stratus type clouds.
b. generally contain a great amount of cloud-to-ground lightning.
c. have lower bases and lie closer to the earth’s surface.
d. are much more violent and turbulent.

JPATS AVIATION WEATHER BOOKLET
3-18 Version 3.2/Dec 08
6. Which one of the following would indicate that a cold front has passed?
a. Wind shifts
b. Pressure falls
c. Humidity increases
d. Temperature rises
7. If you are flying from east to west and you encounter cirrus, cirrostratus, alto-stratus, nimbostratus and then stratus clouds, you are most likely approaching a ______.
a. stationary front
b. warm front
c. either a or b
d. neither a nor b
In each cell of the table at right, circle the correct characteristics of each of the types of fronts. This is similar to a multiple-choice question, where the question is formed by matching a column heading with a row heading, and the alternatives are listed in the intersecting cell.

JPATS AVIATION WEATHER BOOKLET
Version 3.2/Dec 08 3-19
Type of
Front Wind Shift
Temper-
ature
Change
Pressure
Change
Direction of
Movement
Speed of
Movement
(kts)
Cloud Types Turbulence
Conditions
Color
Code
Warm
Front
SE to SW
SW to NW
SE to NW
180°
Warmer
Colder
Either
Rises then Falls
Falls then Rises
SE
NE
NW
None
0 to 5
15
20
25
Stratiform
Cumuliform
Combination
Smooth
Rough
Combination
Red
Blue
Purple
R & B
Cold
Front
SE to SW
SW to NW
SE to NW
180°
Warmer
Colder
Either
Rises then Falls
Falls then rises
SE
NE
NW
None
0 to 5
15
20
25
Stratiform
Cumuliform
Combination
Smooth
Rough
Combination
Red
Blue
Purple
R & B
Warm
Front
Occlusion
SE to SW
SW to NW
SE to NW
180°
Warmer
Colder
Either
Rises then Falls
Falls then rises
SE
NE
NW
None
0 to 5
15
20
25
Stratiform
Cumuliform
Combination
Smooth
Rough
Combination
Red
Blue
Purple
R & B
Cold
Front
Occlusion
SE to SW
SW to NW
SE to NW
180°
Warmer
Colder
Either
Rises then Falls
Falls then rises
SE
NE
NW
None
0 to 5
15
20
25
Stratiform
Cumuliform
Combination
Smooth
Rough
Combination
Red
Blue
Purple
R & B
Stationary Front
SE to SW
SW to NW
SE to NW
180°
Warmer
Colder
Either
Rises then Falls
Falls then rises
SE
NE
NW
None
0 to 5
15
20
25
Stratiform
Cumuliform
Combination
Smooth
Rough
Combination
Red
Blue
Purple
R & B

JPATS AVIATION WEATHER BOOKLET
3-20 Version 3.2/Dec 08
This page intentionally left blank

JPATS AVIATION WEATHER BOOKLET
Version 3.2/Dec 08 4-1
JX104 WEATHER HAZARDS
OVERVIEW This chapter will cover the causes of turbulence, classification of the various categories of turbulence, conditions under which turbulence exists, and will recommend flying procedures to be used when turbulence is encountered. This chapter will also cover the requirements for icing formation, types of icing, and their effects on aircraft flight and aircraft components, including techniques that should be following for safe flight. Finally, this chapter will introduce the student to ceilings and visibility, sky coverage terminology, and the requirements for fog formation and dissipation, plus a synopsis of the aviation hazards of volcanic ash clouds.
Turbulence is one of the most unexpected aviation hazards to fly through and is also one of the most difficult hazards to forecast. Severe and extreme turbulence has been known to cause extensive structural damage to military aircraft, with lesser intensities resulting in compressor stalls, flameouts, and injury to crewmembers and passengers. From minor bumps to severe mountain wave turbulence, turbulence comes in many forms and is usually worst during the winter months. It is estimated that turbulence causes $30 million in damage annually to aviation assets.
Aircraft icing is another aviation weather hazard. Many aircraft accidents and incidents have been attributed to aircraft icing. In fact, many icing-related mishaps have occurred when the aircraft was not deiced before attempting takeoff. Most of the time, ground deicing and anti-icing procedures will adequately handle icing formation. However, there are times when pilots may be caught unaware of dangerous ice buildup.
Historically, low ceilings and poor visibilities have contributed to many aircraft accidents. Fog, heavy snow, heavy rain, blowing sand, and blowing dust all restrict visibility and can also result in low ceilings. Adverse weather conditions causing widespread low ceilings and visibilities can restrict flying operations for days. Since ceiling and visibility is so important to operational flying, it is imperative that a pilot understands the strict meanings of the two terms. There are many different kinds of “visibility,” but pilots are usually more concerned with “prevailing visibility.”
Ash clouds from volcanic eruptions present a unique hazard to aviation. Though most prudent aviators would choose to keep well clear of any active volcano, certain situations such as evacuations may require the military to operate in close proximity to ash clouds. The corresponding causes of aircraft damage are discussed in the last portion of the chapter.
REFERENCES AFH 11-203, Weather for Aircrews, Volume 1, Chapters 1, 3, and 4.
TURBULENCE DEFINED AND CLASSIFIED
Turbulence is any irregular or disturbed flow in the atmosphere producing gusts and or eddies. Occurrences of turbulence are local in extent and transient in character. Although general forecasts of turbulence are quite good, forecasting precise locations is difficult.
Turbulence intensity is classified using a subjective scale. Table 4-1 contains the four intensity levels and the three time descriptors used by aircrew when giving a Pilot Report (PIREP), which details the in-flight weather. You can see how individual crewmembers of the same aircraft

JPATS AVIATION WEATHER BOOKLET
4-2 Version 3.2/Dec 08
might not agree on the degree of turbulence that they encountered. Realize that moderate turbulence for a B-52 could be severe or extreme for a T-34 or a T-6A.
Intensity Aircraft Reaction Reaction Inside Aircraft
Light
Turbulence that momentarily causes slight, erratic changes in altitude and/or attitude (pitch, roll, yaw). Report as Light Turbulence; 1
or
Turbulence that causes slight, rapid, and somewhat rhythmic bumpiness without appreciable changes in altitude or attitude. Report as Light Chop.
Occupants may feel a slight strain against seat belts or shoulder straps. Unsecured objects may be displaced slightly. Food service may be conducted and little or no difficulty is encountered in walking.
Moderate
Turbulence that is similar to Light Turbulence but of greater intensity. Changes in altitude and/or attitude occur but the aircraft remains in positive control at all times. It usually causes variations in indicated airspeed. Report as Moderate Turbulence; 1
or
Turbulence that is similar to Light Chop but of greater intensity. It causes rapid bumps or jolts without appreciable changes in aircraft altitude or attitude. Report as Moderate Chop.
Occupants feel definite strains against seat belts or shoulder straps. Unsecured objects are dislodged. Food service and walking are difficult.
Severe
Turbulence that causes large, abrupt changes in altitude and/or attitude. It usually causes large variations in indicated airspeed. Aircraft may be momentarily out of control. Report as Severe Turbulence; 1
Occupants are forced violently against seat belts or shoulder straps. Unsecured objects are tossed about. Food service and walking are impossible.
Extreme Turbulence in which the aircraft is violently tossed about and is practically impossible to control. It may cause structural damage. Report as Extreme Turbulence.
1High level turbulence (normally above 15,000 feet MSL) not associated with cumuliform cloudiness, including thunderstorms, should be reported as CAT (clear air turbulence) preceded by the appropriate intensity, or light or moderate chop.
NOTE: Reporting Term Definition
Occasional Less than 1/3 of the time
Intermittent 1/3 to 2/3 of the time
Continuous More than 2/3 of the time
Table 4-1 — PIREP Turbulence Reporting Table
The different types of turbulence can be divided according to their causative factors: thermal, mechanical, frontal, and large-scale wind shear.
Two or more of these causative factors often work together. Any of the four types of turbulence may occur without the visual warning associated with clouds. Turbulence in the absence of or outside of clouds is referred to as clear-air turbulence (CAT).

JPATS AVIATION WEATHER BOOKLET
Version 3.2/Dec 08 4-3
Clear Air Turbulence CAT normally occurs outside of clouds and usually occurs at altitudes above 15,000 feet MSL, due to strong wind shears in the jet stream. CAT is not limited to jet streams–in fact CAT can be found in each of the four categories of turbulence–but the most severe CAT is associated with jet streams. You may also notice that the Wind Shear category of turbulence is only CAT.
Thermal Turbulence Thermal (or convective) turbulence is caused by localized vertical convective currents resulting from surface heating or cold air moving over warmer ground. Strong solar heating of the Earth’s surface can result in localized vertical air movements, both ascending and descending. For every rising current, there is a compensating downward current that is usually slower in speed since it covers a broader area. Such vertical air movements can also result from cooler air being heated through contact with a warm surface. The turbulence that forms as a result of heating from below is called thermal, or convective, turbulence.
The strength of convective currents depends in part on the extent to which the earth’s surface has been heated, which in turn, depends upon the nature of the surface (Figure 4-1). Notice in the illustration that dry, barren surfaces such as sandy or rocky wasteland and plowed fields absorb heat more readily than surfaces covered with grass or other vegetation, which tend to contain more moisture. Thus, barren surfaces generally cause stronger convective currents. In comparison, water surfaces are heated more slowly. The difference in surface heating between land and water masses is responsible for the turbulence experienced by aircrews when crossing shorelines on hot summer days.
Figure 4-1 - Strength of Convective Currents Vary With Composition of Surface
When air is very dry, convective currents may be present even though convective-type clouds (cumulus) are absent. The upper limits of the convective currents are often marked by haze lines or by the tops of cumulus clouds that form when the air is moist. Varying surfaces often affect the amount of turbulence experienced in the landing pattern and on final approach.
Figure 4-1 — Strength of Convective Currents Vary With Composition of Surface

JPATS AVIATION WEATHER BOOKLET
4-4 Version 3.2/Dec 08
Mechanical Turbulence Mechanical turbulence results from wind flowing over or around irregular terrain or other obstructions. When the air near the surface of the Earth flows over obstructions, such as bluffs, hills, mountains, or buildings, the normal horizontal wind flow is disturbed and transformed into a complicated pattern of eddies and other irregular air movements (Figure 4-2). An eddy current is a current of air (or water) moving contrary to the main current, forming swirls or whirlpools. One example of mechanical turbulence may result from the buildings or other obstructions near an airfield.
Figure 4-2 — Airflow Over Irregular Terrain The strength and magnitude of mechanical turbulence depends on the speed of the wind, the roughness of the terrain (or nature of the obstruction), and the stability of the air. Stability seems to be the most important factor in determining the strength and vertical extent of the mechanical turbulence. When a light wind blows over irregular terrain, the resulting mechanical turbulence has only minor significance. When the wind blows faster and the obstructions are larger, the turbulence intensity increases and it extends to higher levels.
Mountain Wave Turbulence When strong winds blow approximately perpendicular to a mountain range, the resulting turbulence can be severe. Associated areas of steady updrafts and downdrafts may extend to heights from 2 to 20 times the height of the mountain peaks. When the air is stable, large waves tend to form on the lee side of the mountains and extend up to the lower stratosphere for a distance of up to 300 miles or more downwind. These are referred to as standing waves or mountain waves, and may or may not be accompanied by turbulence (Figure 4-3). Pilots, especially glider pilots, have reported that the flow in these waves is often remarkably smooth. Others have reported severe turbulence.

JPATS AVIATION WEATHER BOOKLET
Version 3.2/Dec 08 4-5
Figure 4-3 — Mountain Wave Turbulence Even though mountain wave turbulence may be present, when the airflow begins to move up the windward side of the mountain, is usually fairly smooth as the orographic lifting imparts the vertical component to the motion of the air. The wind speed gradually increases, reaching a maximum near the peak of the mountain. Past the peak, the air naturally flows down the leeward side, completing one cycle of oscillation and setting up the standing wave pattern of the mountain wave turbulence. Downwind, perhaps 5 to 10 miles from the peak, the airflow begins to ascend again, where the rotor or lenticular clouds may appear. Additional waves, generally less intense than the primary wave, may form farther downwind. Note in Figures 4-3 and 4-4 that the mountains are on the left and the wind is flowing from left to right.
Figure 4-4 — Lenticular Clouds While clouds are usually present to warn aircrews of mountain wave activity, it is possible for wave action to take place when the air is too dry to form clouds, producing CAT. Still, cloud

JPATS AVIATION WEATHER BOOKLET
4-6 Version 3.2/Dec 08
forms particular to wave action provide the best means of identifying possible turbulence, aside from weather forecasts and PIREPs. Although the lenticular clouds in Figure 4-4 are smooth in contour, they may be quite ragged when the airflow at that level is turbulent. These clouds may occur singularly or in layers at heights usually above 20,000 feet. The rotor cloud forms at a lower level and is generally found at about the same height as the mountain ridge. The cap cloud usually obscures both sides of the mountain peak. The lenticular clouds (Figure 4-4), like the rotor and cap clouds, are stationary in position, even though the wind flows through them.
The pilot is concerned, for the most part, with the first wave because of its more intense activity and proximity to the high mountainous terrain. Extreme turbulence is usually found at low levels on the leeward side of the mountain in or near the rotor and cap clouds when the winds are 50 knots or greater at the mountaintop. With these wind conditions, severe turbulence can frequently be found to exist from the surface to the tropopause and 150 miles downwind. Moderate turbulence can be experienced often as far as 300 miles downwind under those same conditions. When the winds are less than 50 knots at mountain peak level, a lesser degree of turbulence may be experienced.
Mountain wave turbulence is dangerous in the vicinity of the rotor clouds and to the leeward side of the mountain peaks. The cap cloud must always be avoided in flight because of the turbulence and the concealed mountain peaks.
The following techniques should be applied when mountain wave turbulence has been forecast:
1. Avoid the turbulence if possible by flying around the areas where wave conditions exist. If this is not feasible, fly at a level that is at least 50% higher than the height of the highest mountain range along your flight path. This procedure will not keep the aircraft out of turbulence, but provides a margin of safety if a strong downdraft is encountered.
2. Avoid the rotor, lenticular, and the cap clouds since they contain intense turbulence and strong updrafts and downdrafts.
3. Approach the mountain range at a 45° angle, so that a quick turn can be made away from the ridge if a severe downdraft is encountered.
4. Avoid the leeward side of mountain ranges, where strong downdrafts may exist, until certain turbulence is not a factor.
5. Do not place too much confidence in pressure altimeter readings near mountain peaks. They may indicate altitudes more than 2500 feet higher than the true altitude.
6. Penetrate turbulent areas at air speeds recommended for your aircraft.

JPATS AVIATION WEATHER BOOKLET
Version 3.2/Dec 08 4-7
Frontal Turbulence
Figure 4-5 — Frontal Turbulence Frontal turbulence is caused by lifting of warm air by a frontal surface leading to instability, or by the abrupt wind shift between the warm and cold air masses. The vertical currents in the warm air are the strongest when the warm air is moist and unstable. The most severe cases of frontal turbulence are generally associated with fast moving cold fronts. In these cases, mixing between the two air masses, as well as the differences in wind speed and or direction (wind shear), add to the intensity of the turbulence.
Ignoring the turbulence resulting from any thunderstorm along the front, Figure 4-5 illustrates the wind shift that contributes to the formation of turbulence across a typical cold front. The wind speeds are normally greater in the cold air mass.
Wind Shear Turbulence
Large-scale wind shear turbulence results from a relatively steep gradient in wind velocity or direction producing eddy currents that result in turbulence. Wind shear is defined as a sudden change in wind speed or direction over a short distance in the atmosphere. The greater the change in wind speed and/or direction in a given area, the more severe the turbulence will be. These turbulent wind shear flight conditions are frequently encountered in the vicinity of the jet stream, where large shears in both the horizontal and vertical planes are found, as well as in association with land and sea breezes, fronts, inversions, and thunderstorms. Strong wind shear can abruptly distort the smooth flow of wind, creating rapid changes in aircraft performance.
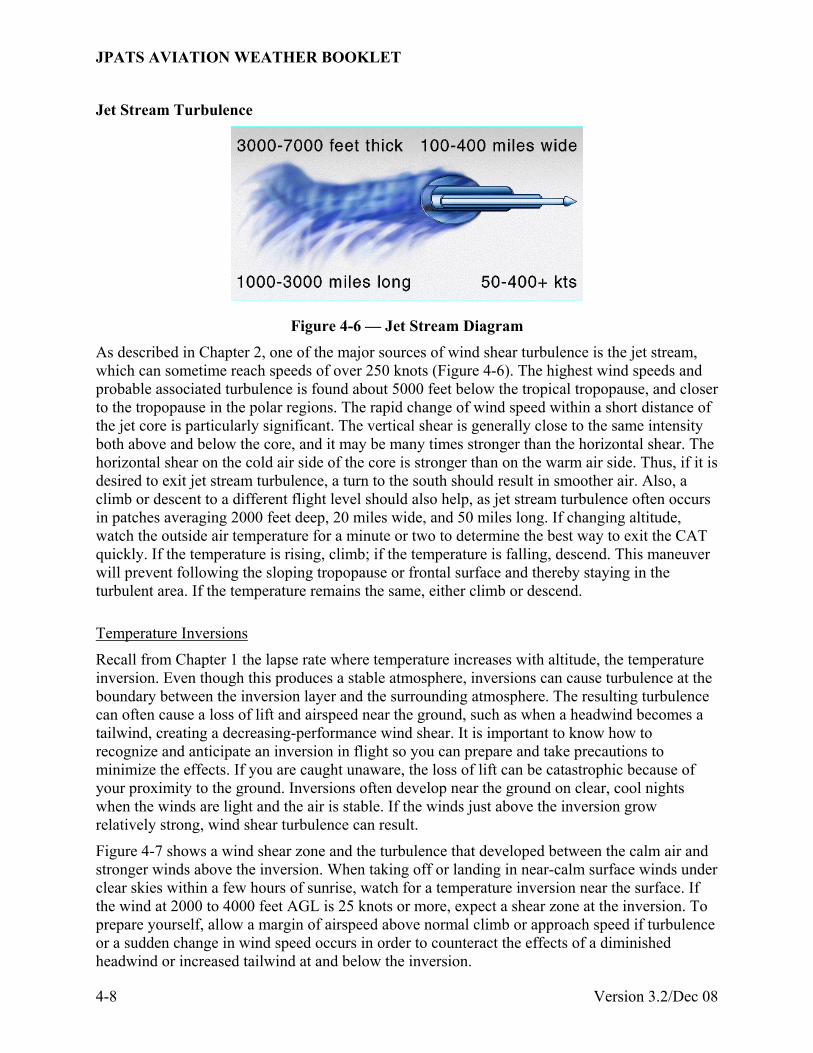
JPATS AVIATION WEATHER BOOKLET
4-8 Version 3.2/Dec 08
Jet Stream Turbulence
Figure 4-6 — Jet Stream Diagram As described in Chapter 2, one of the major sources of wind shear turbulence is the jet stream, which can sometime reach speeds of over 250 knots (Figure 4-6). The highest wind speeds and probable associated turbulence is found about 5000 feet below the tropical tropopause, and closer to the tropopause in the polar regions. The rapid change of wind speed within a short distance of the jet core is particularly significant. The vertical shear is generally close to the same intensity both above and below the core, and it may be many times stronger than the horizontal shear. The horizontal shear on the cold air side of the core is stronger than on the warm air side. Thus, if it is desired to exit jet stream turbulence, a turn to the south should result in smoother air. Also, a climb or descent to a different flight level should also help, as jet stream turbulence often occurs in patches averaging 2000 feet deep, 20 miles wide, and 50 miles long. If changing altitude, watch the outside air temperature for a minute or two to determine the best way to exit the CAT quickly. If the temperature is rising, climb; if the temperature is falling, descend. This maneuver will prevent following the sloping tropopause or frontal surface and thereby staying in the turbulent area. If the temperature remains the same, either climb or descend.
Recall from Chapter 1 the lapse rate where temperature increases with altitude, the temperature inversion. Even though this produces a stable atmosphere, inversions can cause turbulence at the boundary between the inversion layer and the surrounding atmosphere. The resulting turbulence can often cause a loss of lift and airspeed near the ground, such as when a headwind becomes a tailwind, creating a decreasing-performance wind shear. It is important to know how to recognize and anticipate an inversion in flight so you can prepare and take precautions to minimize the effects. If you are caught unaware, the loss of lift can be catastrophic because of your proximity to the ground. Inversions often develop near the ground on clear, cool nights when the winds are light and the air is stable. If the winds just above the inversion grow relatively strong, wind shear turbulence can result.
Figure 4-7 shows a wind shear zone and the turbulence that developed between the calm air and stronger winds above the inversion. When taking off or landing in near-calm surface winds under clear skies within a few hours of sunrise, watch for a temperature inversion near the surface. If the wind at 2000 to 4000 feet AGL is 25 knots or more, expect a shear zone at the inversion. To prepare yourself, allow a margin of airspeed above normal climb or approach speed if turbulence or a sudden change in wind speed occurs in order to counteract the effects of a diminished headwind or increased tailwind at and below the inversion.
Temperature Inversions

JPATS AVIATION WEATHER BOOKLET
Version 3.2/Dec 08 4-9
Figure 4-7 — Wind Shear Associated With a Temperature Inversion
The strongest turbulence within cumulonimbus clouds occurs with the shear between the updrafts and downdrafts. Outside the clouds, wind shear turbulence has been encountered several thousand feet above and 20 miles laterally from a severe storm. Severe turbulence can be encountered in the anvil 15 to 30 miles downwind. The storm cloud is only the visible portion of a turbulent system whose updrafts and downdrafts often extend outside the storm.
Flight Techniques for Turbulence The following are recommended procedures if you can’t avoid flying in turbulence:
1. Establish and maintain thrust settings consistent with turbulent air penetration airspeed and aircraft attitude. Severe turbulence may cause large and rapid variations in indicated airspeed. Don’t chase airspeed.
2. Trim the aircraft for level flight at the recommended turbulent air penetration airspeed. Don’t change trim after the proper attitude has been established.
3. The key to flying through turbulence is proper attitude control. Both pitch and bank should be controlled by reference to the attitude gyro indicator. Extreme gusts may cause large changes in pitch or bank. To avoid overstressing the aircraft, don’t make abrupt control inputs. Use moderate control inputs to reestablish the desired attitude.
4. Severe vertical gusts may cause appreciable altitude deviations. Allow altitude to vary. Sacrifice altitude to maintain desired attitude. Don’t chase the altimeter.
Turbulence Associated With Thunderstorms

JPATS AVIATION WEATHER BOOKLET
4-10 Version 3.2/Dec 08
AIRCRAFT ICING
Summary of Air Florida Mishap
On January 13, 1982, Air Florida Flight 90, a Boeing 727-222 (N62AF), was a scheduled flight to Fort Lauderdale, Florida, from Washington National Airport, Washington D.C. There were 74 passengers, including 3 infants, and 5 crewmembers on board. The flight’s scheduled departure time was delayed about 1 hour 45 minutes because of moderate to heavy snowfall, which necessitated the temporary closing of the airport.
Following takeoff from runway 36, which was made with snow and/or ice adhering to the aircraft, the aircraft at 1:31 EST crashed into the barrier wall of the northbound span of the 14th Street Bridge, which connects the District of Columbia with Arlington County, Virginia, and plunged into the ice-covered Potomac River. It came to rest on the west side of the bridge 0.75 nm from the departure end of runway 36. Four passengers and one crewmember survived the crash.
When the aircraft hit the bridge, it struck seven occupied vehicles and then tore away a section of the bridge barrier wall and bridge railing. Four persons in the vehicles were killed; four were injured.
The National Transportation Safety Board determined that the probable cause of this accident was the flight crew’s failure to use engine anti-ice during ground operation and takeoff, their decision to take off with snow/ice on the airfoil surfaces of the aircraft, and the captain’s failure to reject the takeoff during the early stage when his attention was called to anomalous engine instrument readings. Contributing to the accident were the prolonged ground delay between deicing and the receipt of ATC takeoff clearance during which the airplane was exposed to continual precipitation, the known inherent pitch up characteristics of the B-727 aircraft when the leading edge is contaminated with even small amounts of snow or ice, and the limited experience of the flight crew in jet transport winter operations.
Table 4-2 — Air Florida Mishap Abstract As graphically demonstrated by Table 4-2, icing poses a serious threat to aviation. No matter which part of the world home base is located, icing can become a hazard to any phase of flight, not just the takeoff or landing phase.
Aircraft icing is classified into two main groups: structural and engine icing.
Structural icing is icing that forms on the external structure of an aircraft. Structural ice forms on the wings, fuselage, antennas, pitot tubes, rotor blades, and propellers. Significant structural icing on an aircraft can cause control problems and dangerous performance degradation. The types of structural icing are clear, rime, mixed, and frost.
Engine icing occurs when ice forms on the induction or compressor sections of an engine, reducing its performance.

JPATS AVIATION WEATHER BOOKLET
Version 3.2/Dec 08 4-11
Icing Requirements There are two requirements for the formation of aircraft icing. First, the atmosphere must have super-cooled visible water droplets. Second, the free air temperature (measured by the aircraft’s outside air temperature gauge) and the aircraft’s surface temperature must be below freezing.
Clouds are the most common form of visible liquid water, and Super-cooled water is liquid water found at air temperatures below freezing. When super-cooled droplets strike an exposed object, such as a wing, the impact induces freezing and results in aircraft icing. Therefore, when penetrating a cloud at subzero temperatures, icing should be expected.
Super-cooled water forms because, unlike bulk water, water droplets in the free air do not freeze at 0° C. Instead, their freezing temperature varies from –10 to –40° C: the smaller the droplets, the lower the freezing point. As a general rule, serious icing is rare in clouds with temperatures below –20° C since these clouds are almost completely composed of ice crystals. However, be aware that icing is possible in any cloud when the temperature is 0° C or below.
Structural Icing Conditions Clear icing normally occurs at temperatures between 0° C and –10° C, where water droplets are large because of unstable air, such as in cumulus clouds and in areas of freezing rain or drizzle. Instead of freezing instantly upon contact with the aircraft’s surface, these large water droplets move along with the airflow, freeze gradually, and form a solid layer of ice. This layer of clear ice can cover a large portion of the wing surface and is difficult to break off. Clear icing is extremely hazardous because it builds up fast, can freeze the flight controls, and disrupts airflow over the wings.
Rime icing is milky white in appearance and is most likely to occur at temperatures of –10 to –20° C. It is more dense and harder than frost, but lighter, softer, and less transparent than clear ice. Rime ice occurs in stable conditions–clouds where the water droplets are small and freeze instantaneously, such as stratiform clouds and the upper portions of cumulus clouds. It is brittle and fairly easy to break off. Rime ice does not normally spread over an aircraft surface, but protrudes forward into the air stream along the leading edges of airfoils.
Mixed icing is a combination of clear ice and rime ice, occurring where both large and small water droplets are present, normally at temperatures of –8 to –15° C. Because mixed icing is a combination of large and small water droplets, it takes on the appearance of both rime and clear icing. It is lumpy, like rime ice, but also hard and dense, like clear ice. The most frequent type of icing encountered is usually a form of mixed icing.
Frost is a thin layer of crystalline ice that forms on exposed surfaces. It normally occurs on clear, calm winter nights on aircraft surfaces just as it does on automobiles. Frost also forms in flight when a cold aircraft descends from a zone of freezing temperatures into high relative humidity. The moist air is chilled suddenly to below freezing temperatures by contact with the cold surfaces of the aircraft, and deposition occurs. Frost, like other forms of icing, disrupts the smooth boundary layer flow over airfoils, and thus increases drag, causes a loss of lift, and increases stall speed. Though it is unlikely to add considerable weight to an aircraft, any amount of frost is hazardous and must be removed prior to takeoff.
Aircrews should anticipate and plan for some type of icing on every flight conducted in below freezing temperatures and should be familiar with the icing generally associated with different atmospheric conditions, as discussed in the next section.
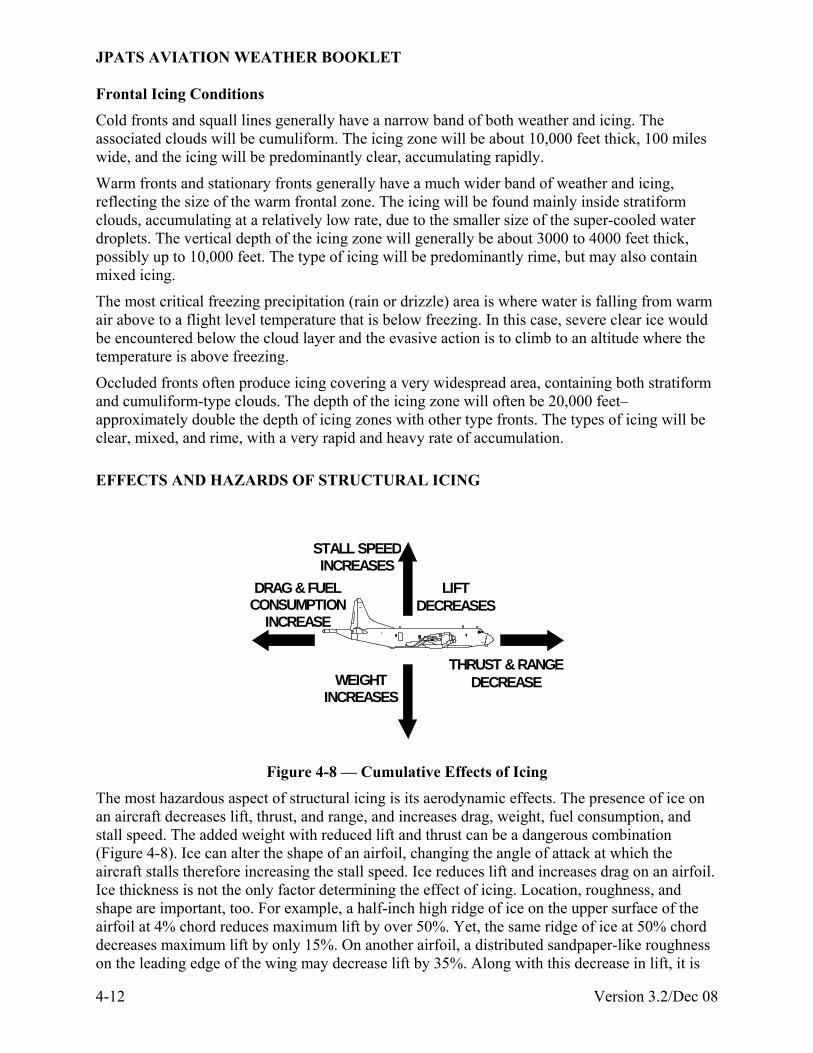
JPATS AVIATION WEATHER BOOKLET
4-12 Version 3.2/Dec 08
Frontal Icing Conditions Cold fronts and squall lines generally have a narrow band of both weather and icing. The associated clouds will be cumuliform. The icing zone will be about 10,000 feet thick, 100 miles wide, and the icing will be predominantly clear, accumulating rapidly.
Warm fronts and stationary fronts generally have a much wider band of weather and icing, reflecting the size of the warm frontal zone. The icing will be found mainly inside stratiform clouds, accumulating at a relatively low rate, due to the smaller size of the super-cooled water droplets. The vertical depth of the icing zone will generally be about 3000 to 4000 feet thick, possibly up to 10,000 feet. The type of icing will be predominantly rime, but may also contain mixed icing.
The most critical freezing precipitation (rain or drizzle) area is where water is falling from warm air above to a flight level temperature that is below freezing. In this case, severe clear ice would be encountered below the cloud layer and the evasive action is to climb to an altitude where the temperature is above freezing.
Occluded fronts often produce icing covering a very widespread area, containing both stratiform and cumuliform-type clouds. The depth of the icing zone will often be 20,000 feet–approximately double the depth of icing zones with other type fronts. The types of icing will be clear, mixed, and rime, with a very rapid and heavy rate of accumulation.
EFFECTS AND HAZARDS OF STRUCTURAL ICING
THRUST & RANGEDECREASE
LIFT DECREASES
WEIGHTINCREASES
DRAG & FUEL CONSUMPTION
INCREASE
STALL SPEEDINCREASES
Figure 4-8 — Cumulative Effects of Icing The most hazardous aspect of structural icing is its aerodynamic effects. The presence of ice on an aircraft decreases lift, thrust, and range, and increases drag, weight, fuel consumption, and stall speed. The added weight with reduced lift and thrust can be a dangerous combination (Figure 4-8). Ice can alter the shape of an airfoil, changing the angle of attack at which the aircraft stalls therefore increasing the stall speed. Ice reduces lift and increases drag on an airfoil. Ice thickness is not the only factor determining the effect of icing. Location, roughness, and shape are important, too. For example, a half-inch high ridge of ice on the upper surface of the airfoil at 4% chord reduces maximum lift by over 50%. Yet, the same ridge of ice at 50% chord decreases maximum lift by only 15%. On another airfoil, a distributed sandpaper-like roughness on the leading edge of the wing may decrease lift by 35%. Along with this decrease in lift, it is

JPATS AVIATION WEATHER BOOKLET
Version 3.2/Dec 08 4-13
obvious that parasite drag will significantly increase. The buildup of ice on various structural parts of the aircraft can result in vibration, causing added stress to those parts. This is especially true in the case of propellers and rotors, which are delicately balanced. Even a small amount of ice, if not distributed evenly, can cause great stress on the propeller and engine mounts.
Icing is not restricted to airfoils and other external structure. Engines, fuel, and instruments may also be affected by ice formation.
Figure 4-9 — Pitot Tube Icing Ice associated with freezing rain or drizzle can accumulate beyond the limits of an ice protection system. If you encounter any type of freezing rain or drizzle, the best course of action is to leave the area.
Structural icing can block the pitot tube (Figure 4-9) and static ports. This can cause a pilot to either lose or receive erroneous indications from various instruments such as the airspeed indicator, VSI, and altimeter. For example, if the pitot tube becomes blocked with ice, the “total pressure” input to the system remains constant. Therefore, during a descent, as the “static pressure” input to the system increases, the airspeed indicator gives an erroneous indication of decreasing airspeed. The opposite would be true during a climb.
During flight, it can be difficult to detect ice on areas such as the empennage that may be impossible to see. Some cues which signal the potential for icing include the following: (1) ice on windshield wiper arms or projections such as engine drain tubes, pitot tubes, engine inlet lips, or propeller spinners, (2) decreasing airspeed with constant power and altitude, and (3) ice detector annunciation.
Icing on rotary wing aircraft is related to those involving wings and propellers. Ice formation on the helicopter main rotor system or anti-torque rotor system may produce serious vibration, loss of efficiency or control, and can significantly deteriorate the available RPM to a level where safe landing cannot be assured. In fact, a 3/16-inch (4.8-mm) coating of ice is sufficient to prevent some helicopters from maintaining flight in a hover.
OTHER TYPES OF AIRCRAFT ICING Induction icing – In flights through clouds that contain super-cooled water droplets, air intake duct icing is similar to wing icing. However, the ducts may ice when skies are clear and temperatures are above freezing. The reduced pressure that exists at the intake lowers the temperature to the point that condensation and or deposition take place, resulting in the formation of ice. The degree of temperature decrease varies considerably with different types of engines. However, if the free air temperature is 10° C or less (especially near the freezing point),

JPATS AVIATION WEATHER BOOKLET
4-14 Version 3.2/Dec 08
and the relative humidity is high, the possibility of induction icing exists. Ingestion of ice shed ahead of the compressor inlet may cause severe foreign object damage (FOD) to the engine.
Compressor icing – Ice forming on compressor inlet screens and compressor inlet guide vanes will restrict the flow of inlet air, eventually causing engine flameout. The reduction in airflow is noticeable through a loss of thrust and a rapid rise in exhaust gas temperature. As the airflow decreases, the fuel-air ratio increases, which in turn raises the temperature of the gases going to the turbine. The fuel control attempts to correct any loss in engine RPM by adding more fuel, which merely aggravates the condition. Ice build-up on inlet screens sufficient to cause turbine failure can occur in less than 1 minute under severe conditions.
Ground icing hazards – We have already stressed the importance of removing all icing and frost from an aircraft prior to takeoff. De-icing itself, however, can also be a hazard. De-icing fluids (discussed in the next section) are highly corrosive to internal aircraft and engine parts. Thus, it is imperative that de-icing crews understand the particular requirements for your type of aircraft. Additionally, taxiing through mud, water or slush on ramps and runways can create a covering of ice that can hamper the movement of flaps, control surfaces, and the landing gear mechanism. Ice and snow on runways are conditions that affect braking action of aircraft. Braking action varies widely with aircraft type and weight. Therefore, pilots must be aware of the limits to their aircraft’s braking capabilities.
MINIMIZING OR AVOIDING ICING HAZARDS
Flight Path Options
Figure 4-10 — Options to Escape Icing In coping with an icing hazard in flight, a pilot usually has two alternatives. First, the pilot can climb to the colder temperatures where the precipitation will be frozen and therefore not an icing hazard. Second, the pilot can descend to an altitude where the air temperatures are well above freezing (Figure 4-10). However, if encountering clear icing in the freezing precipitation below the clouds of a warm front, the aircraft is most likely in the cold air ahead of the warm front. In this case, the best alternative may be to climb to warmer temperatures, across the frontal boundary, as the freezing precipitation may extend all the way to ground level.

JPATS AVIATION WEATHER BOOKLET
Version 3.2/Dec 08 4-15
Anti-Icing and De-Icing Equipment Deicing equipment eliminates or removes ice that has already accumulated on the aircraft. Anti-icing equipment prevents the accumulation of ice on specific aircraft surfaces. Most military aircraft are equipped with anti-icing and or deicing equipment. There are three common methods for preventing and or eliminating ice buildup: mechanical, fluids, and heat.
The mechanical method uses deicing boots, which are rubber bladders installed on the leading edges of lift producing surfaces. Compressed air cycles through these rubber boots causing them to alternately inflate and deflate, thus cracking accumulated ice and allowing the air stream to peel it away.
Anti-icing fluids are freezing point depressants and are pumped through small holes in the wing’s leading edge. This fluid coats the wing, preventing ice from forming on the wing’s surface. Deicing fluids are also used by ground crews to remove and prevent ice buildup before takeoff.
Heat application capability to wings, props, tail surfaces, or engine intakes is installed in most aircraft. Systems of this nature can be designed for either anti-icing or deicing purposes. Critical areas can be heated electrically or by hot air that is bled from the engine’s compressor section.
Recommended Precautions: Keep these precautions in mind when flying in the vicinity of icing conditions.
1. Don’t fly into areas of known or forecast icing conditions.
2. Avoid flying in clouds with temperatures from 0° C to –20° C.
3. Don’t fly through rain showers or wet snow with temperatures near freezing.
4. Avoid low clouds above mountain ridges or crests. Expect the heaviest icing in clouds around 5000 feet above the mountaintops.
5. Do not make steep turns with ice on the airplane due to increased stall speeds.
6. Avoid high angles of attack when ice has formed on the aircraft since the aircraft is closer to stall speed in these maneuvers.
7. Under icing conditions, increased drag and additional power required increases fuel consumption.
8. Change altitude to temperatures above freezing or colder than -20° C. An altitude change also may take you out of clouds.
9. In freezing rain, climb to temperatures above freezing, since it will always be warmer at some higher altitude. Don’t delay your climb since ice can accumulate quickly. If you are going to descend, you must know the temperature and terrain below.
10. Do not fly parallel to a front while encountering icing conditions.
11. Avoid icing conditions as much as possible in the terminal phase of flight due to reduced airspeeds.
12. Expect to use more power on final approach when experiencing structural icing.
13. Always remove ice or frost from airfoils before attempting takeoff.

JPATS AVIATION WEATHER BOOKLET
4-16 Version 3.2/Dec 08
Icing Intensities and PIREPs Weather personnel cannot generally observe icing; they must rely on PIREPs. When flying during icing conditions, pilots should report these conditions as indicated in Table 4-3. However, forecasters attempt to forecast the maximum intensity of icing that may be encountered during a flight, not necessarily the intensity of icing that will be encountered by a particular aircraft. It becomes the pilot’s responsibility to make certain that a complete weather briefing is obtained, to include the information for safe completion of the flight.
Intensity Airframe Ice Accumulation Pilot Report
Trace Ice becomes perceptible. Rate of accumulation slightly greater than rate of sublimation. It is not hazardous even though deicing/anti-icing equipment is not used, unless encountered for an extended period of time--over one hour.
Aircraft identification, location, time (GMT), altitude (MSL), type aircraft, sky cover, visibility & weather, temperature, wind, turbulence, icing, remarks.
Example of PIREP transmission:
“Pensacola METRO, Rocket 501, holding 20 miles south of Navy Pensacola, at 2100Z and one-six thousand feet, single T-39 Sabreliner, we’re IFR in stratus clouds, temperature –15° C, winds 330 at 25, no turbulence, Light Rime Icing, flying 200 knots indicated.
Light The rate of accumulation may create a problem if flight is prolonged in this environment (over one hour). Occasional use of deicing/anti-icing equipment removes/prevents accumulation. It does not present a problem if the deicing/anti-icing equipment is used.
Moderate The rate of accumulation is such that even short encounters become potentially hazardous and use of deicing/anti-icing equipment or diversion is necessary.
Severe The rate of accumulation is such that deicing/anti-icing equipment fails to reduce or control the hazard. Immediate diversion is necessary.
Icing may be rime, clear, or mixed:
Rime ice – Rough milky opaque ice formed by the instantaneous freezing of small super-cooled water droplets.
Clear ice – A glossy, clear or translucent ice formed by the relatively slow freezing of large super-cooled water droplets.
Mixed ice – A combination of rime and clear ice.
Table 4-3 — Icing Reporting Criteria

JPATS AVIATION WEATHER BOOKLET
Version 3.2/Dec 08 4-17
VISIBILITY DEFINITIONS Visibility is important to all aviators since it plays an essential role in takeoffs, approaches, and landings. Visibility is defined as the ability to see and identify prominent unlighted objects by day and prominent lighted objects at night, and is expressed in statute miles, hundreds of feet, or meters. There are several particular methods of reporting visibility, some of which are defined below.
Flight Visibility – The average forward horizontal distance, measured in statute miles from the cockpit of an aircraft in flight, at which a pilot can see and identify prominent unlighted objects by day and prominent lighted objects at night.
Prevailing Visibility – The greatest horizontal visibility, measured in statute miles, equaled or exceeded throughout at least half the horizon circle, which need not be continuous. Figure 4-11 illustrates how prevailing visibility is determined. The center of the circles depict the observation point, and the edge of the circles represent a distance of 3 miles, the furthest that prominent objects may be seen and identified. In the left depiction, the maximum visibility common to half or more of the horizon circle is 3 miles, so the prevailing visibility is 3 miles. If a bank of fog were to roll in to the airfield, as in the right depiction, visibility toward the east would be reduced. However, the observer can still see 3 miles throughout at least 180° of view, so the prevailing visibility is still 3 miles. Look at the visibility for each of the runways, and notice how the actual visibility may vary significantly from the prevailing visibility.
Figure 4-11 — Prevailing Visibility Determination Slant Range Visibility – The distance on final approach when the runway environment is in sight. This is probably the most vital weather information needed during a final approach in questionable weather. Unfortunately, slant rage visibility is not often provided because of great difficulty in estimating or measuring it from the ground. RVR provides the best indication of the slant range visibility. However, other weather information such as precipitation and prevailing visibility help indicate slant range visibility.
Runway Visual Range (RVR) – The horizontal distance, expressed in hundreds of feet or meters, a pilot will see by looking down the runway from the approach end. For take off and landing under IFR, prevailing visibility is not as important as the visibility within the runway environment.

JPATS AVIATION WEATHER BOOKLET
4-18 Version 3.2/Dec 08
Surface vs Flight Visibility RVR and prevailing visibility are horizontal visibilities near the Earth’s surface. They may be quite different from the vertical visibility when looking down at the ground from an aircraft in flight. For example, surface visibility may be seriously reduced by fog or blowing snow, yet only a slight reduction in visibility is apparent when viewed from above the field. In Figure 4-12, the airfield may be seen relatively clearly from above the fog. When descending to the level of the fog, however, the airfield may disappear from sight. In another situation, flying into the setting sun on a hazy day may reduce flight visibility to values less than the surface visibility. When given the surface visibility, learn to anticipate what your flight visibility is likely to be. It may vary, depending on other weather conditions present.
Figure 4-12 — Surface vs. Flight Visibility
Obscuring Phenomena Obscuring phenomena are any collection of particles that reduce horizontal visibility to less than six miles. They may be either surface based or aloft. Examples include fog, haze, smoke, volcanic ash, and blowing spray, to name a few.
Haze produces a bluish color when viewed against the ground. Although haze may occur at any level in the troposphere, it is more common in the lower few thousand feet. Haze is associated with a stable atmosphere. The top of a haze layer, which is usually confined by a low-level inversion, has the appearance of a horizon when viewed from above the layer. In this case, the haze may completely obscure the ground in all directions except the vertical. Dense haze may reduce visibility to less than 3 miles, with slant range visibility generally less than surface visibility. Visibility in haze is lower when looking toward the Sun than away from it.
Smoke causes the sunrise and sunset to appear very red. Smoke reduces visibility in a manner similar to haze. Smoke from forest fires is often concentrated in layers aloft with good visibility beneath. Smoke may be a major concern near industrial areas. Smoke from forest fires has been

JPATS AVIATION WEATHER BOOKLET
Version 3.2/Dec 08 4-19
carried great distances at high altitudes. Aircrews flying at these altitudes may encounter dense smoke, although the lower altitudes are clear.
Rain and Drizzle – Precipitation in its liquid form can, on its own, reduce visibility. Precipitation also reduces visibility as it streams across a windshield or canopy. Drizzle is a feature of stable air, and fog or smog are also likely to be present. Therefore, drizzle may result in extremely poor visibility. Approaches and the ensuing transition to visual flight can be very hazardous since moderate to heavy rain conditions can seriously affect the recognition of visual cues. Night approaches in these conditions can be even more critical as you may be distracted by the aircraft’s flashing strobes or sequenced flashing runway lights.
Snow —Snow affects visibility much more than rain or drizzle and can easily reduce visibility to less than 1 mile. It is often difficult to see snow falling ahead of you; you may enter the snow unexpectedly.
Blowing Snow – Fine, dry snow can be easily lifted by the wind up to 300 feet AGL, depending on wind strength and air stability. During or after a fresh snowfall with brisk winds, surface visibility may be reduced to less than ½ mile. Blowing snow is accompanied by many of the same hazards as rain, such as turbulence (creating difficulties in reading flight instruments) and obscured visual cues (a lack of visual cues for runway identification during the visual portion of the approach). The approach and runway lights will provide some identification of the runway environment; however, runway markings may be lost in the whiteness. Therefore, depth perception will be difficult, requiring more emphasis on instruments.
Dust and Sand form when strong winds combined with unstable air and loose, dry soil can blow dust or sand into the air. Dust is finer than sand, and strong winds may lift the dust to considerable heights. Sand will usually be limited in altitude to 50 or 100 feet. In severe conditions, visibility can be near zero. Blowing dust is common behind cold fronts moving rapidly across prairies in early spring before a cover of vegetation has appeared. This effect may cause blowing dust conditions and reduced visibilities over a wide area.
SKY COVERAGE AND CEILINGS For determining the amount of sky covered by clouds, the celestial dome is divided into 8ths. The terms contained in Table 4-4 are used to report the percentage of sky coverage as well as any obstructions to visibility. These coverages apply to a given altitude; therefore, more than one is normally reported. For example, the sky may be reported as follows: SCT at 2000 ft., BKN at 5000 ft., OVC at 10,000 ft., where the altitudes refer to the bases of the cloud layers in feet AGL.

JPATS AVIATION WEATHER BOOKLET
4-20 Version 3.2/Dec 08
Reportable Contractions Meaning Amount of Sky Cover
SKC or CLR1 Sky Clear 0/8
FEW2 Few > 0/8 - 2/8
SCT Scattered 3/8 - 4/8
BKN Broken 5/8 - 7/8
OVC Overcast 8/8
VV Obscured3 8/8 (surface based)
1. The abbreviation CLR is used at automated stations when no clouds at or below 12,000 feet are reported; the abbreviation SKC is used at manual stations when no clouds are reported.
2. Any amount less than 1/8 is reported as FEW.
3. The last 3 digits report the height of the vertical visibility into an indefinite ceiling.
Table 5-4 — Sky Coverage Contractions
A ceiling is the height above the ground (AGL) ascribed to the lowest broken or overcast layer; or the vertical visibility into an obscuring phenomenon (total obscuration).
Vertical visibility is the distance that can be seen directly upward from the ground into a surface-based obscuring phenomenon. This term is used when the celestial dome is totally hidden from view (8/8s) by some surface based obscuration, and the reported ceiling is determined by measuring the vertical visibility upward as seen from the ground. In this type of situation, the base of the obscuration is less well defined, but it may still be possible to see upwards into the moisture (or other obstruction) for a short distance. While this does constitute a ceiling, it is sometimes referred to as an “indefinite” ceiling, and the distance that can be seen upward into the phenomenon is then given as the vertical visibility. For example, if the sky were totally hidden by fog which touched the ground, but a ground observer could see a weather balloon ascend upward into the fog for 200 feet, she would report a vertical visibility of 200 feet.
It is important to realize that the vertical visibility of 200 feet in the foregoing example is very different from a cloud ceiling of 200 feet. With a low cloud ceiling, a pilot normally can expect to see the ground and the runway once the aircraft descends below the cloud base. However, in the case of vertical visibility, the obscuring phenomenon also reduces the slant range visibility. Therefore, a pilot will have difficulty seeing the runway or approach lights clearly even after descending below the level of the reported vertical visibility.
If the weather observer on the ground is able to see part of the celestial dome or some clouds through an obscuring phenomenon (a partial obscuration) it is reported as few, scattered, or broken as appropriate, and assigned a height of 000 to indicate it is a surface based phenomenon. If clouds are present, their bases and amount or coverage are also reported.
Surface based obscuring phenomena classified as few, scattered, or broken also present a slant range visibility problem for pilots on approach for a landing but normally to a lesser degree that when the celestial dome is completely hidden. Thus, partial obscurations are not considered ceilings.

JPATS AVIATION WEATHER BOOKLET
Version 3.2/Dec 08 4-21
Fog vs Stratus Fog related low ceilings and reduced visibility are among the most common and persistent weather hazards encountered in aviation. Since fog occurs at the surface, it is primarily a hazard during takeoff and landing.
Fog is a visible aggregate of minute water droplets that is based at or within 50 feet of the surface, is greater than 20 feet in depth, and reduces the prevailing visibility to less than ⅝ of a statute mile. Fog reduces horizontal and vertical visibility and may extend over a large area.
Fog that extends no more than 200 feet in height is considered shallow fog and is normally reported as a partial obscuration. Since the fog may be patchy, it is possible that visibility will vary considerably during the approach and rollout. RVR may not be representative of actual conditions in this situation if the measuring equipment is located in an area of good visibility.
One of the most serious problems with shallow fog stems from the abundance of cues available at the start of the approach. You may see the approach lighting system and possibly even some of the runway during the early stages of the approach. However, as the fog level is entered, loss of visual cues may cause confusion or disorientation. In these conditions, you should not rely entirely on visual cues for guidance. Bring visual cues into your instrument cross-check to confirm position, but maintain instrument flight until visual cues can provide sufficient references for landing.
Dense fog normally causes a total obscuration. You will not normally see visual cues during the early portion of an approach. Strobe lights and landing lights may cause a blinding effect at night. Transitioning to land in a total obscuration involves the integration of visual cues with the instrument cross-check during the latter portion of the approach.
A layer of low clouds forming a ceiling is usually formed from stratus clouds. Stratus, like fog, is composed of extremely small water droplets or ice crystals suspended in the air. The main distinction between fog and stratus is that a stratus layer is not surface based. It is above the ground (greater than 50 feet AGL) and does not reduce the horizontal visibility at the surface. An observer on a mountain enveloped in the layer would call it fog, while one farther down the slope would call it stratus. In fact, the requirements for formation of fog contain many of the same items listed in the requirements for cloud formation.
Fog Formation
The formation of fog or cloudiness of any type is dependent on the air becoming temporarily supersaturated (contains more moisture than the air can hold at that temperature). Once the air reaches a supersaturated state, the excess moisture in the air condenses out of solution into minute water droplets that are light enough to remain suspended in the air. If the condensed water particles form in sufficient amount near the surface, the resulting condition is fog. For fog to form, three conditions must be satisfied: (1) condensation nuclei must be present in the air, (2) the air must have a high water content (a low dew point spread), (3) and light surface winds must be present.
Recall from Chapter 2 that when the air temperature is equal or nearly equal to the dew point temperature, there is a low dew point spread, and the air is close to saturation. Once saturation is achieved–either through the cooling of the air or through the evaporation of water into the atmosphere–water will condense from the vapor state into water droplets or ice crystal.

JPATS AVIATION WEATHER BOOKLET
4-22 Version 3.2/Dec 08
Figure 4-13 — Wind Causing Eddy Currents, Cooling Air to Saturation Wind velocity is an important consideration in the formation of fog. As will be discussed shortly, the radiational cooling of the Earth’s surface is one of the main causes of fog formation. When light surface winds are present, on the order of 1 to 10 knots, the speed differential resulting from friction slowing the air directly next to the surface causes the air to tumble in a mild eddy current (Figure 4-13). This brings more air in contact with the surface, enabling more air to be cooled, producing a thicker layer of condensed moisture. If the winds become too fast, however, this layer lifts away from the ground, lifting the bases higher with increasing speeds.
Types of Fog The two main types of fog are radiation fog and advection fog.
Figure 4-14 — Radiation Fog Radiation fog (Figure 4-14) occurs due to nocturnal cooling, usually on clear nights, when the Earth releases relatively large amounts of radiation into the atmosphere, cooling the surface. (Cloudy nights, on the other hand, reflect most terrestrial radiation back to the Earth, reducing
Radiation Fog

JPATS AVIATION WEATHER BOOKLET
Version 3.2/Dec 08 4-23
the amount of cooling through a “blanket” effect.) Radiation cooling actually begins after the maximum daily temperature is reached, usually between 1530 and 1600 local time. Cooling continues until sunrise or shortly after sunrise, and it effects only the lower limits of the atmosphere. If nocturnal cooling reduces the air temperature to the dew point temperature, fog or low ceiling clouds will develop in the area. Winds play an important factor in fog formation. Winds less than 5 knots usually results in shallow fog. Winds of 5 to 10 knots will usually cause dense fog. Winds of greater than 10 knots will usually dissipate the fog and cause low stratus or stratocumulus clouds to form. The other way radiation fog can dissipate is through solar heating.
Figure 4-15 — Dissipation of Radiation Fog In considering the dissipation of fog and low clouds, consideration should be given to the rate at which the ground temperature can increase after sunrise. Vertically thick fog or multiple cloud layers in the area will slow down the morning heating of the ground. Only the heating of the ground can increase the temperature of the air overlying the ground. Once the surface air temperature rises, the ability of the air to hold more water vapor increases, and the fog particles tend to evaporate (Figure 4-15).
Advection fog occurs when warm, moist air moves over a cold surface and the air is cooled to below its dew point. Common in coastal areas, it is often referred to as sea fog when observed to come from the sea. Fog of this type becomes thicker and denser as the wind speed increases, up to about 15 knots. Winds much stronger than this lift the fog into a layer of low stratus. However, in some oceanic areas, sea fog has been known to persist with winds as high as 40 knots. Advection fog can stay over the water for weeks, moving over the land late in the day and moving back over the water the next morning.
Advection Fog

JPATS AVIATION WEATHER BOOKLET
4-24 Version 3.2/Dec 08
Figure 4-16 — Advection Fog The west coast of the United States is quite vulnerable to sea fog (Figure 4-16). This frequently occurring fog forms offshore–largely as a result of very cold water from the ocean depths rising to the surface, cooling the moist air above it–and is carried inland by the wind. Advection fog over the southeastern United States and along the Gulf Coast results from moist tropical air moving over cold ground. It is, therefore, more frequent in winter than in summer.
Advection fog dissipates only with a wind shift, blowing the fog away, usually back out over the sea. Incoming solar radiation will seldom cause the dissipation of advection fog because its thickness generally prevents enough radiation to warm the Earth sufficiently. The high specific heat of water and the resulting stable temperature also prevents any solar heating from causing the dissipation of sea fog. Only a change in wind direction that moves the air from a colder surface to a warmer surface, reversing the saturation process, can cause advection fog to dissipate.
VOLCANIC ASH CLOUDS
Volcanic eruptions are rare, but the severe effects ash clouds have on an aircraft make it important to understand the hazards in order to minimize or avoid them.
Volcanic ash clouds create an extreme hazard to aircraft operating near (especially downwind) of active volcanoes. Aircraft flying through volcanic ash clouds have experienced a significant loss of engine thrust and/or multiple engine flameouts along with wing leading edges and windshields being sandblasted.
Flight into an area of known volcanic activity must be avoided. Avoiding volcanic ash clouds is particularly difficult during hours of darkness or in daytime instrument meteorological conditions when the volcanic ash cloud may not be detected by the flight crew. Volcanic ash clouds are not displayed on airborne or Air Traffic Control (ATC) radar, as the radar reflectivity of volcanic ash is roughly a million times less than that of a cumuliform cloud.
A volcanic ash cloud is not necessarily visible, either. Aircrews have reported smelling an acrid odor similar to electrical smoke and smoke or dust appearing in the aircraft, but not seeing the

JPATS AVIATION WEATHER BOOKLET
Version 3.2/Dec 08 4-25
ash cloud. Expect minor eye irritation if odors become noticeable (i.e., eyes watering). Remove contact lenses if this occurs. Consider using oxygen when odors or eye irritation occurs.
If volcanic activity is reported, the planned flight should remain at least 20 NM from the area and, if possible, stay on the upwind side of the volcano even when flying outside of the 20 NM limitation. Volcanic ash clouds may extend downwind for several hundred miles and thousands of feet in altitude. Volcanic ash can cause rapid erosion and damage to the internal components of engines with loss of thrust within 50 seconds.
Since airborne radar cannot detect volcanic ash clouds, weather forecasts are occasionally wrong, and ash clouds may be hidden by other clouds, inadvertent flight through an ash cloud may occur. It may be difficult to determine if you are in an ash cloud when flying through other clouds or at night. The following conditions may indicate you have inadvertently flown into an ash cloud:
1. Airspeed indications may fluctuate greatly or appear unusually high or low due to volcanic dust blocking the pitot-static system. Establish the proper pitch and power settings required by the Dash One or the NATOPS Flight Manual for flying with an unreliable airspeed indicator.
2. An acrid odor similar to electrical smoke may be present.
3. A rise in oil temperature could indicate dust-plugged oil cooler(s).
4. Torching (flames) from the engine tailpipe(s) may occur.
5. Volcanic ash/dust may be blown into the cockpit through the aircraft air conditioning system.
6. Windshields become pitted so severely that they are translucent. In addition, the abrasive cloud particles will sandblast the aircraft’s leading edges.
7. At night, St. Elmo’s fire and static discharges around the windshield are often visible. A bright orange glow in engine inlets frequently occurs.
8. At night, or in dark clouds, landing lights cast dark distinct shadows in ash clouds (unlike the fuzzy, indistinct shadows that are cast against moisture clouds).
9. Multiple engine malfunctions such as power surges, loss of thrust, high EGT, or compressor stalls. These result from ash buildup and blockage of the high-pressure turbine guide vanes and high-pressure turbine cooling ports.
10. More than one or all engines may flameout, since all engines are exposed to the same ash cloud.
If you encounter volcanic ash in flight, the best procedure is to perform a 180 degree turn immediately and leave the area. Consider also a reduction in altitude, as hot ash has most likely ascended in convective currents before forming the cloud. Reduce thrust to the minimum practical and monitor your engine instruments for indications of a possible flameout. If engines flameout, continue attempting restart procedures, as exiting the ash cloud may improve the probability of light off. Declare an in-flight emergency as soon as practicable, and land at the nearest suitable airfield. Transmit PIREPs to military weather stations to report the location of the volcanic ash cloud (to warn other aircrews). As soon as safely possible, record the altitude, location, duration of exposure, and any related malfunctions observed, since special aircraft cleanup procedures are required after flight through volcanic ash.

JPATS AVIATION WEATHER BOOKLET
4-26 Version 3.2/Dec 08
WEATHER HAZARDS REVIEW QUESTIONS
1. Which one of the following is NOT one of the classifications used to describe turbulence?
a. Trace
b. Light
c. Moderate
d. Extreme
2. Which one of the following may cause mechanical turbulence when air is flowing over it?
a. Irregular terrain
b. Buildings
c. Mountains
d. All of the above
3. Which one of the following is not one of the cloud formations associated with mountain wave turbulence?
a. Lenticular cloud
b. Roll cloud
c. Rotor cloud
d. Cap cloud
4. Frontal turbulence would be the most severe when associated with a ______.
a. fast moving warm front
b. fast moving cold front
c. slow moving warm front
d. slow moving cold front
5. Which one of the following is not one of the recommended procedures for flying through turbulence?
a. Establish and maintain thrust settings consistent with cruise airspeeds
b. Control attitude by referencing the attitude gyro indicator
c. To avoid overstressing the aircraft, don’t make abrupt control inputs
d. Allow airspeed and altitude to vary; don’t chase the altimeter
6. What conditions are necessary for the formation of ice on aircraft?
a. Freezing temperatures, invisible moisture, and rain
b. Freezing temperatures, visible moisture, and aircraft skin temperature below freezing
c. Freezing temperatures, humidity above 75 percent, and aircraft skin temperature below freezing
d. Freezing temperatures, strong head winds, and clear skies

JPATS AVIATION WEATHER BOOKLET
Version 3.2/Dec 08 4-27
7. An aviation hazard associated with structural icing is that it results in ______.
a. a reduction of lift by changing the airfoil characteristics
b. a decrease in airspeed
c. a decrease in drag
d. both a and c are correct
8. Clear icing will generally be encountered between a temperature range of ______.
a. –2° C and –10° C
b. 0° C and –10° C
c. 0° C and –20° C
d. +2° C and –20° C
In questions 9 through 12, match the types of structural ice in column B with the correct descriptions in column A.
A B
9. Formed from small super-cooled water droplets in stratiform clouds of stable air
10. Consists of ice crystals formed by deposition.
11. Formed by large individual water droplets freezing as they strike the aircraft surface
12. Considered to be the most frequently encountered type of icing
a. Clear icing
b. Rime icing
c. Mixed icing
d. Frost
13. What happens to stall speed when ice forms on the wings of an aircraft?
a. It will increase
b. It will decrease
c. It will remain the same
d. All of the above
14. Engine failure due to icing conditions encountered by a jet aircraft is generally the result of ______.
a. carburetor icing
b. a rapid drop in exhaust gas temperature
c. a decrease in the fuel-air ratio
d. induction icing

JPATS AVIATION WEATHER BOOKLET
4-28 Version 3.2/Dec 08
15. Ice in the pitot tube or static ports could affect instruments, depending on the type of aircraft and its system hookup.
a. True
b. False
16. Which one of the following would be correct if an aircraft attempted to take off without removing frost that has formed during the night?
a. Increase in the stall speed
b. Lift and drag/ratios will be affected
c. Extensive weight increase
d. All of the above are correct
e. Only a and b are correct
17. Which one of the following types of clouds would you most likely be flying through if encountering clear icing?
a. Nimbostratus
b. Cumulus
c. Cirrocumulus
d. Both b and c are correct
18. Which one of the following states a correct evasive tactic for use when wet snow or freezing rain is encountered?
a. Climb or descend to colder air in either case
b. Climb or descend to warmer air in either case
c. Climb to colder air with wet snow and climb to warmer air with freezing rain
d. Climb to warmer air with wet snow and climb to colder air with freezing rain
19. Which one of the following is NOT one of the classifications used to describe icing?
a. Light
b. Moderate
c. Severe
d. Extreme
20. Which one of the following conditions would most likely result in frost on an aircraft?
a. Cloudy nights, 5 knots of wind, dew point 28° F
b. Clear nights, no wind, dew point of 28° F
c. Clear nights, 5 knots of wind, dew point of 32° F
d. Cloudy nights, no wind, dew point of 37° F

JPATS AVIATION WEATHER BOOKLET
Version 3.2/Dec 08 4-29
21. Which one of the following describes a basic type of fog classification?
a. Air mass
b. Advection
c. Adiabatic
d. All of the above are correct
22. Which one of the following will result in the saturation of an air mass?
a. Rising dew point
b. Lowering humidity
c. Lowering dew point
d. Rising temperature
23. A layer of condensed water vapor is considered to be fog if its base is at or below 20 feet above terrain elevation and greater than 50 feet in thickness.
a. True
b. False
24. Radiation fog could be expected in areas characterized by ______.
a. low wind speed, and clear skies
b. low wind speed, and cloudy skies
c. high wind speed, and cloudy skies
d. high wind speed, and clear skies
25. What phenomenon would your aircraft be flying through if experiencing a rise in oil temperatures, acrid odor (possibly from an electrical fire), airspeed fluctuations, pitted windscreens, and a bright orange glow around the engine inlets?
a. Advection fog
b. Microburst
c. Volcanic ash cloud
d. Mountain wave turbulence

JPATS AVIATION WEATHER BOOKLET
4-30 Version 3.2/Dec 08
This page intentionally left blank

JPATS AVIATION WEATHER BOOKLET
Version 3.2/Dec 08 5-1
JX105 - THUNDERSTORMS
OVERVIEW Thunderstorms contain many of the most severe weather hazards. They are often accompanied by strong wind gusts, severe turbulence, lightning, heavy rain showers, severe icing, and possibly hail and tornadoes. As a result, thunderstorms should be avoided if possible.
About 44,000 thunderstorms occur daily over the earth and pilots can expect to encounter one occasionally. In some tropical regions, thunderstorms occur year-round. In the mid-latitudes, they develop most frequently in spring, summer, and fall. This chapter presents hazards a pilot must consider when flying in the vicinity of, or actually entering, a thunderstorm. Being familiar with these factors will help you better understand what is going on both inside and outside the cockpit. Knowledge of thunderstorm characteristics and the application of tested procedures will help aircrews operate more safely near thunderstorms.
REFERENCES AFH 11-203, Weather for Aircrews, Volume 1, Chapters 1, 3, and 4.
THUNDERSTORM DEVELOPMENT The basic requirements for thunderstorm formation are moisture, unstable air, and some type of lifting action. Lifted air does not always result in thunderstorm activity. Air may be lifted to a point where the moisture condenses and clouds form, but these clouds may not grow significantly unless the air parcel reaches a point where it will continue to rise freely (recall the LFC from Chapter 2). The higher the moisture content, the easier the LFC is reached. One of the four lifting methods (from Chapter 2) is necessary to force warmer air from its lower level to the LFC, which is the trigger to starting the cumulus cloud through the thunderstorm life cycle. Once moist air is lifted in an unstable environment, the rapidly rising unstable air quickly forms towering cumulus and eventual cumulonimbus clouds. The degree of vertical cloud growth often indicates the potential severity of the thunderstorm.
THUNDERSTORM WEATHER HAZARDS Thunderstorms are accompanied by some or all of the following hazards: extreme turbulence, hail, microbursts, severe icing, lightning, and tornadoes.
Turbulence Severe turbulence is present in all thunderstorms. One of the major characteristics of every thunderstorm is updrafts and downdrafts that can occur near each other creating strong, vertical shear and turbulence. This turbulence can extend over 5000 feet above the cloud tops and down to the ground beneath the cloud base. It can damage an airframe and cause serious injury to passengers and crew.
The first gust or gust front of an approaching thunderstorm is another form of turbulence that can cause a rapid and drastic change in the surface wind (Figure 5-1). An attempt to take off or land with an approaching thunderstorm nearby could have disastrous results. Gust fronts can travel 5 to 20 miles from the thunderstorm.

JPATS AVIATION WEATHER BOOKLET
5-2 Version 3.2/Dec 08
Figure 5-1 — Gust Front A roll cloud on the lower leading edge of a cumulonimbus cloud marks an area of strong eddy currents and identifies the location of wind shear and severe turbulence occurring with the onset of the gust front (Figure 5-2).
Figure 5-2 — Roll Cloud Large pressure changes can accompany thunderstorm formation due to the turbulence of updrafts and downdrafts. Therefore, if the altimeter setting is not updated, the indicated altitude might be in error by over 200 feet. The pressure variations associated with thunderstorms follow a common pattern:
1. A rapid fall in pressure as the storm approaches
2. An abrupt rise in pressure with the onset of the first gust and arrival of rain showers
3. A gradual return to normal pressure as the storm passes and the rain ceases

JPATS AVIATION WEATHER BOOKLET
Version 3.2/Dec 08 5-3
Hail As a rule, the larger the storm, the more likely it is to produce hail. Hail has been encountered as high as 45,000 feet in completely clear air and may be carried 10 to 20 miles downwind from the storm core. Aircrews should anticipate possible hail with any thunderstorm, especially beneath the anvil of a large thunderstorm. Hailstones larger than ½ to ¾ of an inch (Figure 5-3) can cause significant aircraft damage in only a few seconds. Give yourself a clearance of at least 20 miles around a thunderstorm.
Figure 5-3 — Hailstones
Lightning and Electrostatic Discharge Lightning occurs at all levels in a thunderstorm. The majority of lightning bolts never strike the ground, but occur between clouds or within the same cloud. Lightning also occurs in the clear air around the tops, sides, and bottoms of storms. Aircrews flying several miles from a thunderstorm can still be struck by the proverbial “bolt out of the blue.” Lightning strikes can also occur in the anvil of a well-developed or dissipated thunderstorm. Additionally, lightning strikes in the anvil have occurred up to 3 hours after the thunderstorm has dissipated.
An electrostatic discharge (ESD) is similar to a lightning strike, but it is caused by the aircraft itself. The larger and faster the aircraft, the more particles it impacts, generating a greater static electricity charge on the airframe. The electrical field of the aircraft may interact with the cloud and an electrostatic discharge may then occur. Aircraft have reported damage from electrostatic discharges occurring in cirrus clouds downwind of previous thunderstorm activity, in cumulus clouds around a thunderstorm’s periphery, and even in stratiform clouds and light rain or showers. This release of static electricity is frequently called Saint Elmo’s fire.
Aircraft Lightning or ESD Encounters Lightning strikes and electrostatic discharges are the most reported weather related aviation incidents. All types of aircraft are susceptible to lightning strikes and electrostatic discharges. Aircraft have been struck by lightning or experienced electrostatic discharges at altitudes ranging from the surface to at least 43,000 feet.

JPATS AVIATION WEATHER BOOKLET
5-4 Version 3.2/Dec 08
Most lightning strikes occur when aircraft are operating in one or more of the following conditions:
1. Within 8° C of the freezing level
2. Within approximately 5000 feet of the freezing level
3. In precipitation, including snow
4. In clouds
5. In some turbulence
It should be noted that not all these conditions need to occur for a lightning strike or an electrostatic discharge to take place.
Figure 5-4 — Lightning Hazards Lightning strikes have varied effects on aircraft and aircrews (Figure 5-4). Usually the structural damage is minor, but it has the potential to be severe. Normally, it will only interrupt electrical circuits, causing damage to aircraft electrical systems, instruments, avionics, or radar.
Catastrophic fuel ignition can occur under certain conditions. In non-pressurized fuel tanks, a mixture of vaporized fuel and air fills the space above the liquid fuel. The proper ratio of fuel vapor to air can form a highly explosive mixture. For this reason, as well as for battle survivability, most military aircraft fuel tanks are pressurized.
Pilots are not immune to the effects of lightning strikes, either. Temporary night vision degradation can occur due to flash blinding, but this effect can be minimized by turning cockpit lighting to maximum intensity. Some pilots have also experienced mild electric shock and minor burns.
Tornadoes A tornado is a violent, intense, rotating column of air that descends from cumulonimbus clouds in funnel-like or tube-like shapes. If the circulation does not reach the surface, it is called a funnel cloud. If it touches down over the water, it is called a waterspout. A tornado vortex is normally several hundred yards wide, but some have been measured up to 2½ miles wide. Within the tornado’s funnel-shaped circulation, winds have been measured at speeds over 300 miles per hour, while the forward speed of tornadoes averages 30-40 knots.

JPATS AVIATION WEATHER BOOKLET
Version 3.2/Dec 08 5-5
Observed as appendages of the main cloud, tornadoes often form in groups or families of funnel clouds, some as far as 20 miles from the lightning and precipitation areas. Innocent looking cumulus clouds trailing a thunderstorm may mask tornadic activity, and the vortex may not be visible to warn unwary aircrews. The invisible vortices may be revealed only by swirls in the cloud base or dust whirls boiling along the ground, but may be strong enough to cause severe damage to aircraft.
Tornadoes form only with severe thunderstorms. The hazards they present have been chronicled often by news reports and television documentaries. To avoid tornadoes, avoid areas of severe thunderstorm activity.
MICROBURSTS A microburst is an intense, highly localized downward atmospheric flow with velocities of 2000 to over 6000 feet per minute. This downward flow diverges outward, producing a vortex ring of wind that can produce differential velocities ranging from 20 to 200 knots in an area only ¼ to 2½ miles in diameter (Figures 4-5 and 4-6). Microbursts may emanate from any convective cloud, not just cumulonimbus clouds. Another unique aspect of a microburst is its short life span–usually only 5 to 10 minutes after reaching the ground–which makes the study, and hence the prediction, of microbursts a difficult task.
Figure 5-5 — Vortex Ring of a Microburst
Figure 5-6 — Cross Section of a Microburst

JPATS AVIATION WEATHER BOOKLET
5-6 Version 3.2/Dec 08
The wind shear created by microbursts is extremely dangerous to aircraft during the takeoff, approach, and go-around phases of flight. Not all microbursts are associated with thunderstorms. Microbursts are possible with any rain shower, even if the rain isn’t reaching the ground (virga).
Figure 5-7 — Attitude Changes with Microburst Penetration In Figure 5-7, the aircraft at position 1 has entered a microburst. At this point, the crew may notice an increased angle of attack as the aircraft enters the upward flow of the vortex ring. Once inside the microburst, the aircraft will experience a strong increase in headwind, with a resulting increase in indicated airspeed and lift, which will cause the aircraft to pitch up (position 2). A natural reaction of the pilot would be to reduce power and apply nose down stick force. This would correct the situation if the aircraft was not in a microburst, and would appear to work here until the reaching position 3. At this point, the aircraft will be in a severe downdraft, and a transition from a strong headwind to a strong tailwind will occur (position 4). The resulting loss of indicated airspeed and lift will cause the aircraft to pitch down and lose altitude. At this point (or earlier), the correct reaction would be to add maximum power and establish a climbing attitude on the vertical gyro. Chances of successful recovery depend on reaction time, aircraft performance capabilities, and the altitude of the aircraft.
If you encounter a microburst on final approach or on takeoff, the results could be disastrous. The best course of action is to avoid microbursts at all costs. This point cannot be over emphasized. You must always be alert for the warning signs of a microburst. Remember–avoid, avoid, avoid. You may only get one chance to make a life or death decision.
Methods of Microburst Detection
Because microbursts are such a dangerous phenomenon, early detection is vital to mishap prevention. In most microburst accidents there have been warning signs that were ignored, misinterpreted, or misunderstood. You must evaluate the warning signs and make a decision quickly and decisively. Here are some very important clues that indicate the presence of microburst.
Ground-based Doppler radar now has the capability to accurately detect hazards that can take the form of microbursts, tornadoes, and other low-level wind shear activity. Therefore, when weather observations or recordings mention low-level wind shear, or call for gusty winds, heavy rain, or severe thunderstorms, be aware that the potential for microburst activity exists.

JPATS AVIATION WEATHER BOOKLET
Version 3.2/Dec 08 5-7
Visual cues are also very important in detecting microbursts. In fact, in many fatal wind shear mishaps the pilot continued the approach or takeoff in visible and known thunderstorm conditions. Visual cues include virga, localized blowing dust (especially in circular or elliptical patterns), rain shafts with rain diverging away from the core of the cell, roll clouds, and, of course, experiencing vivid lightning or tornado-like activity.
If you suspect the potential for wind shear conditions prior to take off or landing, get additional information from the tower or base weather station to include the latest radar report and pilot reports (PIREPs). Some airfields even have a wind shear warning system to help you. These sources will not identify every microburst situation, so if in doubt, wait it out! If you do encounter a wind shear condition, you must make a PIREP to warn fellow aviators about the dangerous situation. Your PIREP should include the location where the activity was encountered, an estimate of its magnitude and, most importantly, a description of what was experienced, such as turbulence, airspeed gain or loss, glidepath problems, etc.
Icing Expect severe icing in thunderstorms where the free-air temperature is at or below freezing. Since heavy rainfall and turbulence most frequently occur at the freezing level, this particular altitude appears to be the most hazardous. Most of the icing, however, occurs in the top ⅔ of the thunderstorm cell. Note that the actual altitude of the freezing level will fluctuate with the up and down drafts, and it will be lower in the area of downdrafts. Due to the heavy amounts of moisture and large water droplets, the icing in thunderstorms is mostly clear icing, accumulating rapidly on the airfoils and other aircraft surfaces. Other aspects of icing were covered in more detail in Chapter 4.
RADAR THUNDERSTORM INFORMATION Ground-based weather radar is the most accurate means of tracking thunderstorms. In addition to the locating and tracking of cumulonimbus cells, their intensities can also be determined. The large drops of water and hail, if present, within thunderstorms yield the strongest return signals. Smaller droplets result in dimmer areas on the scope and snow produces the faintest echo.
Detection and warnings are more accurate with the modern NEXRAD Doppler radar systems (Figure 5-8). This is particularly true for microbursts and wind shear alerts.

JPATS AVIATION WEATHER BOOKLET
5-8 Version 3.2/Dec 08
Figure 5-8 — NEXRAD Doppler Radar Composite
A direct relationship exists among the strength of the radar echoes, the presence of aircraft icing, and the intensity of turbulence. Stronger radar echoes are associated with more severe thunderstorms.
The following weather radar information is of particular interest to pilots:
1. A thunderstorm with radar echo tops indicated above 35,000 feet often contains extreme turbulence and hail.
2. Hazardous weather associated with scattered echoes can usually be circumnavigated. However, if the lines or areas are reported as broken or solid and are of moderate to strong intensity, hazardous weather can be avoided only if the aircraft is radar equipped.
3. Severe clear air turbulence and hail may be experienced between thunderstorms if the separation between echoes is less than 30 miles.
Ground-based weather radar is the most valuable to a pilot when there are numerous thunderstorms that are obscured by multiple cloud layers. However, echoes can change shape, character, and intensity in a matter of minutes when updrafts reach velocities of over 6000 feet per minute. Therefore, radar information received before takeoff may be worthless by the time thunderstorms are encountered.
A pilot with airborne weather radar should remember that radar does not eliminate the hazards of the thunderstorm. It merely helps to locate the most severe conditions. Since the radarscope indicates only precipitation areas within thunderstorms, hazards can be encountered even in soft spots. Thunderstorms having frequent, vivid lightning discharges are especially dangerous.
Airborne weather radar should be used as an avoidance rather than penetration tool. The pilot should take time to properly evaluate scope indications and watch for trends in order to avoid the most intense echo patterns. The pilot without airborne weather radar should make no attempt to find soft spots on the basis of any radar information that is not current up-to-the-minute.

JPATS AVIATION WEATHER BOOKLET
Version 3.2/Dec 08 5-9
FLIGHT TECHNIQUES IN THE VICINITY OF THUNDERSTORMS Since thunderstorms have so many potential hazards, it is appropriate to list some recommended practices for pilots who must cope with these “uninvited guests.” As far as flying is concerned, there is no such thing as a small thunderstorm, so some common sense recommendations are provided below:
1. If at all possible, avoid thunderstorms.
2. Do not venture closer than 20 miles to any storm cloud with overhanging anvils because of the possibility of encountering hail.
3. Do not attempt to fly under thunderstorms in mountainous regions even if the area on the other side of the mountains can be seen. Winds that are strong enough to provide the lifting action to produce the thunderstorms can also create extreme turbulence between mountain peaks.
4. If at all possible, avoid flying under thunderstorms because updrafts and downdrafts can exceed the performance of the aircraft.
5. Do not take off or land if a thunderstorm is approaching. Sudden wind shifts or microbursts can cause control problems.
6. Do not fly into a cloud mass containing scattered embedded thunderstorm without airborne radar. Radar is necessary to “see” storms in the cloud mass. Scattered thunderstorms can be circumnavigated visually unless they are embedded.
7. To avoid lightning do not penetrate a thunderstorm or fly through the cirrus anvil of a well-developed or dissipated thunderstorm. Aircraft should also avoid clouds downwind of thunderstorms.
8. The brighter and more frequent the lightning, the more severe the thunderstorm.
9. Regard any thunderstorm with tops 35,000 feet or higher as severe.
Thunderstorms should be avoided if at all possible using the following recommendations, listed in order of priority of choice:
1. Fly around (circumnavigate) the storm.
2. Fly over the top of the storm.
3. Fly under the storm.
If it is not possible to avoid the storm(s) then,
4. Fly through the lower ⅓ of the storm.
When thunderstorms are isolated, they are easily circumnavigated provided the surrounding area is clear of masking clouds. If lines of thunderstorms are present or if masking clouds obscure the area around the storm, other techniques must be employed.

JPATS AVIATION WEATHER BOOKLET
5-10 Version 3.2/Dec 08
Circumnavigation
Figure 5-9 — Around a Thunderstorm Circumnavigation presents no special flight problems. When the aircrew determines that circumnavigation is possible, they merely alter course to take them around the storm (Figure 5-9). Since most individual thunderstorm cells are about five to ten miles in diameter, detouring to one side or another would not appreciably add to either the time or distance of the flight. In case of a line of thunderstorms, it is sometimes possible to circumnavigate them by flying through thin spots of precipitation between the storms. Care should be exercised in this procedure because another thunderstorm may lie on the other side of a thin spot.
Over the Top
Figure 5-10 — Over the Top When circumnavigation of thunderstorms is not possible, the next best course of action is to go over the top (Figure 5-10). Realize that thunderstorms build to great heights, and that this procedure is restricted to aircraft with the capability and fuel to climb to these altitudes. Some turbulence may be encountered in the clear air above the cloud. In addition, hail can be thrown out the top of the cumulonimbus cloud. Thus, allow a margin of safety by choosing an altitude separation from the top of the thunderstorm of 1000 feet for every 10 knots of wind speed at the altitude of the tops. Oftentimes, aircraft cannot climb over the top of the cloud, but it will still be possible to fly over the saddlebacks between the build-ups.

JPATS AVIATION WEATHER BOOKLET
Version 3.2/Dec 08 5-11
Figure 5-11 — Under the Thunderstorm
Underneath If you are unable to circumnavigate the thunder-storms in your area and the ceiling capabilities of your aircraft will not permit an over-the-top flight, you should consider flying below the base of the cloud. The speed of downdrafts usually decreases closer to the surface (Unless a microburst is present!). Therefore, an altitude should be selected which will keep you as far away from the cloud base as possible and still enable you to maintain adequate terrain clearance. Here you can use the ⅓ rule which specifies selecting an altitude ⅓ the distance from the surface to the base of the cloud (Figure 5-11). This procedure is not recommended for areas of mountainous terrain. Below the storm, expect a low ceiling, poor visibility, and moderate turbulence. Perhaps the most dangerous threat to flight below a thunderstorm is the downburst, or microburst, which can be deadly to the unsuspecting pilot.
Penetration Mission urgency or fuel state dictates whether thunderstorm penetration is required when avoidance is not possible. The lower in the storm the penetration is made, the less the chance of encountering hail, structural icing, or being struck by lightning. Therefore, another version of the ⅓ rule applies: penetrate through the lower ⅓ of the storm, since most hazards are more severe in top ⅔ of the cell (Figure 5-12). However, with the strong updrafts and downdrafts, adequate terrain clearance should also be considered in the selection of a penetration level. When crossing a line of thunderstorms (a squall line for example), attempt to determine the orientation of the line and penetrate the line at right angles (Figure 5-13). During the penetration of a thunderstorm, do not attempt to turn back once you are inside the storm. Remember that single-cell thunderstorms are only about one to five miles in diameter, and turning around will only increase your time in the storm. Turning around can also result in a pilot becoming disoriented and flying in the storm for a considerably longer period of time than continuing directly through the storm in the first place. With no other information to make a decision, a penetration altitude between 4000 and 6000 feet AGL should be adequate.

JPATS AVIATION WEATHER BOOKLET
5-12 Version 3.2/Dec 08
Figure 5-12 — Through the Thunderstorm
Penetration Procedures
Figure 5-13 — Thunderstorm Penetration The faster a plane is going when it strikes an updraft or downdraft, the greater the shock. Refer to your flight manual for the recommended turbulent air penetration speed.
Once inside the storm, the pilot should let the plane ride out the updrafts and downdrafts and concentrate on maintaining a level attitude. With power set to maintain the proper airspeed, maintaining the same attitude will result in only minor airspeed variations. However, the aircraft’s altitude may vary by thousands of feet. The rapidly changing pressure conditions within the storm will result in unreliable indications and erratic variations in altitude, airspeed, and rate of climb instruments. Since the attitude gyro is independent of the pitot-static system, its indications should be considered reliable.
If thunderstorm penetration is unavoidable or you inadvertently fly into a thunderstorm, follow these procedures:
1. Secure all loose objects, tighten your lap belt and lock your shoulder harness. Turn cockpit lights up to highest intensity.

JPATS AVIATION WEATHER BOOKLET
Version 3.2/Dec 08 5-13
2. Turn on pitot heat. (Also turn on engine anti-ice, if the aircraft is so equipped. Neither the T-34 nor the T-6 has engine anti-ice.)
3. If able, plan your course to take you through the storm in minimum time, penetrating below the freezing level or above -20° C to avoid the most critical icing areas.
4. Establish the recommended turbulent air penetration speed and disengage the autopilot to minimize control inputs that could increase structural stresses.
5. Don’t chase the airspeed and minimize power changes. Expect significant deviations in attitude and altitude. Keep your eyes on your instruments.
6. Don’t turn back once in the thunderstorm.
Experience in severe weather flying is gained by necessity more often than by design and planning. Your first flight experience near a severe thunderstorm will make the dangers listed in this chapter all too real. No pilot should knowingly fly into severe weather if the mission does not demand it. In making a “go/no-go” decision, consider that it is better to arrive at the destination late than not at all.

JPATS AVIATION WEATHER BOOKLET
5-14 Version 3.2/Dec 08
THUNDERSTORM REVIEW QUESTIONS
1. The atmospheric conditions necessary for the formation of a thunderstorm include a combination of ______.
a. stable air or relatively low humidity and some type of lifting action
b. stable air of relatively high humidity and some type of subsiding action
c. unstable air of relatively low humidity and some type of subsiding action
d. unstable air of relatively high humidity and some type of lifting action.
2. Which one of the following hazards to flight are associated with thunderstorms?
a. Hail, turbulence, and lightning
b. Hail, icing, and microbursts
c. Hail, turbulence, and icing
d. All of the above are correct
3. Which one of the following is an indication of turbulence found in thunderstorms?
a. Rotor clouds
b. The gust front
c. Orographic lifting
d. Severe icing
4. Which one of the following type clouds could indicate the possibility of microburst activity?
a. Convective only
b. Cumulonimbus only
c. Both a and b
d. Nimbostratus
5. Which one of the following telltale signs in the vicinity of thunderstorms should alert you to the possibility of microburst activity?
a. Roll clouds
b. Blowing dust
c. Gusty conditions
d. All of the above

JPATS AVIATION WEATHER BOOKLET
Version 3.2/Dec 08 5-15
6. Which one of the following is/are correct concerning thunderstorm recommended flight techniques?
a. Penetration of a thunderstorm should be at an altitude of 4000 to 6000 feet AGL.
b. When flying under a thunderstorm, select an altitude 1/3 the distance from the surface to the base of the cloud
c. Both a and b above are correct
d. Neither a or b above are correct
7. When flying through a thunderstorm a pilot should concentrate on maintaining a level attitude.
a. True
b. False

JPATS AVIATION WEATHER BOOKLET
5-16 Version 3.2/Dec 08
This page intentionally left blank

JPATS AVIATION WEATHER BOOKLET
Version 3.2/Dec 08 6-1
JX106 - METARS AND TAFS
INTRODUCTION The Aviation Routine Weather Report (METAR) and the Terminal Aerodrome Forecast (TAF) are the most widely used methods of disseminating weather observations and forecasts (respectively) to aircrew. They are also the quickest means, as well, because they contain only letters and numbers. Years ago, when Teletype was the quickest means of information dissemination, METARs and TAFs were distributed across the country and overseas by this method, as well. Today, even though electronic communication is an important part of the existing military and civilian weather networks, the same basic character set is used, and these reports are still often called “teletype” products.
The METAR and TAF formats have not changed greatly over recent years, except to conform better to international standards. Thus, these formats contain certain codes, which–while they may be cumbersome at first–provide users with precise weather information because of their clear and exact nature.
Once the interpretation of a METAR has been discussed, the TAF format should then be easier to understand, since they use similar data groups. The TAF, however, is usually longer since it is a forecast covering a greater period of time. As such, the TAF format has additional rules that must be understood before an aviator can apply the forecast information to a particular situation. Following the discussion of these topics, this chapter will point out the major differences between the military TAF and its civilian and international counterparts. Finally, this chapter will demonstrate how to apply this knowledge to various flight planning situations.
REFERENCES AFH 11-203, Weather for Aircrews, Volume 2
DoD Flight Information Publication (FLIP) General Planning, Chapter 8
THE AVIATION ROUTINE WEATHER REPORT (METAR) Aviation Routine Weather Reports (METAR) provide a rapid and efficient means of transmitting the latest observed weather information for various stations throughout the world. These reports are transmitted over available computer/teletype circuits.
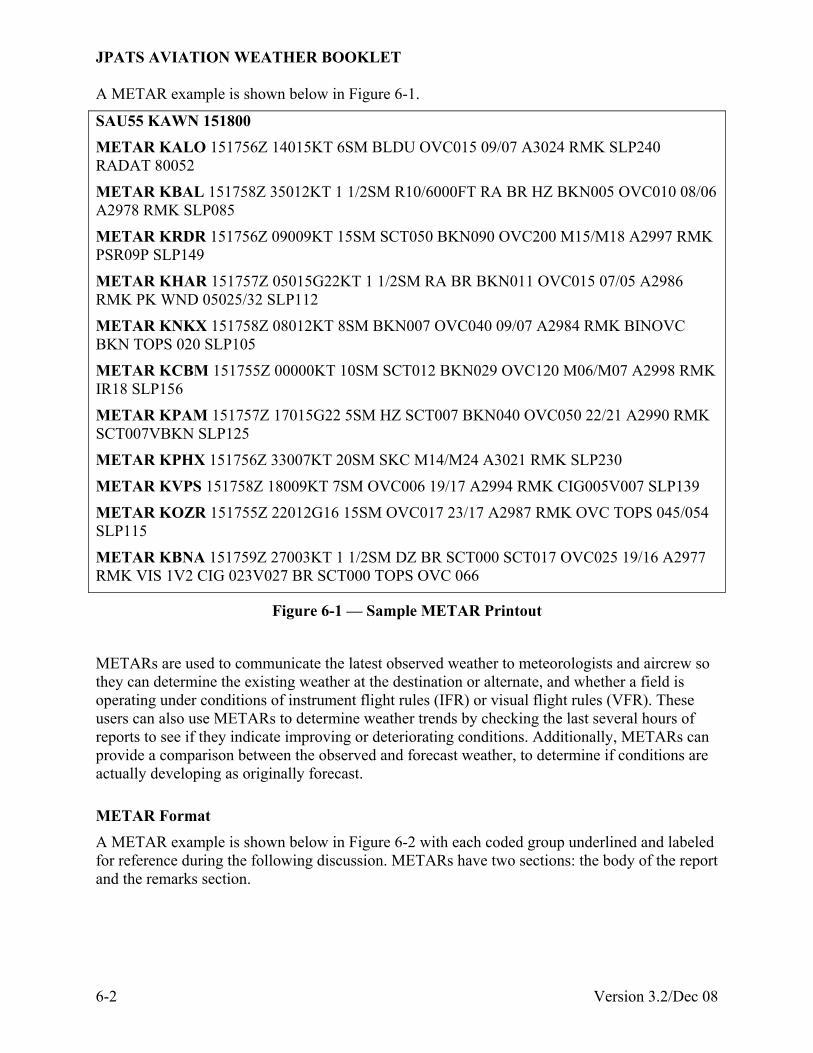
JPATS AVIATION WEATHER BOOKLET
6-2 Version 3.2/Dec 08
A METAR example is shown below in Figure 6-1.
SAU55 KAWN 151800 METAR KALO 151756Z 14015KT 6SM BLDU OVC015 09/07 A3024 RMK SLP240 RADAT 80052
METAR KBAL 151758Z 35012KT 1 1/2SM R10/6000FT RA BR HZ BKN005 OVC010 08/06 A2978 RMK SLP085
METAR KRDR 151756Z 09009KT 15SM SCT050 BKN090 OVC200 M15/M18 A2997 RMK PSR09P SLP149
METAR KHAR 151757Z 05015G22KT 1 1/2SM RA BR BKN011 OVC015 07/05 A2986 RMK PK WND 05025/32 SLP112
METAR KNKX 151758Z 08012KT 8SM BKN007 OVC040 09/07 A2984 RMK BINOVC BKN TOPS 020 SLP105
METAR KCBM 151755Z 00000KT 10SM SCT012 BKN029 OVC120 M06/M07 A2998 RMK IR18 SLP156
METAR KPAM 151757Z 17015G22 5SM HZ SCT007 BKN040 OVC050 22/21 A2990 RMK SCT007VBKN SLP125
METAR KPHX 151756Z 33007KT 20SM SKC M14/M24 A3021 RMK SLP230
METAR KVPS 151758Z 18009KT 7SM OVC006 19/17 A2994 RMK CIG005V007 SLP139
METAR KOZR 151755Z 22012G16 15SM OVC017 23/17 A2987 RMK OVC TOPS 045/054 SLP115
METAR KBNA 151759Z 27003KT 1 1/2SM DZ BR SCT000 SCT017 OVC025 19/16 A2977 RMK VIS 1V2 CIG 023V027 BR SCT000 TOPS OVC 066
Figure 6-1 — Sample METAR Printout
METARs are used to communicate the latest observed weather to meteorologists and aircrew so they can determine the existing weather at the destination or alternate, and whether a field is operating under conditions of instrument flight rules (IFR) or visual flight rules (VFR). These users can also use METARs to determine weather trends by checking the last several hours of reports to see if they indicate improving or deteriorating conditions. Additionally, METARs can provide a comparison between the observed and forecast weather, to determine if conditions are actually developing as originally forecast.
METAR Format A METAR example is shown below in Figure 6-2 with each coded group underlined and labeled for reference during the following discussion. METARs have two sections: the body of the report and the remarks section.

JPATS AVIATION WEATHER BOOKLET
Version 3.2/Dec 08 6-3
The first word of the report line, either “METAR” or “SPECI,” will indicate which of these two main types of observations was reported (Figure 6-3).
METAR — An hourly routine scheduled observation–containing wind, visibility, runway visual range, present weather, sky condition, temperature/dew point, and altimeter setting–constitutes the body of the report. Additional coded data or plain language information that elaborates on the report may be included in the “Remarks” section.
SPECI — A SPECIal, unscheduled observation containing all the data elements found in a METAR whenever critical data have changed from the previous observation (reasons are too numerous to cover in this course). All SPECI are made as soon as possible after the element criteria are observed.
Figure 6-2 — METAR Code Groups
METAR KNPA 082255Z 27004KT 7/8SM R04/4500FT DZ FG SCT000 BKN011 OVC380 19/18 A2997 RMK VIS1/2V1 CIG009V013 FG SCT000 BKN TOPS 027 SLP149
SPECI KNPA 082317Z 31020G30KT 3/8SM R04/2500FT VCTS SCT000 BKN006 OVC380 17/17 A2993 RMK VIS1/8V1 CIG004V008 FG SCT000 BKN TOPS 350 SLP136
Figure 6-3 — Type of Report: METAR or SPECI
The METAR code format uses a 4-letter ICAO (International Civil Aviation Organization) identifier. In the continental U. S., all 3-letter identifiers are prefixed with a “K,” e.g., KLAX for Los Angeles, and KBOS for Boston (Figure 6-4). Elsewhere, the first two letters of the ICAO identifier indicate what region of the world (e.g. K=USA, C=Canada, P=Pacific, E=Europe) and country the station is located. For example, PAFA is Fairbanks, Alaska, PHNA is Barber’s Point, Hawaii, and CYUL is Montreal, Canada. Also, EG indicates a station in England, and LI indicates a station in Italy. For a complete worldwide listing of all the identifiers, one must refer to the ICAO Document 7910 Location Identifiers.
Group 1: Type Of Report
Group 2: Station Identifiers

JPATS AVIATION WEATHER BOOKLET
6-4 Version 3.2/Dec 08
METAR KNPA 082255Z 27004KT 7/8SM R04/4500FT DZ FG SCT000 BKN011 OVC380 19/18 A2997 RMK VIS1/2V1 CIG009V013 FG SCT000 BKN TOPS 027 SLP149
Figure 6-4 — Station Identifier in METAR
The time of observation will be included in all reports, using the standard date time group (DTG) format. Times are always given in Universal Coordinated Time (UTC) and therefore will end in “Z,” indicating Zulu, or UTC, time. The first two numbers are the date, and the second four are the time of the report (Figure 6-5).
METAR KNPA 082255Z 27004KT 7/8SM R04/4500FT DZ FG SCT000 BKN011 OVC380 19/18 A2997 RMK VIS1/2V1 CIG009V013 FG SCT000 BKN TOPS 027 SLP149
Figure 6-5 — DTG in METAR Manual METAR observations are required to be started no earlier than 15 minutes prior to the reporting time, which is a window between 55 and 59 minutes past the hour. Additionally, elements having the greatest rate of change are evaluated last. At automated stations, evaluations are based on sensor data taken within 10 minutes of the report time (although sky cover data is gathered over the preceding 30 minutes). Therefore, as an aviator, you can be assured you have the most up-to-date information available, assuming you’re checking the weather at the top of the hour.
Of course, report times given for SPECI observations are the time at which the event requiring the SPECI report occurred.
Reports may also contain one of two modifiers, “COR,” or “AUTO,” which will appear after the DTG:
COR — Indicates a CORrected report, which is transmitted as soon as possible whenever an error is detected in a METAR or SPECI report. In this case, the DTG will be the same time used in the report being corrected.
AUTO — Indicates a routine scheduled observation was sent from a fully AUTOmated station with no human intervention. In the remarks section, either “AO1” or “AO2” will be present indicating the type of automatic precipitation measuring equipment. Sometimes, manual observations are reported using data gathered from automatic devices, in which case an “AO1” or “AO2” will be present in the remarks without an “AUTO” following the DTG.
Winds are a 2-minute average speed and direction report in knots and degrees true from which direction the wind is blowing. The wind direction is first and will be in tens of degrees, using three digits. Directions less than 100 degrees are preceded by a zero to supply three digits. Speed is in whole knots, using two or three digits after the direction, without spaces, and speeds of less than 10 knots are preceded with a zero. The wind group will always end with the letters “KT” to indicate knots. Other countries may use different units of measurement, such as KM (kilometers), MPH (miles per hour), or MPS (meters per second) (Figure 6-6).
Group 3: Date Time Group and Report Modifier
Group 4: Wind
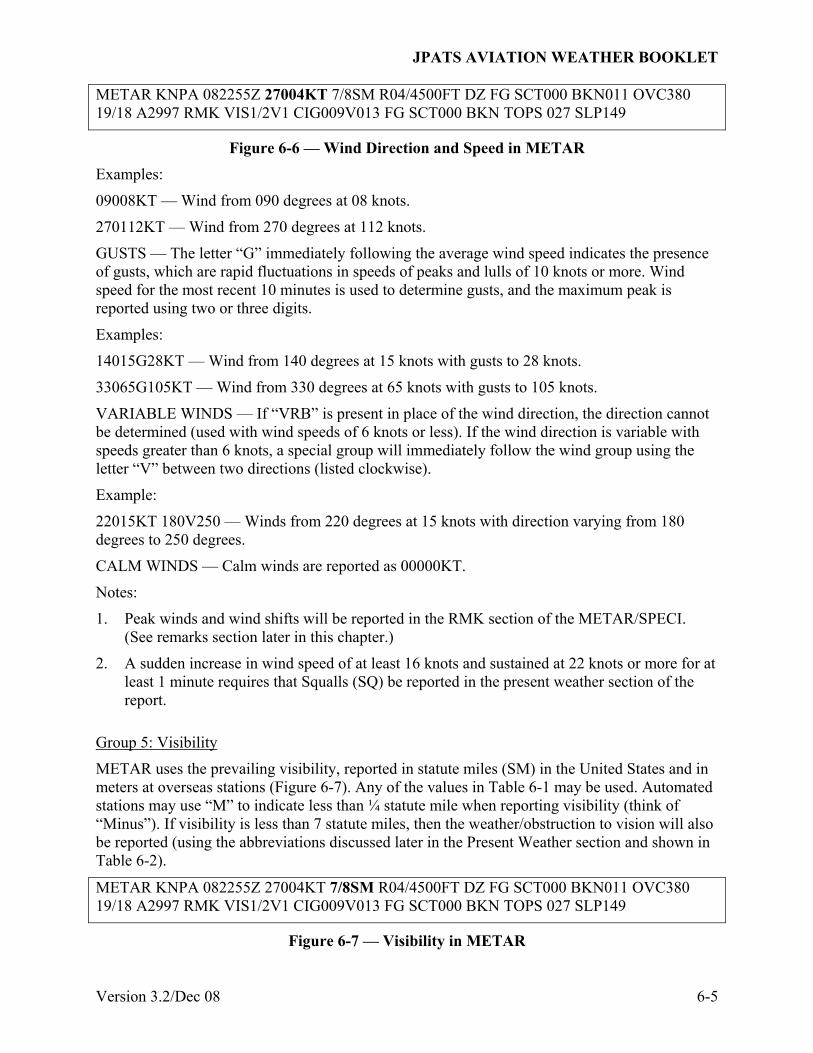
JPATS AVIATION WEATHER BOOKLET
Version 3.2/Dec 08 6-5
METAR KNPA 082255Z 27004KT 7/8SM R04/4500FT DZ FG SCT000 BKN011 OVC380 19/18 A2997 RMK VIS1/2V1 CIG009V013 FG SCT000 BKN TOPS 027 SLP149
Figure 6-6 — Wind Direction and Speed in METAR Examples:
09008KT — Wind from 090 degrees at 08 knots.
270112KT — Wind from 270 degrees at 112 knots.
GUSTS — The letter “G” immediately following the average wind speed indicates the presence of gusts, which are rapid fluctuations in speeds of peaks and lulls of 10 knots or more. Wind speed for the most recent 10 minutes is used to determine gusts, and the maximum peak is reported using two or three digits.
Examples:
14015G28KT — Wind from 140 degrees at 15 knots with gusts to 28 knots.
33065G105KT — Wind from 330 degrees at 65 knots with gusts to 105 knots.
VARIABLE WINDS — If “VRB” is present in place of the wind direction, the direction cannot be determined (used with wind speeds of 6 knots or less). If the wind direction is variable with speeds greater than 6 knots, a special group will immediately follow the wind group using the letter “V” between two directions (listed clockwise).
Example:
22015KT 180V250 — Winds from 220 degrees at 15 knots with direction varying from 180 degrees to 250 degrees.
CALM WINDS — Calm winds are reported as 00000KT.
Notes:
1. Peak winds and wind shifts will be reported in the RMK section of the METAR/SPECI. (See remarks section later in this chapter.)
2. A sudden increase in wind speed of at least 16 knots and sustained at 22 knots or more for at least 1 minute requires that Squalls (SQ) be reported in the present weather section of the report.
METAR uses the prevailing visibility, reported in statute miles (SM) in the United States and in meters at overseas stations (Figure 6-7). Any of the values in Table 6-1 may be used. Automated stations may use “M” to indicate less than ¼ statute mile when reporting visibility (think of “Minus”). If visibility is less than 7 statute miles, then the weather/obstruction to vision will also be reported (using the abbreviations discussed later in the Present Weather section and shown in Table 6-2).
METAR KNPA 082255Z 27004KT 7/8SM R04/4500FT DZ FG SCT000 BKN011 OVC380 19/18 A2997 RMK VIS1/2V1 CIG009V013 FG SCT000 BKN TOPS 027 SLP149
Figure 6-7 — Visibility in METAR
Group 5: Visibility
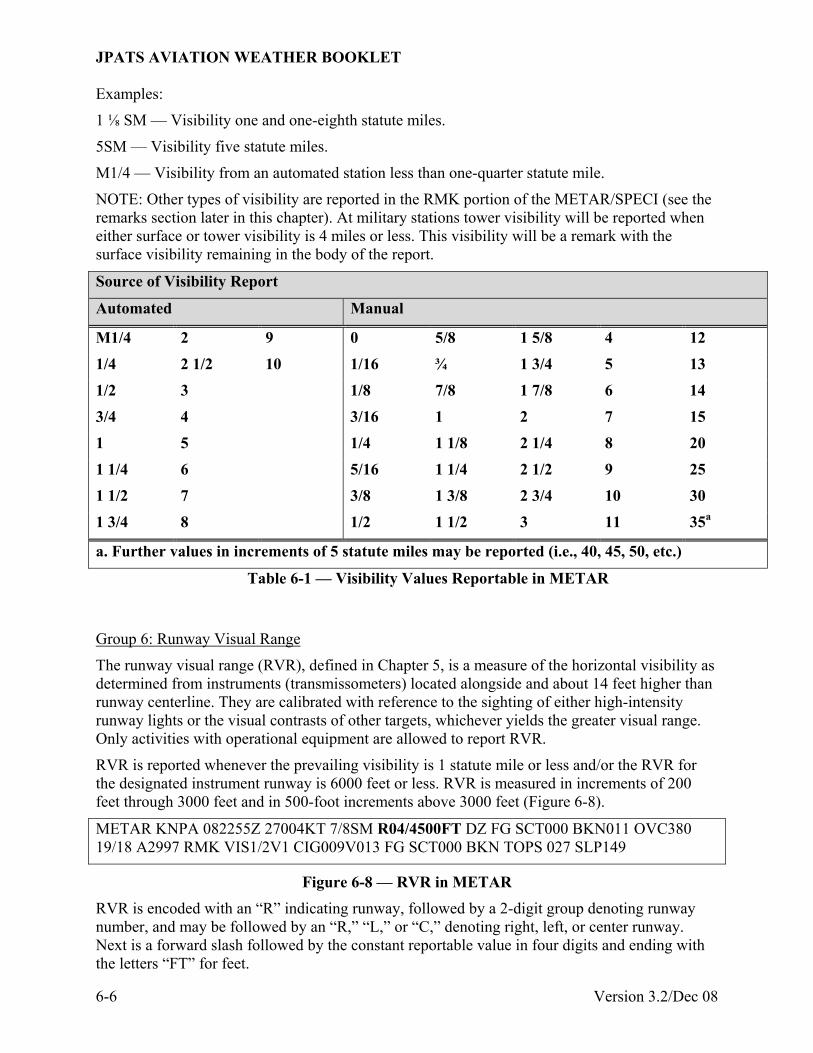
JPATS AVIATION WEATHER BOOKLET
6-6 Version 3.2/Dec 08
Examples:
1 ⅛ SM — Visibility one and one-eighth statute miles.
5SM — Visibility five statute miles.
M1/4 — Visibility from an automated station less than one-quarter statute mile.
NOTE: Other types of visibility are reported in the RMK portion of the METAR/SPECI (see the remarks section later in this chapter). At military stations tower visibility will be reported when either surface or tower visibility is 4 miles or less. This visibility will be a remark with the surface visibility remaining in the body of the report.
Source of Visibility Report
Automated Manual
M1/4 2 9 0 5/8 1 5/8 4 12
1/4 2 1/2 10 1/16 ¾ 1 3/4 5 13
1/2 3 1/8 7/8 1 7/8 6 14
3/4 4 3/16 1 2 7 15
1 5 1/4 1 1/8 2 1/4 8 20
1 1/4 6 5/16 1 1/4 2 1/2 9 25
1 1/2 7 3/8 1 3/8 2 3/4 10 30
1 3/4 8 1/2 1 1/2 3 11 35a
a. Further values in increments of 5 statute miles may be reported (i.e., 40, 45, 50, etc.)
Table 6-1 — Visibility Values Reportable in METAR
The runway visual range (RVR), defined in Chapter 5, is a measure of the horizontal visibility as determined from instruments (transmissometers) located alongside and about 14 feet higher than runway centerline. They are calibrated with reference to the sighting of either high-intensity runway lights or the visual contrasts of other targets, whichever yields the greater visual range. Only activities with operational equipment are allowed to report RVR.
RVR is reported whenever the prevailing visibility is 1 statute mile or less and/or the RVR for the designated instrument runway is 6000 feet or less. RVR is measured in increments of 200 feet through 3000 feet and in 500-foot increments above 3000 feet (Figure 6-8).
METAR KNPA 082255Z 27004KT 7/8SM R04/4500FT DZ FG SCT000 BKN011 OVC380 19/18 A2997 RMK VIS1/2V1 CIG009V013 FG SCT000 BKN TOPS 027 SLP149
Figure 6-8 — RVR in METAR RVR is encoded with an “R” indicating runway, followed by a 2-digit group denoting runway number, and may be followed by an “R,” “L,” or “C,” denoting right, left, or center runway. Next is a forward slash followed by the constant reportable value in four digits and ending with the letters “FT” for feet.
Group 6: Runway Visual Range

JPATS AVIATION WEATHER BOOKLET
Version 3.2/Dec 08 6-7
If RVR is varying, the coding will be the same as above, except the two reportable values will be separated by a “V.” If RVR is less than its lowest reportable value, the 4-digit value will be preceded with an “M” (for Minus), and if greater than the highest reportable value, it is preceded with a “P” (for Plus).
Examples:
R33/1800FT — Runway 33 visual range 1800 feet.
R17R/3500FT — Runway 17 Right visual range 3500 feet.
R09/1000V4000FT — Runway 09 visual range 1000 feet variable to 4,000 feet.
R28L/P6000FT — Runway 28 Left visual range greater than 6000 feet.
R02/M0800FT — Runway 02 visual range less than 800 feet.
NOTE: Runway visual range is not reported from USN/USMC stations. It will, however, be disseminated locally to arriving and departing aircraft.
Present weather includes precipitation, well-developed dust or sand swirls, squalls, tornadic activity, sandstorms, and duststorms. It may be evaluated instrumentally, manually, or through a combination of methods. The codes used for present weather as seen below in Figure 6-9 and Table 6-2 are used throughout meteorology.
METAR KNPA 082255Z 27004KT 7/8SM R04/4500FT DZ FG SCT000 BKN011 OVC380 19/18 A2997 RMK VIS1/2V1 CIG009V013 FG SCT000 BKN TOPS 027 SLP149
Figure 6-9 — Present Weather in METAR In addition to the notes of Table 6-2, the following are a few of the conventions used to report present weather conditions in METAR/SPECI observations.
A. Present weather given in the body of the report occurs at the point of observation or within 5 miles from the station. If the letters “VC” are used, the weather is in the vicinity of 5-10 miles. Any reported weather occurring beyond 10 miles of the point of observation will be included in the remarks portion of the METAR.
B. Intensity refers to the precipitation, not its descriptor (TS or SH).
C. TS may be coded by itself, or it may be coded with RA, SN, PL, GS, or GR.
Group 7: Present Weather

JPATS AVIATION WEATHER BOOKLET
6-8 Version 3.2/Dec 08
QUALIFIER WEATHER PHENOMENA1
INTENSITY OR PROXIMITY
1
DESCRIPTOR
2
PRECIPITATION
3
OBSCURATION
4
OTHER
5
– Light
Moderate2
+ Heavy
VC In the Vicinity
MI Shallow
PR Partial
BC Patches
DR Low Drifting
BL Blowing
SH Shower(s) TS Thunder-storm
FZ Freezing
DZ Drizzle
RA Rain
SN Snow SG Snow Grains
IC Ice Crystals2
PL Ice Pellets
GR Hail2
GS Small Hail and/or Snow Pellets
UP Unknown Precipitation
BR Mist
FG Fog
FU Smoke VA Volcanic Ash
DU Widespread Dust
SA Sand
HZ Haze
PY Spray
PO Well-Developed Dust/ Sand Whirls
SQ Squalls
FC Funnel Cloud(s) (Tornado or Waterspout)3
SS Sandstorm
DS Duststorm
1. Weather groups are constructed by considering columns 1 to 5 above in sequence, i.e., intensity, followed by description, followed by weather phenomena (e.g., heavy rain shower(s) is coded as +SHRA).
2. No symbol denotes moderate intensity. No intensity is assigned to Hail (GR) or Icing (IC).
3. Tornadoes and waterspouts in contact with the surface are coded +FC.
Table 6-2 — Present Weather Codes Reportable in METAR
METAR KNPA 082255Z 27004KT 7/8SM R04/4500FT DZ FG SCT000 BKN011 OVC380 19/18 A2997 RMK VIS1/2V1 CIG009V013 FG SCT000 BKN TOPS 027 SLP149
Figure 6-10 — Sky Condition in METAR The sky condition group (Figure 6-10) gives a description of the appearance of the sky including the type of clouds, cloud layers, amount of sky coverage, height of their bases, and any obscuring phenomena. Cloud layer amounts for each layer indicate eighths of the sky that is covered, according to the abbreviations in Table 6-3, which is the same as Table 5-3.
Group 8: Sky Condition

JPATS AVIATION WEATHER BOOKLET
Version 3.2/Dec 08 6-9
Reportable
Contractions Meaning
Amount of
Sky Cover
SKC or CLR1 Sky Clear 0/8
FEW2 Few > 0/8 - 2/8
SCT Scattered 3/8 - 4/8
BKN Broken 5/8 - 7/8
OVC Overcast 8/8
VV Obscured3 8/8 (surface based)
1. The abbreviation CLR is used at automated stations when no clouds at or below 12,000 feet are reported; the abbreviation SKC is used at manual stations when no clouds are reported.
2. Any amount less than ⅛ is reported as FEW.
3. The last 3 digits report the height of the vertical visibility into an indefinite ceiling.
Table 6-3 — Sky Coverage
In addition to the notes of Table 6-3, the following are some of the cloud reporting rules that are used in METAR/SPECI.
A. All sky cover heights are reported in feet above the ground level (AGL).
B. Sky condition is annotated by a 6-digit group, the first 3 digits (letters) describing the amount of sky cover (from Table 6-3), and the second 3 digits (numbers) the height of that layer in hundreds of feet. Layers will be reported in ascending order up to the first overcast. If the cloud layer is below the station (for mountain stations), the height will be coded as ///.
C. When the sky is totally obscured by a surface-based obscuration the only group in the sky condition section will be a 5-digit group, the first 2 digits VV (Vertical Visibility) and the last 3 digits the height of the vertical visibility into the indefinite ceiling. Most always this height will be 000, as any surface-based phenomenon is (by definition of “surface-based”) within 50 feet of the surface, and will be rounded down to the nearest hundred feet (i.e., zero).
D. When the sky is partially obscured by a surface-based obscuration, the amount of the sky cover hidden by the weather phenomena will be reported as FEW000, SCT000, or BKN000. A remark will then also be given to describe these details (see Remarks section).
E. At manual stations CB (cumulonimbus) or TCU (towering cumulus) will be appended to the layer if it can be determined.
Examples:
BKN000 — Partial obscuration of ⅝ to ⅞ (surface-based).
VV008 — Sky obscured, indefinite ceiling, vertical visibility 800 feet AGL.
SCT020CB — Scattered clouds (3/8 to 4/8 of the sky) at 2000 feet AGL composed of cumulonimbus clouds.

JPATS AVIATION WEATHER BOOKLET
6-10 Version 3.2/Dec 08
FEW011 BKN040 OVC120 — Few clouds (1/8 to 2/8) at 1100 feet AGL, broken clouds (5/8 to 7/8) at 4000 AGL, overcast clouds (8/8) at 12,000 feet AGL.
Temperature and dew point are reported as two 2-digit groups, rounded to the nearest whole degree Celsius, and separated with a (/) (Figure 6-11). Sub-zero temperatures or dew points will be prefixed with the letter “M” (for Minus). If the temperature and dew point are not available, the entire group is omitted. If only dew point is unavailable, then only temperature is coded, followed by the (/).
METAR KNPA 082255Z 27004KT 7/8SM R04/4500FT DZ FG SCT000 BKN011 OVC380 19/18 A2997 RMK VIS1/2V1 CIG009V013 FG SCT000 BKN TOPS 027 SLP149
Figure 6-11 — Temperature and Dew Point in METAR If necessary, convert between Fahrenheit and Celsius using the following formulas:
F = (C * 9/5) +32 C = (F - 32) * 5/9 (9/5 = 1.8)
or by using the conversion scale on the CR-2 circular slide rule.
The altimeter setting will be included in all reports. The altimeter group always starts with the letter “A”, and will be followed with a 4-digit group using the tens, units, tenths, and hundredths of inches of mercury. For example, A2992 indicates an altimeter setting of 29.92 inches of Hg (Figure 6-12).
METAR KNPA 082255Z 27004KT 7/8SM R04/4500FT DZ FG SCT000 BKN011 OVC380 19/18 A2997 RMK VIS1/2V1 CIG009V013 FG SCT000 BKN TOPS 027 SLP149
Figure 6-12 — Altimeter Setting in METAR
Remarks will be included in all METAR/SPECI reports if deemed appropriate. They will be separated from the body of the report by a space and the abbreviation RMK. If there are no remarks, then “RMK” is omitted (Figure 6-13). The remarks fall into three major categories, (1) Manual and Automated remarks, (2) Plain language remarks, and (3) Additive data and Maintenance remarks. Only the first two will be discussed in this chapter, as the last is of very little importance to an aviator.
METAR KNPA 082255Z 27004KT 7/8SM R04/4500FT DZ FG SCT000 BKN011 OVC380 19/18 A2997 RMK VIS1/2V1 CIG009V013 FG SCT000 BKN TOPS 027 SLP149
Figure 6-13 — Remarks Section of METAR Remarks are made in accordance with the following conventions.
A. Where plain language is called for, authorized abbreviations and symbols are used to conserve time and space.
Group 9: Temperature/Dew Point
Group 10: Altimeter Setting
Remarks Section
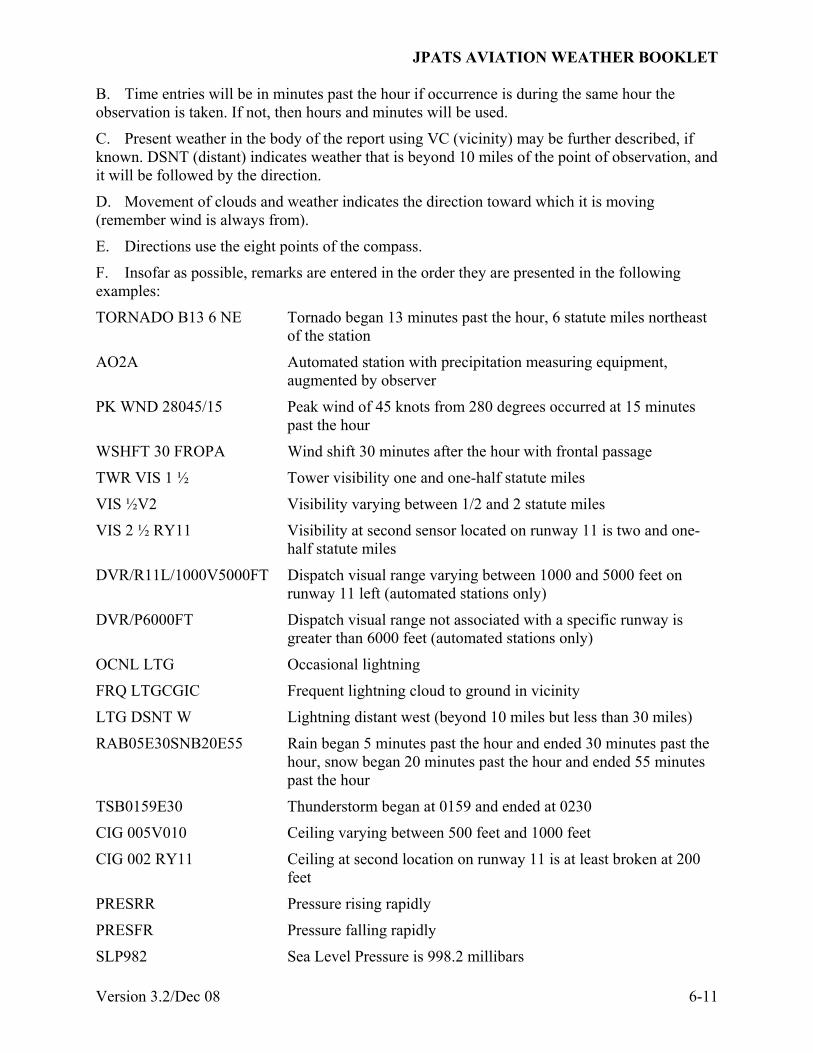
JPATS AVIATION WEATHER BOOKLET
Version 3.2/Dec 08 6-11
B. Time entries will be in minutes past the hour if occurrence is during the same hour the observation is taken. If not, then hours and minutes will be used.
C. Present weather in the body of the report using VC (vicinity) may be further described, if known. DSNT (distant) indicates weather that is beyond 10 miles of the point of observation, and it will be followed by the direction.
D. Movement of clouds and weather indicates the direction toward which it is moving (remember wind is always from).
E. Directions use the eight points of the compass.
F. Insofar as possible, remarks are entered in the order they are presented in the following examples:
TORNADO B13 6 NE Tornado began 13 minutes past the hour, 6 statute miles northeast of the station
AO2A Automated station with precipitation measuring equipment, augmented by observer
PK WND 28045/15 Peak wind of 45 knots from 280 degrees occurred at 15 minutes past the hour
WSHFT 30 FROPA Wind shift 30 minutes after the hour with frontal passage
TWR VIS 1 ½ Tower visibility one and one-half statute miles
VIS ½V2 Visibility varying between 1/2 and 2 statute miles
VIS 2 ½ RY11 Visibility at second sensor located on runway 11 is two and one-half statute miles
DVR/R11L/1000V5000FT Dispatch visual range varying between 1000 and 5000 feet on runway 11 left (automated stations only)
DVR/P6000FT Dispatch visual range not associated with a specific runway is greater than 6000 feet (automated stations only)
OCNL LTG Occasional lightning
FRQ LTGCGIC Frequent lightning cloud to ground in vicinity
LTG DSNT W Lightning distant west (beyond 10 miles but less than 30 miles)
RAB05E30SNB20E55 Rain began 5 minutes past the hour and ended 30 minutes past the hour, snow began 20 minutes past the hour and ended 55 minutes past the hour
TSB0159E30 Thunderstorm began at 0159 and ended at 0230
CIG 005V010 Ceiling varying between 500 feet and 1000 feet
CIG 002 RY11 Ceiling at second location on runway 11 is at least broken at 200 feet
PRESRR Pressure rising rapidly
PRESFR Pressure falling rapidly
SLP982 Sea Level Pressure is 998.2 millibars

JPATS AVIATION WEATHER BOOKLET
6-12 Version 3.2/Dec 08
SLPNO Sea Level Pressure not available
VIS NE 2 ½ Visibility northeast two and one-half statute miles
TS SE MOV NE Thunderstorm southeast moving northeast
GR 1 1/4 Hailstones one and one-quarter inch
VIRGA SW Precipitation southwest not reaching the ground
FG SCT000 Fog partially obscures 3/8 to 4/8 of the sky
BKN014 V OVC Broken clouds at 1400 feet are variable to overcast
CB W MOV E Cumulonimbus clouds west moving east
CBMAM E MOV S Cumulonimbus mammatus clouds east moving south
TCU W Towering cumulus clouds west
TOP OVC050 Tops of overcast are 5000 feet MSL.
ACC NW Altocumulus castellanus northwest (indicates turbulence)
ACSL SW-W Altocumulus standing lenticular clouds southwest through west (indicates mountain wave turbulence)
APRNT ROTOR CLD NE Apparent rotor cloud northeast (also indicates mountain wave turbulence)
CCL S Cirrocumulus standing lenticularis south
FU BKN020 Smoke layer broken at 2000 feet
ACRFT MSHP Aircraft mishap
Runway Condition Reporting (RSC & RCR) — Runway condition, when reported, will include two parts, the RSC (runway surface condition), and the RCR (runway condition reading) as determined by the airfield manager or operations officer. The following RSCs describe the runway condition:
WR Wet runway
SLR Slush on the runway
LSR Loose snow on the runway
PSR Packed snow on the runway
IR Ice on the runway
RCRNR Base Operations closed
The RCR is a 2-digit number giving an average decelerometer reading from 02 to 25 (Table 6-4). Two slants (//) will be entered when the runway is wet, slush-covered, or when no decelerometer reading is available.
Special Remarks That May be Appended to the Remarks Section

JPATS AVIATION WEATHER BOOKLET
Version 3.2/Dec 08 6-13
Runway Braking
Action Reading
Equivalent
Terminology
% Increase in
Landing Roll
02 to 05 NIL 100% or more
06 to 12 POOR 99% to 46%
13 to 18 FAIR (MEDIUM) 45% to 16%
19 to 25 GOOD 15% to 0%
Table 6-4 — RCR Values and Corresponding Braking Action
The following will be added to the report when applicable:
“P” is appended to the RCR when there are patches of ice, snow, or slush on the runway.
“SANDED” is appended when runways have been treated with sand or other friction enhancing materials.
“P WET” or “P DRY” is appended whenever the rest of the runway is either wet or dry.
ICAO braking action remarks (such as BA GOOD, BA NIL) may be reported at airfields not equipped with decelerometers when required.
Examples:
PSR15 Packed snow on runway, RCR value 15
IR// Ice on runway, no RCR value available
LSR08P DRY Loose snow on runway, RCR value 08 patchy, rest of runway dry
WR// Wet runway
RCRNR Base Operations closed
PSR12 HFS IR08 Packed snow on runway, RCR value 12 on touchdown, on rollout portion of a high friction surface with ice on runway, RCR value 08
PSR// SANDED BA MEDIUM Packed snow on runway, no RCR available, runway treated with friction enhancer, braking action medium
Freezing Level Data (RADATS) — Information beginning with the contraction RADAT gives freezing level data. (Think of RAdiosonde DATa. A radiosonde is a weather balloon.) RADAT is followed by the relative humidity (RH) at the freezing level and the height of the freezing level in hundreds of feet MSL. When multiple crossings are reported, the order will be the lowest crossing first, followed by the intermediate crossing with the highest RH, then the highest crossing. A letter “L” or “H” after the RH value will indicate to which altitude the RH corresponds. A single slash after these altitudes indicates that more than three crossings occur, and the number of additional crossings is noted after the slash. When a “00” appears for the RH, this indicates an RH of 100%. If “20” is coded, this indicates that the RH is the lowest that can be obtained. Two slashes, “//”, indicate RH data is missing.

JPATS AVIATION WEATHER BOOKLET
6-14 Version 3.2/Dec 08
Examples:
RADAT 63017 Freezing level at 1700 feet MSL with 63% RH
RADAT 91L028039061 Freezing levels at 2800, 3900, and 6100 feet MSL with 91%RH at 2800 feet
RADAT 84H008025085/1 Freezing levels at 800, 2500, and 8500 feet MSL with 84% RH at 8500 feet, and one additional crossing
RADAT ZERO Freezing level at the surface
RADAT MISG Unable to obtain, high winds, or equipment failure
RAICG 89MSL Balloon iced up at 8900 feet MSL
THE TERMINAL AERODROME FORECAST (TAF)
TAF Use For Flight Planning Any aviator planning a flight should know both the destination's existing and forecasted weather. Previously we learned the Aviation Routine Weather Report (METAR) provides existing weather. Now, we will discuss the surface forecasted weather conditions by learning how to read Terminal Aerodrome Forecasts (TAFs). This teletype information will also aid you in planning for the type of flight (IFR/VFR), type of approach you require, determining if an alternate is required, and selection of the best alternate.
Although there are many differences in TAF reporting between the military and civilian weather offices, as well as throughout the world, we will focus this discussion on the U.S. military TAF since the bulk of your training flights will commence from military bases. Once this has been accomplished, it will be much easier to point out differences existing among the TAFs of the U.S. military, civilian, and international communities.
TAF Sequence It will become readily apparent that each line of the TAF forecast will follow the same basic sequence: message heading or change group, time, wind, visibility, weather and obstructions to vision, clouds, altimeter, and remarks. The only deviation that occurs is the addition of wind shear, temperature, icing, and turbulence groups when applicable. Figure 6-14 shows an example of a single line forecast with a breakdown of each group. Figure 6-15 shows an actual forecast for Navy Whiting Field.

JPATS AVIATION WEATHER BOOKLET
Version 3.2/Dec 08 6-15
Figure 6-14 — TAF Groups
KNSE TAF 260909 28004KT 9000 HZ SCT020 SCT200 QNH2998INS
FM1200 26007KT 9000 HZ SCT025 SCT080 BKN250 QNH2996INS VCSHRA
BECMG 1416 9999 SCT025CB SCT250
BECMG 1718 23015G25KT 530004
TEMPO 1902 8000 TSSHRA SCT010 BKN025CB
FM0200 27010KT 9999 SCT030 BKN080 BKN250 QNH3001INS 20/09Z
KMOB 262046Z 262121 00000KT 3200 BR VV004 QNH3012INS
BECMG 0607 14012 9999 SCT004 SCT025 QNH3016INS
Figure 6-15 — TAF Example
Message Heading The message heading begins with the 4-letter ICAO location identifier (e.g., KNSE for NAS Whiting Field) as shown in Figure 6-16. Next comes the letters “TAF” and any modifiers such as AMD, COR, or RTD, which stand for AMenDed, CORrected, or RouTine Delayed, unless the station is USN/USMC, in which case a remark will be appended to the last line of the forecast.
KNSE TAF 260909 28004KT 9000 HZ SCT020 SCT200 QNH2998INS
Figure 6-16 — TAF Heading

JPATS AVIATION WEATHER BOOKLET
6-16 Version 3.2/Dec 08
Forecast Times The 6-digit number following the message heading indicates the forecast period of the entire TAF, which is usually 24 hours (Figure 6-17). The first two digits represent the date of the forecast. The second two digits indicate the beginning hour of the forecast, and the final two digits indicate the ending hour of the forecast. For example, 260909 means that the forecast begins at 0900Z on the 26th day of the month and covers the 24-hour period up to but not including 0900Z the next day. U.S. civil stations include date and time of transmission prior to the forecast period (i.e., 091720Z 091818).
KNSE TAF 260909 28004KT 9000 HZ SCT020 SCT200 QNH2998INS
Figure 6-17 — TAF Time Group Whenever the forecast is an AMD, COR, or RTD, the times may not be for a 24-hour period and will be indicated accordingly. When USN/USMC stations amend, correct, or have a routine delayed forecast, a remark will be appended to the last line of the forecast with the appropriate time (e.g., AMD2218).
Winds Wind direction is forecasted to the nearest 10 degrees true, in the direction from which the wind will be blowing (Figure 6-18). If wind direction is expected to vary by 60 degrees or more, the limits of variability will be noted as a remark, e.g., WND 270V350. The contraction VRB can only be used to replace direction when forecasted wind speed is 6 knots or less, or in more rare cases when it is impossible to forecast a single wind direction, such as for thunderstorms.
KNSE TAF 260909 28004KT 9000 HZ SCT020 SCT200 QNH2998INS
Figure 6-18 — TAF Winds Forecasted wind speeds and gust data are given in whole knots; if the wind speed is over 100 knots, then 3 digits are used. Calm winds are represented by “00000” for the wind group. “G” will be included to indicate gusts when the peak wind exceeds the average wind by 10 knots or more. Presently all U.S. winds are in knots and the contraction KT will end these wind groups. Some overseas stations use KPH (kilometers per hour) or MPS (meters per second).
Visibility, Weather, and Obstructions to Vision For TAFs, forecasted prevailing visibility is reported in meters and rounded down to the nearest reportable value (Figure 6-19). U.S. civil stations, however, will report visibility in
KNSE TAF 260909 28004KT 9000 HZ SCT020 SCT200 QNH2998INS
Figure 6-19 — TAF Visibility Group statute miles (Table 6-5). Whenever the prevailing visibility is forecasted to be 9000 meters or less (6 miles or less) the weather or obstructions to vision causing the reduced visibility will be included using the same notation as the METAR present weather group, described above in Table 6-2. A visibility code of “9999” indicates 7 miles visibility or greater is forecast, i.e. unlimited visibility. When appropriate, RVRs will follow immediately after the prevailing visibility.

JPATS AVIATION WEATHER BOOKLET
Version 3.2/Dec 08 6-17
VISIBILITY CONVERSION TABLE - STATUE MILES TO METERS
Statute Miles Meters Statue Miles Meters Statute Miles Meters
0 0 3/4 1200 1 7/8 3000
1/16 100 7/8 1400 2 3200
1/8 200 1 1600 2 1/4 3600
3/16 300 1 1/8 1800 2 1/2 4000
1/4 400 1 1/4 2000 3 4800
5/16 500 1 3/8 2200 4 6000a
3/8 600 1 1/2 2400 5 8000
1/2 800 1 5/8 2600 6 9000b
5/8 1000 1 3/4 2800 7 9999
Notes: a Rounded down from 6400m; b Rounded down from 9600m.
Table 6-5 — Reportable Visibility Values for TAFs
If any significant weather or an obstruction to vision is forecast (rain, snow, sleet, hail, blowing dust, etc.), it will be included after visibility, using the codes in Table 6-2. If there is no significant weather, this group will be omitted.
Sky Condition Group This group(s) will be included as often as necessary to indicate all forecast cloud layers–up to the first overcast layer (8/8ths)–in ascending order of cloud bases, with lowest layer first (Figure 6-20).
KNSE TAF 260909 28004KT 9000 HZ SCT020 SCT200 QNH2998INS
Figure 6-20 — TAF Sky Condition Group
As with METARs, TAF sky conditions will consist of five or six characters. The first two or three letters indicate the amount of sky coverage, from Table 6-3, above, and the last three digits indicate the height of the cloud bases in hundreds of feet AGL.
The types of clouds will not be forecast with the exception of cumulonimbus (CB), which will always be given as a separate layer (e.g., SCT005CB). In the event of a partial obscuration, it will be considered the first cloud layer and will be reported as FEW000, SCT000, or BKN000.
Special Wind Shear Group An entry such as “WS020/22030KT” indicates the presence of wind shear. The three digits before the slash indicate the altitude (AGL), and the characters following the slash indicate wind direction and speed. North American stations will insert this special non-convective wind shear group immediately after the cloud group when it is forecast for altitudes 2000 feet AGL and below. However, if it cannot be forecast with accuracy, a less specific format of “WSCONDS”

JPATS AVIATION WEATHER BOOKLET
6-18 Version 3.2/Dec 08
(wind shear conditions) may be used, and no further numeric data will be given. If no wind shear is forecast, then this group is omitted.
Icing Group This group consists of six numbers only and begins with a “6.” It is used to forecast non-thunderstorm icing (the presence of thunderstorms implies moderate or greater icing), and is repeated as often as necessary to indicate multiple icing layers. The group is omitted if no icing is forecasted. The following example illustrates the decoding of the icing group:
641104
The “6” indicates that icing is forecasted. The next digit, “4,” is the type of forecasted icing from Table 6-6 (moderate icing). If more than one type of icing is forecast within the same stratum of air, the highest code Figure–the most severe–will be used. The next three digits, “110,” indicate the height of the base of the icing stratum in hundreds of feet AGL, which is 11,000' AGL in this case. If the numbers “000” are used, this would indicate icing occurring at or below 100 feet AGL. The last digit, “4,” is the thickness of the icing layer in thousands of feet (4000' here) using numbers 1 through 9. If layer is thicker than 9000 feet, the icing group is repeated so that the base of the repeated group coincides with the top of the first encoded icing group. If multiple layers are forecasted that are not related to each other, the layers are encoded in an ascending order.
Ic TYPE OF ICING B TYPE OF TURBULENCE
Code Description Code Description
0 No icing 0 None
1 Light icing 1 Light turbulence
2 Light icing in cloud 2 Moderate turbulence in clear air, occasional
3 Light icing in precipitation 3 Moderate turbulence in clear air, frequent
4 Moderate icing 4 Moderate turbulence in cloud, occasional
5 Moderate icing in cloud 5 Moderate turbulence in cloud, frequent
6 Moderate icing in precipitation
6 Severe turbulence in clear air, occasional
7 Severe icing 7 Severe turbulence in clear air, frequent
8 Severe icing in cloud 8 Severe turbulence in cloud, occasional
9 Severe icing in precipitation 9 Severe turbulence in cloud, frequent
X Extreme turbulence
Table 6-6 — TAF Icing and Turbulence Codes

JPATS AVIATION WEATHER BOOKLET
Version 3.2/Dec 08 6-19
Turbulence Group This group is similar to the icing group because it is consists of six characters and follows the same format. The turbulence group, however, begins with a “5,” and the second digit represents the turbulence intensity, also from Table 6-6. The turbulence group is used to forecast non-thunderstorm turbulence (the presence of thunderstorms implies moderate or greater turbulence) and is also repeated as often as necessary to indicate multiple turbulence layers. The group is omitted if no turbulence is forecasted. The example below illustrates the decoding of the turbulence group:
510302
Following the same rules as the icing group, above, one would expect light turbulence from 3000 feet AGL to 5000 feet AGL.
Altimeter Group This group forecasts the lowest expected altimeter setting in inches of Hg (Mercury) during the initial forecast period and each subsequent BECMG and FM group (to be discussed shortly) that follows. TEMPO groups (also to be discussed shortly) do not forecast the QNH group. This minimum altimeter setting becomes quite valuable when aircraft lose radio communications in IMC conditions and need a useful altimeter setting for the destination airfield (Figure 6-21).
KNSE TAF 260909 28004KT 9000 HZ SCT020 SCT200 QNH2998INS
Figure 6-21 — TAF Altimeter Group The “QNH” indicates that sea level pressure is being given. The next four digits indicate the lowest forecast altimeter setting in inches of Hg (and hundredths), without the decimal. “INS” simply indicates the unit of measurement is inches. Other standards, such as QNE and QFE, are also used in different circumstances. QNE is the standard datum plane, 29.92 in-Hg, and some countries use QFE, the actual station pressure not corrected to sea level. If QFE is set, the altimeter indicates actual elevation above the field, but does not ensure terrain clearance. Aircrews must exercise extreme caution if conducting operations at a location using QFE.
International stations report the altimeter in millibars (a.k.a. hectopascals, hPa) and use the letter “Q” for indicator. For example, “Q1013” indicates a forecast altimeter setting of 1013 millibars. U.S. civil stations generally will not forecast an altimeter setting.
Remarks Various remarks may be appended to the end of the initial forecast period and subsequent change groups. The contractions listed in Table 6-2 are used for weather and obstructions to vision, while the FAA General Use Contractions will be used for other abbreviations.
The abbreviation “VC,” also from Table 6-2, will only be used for air mass weather that is expected to occur within the forecast area. For example, “VCSHRA W” would indicate that rain showers are in the vicinity to the west. However, “VC” will not be used for weather expected to occur within a 5-mile radius of the runway complex, since that is considered to be “at the station.”

JPATS AVIATION WEATHER BOOKLET
6-20 Version 3.2/Dec 08
Temperature Group This is an optional group; however, its usage is highly encouraged and should be included to meet the requirements of local operations, especially for helicopter and VSTOL aircraft, which require density altitude. The forecast maximum or minimum temperature, depending on the time of the day, is given in two digits Celsius, using “M” for minus temperatures. This is followed by the 2-digit hour during which the maximum or minimum is expected to occur. It will be on the last line of the TAF, unless the forecast was amended.
Change Group Terminology The change groups of “FM,” “BECMG,” and “TEMPO” will be used whenever a change in some or all of the elements forecasted are expected to occur at some intermediate time during the 24-hour TAF period. A new line of forecasted text is started for each change group. More than one change group may be used to properly identify the forecast conditions (Figure 6-22).
FM (From) and BECMG (Becoming) are indicators of expected speed of change. FM is used when the change is expected to be quick, and BECMG is used when the change is expected to occur over a longer period of time. FM indicates that a permanent, dramatic or relatively dramatic, change to a weather pattern is forecast to occur in a short period. All elements of the forecast conditions will be listed on that TAF line. BECMG indicates that some forecast elements are going to change permanently, or possibly that all of the forecast elements are to change. TEMPO (Temporary) means just that: a temporary or non-permanent change to the to the overall weather pattern.
KNSE TAF 260909 28004KT 9000 HZ SCT020 SCT200 QNH2998INS
FM1200 26007KT 9000 HZ SCT025 SCT080 BKN250 QNH2996INS VCSHRA
BECMG 1416 9999 SCT025CB SCT250
BECMG 1718 23015G25KT 530004
TEMPO 1902 8000 TSSHRA SCT010 BKN025CB
FM0200 27010KT 9999 SCT030 BKN080 BKN250 QNH3001INS 20/09Z
Figure 6-22 — TAF Change Groups
The heading “FM” followed immediately by a time (hours and minutes) indicates that the forecast weather is expected to change rapidly to the conditions on that line. In other words, the time indicates the beginning of a significant and permanent change in the whole weather pattern, and all previously forecast conditions are superseded by the conditions forecasted on this line. Additionally, the “FM” line includes all elements of a normal forecast as discussed above.
Using Figure 6-22 as an example, the change group “FM1200” starts the change line, and this indicates a change is forecasted to occur at 1200Z. All elements on that line will be in effect
FM Group

JPATS AVIATION WEATHER BOOKLET
Version 3.2/Dec 08 6-21
from 1200Z to the end of the original 24-hour period (0900Z in this example), unless changed later in the forecast by another change group (as is the case here).
A line beginning with the heading “BECMG” indicates a change to forecast conditions is expected to occur slowly within the period designated in the time group immediately following the heading. In this time group of four digits, the first two indicate the beginning hour, and the last two represent the ending hour during which the change will take place. The duration of this change is normally about 2 hours, 4 at most.
The elements included in the BECMG line will supersede some of the previous TAF groups, but it is possible that all the groups may change. Any group omitted in the BECMG line will be the same during the BECMG period as indicated in the main TAF line. These new conditions are expected to exist until the end of the TAF forecast time period (unless changed later in the forecast by another change group).
KNSE TAF 260909 28004KT 9000 HZ SCT020 SCT200 QNH2998INS
FM1200 26007KT 9000 HZ SCT025 SCT080 BKN250 QNH2996INS VCSHRA
BECMG 1416 9999 SCT025CB SCT250
BECMG 1718 23015G25KT 530004
TEMPO 1902 8000 TSSHRA SCT010 BKN025CB
FM0200 27010KT 9999 SCT030 BKN080 BKN250 QNH3001INS 20/09Z
Figure 6-23 — TAF BECMG Group From Figure 6-23, some aspects of the weather will begin to change slowly sometime between 1700 and 1800Z, specifically the winds and turbulence. These forecast winds of 230° at 15 kts, gusting to 25 kts, and the frequent, moderate CAT can be expected to last until superseded by the FM group at 0200Z.
The heading “TEMPO” followed by a 4-digit time group indicates the weather conditions on this line will occur briefly, and will not represent a permanent change in the overall forecast weather pattern. Rather, there will be a short-lived overlay to the base forecast occurring only between the beginning and ending hours (two digits for each) specified by the time group. Furthermore, only the elements listed are forecast to be affected.
BECMG Group
TEMPO Group

JPATS AVIATION WEATHER BOOKLET
6-22 Version 3.2/Dec 08
For example, in Figure 6-24, the temporary occurrence of thunderstorms and rain showers are forecast to exist only from 1900 up to, but not including, 0200. After this time, the conditions listed in the TEMPO line will be replaced by the forecast from other lines.
KNSE TAF 260909 28004KT 9000 HZ SCT020 SCT200 QNH2998INS
FM1200 26007KT 9000 HZ SCT025 SCT080 BKN250 QNH2996INS VCSHRA
BECMG 1416 9999 SCT025CB SCT250
BECMG 1718 23015G25KT 530004 TEMPO 1902 8000 TSSHRA SCT010 BKN025CB
FM0200 27010KT 9999 SCT030 BKN080 BKN250 QNH3001INS 20/09Z
Figure 6-24 — TAF TEMPO Group
Civilian stations will sometimes forecast the probability of occurrence of thunderstorms or other precipitation events. Such a line begins with “PROB,” followed by a 2-digit percentage and the corresponding weather, as this example illustrates:
PROB40 1/2SM +TSRA OVC005CB
This station forecasts a 40% chance of heavy rain from thunderstorms, producing an overcast ceiling of cumulonimbus clouds at 500 feet, with visibility ½ mile. This group may also be followed by a 4-digit time period group giving the beginning and ending time for the occurrence. USN/USMC stations will not use this change group.
Change Groups and Times (FROM/TO) In order to use a TAF effectively, one must know how long a given pattern of weather will last, as well as what that pattern will be. To do this, establish the FROM and TO times of that pattern. (Note: in this text, TO will mean up TO, but not including that time.)
• The times on the first line of code, after the location, are the FROM and TO date and times for the entire forecast, and the beginning (FROM) time of the first forecast line.
• The time listed immediately after a FM can be a beginning time of a new pattern of weather as well as a TO time of a previously defined pattern, depending upon where it falls in the forecast.
• The first two digits of the 4-digit time group following BECMG will be the beginning (FROM) time of the new forecast elements, and the last two digits are the ending (TO) time of the previous pattern.
• The first two digits of the 4-digit time group shown after a TEMPO are the beginning (FROM) time, and the last two digits are the ending (TO) time for that TAF line.
PROB Group

JPATS AVIATION WEATHER BOOKLET
Version 3.2/Dec 08 6-23
KNSE 200909 00000KT 0800 FG VV001 620106 QNH3000INS
TEMPO0912 00000KT 2400 BR SCT000 SCT005 SCT080 SCT250
FM1400 20005KT 6000 HZ SCT025 SCT080 SCT250 QNH3004INS
BECMG1617 9999 QNH3002INS
BECMG2022 23010KT 9999 SCT025 SCT080 BKN250 WSCONDS 531006 QNH2996INS VCTSSH
TEMPO2303 VRB15G30KT 1600 TSSH OVC010CB
Figure 6-25 — From/To Example Using the example in Figure 6-25, the first forecast line (KNSE 200909) begins FROM 0900Z on the 20th and is good up TO 1400Z on the third line. (0900Z to 0900Z is also the 24 hour forecast period.) The second forecast line (TEMPO0912) begins FROM 0900Z and is forecast to occur up TO 1200Z. The third forecast line (FM1400) begins FROM 1400Z and is good up TO 1700Z, with some of these conditions changing by up TO 1700Z, the fourth line. The fourth forecast line (BECMG1617) begins FROM 1600Z and is good up TO 2200Z. The fifth forecast line (BECMG2022) begins FROM 2000Z and is forecast to occur up TO at least 0900Z, the end of the forecast period. The sixth line (TEMPO2303) begins FROM 2300Z and is forecast to occur up TO 0300Z.
Summary Of U.S. Civil/Military TAF Differences Civilian weather stations are required to adhere to slightly different formats than military stations, as has been discussed in the corresponding sections above. For reference, these differences are summarized below. An example follows in Figure 6-26.
1. U.S. civil stations will use statute miles instead of meters.
2. U.S. civil stations include date time group of transmission prior to the forecast period (e.g., 091720Z 081818).
3. When U.S. military stations amend, correct, or have a routine delayed forecast, a remark will be appended to the last line of the forecast with the appropriate time (e.g., AMD2218).
4. U.S. civil stations may include probability of precipitation occurrence.

JPATS AVIATION WEATHER BOOKLET
6-24 Version 3.2/Dec 08
KLCH TAF 032240Z 032323 01012G22KT 5SM HZ OVC006
BECMG 0002 01015G25KT 2SM -DZ BR OVC004 PROB40 0004 VRB25G35KT 2SM TSRA VV002
FM0400 01012G20KT 2SM BR OVC004
BECMG 1516 01015G25KT 4SM HZ OVC008
FM1700 01010KT 5SM HZ OVC009;
KSHV TAF 032240Z 032323 36010KT 4SM BR OVC004 WS005/27050KT
TEMPO 2316 35015KT 2SM -FZDZ PL OVC020
FM1700 04008KT P6SM BKN025;
Figure 6-26 — Civilian TAF Examples Additionally, there are some differences between military TAFs and International TAFs, which are summarized in Table 6-7.
TAF Differences
U.S. Military TAF International TAF
Forecast Period 24 Hours Forecast Period Variable
Wind Speed Knots Wind Speed Knots-, or Meters- or Kilometers-per-hour
CAVOK not used CAVOK used
Table 6-7 — Differences Between Military and International TAFs
The term CAVOK is similar to the term sometimes used among aviators, CAVU, which stands for “Clear Air, Visibility Unlimited.” The term CAVOK stands for “Clear Air, Visibility O.K.” and is not used in U.S. Military TAF reporting.
Determination of Ceiling in METARs and TAFs In Chapter 5 we first introduced the concept of cloud layers and ceilings. As you may recall, the definition of a ceiling is the height above the ground (AGL) ascribed to the lowest broken or overcast layer; or the vertical visibility into an obscuring phenomenon (total obscuration). Remember that partial obscurations, such as FEW000, or SCT000, do not constitute a ceiling.
Ceilings may be easy to determine in METAR, but more difficult in TAFs, since they usually have more than one line. Therefore, it is important to carefully evaluate the ceiling by using the appropriate time period, as will be discussed below in “Using TAFs for Flight Planning.” Once the ceiling (and other cloud layers) has been determined, then one can move onward to determining the type of flight plan (IFR or VFR) as well as whether an alternate landing airfield is required.

JPATS AVIATION WEATHER BOOKLET
Version 3.2/Dec 08 6-25
Example of Military TAF with Description of Elements
KNSE TAF 260909 28004KT 9000 HZ SCT020 SCT200 QNH2998INS
FM1200 26007KT 9000 HZ SCT025 SCT080 BKN250 QNH2996INS VCSHRA
BECMG 1416 9999 SCT025CB SCT250
BECMG 1718 23015G25KT 530004
TEMPO 1902 8000 TSSHRA SCT010 BKN025CB FM0200 27010KT 9999 SCT030 BKN080 BKN250 QNH3001INS 20/09Z
Figure 6-27 — Military TAF Example 1st line — Forecast for NAS Whiting field (KNSE) beginning at 0900Z (0909) and valid up to but not including 1200Z on the second line (FM1200), winds from 280 degrees and speed 4 knots (28004KT), visibility 6 miles (9000 meters), in haze (HZ), scattered clouds at 2,000 feet AGL (SCT020), scattered clouds at 20,000 feet AGL (SCT200), altimeter setting 29.98 inches (QNH2998INS).
2nd Line — From 1200Z (FM1200), up to but not including 1600Z (BECMG 1416), winds from 260 degrees at 7 knots (26007KT), visibility 6 miles (9000 meters), in haze (HZ), scattered clouds at 2500 feet AGL (SCT025), scattered clouds at 8000 feet AGL (SCT080), broken clouds at 25,000 feet AGL (BKN250), altimeter setting of 29.96 inches (QNH2996INS), and rain showers in the vicinity (VCSHRA), ceiling at 25,000 feet.
3rd Line — From 1400Z (BECMG 1416), up to but not including 1800Z (BECMG 1718), winds the same as 2nd line (26007KT), visibility greater than 7 miles (9999), scattered cumulonimbus clouds at 2500 feet AGL (SCT025CB), and scattered clouds at 25,000 feet AGL (SCT250), altimeter setting same as 2nd line (QNH2996INS); remarks same as 2nd line.
4th Line — From 1700Z (BECMG 1718) up to but not including 0200Z (FM02), winds from 230 degrees at 15 knots with gusts to 25 knots (23015G25KT), visibility same as 3rd line (9999), clouds same as 3rd line (SCT025CB, SCT250), moderate turbulence in clear air from surface up to 4000 feet (530004), altimeter setting same as 2nd line, 29.96 inches (QNH2996INS). Remarks same as 2nd line.
5th Line — Temporarily between 1900Z and 0200Z (TEMPO 1902), winds same as 4th line (23015G25KT), visibility 5 miles (8000 meters), with thunderstorms and rain showers (TSSHRA), scattered clouds at 1000 feet AGL (SCT010) and broken cumulonimbus clouds at 2500 feet AGL (BKN025CB), turbulence same as 4th line (530004), altimeter same as 2nd line (QNH2996INS), with ceiling at 2500 feet.
6th line — From 0200Z (FM0200) up to but not including 0900Z (end of TAF), winds from 270 degrees at 10 knots (27010KT), visibility greater than 6 miles (9999), scattered clouds at 3000 feet AGL (SCT030), broken clouds at 8000 feet AGL (BKN080), broken clouds at 25,000 feet AGL (BKN250), altimeter setting 30.01 inches (QNH3001INS), ceiling at 8000 feet AGL, minimum temperature forecasted for the day is 20° C (68° F) at 0900Z.

JPATS AVIATION WEATHER BOOKLET
6-26 Version 3.2/Dec 08
Using TAFs For Flight Planning For flight planning purposes, an aviator must consider the worst weather conditions that fall within the period of 1 hour prior to the planned estimated time of arrival (ETA) up to but not including 1 hour after ETA, for a total of a 2-hour window. As an example, assume an ETA of 1620Z at NAS Whiting, use the TAF in Figure 6-27, and follow these simple steps:
1. Determine the arrival window, which would be 1520 – 1720Z in this case.
2. Evaluate the whole TAF to determine the forecast time period to which each line applies. If any part of the 2-hour ETA window falls within the time period of that line, then the information in that line will be applicable. In this case, lines 2, 3, and 4 each cover part of the 1520 – 1720Z window.
3. Finally, mix and match the weather from each line for use in flight planning, building a set of the worst-case scenario for each group: strongest winds, lowest visibility, worst weather, lowest ceiling, and lowest altimeter.
Another technique is to lay out a timeline in order to dissect and categorize the applicability of the various lines of a TAF. By drawing labeled brackets around the times to which each line applies and around the 2-hour ETA window, it becomes easier to see which lines of the TAF are applicable. This technique is especially useful when planning a mission with numerous approaches or en route delays, or when the weather will be a deciding factor for the landing time. Figure 6-28 shows a diagram of this technique for our example.
Figure 6-28 — TAF Timeline Example
This technique also requires the flight crew to apply the 2nd, 3rd, and 4th lines of the forecast. Using either method, they would look for the worst weather among each of these lines and plan for:
• Winds 230 degrees at 15 knots gusting to 25 knots (23015G25)
• Visibility 6 miles in haze (9000 HZ)
• Scattered cumulonimbus at 2500' AGL, scattered clouds at 8000' AGL, and broken clouds at 25,000' AGL, with ceiling at 25,000' (SCT025CB, SCT080, BKN250)
• Altimeter setting 29.96 inches (QNH2996INS)
• Frequent moderate clear air turbulence from the surface up to 4000 feet (530004)
• Rain showers in the vicinity (VCSHRA)

JPATS AVIATION WEATHER BOOKLET
Version 3.2/Dec 08 6-27
METARs AND TAFs REVIEW QUESTIONS Use Figure 6-29 for questions 1-6, as well as any tables needed from the chapter.
KLEX 0359Z 19004KT 7SM BKN250 22/20 A3020 RMK SLP220
KPAH 0358Z 09008KT 15SM -RA BKN011 OVC060 22/20 A3007 RMK CB OVHD MOVG E SLP178
KAND 0357Z 09005KT 060V140 12SM SCT050 BKN250 30/22 A3015 RMK SLP204
KCAE 0356Z 00000KT 10SM FEW000 FEW050 SCT300 25/20 A3013 RMK CB N LTGIC SLP201
KAVL 0458Z 12004KT 2SM BR HZ SCT000 SCT060 BKN080 21/20 A3028 RMK FG HZ SCT000 PRESFR SLP226
KRDU 0456Z 13008KT 2SM HZ SCT000 24/22 A3017 RMK HZ SCT000 SLP208
Figure 6-29 — METAR for Questions 1-6
1. The report for Anderson (AND) indicates ______.
a. broken clouds at 25,000 feet
b. that the altimeter setting is 29.05 inches of mercury
c. that the wind is 200° at 40 miles per hour
d. broken clouds at 5000 feet
2. The report for Lexington (LEX) indicates ______.
a. that the ceiling is reported at 25,000 feet
b. that the wind is from the south at 40 miles per hour
c. no ceiling
d. that the station pressure reduced to sea level is 922.0 mb
3. The report for Paducah (PAH) indicates ______,
a. the ceiling is 6000 feet
b. the overcast is measured at 1100 feet
c. the altimeter setting is 30.07 inches of mercury
d. that it is snowing
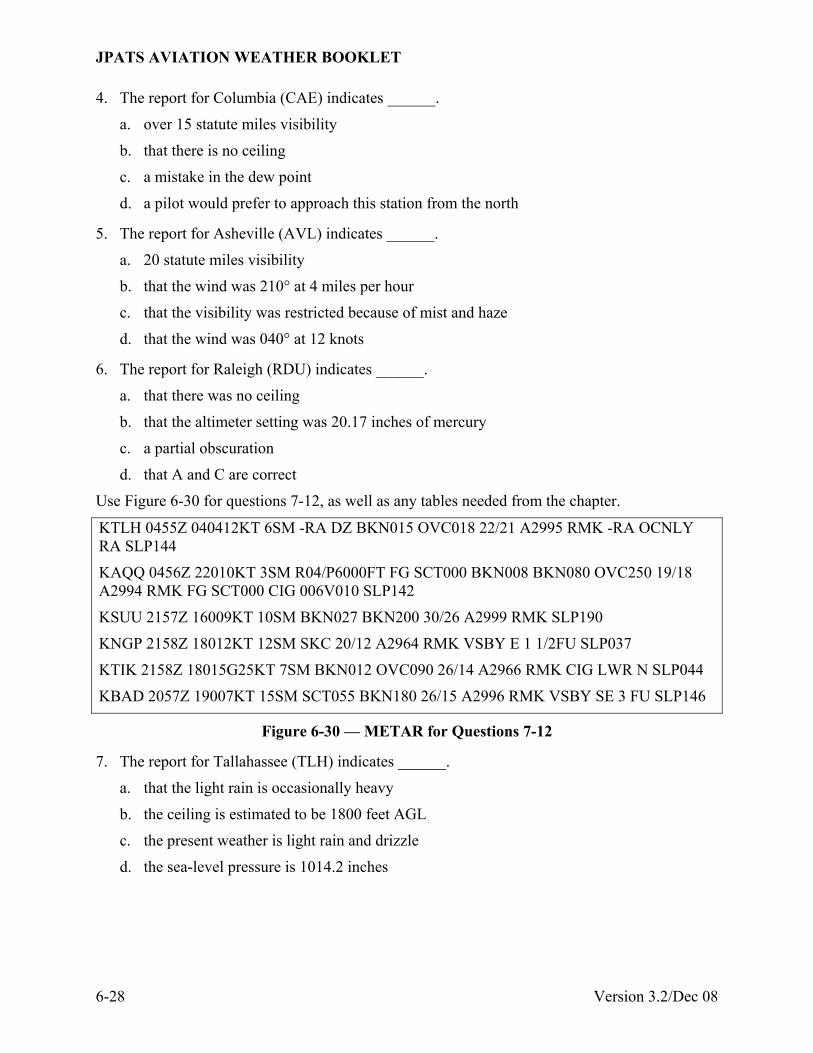
JPATS AVIATION WEATHER BOOKLET
6-28 Version 3.2/Dec 08
4. The report for Columbia (CAE) indicates ______.
a. over 15 statute miles visibility
b. that there is no ceiling
c. a mistake in the dew point
d. a pilot would prefer to approach this station from the north
5. The report for Asheville (AVL) indicates ______.
a. 20 statute miles visibility
b. that the wind was 210° at 4 miles per hour
c. that the visibility was restricted because of mist and haze
d. that the wind was 040° at 12 knots
6. The report for Raleigh (RDU) indicates ______.
a. that there was no ceiling
b. that the altimeter setting was 20.17 inches of mercury
c. a partial obscuration
d. that A and C are correct
Use Figure 6-30 for questions 7-12, as well as any tables needed from the chapter.
KTLH 0455Z 040412KT 6SM -RA DZ BKN015 OVC018 22/21 A2995 RMK -RA OCNLY RA SLP144
KAQQ 0456Z 22010KT 3SM R04/P6000FT FG SCT000 BKN008 BKN080 OVC250 19/18 A2994 RMK FG SCT000 CIG 006V010 SLP142
KSUU 2157Z 16009KT 10SM BKN027 BKN200 30/26 A2999 RMK SLP190
KNGP 2158Z 18012KT 12SM SKC 20/12 A2964 RMK VSBY E 1 1/2FU SLP037
KTIK 2158Z 18015G25KT 7SM BKN012 OVC090 26/14 A2966 RMK CIG LWR N SLP044
KBAD 2057Z 19007KT 15SM SCT055 BKN180 26/15 A2996 RMK VSBY SE 3 FU SLP146
Figure 6-30 — METAR for Questions 7-12
7. The report for Tallahassee (TLH) indicates ______.
a. that the light rain is occasionally heavy
b. the ceiling is estimated to be 1800 feet AGL
c. the present weather is light rain and drizzle
d. the sea-level pressure is 1014.2 inches

JPATS AVIATION WEATHER BOOKLET
Version 3.2/Dec 08 6-29
8. The report for Appalachicola (AQQ) indicates ______.
a. that there are two ceilings
b. that on RWY 04, the visual range is greater than 6000 feet
c. the ceiling varies between 6000 and 10,000 feet MSL
d. fog obscures five-eighths of the sky
9. The report for Travis AFB (SUU) indicates that ______.
a. the wind is 160° at 9 miles per hour
b. there was a ceiling
c. the visibility is 10 nautical miles
d. the altimeter setting is 29.99 mb
10. The report for NAS Corpus Christi (NGP) indicates that ______.
a. there is no ceiling
b. the wind is 12 knots from the south
c. the visibility in the area is restricted
d. A and B are correct
11. The report for Tinker AFB (TIK) indicates that ______.
a. the ceiling is 900 feet and is overcast
b. a pilot flying at 10,000 feet would be above all clouds
c. the ceiling on an approach from the north may be lower
d. there are squalls
12. The report for Barksdale AFB (BAD) indicates ______.
a. the magnetic wind is 190° at 07 knots
b. the visibility is 15 statute miles in all directions
c. the temperature-dew point spread is 12° C
d. none of the above

JPATS AVIATION WEATHER BOOKLET
6-30 Version 3.2/Dec 08
Use Figure 6-31 for questions 13-19, as well as any tables needed from the chapter.
KNQA SPECI 2056Z 36007KT 3/4SM FG VV004 22/21 A2976 RMK SLP078
KBWG 1357Z 13004KT 10SM TSRA PL SCT025CB SCT035 SCT100 BKN250 28/26 A2990 RMK TSSH ALQDS SLP125
KMEM 1356Z 04010KT 010V070 30SM BKN120 BKN250 30/17 A2995 RMK SLP142
KPAH 1358Z 17023G30KT 12SM SKC 34/24 A2990 RMK FEW CI SLP111
KSDF SPECI 1357Z 00000KT 1SM -RA FG BKN006 19/18 A2976 RMK SLP078
KTRI 1356Z 00000KT 20SM BKN065 A3010 RMK LSR08P DRY SLP193
Figure 6-31 — METAR for Questions 13-19
13. The report of NAS Memphis (NQA) at 2100Z indicates ______.
a. an overcast at 400 feet
b. that the visibility is 3 statute miles
c. that the ceiling was due to an obscuration
d. that the lowest cloud layer is at 300 feet
14. The 2100Z report from NAS Memphis (NQA) indicates ______.
a. that this was a special weather observation
b. that the visibility is unrestricted
c. that the wind information is missing
d. no clouds
15. The report for Memphis (MEM) indicates that ______.
a. the wind is steady from 040° magnetic at 10 knots
b. the ceiling is 12,000 feet
c. there is another ceiling at 25,000 feet
d. the altimeter setting is 29.95 hectopascals
16. The report for Bristol (TRI) indicates ______.
a. the temperature and dew point are minus values
b. that the wind information is missing
c. that the temperature is missing
d. two layers of clouds

JPATS AVIATION WEATHER BOOKLET
Version 3.2/Dec 08 6-31
17. The report for Bowling Green (BWG) indicates ______.
a. that the ceiling is 2500 feet
b. that ice pellets were falling at the time of the observation
c. that the wind is 130° at 4 miles per hour
d. broken clouds at 10,000 feet
18. The report for Paducah (PAH) indicates ______.
a. gusty winds
b. that the wind speed reached 30 miles per hour
c. that there are no clouds
d. that the barometric pressure is 911.1 mb
19. The report for Louisville (SDF) indicates ______.
a. light rain and fog
b. that the wind is calm
c. the height of the ceiling was 600 feet
d. that all are correct
Use Figure 6-32 for questions 20-25, as well as any tables needed from the chapter.
KADM SPECI 0958Z 32014KT 7SM SKC 21/18 A2970 RMK SLP057 RADAT 79100
KOKC 1008Z 108014KT 15SM SCT010 BKN025 28/23 A3006 RMK DSNT TSSH SLP219
KPWM 1055Z 30018KT 2SM R30/P6000FT -SN SCT000 OVC008 M01/M02 A2991 RMK SN SCT000 DRFTG SN PSR20 SLP118
KLUF 1356Z 18005KT 45SM SCT025 SCT050 BKN240 04/M06 A3017 RMK SHSN OBSCG MTNS N SLP217
KNFB SPECI 0123Z 01023G35 1/2SM R36R/1200FT -BLSN SCT000 OVC005 RMK VIS 3/8V5/8 BLSN SCT000 CIG 004V006
KNXX 0058Z COR 13008G15KT 100V170 8SM SCT005 BKN008 OVC012 06/M01 A2945
RMK BKN TOPS 070 SLP985
Figure 6-32 — METAR for Questions 20-25

JPATS AVIATION WEATHER BOOKLET
6-32 Version 3.2/Dec 08
20. The report for Ardmore (ADM) indicates that ______.
a. the freezing level was observed to be at 10,000 feet MSL
b. the time of the RADAT observation was 1008Z
c. the freezing level was forecast to be at 10,000 feet MSL
d. the freezing level was forecast to be at 10,000 feet AGL
21. The report for Oklahoma City (OKC) indicates ______.
a. it is raining in sight of the field
b. the temperature-dew point spread was 9° C
c. Oklahoma City was still able to transmit the report at the assigned time slot
d. that A and C are correct
22. The report for Portland (PWM) indicates that ______.
a. the sky is partially obscured by snow
b. the runway visual range is greater than 6000 feet
c. the ceiling was 800 feet
d. all above are correct
23. Luke AFB (LUF) reported ______.
a. a visibility of 45 statute miles
b. no weather in the vicinity of the station
c. an unlimited ceiling
d. all of the above
24. The report for NAS Grosse Isle (NFB) ______.
a. indicates a partial obscuration due to blowing snow
b. is in error, since RVR does not coincide with prevailing visibility
c. indicates a possible ceiling at 400 feet
d. indicates the conditions stated in A and C
25. NAS Willow Grove (NXX) reported ______.
a. base of the overcast at 1200' MSL, top of the overcast at 7000' MSL
b. conditions which would point up the wisdom of monitoring reports for further weather developments at Willow Grove while en route to that terminal
c. VFR conditions over the field
d. wind steady from 310° at 8 knots with gusts at 15 knots

JPATS AVIATION WEATHER BOOKLET
Version 3.2/Dec 08 6-33
Terminal Aerodrome Forecasts (TAFs)
Use Figure 6-33 for questions 26-50, as well as any tables needed from the chapter.
KNPA 201212 36005KT 0800 DZ FG VV002 QNH3001INS
FM1500 02011KT 8000 HZ BKN007 BKN020 BKN140 BKN300 641403 540209 QNH2995INS
TEMPO1822 16008KT 4800 SHRA SCT008 BKN020
KNTU 201212 02008KT 1600 RA BR OVC004 QNH3000INS
TEMPO1216 VRB05KT 0800 FG VV001
FM1600 02011KT 6000 HZ BKN007 BKN020 OVC300 670708 QNH2993INS
TEMPO1822 19006KT 4800 SHRA SCT009 BKN020
KDOV 201212 36007KT 0800 DZ FG VV002 QNH3001INS
FM1500 02011KT 8000 HZ BKN007 BKN020 BKN150 OVC300 621403 540209 QNH2995INS
TEMPO1822 16008KT 4800 SHRA SCT008 BKN020
KNBE 201212 VRB05KT 0800 DZ FG VV001 QNH3004INS
FM1300 12006KT 1600 BR OVC005 QNH3007INS VCRA
FM1700 17010KT 8000 HZ SCT007 BKN020 OVC300 650106 540209 QNH2991INS VCSHRA
TEMPO1823 18015KT 4800 SHRA BKN020
BECMG0102 VRB05KT 3200 BR BKN005 OVC020 QNH 3000INS
KTIK 201212 VRB05KT 1600 DZ BR OVC004 QNH2999INS
FM1500 15010KT 0800 DZ FG OVC006 QNH3001INS
BECMG2122 17010KT 2400 DZ BKN014 OVC025 QNH3005INS
FM0000 22012KT 9999 SCT030 OVC050 QNH3002INS
BECMG0608 24012KT SKC QNH3004INS
KSPS 201212 17010KT 4800 BR BKN008 OVC015 QNH2987INS
FM1500 17015KT 9999 OVC015 QNH2989INS
FM2000 19012KT 9999 BKN030 QNH2990INS
BECMG0204 19010KT SKC QNH2993INS

JPATS AVIATION WEATHER BOOKLET
6-34 Version 3.2/Dec 08
KNQA 201515 18008KT 9999 SKC QNH3016INS
FM1800 17012G20KT 9999 BKN025 611109 521103 QNH3012INS
FM0400 17015G22KT 9999 BKN020 BKN100 WSCONDS QNH3008INS
TEMPO0408 20025G35KT 1600 TSSHRA OVC008CB
KNBG 201515 13008KT 9999 SCT025 SCT100 651309 521303 QNH3025INS
TEMPO1500 13012KT 9999 BKN025 BKN100
FM0900 VRB04KT 2400 BR SCT015 QNH3021INS
TEMPO0913 00000KT 0800 FG OVC015
FM1300 17010KT 9999 SCT030 QNH3020INS
KNMM 201515 14005KT 8000 BR SCT025 QNH3028INS
FM1900 16005KT 8000 HZ SCT025 BKN080 651109 561203 QNH3024INS
TEMPO1902 18010KT 6000 HZ BKN025 OVC080
FM0200 00000KT 9999 SKC 562005 QNH3020INS
BECMG0809 1600 BR SCT000 QNH3018INS
Figure 6-33 — TAF for Questions 26-50
26. What is the forecast period for the first line of code on the Navy Pensacola (NPA) forecast?
a. 1200Z up to, but not including 1200Z
b. 1200Z up to, but not including 2200Z
c. 1200Z up to, but not including 1800Z
d. 1200Z up to, but not including 1500Z
27. An aircraft with an ETA into NPA of 1715Z would expect a ceiling of no less than ______.
a. 2000 feet MSL
b. 2000 feet AGL
c. 700 feet AGL
d. 700 feet MSL
28. What is the highest visibility forecast throughout the forecast period at NPA?
a. 3 SM
b. 5 SM
c. ½ SM
d. >6 SM

JPATS AVIATION WEATHER BOOKLET
Version 3.2/Dec 08 6-35
29. Would a pilot flying over NPA during the hours of 1600Z to 2000Z expect icing?
a. Yes
b. No
30. Which lines of the forecast for Navy Oceana (NTU) would it be necessary to look at to formulate the worst case scenario for an ETA of 1615Z?
a. Line 3 only
b. Lines 2 and 3 only
c. All lines would be used.
d. Lines 1 thru 3
31. What minimum visibility would be expected at NTU for an ETA of 1300Z?
a. 1 SM
b. ½ SM
c. 4 SM
d. >6 SM
32. What type of turbulence is forecast over NTU at 2000Z?
a. Severe turbulence in clear, frequent
b. Severe turbulence in cloud, infrequent
c. Severe turbulence in clear, infrequent
d. None forecast at that time
33. What is the temporary forecast sky cover between 1200Z and 1600Z at NTU?
a. 800 foot ceiling
b. Nine-tenths cloud coverage
c. Partial obscuration
d. Total obscuration
34. What is the forecast period for the second line of code for Dover, DE (DOV)?
a. 1500Z up to, but not including 1200Z
b. 1200Z up to, but not including 1500Z
c. 1500Z up to, but not including 2200Z
d. 1500Z up to, but not including 1800Z
JPATS AVIATION WEATHER BOOKLET
6-36 Version 3.2/Dec 08
35. Between which altitudes would icing be expected at DOV, at any time, if at all?
a. 14,000 - 17,000 feet
b. 14,000 - 14,300 feet
c. 2000 - 11,000 feet
d. None is forecast for DOV
36. What are the maximum forecast winds at DOV throughout the forecast period?
a. 020° MAG at 11 mph
b. 150° True at 16 knots
c. 020° True at 11 knots
d. 180° MAG at 22 knots
37. How many, if any, different types of weather are forecast throughout the forecast period at DOV?
a. 2
b. 3
c. 4
d. 5
38. What is the forecast period for the TEMPO line on the Navy Dallas, TX (NBE) forecast?
a. 1800Z up to, but not including 0200Z
b. 1800Z up to, but not including 1200Z
c. 1800Z up to, but not including 0100Z
d. 1800Z up to, but not including 2300Z
39. The minimum expected ceiling throughout the forecast period for NBE is ______.
a. 1000 feet AGL
b. 100 meters MSL
c. 100 feet AGL
d. 500 feet MSL

JPATS AVIATION WEATHER BOOKLET
Version 3.2/Dec 08 6-37
40. What are the forecast winds for NBE for an ETA of 0315Z?
a. 170/10
b. Variable at 5 kts
c. 180/15
d. Calm
41. Was Navy Memphis was expecting wind shear at anytime during the forecast period?
a. Yes
b. No
For questions 42-46, provide the minimum ceilings and visibilities for the location and ETA listed.
42. NTU ETA 1300Z: / ; ETA 1900Z: / ; ETA 0900Z: /
(CIG) / (VSBY)
43. DOV ETA 1400Z: / ; ETA 1800Z: / ; ETA 0100Z: /
44. NBE ETA 1415Z: / ; ETA 1920Z: / ; ETA 0130Z: /
45. TIK ETA 1300Z: / ; ETA 1545Z: / ; ETA 0300Z: /
46. SPS ETA 1310Z: / ; ETA 1730Z: / ; ETA 2300Z: /
47. Fill in the forecast elements for the following Table:
NQA/ETA 0700Z NBG/ETA 1600Z NMM/ETA 0730Z
2 HOUR WINDOW .
CEILING (MIN) .
VISIBILITY (MIN)/WEATHER(S) / / / .
ALTIMETER (LOWEST) .
WINDS (MAX) .
ICING (TYPE/ALTITUDES) / / /
.
TURB (TYPE/ALTITUDES) / / /

JPATS AVIATION WEATHER BOOKLET
6-38 Version 3.2/Dec 08
.
Answer questions 48-50 for NQA, NBG, and NMM in regards to ceilings and visibilities only.
48. Is NQA, NBG or NMM forecast to be IFR for the ETA's listed in question 47 (circle yes or no for each station)?
a. NQA (Yes/No)
b. NBG (Yes/No)
c. NMM (Yes/No)
49. Would NQA, NBG or NMM require an alternate at the ETA (circle yes or no for each station)?
a. NQA (Yes/No)
b. NBG (Yes/No)
c. NMM (Yes/No)
50. Why would NQA, NBG or NMM require an alternate at the ETA, if at all?
a. NQA Ceilings and/or Visibilities? (Circle one or both)
b. NBG Ceilings and/or Visibilities? (Circle one or both)
c. NMM Ceilings and/or Visibilities? (Circle one or both)
d. No alternate required for either station

JPATS AVIATION WEATHER BOOKLET
Version 3.2/Dec 08 A-1
APPENDIX A
GLOSSARY OF SELECTED METEOROLOGICAL TERMS
ACTUAL TIME OF OBSERVATION – For METAR reports, it is the time the last element of the report is observed or evaluated. For SPECI reports, it is the time that the criteria for a SPECI were met or noted.
ADIABATIC – The word applied in the science of thermodynamics to a process during which no heat is communicated to or withdrawn from the body or system concerned. Adiabatic changes of atmospheric temperatures are those that occur only in consequence of compression or expansion accompanying an increase or a decrease of atmospheric pressure.
AIRCRAFT MISHAP – An inclusive term to denote the occurrence of an aircraft accident or incident.
ALTIMETER SETTING – Pressure of the reporting station converted in order to produce a reading on altimeters of field elevation at 10 feet above the runway (normal installation height of the altimeter). Altimeter settings are given in inches of mercury and represent sea level pressure.
ATMOSPHERIC PRESSURE – The force exerted by the weight of the atmosphere from the level of measurement to its outer limits.
AUGMENTED REPORT – A meteorological report prepared by an automated surface weather observing system for transmission with certified weather observers signed on to the system to add information to the report.
AUTOMATED REPORT – A meteorological report prepared by an automated surface weather observing system for transmission, and with no certified weather observers signed on to the system.
BLOWING DUST – Dust raised by the wind to moderate heights above the ground and restricting horizontal visibility to less than 7 miles. If visibility reduced to between 5/8 and 5/16 then a Duststorm; if less than 5/16, a severe Duststorm.
BLOWING SAND – Sand raised by the wind to moderate heights above the ground and restricting horizontal visibility to less than 7 miles. If visibility reduced to between 5/8 and 5/16 then a Sandstorm; if less than 5/16, a severe Sandstorm.
BLOWING SNOW – Snow particles raised and stirred violently by the wind to moderate or great heights. Visibility is poor (6 miles or less) and the sky may become obscured when the particles are raised to great heights.
BLOWING SPRAY – Spray raised in such quantities as to reduce the visibility at eye level (6 feet on shore, 33 feet at sea) to 6 miles or less.
BROKEN LAYER – A cloud layer covering whose summation amount of sky cover is 5/8 through 7/8.
CALM – A condition when no motion of the air is detected.
CEILING – The height above the earth's surface (field elevation or ground elevation) of the lowest non-surface based layer that is reported as broken or overcast, or the vertical visibility into an indefinite ceiling.

JPATS AVIATION WEATHER BOOKLET
A-2 Version 3.2/Dec 08
CEILOMETER – A device used to evaluate the height of clouds or the vertical visibility into a surface-based obscuration.
CELSIUS – The ninth General Conference of Weights and Measures, held in October 1948, adopted the name Celsius in place of centigrade in honor of its originator, Anders Celsius (1704-1744), a Swedish astronomer who devised the scale.
CLEAR-AIR TURBULENCE (CAT) – Turbulence encountered when flying through air devoid of clouds, produced primarily by thermals and wind shear, including proximity to the jet stream.
CLEAR SKY (SKC) – The state of the sky when it is cloudless.
CLOUD-AIR LIGHTNING (CA) – Streaks of lightning which pass from a cloud to the air, but do not strike the ground.
CLOUD-CLOUD LIGHTNING (CC) – Streaks of lightning reaching from one cloud to another.
CLOUD-GROUND LIGHTNING (CG) – Lightning occurring between cloud and ground.
CLOUD HEIGHT – The height of the base of a cloud or cloud layer above the surface of the Earth.
CONTOUR LINE – A line connecting points of equal (constant) height on a Constant-Pressure Chart.
COORDINATED UNIVERSAL TIME (UTC) – The time in the zero meridian time zone.
CUMULUS – A principal cloud type in the form of individual, detached elements that are generally dense and possess sharp non-fibrous outlines.
CUMULONIMBUS – An exceptionally dense and vertically developed cloud, occurring either isolated or as a line or wall of clouds with separated upper portions. These clouds appear as mountains or huge towers, at least a part of the upper portions of which are usually smooth, fibrous, or striated, and almost flattened.
DESIGNATED RVR RUNWAY – A runway at civilian airports designated by the FAA for reporting RVR in long-line transmissions.
DEW POINT – The temperature to which a given parcel of air must be cooled at constant pressure and constant water-vapor content in order for saturation to occur.
DISPATCH VISUAL RANGE – A visual range value derived from an automated visibility sensor.
DRIZZLE – Fairly uniform precipitation composed exclusively of fine drops (diameter less than 0.02 inch or 0.5 mm) very close together. Drizzle appears to float while following air current, although unlike fog droplets, it falls to the ground.
DRY ADIABATIC LAPSE RATE – The rate of decrease of temperature with height, approximately equal to 3° C. per 1000 feet. This is close to the rate at which an ascending body of unsaturated air will cool by adiabatic expansion.

JPATS AVIATION WEATHER BOOKLET
Version 3.2/Dec 08 A-3
DUSTSTORM – An unusual, frequently severe weather condition characterized by strong winds and dust-filled air over an extensive area.
FEW – A layer whose summation amount of sky cover is 1/8 through 2/8.
FIELD ELEVATION – The elevation above sea level of the highest point on any of the runways of the airport.
FOG – A visible aggregate of minute water particles (droplets) which are based at the Earth's surface and reduce horizontal visibility to less than 5/8 statute mile and, unlike drizzle, it does not fall to the ground.
FREEZING – A descriptor, FZ, used to describe drizzle and/or rain that freezes on contact with the ground or exposed objects, and used also to describe fog that is composed of minute ice crystals.
FREEZING DRIZZLE – Drizzle that freezes upon impact with the ground, or other exposed objects.
FREEZING FOG – A suspension of numerous minute ice crystals in the air, or water droplets at temperatures below 0° Celsius, based at the Earth's surface, which reduces horizontal visibility; also called ice fog.
FREEZING PRECIPITATION – Any form of precipitation that freezes upon impact and forms a glaze on the ground or exposed objects.
FREEZING RAIN – Rain that freezes upon impact and forms a glaze on the ground or exposed objects.
FROZEN PRECIPITATION – Any form of precipitation that reaches the ground in solid form (snow, small hail and/or snow pellets, snow grains, hail, ice pellets, and ice crystals).
FUNNEL CLOUD – A violent, rotating column of air which does not touch the ground, usually appended to a cumulonimbus cloud (see tornado and waterspout).
GLAZE – Ice formed by freezing precipitation covering the ground or exposed objects.
GRAUPEL – Granular snow pellets, also called soft hail.
GUST – Rapid fluctuations in wind speed with a variation of 10 knots or more between peaks and lulls.
HAIL – Precipitation in the form of small balls or other pieces of ice falling separately or frozen together in irregular lumps.
HAZE – A suspension in the air of extremely small, dry particles invisible to the naked eye and sufficiently numerous to give the air an opalescent appearance.
HECTOPASCAL – A unit of measure of atmospheric pressure equal to 100 newtons per square meter, abbreviated hPa.
ICE CRYSTALS (DIAMOND DUST) – A fall of unbranched (snow crystals are branched ice crystals in the form of needles, columns, or plates.

JPATS AVIATION WEATHER BOOKLET
A-4 Version 3.2/Dec 08
ICE PELLETS (PL) – Precipitation of transparent or translucent pellets of ice, which are round or irregular, rarely conical, and which have a diameter of 0.2 inch (5 mm), or less. There are two main types:
a. Hard grains of ice consisting of frozen raindrops, or largely melted and refrozen snowflakes.
b. Pellets of snow encased in a thin layer of ice which have formed from the freezing of either droplets intercepted by the pellets or of water resulting from the partial melting of the pellets.
IN-CLOUD LIGHTNING (IC) – Lightning which takes place within the thunder cloud.
INDEFINITE CEILING – The ceiling classification applied when the reported ceiling value represents the vertical visibility upward into surface-based obscuration.
INSOLATION – INcoming SOLar radiATION. The total amount of energy radiated by the Sun that reaches the Earth’s surface. Insolation is the primary source for all weather phenomena on the Earth.
INTENSITY QUALIFIER – Intensity qualifiers are used to describe whether a phenomena is light (–), moderate (no symbol used), or heavy (+).
ISOBAR – A line on a chart or diagram drawn through places or points having the same barometric pressure. (Isobars are customarily drawn on weather charts to show the horizontal distribution of atmospheric pressure reduced to sea level or the pressure at some specified altitude.)
ISOTACH – A line joining points of equal wind speed.
ISOTHERM – A line on a chart or diagram drawn through places or points having equal temperature.
LOW DRIFTING – A descriptor, DR, used to describe snow, sand, or dust raised to a height of less than 6 feet above the ground.
LOW DRIFTING DUST – Dust that is raised by the wind to less than 6 feet above the ground; visibility is not reduced below 7 statute miles at eye level, although objects below this level may be veiled or hidden by the particles moving nearly horizontal to the ground.
LOW DRIFTING SAND – Sand that is raised by the wind to less than 6 feet above the ground; visibility is not reduced below 7 statute miles at eye level, although objects below this level may be veiled or hidden by the particles moving nearly horizontal to the ground.
LOW DRIFTING SNOW – Snow that is raised by the wind to less than 6 feet above the ground; visibility is not reduced below 7 statute miles at eye level, although objects below this level may be veiled or hidden by the particles moving nearly horizontal to the ground.
MANUAL STATION – A station, with or without an automated surface weather observing system, where the certified observers are totally responsible for all meteorological reports that are transmitted.
METAR/SPECI – An evaluation of select weather elements from a point or points on or near the ground according to a set of procedures. It may include type of report, station identifier, date and time of report, a report modifier, wind, visibility, runway visual range, weather and obstructions to vision, sky condition, temperature and dew point, altimeter setting, and Remarks.

JPATS AVIATION WEATHER BOOKLET
Version 3.2/Dec 08 A-5
MILLIBAR – (Bar – a unit of pressure equal to 1,000,000 dynes per square centimeter.) A millibar is equal to 1/1000 of a bar.
MIST – A hydrometer consisting of an aggregate of microscopic and more-or-less hygroscopic water droplets or ice crystals suspended in the atmosphere that reduces visibility to less than 6 statute miles but greater than or equal to ⅝ statute mile.
MOIST ADIABATIC LAPSE RATE – See Saturated Adiabatic Lapse Rate.
NON-UNIFORM SKY CONDITION – A localized sky condition which varies from that reported in the body of the report.
NON-UNIFORM VISIBILITY – A localized visibility which varies from that reported in the body of the report.
OBSCURED SKY – The condition when the entire sky is hidden by a surface-based obscuration.
OBSCURATION – Any aggregate of particles in contact with the earth's surface that is dense enough to be detected from the surface of the earth. Also, any phenomenon in the atmosphere, other than precipitation, that reduces the horizontal visibility.
OVERCAST – A layer of clouds whose summation amount of sky cover is 8/8.
PARTIAL – A descriptor, PR, used only to report fog that covers part of the airport.
PARTIAL FOG – Fog covering part of the station and which extends to at least 6 feet above the ground and apparent visibility in the fog is less than ⅝ SM. Visibility over parts of the station is less than or equal to ⅝ SM.
PARTIAL OBSCURATION – The portion of the sky cover (including higher clouds, the moon, or stars) hidden by weather phenomena in contact with the surface.
PATCHES – A descriptor, BC, used only to report fog that occurs in patches at the airport.
PATCHES (OF) FOG – Fog covering part of the station which extends to at least 6 feet above the ground and the apparent visibility in the fog patch or bank is less than ⅝ SM. Visibility in parts of the observing area is greater than or equal to ⅝ SM, when the fog is close to the point of observation, the minimum visibility reported will be less than ⅝SM.
PEAK WIND SPEED – The maximum instantaneous wind speed since the last METAR that exceeded 25 knots.
PRECIPITATION DISCRIMINATOR – A sensor, or array of sensors, that differentiates between different types of precipitation (liquid, freezing, frozen).
PRESSURE FALLING RAPIDLY – A decrease in station pressure at a rate of 0.06 inch of mercury or more per hour which totals 0.02 inch or more.
PRESSURE RISING RAPIDLY – An increase in station pressure at a rate of 0.06 inch of mercury or more per hour which totals 0.02 inch or more.
RADIOSONDE – A balloon-borne instrument used to measure the temperature, pressure and humidity aloft.
JPATS AVIATION WEATHER BOOKLET
A-6 Version 3.2/Dec 08
RAIN – Precipitation of liquid water particles, either in the form of drops larger than .02 inch (0.5 mm) or smaller drops which, in contrast to drizzle, are widely separated.
PREVAILING VISIBILITY – The visibility that is considered representative of conditions at the station; the greatest distance that can be seen throughout at least half the horizon circle, not necessarily continuous.
ROTOR CLOUD – A turbulent cloud formation found in the lee of some large mountain barriers. The air in the cloud rotates around an axis parallel to the mountain range.
RUNWAY VISUAL RANGE (RVR) – An instrumentally-derived value, based on standard calibrations, that represents the horizontal distance a pilot may see down the runway from the approach end.
SANDSTORM – Particles of sand ranging in diameter from 0.008 to 1 mm that are carried aloft by a strong wind. The sand particles are mostly confined to the lowest ten feet, and rarely rise more than fifty feet above the ground.
SATURATED ADIABATIC LAPSE RATE – A rate of decrease of temperature with height equal to the rate at which an ascending body of saturated air will cool during adiabatic expansion. This value will vary, but is considered to average about 1.5° C. per 1000 feet.
SCATTERED – A layer whose summation amount of sky cover is ⅜ through 4/8.
SCHEDULED TIME OF REPORT – The time a schedule report is required to be available for transmission.
SEA-LEVEL PRESSURE – The pressure value obtained by the theoretical reduction or increase of barometric pressure to sea-level; measured in hectopascals (millibars).
SECTOR VISIBILITY – The visibility in a specified direction that represents at least a 45-degree arc of the horizon circle.
SHALLOW – A descriptor, MI, used only to describe fog when the visibility at 6 feet above the ground is ⅝ statute mile or more and the apparent visibility in the fog layer is less than 5/8 statute mile.
SHALLOW FOG – Fog in which the visibility at 6 feet above ground level is ⅝ statute mile or more and the apparent visibility in the fog layer is less than ⅝ statute mile.
SHOWER(S) – A descriptor, SH, used to qualify precipitation characterized by the suddenness with which they start and stop, by the rapid changes of intensity, and usually by rapid changes in the appearance of the sky.
SIGNIFICANT CLOUDS – Cumulonimbus, cumulonimbus mammatus, towering cumulus, altocumulus castellanus, and standing lenticular or rotor clouds.
SKY CONDITION – The state of the sky in terms of such parameters as sky cover, layers and associated heights, ceiling, and cloud types.
SKY COVER – The amount of the sky which is covered by clouds or partial obscurations in contact with the surface.
SMOKE – A suspension in the air of small particles produced by combustion. A transition to haze may occur when smoke particles have traveled great distances (25 to 100 statute miles or more) and when the larger particles have settled out and the remaining particles have become widely scattered through the atmosphere.

JPATS AVIATION WEATHER BOOKLET
Version 3.2/Dec 08 A-7
SNOW – Precipitation of snow crystals, mostly branched in the form of six-pointed starts; for automated stations, any form of frozen precipitation other than hail.
SNOW GRAINS – Precipitation of very small, white opaque grains of ice; the solid equivalent of drizzle.
SNOW PELLETS – Precipitation of white, opaque grains of ice. The grains are round or sometimes conical. Diameters range from about 0.08 to 0.2 inch (2 to 5 mm).
SPRAY – An ensemble of water droplets torn by the wind from an extensive body of water, generally from the crests of waves, and carried up into the air in such quantities that it reduces the horizontal visibility.
SPECI – A surface weather report taken to record a change in weather conditions that meets specified criteria or is otherwise considered to be significant.
SQUALL – A strong wind characterized by a sudden onset in which wind speeds increase to at least 16 knots and are sustained at 22 knots ore more for at least one minute.
STANDARD ATMOSPHERE – A hypothetical vertical distribution of the atmospheric temperature, pressure, and density, which by international agreement is considered to be representative of the atmosphere for pressure-altimeter calibrations and other purposes (29.92 in-Hg or 1013 Pa).
STANDING LENTICULAR CLOUD – A more or less isolated cloud with sharp outlines that is generally in the form of a smooth lens or almond. These clouds often form on the lee side of and generally parallel to mountain ranges. Depending on their height above the surface, they may be reported as stratocumulus standing lenticular cloud (SCSL); altocumulus standing lenticular (ACSL); or cirrocumulus standing lenticular cloud (CCSL).
STATION ELEVATION – The officially designated height above sea-level to which station pressure pertains. It is generally the same as field elevation at an airport station.
STATION IDENTIFIER – A 4-alphabetic-character code group used to identify the observing location.
STATION PRESSURE – Atmospheric pressure computed for the level of the station elevation.
SUMMATION LAYER AMOUNT – a categorization of the amount of sky cover at and below each reported layer of cloud.
SUMMATION PRINCIPLE – This principle states that the sky cover at any level is equal to the summation of the sky cover of the lowest layer, plus the additional sky cover present at all successively higher layers up to and including the layer being considered.
SURFACE VISIBILITY – The prevailing visibility determined from the usual point of observation.
SYNOPTIC CHART – A chart, such as the ordinary weather map, which shows the distribution of meteorological conditions over an area at a given moment.
THUNDERSTORM – A descriptor, TS, used to qualify precipitation produced by a cumulonimbus cloud that is accompanied by lightning and thunder, or for automated systems, a storm detected by lightning detection systems.
TIME OF OCCURRENCE – A report of the time weather begins and ends.

JPATS AVIATION WEATHER BOOKLET
A-8 Version 3.2/Dec 08
TORNADIC ACTIVITY – The occurrence or disappearance of tornadoes, funnel clouds, or waterspouts.
TORNADO – A violent, rotating column of air touching the ground; funnel cloud that touches the ground (see funnel cloud and water spout).
TOWER VISIBILITY – The prevailing visibility determined from the airport traffic control tower when the surface visibility is determined from another location.
TOWERING CUMULUS – A descriptive term for a cloud with generally sharp outlines and with moderate to great vertical development, characterized by its cauliflower or tower appearance.
UNKNOWN PRECIPITATION – Precipitation type that is reported if the automated station detects the occurrence of light precipitation but the precipitation discriminator cannot recognize the type.
VARIABLE CEILING – A ceiling of less than 3000 feet which rapidly increases or decreases in height by established criteria during the period of observation.
VARIABLE LAYER AMOUNTS – A condition when the reportable amount of a layer varies by one or more reportable values during the period it is being evaluated (variable sky condition).
VARIABLE PREVAILING VISIBILITY – A condition when the prevailing visibility is less than 3 statute miles and rapidly increases and decreases by ½ mile or more during the period of observation.
VARIABLE WIND DIRECTION – A condition when (1) the wind direction fluctuates by 60 degrees or more during the 2-minute evaluation period and the wind speed is greater than 6 knots; or (2) the direction is variable and the wind speed is 6 knots or less.
VERTICAL VISIBILITY – A subjective or instrumental evaluation of the vertical distance into a surface-based obscuration that an observer would be able to see.
VICINITY – A proximity qualifier, VC, used to indicate weather phenomena observed between 5 and 10 statute miles of the usual point of observation but not at the station.
VIRGA – Visible wisps or strands of precipitation falling from clouds that evaporate before reaching the surface.
VISIBILITY – The greatest horizontal distance at which selected objects can be seen and identified or its equivalent derived from instrumental measurements.
VOLCANIC ASH – Fine particles of rock powder that originate blown out from a volcano and that may remain suspended in the atmosphere for long periods. The ash is a potential hazard to aircraft operations and may be an obscuration.
VOLCANIC ERUPTION – An explosion caused by the intense heating of subterranean rock which expels lava, steam, ashes, etc., through vents in the earth's crust.
WATERSPOUT – A violent, rotating column of air that forms over a body of water, and touches the water surface; tornado or funnel cloud that touches a body of water (see funnel cloud and tornado).

JPATS AVIATION WEATHER BOOKLET
Version 3.2/Dec 08 A-9
WELL-DEVELOPED DUST/SAND WHIRL – An ensemble of particles of dust or sand, sometimes accompanied by small litter, raised from the ground in the form of a whirling column of varying height with a small diameter and an approximately vertical axis.
WIDESPREAD DUST – Fine particles of earth or other matter raised or suspended in the air by the wind that may have occurred at or far away from the station.
WIND SHIFT – A change in the wind direction of 45 degrees or more in less than 15 minutes with sustained wind speeds of 10 knots or more throughout the wind shift.

JPATS AVIATION WEATHER BOOKLET
A-10 Version 3.2/Dec 08
This page intentionally left blank

JPATS AVIATION WEATHER BOOKLET
Version 3.2/Dec 08 B-1
APPENDIX B
COMMON WEATHER CONTRACTIONS
A
ABT about
ABV above
AC altocumulus
ACS across
ACFT aircraft
ACRS across
ACTVTY/ACT activity
ADJ adjacent
ADVY advisory
AFT after
AGL above ground level
AHD ahead
ALF aloft
ALG along
ALQDS all quadrants
AMS air mass
AOB at or below
APRNT apparent
AR Arkansas
ARPT airport
ATLC Atlantic
AUTO automated weather report
B
B began
BA breaking action
BC patches
BCM become
BECMG becoming
BGNG beginning
BHND behind
BINOVC breaks in overcast
BKN broken
BL blowing
BLDPS buildups
BLO/BLW below
BNDRY boundary
BR mist
BRFLY briefly
BTWN between
BYD beyond
C
C ceiling
CA clear above
CAT clear air turbulence
CBS/CB cumulonimbus
CDFNT/CFP cold front
CDT Central Daylight Time
CHC chance
CI cirrus
CIG ceiling
CIGS ceilings
CLD cold
CLDS clouds
CLR clear (used at automated stations)

JPATS AVIATION WEATHER BOOKLET
B-2 Version 3.2/Dec 08
CLSD closed
CNCL cancel
CNTRD/CNTR centered
CNTRL/CTRL central
CNSDBLY considerably
CNVGNC convergence
CNVTV convective
CO Colorado
CONDS conditions
CON/CONTD continue
CONS continuous
CONTG continuing
COR correction
CST Central Standard Time
CSTL coastal
CTC contact
CU cumulus
CUFA cumulofractus
D
D dust
DCRG decreasing
DEP depth
DMSHG diminishing
DR dropping rapidly
DR low drifting
DRFTG drifting
DS dust storm
DSIPTG dissipating
DSNT distant
DU (widespread) dust
DURG during
DURCG during climb
DURGD during descent
DVLP/DVLPG develop/developing
DVR dispatch visual range
DZ drizzle
E
E ended/east
EBND eastbound
ELSW elsewhere
ELY easterly
EMBDD embedded
ERN eastern
EST estimated
EWD eastward
EXCP/EXC except
EXPCD/EXPCTD/EXPTD/EXP expected
EXTM/EXTRM extreme
EXTDS extends
F
FAP final approach
FEW few clouds
FC funnel cloud(s)
FCST forecast
FG fog
FIBI filed but impractical to transmit
FL flight level/Florida
FLT flight
FM from
FNT front
FNTL frontal
FRQ frequent

JPATS AVIATION WEATHER BOOKLET
Version 3.2/Dec 08 B-3
FQTLY frequently
FRMG forming
FROPA frontal passage
FRTHR further
FRZLVL freezing level
FT feet
FU smoke
FXD fixed
FVRBL favorable
FZ freezing
FZRNO freezing rain sensor not available
G
G gust/gusting
GA Georgia
GND ground
GR hail (graupel)
GRT/GTR greater
GS small hail/snow pellets
GULFMEX/GLF Gulf of Mexico
H
H/HZ haze
HALF haze aloft
HGTS heights
HI high
HLSTO/GR/GS hailstone
HZ haze
I IA Iowa
IC icing/ice crystals
ICGIC icing in clouds
ICGICIP icing in clouds & in precipitation
ID Idaho
IFR Instrument Flight Rules
IL Illinois
IMPVG/IPVG improving
INC in clouds
IN inch
IN Indiana
INCRG increasing
INTMT intermittent
INTSFYG intensifying
INSTBY instability
INVOF in vicinity of
ISLTD/ISOLD isolated
J
JSTR jet stream
K
K/FU smoke
KALF smoke aloft
KOCTY smoke over city
KS Kansas
KT knot
KTS knots
L
LCL local
LCLY locally
LE Lake Erie
LGT light
LI lifted index

JPATS AVIATION WEATHER BOOKLET
B-4 Version 3.2/Dec 08
LLWS low level wind shear
LN line
LOC location identifier
LO low
LRG large
LTG lightning
LTGCA lightning cloud to air
LTGCCCG lightning cloud to cloud
and cloud to ground
LTGCG lightning cloud to ground
LTGIC lightning in cloud
LTL little
LTLCHG little change
LVL level
LWR lower
LWRG lowering
LYR/LYRD layer/layered
M
M minus; less than
MALSR medium intensity
approach lighting system
MAX maximum
MDT/MOD moderate
MEGG merging
METAR aviation routine weather report
MI Michigan
MI miles
MI shallow
MO Missouri
MOGR moderate or greater
MOV move
MOVD moved
MOVG\MVG moving
MS Mississippi
MSL mean sea level
MST most
MSTLY mostly
MSTR moisture
MT mountains/Montana
MTN/MTNS mountain/mountains
MULTILYRD multi layered
MVFR Marginal Visual Flight Rules
MXD mixed
N
N north
ND North Dakota
NE Nebraska or northeast
NEG negative
NEWD northeastward
NJ New Jersey
NMRS numerous
NNEWD north-northeastward
NR near
NRLY nearly
NRN northern
NW northwest
NWD northward
NWLY northwesterly
O
OBSCD obscured
OBSCG obscuring

JPATS AVIATION WEATHER BOOKLET
Version 3.2/Dec 08 B-5
OBSCN obscuration
OCNL occasional
OCNLY occasionally
OMTS over mountains
OR Oregon
OTLK outlook
OTRW otherwise
OTS out of service
OVC overcast
OVHD overhead
OVR over
P
P plus; greater than
PCPN precipitation
PE ice pellets
PNHDL panhandle
PK peak
PK WND peak wind
PO well-developed dust/sand whirls
PR partial
PRCTN precautions
PRD period
PRES pressure
PRESFR pressure falling rapidly
PRESRR pressure rising rapidly
PSBL/POSS possible
PTN/PTNS portion/portions
PY spray
R
R runway
RA rain
RDG reading
REPTD/RPRTD/RPTD reported
RGD ragged
RMN remain
RMNDR remainder
RQR require
RTD routine delayed observation
RVR runway visual range
RVRNO RVR not available
RWU rain shower intensity unknown
RWY/RY runway
S
S south
SA sand
SCSL stratocumulus standing lenticular cloud
SCT scattered
SD South Dakota
SE southeast
SECS sections
SERN southeastern
SEWD southeastward
SEV/SVR severe
SFC surface
SG snow grains
SGFNT/SIG significant
SH shower(s)
SHD/SHLD should
SHFTG shifting
SHLW shallow
SHWRS showers

JPATS AVIATION WEATHER BOOKLET
B-6 Version 3.2/Dec 08
SIG CLD significant cloud
SKC sky clear
SLD solid
SLGT slight
SLP sea level pressure
SLPG sloping
SLPNO sea level pressure not available
SLY southerly
SM statute miles
SMTH smooth
SN snow
SPECI a special observation
SPRDG spreading
SQ squalls
SQLN squall line
SRN southern
SS sand storm
ST stratus
STFRA stratofractus
STG strong
STN station
STNRY stationary
SVRL several
SWD/SWRD/SWWD southwestward
SW snow showers or southwest
SYNS synopsis
T
TAF terminal aerodrome forecast
TCU towering cumulus
TE thunder ended
TEMPS temperatures
THN thin
THRU through
THSD thousand
TIL until
TS/TSTMS thunderstorms
TURB turbulence
TWR tower
U
UP unknown precipitation
UPR upper
UTC Coordinated Universal Time
UDDF updrafts and downdrafts
UNK/UNKN unknown
UNSTBL unstable
UP unknown precipitation
V
V variable
VA volcanic ash
VC/VCNTY vicinity
VFR Visual Flight Rules
VIS visibility
VLYS valleys
VOR Very high frequency
Omni-directional Range
VR visual range
VRB/VRBL variable
VRY very
VSBYDR visibility decreasing rapidly
VV vertical visibility
W

JPATS AVIATION WEATHER BOOKLET
Version 3.2/Dec 08 B-7
W west
WA Washington
WBND westbound
WDLY widely
WL will
WM warm
WND wind
WRN western
WS wind shear
WSCONDS wind shear conditions
WSHFT wind shift
WTRS waters
WX weather
X
XCP/XCPT except
XTNDG extending
Z
Z Zulu Time (UTC)
WIND DIRECTIONS (8 POINTS) N – NORTH –000° or 360°
NE – NORTHEAST – 045°
E – EAST – 090°
SE – SOUTHEAST – 135°
S – SOUTH – 180°
SW – SOUTHWEST –225°
W – WEST – 270°
NW – NORTHWEST –315°
For additional contractions, acronyms, and locations not found in this Appendix, consult Section 14 of the AC 00-45E, Aviation Weather Services, available at the following location:
http://www.faa.gov/avr/afs/afs400

JPATS AVIATION WEATHER BOOKLET
B-8 Version 3.2/Dec 08
This page intentionally left blank

JPATS AVIATION WEATHER BOOKLET
Version 3.2/Dec 08 C-1
APPENDIX C
LOCATION IDENTIFIERS KABI Abilene, TX
KABQ Albuquerque, NM
KABR Aberdeen, SD
KABY Albany, GA
KACT Waco, TX
KACY Atlantic City, NJ
KADM Ardmore, OK
KAEX England AFB, LA
KAGS Augusta, GA
KALO Waterloo, IA
KAMA Amarillo, TX
KANB Anniston, AL
KAND Anderson, SC
KAQQ Apalachicola, FL
KARG Walnut Ridge, AR
KART Watertown, NY
KATL Atlanta, GA
KAUG Augusta, TA
KAUS Austin, TX
KAVL Asheville, NC
KBAD Barksdale AFB LA
KBAL Baltimore, MD
KBFM Brookley VOR, AL
KBGS Big Springs, TX
KBHM Birmingham, AL
KBIS Bismarck, ND
KBIX Biloxi, MS
KBLD Boulder City, NV
KBLH Blythe, CA
KBNA Nashville, TN
KBOI Boise, ID
KBOS Boston, MA
KBPT Beaumont, TX
KBRO Brownsville, TX
KBSM Bergstrom AFB, TX
KBTR Baton Rouge, LA
KBWG Bowling Green KY
KCAE Columbia, SC
KCBM Columbus, MS
KCDW Caldwell, NJ
KCDS Childress, TX
KCEW Crestview, FL
KCHA Chattanooga, TN
KCHI Chicago, IL
KCHS Charleston, SC
KCID Ceder Rapids, IA
KCLL College Station, TX
KCLT Charlotte, NC
KCNU Chanute, KS
KCOT Cotulla, TX
KCOU Columbia, MO
KCRP Corpus Christi, TX
KCSV Crossville, TN
KCTY Cross City, FL
KCVG Cincinnati, OH
KDAB Daytona Beach, FL
KDAL Dallas, TX
KDCA Washington, DC
KDDC Dodge City, KS
KDFW Fort Worth, TX

JPATS AVIATION WEATHER BOOKLET
C-2 Version 3.2/Dec 08
KDHN Dothan, AL
KDLF Loughlin AFB, TX
KDOV Dover AFB, DE
KDRT Del Rio, TX
KDUA Durant, OK
KDYR Dyersburg, TN
KDYS Dyess AFB, TX
KEFD Ellington AFB, TX
KELP El Paso, TX
KEND Enid, OK
KEUG Eugene, OR
KFAT Fresno, CA
KFBG Fort Bragg, NC
KFDY Findley, OH
KFFO Wright Patterson AFB, OH
KFLO Florence, SC
KFMN Farmington, NM
KFMY Fort Myers, FL
KFOD Fort Dodge, IA
KFSI Fort Sill, OK
KFSM Fort Smith, AR
KFTY Fulton County VOR, GA
KFWH Carswell AFB, TX
KFYV Fayetteville, AR
KGAG Gage, OK
KGCK Garden City, KS
KGFA Great Falls, MT
KGFK Grand Forks, ND
KGGG Longview, TX
KGLS Galveston, TX
KGPT Gulfport, MS
KGRI Grand Island, NE
KGRK Gray AAF, TX
KGSO Greensboro, NC
KGUS Grissom AFB, IN
KGUY Guymon, OK
KGWO Greenwood, MS
KHAR Harrisburg, PA
KHAT Cape Hatteras, NC
KHLR Fort Hood AAF, TX
KHNN Henderson, WV
KHOT Hot Springs, AR
KHOU Houston, TX
KHQM Hoquiam, WA
KIAH Houston, TX
KICT Wichita, KS
KIGB Columbus, MS
KILM Wilmington, NC
KINK Wink, TX
KINL International Falls, MN
KJAN Jackson, MS
KJAX Jacksonville, FL
KLBE Latrobe, PA
KLBF North Platte, NE
KLBL Liberal, KS
KLCH Lake Charles, LA
KLEX Lexington, KY
KLFK Lufkin, TX
KLIT Little Rock, AR
KLRD Laredo, TX
KLRF Little Rock, AR
KLTS Altus, OK
KLUF Luke AFB, AZ
KMCB McComb, MS
KMEI Meridian, MS
KMEM Memphis, TN
KMGM Montgomery, AL
KMIA Miami, FL

JPATS AVIATION WEATHER BOOKLET
Version 3.2/Dec 08 C-3
KMKC Kansas City, MO
KMLB Melbourne, FL
KMLU Monroe, LA
KMOB Mobile, AL
KMOT Minot, ND
KMRB Martinsburg, WV
KMSP Minneapolis, MN
KMSY New Orleans, LA
KMXF Maxwell AFB, AL
KNBE Navy Dallas, TX
KNBU Navy Glenview, IL
KNBG New Orleans, LA
KNFB Navy Detroit, MI
KNFL NAS Fallon, NV
KNGZ NAS Alameda, CA
KNID NAF China Lake, CA
KNIP Navy Jacksonville, FL
KNKT MCAS Cherry Point, NC
KNKX NAS Miramar, CA
KNMM Navy Meridian, MS
KNPA Navy Pensacola, FL
KNQA Navy Memphis, TN
KNSE Navy Whiting Field, FL
KNSU NALF Monterey, CA
KNTD NAS Pt Mugu, CA
KNTU Navy Oceana, VA
KNUN NAS Saufley Field, FL
KNUW NAS Whidbey Island, WA
KNXX Navy Willow Grove, PA
KNZY NAS North Island, CA
KOFF Offutt AFB, NE
KOKC Oklahoma City, OK
KOKM Okmulgee, OK
KOMA Omaha, Ne
KONP Newport, OR
KORF Norfolk, VA
KORL Orlando, FL
KOUN Norman, OK
KOZR Cairns AFB, AL
KPAH Paducah, KY
KPAM Tyndall AFB, FL
KPBI Palm Beach, FL
KPDX Portland, OR
KPIE St. Petersburg, FL
KPHL Philadelphia, PA
KPHX Phoenix, AZ
KPIT Pittsburgh, PA
KPKB Parkersburg, WV
KPNS Pensacola, FL
KPOE Fort Polk, LA
KPRC Prescott, AZ
KPRX Paris, TX
KPSB Philipsburg, PA
KPUB Pueblo, CO
KPWM Portland, ME
KRAP Rapid City, SD
KRDR Grand Forks, ND
KRDU Raleigh, NC
KRIV March AFB, CA
KRND Randolph AFB, TX
KRNO Reno, NV
KRWI Rocky Mount, NC
KSAN San Diego, Ca
KSAT San Antonio, TX
KSBA Santa Barbara, CA
KSDF Louisville, KY
KSEA Seattle, WA
KSEM Craig AFB, AL

JPATS AVIATION WEATHER BOOKLET
C-4 Version 3.2/Dec 08
KSFO San Francisco, CA
KSGF Springfield, MO
KSHV Shreveport, LA
KSJT San Angelo, TX
KSKF Kelly AFB, CA
KSLC Salt Lake City, UT
KSLN Salina, KS
KSPS Sheppard AFB, TX
KSTL St. Louis, MO
KSUU Travis AFB, CA
KSVN Hunter AFB, GA
KTLH Tallahassee, FL
KTIK Tinker AFB, OK
KTOL Toledo, OH
KTOP Topeka, KS
KTPL Temple, TX
KTRI Bristol, TN
KTUL Tulsa, OK
KTUS Tucson, AZ
KVAD Moody AFB, GA
KVPS Eglin AFB, FL
KVRB Vero Beach, FL
KWRB Warner-Robbins AFB, GA
KWRI McGuire AFB, NJ
INTERNATIONAL IDENTIFIERS
EGLL Gatwick, England
PGUA Andersen AFB, Guam, Mariana Islands
LEMD Madrid, Spain
EDAH Amsterdam, Holland
STATE ABBREVIATIONS Alabama AL
Alaska AK
Arizona AZ
Arkansas AR
American Samoa AS
California CA
Colorado CO
Connecticut CT
Delaware DE
District of Columbia DC
Florida FL
Georgia GA
Guam GU
Hawaii HI
Idaho ID
Illinois IL
Indiana IN
Iowa IA
Kansas KS
Kentucky KY
Louisiana LA
Maine ME
Maryland MD
Massachusetts MA
Michigan MI
Minnesota MN
Mississippi MS
Missouri MO
Montana MT
Nebraska NE
Nevada NV
New Hampshire NH

JPATS AVIATION WEATHER BOOKLET
Version 3.2/Dec 08 C-5
New Jersey NJ
New Mexico NM
New York NY
North Carolina NC
North Dakota ND
Northern Mariana Island CM
Ohio OH
Oklahoma OK
Oregon OR
Pennsylvania PA
Puerto Rico PR
Rhode Island RI
South Carolina SC
South Dakota SD
Tennessee TN
Trust Territory TT
Texas TX
Utah UT
Vermont VT
Virginia VA
Virgin Islands VI
Washington WA
West Virginia WV
Wisconsin WI
Wyoming WY

JPATS AVIATION WEATHER BOOKLET
C-6 Version 3.2/Dec 08
This page intentionally left blank
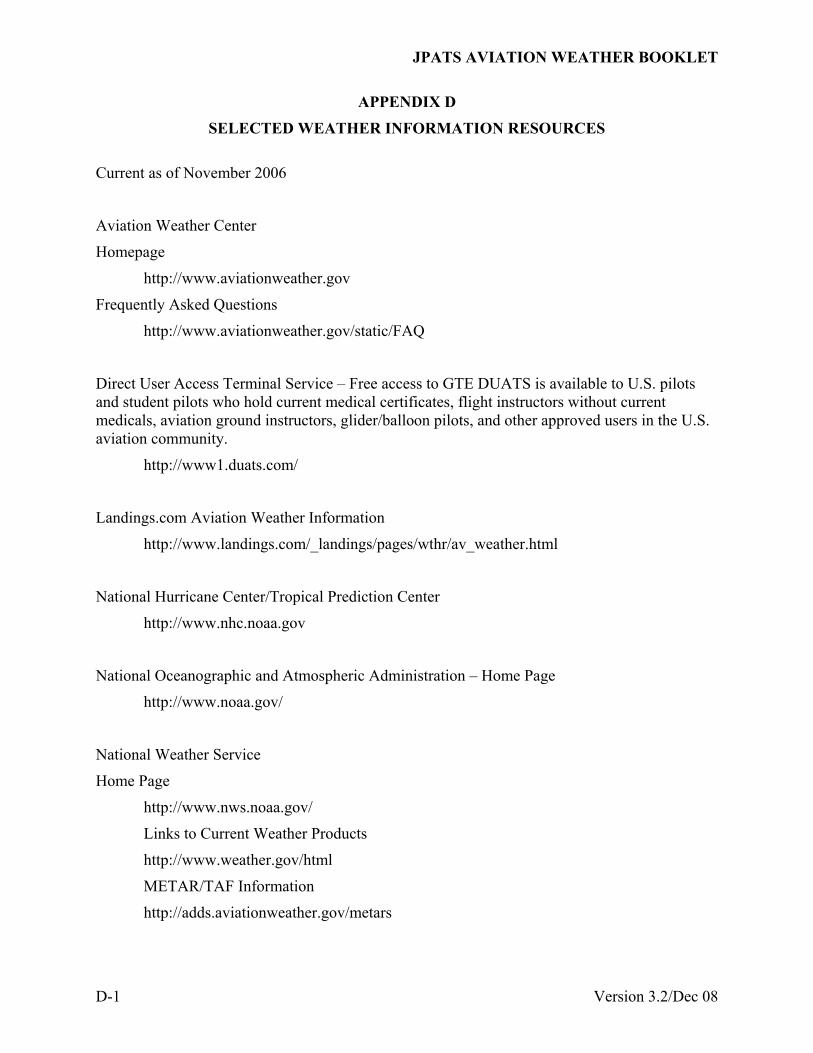
JPATS AVIATION WEATHER BOOKLET
D-1 Version 3.2/Dec 08
APPENDIX D
SELECTED WEATHER INFORMATION RESOURCES Current as of November 2006
Aviation Weather Center
Homepage
http://www.aviationweather.gov
Frequently Asked Questions
http://www.aviationweather.gov/static/FAQ
Direct User Access Terminal Service – Free access to GTE DUATS is available to U.S. pilots and student pilots who hold current medical certificates, flight instructors without current medicals, aviation ground instructors, glider/balloon pilots, and other approved users in the U.S. aviation community.
http://www1.duats.com/
Landings.com Aviation Weather Information
http://www.landings.com/_landings/pages/wthr/av_weather.html
National Hurricane Center/Tropical Prediction Center
http://www.nhc.noaa.gov
National Oceanographic and Atmospheric Administration – Home Page
http://www.noaa.gov/
National Weather Service
Home Page
http://www.nws.noaa.gov/
Links to Current Weather Products
http://www.weather.gov/html
METAR/TAF Information
http://adds.aviationweather.gov/metars

JPATS AVIATION WEATHER BOOKLET
Version 3.2/Dec 08 D-2
Naval Atlantic Meteorology and Oceanography Center home page – includes links to aviation weather and hurricane (tropical cyclone) data
http://www.nlmoc.navy.mil/
Storm Prediction Center
http://www.spc.noaa.gov/
USA Today Aviation Weather links
http://www.usatoday.com/weather/wpilots0.htm
The Weather Channel – Home Page
http://www.weather.com

JPATS AVIATION WEATHER BOOKLET
E-1 Version 3.2/Dec 08
APPENDIX E
ANSWER KEY

JPATS AVIATION WEATHER BOOKLET
Version 3.2/Dec 08 E-2
JX101 – ATMOSPHERIC STRUCTURE
Review Questions
1. A 11. C
2. B 12. D 3. D 13. A 4. B 14. D 5. B 15. B 6. C 16. D 7. B 17. C 8. C 18. D 9. D 19. .D 10. B 20. B
JX102 – Atmospheric Mechanics
Review Questions
1. C 12. dew point temperature
2. A 13. D
3. A 14. A
4. D 15. C
5. D 16. C
6. B 17. C
7. C 18. B
8. A 19. A
9. D 20. cumuliform;unstable
10. B 21. C
11. saturated 22. B

JPATS AVIATION WEATHER BOOKLET
E-3 Version 3.2/Dec 08
JX103 – Frontal Mechanics
Review Questions
1. D 5. A
2. B 6. A
3. A 7. C
4. C
8.
Type of Front Wind Shift Temperature
Change Pressure Change
Direction of Movement
Speed of Movement (kts)
Cloud Types Turbulence Conditions
Color Code
Warm
Front SE to SW Warmer Falls then
rises NE 15 Stratiform Smooth Red
Cold
Front SW to NW Colder Falls then
rises SE 20 Cumuliform Rough Blue
Warm
Front
Occlusion
SE to NW Warmer Falls then rises NE 15 Combination Combination Purple
Cold
Front
Occlusion
SE to NW Colder Falls then rises NE 20 Combination Combination Purple
Stationary Front 180° Either Falls then
rises None 0 to 5 Stratiform Smooth R & B

JPATS AVIATION WEATHER BOOKLET
Version 3.2/Dec 08 E-4
JX104 – Weather Hazards
Review Questions
1. A 14. D
2. D 15. A
3. B 16. E
4. B 17. B
5. A 18. C
6. B 19. D
7. A 20. B
8. B 21. B
9. B 22. A
10. D 23. B
11. A 24. A
12. C 25. C
13. A
JX105 – Thunderstorms
Review Questions
1. D 5. D
2. D 6. C
3. B 7. A
4. C
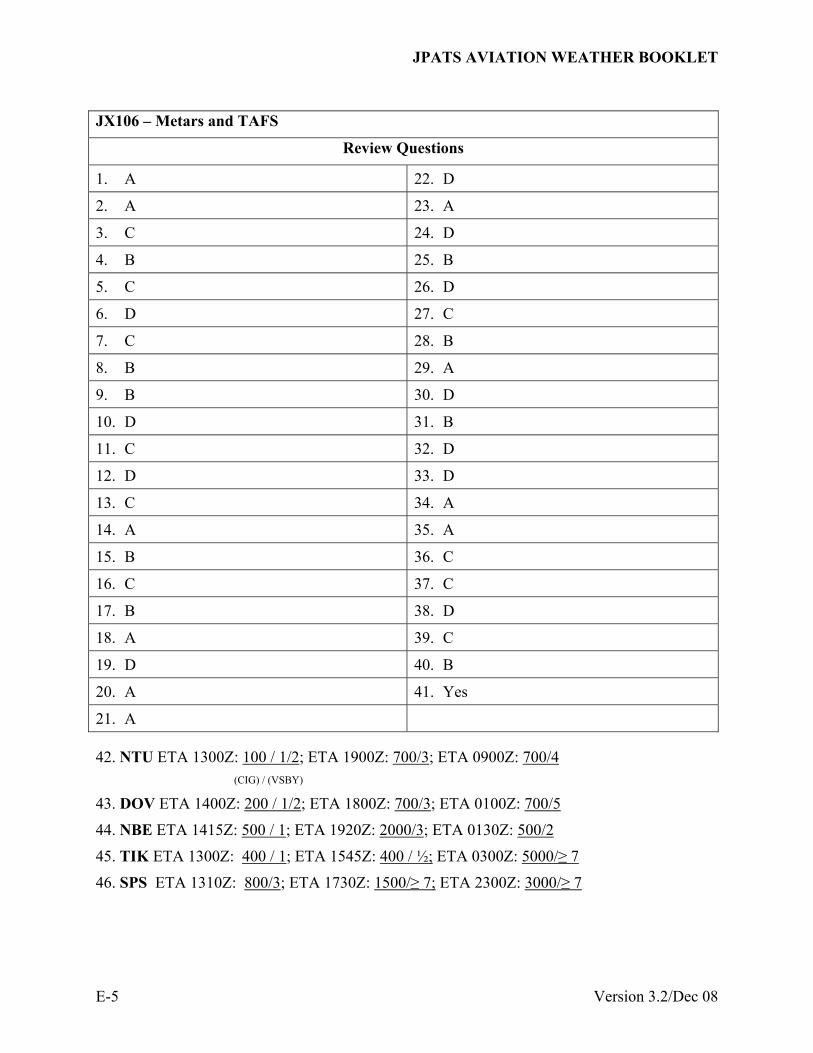
JPATS AVIATION WEATHER BOOKLET
E-5 Version 3.2/Dec 08
JX106 – Metars and TAFS
Review Questions
1. A 22. D
2. A 23. A
3. C 24. D
4. B 25. B
5. C 26. D
6. D 27. C
7. C 28. B
8. B 29. A
9. B 30. D
10. D 31. B
11. C 32. D
12. D 33. D
13. C 34. A
14. A 35. A
15. B 36. C
16. C 37. C
17. B 38. D
18. A 39. C
19. D 40. B
20. A 41. Yes
21. A 42. NTU ETA 1300Z: 100 / 1/2; ETA 1900Z: 700/3; ETA 0900Z: 700/4 (CIG) / (VSBY)
43. DOV ETA 1400Z: 200 / 1/2; ETA 1800Z: 700/3; ETA 0100Z: 700/5
44. NBE ETA 1415Z: 500 / 1; ETA 1920Z: 2000/3; ETA 0130Z: 500/2
45. TIK ETA 1300Z: 400 / 1; ETA 1545Z: 400 / ½; ETA 0300Z: 5000/≥ 7
46. SPS ETA 1310Z: 800/3; ETA 1730Z: 1500/≥ 7; ETA 2300Z: 3000/≥ 7

JPATS AVIATION WEATHER BOOKLET
Version 3.2/Dec 08 E-6
47. NQA/ETA 0700Z NBG/ETA 1600Z NMM/ETA 0730Z
2 HOUR WINDOW 06-08Z 15-17Z 0630-0830Z
CEILING (MIN) 800 2500 NONE .
VISIBILITY (MIN)/WEATHER(S) 1 / TSHRA ≥ 7 / None 1 / BR .
ALTIMETER (LOWEST) 30.08 30.25 30.18 .
WINDS (MAX) 200/25G35 130/12 CALM .
ICING (TYPE/ALTITUDES) NONE / MOD IN CLD / NONE /
N/A 13-22K FT N/A .
TURB (TYPE/ALTITUDES) NONE / MOD IN CLR OCNL/ SEV IN CLR /
N/A 13-16K FT 20-25K FT
48. A. NQA - Yes
B. NBG - No
C. NMM - Yes
49. A. NQA - Yes
B. NBG - Yes
C. NMM - Yes
50. A. NQA - Ceilings and visibility
B. NBG - Ceilings only
C. NMM - Visibility only