Embed Size (px)
Citation preview
June 1, 2015 Jon Hilliard Project Manager California Energy Commission 1516 Ninth Street Sacramento, CA 95814‐5512
Subject: Puente Power Project (15‐AFC‐01) Data Adequacy Supplemental Response Dear Mr. Hilliard:
NRG Energy Center Oxnard LLC (NECO) is pleased to submit the enclosed supplemental information in
response to the California Energy Commission’s (CEC) May 13, 2015 Data Adequacy Recommendation
(TN #204615) for the Puente Power Project (15‐AFC‐01). In the Data Adequacy Recommendation, CEC
requested additional information in the areas of Air Quality, Public Health and Transmission System
Design. The attached Data Adequacy Supplemental Response provides the requested information.
If you have any questions regarding this submittal, please do not hesitate to contact me at (760) 710‐
2156 or Anne Connell at (415) 243‐3892.
Best Regards,
George L. Piantka, PE Director, Regulatory Environmental Services Attachment cc: Dawn Gleiter, NRG
Michael Carroll, Latham & Watkins Anne Connell, AECOM
NRG Energy Center Oxnard LLC 5790 Fleet Street, Suite 200 Carlsbad, CA 92008 Phone: 760‐710‐2156 Fax: 760‐710‐2158
Application for Certification(15-AFC-01)
Puente Power Project (P3)Oxnard, CA
Submitted to:The California Energy Commission
Data Adequacy Supplemental Response
Prepared by:
i
Puente Power Project
Application for Certification (15-AFC-01)
Data Adequacy Supplemental Response
CONTENTS
Air Quality………………………..………………………………………………….AQ-1 through AQ-10
Public Health…………………………………………………………………………………….…….PH-1
Transmission System Design………………………………………………………..…..TSD-1 and TSD-2
FIGURES
Revised Figure 2.7-a: Single-Line Diagram – Existing Switchyard
Revised Figure 2.7-b: Single-Line Diagram – P3 Unit
ATTACHMENTS
Attachment AQ-1: Applicant’s Response to VCAPCD Incomplete Application Notification
Attachment AQ-2: VCAPCD Complete Application Notice
Attachment AQ-3: Corrected Air Quality Section 4.1 Tables 4.1-1 to 4.1-38
Attachment PH-1: Summary of Potential Health Risks
Attachment TSD-1: CAISO Facilities Study

AIR QUALITY

AQ-1
Puente Power Project (15-AFC-01)
Response to Staff's Data Adequacy Recommendation
Air Quality
Siting Regulation: Appendix B(g)(8)(A)
The information necessary for the air pollution control district where the project is located to
complete a Determination of Compliance.
Information Required to Make AFC Conform with Regulations
The Ventura County Air Pollution Control District issued its incompleteness letter for the P3
project April 15, 2015. Information still needed, per district rules, are: Mandalay Unit 1 and 2 fuel
use data for 2010 through 2014, identification of offsets and whether they are “surplus at time of
use,” certification of applicant’s other California permits being in compliance, an alternatives
analysis, and a justification that the electrical function of the new turbine would be considered a
“replacement emission unit.”
Response:
Please see Applicant’s May 15, 2015 response to information requested from Ventura County Air
Pollution Control District (VCAPCD) (see Attachment AQ-1).
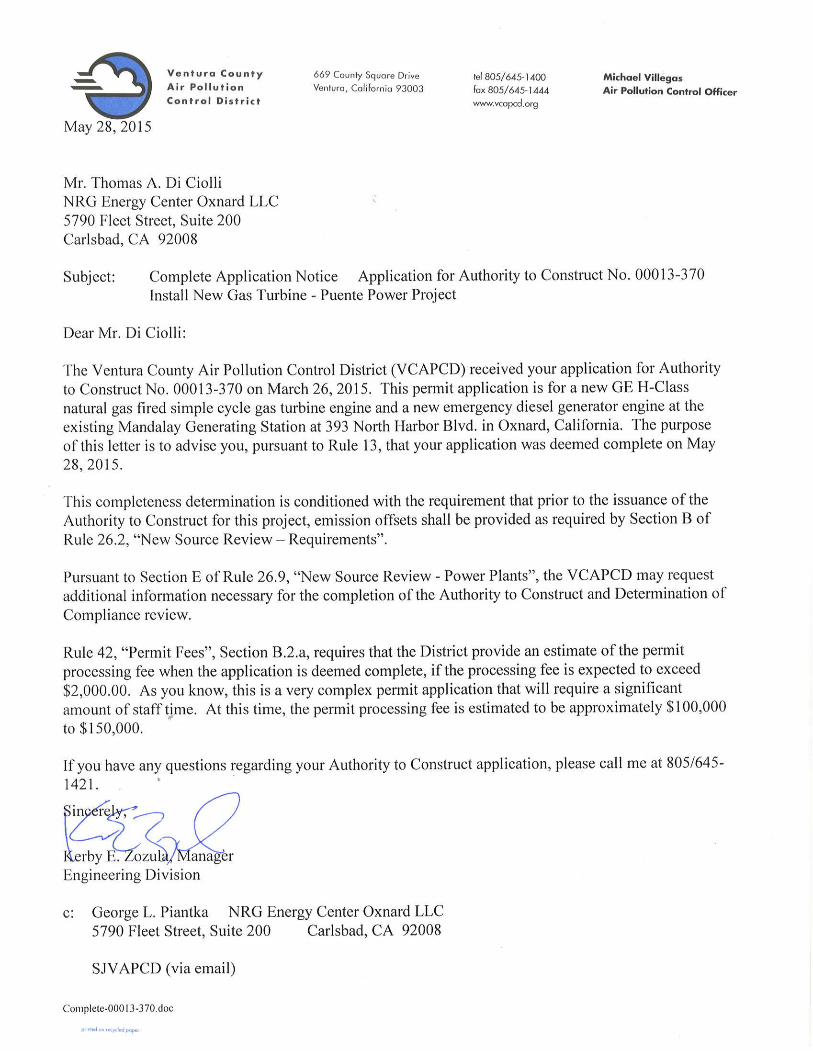
On May 28, 2015, VCAPCD issued the Complete Application Notice for the Puente Power
Project Application for Authority to Construct (see Attachment AQ-2).
ATTACHMENT AQ-1
APPLICANT’S RESPONSE TO VCAPCD INCOMPLETE APPLICATION
NOTIFICATION
Ventura County
Air Pollution
Control District
April JS, 2015
Mr. Thomas A. DiCiolli NRG Energy Center Oxnard LLC 5790 Fleet Street, Suite 200 Carlsbad, CA 92008
669 (oLmfy Square Drive Venturo, California 93003
tel 805/645· l 400 fox 805/645-1444 www.vcopcd.org
INCOMPLETE APPLICATION NOTIFICATION
Authority to Construct Application No. 00013-370
Install New Gas Turbine: Puente Power Project 393 North Harbor Blvd. Oxnard, CA 93035
Michael Villegas Air Pollution Control Officer
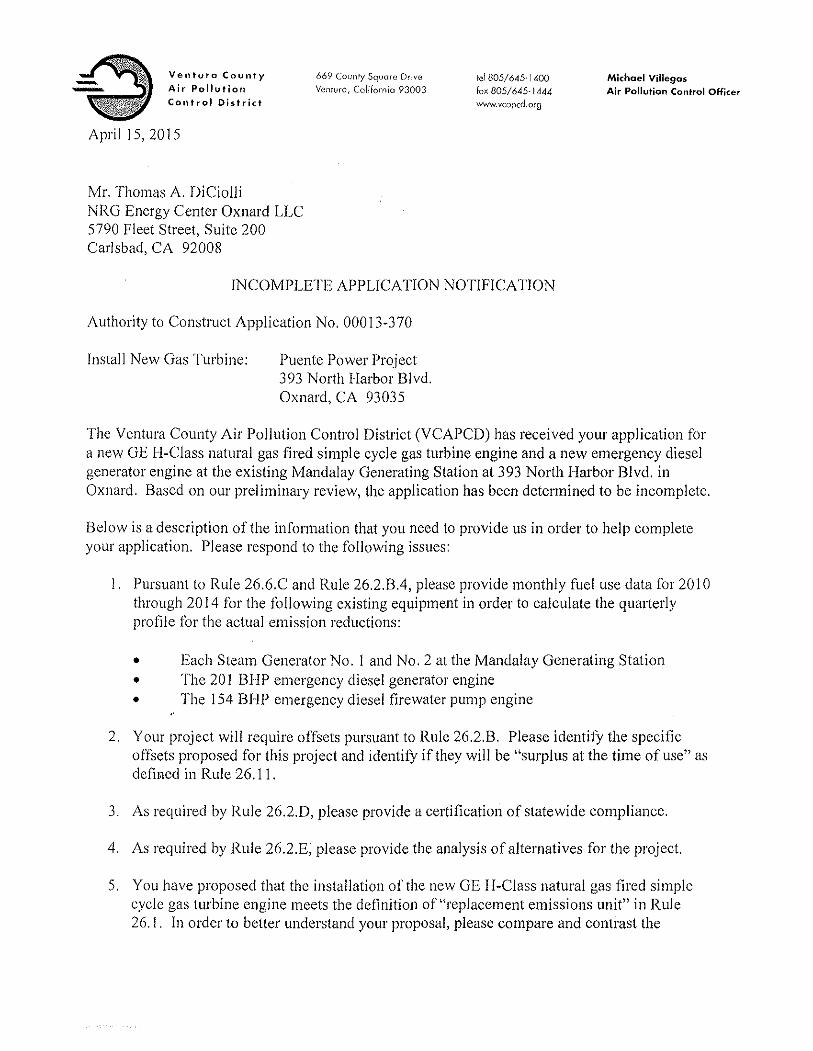
The Ventura County Air Pollution Control District (VCAPCD) has received your application for a new GE H-Class natural gas fired simple cycle gas turbine engine and a new emergency diesel generator engine at the existing Mandalay Generating Station at 393 North Harbor Blvd. in Oxnard. Based on our preliminary review, the application has been determined to be incomplete.
Below is a description of the information that you need to provide us in order to help complete your application. Please respond to the following issues:
l. Pursuant to Rule 26.6.C and Rule 26.2.B.4, please provide monthly fuel use data for 2010 through 20 l 4 for the following existing equipment in order to calculate the qumterly profile for the actual emission reductions:
• Each Steam Generator No. 1 and No. 2 at the Mandalay Generating Station • The 20 I BHP emergency diesel generator engine • The 154 BHP emergency diesel firewater pump engine
2. Your project will require offsets pursuant to Rule 26.2.B. Please identify the specific offsets proposed for this project and identify if they will be "surplus at the time of use" as defo1ed in Rule 26. I I.
3. As required by Rule 26.2.D, please provide a certification of statewide compliance.
4. As required by Rule 26.2.E, please provide the analysis of alternatives for the project.
5. You have proposed that the installation of the new GE H-Class natural gas fired simple cycle gas turbine engine meets the definition of "replacement emissions unit" in Rule 26. J. In order to better understand your proposal, please compare and contrast the
electrical functions of the new gas turbine engine, existing Stearn Generator Nos. I and 2, existing Turbine Peaking Unit No. 3, and the existing nearby McGrath Beach Turbine Peaking Unit owned and operated by Southern California Edison.
Please review these items carefully and mail the requested information to:
Ventura County Air Pollution Control District 669 County Square Drive, 2"d Floor
Ventura, CA 93003 Attention: Kerby E. Zazula
Please be aware that we cannot complete the processing of your application until we receive the requested information. On further review of your application, we may determine that more information is needed to complete it.
lfyou have any questions, or wish to discuss this matter in further detail, please call me at 805/645-1421.
sz:·~;~ __ /, C7 \_.---v/_( y'
Kerby E. Zo~l.i( Manager Engineering Division
c: George L. Piantka NRG Energy Center Oxnard LLC 5790 Fleet Street, Suite 200 Carlsbad, CA 92008
S.JVAPCD
lncomplcteApplicntion-NRG PPP-AC 00013-370.doc
May 15, 2015 Kerby E. Zozula
Manager, Engineering Division
Ventura County Air Pollution Control District
669 County Square Drive, 2nd Floor
Ventura, CA 93003 Subject: Application for an Authority to Construct/Determination of Compliance for the
Proposed Puente Power Project (P3) Dear Mr. Zozula: NRG Energy Center Oxnard LLC is pleased to submit the following responses to the information
requested in Ventura County Air Pollution Control District’s (VCAPCD) April 15, 2015 letter regarding the
March 19, 2015 Authority to Construct (ATC)/Determination of Compliance (DOC) application package
(Application 00013‐370) for the proposed Puente Power Project (P3).
Request 1: Pursuant to Rule 26.6C and Rule 26.2.B.4, please provide monthly fuel use data for 2010
through 2014 for the following existing equipment in order to calculate the quarterly profile for the
actual emission reductions:
East Steam Generator No. 1 and No. 2 at the Mandalay Generating Station
The 201 BHP emergency diesel generator engine
The 154 BHP emergency diesel firewater pump engine
Response: The monthly fuel use data from 2010 through 2014 for the existing combustion equipment at
the Mandalay Generating Station are included in Attachment 1.
Request 2: Your project will require offsets pursuant to Rule 26.2.B. Please identify the specific offsets
proposed for this project and identify if they will be “surplus at the time of use” as defined in Rule 26.11.
Response: The NOx emission reduction credits (ERCs) totaling approximately 52.7 tons/year that will be
used for the P3 (on an as‐needed basis) are Southern California Edison Company ERC certificate
numbers 1078, 1079, 1080, 1083, 1084, 1085, 1091, 1092, 1094, 1097, 1104, 1107, and 1109. With
NRG Energy Center Oxnard LLC 5790 Fleet Street, Suite 200 Carlsbad, CA 92008 Phone: 760‐710‐2156 Fax: 760‐710‐2158
Mr. Kerby Zozula, VCAPCD May 15, 2015 Page 2 regard to the amount of these ERCs that will be “surplus at the time of use,” under Rule 26.11.C.6 this
ERC surplus determination is not required for permitting actions occurring during periods when the
annual equivalency demonstrations prepared by the VCAPCD show a positive balance. We note that the
April 2014 annual equivalency demonstration prepared by the VCAPCD showed a positive year‐end
balance of 53.27 tons per year of ROC and 33.37 tons per year of NOx. Based on this result, new major
sources and major modifications are exempt from the NOx/ROC ERC surplus determination until the
submission of the next annual equivalency demonstration. While the results of the 2015 annual
equivalency demonstration may show that an ERC surplus determination is not necessary for the P3, we
are currently in the process of collecting the necessary background information on the above ERCs to
make this determination. We expect to have this analysis completed within approximately two weeks
and will submit the results to the VCAPCD at that time.
Request 3: As required by Rule 26.2.D, please provide a certification of statewide compliance.
Response: Enclosed as Attachment 2 is the statewide compliance certification letter.
Request 4: As required by Rule 26.2.E, please provide the analysis of alternatives for the project.
Response: An analysis of alternatives was included as Section 5 of the Application for Certification (AFC)
for the P3 filed with the California Energy Commission on April 15, 2015. An electronic copy of the AFC
is included in the enclosed compact disc. Section 5 of the AFC is provided as Attachment 3.
Request 5: You have proposed that the installation of the new GE H‐Class natural gas‐ fired, simple‐
cycle gas turbine meets the definition of “replacement emissions unit” in Rule 26.1. In order to better
understand your proposal, please compare and contrast the electrical functions of the new gas turbine
engine, existing Steam Generator Nos. 1 and 2, existing Turbine Peaking Unit No. 3, and the existing
nearby McGrath Beach Turbine Peaking Unit owned and operated by Southern California Edison.
Response: Provided below is a summary of the electrical functions of Mandalay Units 1‐3, the McGrath
Peaking Unit, and the proposed new H‐Class combustion turbine generator (CTG).
Mandalay Units 1 and 2 and the New H‐Class CTG: Mandalay Units 1 and 2 are natural gas‐fired steam boiler generating units with a combined nominal generating capacity of approximately 430 MW (net). The proposed new unit is a natural gas‐fired simple‐cycle CTG with a nominal generating capacity of approximately 262 MW (net). As is the case with Units 1 and 2, the new CTG will be connected to the SCE 220‐kV switchyard (located adjacent to the project site). This switchyard is connected to the SCE Santa Clara substation, which is part of the high‐voltage grid system serving the Big Creek/Ventura local reliability area. The new CTG will perform the same electrical function as is currently being performed by Mandalay Units 1 and 2. This function is to provide dispatchable power to the high‐voltage 220‐kV system mainly to provide voltage support to the Big Creek/Ventura local reliability area and to meet long‐term capacity requirements. This voltage support is necessary to help maintain the grid stability needed due
Mr. Kerby Zozula, VCAPCD May 15, 2015 Page 3
to the intermittent operating nature of renewable generating sources (i.e., wind and solar power). The identical function of the new CTG and Mandalay Units 1 and 2 is supported by the similar number of annual startups and operating hours for the new and existing units. The new CTG is expected to undergo approximately 200 startups per year and be operated a total of approximately 2,453 hours per year. Over the past five years (2010 to 2014), Mandalay Units 1 and 2 have undergone a combined average of approximately 175 startups per year and operated a total of approximately 2,370 hours per year (these are hours synchronized to the grid). The advantage of the new CTG is that it can provide this grid support more efficiently by burning less fuel on a per‐MW basis, with a faster response time, and with lower maintenance costs compared to Mandalay Units 1 and 2.
Mandalay Unit 3 and the McGrath Peaking Unit: Mandalay Unit 3 is a natural gas‐fired simple‐cycle CTG with a nominal generating capacity of approximately 130 MW (net). The existing SCE McGrath Peaking Unit is a natural gas‐fired simple‐cycle CTG with a nominal generating capacity of approximately 47 MW. Both Mandalay Unit 3 and the McGrath Peaking Unit are connected to the SCE 66‐kV switchyard (located on the east side of North Harbor Blvd from the project site). This switchyard is connected to several SCE substations including the Santa Clara, Silver Strand, Gonzales, and San Miguel substations. Both Mandalay Unit 3 and the McGrath Peaking Unit provide the same electrical function, which is to provide local grid support due to system upsets such as the sudden loss of a generating unit or failure of a transmission line. Both units were designed with black start capability (i.e., the ability to startup without utility power) to help bring the grid back on‐line due to a total system failure. It should be noted that while Mandalay Unit 3 is designed for black start capability, it would likely require the replacement of startup batteries for this unit to actually be able to achieve a black start. Due to the type of support provided to the grid, both Mandalay Unit 3 and the McGrath Peaking Unit will operate a limited number of hours per year. For example, over the past five years (2010 to 2014) Mandalay Unit 3 has undergone an average of approximately 22 startups per year and operated a total of approximately 60 hours per year (these are hours synchronized to the grid). Because Mandalay Unit 3 is an older‐generation CTG compared to the McGrath Peaking Unit, the McGrath Peaking Unit would be more efficient to operate compared to Unit 3.
In addition to the above responses, please note that the screening‐level health risk assessment (HRA)
results in the April 15, 2015 AFC (see Section 4.9 ‐ Public Health) are based on the recently issued HARP2
model, whereas the HRA results in the March 19, 2015 ATC/DOC permit application package were based
on the earlier version of the HARP model. Therefore, we request that the VCAPCD use the HRA results
in the AFC. The detailed HARP2 modeling files are included in the enclosed air quality modeling compact
disc. This disc also includes the criteria pollutant modeling files, which are identical to the files
submitted as part of the ATC/DOC permit application package.
It is our intention that the additional information provided will enable VCAPCD to issue a “completeness
determination” with respect to Authority to Construct Application No, 00013‐370. Such a letter will
assist in meeting the CEC’s Data Adequacy determination that is currently pending. CEC Data Adequacy
is an important milestone in the processing of the AFC.
For the purposes of deeming the P3 ATC/DOC application package complete, we believe the VCAPCD
can complete its completeness determination based on our application and the additional information
Mr. Kerby Zozula, VCAPCD May 15, 2015 Page 4 we have provided herein. If you have any questions or need any additional information, please do not
hesitate to contact me at 760‐710‐2156 or Tom Andrews of Sierra Research at 916‐273‐5139.
Sincerely,
George L. Piantka, PE
Director, Regulatory Environmental Services
NRG West Region
Attachments
cc: Jon Hilliard, CEC
Gerry Bemis, CEC
CEC Dockets (15‐AFC‐01)
Leonard Scandura, SJVAPCD
Leland Villalvazo, SJVAPCD
Tom Andrews, Sierra Research
Michael J. Carroll, Latham & Watkins
Anne Connell, AECOM

ATTACHMENT 1
MONTHLY FUEL USE SUMMARIES FOR MANDALAY GENERATING STATION (2010 To 2014)
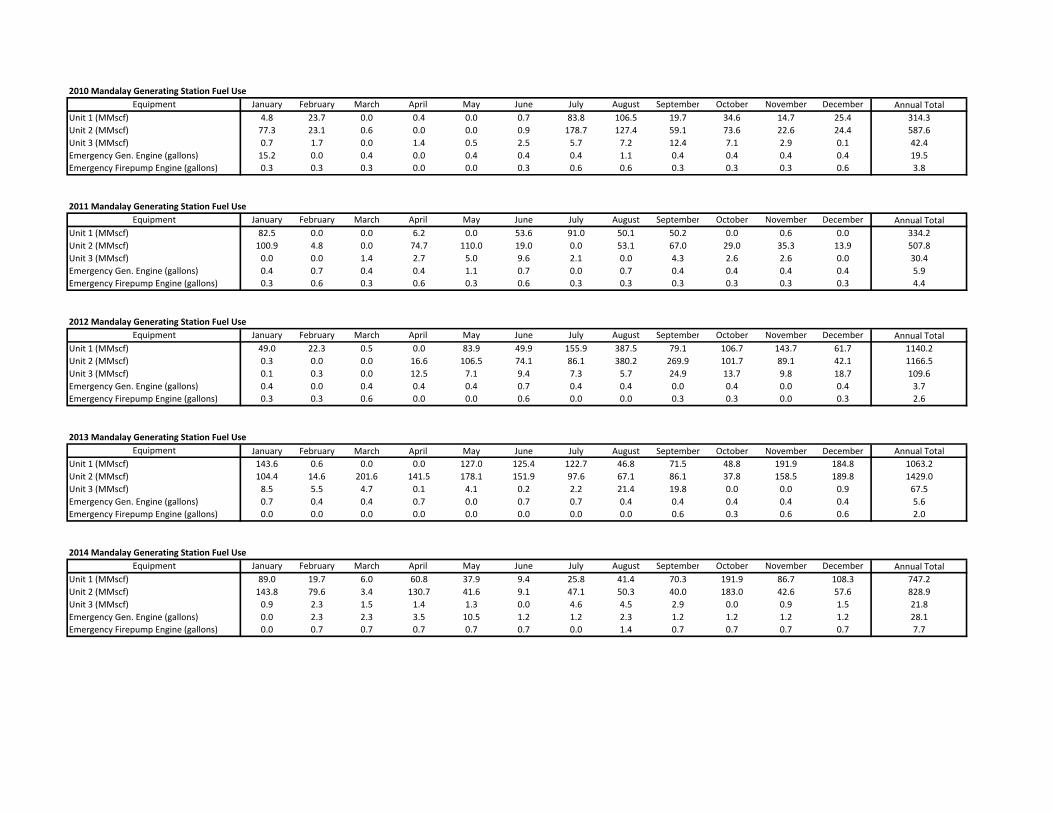
2010 Mandalay Generating Station Fuel UseEquipment January February March April May June July August September October November December Annual Total
Unit 1 (MMscf) 4.8 23.7 0.0 0.4 0.0 0.7 83.8 106.5 19.7 34.6 14.7 25.4 314.3Unit 2 (MMscf) 77.3 23.1 0.6 0.0 0.0 0.9 178.7 127.4 59.1 73.6 22.6 24.4 587.6Unit 3 (MMscf) 0.7 1.7 0.0 1.4 0.5 2.5 5.7 7.2 12.4 7.1 2.9 0.1 42.4Emergency Gen. Engine (gallons) 15.2 0.0 0.4 0.0 0.4 0.4 0.4 1.1 0.4 0.4 0.4 0.4 19.5Emergency Firepump Engine (gallons) 0.3 0.3 0.3 0.0 0.0 0.3 0.6 0.6 0.3 0.3 0.3 0.6 3.8
2011 Mandalay Generating Station Fuel UseEquipment January February March April May June July August September October November December Annual Total
Unit 1 (MMscf) 82.5 0.0 0.0 6.2 0.0 53.6 91.0 50.1 50.2 0.0 0.6 0.0 334.2Unit 2 (MMscf) 100.9 4.8 0.0 74.7 110.0 19.0 0.0 53.1 67.0 29.0 35.3 13.9 507.8Unit 3 (MMscf) 0.0 0.0 1.4 2.7 5.0 9.6 2.1 0.0 4.3 2.6 2.6 0.0 30.4Emergency Gen. Engine (gallons) 0.4 0.7 0.4 0.4 1.1 0.7 0.0 0.7 0.4 0.4 0.4 0.4 5.9Emergency Firepump Engine (gallons) 0.3 0.6 0.3 0.6 0.3 0.6 0.3 0.3 0.3 0.3 0.3 0.3 4.4
2012 Mandalay Generating Station Fuel UseEquipment January February March April May June July August September October November December Annual Total
Unit 1 (MMscf) 49.0 22.3 0.5 0.0 83.9 49.9 155.9 387.5 79.1 106.7 143.7 61.7 1140.2Unit 2 (MMscf) 0.3 0.0 0.0 16.6 106.5 74.1 86.1 380.2 269.9 101.7 89.1 42.1 1166.5Unit 3 (MMscf) 0.1 0.3 0.0 12.5 7.1 9.4 7.3 5.7 24.9 13.7 9.8 18.7 109.6Emergency Gen. Engine (gallons) 0.4 0.0 0.4 0.4 0.4 0.7 0.4 0.4 0.0 0.4 0.0 0.4 3.7Emergency Firepump Engine (gallons) 0.3 0.3 0.6 0.0 0.0 0.6 0.0 0.0 0.3 0.3 0.0 0.3 2.6
2013 Mandalay Generating Station Fuel UseEquipment January February March April May June July August September October November December Annual Total
Unit 1 (MMscf) 143.6 0.6 0.0 0.0 127.0 125.4 122.7 46.8 71.5 48.8 191.9 184.8 1063.2Unit 2 (MMscf) 104.4 14.6 201.6 141.5 178.1 151.9 97.6 67.1 86.1 37.8 158.5 189.8 1429.0Unit 3 (MMscf) 8.5 5.5 4.7 0.1 4.1 0.2 2.2 21.4 19.8 0.0 0.0 0.9 67.5Emergency Gen. Engine (gallons) 0.7 0.4 0.4 0.7 0.0 0.7 0.7 0.4 0.4 0.4 0.4 0.4 5.6Emergency Firepump Engine (gallons) 0.0 0.0 0.0 0.0 0.0 0.0 0.0 0.0 0.6 0.3 0.6 0.6 2.0
2014 Mandalay Generating Station Fuel UseEquipment January February March April May June July August September October November December Annual Total
Unit 1 (MMscf) 89.0 19.7 6.0 60.8 37.9 9.4 25.8 41.4 70.3 191.9 86.7 108.3 747.2Unit 2 (MMscf) 143.8 79.6 3.4 130.7 41.6 9.1 47.1 50.3 40.0 183.0 42.6 57.6 828.9Unit 3 (MMscf) 0.9 2.3 1.5 1.4 1.3 0.0 4.6 4.5 2.9 0.0 0.9 1.5 21.8Emergency Gen. Engine (gallons) 0.0 2.3 2.3 3.5 10.5 1.2 1.2 2.3 1.2 1.2 1.2 1.2 28.1Emergency Firepump Engine (gallons) 0.0 0.7 0.7 0.7 0.7 0.7 0.0 1.4 0.7 0.7 0.7 0.7 7.7
ATTACHMENT 2
STATEWIDE COMPLIANCE CERTIFICATION LETTER
ATTACHMENT 3
SECTION 5, ALTERNATIVES – PUENTE POWER PROJECT APPLICATION FOR CERTIFICATION
Application for Certification
Puente Power Project (P3)Oxnard, CA
Submitted to:The California Energy Commission
Volume I
Prepared by:
Puente Power Project Application for Certification 5.0 Alternatives
R:\15 P3\5_0 Alts.docx Page 5-1 April 2015
5.0 ALTERNATIVES
5.1 INTRODUCTION
The California Environmental Quality Act (CEQA) requires environmental documents to consider “a range of reasonable alternatives to the project, or to the location of the project, which would feasibly attain most of the basic objectives of the project but would avoid or substantially lessen any of the significant effects of the project, and evaluate the comparative merits of the alternatives” (14 California Code of Regulations [CCR] 15126.6[a]). Therefore, the focus of an alternatives analysis should be on alternatives that “could feasibly accomplish most of the basic objectives of the project and could avoid or substantially lessen one or more of the significant effects” (14 CCR 15126.6(c)). The CEQA Guidelines further provide that “[a]mong the factors that may be used to eliminate alternatives from detailed consideration in an EIR [Environmental Impact Report] are: (i) failure to meet most of the basic project objectives, (ii) infeasibility, or (iii) inability to avoid significant environmental impacts” (14 CCR 15126.6(c)).
A range of reasonable alternatives to the proposed Puente Power Project (P3 or project), or certain elements thereof, is identified and evaluated in this section. These alternatives include:
• The “No Project” alternative (that is, not developing a new power generation facility); • Alternative generation technologies and configurations; • Alternative sources of water supply; • Alternative wastewater handling systems; and • Alternative emission control technologies.
5.2 PROJECT OBJECTIVES
Applicant has identified several basic objectives for the development of P3:
• Fulfill Applicant’s obligations under its 20-year Resource Adequacy Purchase Agreement (RAPA) with Southern California Edison (SCE) requiring development of 262 megawatts (MW) nominal net output of newer, more flexible and efficient natural gas generation at the site of the existing Mandalay Generating Station (MGS);
• Provide an efficient, reliable, and predictable power supply by using a simple-cycle, natural-gas–fired combustion turbine to replace the existing once-through cooling (OTC) generation;
• Support the local capacity requirements of the California Independent System Operator Big Creek/Ventura Local Capacity Reliability area;
• Develop a 262-MW nominal net power generation plant that provides efficient operational flexibility with rapid-start and fast-ramping capability to allow for efficient integration of renewable energy sources in the California electrical grid;
• Be designed, permitted, built, and commissioned by June 1, 2020;
• Minimize environmental impacts and development costs by developing on an existing brownfield site and reusing existing transmission, water, wastewater, and natural gas infrastructure;
• Site the project on property that has an industrial land use designation with consistent zoning; and
• Safely produce electricity without creating significant environmental impacts.
Puente Power Project Application for Certification 5.0 Alternatives
R:\15 P3\5_0 Alts.docx Page 5-2 April 2015
Project objectives play an important role in determining what constitutes a range of reasonable alternatives to the proposed project. “Under the case law applying CEQA’s definition of feasibility, ‘[al]though a lead agency may not give a project’s purpose an artificially narrow definition, a lead agency may structure its EIR alternative analysis around a reasonable definition of underlying purpose and need not study alternatives that cannot achieve that basic goal.’” Surfrider Found. v. State Water Res. Control Bd. (2012) 211 Cal. App. 4th 557, 583 (citation omitted). Furthermore, what constitutes a reasonable range of alternatives must be determined in light of the specific context and circumstances under which a project is proposed. “‘CEQA establishes no categorical legal imperative as to the scope of alternatives to be analyzed in an EIR. Each case must be evaluated on its facts, which in turn must be reviewed in light of the statutory purpose.’ … There is no ironclad rule governing the nature or scope of the alternatives to be discussed other than the rule of reason.” Watsonville Pilots Assn. v. City of Watsonville (2010) 183 Cal. App. 4th 1059, 1086 [citations omitted].
Although all of the project objectives should be taken into consideration when evaluating alternatives to the proposed project, the first project objective identified above is particularly important. It reflects the context in which the State of California plans for and procures its electricity supply. The RAPA is the end result of the California Public Utility Commission’s (CPUC) Long-Term Procurement Plan; CPUC decisions authorizing the procurement of electricity by the state’s investor-owned utilities; and the Request for Offers (RFO) process conducted pursuant to those authorizations. Through the RFO process, the utility evaluates a range of alternatives and awards RAPAs that are technology-specific and location-specific to those projects best suited to meet its needs. The RAPAs are then reviewed and approved by the CPUC. It is then incumbent upon the developer to deliver the project consistent with the terms of the RAPA. Therefore, this objective is not merely a goal or aspiration of the project developer, but a legal imperative. This must be kept in mind when determining what constitutes a range of reasonable alternatives, as well as which alternatives might be considered feasible. Alternatives that fail to satisfy the first project objective are neither reasonable nor feasible, and extensive analysis of such alternatives is unwarranted.
5.3 NO PROJECT ALTERNATIVE
5.3.1 Description
The No Project Alternative “provides the decision makers and the public with specific information about the environment if the project is not approved. It is a factually based forecast of the environmental impacts of preserving the status quo.” Planning & Conservation League v. Department of Water Resources (2000) 83 Cal. App. 4th 892, 917, 918. In this case, P3 is intended to replace the generation currently provided by MGS Units 1 and 2. Because there are currently no other gas-fired projects proposed for development in the area, in the absence of P3, MGS Units 1 and 2 may continue to be needed to meet local reliability needs. However, the State Water Resources Control Board’s (SWRCB) Statewide Water Quality Control Policy on the Use of Coastal and Estuarine Waters for Power Plant Cooling, also referred to as the OTC Policy, requires that MGS Units 1 and 2 either cease use of ocean water for cooling or reduce the impacts of OTC to a level commensurate with closed-cycle cooling by December 31, 2020. Therefore, the No Project Alternative would be MGS Units 1 and 2 continuing to operate, but with an alternative cooling system that meets the requirements of the OTC Policy.
Prior to the decision to replace MGS Units 1 and 2 with P3, a number of alternative cooling systems for MGS Units 1 and 2 were evaluated (GenOn, 2011). The Mandalay Generating Station 2011 Implementation Plan for the OTC Policy evaluated closed-cycle wet-cooling options using salt (ocean) water and fresh water, including recycled water. Due to logistical, technical, and permitting/environmental constraints, all closed-cycle wet-cooling options were determined to be infeasible. The 2011 Implementation Plan did not evaluate retrofitting MGS Units 1 and 2 with dry cooling. Ultimately, the 2011 Implementation Plan outlined compliance with the OTC Policy through implementation of
Puente Power Project Application for Certification 5.0 Alternatives
R:\15 P3\5_0 Alts.docx Page 5-3 April 2015
technological and/or operational measures to reduce impingement and entrainment to required levels. This approach requires a 3-year impingement and entrainment monitoring program to establish baseline conditions against which to evaluate the effectiveness of the proposed technological and/or operational measures. On May 14, 2012, the compliance strategy laid out in the 2011 Implementation Plan was changed to the current strategy of replacing MGS Units 1 and 2 with new dry-cooled generation (GenOn, 2012).
In the event that P3 did not move forward (i.e., the No Project Alternative), it would be necessary to revisit alternative OTC Policy-compliant cooling systems for MGS Units 1 and 2. The circumstances affecting the feasibility of closed-cycle wet cooling have not changed materially since development of the 2011 Implementation Plan, and those technologies continue to be infeasible. One option would be to revert to the Track 2 compliance strategy laid out in the 2011 Implementation Plan, namely implementation of technological and/or operational measures that may include variable-speed drive pumps to more efficiently manage intake flow and intake screens to reduce entrainment. However, because of the need to conduct a 3-year baseline monitoring program, after which such a strategy change would be implemented, it may not be possible to implement Track 2 prior to the compliance deadline of December 31, 2020. Therefore, notwithstanding certain engineering challenges, retrofitting MGS Units 1 and 2 with dry cooling appears to be the most viable option for bringing those units into compliance with the OTC Policy in the event that P3 does not move forward. This is, therefore, the No Project Alternative.
For the dry-cooling scenario, two ACCs, one for each unit, would be provided. Each ACC would be approximately 130 feet by 290 feet by 100 feet tall. The site would have sufficient space to accommodate this infrastructure. Process water requirements would continue to be met from the existing potable water supply. The amount of potable water would be approximately the same amount of potable water that the MGS currently uses.
5.3.2 Ability of No Project Alternative to Meet Project Objectives
The No Project Alternative would meet certain project objectives. However, it would also fail to meet certain important project objectives. The No Project Alternative would not allow Applicant to fulfill its obligations under the 20-year RAPA with SCE requiring development of newer, more flexible and efficient natural gas generation. Although retrofitting MGS Units 1 and 2 with an alternative cooling system would help support the local capacity requirements, the older generating technology would not provide the same efficient operational flexibility, with rapid-start and fast ramping capability, to allow for efficient integration of renewable energy sources in the California electrical grid.
5.3.3 Potential Environmental Effects of No Project Alternative
Some of the construction-related impacts associated with P3 would be eliminated with the No Project Alternative; however, there would be construction impacts associated with constructing the alternative cooling system. Because MGS Units 1 and 2 are older and less-efficient technology, the No Project Alternative would result in increased fuel and water consumption and air pollution compared to the proposed P3 project.
5.4 ALTERNATIVE SITES
The proposed P3 project site is in the existing MGS site and would be constructed north of the existing power-generating facilities. The proposed site is currently undeveloped, but was previously graded. Construction of the new facility on the proposed site would capitalize on the close proximity to the existing SCE Substation, adjacent to MGS. Additionally, locating P3 within the boundaries of the existing MGS site would allow the reuse of infrastructure such as the ammonia tank, access roads, and
Puente Power Project Application for Certification 5.0 Alternatives
R:\15 P3\5_0 Alts.docx Page 5-4 April 2015
electrical, water, wastewater, and natural gas systems. This would eliminate the need for offsite linear facilities and minimize environmental impacts.
According to Public Resources Code (PRC) 25540.6(b), evaluation of alternative sites is not required when a natural-gas–fired thermal power plant is proposed for development at an existing industrial site such as MGS. P3 is just that type of project that was envisioned by this code section; therefore, it is reasonable not to analyze alternative sites for the project. P3 would be adjacent to the existing SCE switchyard, and because of adjacent existing infrastructure, would minimize the need for offsite linear features. Therefore, evaluation of alternative sites outside the boundaries of the MGS is not required.
In addition, as stated above, CEQA requires environmental documents to consider a range of reasonable alternatives that would feasibly attain most of the basic objectives of the project, but would avoid or substantially lessen any of the significant effects; and states that failure to do either may be grounds for elimination of an alternative. “Although CEQA requires that an EIR identify alternatives to a project, it does not expressly require a discussion of alternative project locations.” Mira Mar Mobile Community v. City of Oceanside, 119 Cal. App. 4th 477, 491 (2004) (citing PRC §§ 21001 (g), 21002.1(a), 21061). “[T]here is no rule requiring an EIR to explore offsite project alternatives in every case.” California Native Plant Society v. City of Santa Cruz (2009) 177 Cal. App. 4th 957, 991. An agency may determine that no feasible locations exist either because basic project objectives cannot be achieved at another site, or because there are no sites meeting the criteria for feasible alternative sites. See City of Long Beach v. Los Angeles Unified Sch. Dist., 176 Cal. App. 4th 889, 921 (2009).
It would not be feasible to meet most of the project objectives if P3 was constructed at an alternate site. First and foremost, the RAPA awarded by SCE is location-specific and calls for new generation to be developed at the MGS site. In its RFO process, SCE evaluated numerous proposals at a variety of different locations, and selected the Applicant’s proposal at the MGS location as the proposal that best meets its needs. Applicant does not have the ability under the RAPA to select an alternative location for the development of P3. Even if Applicant had the ability to select an alternative location, doing so would not meet other project objectives, including reusing existing infrastructure to minimize development costs and environmental impacts.
Furthermore, Applicant does not have ownership or control over alternative sites on which P3 could be located, and it is unlikely that Applicant could identify, evaluate, and acquire an alternative site, including necessary rights-of-way for gas, water, and transmission infrastructure, and meet its commissioning date of June 1, 2020. “A feasible alternative is one which can be ‘accomplished in a successful manner within a reasonable period of time, taking into account economic, environmental, social, and technological factors.’ . . . Surely whether a property is owned or can reasonably be acquired by the project proponent has a strong bearing on the likelihood of a project's ultimate cost and the chances for an expeditious and ‘successful accomplishment.’. . . . [T]he law does not require in depth review of alternatives which cannot be realistically considered and successfully accomplished . . .” Citizens of Goleta Valley v. Board of Supervisors (1990) 52 Cal. 3d 553, 574–75 [internal citations omitted].
Finally, construction and operation of a power plant at an alternate location would likely result in new, significant environmental impacts associated with the additional construction and operation of infrastructure that would be required because existing plant infrastructure would not be used. This would potentially result in greater impacts related to Air Quality, Biological Resources, Cultural Resources, Hazards and Hazardous Materials, Noise, Soils, Transportation and Circulation, Visual Resources, and Water Resources.
For the reasons set forth above, further evaluation of alternative sites outside the boundaries of the MGS is not required.
Puente Power Project Application for Certification 5.0 Alternatives
R:\15 P3\5_0 Alts.docx Page 5-5 April 2015
5.5 ALTERNATIVE GENERATING CONFIGURATIONS AND TECHNOLOGIES
5.5.1 Proposed Configuration
The proposed configuration includes one General Electric (GE) 7HA.01 natural-gas–fired combustion turbine generator (CTG) operated in simple-cycle mode. The proposed layout has been optimized for plant-operating efficiencies, such as effective use of existing infrastructure and reuse of various facilities, including the ammonia tank and retention basins. The identified location for P3 is the most efficient location within the MGS boundaries that could support a facility of this configuration.
5.5.2 GE LMS-100s
Applicant initially considered use of a GE LMS-100s system. In its response to SCE’s RFO for the Moorpark Sub-Area of the Big Creek/Ventura Local Reliability Area, Applicant submitted bids for three options: GE 7HA.01, GE LMS-100s, and conventional combined cycle. Based on the competitive bidding process, SCE selected the GE 7HA.01, and therefore the RAPA requires deployment of this technology. Deployment of alternative generating technology would fail to meet the project objective of meeting the obligations of the RAPA. Therefore, use of a GE LMS-100s system was eliminated from further consideration.
5.5.3 Conventional Combined-Cycle
Applicant initially considered use of a conventional combined-cycle system. As stated above, Applicant proposed a conventional combined-cycle plant as one of three options in response to SCE’s RFO. Based on the competitive bidding process, SCE selected the GE 7HA.01, and therefore the RAPA requires deployment of this technology. Deployment of alternative generating technology would fail to meet the project objective of meeting the obligations of the RAPA. Therefore, use of a conventional combined-cycle plant was eliminated from further consideration.
5.6 WATER SUPPLY
P3 would be a dry-cooled facility and would use very little water (less than 20 acre-feet per year [AFY]). P3 will not include a steam cycle, and it will not use water for steam condensation purposes or as part of any process that uses water to reject power plant process heat or waste heat to the atmosphere. P3 will only use water for evaporative cooler makeup, service water, and water for combustion turbine washes. The proposed source of the process water for P3 is potable water provided by the City of Oxnard, the local water supply purveyor.
California Energy Commission (CEC) Staff and the Commission have found that a project deploying essentially the same technology as P3 was not using water for cooling purposes within the meaning of the CEC’s policy on the use of fresh water for power plant cooling, as set forth in the CEC’s 2003 Integrated Energy Policy Report, and the similar policy in State Water Quality Control Board (SWQCB) Resolution 75-58. (See Commission Decision, Marsh Landing Generating Station [MLGS], Docket 08-AFC-3, pp. 83-84, citing Staff Assessment, Exhibit 300, pp. 4.9-23 through 4.9-25 [CEC, 2010].) These policies specify that the use of fresh water for cooling purposes by power plants will be approved only when alternative water supply sources and alternative cooling technologies are shown to be environmentally undesirable or economically unsound. In the case of MLGS, Staff concluded, and the Commission concurred, that the proposed use of 50 AFY of fresh water supplied by the City of Antioch was consistent with these policies (CEC, 2010). In its Decision, the Commission found:
“The MLGS will use water in CTG inlet air evaporative coolers and for service water and other industrial purposes. The inlet air evaporative coolers use a relatively small amount of water to reduce the temperature of the ambient air as it enters the combustion turbines to improve power
Puente Power Project Application for Certification 5.0 Alternatives
R:\15 P3\5_0 Alts.docx Page 5-6 April 2015
output and efficiency. In this process, water is introduced into the ambient air as it is drawn through the turbine. The MLGS will not use water for wet cooling or as part of a steam cycle or for steam condensation purposes. The MLGS also will not use any water for the purpose of rejecting waste heat produced by power plant processes to the atmosphere. Staff concluded that the MLGS will not use water for cooling purposes because it utilizes a project design that minimizes the use of water . . . We find that the Marsh Landing Project’s use of either brackish groundwater or fresh water supplied by the City of Antioch for process uses will comply with Energy Commission water policy and SWQCB Resolution 75-58.” (citations omitted)
The technology to be deployed at P3, and the purposes for which water will be used, are essentially the same as in the case of the MLGS. The only material difference is that P3 will use considerably less water than even MLGS.
5.6.1 Recycled Water
As discussed above, the availability of recycled water (i.e., tertiary treated wastewater) at the MGS site was carefully evaluated in the 2011 Implementation Plan developed in connection with the OTC Policy. At that time, it was concluded that recycled water was not available at the MGS site. The circumstances surrounding the availability of recycled water have not changed materially since that time. The use of recycled municipal wastewater for process water needs at the P3 is still considered to be infeasible for the reasons provided below.
1. The City of Oxnard began construction of its Advanced Water Purification Facility (AWPF) in 2009. The plant currently is undergoing its final commissioning process. It is anticipated that the plant will begin operations in spring 2015. The Recycled Water Backbone System has been completed. This main pipeline will convey recycled water from the AWPF, north along Perkins, C Street, and Ventura Road to the River Ridge Golf Course, near the Santa Clara River. The first phase of the recycled water production capacity is 6.25 million gallons per day (MGD), or 7,000 AFY. Approximately, 1,500 AFY to 1,800 AFY of this will be delivered to the River Ridge Golf Club for irrigation. The remaining 5,200 to 5,500 AFY of recycled water will be delivered to an aquifer storage and recovery well that the City plans to construct in 2015, and to agricultural customers (Rydberg, 2014). The closest connection point from the P3 site to the City of Oxnard’s Recycled Water Backbone System is more than 4 miles away (near Fifth Street and Ventura Road), and construction of a pipeline through already congested utility corridors to interconnect would be economically infeasible, considering the small amount of water used by P3.
2. The City of Ventura owns and operates the Ventura Water Reclamation Facility (VWRF), north of the Santa Clara River. Currently, the VWRF generates approximately 9 MGD of tertiary treated wastewater. This water is used for irrigation of golf courses, parks, and landscaping in the City of Ventura, and is discharged to the Santa Clara River Estuary (just north of the river where the river discharges to the ocean) under an order from the Los Angeles Regional Water Quality Control Board. Recently, in compliance with the renewal of the discharge permit, the City of Ventura has been conducting special studies for the Santa Clara River Estuary to assess continued discharge of the recycled water to the estuary or identify other potential customers, for uses such as urban and agricultural irrigation throughout the City of Ventura, and groundwater recharge and other uses outside the City of Ventura (Carollo and Stillwater Sciences, 2011; Carollo, 2014).
The VWRF is outside the boundaries of, and does not serve, the City of Oxnard. There is no connectivity between the City of Oxnard’s water system and the VWRF distribution system. If the proposed project were to obtain recycled water from the VWRF, it would require installation of an approximately 2.5-mile-long pipeline along North Harbor Boulevard and across a large river (i.e., the Santa Clara River). Such an installation, assuming this water supply would be
Puente Power Project Application for Certification 5.0 Alternatives
R:\15 P3\5_0 Alts.docx Page 5-7 April 2015
available, would be considered economically infeasible given the small quantity of water needed by P3. An interconnection to an outside water purveyor may not even be administratively feasible.
3. The next closest facilities are 10 miles or more away from the site, and extensive infrastructure would be required to deliver recycled water, if even available, to the site. These facilities include:
• The Ojai Valley Wastewater Treatment Plant is approximately 10 miles north of P3; it currently does not produce recycled water (Casitas Municipal Water District, 2011).
• Camrosa Water Reclamation Facility is in the City of Camarillo, approximately 15 miles southeast of P3; it currently produces approximately 1.5 MGD of reclaimed water (Camrosa Water District, 2015)
• Santa Paula Water Recycling Facility is approximately 12 miles northeast of P3; it currently produces approximately 3.4 MGD of recycled water (Santa Paula Water District, 2015).
• The City of Fillmore Water Recycling Plan produces approximately 1.8 MGD of recycled water and is more than 20 miles away from P3 (American Water, 2015).
• The Moorpark Wastewater Treatment Plan produces approximately 5 MGD of recycled water and is more than 20 miles away from P3 (PSOMAS, 2014).
There is no connectivity between the City of Oxnard’s water system and any of these other water purveyors. Tertiary-treated recycled water is not feasibly available from these facilities due to jurisdictional, supply, and interconnection constraints. Accordingly, based on currently available information, recycled water supplies are not available.
P3 will deploy dry-cooling technology and use only a small quantity of potable water. Consistent with the MLGS Decision, the proposed use does not constitute use of fresh water for power plant cooling as governed by applicable CEC and SWQCB policies. There is an existing water supply line on the MGS property, and no new offsite infrastructure will be required to deliver water to the project. Use of recycled water would require construction of costly new pipelines, with resulting environmental impacts and disruptions due to construction in congested routes. Under these circumstances, even if P3’s proposed water use fell within the scope of applicable policies, use of recycled water as an alternative water supply would be environmentally undesirable and economically unsound.
Furthermore, as discussed in Section 4.15, Water Resources, the quantity of potable water used for the proposed replacement project will be substantially less than what is currently used, which reduces the impact on the local water supply, and is a substantial benefit to the region.
5.6.2 Irrigation Return Flow
Agriculture is a major industry in Ventura County and the City of Oxnard. In the vicinity of the project site, strawberries and row crops are the predominant crop types (Larry Walker Associates, 2013).
Discharges from irrigated agricultural lands in Ventura County, including irrigation return flows, flows from tile drains, and stormwater runoff, must comply with the Los Angeles Regional Water Quality Control Board’s Conditional Waiver of Waste Discharge Requirements for Discharges from Irrigated Lands within the Los Angeles Region (“Conditional Waiver,” Order No. R4-2010-0186).
These discharges can affect water quality by transporting nutrients, pesticides, sediment, salts, and other pollutants from cultivated fields into surface waters, potentially impairing designated beneficial uses of
Puente Power Project Application for Certification 5.0 Alternatives
R:\15 P3\5_0 Alts.docx Page 5-8 April 2015
receiving water bodies. The Ventura County Agricultural Irrigated Lands Group (VCAILG) is a group of landowners and growers that have joined together to comply with the Conditional Waiver as a “Discharger Group.”
The Oxnard Central Drain collects agricultural discharges from approximately 447 acres of farmland in northwestern Oxnard. A VCAILG monitoring site is located on the Oxnard Central Drain near Harbor Boulevard and Gonzales Road, approximately 1 mile north of the P3 site. The Oxnard Central Drain is monitored periodically during the year, usually one or two wet events and one or two dry events. For the 12 events monitored in 2007, 2009, 2010, and 2012, monitoring results indicate that flow in the drain has ranged from approximately 0.36 cubic foot per second (cfs) (dry period in July 2012) to 93.2 cfs (wet period in January 2010). Water quality exceeded benchmarks for nitrates, copper, and pesticides. Total dissolved solids exceeded 2,500 milligrams per liter for 9 of the 12 events (Larry Walker Associates, 2008, 2009, 2010, 2011, 2013).
Irrigation return flow is considered infeasible due to the cost of infrastructure that would be required to deliver the water to the project site, the unreliability of the flows, and the cost of treatment, if the water is even available. The use of irrigation return flow from the Oxnard Central Drain is considered impracticable for the following reasons:
• An extensive and costly infrastructure system would be required to deliver the water from the drain to the site. A pipeline would need to be constructed within the existing road rights-of-way along Harbor Boulevard, between the site and the drain (approximately 1 mile). A pump station would likely be required because of the generally flat terrain.
• The drain provides an unreliable source of water. The amount of water that is available depends on how the fields are operated, and how much irrigation water is applied and when; which in turn depends on the crop, climate, etc. Based on the data from VCAILG for recent monitoring, flow at the Oxnard Center Drain is highly variable throughout the year and from year to year. Because there are only periodic data available, it is uncertain if there is a sustained minimum flow at the drain.
• As a result of increased water conservation measures by growers, including more efficient irrigation practices and conversion to more water-efficient crops, irrigation return flows would be expected to become an increasingly unreliable source of water.
• The irrigation return flow may require treatment for use at the plant. The limited water quality data that are available for the Oxnard Central Drain indicate that the water would be expected to have elevated amounts of nitrates, pesticides, salts, and minerals.
5.6.3 Desalination
The existing MGS Units 1 and 2 currently use ocean water for once-through-cooling. The intake is located in the Edison Canal, and discharge is through the existing outfall structure. The proposed project could use ocean water as a supply for process water needs. The ocean water would require treatment at an onsite desalination facility. Desalination systems need to run continuously to be efficient and cost-effective. P3 is a peaking facility that will operate up to a 30 percent capacity factor. In addition, the very small amount of water needed by P3 does not justify the costs for constructing and operating an onsite desalination facility.
There are no regional desalination plants in the project region. The closest desalination plant to the project site is the Charles E. Meyer Desalination Facility in Santa Barbara, California, which is more than 40 miles away. This plant is currently mothballed and not in operation. It was constructed more than
Puente Power Project Application for Certification 5.0 Alternatives
R:\15 P3\5_0 Alts.docx Page 5-9 April 2015
20 years ago, but was never used. However, the City of Santa Barbara is currently evaluating water supply alternatives, including potentially starting this desalination plant.
Even if this plant were to begin operating, the distance makes connection to the project site economically infeasible.
5.6.4 Onsite Groundwater
Groundwater underlying the MGS property has been impacted by historical SCE (i.e., the former owner of MGS) operations. A Land Use Covenant will reportedly be put in place, restricting the use of groundwater pumped from the site. Therefore, this alternative water supply has not been considered for the proposed project.
5.7 WASTEWATER DISCHARGE
P3 will discharge construction wastewater, process wastewater and stormwater to the existing MGS retention basins, and discharge via the existing outfall structure to the ocean in accordance with MGS’ existing Waste Discharge Requirements (WDR) Order No. 01-057, National Pollutant Discharge Elimination System Permit Number CA0001180 (LARWQCB, 2001). Sanitary wastewater will be discharged to the existing MGS septic system in accordance with WDR Order No. R4-2008-0087 (LARWQCB, 2008). Reuse and repurposing of existing infrastructure minimizes the environmental impact footprint.
P3 will use inlet-air evaporative coolers and dry-cooling technology to reduce water consumption. P3 does not include a steam cycle and will not use water for steam condensation purposes. The project will use a reverse osmosis system to recycle process wastewater for reuse on site, further reducing process water demand. The project will incorporate water recycling from the evaporative cooling blowdown, and reuse this water in the cooling-water system.
The project evaluated the use of zero-liquid discharge (ZLD) technology. It was determined that the use of this technology for P3 is not viable for the following reasons: increased capital costs, increased annual operation costs, required transport and disposal of sludge to an offsite landfill, and consumption of energy, which reduces power plant output and efficiency. Considering the very small amount of water consumed by the proposed project (less than 20 AFY), the resulting small amount of wastewater (less than 10 AFY), and water quality and treatment considerations, the use of ZLD is not considered an economically viable alternative.
5.8 ELECTRIC TRANSMISSION LINES
P3 would interconnect at the existing SCE switchyard, which is adjacent to the MGS site. Because the P3 transmission line would be very short and would connect directly into the SCE switchyard without the construction of offsite transmission lines, no alternative electric transmission routes were considered.
5.9 NATURAL GAS SUPPLY LINE
Natural gas will be delivered to P3 by SoCalGas, which currently delivers natural gas to the MGS site. Natural gas will be provided using a new 10-inch-diameter line that will connect to a new gas metering station adjacent to the project site. The connection line will continue generally westward to a new gas compression enclosure on the P3 site. Because the gas pipeline interconnection is short and runs through existing power-generating facilities, no alternative gas pipeline routes were considered.
Puente Power Project Application for Certification 5.0 Alternatives
R:\15 P3\5_0 Alts.docx Page 5-10 April 2015
5.10 ALTERNATIVE AIR POLLUTION EMISSION CONTROL ANALYSIS
The project must comply with the requirements of the Ventura County Air Pollution Control District’s (VCAPCD) permit regulations requiring the application of the Best Available Control Technology (BACT) to control air emissions. To comply with the VCAPCD’s BACT requirements for oxides of nitrogen (NOX), the project’s design includes dry low-NOX combustion controls on the gas turbines and selective catalytic reduction (SCR) to control NOX emissions. To comply with VCAPCD’s BACT requirements for reactive organic compounds (ROCs), a carbon monoxide (CO) catalyst will be employed.
The SCR system for the CTG will operate with aqueous ammonia injected into the exhaust gas stream upstream of a catalyst bed to reduce NOX to inert nitrogen and water. The SCR technology proposed for P3 uses a 19 percent solution of ammonia to reduce NOX emissions to elemental nitrogen, water, and a small quantity of unreacted ammonia. Although the use and storage of ammonia would represent a potential risk to the public in the event of a catastrophic breach of the storage tank, the offsite consequence analysis (presented in Section 4.5, Hazardous Materials Management) shows that the potential impacts associated with the project’s use and storage of ammonia would not result in a significant public health impact.
The remainder of this section presents alternative NOX emission control technologies considered for the project. The information presented below is based on the air quality analysis presented in Section 4.1, Air Quality.
Potential NOX control technologies for combustion gas turbines include the following:
• Combustion controls − Dry combustion controls − Dry low-NOX combustor design − Catalytic combustors (e.g., XONON™)
• Post-combustion controls − Selective non-catalytic reduction (SNCR) − Non-selective catalytic reduction (NSCR) − SCONOX
TM
The technical feasibility of available NOX control technologies is presented below.
5.10.1 Combustion Modifications
5.10.1.1 Dry-Combustion Controls
Combustion modifications that lower NOX emissions without wet injection include lean combustion, reduced combustor residence time, lean pre-mixed combustion, and two-stage rich/lean combustion. Lean combustion uses excess air (greater than stoichiometric air-to-fuel ratio) in the combustor’s primary combustion zone to cool the flame, thereby reducing the rate of thermal NOX formation. Reduced combustor residence times are achieved by introducing dilution air between the combustor and the turbine sooner than with standard combustors. The combustion gases are at high temperatures for a shorter time, which also has the effect of reducing the rate of thermal NOX formation. Dry low-NOX combustion would be used on the GE 7HA.01 CTG for this project.
Catalytic combustors use a catalytic reactor bed mounted in the combustor to burn a very lean fuel-air mixture. This technology has been commercially demonstrated under the trade name Xonon™ in a 1.5-MW natural-gas–fired combustion turbine in Santa Clara, California. No turbine vendor, other than
Puente Power Project Application for Certification 5.0 Alternatives
R:\15 P3\5_0 Alts.docx Page 5-11 April 2015
Kawasaki, has indicated the commercial availability of catalytic combustion systems at the present time, and the largest size is 18 MW. The technology is not commercially available for the proposed P3 turbine and other similarly sized combustion turbines; therefore, it is not considered further.
5.10.1.2 Wet-Combustion Controls
Steam or water injection directly into the turbine combustor is one of the most common NOX control techniques. These wet-injection techniques lower the peak flame temperature in the combustor, reducing the formation of thermal NOX. The injected water or steam exits the turbine as part of the exhaust. Although the lower peak flame temperature has a beneficial effect on NOX emissions, it can also reduce combustion efficiency and prevent complete combustion. As a result, emissions of CO and reactive organic gases increase as water/steam injection rates increase.
Water and steam injection have been in use on both oil- and gas-fired combustion turbines in all size ranges for many years, so these NOX control technologies are generally considered technologically feasible and widely available. Because dry low-NOX combustion controls are used in the GE 7HA.01 CTG and are more effective than water injection, water injection is not considered for this project.
5.10.1.3 Post-Combustion Controls
Selective catalytic reduction is a post-combustion technique that controls both thermal and fuel-bound NOX emissions by reducing NOX with a reagent (generally ammonia or urea) in the presence of a catalyst to form water and nitrogen. NOX conversion is sensitive to exhaust gas temperature, and performance can be limited by contaminants in the exhaust gas that may mask the catalyst (sulfur compounds, particulates, heavy metals, and silica). SCR is used in numerous gas turbine installations throughout the United States, almost exclusively in conjunction with other wet or dry NOX combustion controls. SCR requires the consumption of a reagent (ammonia or urea) and requires periodic catalyst replacement. Estimated levels of NOX control are in excess of 90 percent. SCR would be used on this project, in conjunction with the dry low-NOX combustion controls on the GE 7HA.01 CTG.
SNCR involves injection of ammonia or urea with proprietary conditioners into the exhaust gas stream without a catalyst. SNCR technology requires gas temperatures in the range of 1,200 degrees Fahrenheit (°F) to 2,000°F, and is most commonly used in boilers. Some method of exhaust gas reheat, such as additional fuel combustion, would be required to achieve exhaust temperatures compatible with SNCR operations, and this requirement makes SNCR technologically infeasible for P3.
NSCR uses a catalyst without injected reagents to reduce NOX emissions in an exhaust gas stream. NSCR is typically used in automobile exhaust and rich-burn stationary internal combustion engines, and employs a platinum/rhodium catalyst. NSCR is effective only in a stoichiometric or fuel-rich environment where the combustion gas is nearly depleted of oxygen, and this condition does not occur in turbine exhaust, where the oxygen concentrations are typically between 14 and 16 percent. For this reason, NSCR is not technologically feasible for P3.
The SCONOX™ system, also known as EMX™, is an add-on control device that reduces emissions of multiple pollutants. SCONOX™ uses a single catalyst for the reduction of CO, volatile organic compounds (VOCs), and NOX, which are converted to carbon dioxide (CO2), water, and nitrogen.
The catalyst is a monolithic design, made from a ceramic substrate with both a proprietary platinum-based oxidation catalyst and a potassium carbonate adsorption coating. The catalyst simultaneously oxidizes nitric oxide to nitrogen dioxide, CO to CO2, and VOCs to CO2 and water; while nitrogen dioxide is adsorbed onto the catalyst surface, where it is chemically converted to and stored as potassium nitrates and nitrites. The SCONOX potassium carbonate layer has a limited adsorption capability, and requires regeneration approximately every 12 to 15 minutes in normal service. Each regeneration cycle requires
Puente Power Project Application for Certification 5.0 Alternatives
R:\15 P3\5_0 Alts.docx Page 5-12 April 2015
approximately 3 to 5 minutes. At any point in time, approximately 20 percent of the compartments in a SCONOX system would be in regeneration mode, and the remaining 80 percent of the compartments would be in oxidation/absorption mode.
All installations of the technology have been on small, natural-gas facilities, and all of those facilities have experienced performance issues. The fact that SCONOX™ has not been applied to large-scale natural-gas CTGs like the GE 7HA.01 creates concerns regarding the feasibility.
In a recent BACT analysis performed by SCAQMD for the Redondo Beach Energy Project, SCAQMD engineers did carry forward SCONOX™ as a potential control for its turbines; however, the turbine proposed for this project is considerably larger (260 MW vs. 132 MW on the Redondo Beach Energy Project), and it remains true that SCONOX™ has not been demonstrated in practice on a turbine similar to that proposed for P3. For the above reasons, SCONOX™ is considered technically infeasible to meet the 2-parts per million NOX emission level that can be achieved with SCR.
5.10.2 Alternatives to Ammonia-Based Emission Control Systems
Over the last few years, several vendors have designed urea-based systems to generate ammonia on site, thereby eliminating the need to transport and store ammonia. These units are referred to as Ammonia on Demand and Urea–to-Ammonia (U2A) systems. The U2A system has limited commercial availability.
The U2A system generates ammonia from solid dry urea. The process starts by dissolving urea in deionized water to produce an aqueous urea solution. Steam is used in the U2A reactor to convert the urea solution into a gaseous mixture of ammonia, CO2, and water for use in the SCR system. The U2A technology has not been widely applied and accepted for use at simple-cycle or combined-cycle turbine facilities. Aqueous ammonia is currently used at the MGS site. Site personnel are trained and familiar with the safe handling and operation of the systems. Therefore, the U2A system is not considered for this project.
5.11 ALTERNATIVE TECHNOLOGIES
Although the SCE RFO included solicitation for renewable generation, the Applicant’s offer was for a natural-gas–fired facility that would integrate with renewables. Therefore, the following alternative technologies were not considered because their use would not meet project objectives:
• Hydrogen-fired • Biomass • Solar • Wind • Oil • Coal • Nuclear • Hydroelectric • Geothermal • Fuel cells
Alternative generating processes, such as solar or wind, generation plants, or use of “clean fuels,” such as hydrogen or biomass, represent a completely different family of power generation plant designs from natural-gas peaking and combined cycle plants. Although hydrogen-fired or biomass-fired generation facilities may have certain similar components, such as cooling towers and turbine generators, the technical basis for these plants differs markedly from the natural-gas plant represented in the RAPA. In
Puente Power Project Application for Certification 5.0 Alternatives
R:\15 P3\5_0 Alts.docx Page 5-13 April 2015
addition, natural gas is a clean fuel, with its lower sulfur dioxide and particulate emissions than alternative fossil fuels; and in some cases, natural gas plants may be cleaner than combustion of hydrogen or biomass.
Use of solar or wind generation would not meet a couple of the primary objectives of the project, namely SCE’s RAPA, and generation that would integrate renewable energy. Solar or wind generation therefore is not considered further as an alternative technology. Hydrogen-fired or biomass-fired generation would likewise not meet SCE’s RAPA. Furthermore, space requirements, water use, and the cost of generation for these alternative technologies are relatively high compared to natural-gas–fired technologies, and may not allow for the same operating flexibility that the natural-gas–fired technologies provide.
Alternative fossil fuels such as oil and coal were not considered, due to the relatively lower efficiency and higher emissions of air pollutants per kilowatt-hour generated. Furthermore, the use of these fossil fuels is counter to California policy on use of lower carbon technologies.
California law prohibits new nuclear plants until the scientific and engineering feasibility of disposal of high-level radioactive waste has been demonstrated. To date, the CEC is unable to make the findings of disposal feasibility required by law for this technology to be viable in California. This technology, therefore, is not possible at this time.
Most of the sites for hydroelectric facilities have already been developed in California, and the remaining potential sites face lengthy environmental licensing periods. It is doubtful that this technology could be implemented within 3 to 5 years, and the cost would probably be higher than the cost of a conventional simple-cycle combustion turbine. There are no hydroelectric sites in the project area.
Geothermal development is not viable at the project location because suitable thermal resources and strata are not present. Therefore, geothermal was eliminated from consideration.
Fuel cells cleanly and efficiently convert chemical energy from hydrogen-rich fuels into electrical power and usable high quality heat in an electrochemical process, with minimal emission of pollutants. Fuel cell power plant applications come in building blocks of 1.4 MW. The largest stationary fuel cell power plant currently installed in the United States is 11.2 MW. To generate electricity, fuel cells require a continuous supply of fuel. The fuel can be any hydrogen-rich fuel, including natural gas or biogas. Fuel cells are not a viable option at this site for the following reasons: the technology has not been proven at the scale needed for the project; fuel cell plants are not engineered to be dispatchable or operate in a peaking manner; and fuel cells are significantly less efficient than the simple-cycle CTG technology proposed for P3. For all of these reasons, this technology would not be considered technologically or economically feasible for a 262-MW (nominal net) facility that needs to provide rapid-start and fast-ramping capability to allow for efficient integration of renewable energy sources.
5.12 REFERENCES
American Water, 2015. Fillmore Wastewater Treatment Plant. Available online at: http://www.amwater.com/files/ProjectSheet015_Fillmore.pdf. Accessed March 2015.
Camrosa Water District, 2015. Camrosa website. Available online at: http://www.camrosa.com/about_fac_wrf.html. Accessed March 2015.
Carollo, 2014. Amended Estuary Special Studies Phase 2: Facilities Planning Study for Expanding Recycled Water Delivery. May.
Carollo and Stillwater Sciences, 2011. Santa Clara River Estuary Special Studies. September 16.
Puente Power Project Application for Certification 5.0 Alternatives
R:\15 P3\5_0 Alts.docx Page 5-14 April 2015
Casitas Municipal Water District, 2011. 2010 Urban Water Management Plan. June 30.
CEC (California Energy Commission), 2003. Integrated Energy Policy Report. December.
CEC (California Energy Commission), 2010. Commission Decision, Marsh Landing Generating Station. CEC-800-2010-017 CMF. August.
GenOn (GenOn West, L.P.), 2011. Mandalay Generating Station Implementation Plan for the Statewide Water Quality Control Policy on the Use of Coastal and Estuarine Waters for Power Plant Cooling. April 1. Available online at: http://waterboards.ca.gov/water_issues/programs/ocean/cwa316/powerplants/mandalay/docs/mgs_ip2011.pdf. (2011 Implementation Plan.)
GenOn (GenOn West, L.P.), 2012. Ormond Beach Generating Station and Mandalay Generating Station Implementation Plans for the Statewide Water Quality Control Policy on the Use of Coastal and Estuarine Waters for Power Plant Cooling. May 12. Available online at: http://waterboards.ca.gov/water_issues/programs/ocean/cwa316/powerplants/mandalay/docs/genon_05142012.pdf.
Larry Walker Associates, 2008. Ventura County Agricultural Irrigated Lands Group (VCAILG). 2007 Annual Monitoring Report, Draft. February 15.
Larry Walker Associates, 2009. Ventura County Agricultural Irrigated Lands Group (VCAILG). 2008 Water Quality Management Plan. August 15.
Larry Walker Associates, 2010. Ventura County Agricultural Irrigated Lands Group (VCAILG). 2009 Annual Monitoring Report, Draft. February 15.
Larry Walker Associates, 2011. Ventura County Agricultural Irrigated Lands Group (VCAILG). 2010 Annual Monitoring Report, Draft. February 15.
Larry Walker Associates, 2013. Ventura County Agricultural Irrigated Lands Group (VCAILG). 2012 Annual Monitoring Report, Draft. February 26.
LARWQCB (Los Angeles Regional Water Quality Control Board), 2001. Waste Discharge Requirements for Mandalay Generating Station Order No. 01-057. National Pollutant Discharge Elimination System No. CAS0001180.
LARWQCB (Los Angeles Regional Water Quality Control Board), 2008. Waste Discharge Requirements for Mandalay Generating Station Order No. R4-2008-0087. September 5.
LARWQCB (Los Angeles Regional Water Quality Control Board), 2010. Conditional Waiver of Waste Discharge Requirements for Discharges from Irrigated Lands within the Los Angeles Region (“Conditional Waiver”), Order No. R4-2010-0186). October 7.
PSOMAS, 2014. 2010 Urban Water Management Plan Ventura County Waterworks District No. 1. Revised June 20.
Rydberg, David, 2014. Full Advanced Treatment Recycled Water Management and Use Agreement No. A-7651. December 29.
Santa Paula Water District, 2015. Santa Paula Water District website. Available online at: http://santapaulawater.com/process.html. Accessed March 2015.

ATTACHMENT AQ-2
VCAPCD COMPLETE APPLICATION NOTICE

AQ-2
Siting Regulation: Appendix B(g)(8)(B)
The heating value and chemical characteristics of the proposed fuels, the stack height and
diameter, the exhaust velocity and temperature, the heat rate and the expected capacity factor
of the proposed facility.
Information Required to Make AFC Conform with Regulations
Please correct labeling of Tables 4.1-16 thru 4.1-19 and throughout the text in order for staff, the
applicant, interveners, and interested parties to be able to identify and discuss air quality
information.
Response:
These tables in the AFC were inadvertently misnumbered. The tables have been corrected in
underline/strikeout text and are provided in Attachment AQ-3. Please note that the table call-outs
within the text of the AFC are correct as-is.

AQ-3
Siting Regulation: Appendix B(g)(8)(E)
The emission rates of criteria pollutants and greenhouse gases (CO2, CH4, N2O), and SF6)
from the stack, cooling towers, fuels and materials handling processes, delivery and storage
systems, and from all on-site secondary emission sources.
Information Required to Make AFC Conform with Regulations
Please correct labeling of Tables 4.1-28 and throughout the text in order for staff, the applicant,
interveners, and interested parties to be able to identify and discuss air quality information.
Response:
These tables in the AFC were inadvertently misnumbered. The tables have been corrected in
underline/strikeout text and are provided in Attachment AQ-3. Please note that the table call-outs
within the text of the AFC are correct as-is.

AQ-4
Siting Regulation: Appendix B(g)(8)(F) (i)
A description of typical operational modes, and start-up and shutdown modes for the proposed
project, including the estimated frequency of occurrence and duration of each mode, and
estimated emission rate for each criteria pollutant during each mode.
Information Required to Make AFC Conform with Regulations
Please correct labeling of Tables 4.1-21 and 4.1-22 and throughout the text in order for staff, the
applicant, interveners, and interested parties to be able to identify and discuss air quality
information.
Response:
These tables in the AFC were inadvertently misnumbered. The tables have been corrected in
underline/strikeout text and are provided in Attachment AQ-3. Please note that the table call-outs
within the text of the AFC are correct as-is.

AQ-5
Siting Regulation: Appendix B(g)(8)(G)
The ambient concentrations of all criteria pollutants for the previous three years as measured
at the three Air Resources Board certified monitoring stations located closest to the project site,
and an analysis of where this data is representative of conditions at the project site. The
applicant may substitute an explanation as to why information from one, two or all stations is
either not available or unnecessary.
Information Required to Make AFC Conform with Regulations
Please correct labeling of Tables 4.1-1 thru 4.1-11 and 4.1-31 and throughout the text in order for
staff, the applicant, interveners, and interested parties to be able to identify and discuss air quality
information.
Response:
These tables in the AFC were inadvertently misnumbered. The tables have been corrected in
underline/strikeout text and are provided in Attachment AQ-3. Please note that the table call-outs
within the text of the AFC are correct as-is.

AQ-6
Siting Regulation: Appendix B(g)(8)(I) (ii)
A screening level air quality modeling analysis, or a more detailed modeling analysis if so
desired by the applicant, of the direct criteria pollutant (NOx, SO2, CO, PM10 and PM2.5)
impacts on ambient air quality conditions of the project during typical (normal) operation, and
during shutdown and startup modes of operation. Identify and include in the modeling of each
operating mode the estimated maximum emissions rates and the assumed meteorological
conditions;
Information Required to Make AFC Conform with Regulations
Please correct labeling of Tables 4.1-29 thru 4.1-34 and throughout the text in order for staff, the
applicant, interveners, and interested parties to be able to identify and discuss air quality
information.
Response:
These tables in the AFC were inadvertently misnumbered. The tables have been corrected in
underline/strikeout text and are provided in Attachment AQ-3. Please note that the table call-outs
within the text of the AFC are correct as-is.

AQ-7
Siting Regulation: Appendix B(g)(8)(I) (iv)
An air dispersion modeling analysis of the impacts of the initial commissioning phase
emissions on state and federal ambient air quality standards for NOx, SO2, CO, PM10 and
PM2.5.
Information Required to Make AFC Conform with Regulations
Please correct labeling of Table 4.1-33 and throughout the text in order for staff, the applicant,
interveners, and interested parties to be able to identify and discuss air quality information.
Response:
These tables in the AFC were inadvertently misnumbered. The tables have been corrected in
underline/strikeout text and are provided in Attachment AQ-3. Please note that the table call-outs
within the text of the AFC are correct as-is.

AQ-8
Siting Regulation: Appendix B(i)(1)(A)
Tables which identify laws, regulations, ordinances, standards, adopted local, regional state,
and federal land use plans, leases, and permits applicable to the proposed project, and a
discussion of the applicability of, and conformance with each. The table or matrix shall
explicitly reference pages in the application wherein conformance, with each law or standard
during both construction and operation of the facility is discussed; and
Information Required to Make AFC Conform with Regulations
Please correct labeling of Tables 4.1-14 thru 4.1-15 (should be one table) and throughout the text
in order for staff, the applicant, interveners, and interested parties to be able to identify and
discuss air quality information.
Response:
These tables in the AFC were inadvertently misnumbered. The tables have been corrected in
underline/strikeout text and are provided in Attachment AQ-3. Please note that the table call-outs
within the text of the AFC are correct as-is.

AQ-9
Siting Regulation: Appendix B(i)(1)(B)
Tables which identify each agency with jurisdiction to issue applicable permits, leases, and
approvals or to enforce identified laws, regulations, standards, and adopted local, regional,
state and federal land use plans, and agencies which would have permit approval or
enforcement authority, but for the exclusive authority of the commission to certify sites and
related facilities.
Information Required to Make AFC Conform with Regulations
Please correct labeling of Tables 4.1-41 throughout the text in order for staff, the applicant,
interveners, and interested parties to be able to identify and discuss air quality information.
Response:
These tables in the AFC were inadvertently misnumbered. The tables have been corrected in
underline/strikeout text and are provided in Attachment AQ-3. Please note that the table call-outs
within the text of the AFC are correct as-is.

AQ-10
Siting Regulation: Appendix B(i)(2)
The name, title, phone number, address (required), and email address (if known), of an official
who was contacted within each agency, and also provide the name of the official who will serve
as a contact person for Commission staff.
Information Required to Make AFC Conform with Regulations
Please correct labeling of Tables 4.1-41 and throughout the text in order for staff, the applicant,
interveners, and interested parties to be able to identify and discuss air quality information.
Response:
These tables in the AFC were inadvertently misnumbered. The tables have been corrected in
underline/strikeout text and are provided in Attachment AQ-3. Please note that the table call-outs
within the text of the AFC are correct as-is.
ATTACHMENT A-3
CORRECTED AIR QUALITY SECTION 4.1
TABLES 4.1-1 TO 4.1-38
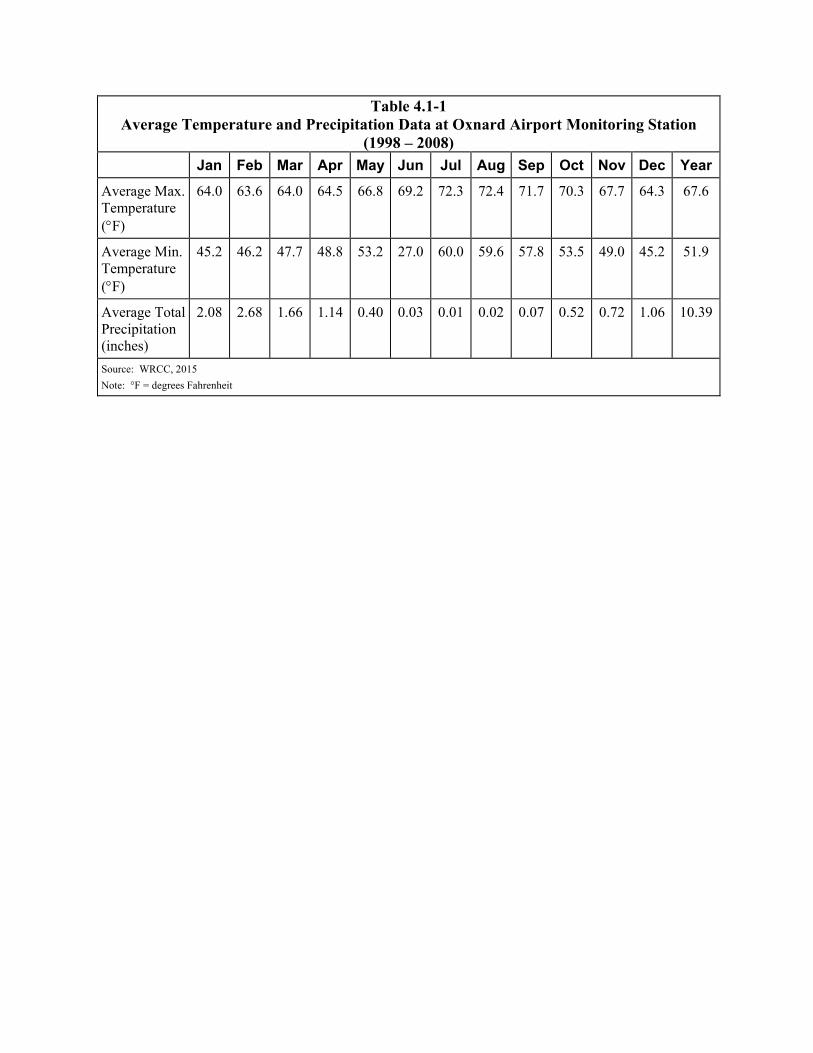
Table 4.1-1 Average Temperature and Precipitation Data at Oxnard Airport Monitoring Station
(1998 – 2008)
Jan Feb Mar Apr May Jun Jul Aug Sep Oct Nov Dec Year
Average Max. Temperature (F)
64.0 63.6 64.0 64.5 66.8 69.2 72.3 72.4 71.7 70.3 67.7 64.3 67.6
Average Min. Temperature (F)
45.2 46.2 47.7 48.8 53.2 27.0 60.0 59.6 57.8 53.5 49.0 45.2 51.9
Average Total Precipitation (inches)
2.08 2.68 1.66 1.14 0.40 0.03 0.01 0.02 0.07 0.52 0.72 1.06 10.39
Source: WRCC, 2015
Note: °F = degrees Fahrenheit
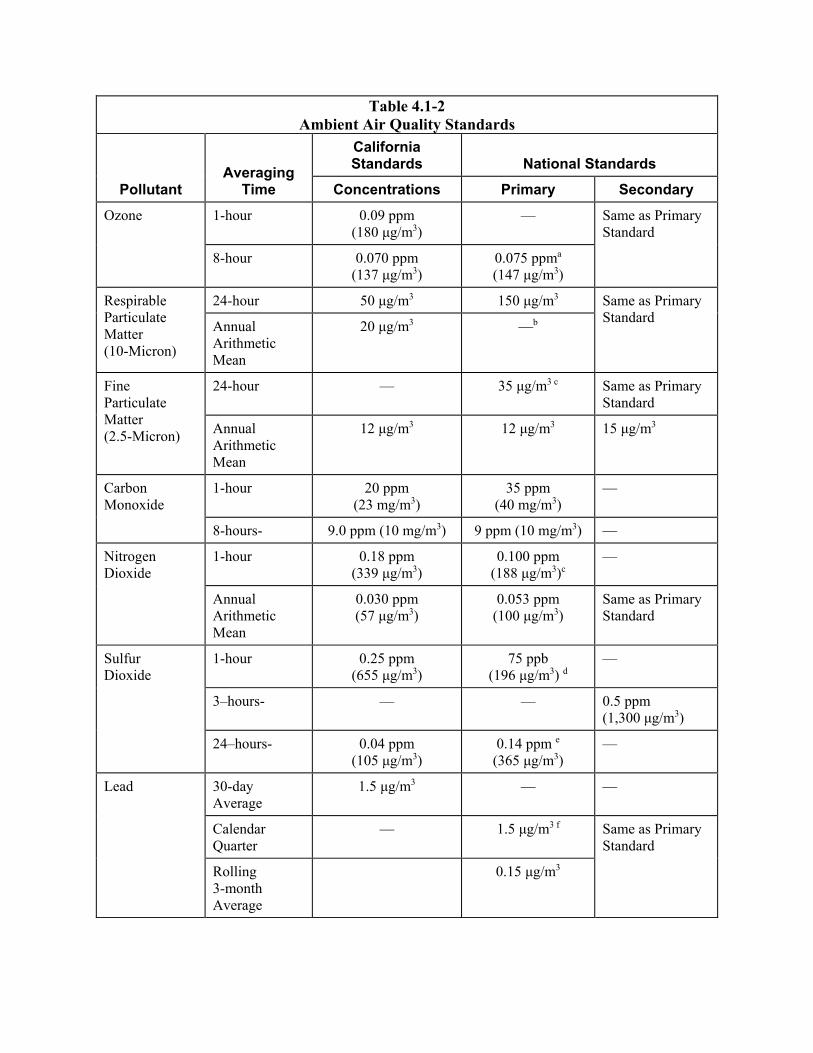
Table 4.1-2 Ambient Air Quality Standards
Pollutant Averaging
Time
California Standards National Standards
Concentrations Primary Secondary
Ozone 1-hour 0.09 ppm (180 μg/m3)
— Same as Primary Standard
8-hour 0.070 ppm (137 μg/m3)
0.075 ppma
(147 μg/m3)
Respirable Particulate Matter (10-Micron)
24-hour 50 μg/m3 150 μg/m3 Same as Primary Standard
Annual Arithmetic Mean
20 μg/m3 —b
Fine Particulate Matter (2.5-Micron)
24-hour — 35 μg/m3 c Same as Primary Standard
Annual Arithmetic Mean
12 μg/m3 12 μg/m3 15 μg/m3
Carbon Monoxide
1-hour 20 ppm (23 mg/m3)
35 ppm (40 mg/m3)
—
8-hours- 9.0 ppm (10 mg/m3) 9 ppm (10 mg/m3) —
Nitrogen Dioxide
1-hour 0.18 ppm (339 μg/m3)
0.100 ppm (188 μg/m3)c
—
Annual Arithmetic Mean
0.030 ppm (57 μg/m3)
0.053 ppm (100 μg/m3)
Same as Primary Standard
Sulfur Dioxide
1-hour 0.25 ppm (655 μg/m3)
75 ppb (196 μg/m3) d
—
3–hours- — — 0.5 ppm (1,300 μg/m3)
24–hours- 0.04 ppm (105 μg/m3)
0.14 ppm e (365 μg/m3)
—
Lead 30-day Average
1.5 μg/m3 — —
Calendar Quarter
— 1.5 μg/m3 f Same as Primary Standard
Rolling 3-month Average
0.15 μg/m3
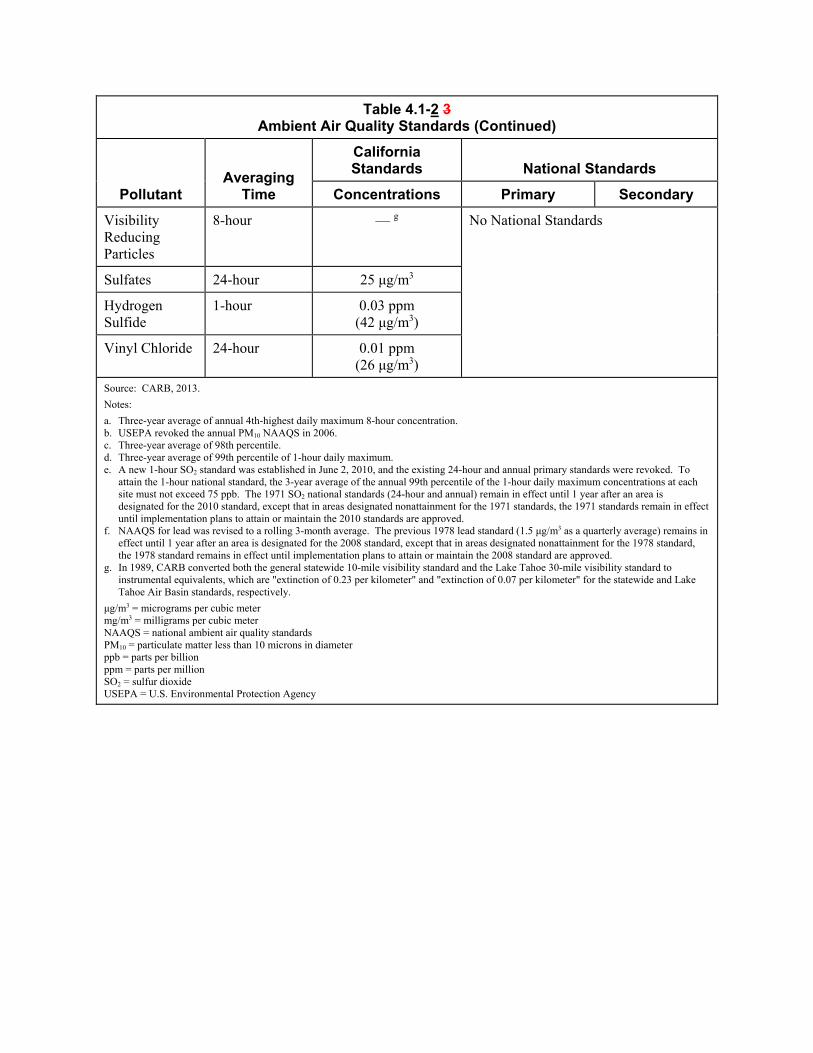
Table 4.1-2 3 Ambient Air Quality Standards (Continued)
Pollutant Averaging
Time
California Standards National Standards
Concentrations Primary Secondary
Visibility Reducing Particles
8-hour — g No National Standards
Sulfates 24-hour 25 μg/m3
Hydrogen Sulfide
1-hour 0.03 ppm (42 μg/m3)
Vinyl Chloride 24-hour 0.01 ppm (26 μg/m3)
Source: CARB, 2013.
Notes:
a. Three-year average of annual 4th-highest daily maximum 8-hour concentration. b. USEPA revoked the annual PM10 NAAQS in 2006. c. Three-year average of 98th percentile. d. Three-year average of 99th percentile of 1-hour daily maximum. e. A new 1-hour SO2 standard was established in June 2, 2010, and the existing 24-hour and annual primary standards were revoked. To
attain the 1-hour national standard, the 3-year average of the annual 99th percentile of the 1-hour daily maximum concentrations at each site must not exceed 75 ppb. The 1971 SO2 national standards (24-hour and annual) remain in effect until 1 year after an area is designated for the 2010 standard, except that in areas designated nonattainment for the 1971 standards, the 1971 standards remain in effect until implementation plans to attain or maintain the 2010 standards are approved.
f. NAAQS for lead was revised to a rolling 3-month average. The previous 1978 lead standard (1.5 μg/m3 as a quarterly average) remains in effect until 1 year after an area is designated for the 2008 standard, except that in areas designated nonattainment for the 1978 standard, the 1978 standard remains in effect until implementation plans to attain or maintain the 2008 standard are approved.
g. In 1989, CARB converted both the general statewide 10-mile visibility standard and the Lake Tahoe 30-mile visibility standard to instrumental equivalents, which are "extinction of 0.23 per kilometer" and "extinction of 0.07 per kilometer" for the statewide and Lake Tahoe Air Basin standards, respectively.
μg/m3 = micrograms per cubic meter mg/m3 = milligrams per cubic meter NAAQS = national ambient air quality standards PM10 = particulate matter less than 10 microns in diameter ppb = parts per billion ppm = parts per million SO2 = sulfur dioxide USEPA = U.S. Environmental Protection Agency
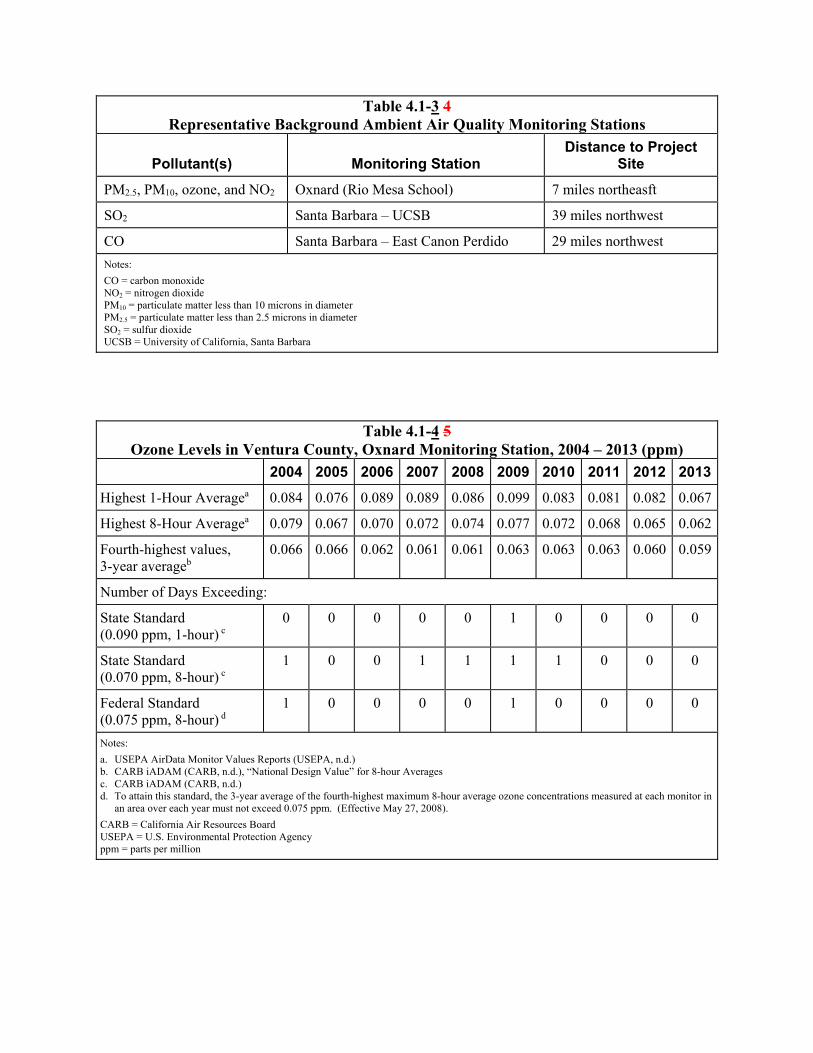
Table 4.1-3 4 Representative Background Ambient Air Quality Monitoring Stations
Pollutant(s) Monitoring Station Distance to Project
Site
PM2.5, PM10, ozone, and NO2 Oxnard (Rio Mesa School) 7 miles northeasft
SO2 Santa Barbara – UCSB 39 miles northwest
CO Santa Barbara – East Canon Perdido 29 miles northwest
Notes:
CO = carbon monoxide NO2 = nitrogen dioxide PM10 = particulate matter less than 10 microns in diameter PM2.5 = particulate matter less than 2.5 microns in diameter SO2 = sulfur dioxide UCSB = University of California, Santa Barbara
Table 4.1-4 5 Ozone Levels in Ventura County, Oxnard Monitoring Station, 2004 – 2013 (ppm)
2004 2005 2006 2007 2008 2009 2010 2011 2012 2013
Highest 1-Hour Averagea 0.084 0.076 0.089 0.089 0.086 0.099 0.083 0.081 0.082 0.067
Highest 8-Hour Averagea 0.079 0.067 0.070 0.072 0.074 0.077 0.072 0.068 0.065 0.062
Fourth-highest values, 3-year averageb
0.066 0.066 0.062 0.061 0.061 0.063 0.063 0.063 0.060 0.059
Number of Days Exceeding:
State Standard (0.090 ppm, 1-hour) c
0 0 0 0 0 1 0 0 0 0
State Standard (0.070 ppm, 8-hour) c
1 0 0 1 1 1 1 0 0 0
Federal Standard
(0.075 ppm, 8-hour) d 1 0 0 0 0 1 0 0 0 0
Notes:
a. USEPA AirData Monitor Values Reports (USEPA, n.d.) b. CARB iADAM (CARB, n.d.), “National Design Value” for 8-hour Averages c. CARB iADAM (CARB, n.d.) d. To attain this standard, the 3-year average of the fourth-highest maximum 8-hour average ozone concentrations measured at each monitor in
an area over each year must not exceed 0.075 ppm. (Effective May 27, 2008).
CARB = California Air Resources Board USEPA = U.S. Environmental Protection Agency ppm = parts per million
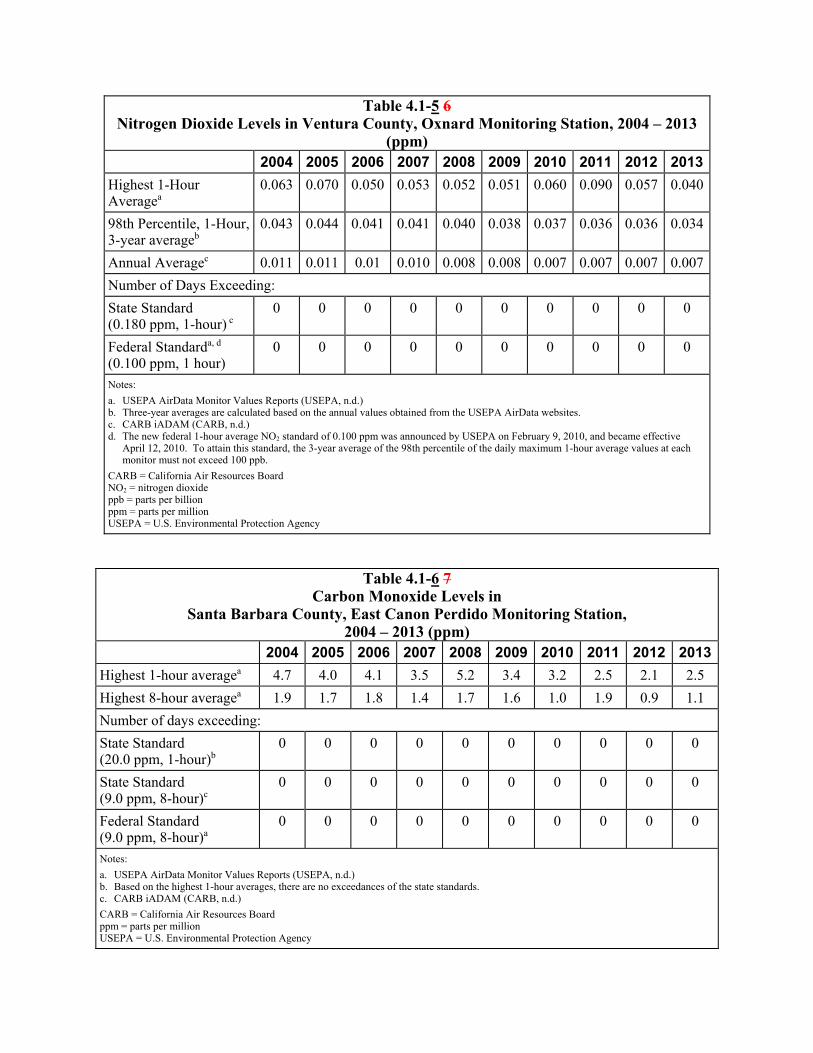
Table 4.1-5 6Nitrogen Dioxide Levels in Ventura County, Oxnard Monitoring Station, 2004 – 2013
(ppm) 2004 2005 2006 2007 2008 2009 2010 2011 2012 2013
Highest 1-Hour Averagea
0.063 0.070 0.050 0.053 0.052 0.051 0.060 0.090 0.057 0.040
98th Percentile, 1-Hour, 3-year averageb
0.043 0.044 0.041 0.041 0.040 0.038 0.037 0.036 0.036 0.034
Annual Averagec 0.011 0.011 0.01 0.010 0.008 0.008 0.007 0.007 0.007 0.007
Number of Days Exceeding:
State Standard (0.180 ppm, 1-hour) c
0 0 0 0 0 0 0 0 0 0
Federal Standarda, d
(0.100 ppm, 1 hour) 0 0 0 0 0 0 0 0 0 0
Notes:
a. USEPA AirData Monitor Values Reports (USEPA, n.d.) b. Three-year averages are calculated based on the annual values obtained from the USEPA AirData websites. c. CARB iADAM (CARB, n.d.) d. The new federal 1-hour average NO2 standard of 0.100 ppm was announced by USEPA on February 9, 2010, and became effective
April 12, 2010. To attain this standard, the 3-year average of the 98th percentile of the daily maximum 1-hour average values at each monitor must not exceed 100 ppb.
CARB = California Air Resources Board NO2 = nitrogen dioxide ppb = parts per billion ppm = parts per million USEPA = U.S. Environmental Protection Agency
Table 4.1-6 7Carbon Monoxide Levels in
Santa Barbara County, East Canon Perdido Monitoring Station, 2004 – 2013 (ppm)
2004 2005 2006 2007 2008 2009 2010 2011 2012 2013
Highest 1-hour averagea 4.7 4.0 4.1 3.5 5.2 3.4 3.2 2.5 2.1 2.5
Highest 8-hour averagea 1.9 1.7 1.8 1.4 1.7 1.6 1.0 1.9 0.9 1.1
Number of days exceeding:
State Standard (20.0 ppm, 1-hour)b
0 0 0 0 0 0 0 0 0 0
State Standard (9.0 ppm, 8-hour)c
0 0 0 0 0 0 0 0 0 0
Federal Standard (9.0 ppm, 8-hour)a
0 0 0 0 0 0 0 0 0 0
Notes:
a. USEPA AirData Monitor Values Reports (USEPA, n.d.) b. Based on the highest 1-hour averages, there are no exceedances of the state standards. c. CARB iADAM (CARB, n.d.)
CARB = California Air Resources Board ppm = parts per million USEPA = U.S. Environmental Protection Agency

Table 4.1-7 8 Sulfur Dioxide Levels in Santa Barbara County, UCSB West Campus Monitoring
Station, 2004 – 2013 (ppm)
2004 2005 2006 2007 2008 2009 2010 2011 2012 2013
Highest 1-Hour Averagea 0.006 0.006 0.009 0.005 0.006 0.004 0.005 0.003 0.002 0.002
Highest 24-Hour Averagea
0.001 0.002 0.002 0.002 0.003 0.001 0.002 0.001 0.001 0.002
99th percentile 1-Hour, 3-year averageb
0.004 0.004 0.004 0.004 0.004 0.004 0.004 0.003 0.003 0.002
Annual Averagec 0.000 0.000 0.000 0.000 0.000 0.000 0.000 0.000 e e
Number of days exceeding:
State Standard (0.25 ppm, 1-hour)d
0 0 0 0 0 0 0 0 0 0
Federal Standarda (75 ppb, 1-hour)a
0 0 0 0 0 0 0 0 0 0
State Standard (0.040 ppm, 24-hour)d
0 0 0 0 0 0 0 0 0 0
Federal Standard (0.140 ppm, 24-hour)a
0 0 0 0 0 0 0 0 0 0
Notes:
a. USEPA AirData Monitor Values Reports ( USEPA, n.d.) b. Three-year averages are calculated based on the annual 99th percentile 1-hour averages obtained from USEPA Air Data Final Rule
signed June 22, 2010, effective August 23, 2010. To attain this standard, the 3-year average of the 99th percentile of the daily maximum 1-hour average at each monitor within an area must not exceed 75 ppb.
c. CARB iADAM (CARB, n.d.) d. Based on the highest 1-hour and 24-hour averages obtained, the state standards were not exceeded, so there are zero days of
exceedances. e. There were insufficient data available to determine the value. CARB = California Air Resources Board ppb = parts per billion ppm = parts per million UCSB = University of California, Santa Barbara USEPA = U.S. Environmental Protection Agency
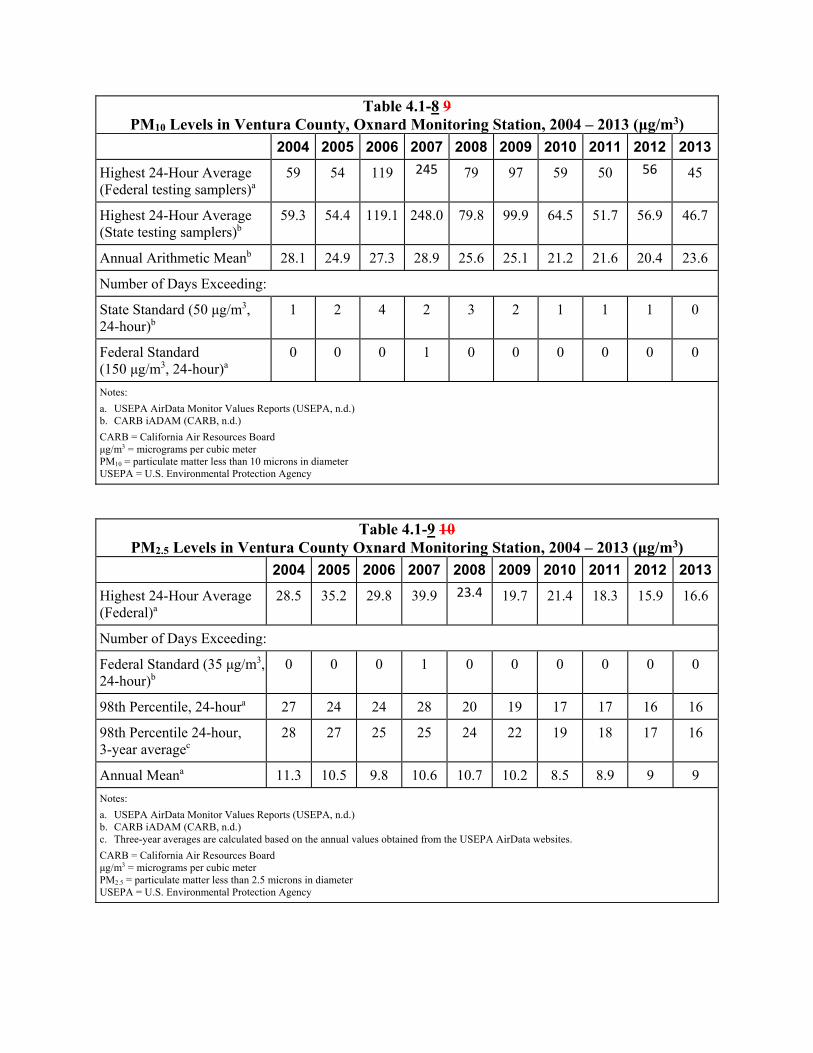
Table 4.1-8 9 PM10 Levels in Ventura County, Oxnard Monitoring Station, 2004 – 2013 (μg/m3)
2004 2005 2006 2007 2008 2009 2010 2011 2012 2013
Highest 24-Hour Average (Federal testing samplers)a
59 54 119 245 79 97 59 50 56 45
Highest 24-Hour Average (State testing samplers)b
59.3 54.4 119.1 248.0 79.8 99.9 64.5 51.7 56.9 46.7
Annual Arithmetic Meanb 28.1 24.9 27.3 28.9 25.6 25.1 21.2 21.6 20.4 23.6
Number of Days Exceeding:
State Standard (50 μg/m3, 24-hour)b
1 2 4 2 3 2 1 1 1 0
Federal Standard (150 μg/m3, 24-hour)a
0 0 0 1 0 0 0 0 0 0
Notes:
a. USEPA AirData Monitor Values Reports (USEPA, n.d.) b. CARB iADAM (CARB, n.d.)
CARB = California Air Resources Board μg/m3 = micrograms per cubic meter PM10 = particulate matter less than 10 microns in diameter USEPA = U.S. Environmental Protection Agency
Table 4.1-9 10 PM2.5 Levels in Ventura County Oxnard Monitoring Station, 2004 – 2013 (μg/m3)
2004 2005 2006 2007 2008 2009 2010 2011 2012 2013
Highest 24-Hour Average (Federal)a
28.5 35.2 29.8 39.9 23.4 19.7 21.4 18.3 15.9 16.6
Number of Days Exceeding:
Federal Standard (35 μg/m3, 24-hour)b
0 0 0 1 0 0 0 0 0 0
98th Percentile, 24-houra 27 24 24 28 20 19 17 17 16 16
98th Percentile 24-hour, 3-year averagec
28 27 25 25 24 22 19 18 17 16
Annual Meana 11.3 10.5 9.8 10.6 10.7 10.2 8.5 8.9 9 9
Notes:
a. USEPA AirData Monitor Values Reports (USEPA, n.d.) b. CARB iADAM (CARB, n.d.) c. Three-year averages are calculated based on the annual values obtained from the USEPA AirData websites. CARB = California Air Resources Board μg/m3 = micrograms per cubic meter PM2.5 = particulate matter less than 2.5 microns in diameter USEPA = U.S. Environmental Protection Agency
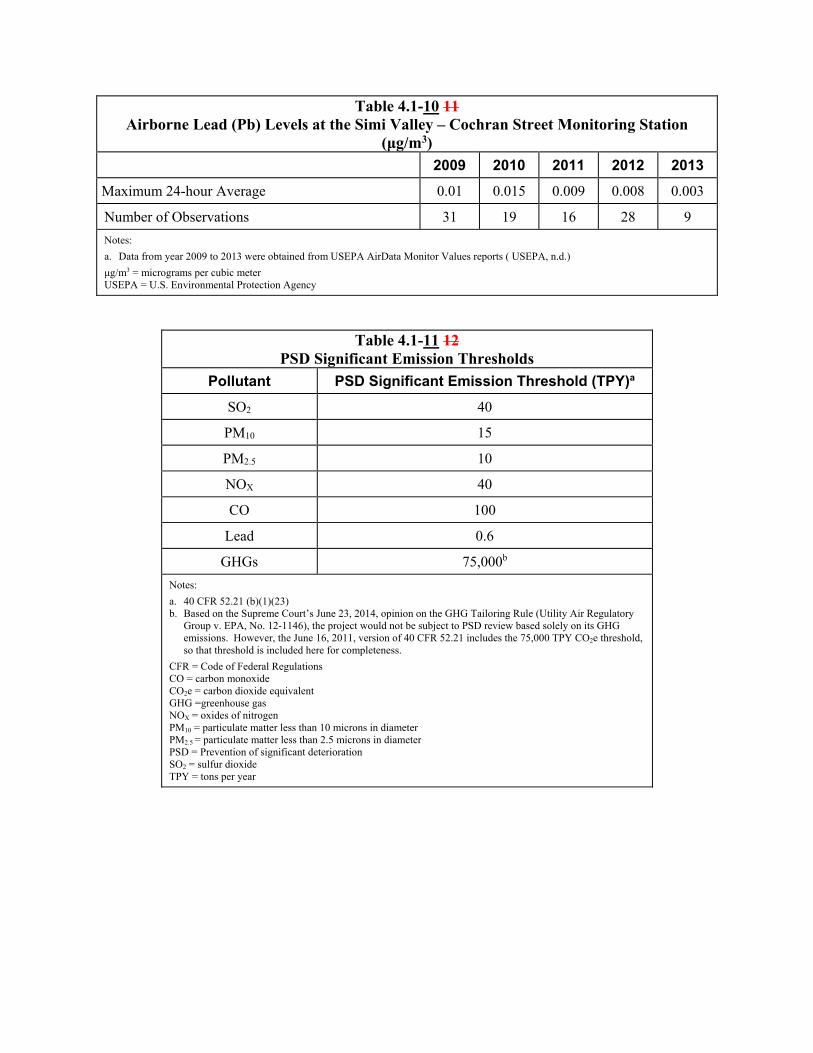
Table 4.1-10 11 Airborne Lead (Pb) Levels at the Simi Valley – Cochran Street Monitoring Station
(μg/m3)
2009 2010 2011 2012 2013
Maximum 24-hour Average 0.01 0.015 0.009 0.008 0.003
Number of Observations 31 19 16 28 9
Notes:
a. Data from year 2009 to 2013 were obtained from USEPA AirData Monitor Values reports ( USEPA, n.d.)
μg/m3 = micrograms per cubic meter USEPA = U.S. Environmental Protection Agency
Table 4.1-11 12 PSD Significant Emission Thresholds
Pollutant PSD Significant Emission Threshold (TPY)a
SO2 40
PM10 15
PM2.5 10
NOX 40
CO 100
Lead 0.6
GHGs 75,000b
Notes:
a. 40 CFR 52.21 (b)(1)(23) b. Based on the Supreme Court’s June 23, 2014, opinion on the GHG Tailoring Rule (Utility Air Regulatory
Group v. EPA, No. 12-1146), the project would not be subject to PSD review based solely on its GHG emissions. However, the June 16, 2011, version of 40 CFR 52.21 includes the 75,000 TPY CO2e threshold, so that threshold is included here for completeness.
CFR = Code of Federal Regulations CO = carbon monoxide CO2e = carbon dioxide equivalent GHG =greenhouse gas NOX = oxides of nitrogen PM10 = particulate matter less than 10 microns in diameter PM2.5 = particulate matter less than 2.5 microns in diameter PSD = Prevention of significant deterioration SO2 = sulfur dioxide TPY = tons per year
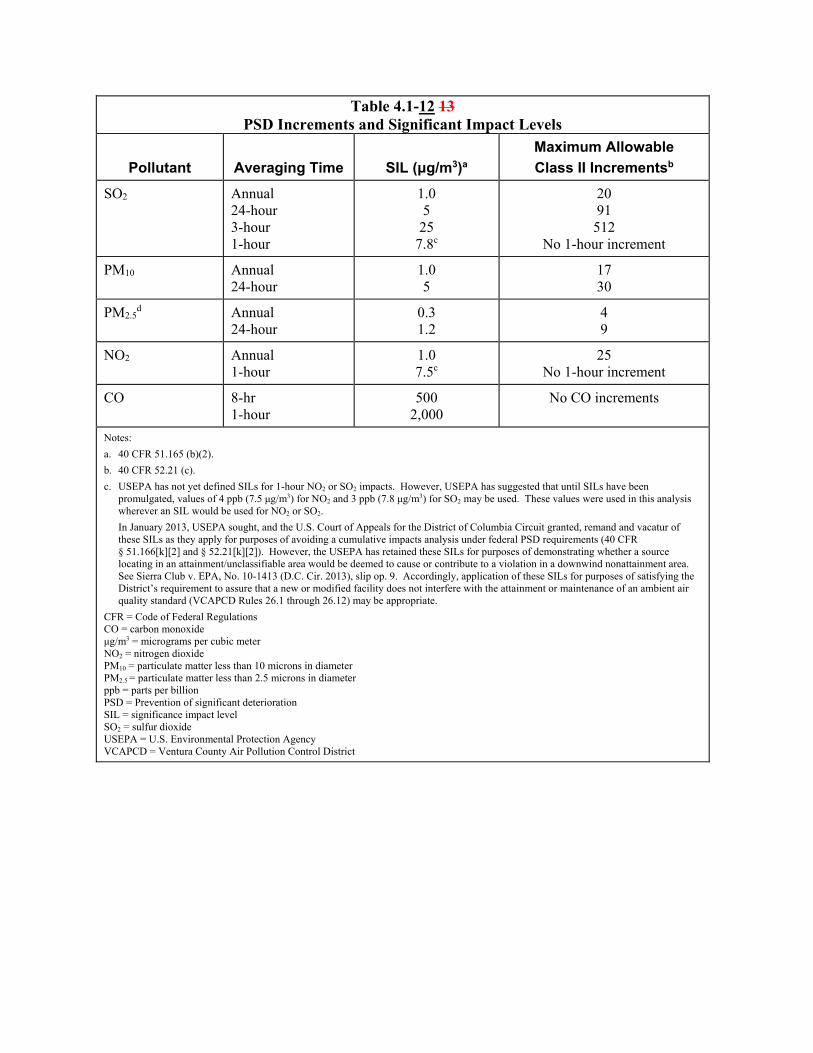
Table 4.1-12 13 PSD Increments and Significant Impact Levels
Pollutant Averaging Time SIL (μg/m3)a
Maximum Allowable
Class II Incrementsb
SO2 Annual 24-hour 3-hour 1-hour
1.0 5
25 7.8c
20 91
512 No 1-hour increment
PM10 Annual 24-hour
1.0 5
17 30
PM2.5d Annual
24-hour 0.3 1.2
4 9
NO2 Annual 1-hour
1.0 7.5c
25 No 1-hour increment
CO 8-hr 1-hour
500 2,000
No CO increments
Notes:
a. 40 CFR 51.165 (b)(2).
b. 40 CFR 52.21 (c).
c. USEPA has not yet defined SILs for 1-hour NO2 or SO2 impacts. However, USEPA has suggested that until SILs have been promulgated, values of 4 ppb (7.5 μg/m3) for NO2 and 3 ppb (7.8 μg/m3) for SO2 may be used. These values were used in this analysis wherever an SIL would be used for NO2 or SO2.
In January 2013, USEPA sought, and the U.S. Court of Appeals for the District of Columbia Circuit granted, remand and vacatur of these SILs as they apply for purposes of avoiding a cumulative impacts analysis under federal PSD requirements (40 CFR § 51.166[k][2] and § 52.21[k][2]). However, the USEPA has retained these SILs for purposes of demonstrating whether a source locating in an attainment/unclassifiable area would be deemed to cause or contribute to a violation in a downwind nonattainment area. See Sierra Club v. EPA, No. 10-1413 (D.C. Cir. 2013), slip op. 9. Accordingly, application of these SILs for purposes of satisfying the District’s requirement to assure that a new or modified facility does not interfere with the attainment or maintenance of an ambient air quality standard (VCAPCD Rules 26.1 through 26.12) may be appropriate.
CFR = Code of Federal Regulations CO = carbon monoxide μg/m3 = micrograms per cubic meter NO2 = nitrogen dioxide PM10 = particulate matter less than 10 microns in diameter PM2.5 = particulate matter less than 2.5 microns in diameter ppb = parts per billion PSD = Prevention of significant deterioration SIL = significance impact level SO2 = sulfur dioxide USEPA = U.S. Environmental Protection Agency VCAPCD = Ventura County Air Pollution Control District
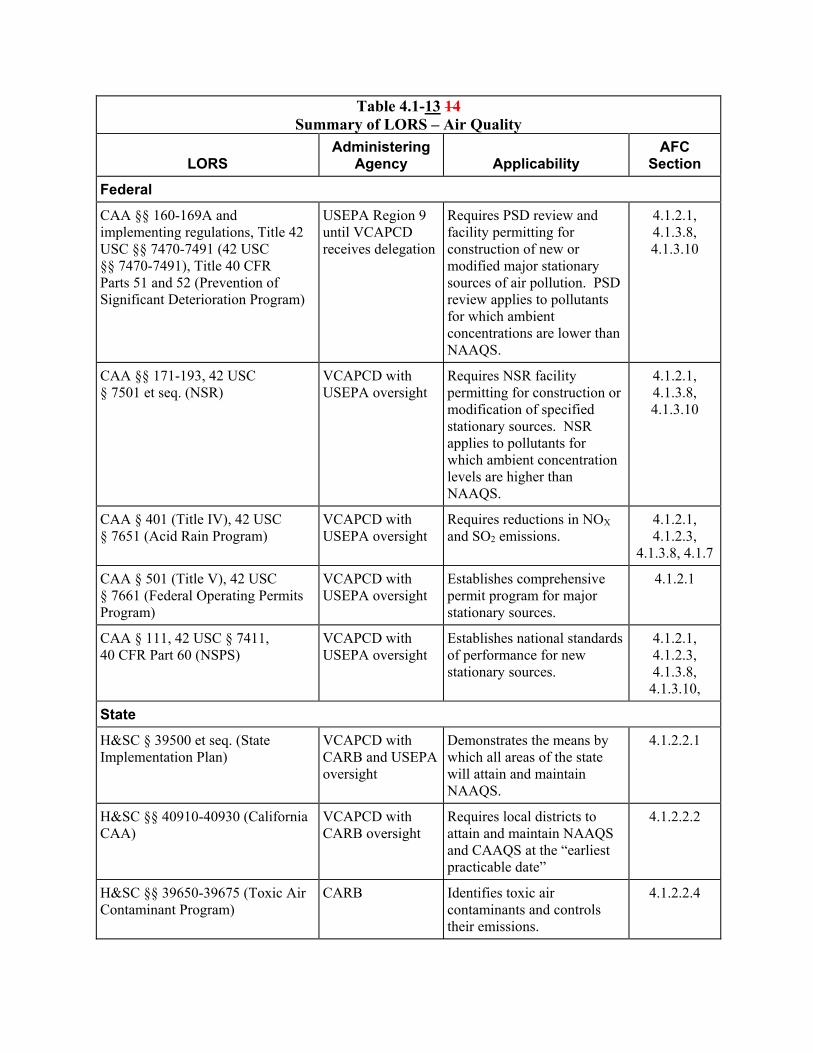
Table 4.1-13 14 Summary of LORS – Air Quality
LORS Administering
Agency Applicability AFC
Section
Federal
CAA §§ 160-169A and implementing regulations, Title 42 USC §§ 7470-7491 (42 USC §§ 7470-7491), Title 40 CFR Parts 51 and 52 (Prevention of Significant Deterioration Program)
USEPA Region 9 until VCAPCD receives delegation
Requires PSD review and facility permitting for construction of new or modified major stationary sources of air pollution. PSD review applies to pollutants for which ambient concentrations are lower than NAAQS.
4.1.2.1, 4.1.3.8, 4.1.3.10
CAA §§ 171-193, 42 USC § 7501 et seq. (NSR)
VCAPCD with USEPA oversight
Requires NSR facility permitting for construction or modification of specified stationary sources. NSR applies to pollutants for which ambient concentration levels are higher than NAAQS.
4.1.2.1, 4.1.3.8, 4.1.3.10
CAA § 401 (Title IV), 42 USC § 7651 (Acid Rain Program)
VCAPCD with USEPA oversight
Requires reductions in NOX and SO2 emissions.
4.1.2.1, 4.1.2.3,
4.1.3.8, 4.1.7
CAA § 501 (Title V), 42 USC § 7661 (Federal Operating Permits Program)
VCAPCD with USEPA oversight
Establishes comprehensive permit program for major stationary sources.
4.1.2.1
CAA § 111, 42 USC § 7411, 40 CFR Part 60 (NSPS)
VCAPCD with USEPA oversight
Establishes national standards of performance for new stationary sources.
4.1.2.1, 4.1.2.3, 4.1.3.8,
4.1.3.10,
State
H&SC § 39500 et seq. (State Implementation Plan)
VCAPCD with CARB and USEPA oversight
Demonstrates the means by which all areas of the state will attain and maintain NAAQS.
4.1.2.2.1
H&SC §§ 40910-40930 (California CAA)
VCAPCD with CARB oversight
Requires local districts to attain and maintain NAAQS and CAAQS at the “earliest practicable date”
4.1.2.2.2
H&SC §§ 39650-39675 (Toxic Air Contaminant Program)
CARB Identifies toxic air contaminants and controls their emissions.
4.1.2.2.4
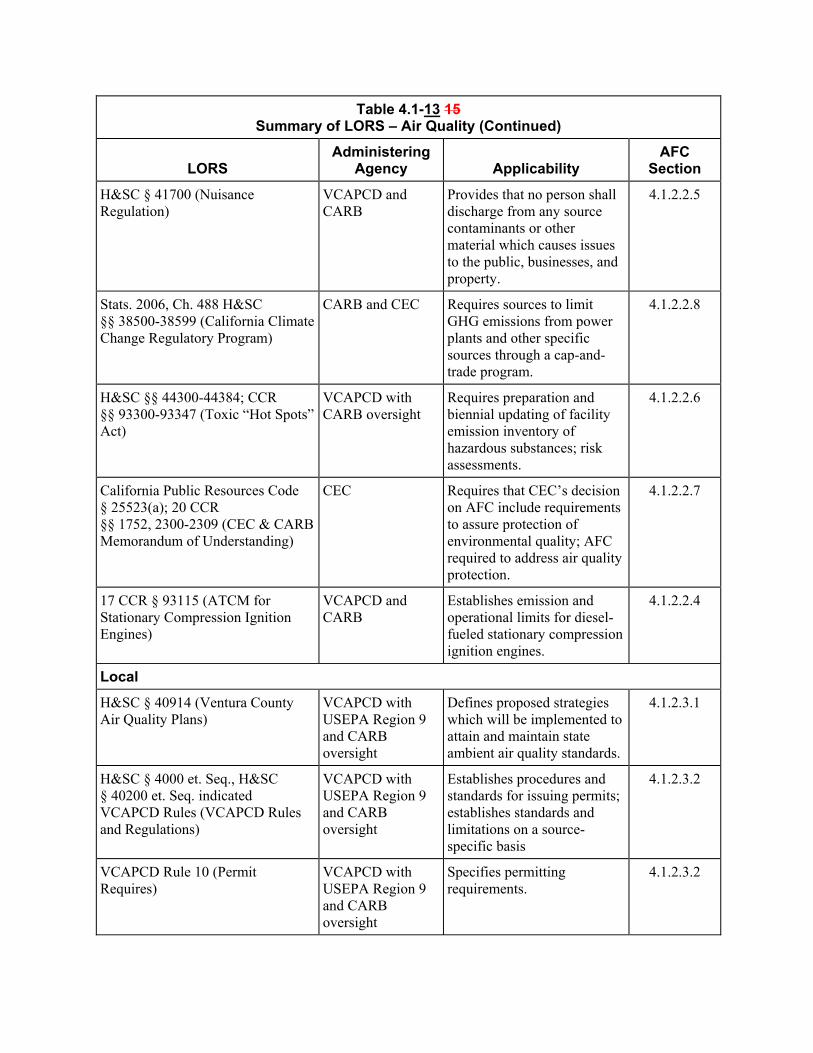
Table 4.1-13 15 Summary of LORS – Air Quality (Continued)
LORS Administering
Agency Applicability AFC
Section
H&SC § 41700 (Nuisance Regulation)
VCAPCD and CARB
Provides that no person shall discharge from any source contaminants or other material which causes issues to the public, businesses, and property.
4.1.2.2.5
Stats. 2006, Ch. 488 H&SC §§ 38500-38599 (California Climate Change Regulatory Program)
CARB and CEC Requires sources to limit GHG emissions from power plants and other specific sources through a cap-and-trade program.
4.1.2.2.8
H&SC §§ 44300-44384; CCR §§ 93300-93347 (Toxic “Hot Spots” Act)
VCAPCD with CARB oversight
Requires preparation and biennial updating of facility emission inventory of hazardous substances; risk assessments.
4.1.2.2.6
California Public Resources Code § 25523(a); 20 CCR §§ 1752, 2300-2309 (CEC & CARB Memorandum of Understanding)
CEC Requires that CEC’s decision on AFC include requirements to assure protection of environmental quality; AFC required to address air quality protection.
4.1.2.2.7
17 CCR § 93115 (ATCM for Stationary Compression Ignition Engines)
VCAPCD and CARB
Establishes emission and operational limits for diesel-fueled stationary compression ignition engines.
4.1.2.2.4
Local
H&SC § 40914 (Ventura County Air Quality Plans)
VCAPCD with USEPA Region 9 and CARB oversight
Defines proposed strategies which will be implemented to attain and maintain state ambient air quality standards.
4.1.2.3.1
H&SC § 4000 et. Seq., H&SC § 40200 et. Seq. indicated VCAPCD Rules (VCAPCD Rules and Regulations)
VCAPCD with USEPA Region 9 and CARB oversight
Establishes procedures and standards for issuing permits; establishes standards and limitations on a source-specific basis
4.1.2.3.2
VCAPCD Rule 10 (Permit Requires)
VCAPCD with USEPA Region 9 and CARB oversight
Specifies permitting requirements.
4.1.2.3.2
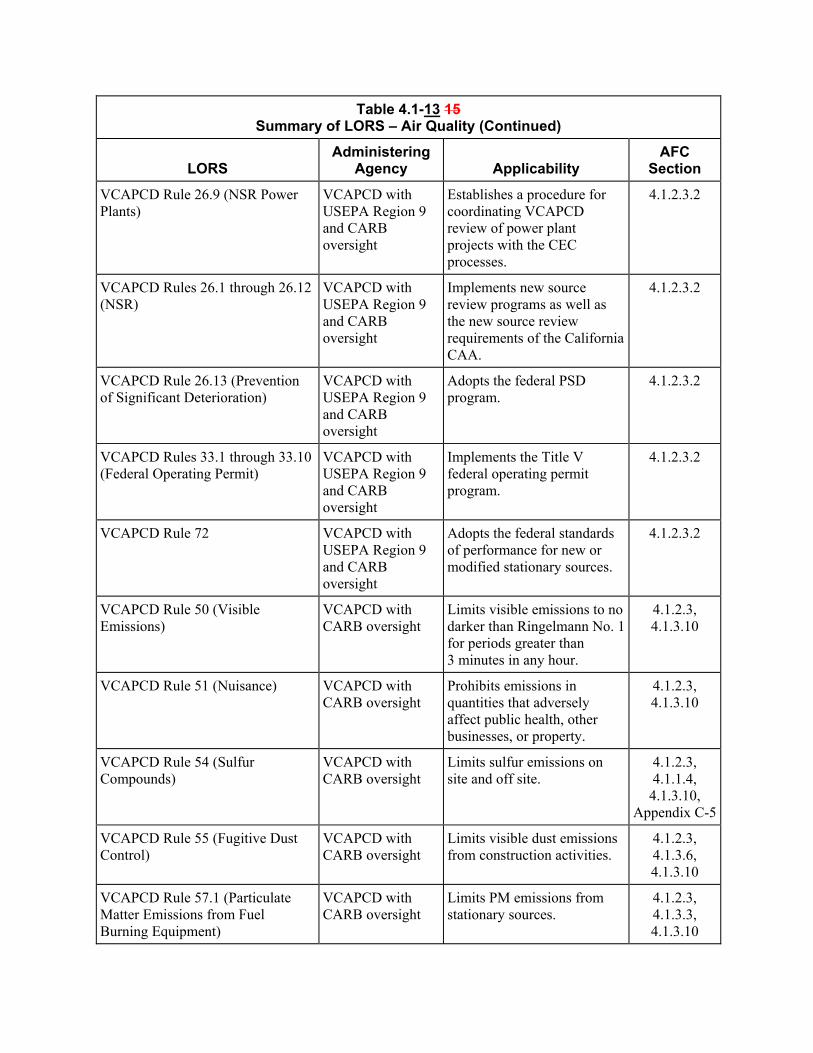
Table 4.1-13 15 Summary of LORS – Air Quality (Continued)
LORS Administering
Agency Applicability AFC
Section
VCAPCD Rule 26.9 (NSR Power Plants)
VCAPCD with USEPA Region 9 and CARB oversight
Establishes a procedure for coordinating VCAPCD review of power plant projects with the CEC processes.
4.1.2.3.2
VCAPCD Rules 26.1 through 26.12 (NSR)
VCAPCD with USEPA Region 9 and CARB oversight
Implements new source review programs as well as the new source review requirements of the California CAA.
4.1.2.3.2
VCAPCD Rule 26.13 (Prevention of Significant Deterioration)
VCAPCD with USEPA Region 9 and CARB oversight
Adopts the federal PSD program.
4.1.2.3.2
VCAPCD Rules 33.1 through 33.10 (Federal Operating Permit)
VCAPCD with USEPA Region 9 and CARB oversight
Implements the Title V federal operating permit program.
4.1.2.3.2
VCAPCD Rule 72 VCAPCD with USEPA Region 9 and CARB oversight
Adopts the federal standards of performance for new or modified stationary sources.
4.1.2.3.2
VCAPCD Rule 50 (Visible Emissions)
VCAPCD with CARB oversight
Limits visible emissions to no darker than Ringelmann No. 1 for periods greater than 3 minutes in any hour.
4.1.2.3, 4.1.3.10
VCAPCD Rule 51 (Nuisance) VCAPCD with CARB oversight
Prohibits emissions in quantities that adversely affect public health, other businesses, or property.
4.1.2.3, 4.1.3.10
VCAPCD Rule 54 (Sulfur Compounds)
VCAPCD with CARB oversight
Limits sulfur emissions on site and off site.
4.1.2.3, 4.1.1.4,
4.1.3.10, Appendix C-5
VCAPCD Rule 55 (Fugitive Dust Control)
VCAPCD with CARB oversight
Limits visible dust emissions from construction activities.
4.1.2.3, 4.1.3.6, 4.1.3.10
VCAPCD Rule 57.1 (Particulate Matter Emissions from Fuel Burning Equipment)
VCAPCD with CARB oversight
Limits PM emissions from stationary sources.
4.1.2.3, 4.1.3.3, 4.1.3.10
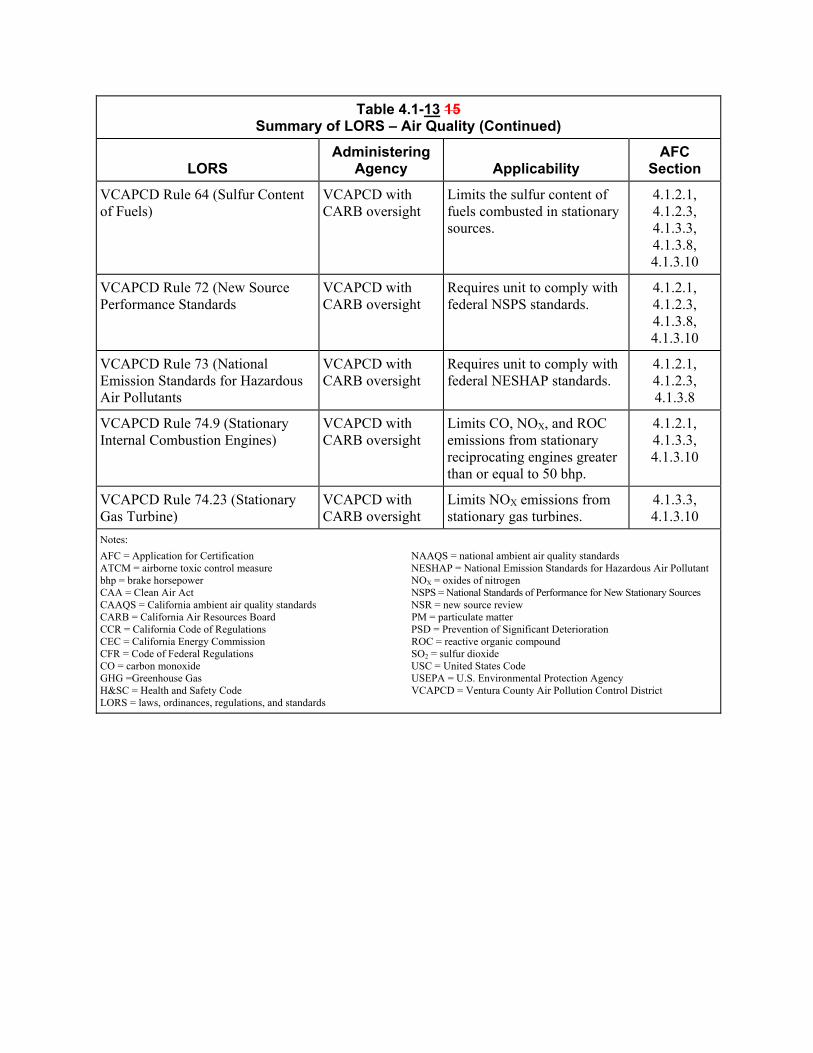
Table 4.1-13 15 Summary of LORS – Air Quality (Continued)
LORS Administering
Agency Applicability AFC
Section
VCAPCD Rule 64 (Sulfur Content of Fuels)
VCAPCD with CARB oversight
Limits the sulfur content of fuels combusted in stationary sources.
4.1.2.1, 4.1.2.3, 4.1.3.3, 4.1.3.8, 4.1.3.10
VCAPCD Rule 72 (New Source Performance Standards
VCAPCD with CARB oversight
Requires unit to comply with federal NSPS standards.
4.1.2.1, 4.1.2.3, 4.1.3.8, 4.1.3.10
VCAPCD Rule 73 (National Emission Standards for Hazardous Air Pollutants
VCAPCD with CARB oversight
Requires unit to comply with federal NESHAP standards.
4.1.2.1, 4.1.2.3, 4.1.3.8
VCAPCD Rule 74.9 (Stationary Internal Combustion Engines)
VCAPCD with CARB oversight
Limits CO, NOX, and ROC emissions from stationary reciprocating engines greater than or equal to 50 bhp.
4.1.2.1, 4.1.3.3, 4.1.3.10
VCAPCD Rule 74.23 (Stationary Gas Turbine)
VCAPCD with CARB oversight
Limits NOX emissions from stationary gas turbines.
4.1.3.3, 4.1.3.10
Notes:
AFC = Application for Certification NAAQS = national ambient air quality standards ATCM = airborne toxic control measure NESHAP = National Emission Standards for Hazardous Air Pollutant bhp = brake horsepower NOX = oxides of nitrogen CAA = Clean Air Act NSPS = National Standards of Performance for New Stationary Sources CAAQS = California ambient air quality standards NSR = new source review CARB = California Air Resources Board PM = particulate matter CCR = California Code of Regulations PSD = Prevention of Significant Deterioration CEC = California Energy Commission ROC = reactive organic compound CFR = Code of Federal Regulations SO2 = sulfur dioxide CO = carbon monoxide USC = United States Code GHG =Greenhouse Gas USEPA = U.S. Environmental Protection Agency H&SC = Health and Safety Code VCAPCD = Ventura County Air Pollution Control District LORS = laws, ordinances, regulations, and standards
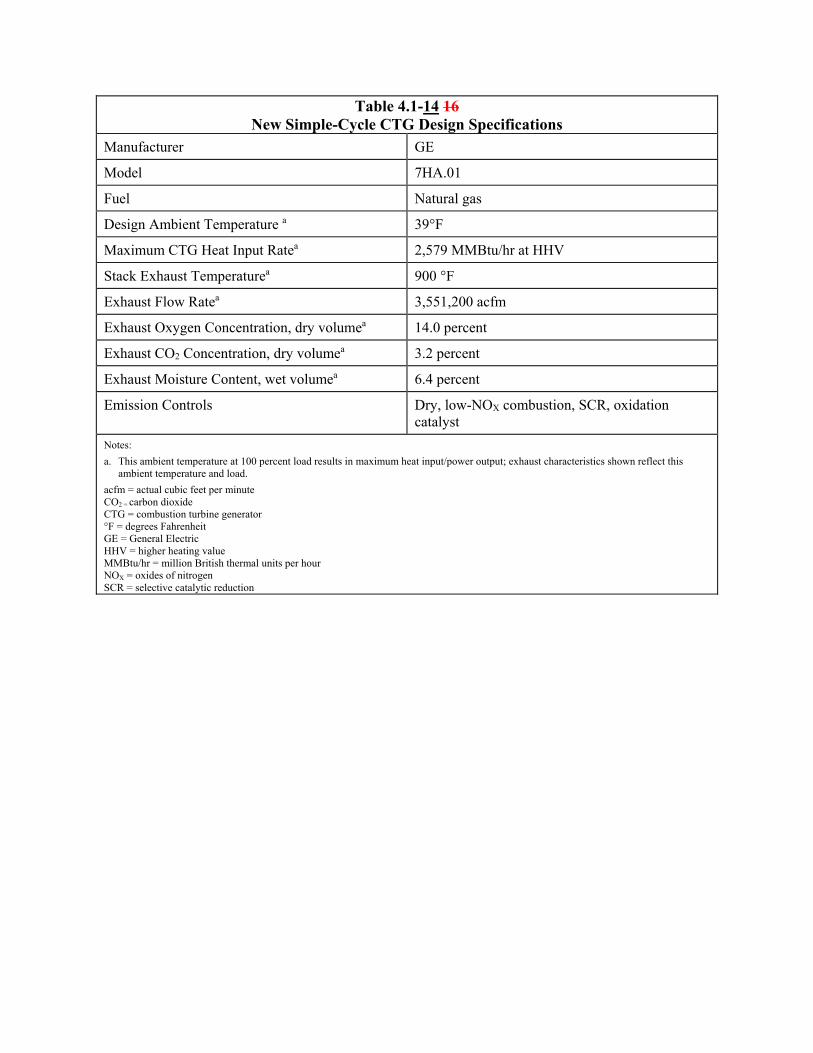
Table 4.1-14 16 New Simple-Cycle CTG Design Specifications
Manufacturer GE
Model 7HA.01
Fuel Natural gas
Design Ambient Temperature a 39°F
Maximum CTG Heat Input Ratea 2,579 MMBtu/hr at HHV
Stack Exhaust Temperaturea 900 °F
Exhaust Flow Ratea 3,551,200 acfm
Exhaust Oxygen Concentration, dry volumea 14.0 percent
Exhaust CO2 Concentration, dry volumea 3.2 percent
Exhaust Moisture Content, wet volumea 6.4 percent
Emission Controls Dry, low-NOX combustion, SCR, oxidation catalyst
Notes:
a. This ambient temperature at 100 percent load results in maximum heat input/power output; exhaust characteristics shown reflect this ambient temperature and load.
acfm = actual cubic feet per minute CO2 = carbon dioxide CTG = combustion turbine generator °F = degrees Fahrenheit GE = General Electric HHV = higher heating value MMBtu/hr = million British thermal units per hour NOX = oxides of nitrogen SCR = selective catalytic reduction
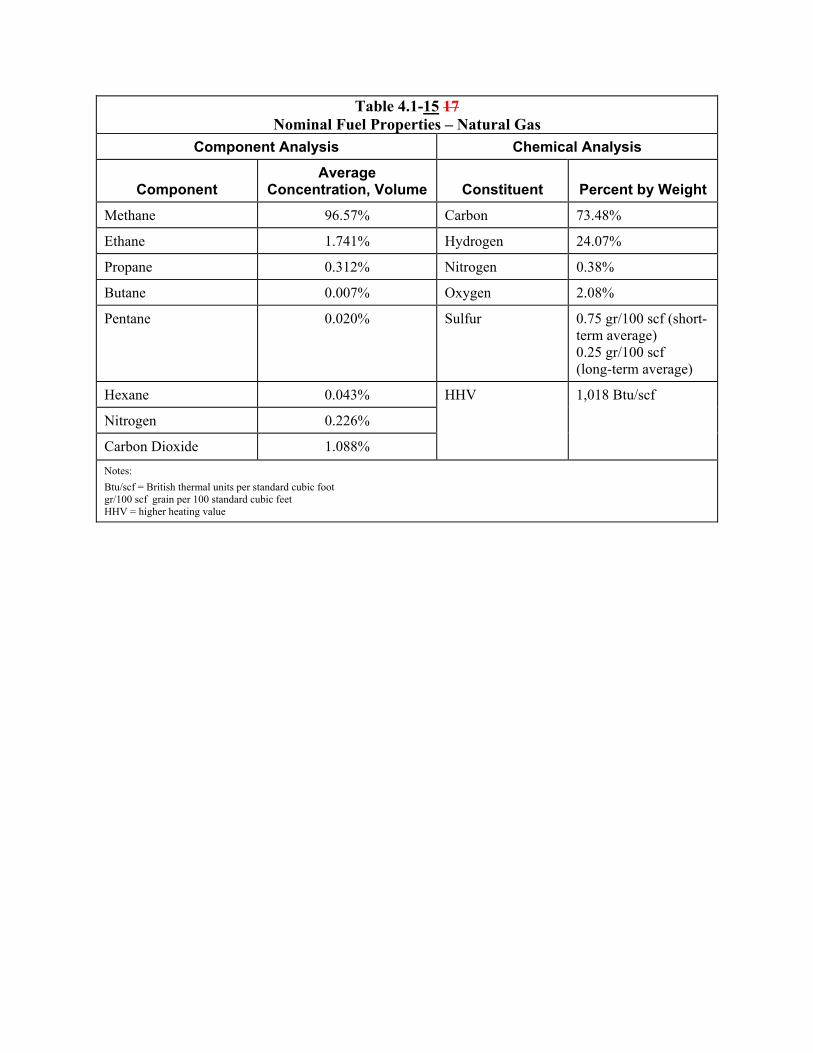
Table 4.1-15 17 Nominal Fuel Properties – Natural Gas
Component Analysis Chemical Analysis
Component Average
Concentration, Volume Constituent Percent by Weight
Methane 96.57% Carbon 73.48%
Ethane 1.741% Hydrogen 24.07%
Propane 0.312% Nitrogen 0.38%
Butane 0.007% Oxygen 2.08%
Pentane 0.020% Sulfur 0.75 gr/100 scf (short-term average) 0.25 gr/100 scf (long-term average)
Hexane 0.043% HHV 1,018 Btu/scf
Nitrogen 0.226%
Carbon Dioxide 1.088%
Notes:
Btu/scf = British thermal units per standard cubic foot gr/100 scf grain per 100 standard cubic feet HHV = higher heating value
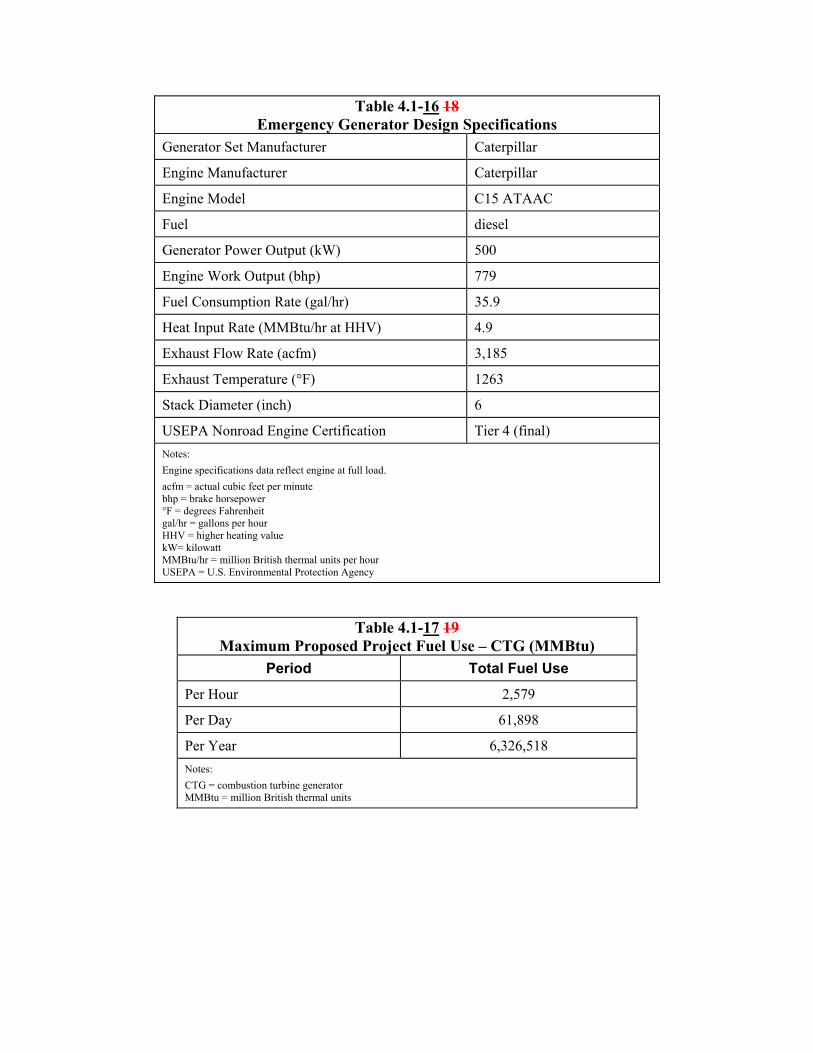
Table 4.1-16 18 Emergency Generator Design Specifications
Generator Set Manufacturer Caterpillar
Engine Manufacturer Caterpillar
Engine Model C15 ATAAC
Fuel diesel
Generator Power Output (kW) 500
Engine Work Output (bhp) 779
Fuel Consumption Rate (gal/hr) 35.9
Heat Input Rate (MMBtu/hr at HHV) 4.9
Exhaust Flow Rate (acfm) 3,185
Exhaust Temperature (°F) 1263
Stack Diameter (inch) 6
USEPA Nonroad Engine Certification Tier 4 (final)
Notes:
Engine specifications data reflect engine at full load.
acfm = actual cubic feet per minute bhp = brake horsepower °F = degrees Fahrenheit gal/hr = gallons per hour HHV = higher heating value kW= kilowatt MMBtu/hr = million British thermal units per hour USEPA = U.S. Environmental Protection Agency
Table 4.1-17 19 Maximum Proposed Project Fuel Use – CTG (MMBtu)
Period Total Fuel Use
Per Hour 2,579
Per Day 61,898
Per Year 6,326,518
Notes:
CTG = combustion turbine generator MMBtu = million British thermal units
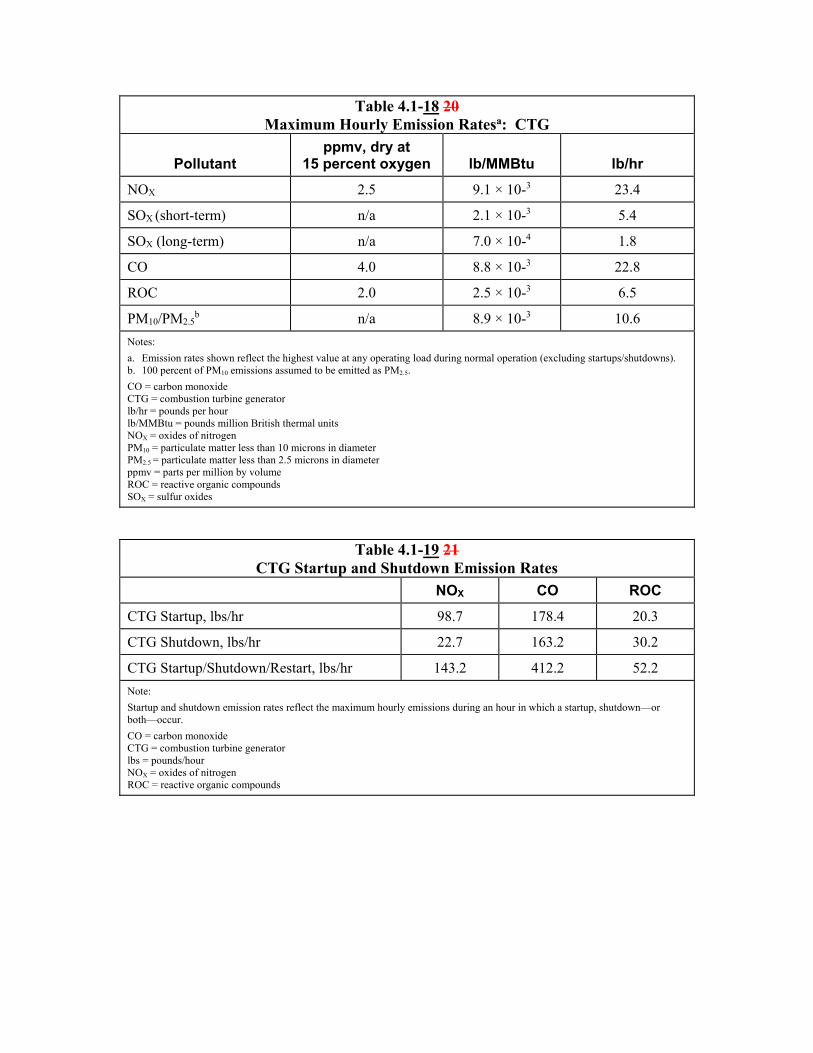
Table 4.1-18 20 Maximum Hourly Emission Ratesa: CTG
Pollutant ppmv, dry at
15 percent oxygen lb/MMBtu lb/hr
NOX 2.5 9.1 × 10⁻³ 23.4
SOX (short-term) n/a 2.1 × 10⁻³ 5.4
SOX (long-term) n/a 7.0 × 10⁻⁴ 1.8
CO 4.0 8.8 × 10⁻³ 22.8
ROC 2.0 2.5 × 10⁻³ 6.5
PM10/PM2.5b n/a 8.9 × 10⁻³ 10.6
Notes:
a. Emission rates shown reflect the highest value at any operating load during normal operation (excluding startups/shutdowns). b. 100 percent of PM10 emissions assumed to be emitted as PM2.5.
CO = carbon monoxide CTG = combustion turbine generator lb/hr = pounds per hour lb/MMBtu = pounds million British thermal units NOX = oxides of nitrogen PM10 = particulate matter less than 10 microns in diameter PM2.5 = particulate matter less than 2.5 microns in diameter ppmv = parts per million by volume ROC = reactive organic compounds SOX = sulfur oxides
Table 4.1-19 21 CTG Startup and Shutdown Emission Rates
NOX CO ROC
CTG Startup, lbs/hr 98.7 178.4 20.3
CTG Shutdown, lbs/hr 22.7 163.2 30.2
CTG Startup/Shutdown/Restart, lbs/hr 143.2 412.2 52.2
Note:
Startup and shutdown emission rates reflect the maximum hourly emissions during an hour in which a startup, shutdown—or both—occur.
CO = carbon monoxide CTG = combustion turbine generator lbs = pounds/hour NOX = oxides of nitrogen ROC = reactive organic compounds
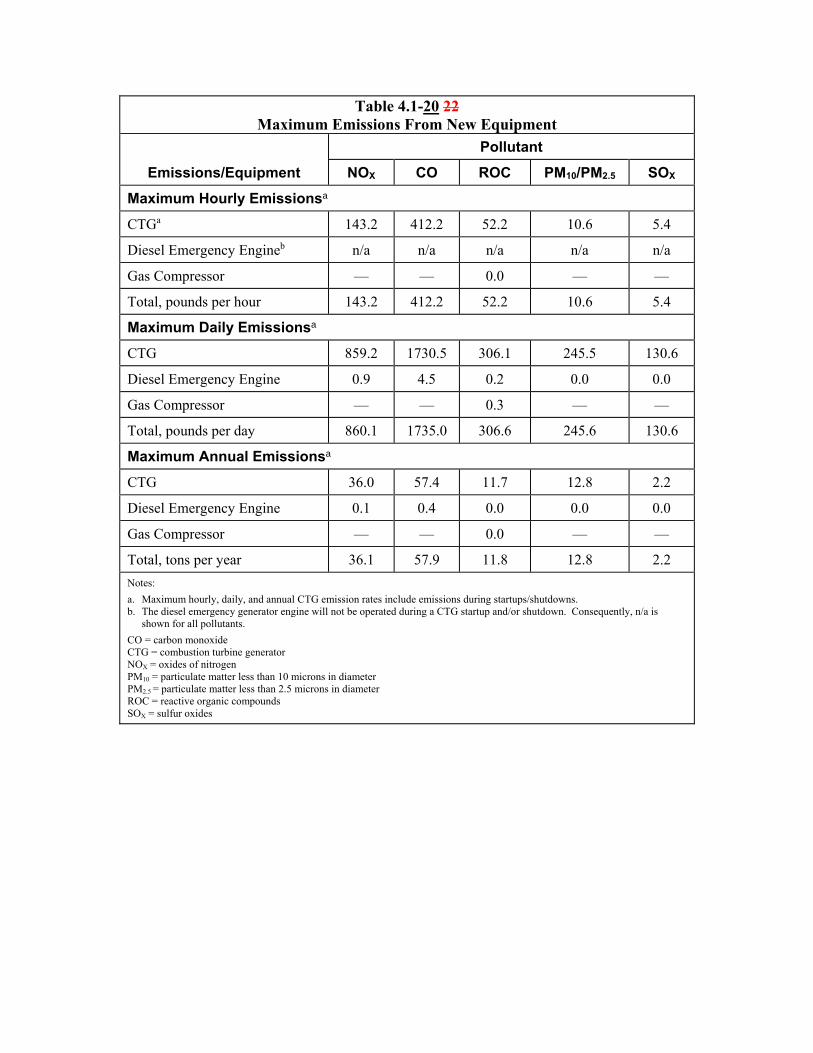
Table 4.1-20 22 Maximum Emissions From New Equipment
Emissions/Equipment
Pollutant
NOX CO ROC PM10/PM2.5 SOX
Maximum Hourly Emissionsa
CTGa 143.2 412.2 52.2 10.6 5.4
Diesel Emergency Engineb n/a n/a n/a n/a n/a
Gas Compressor — — 0.0 — —
Total, pounds per hour 143.2 412.2 52.2 10.6 5.4
Maximum Daily Emissionsa
CTG 859.2 1730.5 306.1 245.5 130.6
Diesel Emergency Engine 0.9 4.5 0.2 0.0 0.0
Gas Compressor — — 0.3 — —
Total, pounds per day 860.1 1735.0 306.6 245.6 130.6
Maximum Annual Emissionsa
CTG 36.0 57.4 11.7 12.8 2.2
Diesel Emergency Engine 0.1 0.4 0.0 0.0 0.0
Gas Compressor — — 0.0 — —
Total, tons per year 36.1 57.9 11.8 12.8 2.2
Notes:
a. Maximum hourly, daily, and annual CTG emission rates include emissions during startups/shutdowns. b. The diesel emergency generator engine will not be operated during a CTG startup and/or shutdown. Consequently, n/a is
shown for all pollutants.
CO = carbon monoxide CTG = combustion turbine generator NOX = oxides of nitrogen PM10 = particulate matter less than 10 microns in diameter PM2.5 = particulate matter less than 2.5 microns in diameter ROC = reactive organic compounds SOX = sulfur oxides
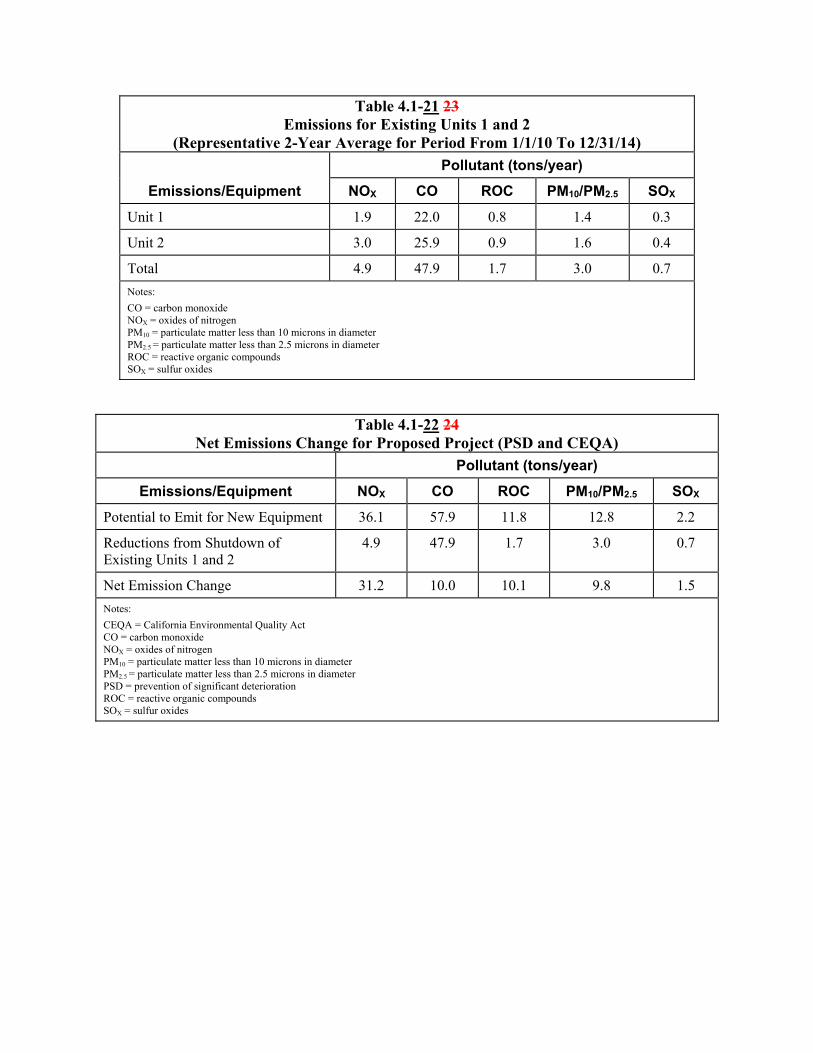
Table 4.1-21 23 Emissions for Existing Units 1 and 2
(Representative 2-Year Average for Period From 1/1/10 To 12/31/14)
Emissions/Equipment
Pollutant (tons/year)
NOX CO ROC PM10/PM2.5 SOX
Unit 1 1.9 22.0 0.8 1.4 0.3
Unit 2 3.0 25.9 0.9 1.6 0.4
Total 4.9 47.9 1.7 3.0 0.7
Notes:
CO = carbon monoxide NOX = oxides of nitrogen PM10 = particulate matter less than 10 microns in diameter PM2.5 = particulate matter less than 2.5 microns in diameter ROC = reactive organic compounds SOX = sulfur oxides
Table 4.1-22 24 Net Emissions Change for Proposed Project (PSD and CEQA)
Pollutant (tons/year)
Emissions/Equipment NOX CO ROC PM10/PM2.5 SOX
Potential to Emit for New Equipment 36.1 57.9 11.8 12.8 2.2
Reductions from Shutdown of Existing Units 1 and 2
4.9 47.9 1.7 3.0 0.7
Net Emission Change 31.2 10.0 10.1 9.8 1.5
Notes:
CEQA = California Environmental Quality Act CO = carbon monoxide NOX = oxides of nitrogen PM10 = particulate matter less than 10 microns in diameter PM2.5 = particulate matter less than 2.5 microns in diameter PSD = prevention of significant deterioration ROC = reactive organic compounds SOX = sulfur oxides
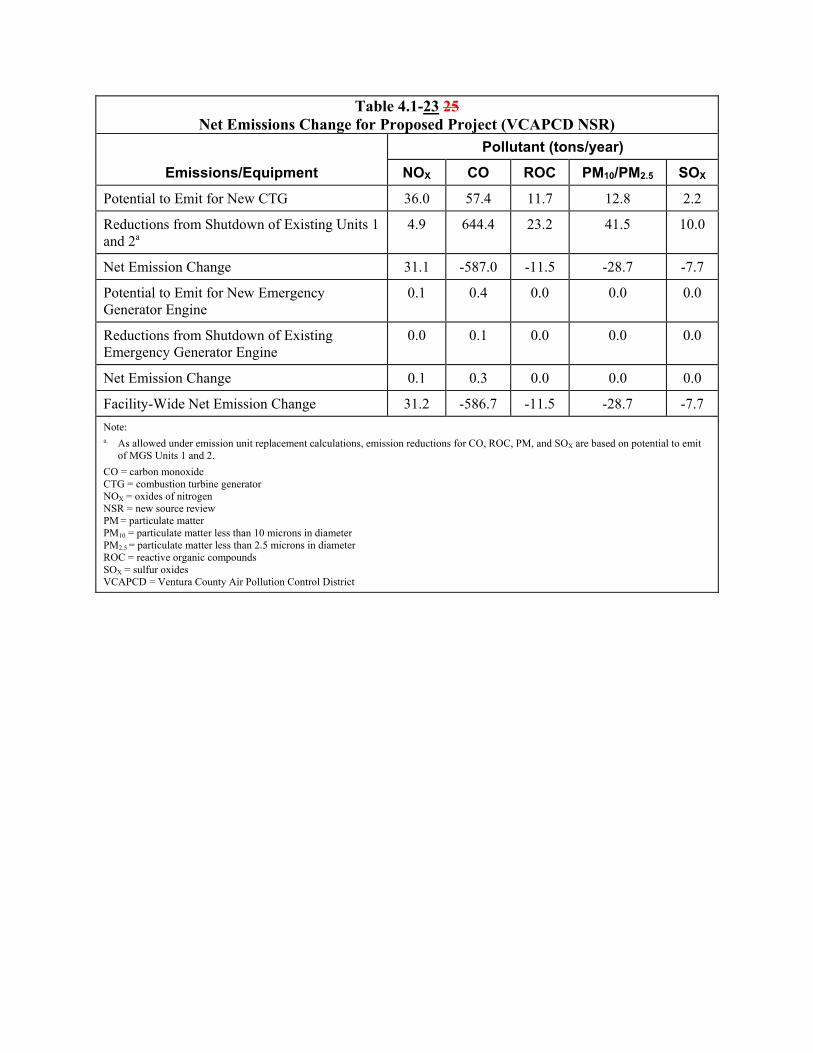
Table 4.1-23 25 Net Emissions Change for Proposed Project (VCAPCD NSR)
Emissions/Equipment
Pollutant (tons/year)
NOX CO ROC PM10/PM2.5 SOX
Potential to Emit for New CTG 36.0 57.4 11.7 12.8 2.2
Reductions from Shutdown of Existing Units 1 and 2a
4.9 644.4 23.2 41.5 10.0
Net Emission Change 31.1 -587.0 -11.5 -28.7 -7.7
Potential to Emit for New Emergency Generator Engine
0.1 0.4 0.0 0.0 0.0
Reductions from Shutdown of Existing Emergency Generator Engine
0.0 0.1 0.0 0.0 0.0
Net Emission Change 0.1 0.3 0.0 0.0 0.0
Facility-Wide Net Emission Change 31.2 -586.7 -11.5 -28.7 -7.7
Note: a. As allowed under emission unit replacement calculations, emission reductions for CO, ROC, PM, and SOX are based on potential to emit
of MGS Units 1 and 2.
CO = carbon monoxide CTG = combustion turbine generator NOX = oxides of nitrogen NSR = new source review PM = particulate matter PM10 = particulate matter less than 10 microns in diameter PM2.5 = particulate matter less than 2.5 microns in diameter ROC = reactive organic compounds SOX = sulfur oxides VCAPCD = Ventura County Air Pollution Control District
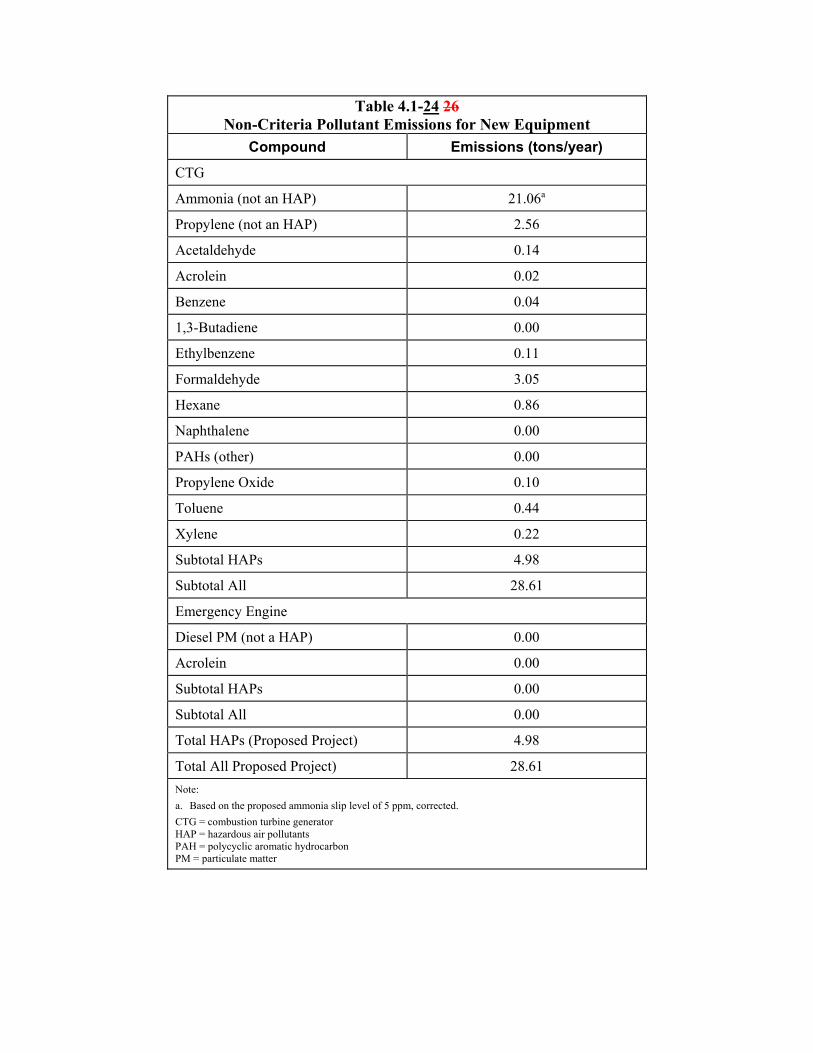
Table 4.1-24 26 Non-Criteria Pollutant Emissions for New Equipment
Compound Emissions (tons/year)
CTG
Ammonia (not an HAP) 21.06a
Propylene (not an HAP) 2.56
Acetaldehyde 0.14
Acrolein 0.02
Benzene 0.04
1,3-Butadiene 0.00
Ethylbenzene 0.11
Formaldehyde 3.05
Hexane 0.86
Naphthalene 0.00
PAHs (other) 0.00
Propylene Oxide 0.10
Toluene 0.44
Xylene 0.22
Subtotal HAPs 4.98
Subtotal All 28.61
Emergency Engine
Diesel PM (not a HAP) 0.00
Acrolein 0.00
Subtotal HAPs 0.00
Subtotal All 0.00
Total HAPs (Proposed Project) 4.98
Total All Proposed Project) 28.61
Note:
a. Based on the proposed ammonia slip level of 5 ppm, corrected.
CTG = combustion turbine generator HAP = hazardous air pollutants PAH = polycyclic aromatic hydrocarbon PM = particulate matter

Table 4.1-25 27 Non-Criteria Pollutant Emissions for Existing Units 1, 2, and 3
(Maximum Potential to Emit)
Compound Emissions (tons/year)
Ammonia (not an HAP) 78.05
Benzene 0.03
Formaldehyde 0.15
Hexane 0.05
Naphthalene 0.01
Dichlorobenzene 0.00
Toluene 0.14
1,3-Butadiene 0.00
Acetaldehyde 0.02
Acrolein 0.01
Ethyl Benzene 0.04
PAHs (other) 0.00
Xylene 0.10
Total HAPs (Existing Facility) 0.54
Total All (Existing Facility) 78.93
Notes:
HAP = hazardous air pollutants PAH = polycyclic aromatic hydrocarbon
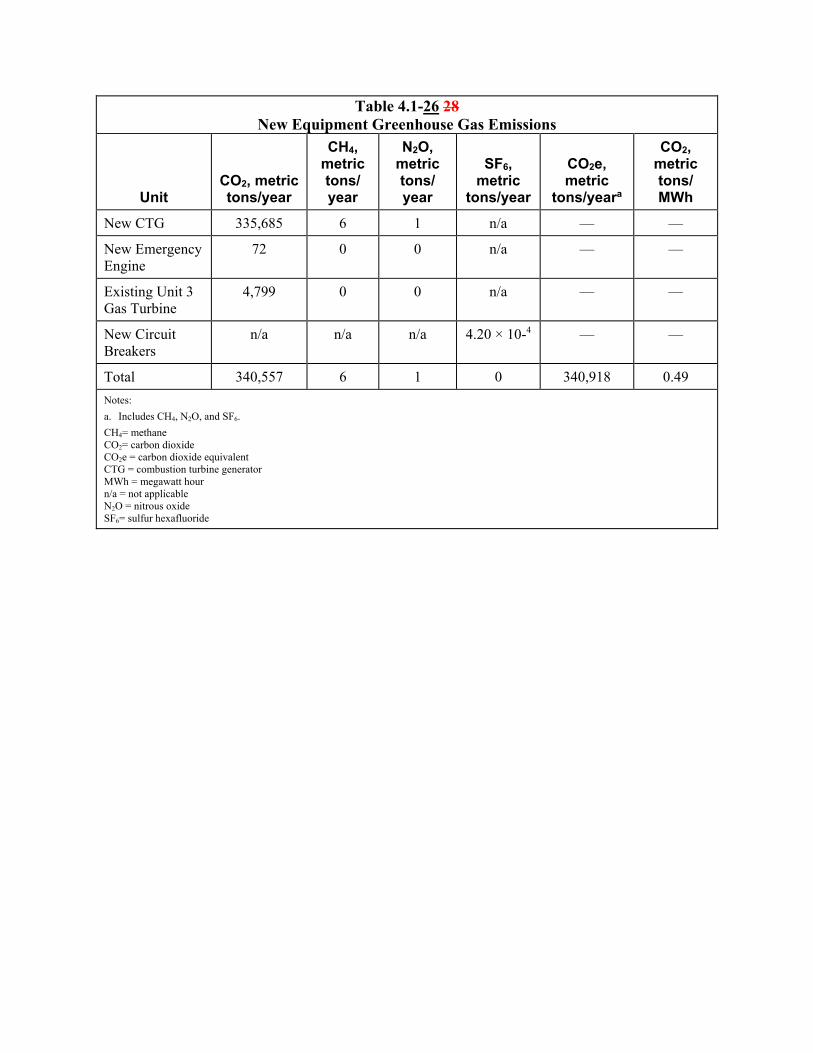
Table 4.1-26 28 New Equipment Greenhouse Gas Emissions
Unit CO2, metric tons/year
CH4, metric tons/year
N2O, metric tons/year
SF6, metric
tons/year
CO2e, metric
tons/yeara
CO2, metric tons/MWh
New CTG 335,685 6 1 n/a — —
New Emergency Engine
72 0 0 n/a — —
Existing Unit 3 Gas Turbine
4,799 0 0 n/a — —
New Circuit Breakers
n/a n/a n/a 4.20 × 10⁻⁴ — —
Total 340,557 6 1 0 340,918 0.49
Notes:
a. Includes CH4, N2O, and SF6.
CH4= methane CO2= carbon dioxide CO2e = carbon dioxide equivalent CTG = combustion turbine generator MWh = megawatt hour n/a = not applicable N2O = nitrous oxide SF6= sulfur hexafluoride
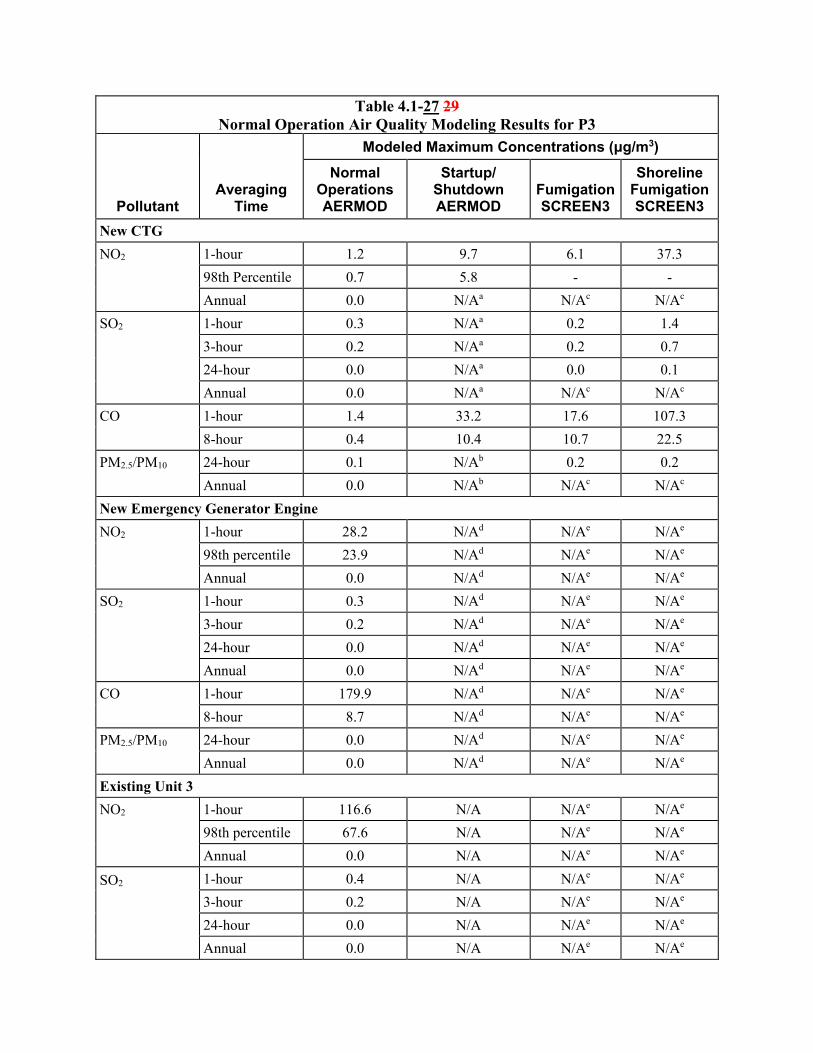
Table 4.1-27 29 Normal Operation Air Quality Modeling Results for P3
Pollutant Averaging
Time
Modeled Maximum Concentrations (μg/m3)
Normal Operations AERMOD
Startup/Shutdown AERMOD
Fumigation SCREEN3
Shoreline Fumigation SCREEN3
New CTG
NO2 1-hour 1.2 9.7 6.1 37.3
98th Percentile 0.7 5.8 - -
Annual 0.0 N/Aa N/Ac N/Ac
SO2 1-hour 0.3 N/Aa 0.2 1.4
3-hour 0.2 N/Aa 0.2 0.7
24-hour 0.0 N/Aa 0.0 0.1
Annual 0.0 N/Aa N/Ac N/Ac
CO 1-hour 1.4 33.2 17.6 107.3
8-hour 0.4 10.4 10.7 22.5
PM2.5/PM10 24-hour 0.1 N/Ab 0.2 0.2
Annual 0.0 N/Ab N/Ac N/Ac
New Emergency Generator Engine
NO2 1-hour 28.2 N/Ad N/Ae N/Ae
98th percentile 23.9 N/Ad N/Ae N/Ae
Annual 0.0 N/Ad N/Ae N/Ae
SO2 1-hour 0.3 N/Ad N/Ae N/Ae
3-hour 0.2 N/Ad N/Ae N/Ae
24-hour 0.0 N/Ad N/Ae N/Ae
Annual 0.0 N/Ad N/Ae N/Ae
CO 1-hour 179.9 N/Ad N/Ae N/Ae
8-hour 8.7 N/Ad N/Ae N/Ae
PM2.5/PM10 24-hour 0.0 N/Ad N/Ae N/Ae
Annual 0.0 N/Ad N/Ae N/Ae
Existing Unit 3
NO2 1-hour 116.6 N/A N/Ae N/Ae
98th percentile 67.6 N/A N/Ae N/Ae
Annual 0.0 N/A N/Ae N/Ae
SO2 1-hour 0.4 N/A N/Ae N/Ae
3-hour 0.2 N/A N/Ae N/Ae
24-hour 0.0 N/A N/Ae N/Ae
Annual 0.0 N/A N/Ae N/Ae
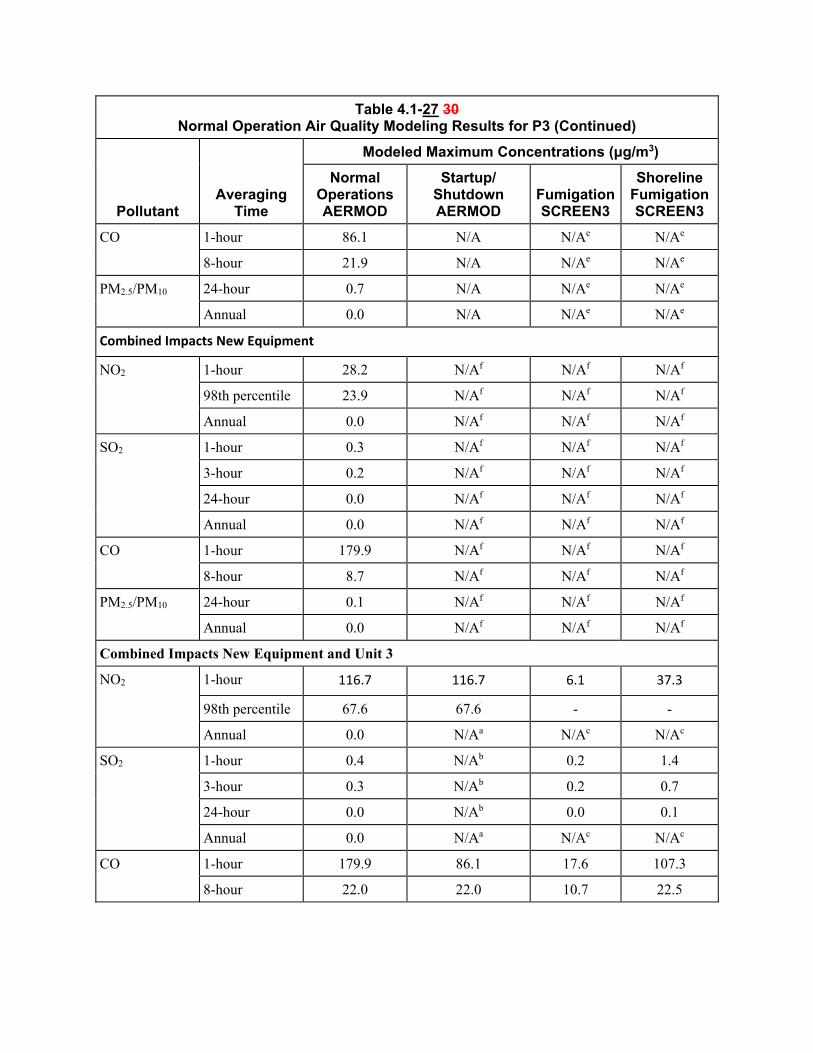
Table 4.1-27 30 Normal Operation Air Quality Modeling Results for P3 (Continued)
Pollutant Averaging
Time
Modeled Maximum Concentrations (μg/m3)
Normal Operations AERMOD
Startup/Shutdown AERMOD
Fumigation SCREEN3
Shoreline Fumigation SCREEN3
CO 1-hour 86.1 N/A N/Ae N/Ae
8-hour 21.9 N/A N/Ae N/Ae
PM2.5/PM10 24-hour 0.7 N/A N/Ae N/Ae
Annual 0.0 N/A N/Ae N/Ae
Combined Impacts New Equipment
NO2 1-hour 28.2 N/Af N/Af N/Af
98th percentile 23.9 N/Af N/Af N/Af
Annual 0.0 N/Af N/Af N/Af
SO2 1-hour 0.3 N/Af N/Af N/Af
3-hour 0.2 N/Af N/Af N/Af
24-hour 0.0 N/Af N/Af N/Af
Annual 0.0 N/Af N/Af N/Af
CO 1-hour 179.9 N/Af N/Af N/Af
8-hour 8.7 N/Af N/Af N/Af
PM2.5/PM10 24-hour 0.1 N/Af N/Af N/Af
Annual 0.0 N/Af N/Af N/Af
Combined Impacts New Equipment and Unit 3
NO2 1-hour 116.7 116.7 6.1 37.3
98th percentile 67.6 67.6 - -
Annual 0.0 N/Aa N/Ac N/Ac
SO2 1-hour 0.4 N/Ab 0.2 1.4
3-hour 0.3 N/Ab 0.2 0.7
24-hour 0.0 N/Ab 0.0 0.1
Annual 0.0 N/Aa N/Ac N/Ac
CO 1-hour 179.9 86.1 17.6 107.3
8-hour 22.0 22.0 10.7 22.5
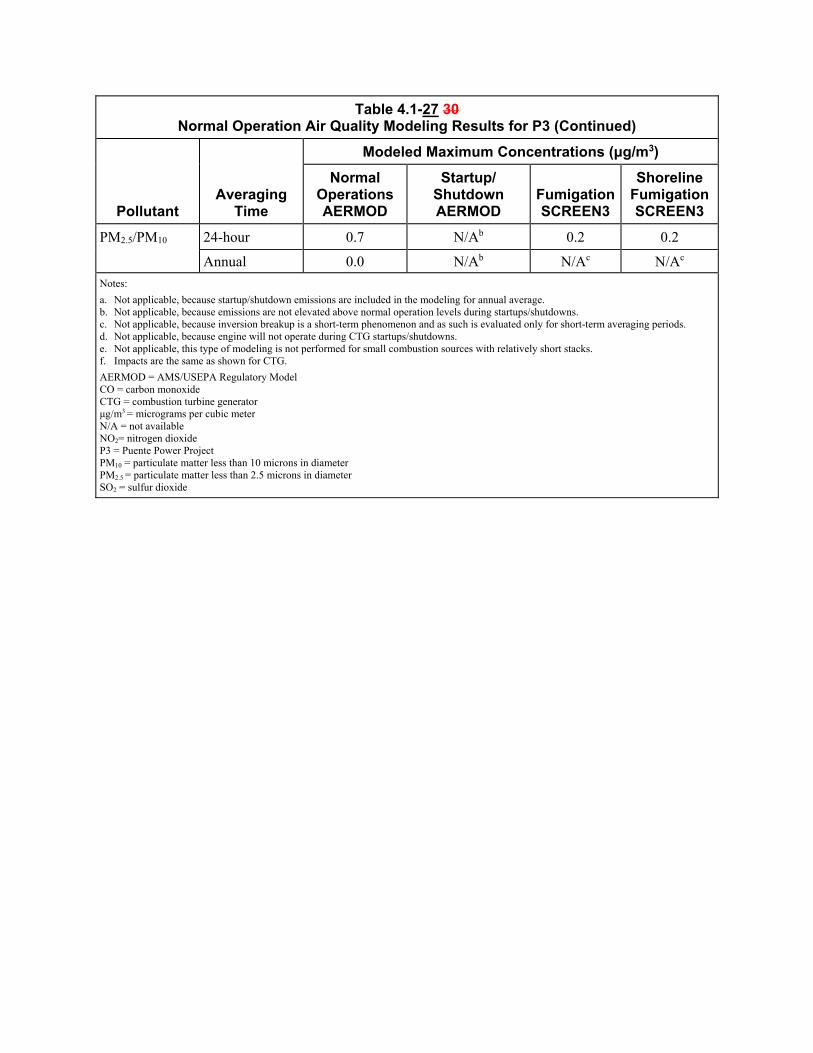
Table 4.1-27 30 Normal Operation Air Quality Modeling Results for P3 (Continued)
Pollutant Averaging
Time
Modeled Maximum Concentrations (μg/m3)
Normal Operations AERMOD
Startup/Shutdown AERMOD
Fumigation SCREEN3
Shoreline Fumigation SCREEN3
PM2.5/PM10 24-hour 0.7 N/Ab 0.2 0.2
Annual 0.0 N/Ab N/Ac N/Ac
Notes:
a. Not applicable, because startup/shutdown emissions are included in the modeling for annual average. b. Not applicable, because emissions are not elevated above normal operation levels during startups/shutdowns. c. Not applicable, because inversion breakup is a short-term phenomenon and as such is evaluated only for short-term averaging periods. d. Not applicable, because engine will not operate during CTG startups/shutdowns. e. Not applicable, this type of modeling is not performed for small combustion sources with relatively short stacks. f. Impacts are the same as shown for CTG.
AERMOD = AMS/USEPA Regulatory Model CO = carbon monoxide CTG = combustion turbine generator μg/m3 = micrograms per cubic meter N/A = not available NO2= nitrogen dioxide P3 = Puente Power Project PM10 = particulate matter less than 10 microns in diameter PM2.5 = particulate matter less than 2.5 microns in diameter SO2 = sulfur dioxide
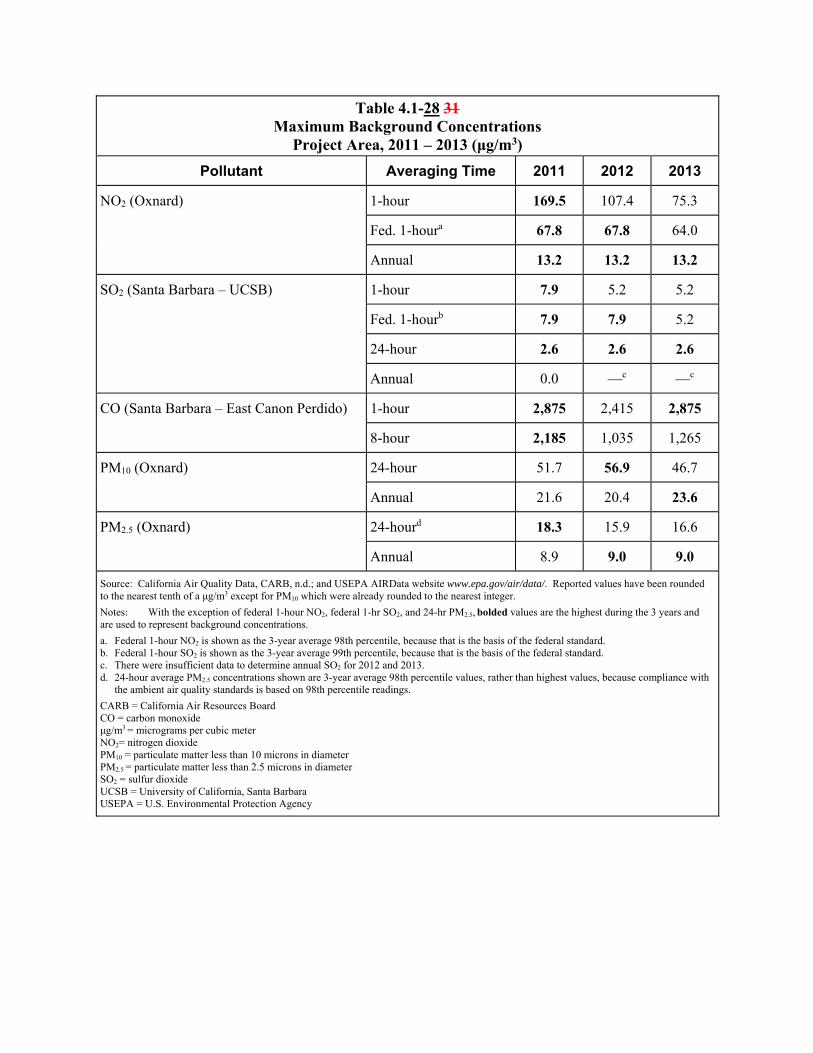
Table 4.1-28 31 Maximum Background Concentrations
Project Area, 2011 – 2013 (μg/m3)
Pollutant Averaging Time 2011 2012 2013
NO2 (Oxnard) 1-hour 169.5 107.4 75.3
Fed. 1-houra 67.8 67.8 64.0
Annual 13.2 13.2 13.2
SO2 (Santa Barbara – UCSB) 1-hour 7.9 5.2 5.2
Fed. 1-hourb 7.9 7.9 5.2
24-hour 2.6 2.6 2.6
Annual 0.0 —c —c
CO (Santa Barbara – East Canon Perdido) 1-hour 2,875 2,415 2,875
8-hour 2,185 1,035 1,265
PM10 (Oxnard) 24-hour 51.7 56.9 46.7
Annual 21.6 20.4 23.6
PM2.5 (Oxnard) 24-hourd 18.3 15.9 16.6
Annual 8.9 9.0 9.0
Source: California Air Quality Data, CARB, n.d.; and USEPA AIRData website www.epa.gov/air/data/. Reported values have been rounded to the nearest tenth of a μg/m3 except for PM10 which were already rounded to the nearest integer.
Notes: With the exception of federal 1-hour NO2, federal 1-hr SO2, and 24-hr PM2.5, bolded values are the highest during the 3 years and are used to represent background concentrations.
a. Federal 1-hour NO2 is shown as the 3-year average 98th percentile, because that is the basis of the federal standard. b. Federal 1-hour SO2 is shown as the 3-year average 99th percentile, because that is the basis of the federal standard. c. There were insufficient data to determine annual SO2 for 2012 and 2013. d. 24-hour average PM2.5 concentrations shown are 3-year average 98th percentile values, rather than highest values, because compliance with
the ambient air quality standards is based on 98th percentile readings.
CARB = California Air Resources Board CO = carbon monoxide μg/m3 = micrograms per cubic meter NO2= nitrogen dioxide PM10 = particulate matter less than 10 microns in diameter PM2.5 = particulate matter less than 2.5 microns in diameter SO2 = sulfur dioxide UCSB = University of California, Santa Barbara USEPA = U.S. Environmental Protection Agency
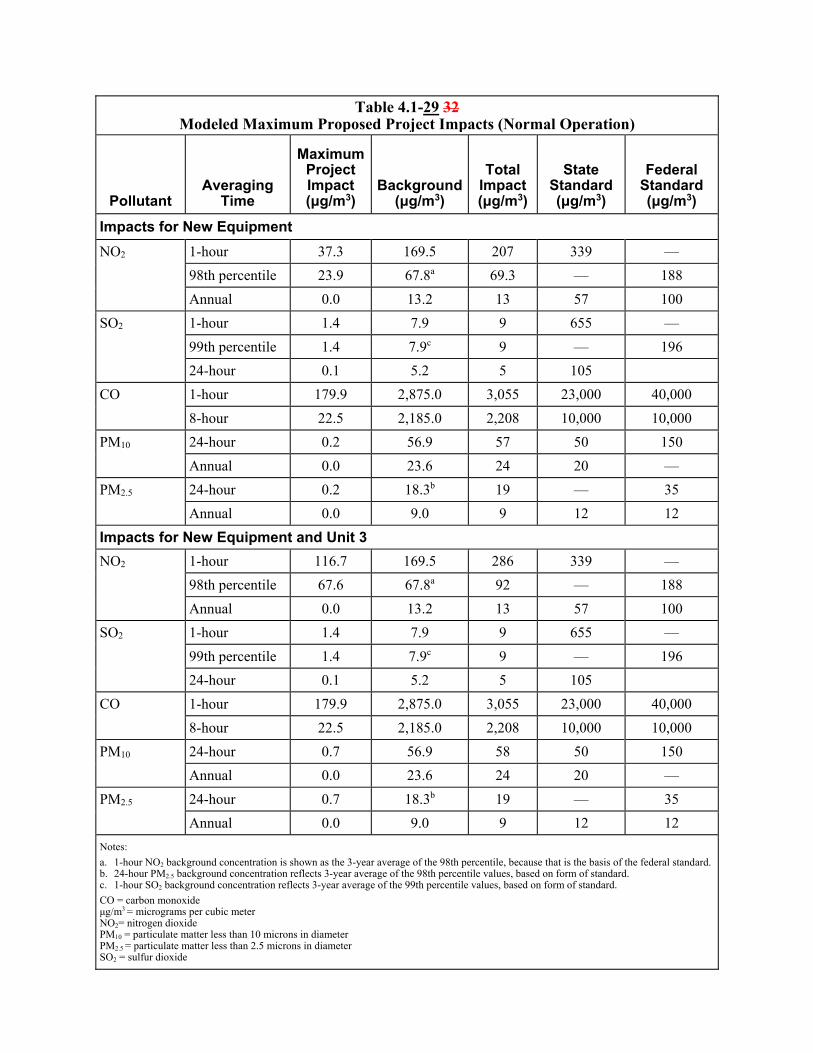
Table 4.1-29 32Modeled Maximum Proposed Project Impacts (Normal Operation)
Pollutant Averaging
Time
Maximum Project Impact (μg/m3)
Background (μg/m3)
Total Impact (μg/m3)
State Standard (μg/m3)
Federal Standard (μg/m3)
Impacts for New Equipment
NO2 1-hour 37.3 169.5 207 339 —
98th percentile 23.9 67.8a 69.3 — 188
Annual 0.0 13.2 13 57 100
SO2 1-hour 1.4 7.9 9 655 —
99th percentile 1.4 7.9c 9 — 196
24-hour 0.1 5.2 5 105
CO 1-hour 179.9 2,875.0 3,055 23,000 40,000
8-hour 22.5 2,185.0 2,208 10,000 10,000
PM10 24-hour 0.2 56.9 57 50 150
Annual 0.0 23.6 24 20 —
PM2.5 24-hour 0.2 18.3b 19 — 35
Annual 0.0 9.0 9 12 12
Impacts for New Equipment and Unit 3
NO2 1-hour 116.7 169.5 286 339 —
98th percentile 67.6 67.8a 92 — 188
Annual 0.0 13.2 13 57 100
SO2 1-hour 1.4 7.9 9 655 —
99th percentile 1.4 7.9c 9 — 196
24-hour 0.1 5.2 5 105
CO 1-hour 179.9 2,875.0 3,055 23,000 40,000
8-hour 22.5 2,185.0 2,208 10,000 10,000
PM10 24-hour 0.7 56.9 58 50 150
Annual 0.0 23.6 24 20 —
PM2.5 24-hour 0.7 18.3b 19 — 35
Annual 0.0 9.0 9 12 12
Notes:
a. 1-hour NO2 background concentration is shown as the 3-year average of the 98th percentile, because that is the basis of the federal standard. b. 24-hour PM2.5 background concentration reflects 3-year average of the 98th percentile values, based on form of standard. c. 1-hour SO2 background concentration reflects 3-year average of the 99th percentile values, based on form of standard.
CO = carbon monoxide μg/m3 = micrograms per cubic meter NO2= nitrogen dioxide PM10 = particulate matter less than 10 microns in diameter PM2.5 = particulate matter less than 2.5 microns in diameter SO2 = sulfur dioxide
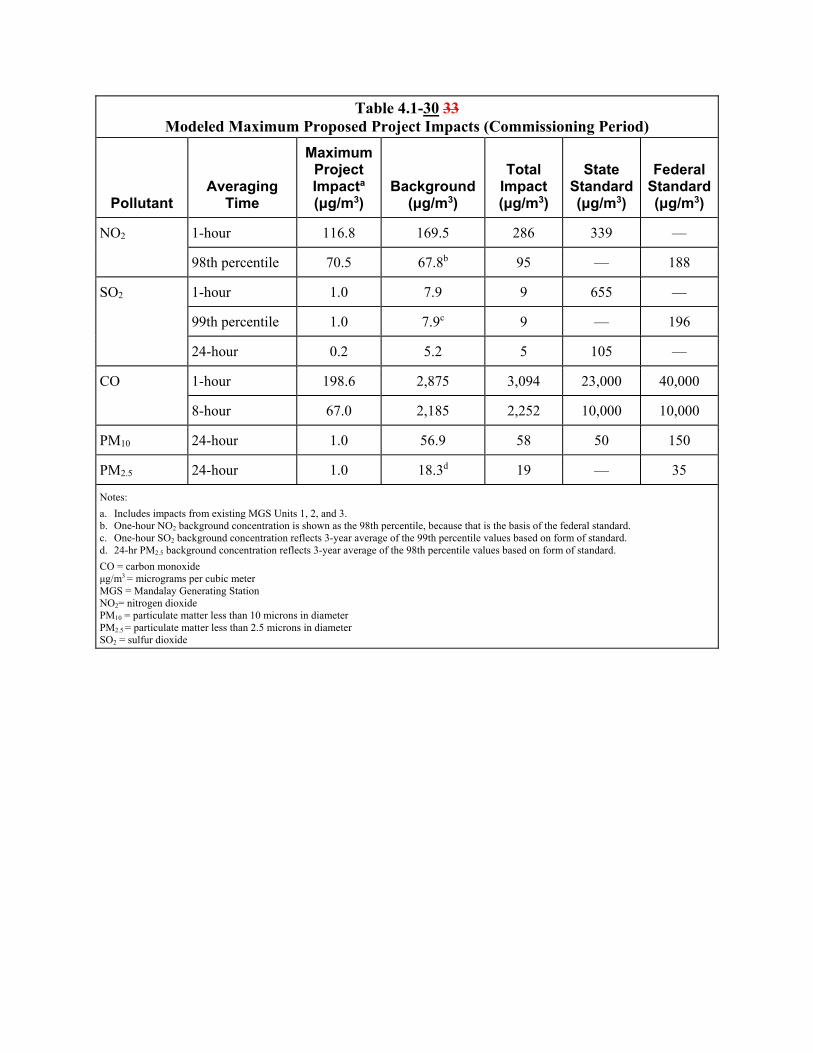
Table 4.1-30 33 Modeled Maximum Proposed Project Impacts (Commissioning Period)
Pollutant Averaging
Time
Maximum Project Impacta (μg/m3)
Background (μg/m3)
Total Impact (μg/m3)
State Standard (μg/m3)
Federal Standard (μg/m3)
NO2 1-hour 116.8 169.5 286 339 —
98th percentile 70.5 67.8b 95 — 188
SO2 1-hour 1.0 7.9 9 655 —
99th percentile 1.0 7.9c 9 — 196
24-hour 0.2 5.2 5 105 —
CO 1-hour 198.6 2,875 3,094 23,000 40,000
8-hour 67.0 2,185 2,252 10,000 10,000
PM10 24-hour 1.0 56.9 58 50 150
PM2.5 24-hour 1.0 18.3d 19 — 35
Notes:
a. Includes impacts from existing MGS Units 1, 2, and 3. b. One-hour NO2 background concentration is shown as the 98th percentile, because that is the basis of the federal standard. c. One-hour SO2 background concentration reflects 3-year average of the 99th percentile values based on form of standard. d. 24-hr PM2.5 background concentration reflects 3-year average of the 98th percentile values based on form of standard.
CO = carbon monoxide μg/m3 = micrograms per cubic meter MGS = Mandalay Generating Station NO2= nitrogen dioxide PM10 = particulate matter less than 10 microns in diameter PM2.5 = particulate matter less than 2.5 microns in diameter SO2 = sulfur dioxide
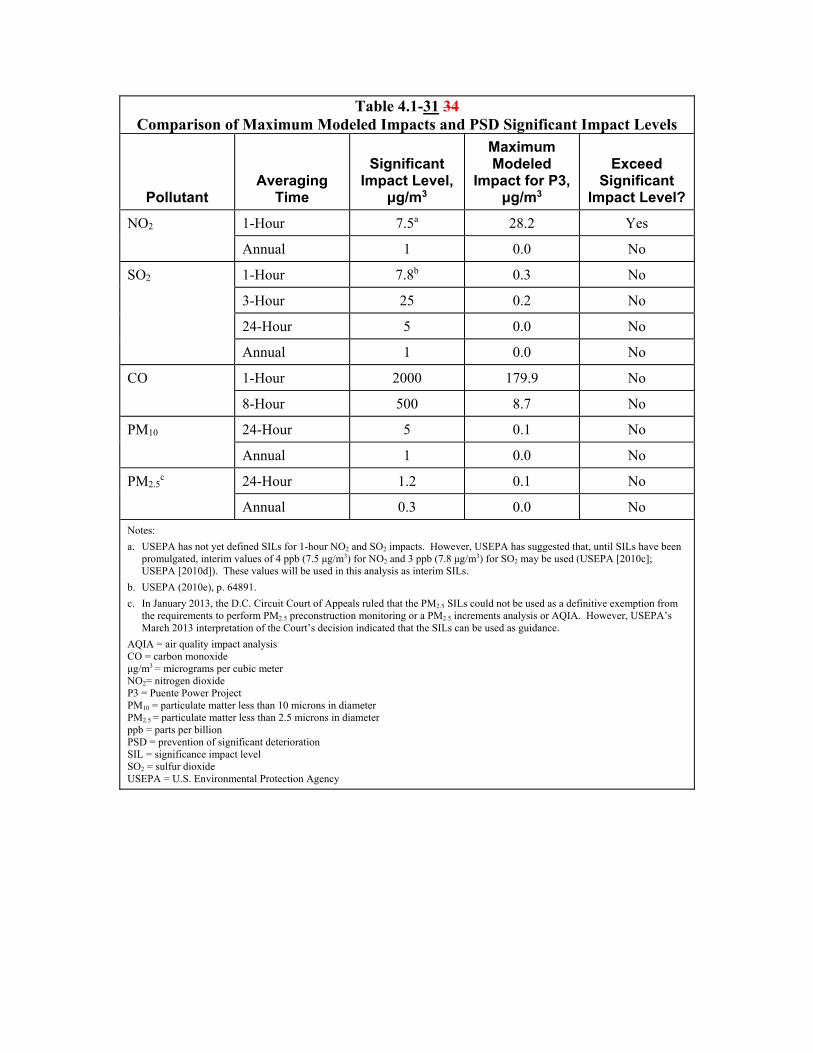
Table 4.1-31 34 Comparison of Maximum Modeled Impacts and PSD Significant Impact Levels
Pollutant Averaging
Time
Significant Impact Level,
μg/m3
Maximum Modeled
Impact for P3, μg/m3
Exceed Significant
Impact Level?
NO2 1-Hour 7.5a 28.2 Yes
Annual 1 0.0 No
SO2 1-Hour 7.8b 0.3 No
3-Hour 25 0.2 No
24-Hour 5 0.0 No
Annual 1 0.0 No
CO 1-Hour 2000 179.9 No
8-Hour 500 8.7 No
PM10 24-Hour 5 0.1 No
Annual 1 0.0 No
PM2.5c 24-Hour 1.2 0.1 No
Annual 0.3 0.0 No
Notes:
a. USEPA has not yet defined SILs for 1-hour NO2 and SO2 impacts. However, USEPA has suggested that, until SILs have been promulgated, interim values of 4 ppb (7.5 μg/m3) for NO2 and 3 ppb (7.8 μg/m3) for SO2 may be used (USEPA [2010c]; USEPA [2010d]). These values will be used in this analysis as interim SILs.
b. USEPA (2010e), p. 64891.
c. In January 2013, the D.C. Circuit Court of Appeals ruled that the PM2.5 SILs could not be used as a definitive exemption from the requirements to perform PM2.5 preconstruction monitoring or a PM2.5 increments analysis or AQIA. However, USEPA’s March 2013 interpretation of the Court’s decision indicated that the SILs can be used as guidance.
AQIA = air quality impact analysis CO = carbon monoxide μg/m3 = micrograms per cubic meter NO2= nitrogen dioxide P3 = Puente Power Project PM10 = particulate matter less than 10 microns in diameter PM2.5 = particulate matter less than 2.5 microns in diameter ppb = parts per billion PSD = prevention of significant deterioration SIL = significance impact level SO2 = sulfur dioxide USEPA = U.S. Environmental Protection Agency
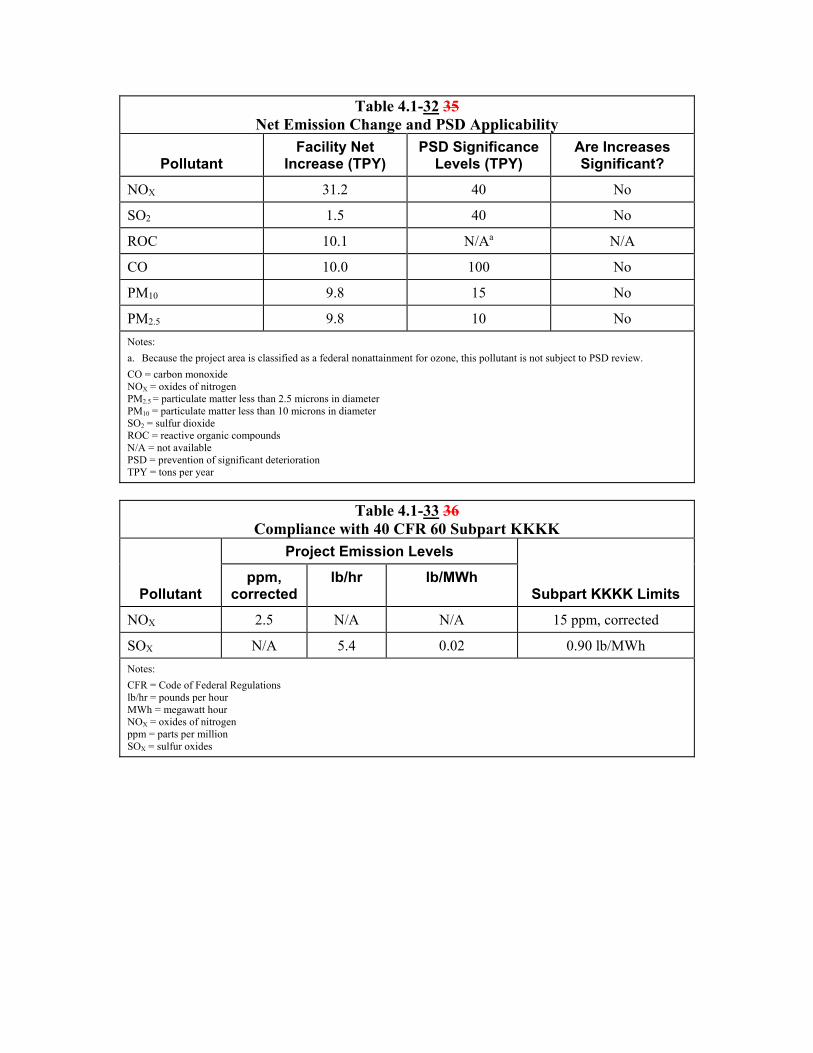
Table 4.1-32 35 Net Emission Change and PSD Applicability
Pollutant Facility Net
Increase (TPY) PSD Significance
Levels (TPY) Are Increases Significant?
NOX 31.2 40 No
SO2 1.5 40 No
ROC 10.1 N/Aa N/A
CO 10.0 100 No
PM10 9.8 15 No
PM2.5 9.8 10 No
Notes:
a. Because the project area is classified as a federal nonattainment for ozone, this pollutant is not subject to PSD review.
CO = carbon monoxide NOX = oxides of nitrogen PM2.5 = particulate matter less than 2.5 microns in diameter PM10 = particulate matter less than 10 microns in diameter SO2 = sulfur dioxide ROC = reactive organic compounds N/A = not available PSD = prevention of significant deterioration TPY = tons per year
Table 4.1-33 36
Compliance with 40 CFR 60 Subpart KKKK
Pollutant
Project Emission Levels
Subpart KKKK Limits ppm,
corrected lb/hr lb/MWh
NOX 2.5 N/A N/A 15 ppm, corrected
SOX N/A 5.4 0.02 0.90 lb/MWh
Notes:
CFR = Code of Federal Regulations lb/hr = pounds per hour MWh = megawatt hour NOX = oxides of nitrogen ppm = parts per million SOX = sulfur oxides
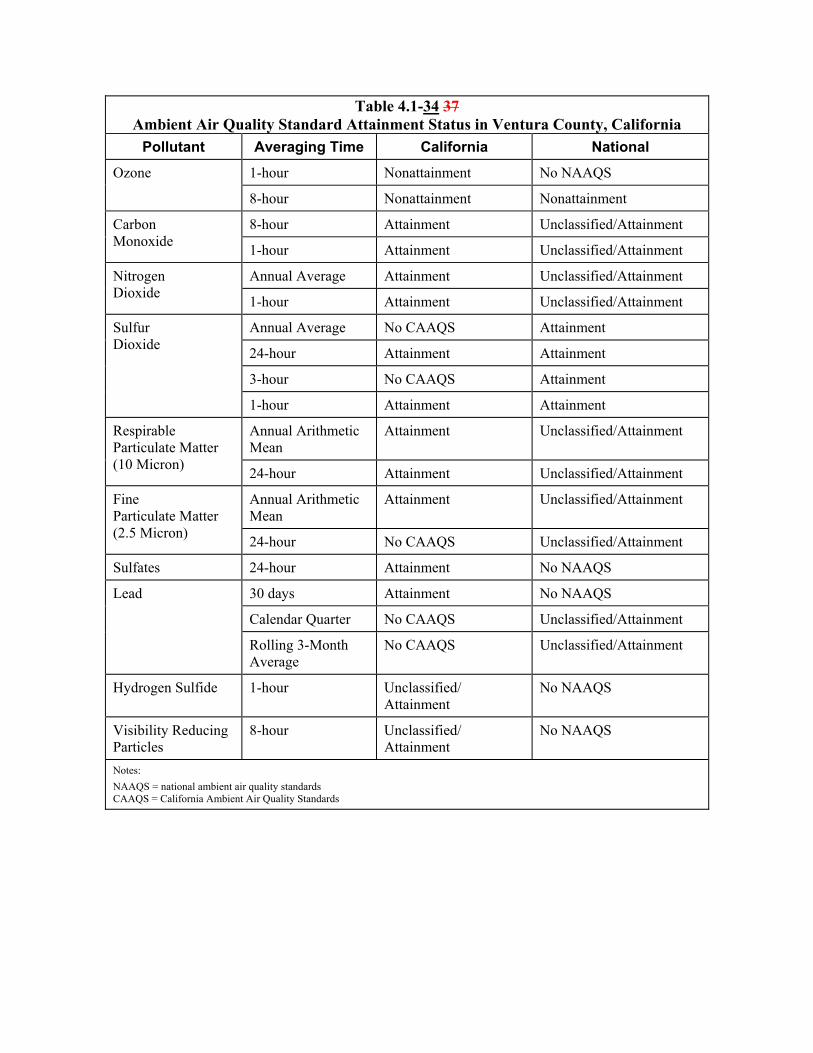
Table 4.1-34 37 Ambient Air Quality Standard Attainment Status in Ventura County, California
Pollutant Averaging Time California National
Ozone 1-hour Nonattainment No NAAQS
8-hour Nonattainment Nonattainment
Carbon Monoxide
8-hour Attainment Unclassified/Attainment
1-hour Attainment Unclassified/Attainment
Nitrogen Dioxide
Annual Average Attainment Unclassified/Attainment
1-hour Attainment Unclassified/Attainment
Sulfur Dioxide
Annual Average No CAAQS Attainment
24-hour Attainment Attainment
3-hour No CAAQS Attainment
1-hour Attainment Attainment
Respirable Particulate Matter (10 Micron)
Annual Arithmetic Mean
Attainment Unclassified/Attainment
24-hour Attainment Unclassified/Attainment
Fine Particulate Matter (2.5 Micron)
Annual Arithmetic Mean
Attainment Unclassified/Attainment
24-hour No CAAQS Unclassified/Attainment
Sulfates 24-hour Attainment No NAAQS
Lead 30 days Attainment No NAAQS
Calendar Quarter No CAAQS Unclassified/Attainment
Rolling 3-Month Average
No CAAQS Unclassified/Attainment
Hydrogen Sulfide 1-hour Unclassified/Attainment
No NAAQS
Visibility Reducing Particles
8-hour Unclassified/Attainment
No NAAQS
Notes:
NAAQS = national ambient air quality standards CAAQS = California Ambient Air Quality Standards
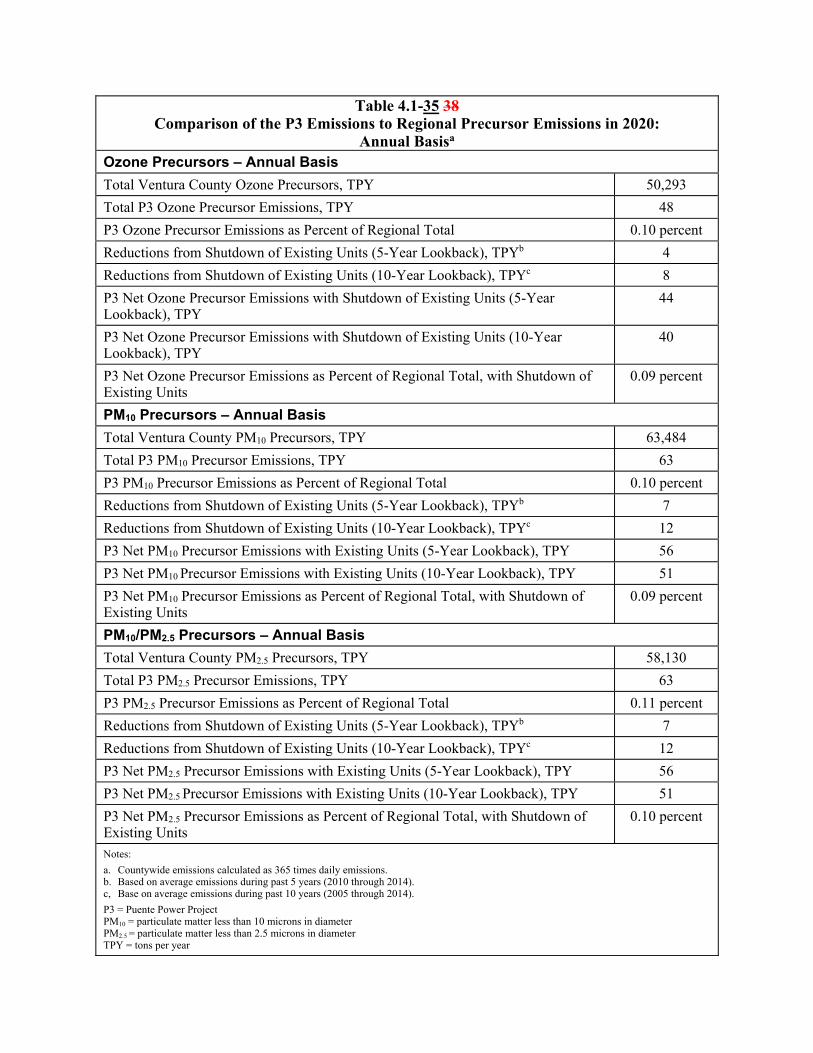
Table 4.1-35 38Comparison of the P3 Emissions to Regional Precursor Emissions in 2020:
Annual Basisa
Ozone Precursors – Annual Basis
Total Ventura County Ozone Precursors, TPY 50,293
Total P3 Ozone Precursor Emissions, TPY 48
P3 Ozone Precursor Emissions as Percent of Regional Total 0.10 percent
Reductions from Shutdown of Existing Units (5-Year Lookback), TPYb 4
Reductions from Shutdown of Existing Units (10-Year Lookback), TPYc 8
P3 Net Ozone Precursor Emissions with Shutdown of Existing Units (5-Year Lookback), TPY
44
P3 Net Ozone Precursor Emissions with Shutdown of Existing Units (10-Year Lookback), TPY
40
P3 Net Ozone Precursor Emissions as Percent of Regional Total, with Shutdown of Existing Units
0.09 percent
PM10 Precursors – Annual Basis
Total Ventura County PM10 Precursors, TPY 63,484
Total P3 PM10 Precursor Emissions, TPY 63
P3 PM10 Precursor Emissions as Percent of Regional Total 0.10 percent
Reductions from Shutdown of Existing Units (5-Year Lookback), TPYb 7
Reductions from Shutdown of Existing Units (10-Year Lookback), TPYc 12
P3 Net PM10 Precursor Emissions with Existing Units (5-Year Lookback), TPY 56
P3 Net PM10 Precursor Emissions with Existing Units (10-Year Lookback), TPY 51
P3 Net PM10 Precursor Emissions as Percent of Regional Total, with Shutdown of Existing Units
0.09 percent
PM10/PM2.5 Precursors – Annual Basis
Total Ventura County PM2.5 Precursors, TPY 58,130
Total P3 PM2.5 Precursor Emissions, TPY 63
P3 PM2.5 Precursor Emissions as Percent of Regional Total 0.11 percent
Reductions from Shutdown of Existing Units (5-Year Lookback), TPYb 7
Reductions from Shutdown of Existing Units (10-Year Lookback), TPYc 12
P3 Net PM2.5 Precursor Emissions with Existing Units (5-Year Lookback), TPY 56
P3 Net PM2.5 Precursor Emissions with Existing Units (10-Year Lookback), TPY 51
P3 Net PM2.5 Precursor Emissions as Percent of Regional Total, with Shutdown of Existing Units
0.10 percent
Notes:
a. Countywide emissions calculated as 365 times daily emissions. b. Based on average emissions during past 5 years (2010 through 2014). c, Base on average emissions during past 10 years (2005 through 2014).
P3 = Puente Power Project PM10 = particulate matter less than 10 microns in diameter PM2.5 = particulate matter less than 2.5 microns in diameter TPY = tons per year
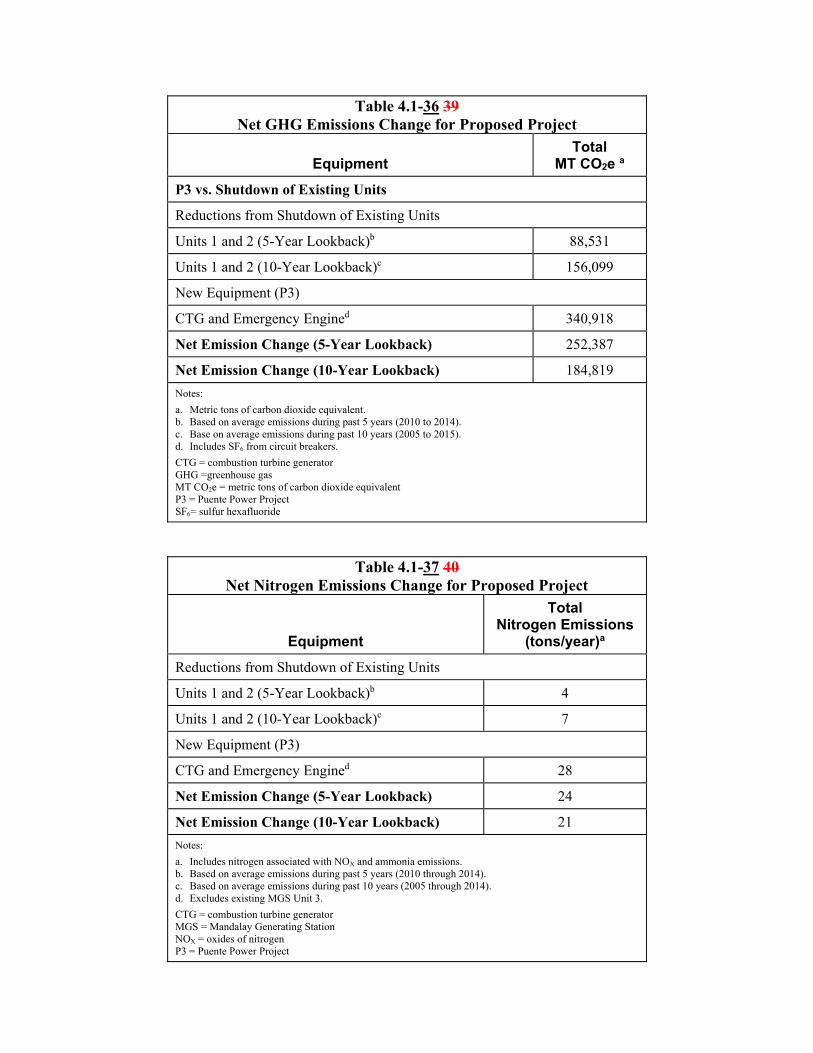
Table 4.1-36 39 Net GHG Emissions Change for Proposed Project
Equipment Total
MT CO2e a
P3 vs. Shutdown of Existing Units
Reductions from Shutdown of Existing Units
Units 1 and 2 (5-Year Lookback)b 88,531
Units 1 and 2 (10-Year Lookback)c 156,099
New Equipment (P3)
CTG and Emergency Engined 340,918
Net Emission Change (5-Year Lookback) 252,387
Net Emission Change (10-Year Lookback) 184,819
Notes:
a. Metric tons of carbon dioxide equivalent. b. Based on average emissions during past 5 years (2010 to 2014). c. Base on average emissions during past 10 years (2005 to 2015). d. Includes SF6 from circuit breakers.
CTG = combustion turbine generator GHG =greenhouse gas MT CO2e = metric tons of carbon dioxide equivalent P3 = Puente Power Project SF6= sulfur hexafluoride
Table 4.1-37 40 Net Nitrogen Emissions Change for Proposed Project
Equipment
Total Nitrogen Emissions
(tons/year)a
Reductions from Shutdown of Existing Units
Units 1 and 2 (5-Year Lookback)b 4
Units 1 and 2 (10-Year Lookback)c 7
New Equipment (P3)
CTG and Emergency Engined 28
Net Emission Change (5-Year Lookback) 24
Net Emission Change (10-Year Lookback) 21
Notes:
a. Includes nitrogen associated with NOX and ammonia emissions. b. Based on average emissions during past 5 years (2010 through 2014). c. Based on average emissions during past 10 years (2005 through 2014). d. Excludes existing MGS Unit 3.
CTG = combustion turbine generator MGS = Mandalay Generating Station NOX = oxides of nitrogen P3 = Puente Power Project
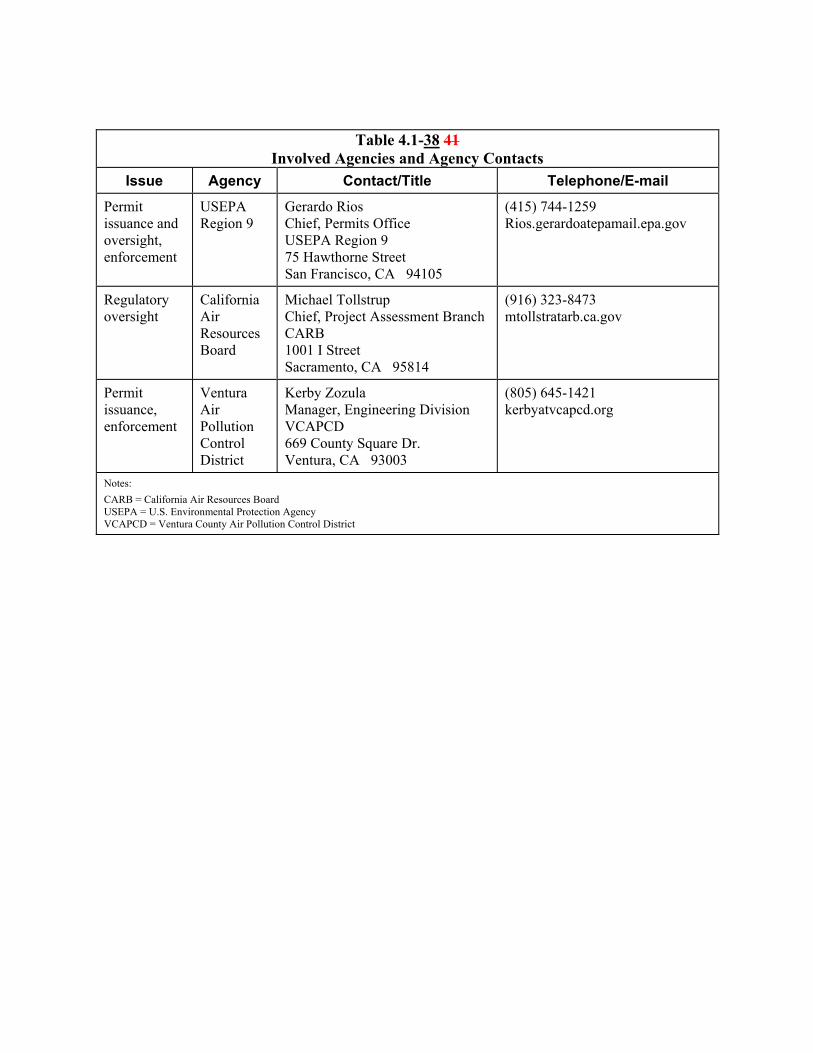
Table 4.1-38 41 Involved Agencies and Agency Contacts
Issue Agency Contact/Title Telephone/E-mail
Permit issuance and oversight, enforcement
USEPA Region 9
Gerardo Rios Chief, Permits Office USEPA Region 9 75 Hawthorne Street San Francisco, CA 94105
(415) 744-1259 Rios.gerardoatepamail.epa.gov
Regulatory oversight
California Air Resources Board
Michael Tollstrup Chief, Project Assessment Branch CARB 1001 I Street Sacramento, CA 95814
(916) 323-8473 mtollstratarb.ca.gov
Permit issuance, enforcement
Ventura Air Pollution Control District
Kerby Zozula Manager, Engineering Division VCAPCD 669 County Square Dr. Ventura, CA 93003
(805) 645-1421 kerbyatvcapcd.org
Notes:
CARB = California Air Resources Board USEPA = U.S. Environmental Protection Agency VCAPCD = Ventura County Air Pollution Control District

PUBLIC HEALTH
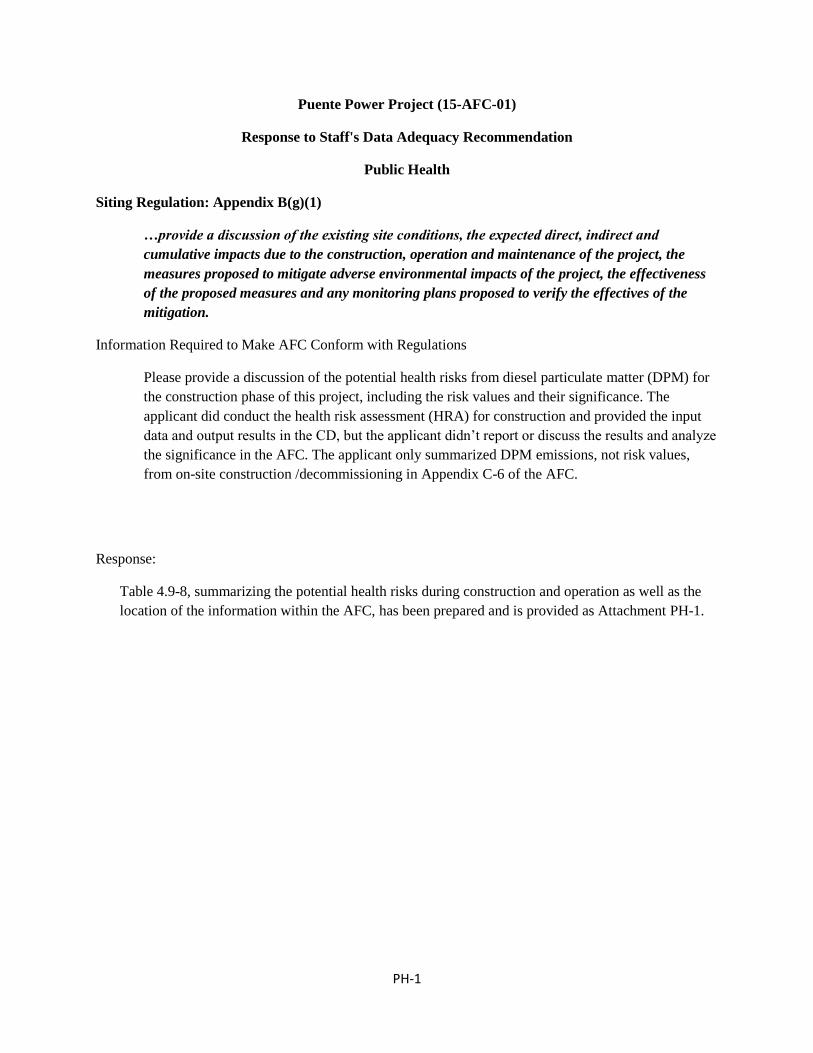
PH-1
Puente Power Project (15-AFC-01)
Response to Staff's Data Adequacy Recommendation
Public Health
Siting Regulation: Appendix B(g)(1)
…provide a discussion of the existing site conditions, the expected direct, indirect and
cumulative impacts due to the construction, operation and maintenance of the project, the
measures proposed to mitigate adverse environmental impacts of the project, the effectiveness
of the proposed measures and any monitoring plans proposed to verify the effectives of the
mitigation.
Information Required to Make AFC Conform with Regulations
Please provide a discussion of the potential health risks from diesel particulate matter (DPM) for
the construction phase of this project, including the risk values and their significance. The
applicant did conduct the health risk assessment (HRA) for construction and provided the input
data and output results in the CD, but the applicant didn’t report or discuss the results and analyze
the significance in the AFC. The applicant only summarized DPM emissions, not risk values,
from on-site construction /decommissioning in Appendix C-6 of the AFC.
Response:
Table 4.9-8, summarizing the potential health risks during construction and operation as well as the
location of the information within the AFC, has been prepared and is provided as Attachment PH-1.
ATTACHMENT PH-1
SUMMARY OF POTENTIAL HEALTH RISKS
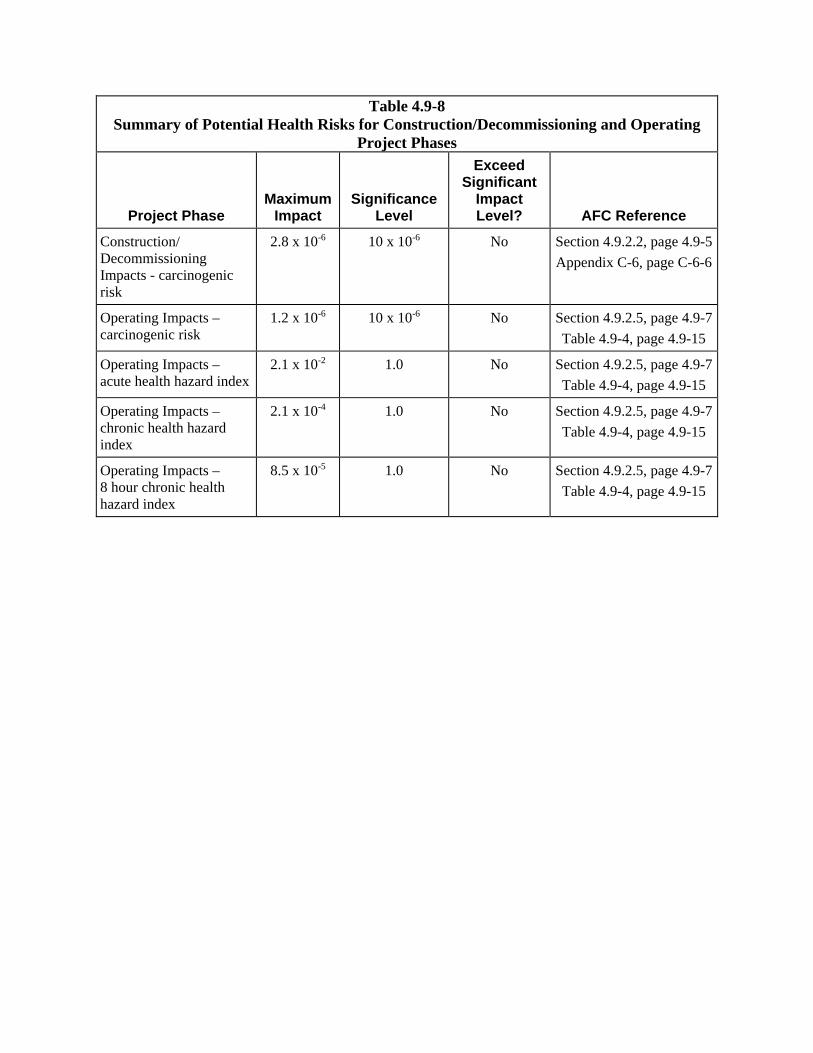
Table 4.9-8 Summary of Potential Health Risks for Construction/Decommissioning and Operating
Project Phases
Project Phase Maximum
Impact Significance
Level
Exceed Significant
Impact Level? AFC Reference
Construction/ Decommissioning Impacts - carcinogenic risk
2.8 x 10⁻⁶ 10 x 10-6 No Section 4.9.2.2, page 4.9-5
Appendix C-6, page C-6-6
Operating Impacts – carcinogenic risk
1.2 x 10⁻⁶ 10 x 10-6 No Section 4.9.2.5, page 4.9-7
Table 4.9-4, page 4.9-15
Operating Impacts – acute health hazard index
2.1 x 10⁻² 1.0 No Section 4.9.2.5, page 4.9-7
Table 4.9-4, page 4.9-15
Operating Impacts – chronic health hazard index
2.1 x 10⁻⁴ 1.0 No Section 4.9.2.5, page 4.9-7
Table 4.9-4, page 4.9-15
Operating Impacts – 8 hour chronic health hazard index
8.5 x 10⁻⁵ 1.0 No Section 4.9.2.5, page 4.9-7
Table 4.9-4, page 4.9-15

TRANSMISSION SYSTEM DESIGN
TSD-1
Puente Power Project (15-AFC-01)
Response to Staff's Data Adequacy Recommendation
Transmission System Design
Siting Regulation: Appendix B(b)(2)(C)
A detailed description of the design, construction, and operation of any electric transmission
facilities, such as power lines, substations, switchyards or other transmission equipment, which
will be constructed or modified to transmit electrical power from the proposed power plant to
the load centers to be served by the facility. Such description shall include the width of rights of
way and the physical and electrical characteristics of electrical transmission facilities such as
towers, conductors, and insulators. This description shall include power load flow diagrams
which demonstrate conformance or nonconformance with utility reliability and planning
criteria at the time the facility is expected to be placed in operation and five years thereafter;
and
Information Required to Make AFC Conform with Regulations
1. Resubmit Figure 2.7-5a. Show all equipment ratings including bay arrangement of the breakers,
disconnect switches, buses, and etc. which are required for the addition of the project.
2. Resubmit Figure 2.7-5b. Show all equipment ratings including generators, transformers, isolated
phase bus, circuit breakers, disconnect switches, and etc. which required for the project.
Response:
1. See attached Revised Figure 2.7-5a.
2. See attached Revised Figure 2.7-5b.
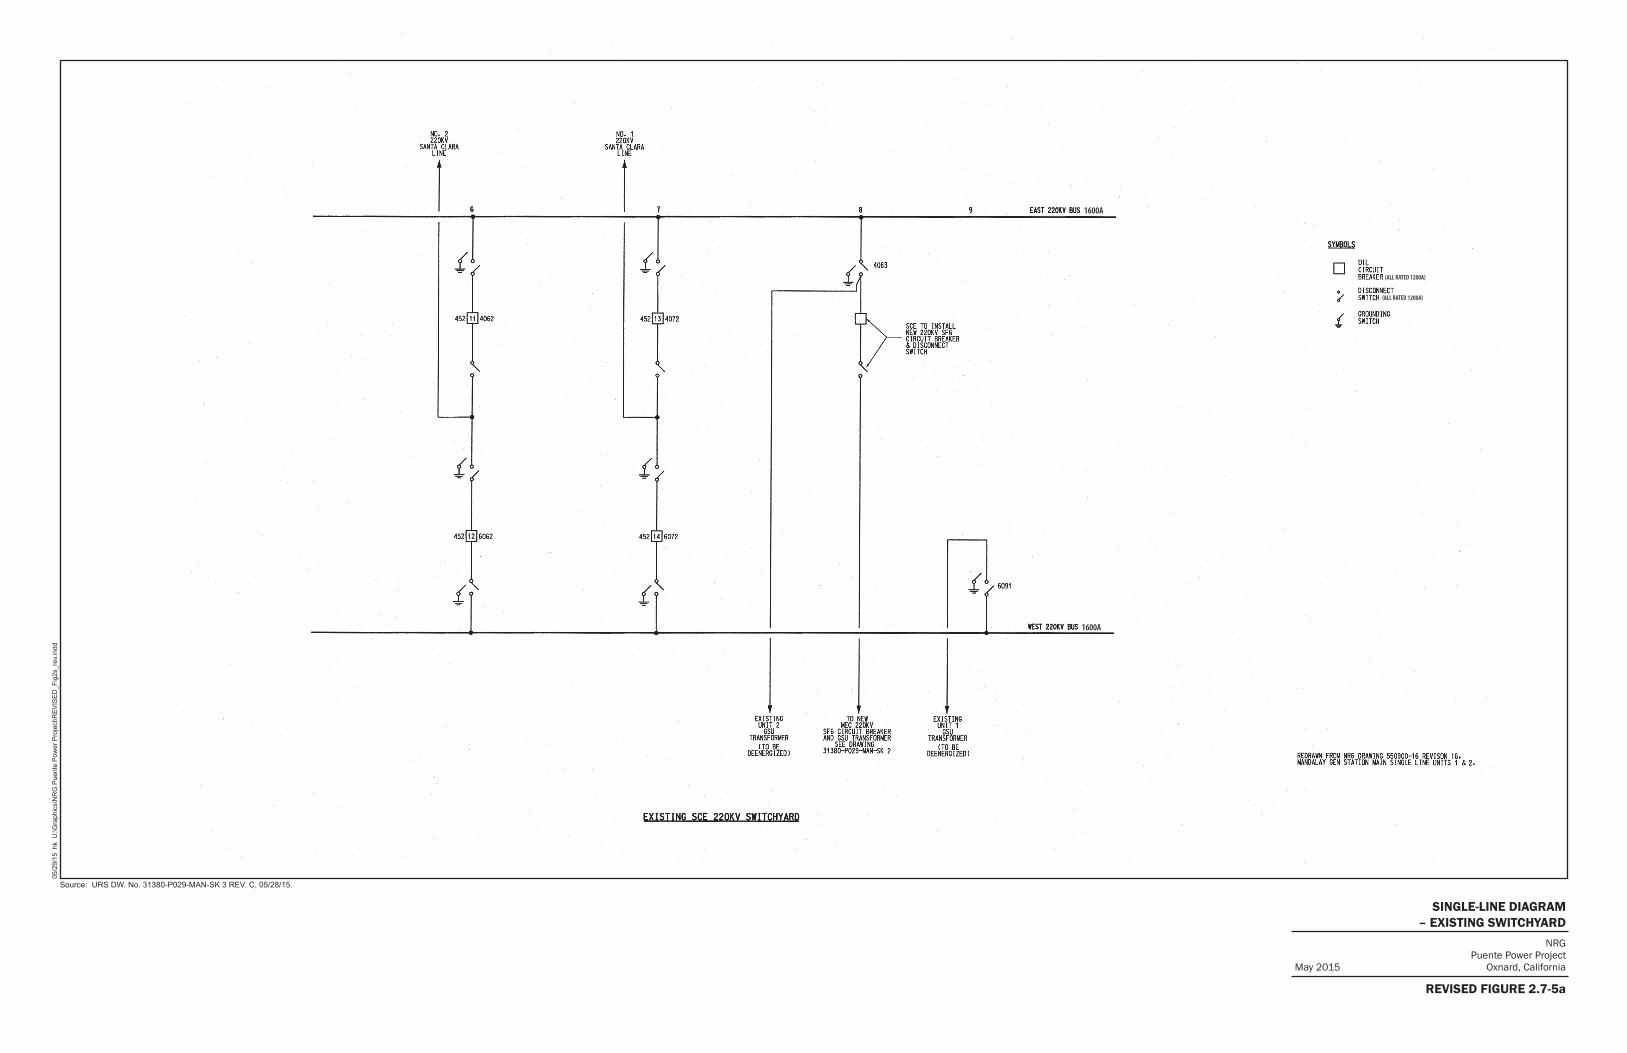
1600A
(ALL RATED 1200A)
(ALL RATED 1200A)
1600A
05/2
9/15
hk
U:\G
raph
ics\
NR
G P
uent
e P
ower
Pro
ject
\RE
VIS
ED
_Fig
2s_r
ev.in
dd
NRGPuente Power Project
Oxnard, CaliforniaMay 2015
REVISED FIGURE 2.7-5a
SINGLE-LINE DIAGRAM – EXISTING SWITCHYARD
Source: URS DW. No. 31380-P029-MAN-SK 3 REV. C, 05/28/15.
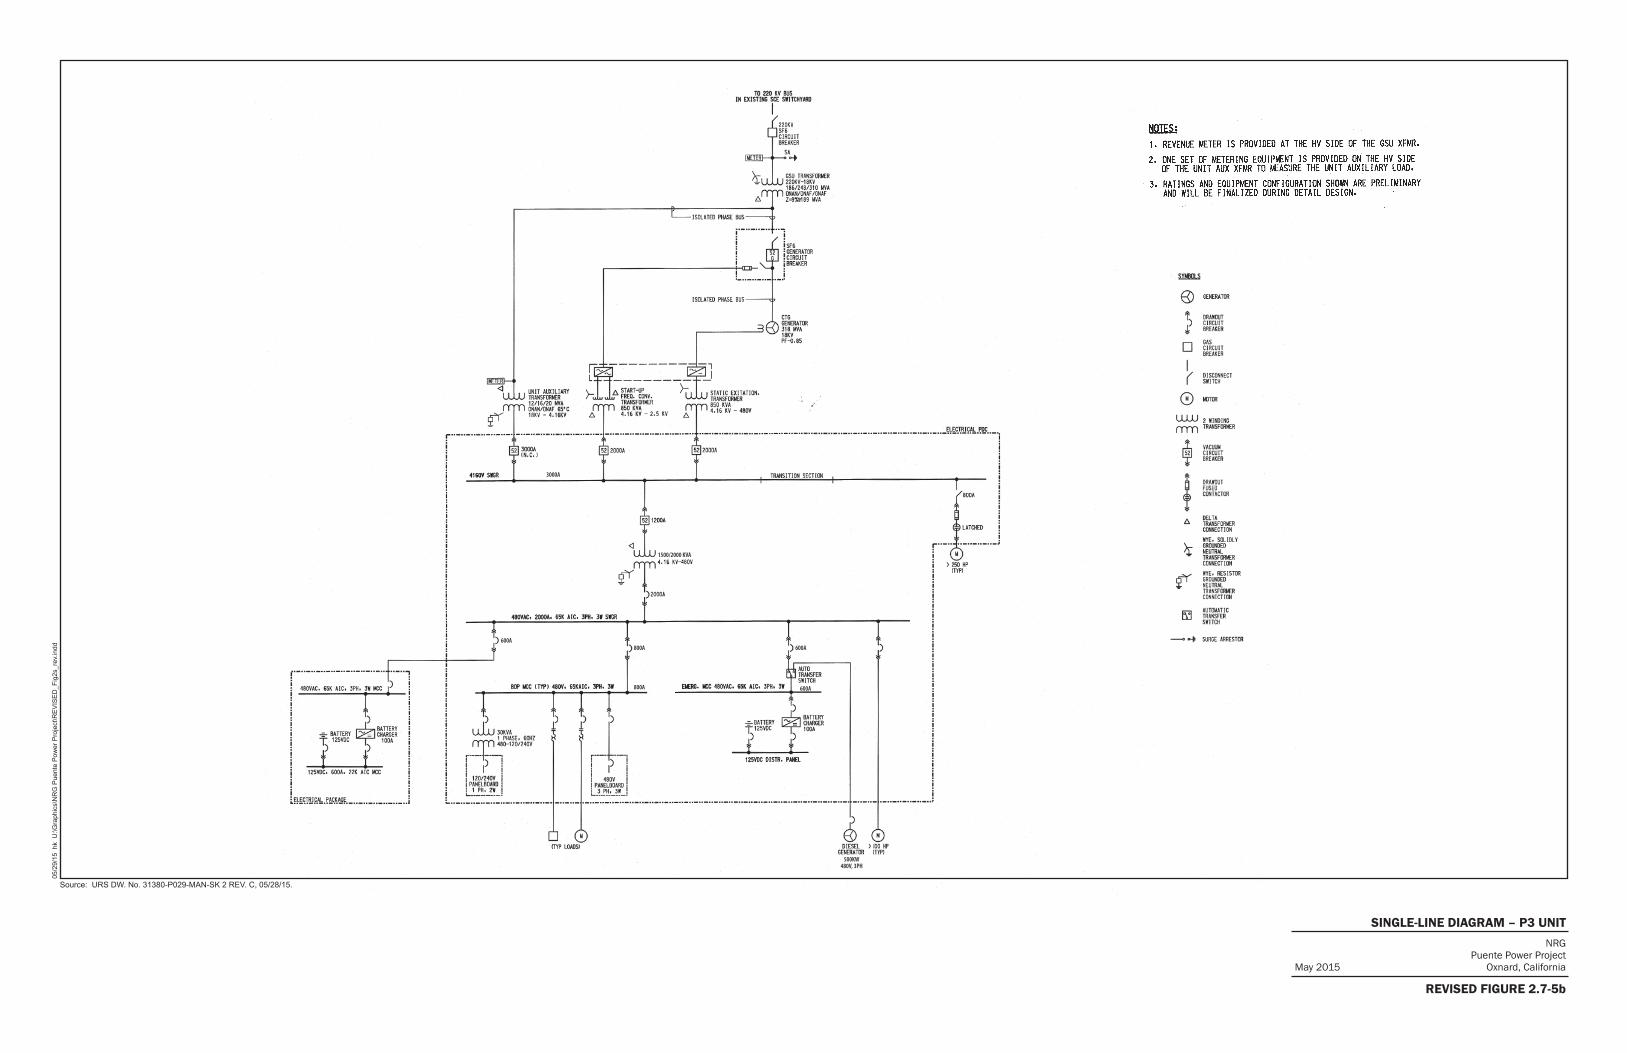
3000A
1500/2000 KVA
600A800A 600A
600A800A
500KW480V, 3PH
05/2
9/15
hk
U:\G
raph
ics\
NR
G P
uent
e P
ower
Pro
ject
\RE
VIS
ED
_Fig
2s_r
ev.in
dd
NRGPuente Power Project
Oxnard, CaliforniaMay 2015
REVISED FIGURE 2.7-5b
SINGLE-LINE DIAGRAM – P3 UNIT
Source: URS DW. No. 31380-P029-MAN-SK 2 REV. C, 05/28/15.
TSD-2
Siting Regulation: Appendix B(b)(2)(E)
A completed System Impact Study or signed System Impact Study Agreement with the
California Independent System Operator and proof of payment. When not connecting to the
California Independent Operator System Operator controlled grid, provide the executed System
Impact Study agreement and proof of payment to the interconnecting utility.
If the interconnection and operation of the proposed project will likely impact a transmission
system that is not controlled by the interconnecting utility (or California Independent System
Operator), provide evidence of a System Impact Study or agreement and proof of payment
(when applicable) with/to the impacted transmission owner or provide evidence that there are
no system impacts requiring mitigation.
Information Required to Make AFC Conform with Regulations
1. There is no CAISO letter in the Appendix B-1. Provide the 2014 CAISO letter and Repowering
Request Technical Review specific to the proposed Puente Power Project.
2. Provide a letter from CAISO confirming the Puente Power Project is not subject to the
interconnection queue process, pursuant to Section 25.1 of the ISO tariff.
3. As stated in section 3.5, the Puente Power Project was amended in January 2015, provide a final
Facilities Study Agreement specific to/for the proposed Puente Power Project.
Response:
1. The CAISO letter dated May 29, 2015 and Repower Study Report specific to the proposed Puente
Power Project are provided in the attached Appendix B-1 (see Attachment TSD-1). Text on page
3-4, Section 3.5 of the AFC should be changed from “The 2014 CAISO…” to “The 2015
CAISO…” as shown on the attached markup of Chapter 3, Transmission (see Attachment TSD-
1).
2. The attached May 29, 2015 letter from CAISO confirms that the Puente Power Project is not
subject to the interconnection queue process, pursuant to Section 25.1 of the ISO tariff (see
Attachment TSD-1).
3. The Facilities Study Agreement (signed in April 2014) and proof of payment were included in
Appendix B of the AFC and are now included in the attached Appendix B-2 (see Attachment
TSD-1). As discussed in the attached May 29, 2015 Repower Study Report, NRG submitted a
Generation Unit Repowering request to CAISO in December 2013 and amended the request in
January 2015. The final February 2015 Facilities Study Agreement specific to the proposed
Puente Power Project is attached to this response (see Appendix B-3 in Attachment TSD-1). No
additional payment was required.

ATTACHMENT TSD-1
CAISO FACILITIES STUDY
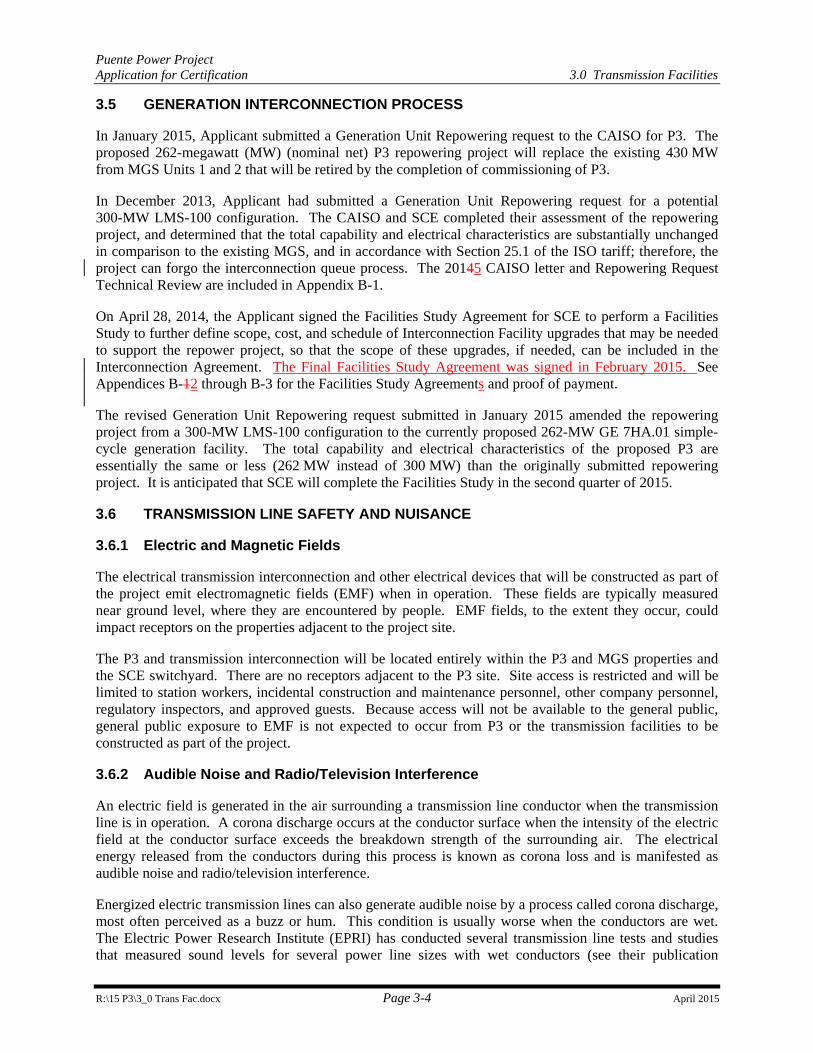
Puente Power Project Application for Certification 3.0 Transmission Facilities
R:\15 P3\3_0 Trans Fac.docx Page 3-4 April 2015
3.5 GENERATION INTERCONNECTION PROCESS
In January 2015, Applicant submitted a Generation Unit Repowering request to the CAISO for P3. The proposed 262-megawatt (MW) (nominal net) P3 repowering project will replace the existing 430 MW from MGS Units 1 and 2 that will be retired by the completion of commissioning of P3.
In December 2013, Applicant had submitted a Generation Unit Repowering request for a potential 300-MW LMS-100 configuration. The CAISO and SCE completed their assessment of the repowering project, and determined that the total capability and electrical characteristics are substantially unchanged in comparison to the existing MGS, and in accordance with Section 25.1 of the ISO tariff; therefore, the project can forgo the interconnection queue process. The 20145 CAISO letter and Repowering Request Technical Review are included in Appendix B-1.
On April 28, 2014, the Applicant signed the Facilities Study Agreement for SCE to perform a Facilities Study to further define scope, cost, and schedule of Interconnection Facility upgrades that may be needed to support the repower project, so that the scope of these upgrades, if needed, can be included in the Interconnection Agreement. The Final Facilities Study Agreement was signed in February 2015. See Appendices B-12 through B-3 for the Facilities Study Agreements and proof of payment.
The revised Generation Unit Repowering request submitted in January 2015 amended the repowering project from a 300-MW LMS-100 configuration to the currently proposed 262-MW GE 7HA.01 simple-cycle generation facility. The total capability and electrical characteristics of the proposed P3 are essentially the same or less (262 MW instead of 300 MW) than the originally submitted repowering project. It is anticipated that SCE will complete the Facilities Study in the second quarter of 2015.
3.6 TRANSMISSION LINE SAFETY AND NUISANCE
3.6.1 Electric and Magnetic Fields
The electrical transmission interconnection and other electrical devices that will be constructed as part of the project emit electromagnetic fields (EMF) when in operation. These fields are typically measured near ground level, where they are encountered by people. EMF fields, to the extent they occur, could impact receptors on the properties adjacent to the project site.
The P3 and transmission interconnection will be located entirely within the P3 and MGS properties and the SCE switchyard. There are no receptors adjacent to the P3 site. Site access is restricted and will be limited to station workers, incidental construction and maintenance personnel, other company personnel, regulatory inspectors, and approved guests. Because access will not be available to the general public, general public exposure to EMF is not expected to occur from P3 or the transmission facilities to be constructed as part of the project.
3.6.2 Audible Noise and Radio/Television Interference
An electric field is generated in the air surrounding a transmission line conductor when the transmission line is in operation. A corona discharge occurs at the conductor surface when the intensity of the electric field at the conductor surface exceeds the breakdown strength of the surrounding air. The electrical energy released from the conductors during this process is known as corona loss and is manifested as audible noise and radio/television interference.
Energized electric transmission lines can also generate audible noise by a process called corona discharge, most often perceived as a buzz or hum. This condition is usually worse when the conductors are wet. The Electric Power Research Institute (EPRI) has conducted several transmission line tests and studies that measured sound levels for several power line sizes with wet conductors (see their publication
APPENDIX B-1
2015 CAISO REPOWERING REQUEST TECHNICAL REVIEW
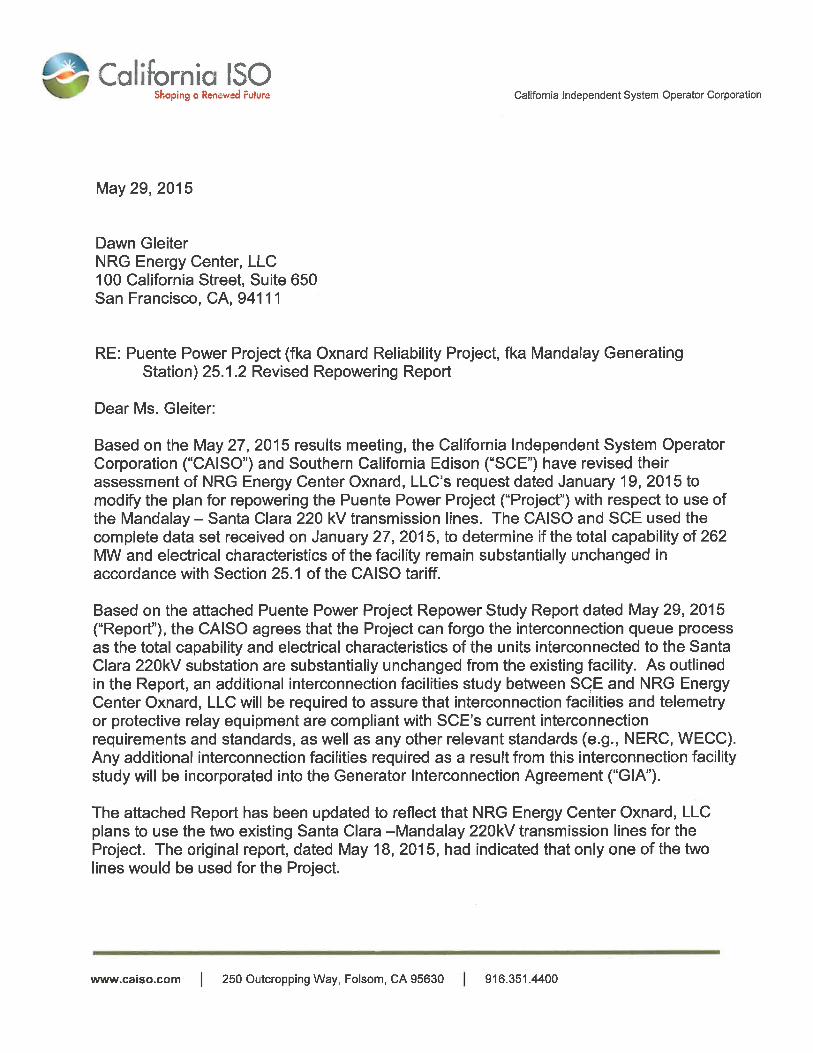
Repower Study Report
NRG Energy Center Oxnard, LLC Puente Power Project
May 29, 2015
This study has been completed with Southern California Edison Company (SCE) per CAISO Tariff Section 25.1.2
1
1. Introduction
On December 13, 2013, NRG Energy Center Oxnard, LLC (“NRG”) submitted a Generation Unit Repowering request to the California Independent System Operator (“CAISO”). NRG’s request is to repower the Puente Power Project (“Facility”) which is also referred to as the Oxnard Reliability Project and the Mandalay Generating Station. After initial review of the information, the ISO and Southern California Edison (“SCE”) determined that additional work was needed to complete the review. On January 9, 2014, NRG provided a complete package of all materials needed to complete evaluation of the repowering request. In addition, NRG provided a notarized affidavit representing that the total capability and/or electrical characteristics of the 430 MW electric generating facility will remain substantially unchanged in satisfaction of the requirements under Section 25.1.2 of the ISO Tariff for repowering. The requested in-service date for the repower project is June 2020. On March 27, 2014 NRG received the results of the Repowering Request Technical Review. In which, it was concluded that the Facility did not result in substantially changing the total capability/and or electrical characteristics of the electric generating facility. On November 17, 2014, NRG reached out to the CAISO to inform them that the previously submitted request to use LMS100 units was not accepted and instead a GE 7HA.01 technology was selected by SCE as the chosen bid for the SCE RFO to comply with the local capacity requirement at Moorpark Sub-Area. On November 17, 2014, NRG reached out to inform the CAISO of the result and requested to amend the original repowering request. NRG submitted a complete package of all materials needed to complete the evaluation of the repowering request with the new data on January 27, 2015. A technical assessment was performed to ascertain and verify that the repower request does not result in substantially changing the total capability and/or electrical characteristics of the electric generating facility. The assessment was performed following Generating Unit Repowering procedures detailed in the CAISO’s Business Practice Manual for Generation Management. The Business Practice Manual describes the CAISO’s procedures for evaluating repower requests by an owner of an existing generating unit made pursuant to Section 25.1.2 of the CAISO tariff. Section 25.1.2 of the ISO tariff allows such entities to obtain an ISO interconnection agreement without having to participate in the ISO generator interconnection and deliverability allocation study process if they demonstrate that the total capability and electrical characteristics of the generating unit will be substantially unchanged. Based on the results of the assessment, the total capability and/or electrical characteristics of the electric generating facility will remain substantially unchanged. However, a Facilities Study is required to further define scope, cost, and schedule of Interconnection Facility upgrades needed to support the repower project so that such scope can be properly described in the Interconnection Agreement. The Facility will not be allowed to repower without the completion of the Facilities Study, the incorporation of any required upgrades into an Interconnection Agreement and the execution of an Interconnection Agreement addressing the repower and corresponding upgrades.
2
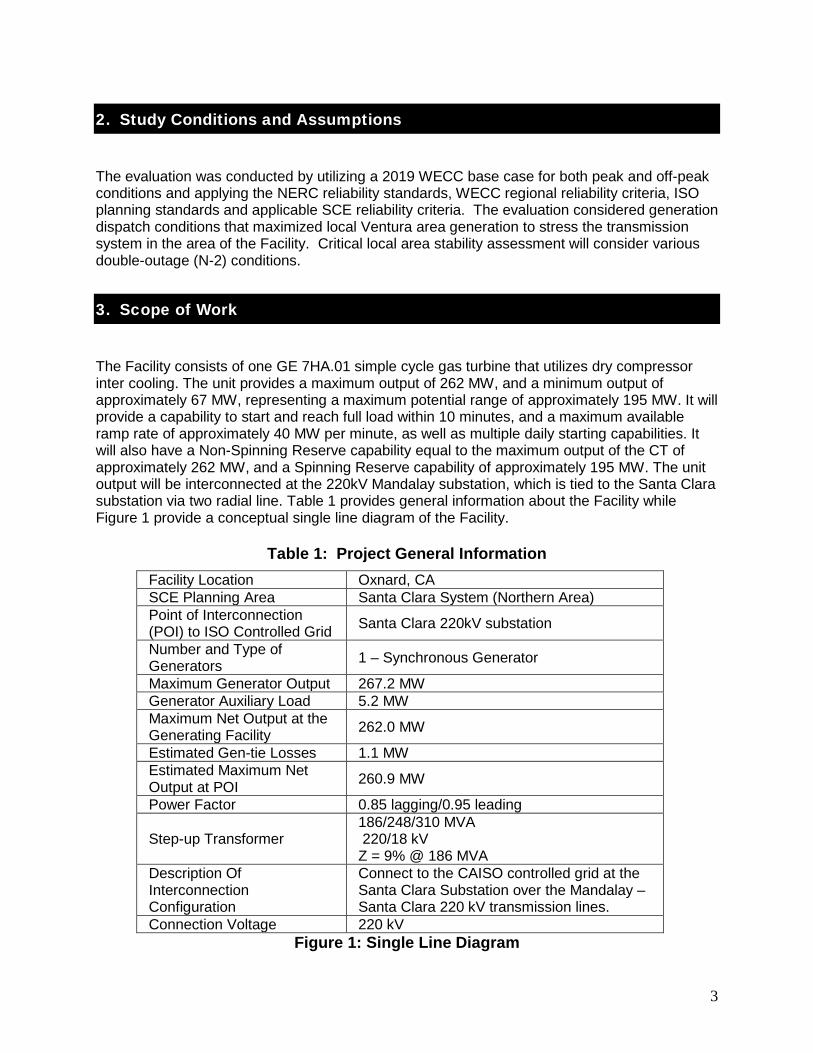
2. Study Conditions and Assumptions
The evaluation was conducted by utilizing a 2019 WECC base case for both peak and off-peak conditions and applying the NERC reliability standards, WECC regional reliability criteria, ISO planning standards and applicable SCE reliability criteria. The evaluation considered generation dispatch conditions that maximized local Ventura area generation to stress the transmission system in the area of the Facility. Critical local area stability assessment will consider various double-outage (N-2) conditions.
3. Scope of Work
The Facility consists of one GE 7HA.01 simple cycle gas turbine that utilizes dry compressor inter cooling. The unit provides a maximum output of 262 MW, and a minimum output of approximately 67 MW, representing a maximum potential range of approximately 195 MW. It will provide a capability to start and reach full load within 10 minutes, and a maximum available ramp rate of approximately 40 MW per minute, as well as multiple daily starting capabilities. It will also have a Non-Spinning Reserve capability equal to the maximum output of the CT of approximately 262 MW, and a Spinning Reserve capability of approximately 195 MW. The unit output will be interconnected at the 220kV Mandalay substation, which is tied to the Santa Clara substation via two radial line. Table 1 provides general information about the Facility while Figure 1 provide a conceptual single line diagram of the Facility.
Table 1: Project General Information
Facility Location Oxnard, CA SCE Planning Area Santa Clara System (Northern Area) Point of Interconnection (POI) to ISO Controlled Grid Santa Clara 220kV substation
Number and Type of Generators 1 – Synchronous Generator
Maximum Generator Output 267.2 MW Generator Auxiliary Load 5.2 MW Maximum Net Output at the Generating Facility 262.0 MW
Estimated Gen-tie Losses 1.1 MW Estimated Maximum Net Output at POI 260.9 MW
Power Factor 0.85 lagging/0.95 leading
Step-up Transformer 186/248/310 MVA 220/18 kV Z = 9% @ 186 MVA
Description Of Interconnection Configuration
Connect to the CAISO controlled grid at the Santa Clara Substation over the Mandalay – Santa Clara 220 kV transmission lines.
Connection Voltage 220 kV Figure 1: Single Line Diagram
3
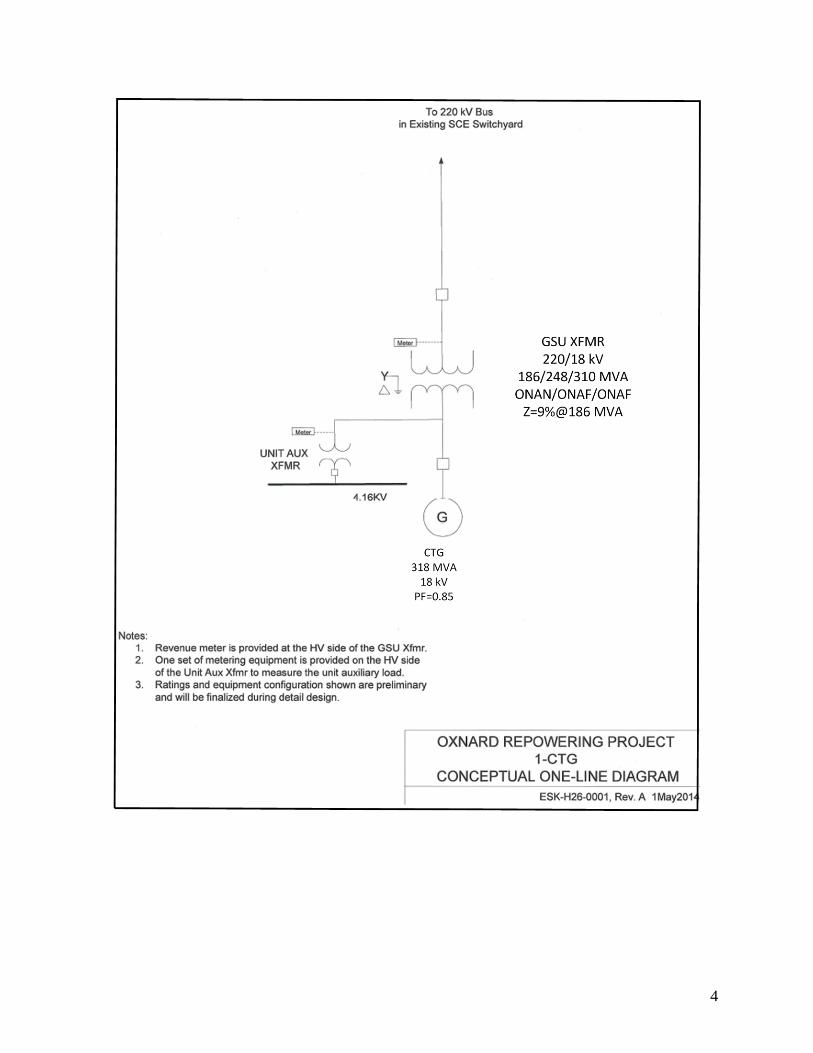
4
4. Results of Evaluation
It is understood that any repower of a generating unit, unless replaced with identical equipment, will result in some changes to the total capability and electrical characteristics of the generating unit and therefore some degree of change to the performance of the transmission system. Most of these changes can be attributed to improvements in technology or the unavailability of original equipment. The ISO considers changes to be ‘substantial’ if there is a proposed change in fuel source or they are found to have an adverse impact on the transmission system, either of which would require the Facility to be evaluated pursuant to the ISO’s generator interconnection and deliverability allocation procedures. Adverse impacts to a transmission system would include increasing the power flow during normal or contingency conditions, any increase in the short circuit duty impacts, or adverse angular or voltage stability impacts, as compared to the impacts associated with the original generating unit.
4.1 Power Flow Impact
The Generating Unit Repowering Technical Bulletin published by the CAISO on September 12, 2013 states that a repower of a generating unit that results in the same or less MW capacity is not considered a substantial change to the total capability of the generating unit from a flow impact standpoint provided all ISO tariff requirements regarding reactive power are met by the new generating unit. Based on the technical data provided, the repower project involves replacing the existing Mandalay Generating Station Units 1 and 2 with one GE 7HA.01 simple cycle gas turbine. This scope of work results in a reduction of total net MW capability from 430 MW down to 262 MW. As far as reactive power requirements, since the generation units are synchronous generators, the repowered units inherently meet all ISO tariff requirements regarding reactive power. Consequently, the repower of the Facility is not considered a substantial change to the total capability of the generating unit from a flow impact standpoint as there would be no adverse power flow impact on the transmission grid under normal and contingency conditions as compared with the original generating unit.
4.2 Short Circuit Duty Impact
The Generating Unit Repowering Technical Bulletin published by the CAISO on September 12, 2013 states that any reduction in the short circuit duty of the repowered generating unit as compared with the original generating unit will not be considered an adverse impact and will not be considered a substantial change to the electrical characteristics. To evaluate the change of short-circuit duty corresponding to the repower project, the evaluation calculated the maximum symmetrical three-phase-to-ground and single-phase-to-ground short-circuit duties at the Mandalay 220 kV bus for both the existing units and the resulting configuration following the repower project. Generation and transformer data represented in the generator and transformer data sheets provided by the customer were utilized. Results of the SCD evaluation are provided below in Table 2.
5
Table 2 Three-Phase-to-Ground and Single-Phase-to-Ground Short-Circuit Duties
Mandalay 220 kV Substation with two radial Santa-Clara 220 kV T/Ls
Type of Fault Existing Repowered Delta
kA kA X/R kA X/R Three-Phase 19.0 13.3 17.0 11.8 -2.0 Single-Phase 16.9 16.0 14.1 13.3 -2.8
Based on a reduction in SCD at the Mandalay 220 kV Substation, the repower of the Facility is not considered a substantial change to the electric characteristics.
4.3 Angular and Voltage Stability Impact
The Generating Unit Repowering Technical Bulletin published by the CAISO on September 12, 2013 states that angular and voltage stability impacts of a generating unit directly depends on the type of generator and the power system control functions that the generating unit encompasses. To evaluate angular and voltage stability impacts, local area N-2 contingencies were evaluated for transient stability and post-transient voltage performance. The evaluation was conducted to determine performance according to NERC/WECC planning criteria for the repower project. The double contingencies evaluated that affect the area of interest are listed below in Table 4.
TABLE 4 Transient Stability and Post-Transient Voltage
Critical Study Outages
Outage Bus Fault Location
Fault Duration
Santa Clara – Moorpark No.1 and No.2 220 kV T/Ls
Santa Clara 220 kV
3-phase 6 cycles
Pardee-Sylmar No.1 and No.2 220 kV T/Ls Pardee 220 kV 3-phase 6 cycles
Moorpark-Pardee No.1 and No.2 220 kV T/Ls Pardee 220 kV 3-
phase 6 cycles
Pardee-Vincent No.1 and No.2 220 kV T/Ls Pardee 220 kV 3-phase 6-cycles
Pardee-Sylmar No.1 and No.2 220 kV T/Ls Pardee 220 kV 1-phase 12 cycles
No transient stability problems or post-transient voltage issues were identified to be associated with the repower request. Consequently, the repower of the Facility is not considered a substantial change to the electric characteristics.
6
5. Conclusions
Based on the results of the assessment, the repower request does not result in substantially changing the total capability and/or electrical characteristics of the electric generating facility. However, a Facilities Study is required to further define scope, cost, and schedule of Interconnection Facility upgrades needed to support the repower project so that such scope can be properly described in the Interconnection Agreement. The Facility will not be allowed to repower without the completion of the Facilities Study, the incorporation of any required upgrades into an Interconnection Agreement and the execution of an Interconnection Agreement addressing the repower and corresponding upgrades.
6. Facilities Study
Although the evaluation has concluded that the capability and electrical characteristics for the repower project is substantially unchanged and therefore does not need to be submitted into the ISO generation interconnection queue, a Facilities Study is required to assure that interconnection facilities, telemetry and protective relay equipment are compliant with the Participating TO’s current interconnection requirements and standards. A high-level evaluation of these facilities has identified the need to perform a detailed review to adequately support the repower project. The activities required involve:
• Development of cost estimate and schedule to replace one set of motor operated disconnect (MOD) switch with two 220 kV circuit breakers and four 220 kV disconnect switches and install a 220 KV MEER building.
• The Facilities Study will also look at the following elements inside the Mandalay
Substation and develop scope, cost and schedule of any Interconnection Facility upgrades needed to support interconnection of the repower of the Puente Power Project:
o Transmission o Substation o Protection o Telecommunications o Environmental Health and Safety o Licensing o Real Properties
Such scope, cost, and schedule will form the basis for properly defining Interconnection Agreement.
7
APPENDIX B-2
2014 FACILITIES STUDY AGREEMENT AND PROOF OF PAYMENT
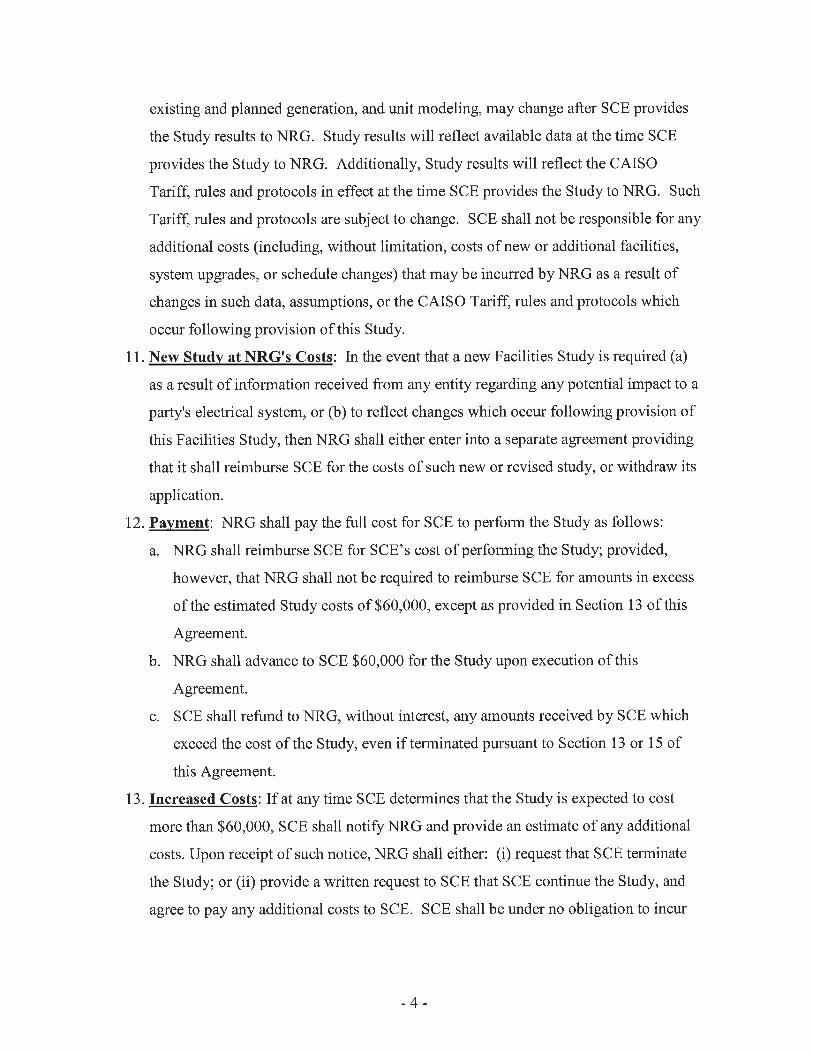
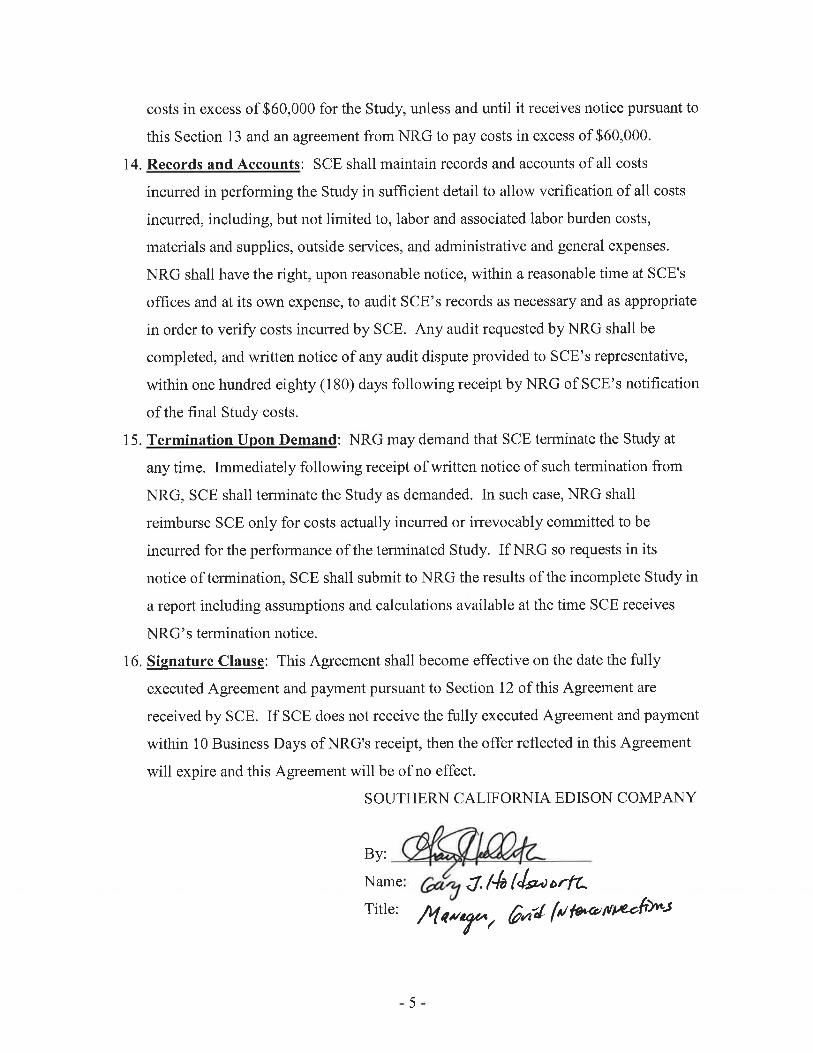
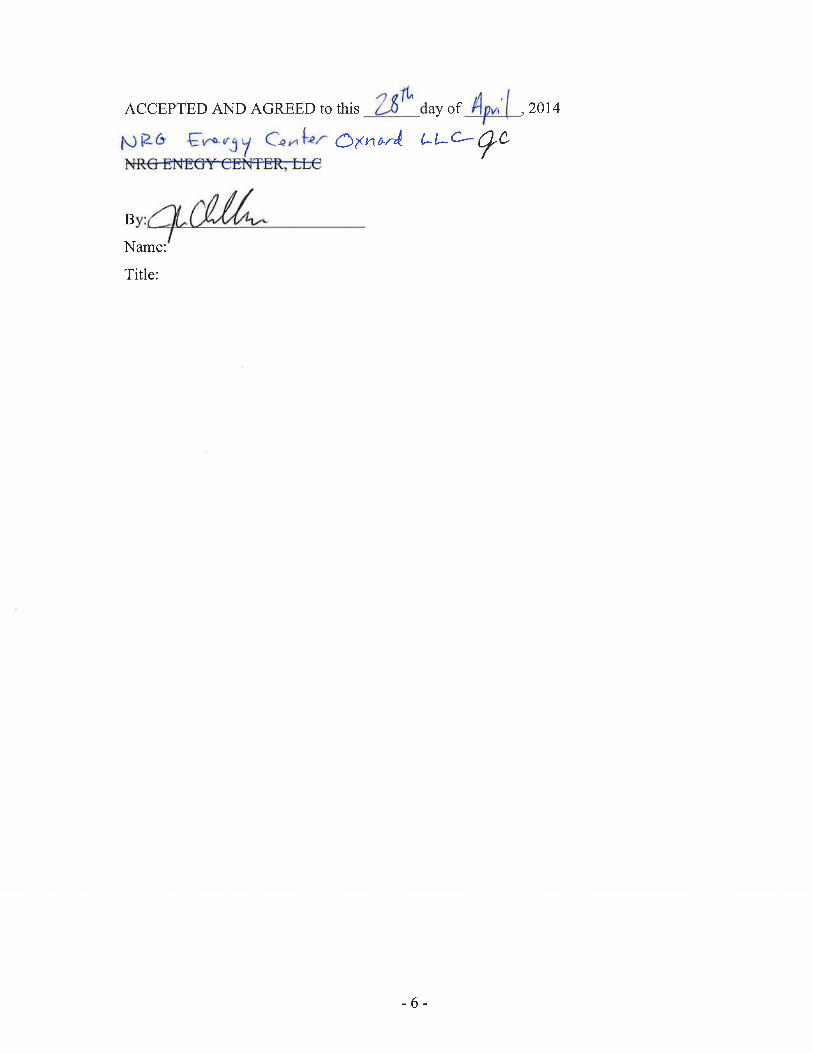
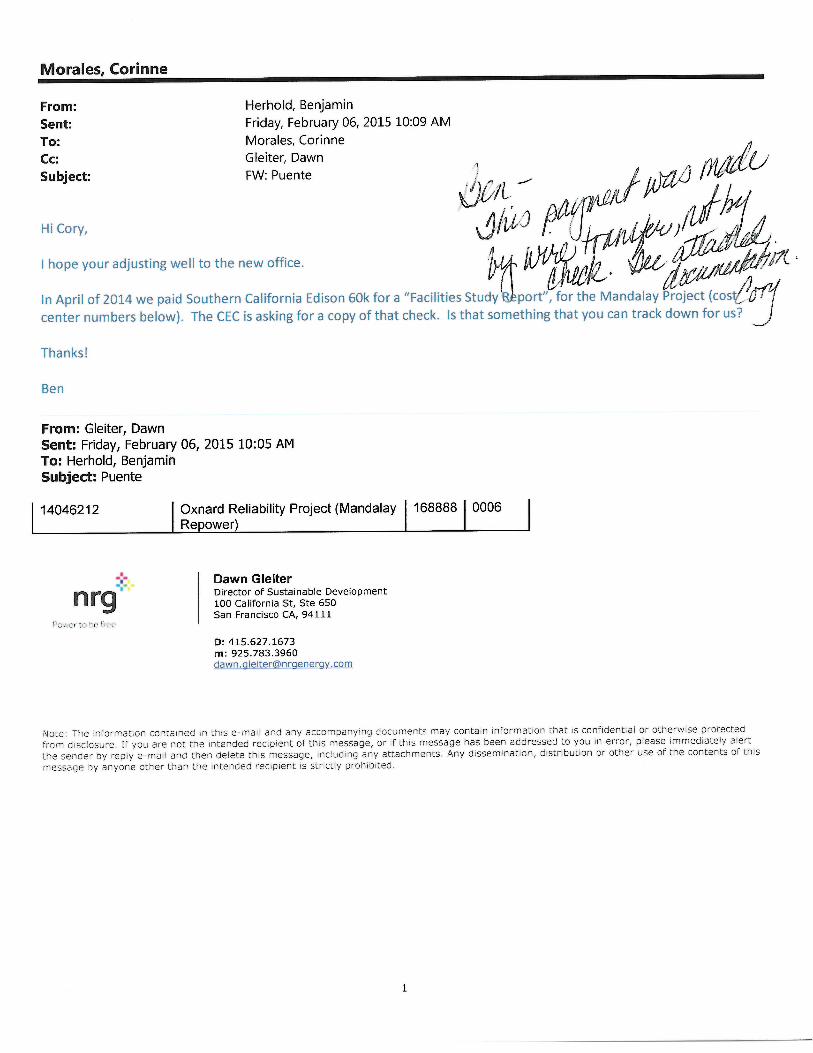
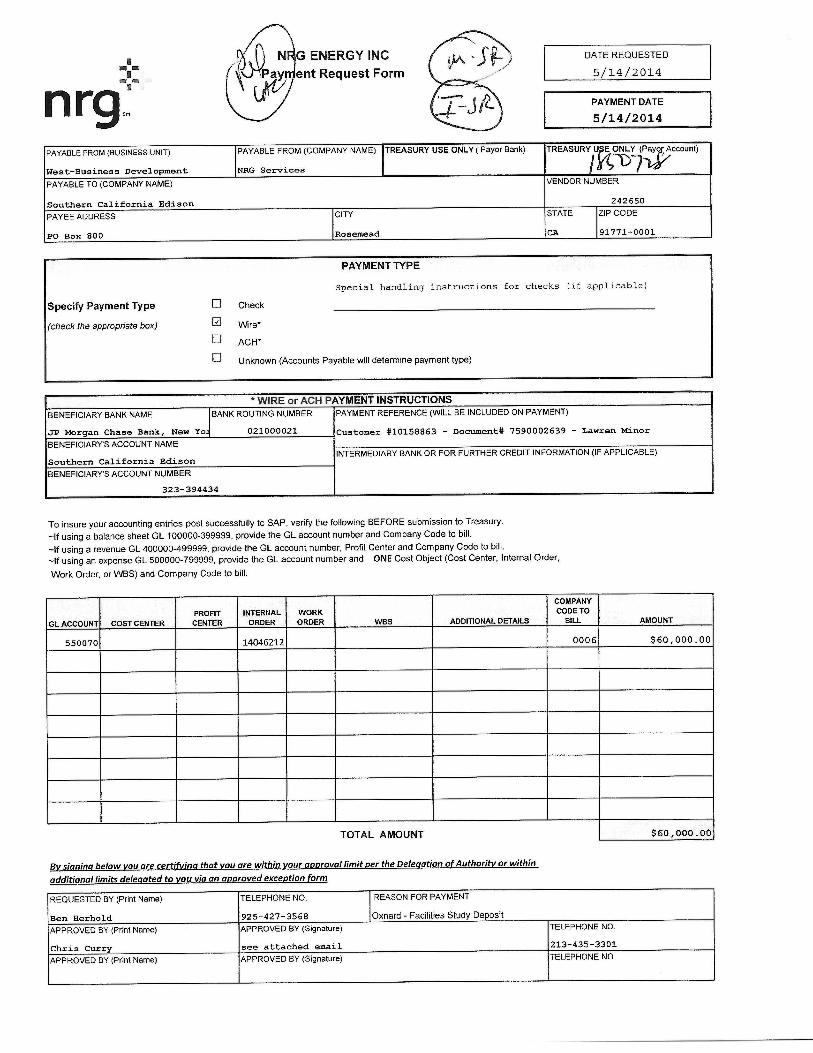
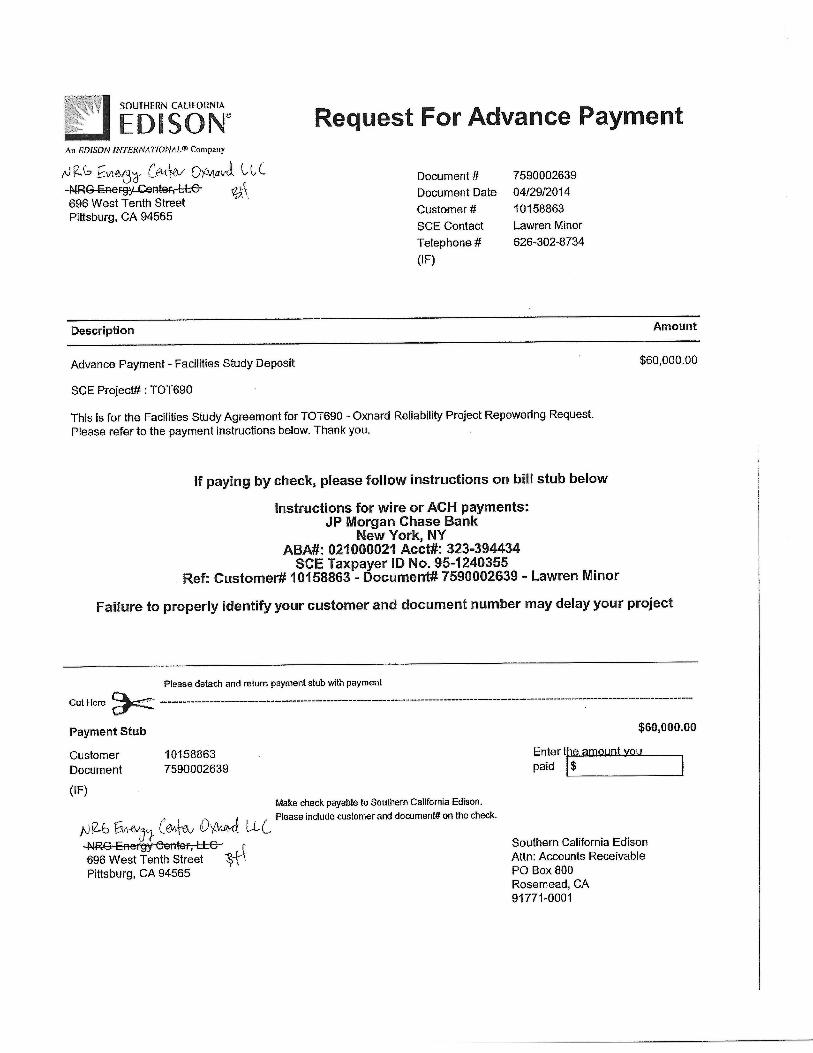

APPENDIX B-3
2015 FACILITIES STUDY AGREEMENT
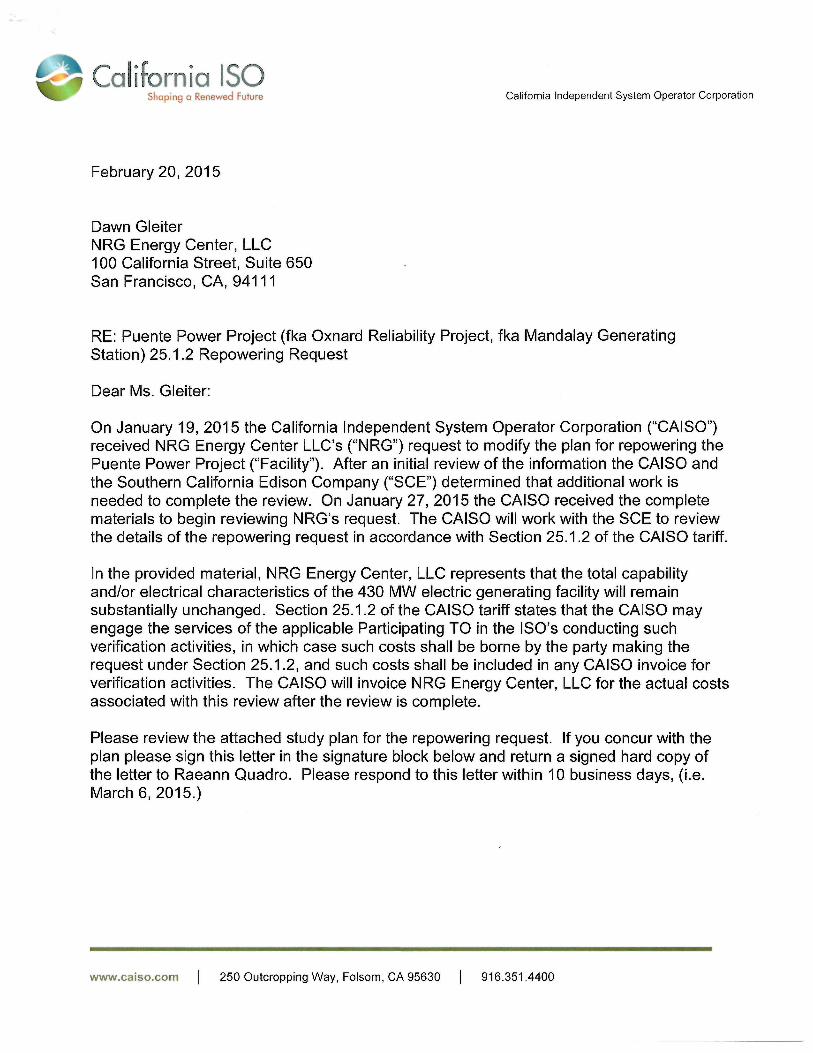
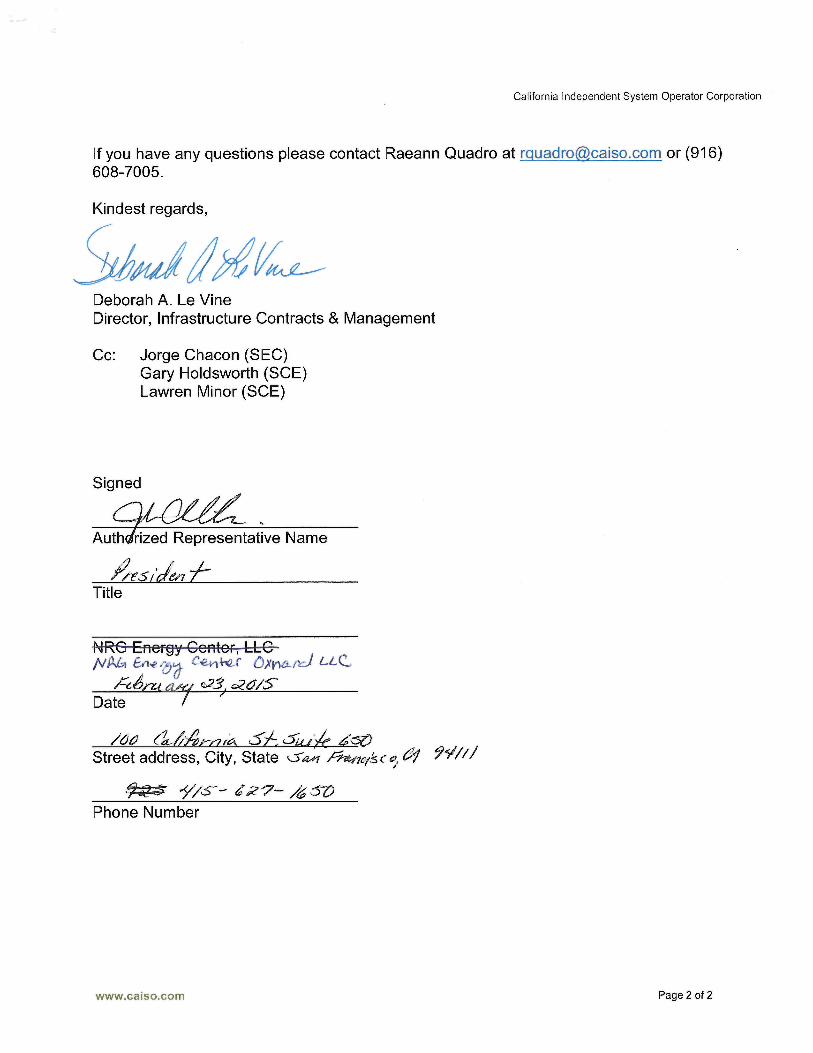


![CALIFORNIA LAW REVISION COMMISSION · 2015] 473 STATE OF CALIFORNIA CALIFORNIA LAW REVISION COMMISSION c/o King Hall Law School Davis, CA 95616 TARAS KIHICZAK, Chairperson CRYSTAL](https://img.pdfslide.net/doc/110x75/5ad08cb87f8b9a4e7a8e15b5/california-law-revision-473-state-of-california-california-law-revision-commission.jpg)