Embed Size (px)
Citation preview
For analyst certification and important disclosures, see the Disclosure Appendix.
Oppenheimer & Co. Inc. 85 Broad Street New York, NY 10004 Tel: 800-221-5588 Fax: 212-667-8229
Technical Analysis
Ari H. Wald, CFA, CMT Technical Analysis (212) 667-5279 [email protected]
June 23, 2019
Technical Analysis: Inflection Points
The Blue Chip Report
Trading conditions have become overbought as the S&P 500 attempts to break through 2,950. The key reason we believe stocks should be owned and pullbacks should be bought is because global markets are improving following an 18-month decline in risk dating back to January 2018. More recently, signs of a double-bottom in the High-Beta vs. Low Volatility ratio corroborate our summer-2016 analog and add to our conviction.
This week’s report highlights the 30 largest stocks in the S&P 500 by market cap. Top ideas are from the Technology sector.
Reviewing the 30 Largest US Stocks
Top Buy: AMZN, CMCSA, CSCO, DIS, HD, MA, MSFT, V, WMT Buy: AAPL, CVX, FB, JPM, MRK, ORCL, PEP, PG Hold: BA, BAC, BRK/B, GOOGL, INTC, JNJ, KO, PFE, T, UNH, VZ Sell: WFC, XOM
June 23, 2019
Key Points
OW MW UW
Energy X
Materials X
Industrials X
Capital Goods x
Commercial & Professional Services xTransportation x
Consumer Discretionary X
Automobiles & Components x
Consumer Durables & Apparel x
Consumer Services x
Retailing x
Consumer Staples X
Food & Staples Retailing x
Food, Beverage & Tobacco x
Household & Personal Products x
Health Care X
HC Equipment & Services x
Pharmaceuticals, Biotechnology & Life Sciences x
Financials X
Banks x
Diversified Financials x
Insurance x
REITs X
Technology X
Software & Services x
Technology Hardware & Equipment x
Semis & Semi Equipment x
Communication Services X
Telecommunication Services x
Media & Entertainment x
Utilities XSource: Oppenheimer & Co.
S&P 500 Sector and Industry Group Ranks
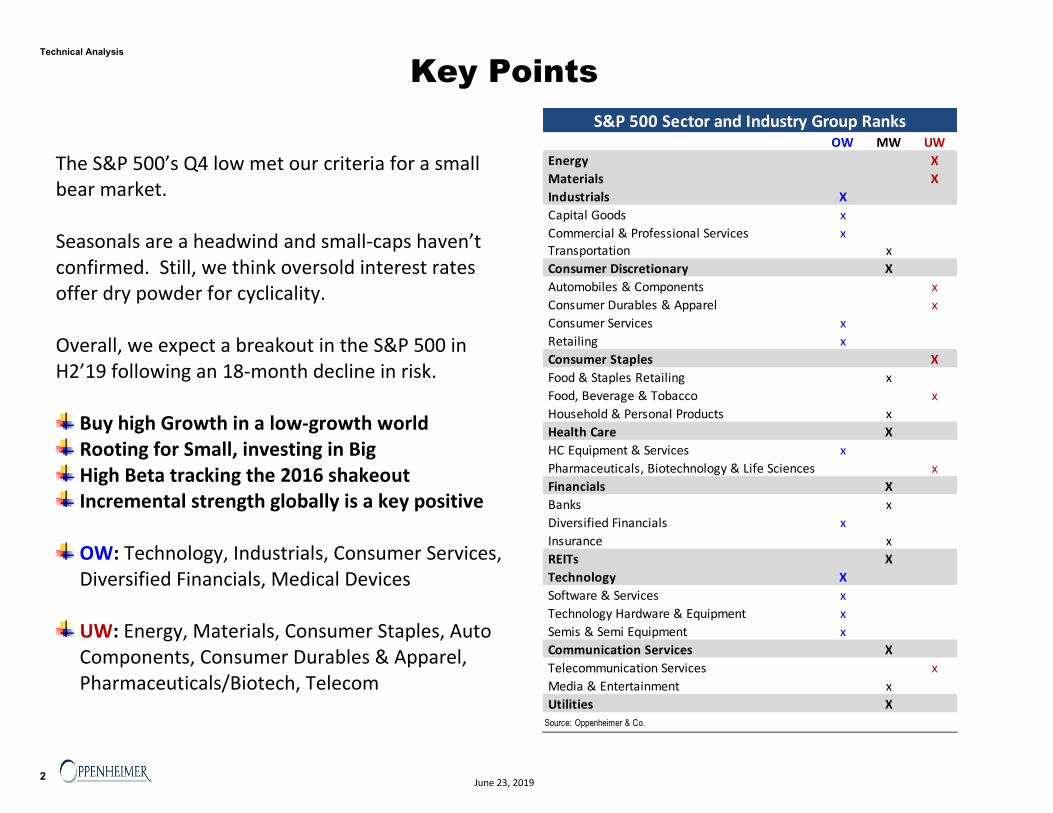
The S&P 500’s Q4 low met our criteria for a small bear market. Seasonals are a headwind and small-caps haven’t confirmed. Still, we think oversold interest rates offer dry powder for cyclicality. Overall, we expect a breakout in the S&P 500 in H2’19 following an 18-month decline in risk.
Buy high Growth in a low-growth world Rooting for Small, investing in Big High Beta tracking the 2016 shakeout Incremental strength globally is a key positive OW: Technology, Industrials, Consumer Services, Diversified Financials, Medical Devices
UW: Energy, Materials, Consumer Staples, Auto Components, Consumer Durables & Apparel, Pharmaceuticals/Biotech, Telecom
2
Technical Analysis
June 23, 2019
Double Bottom in Risk
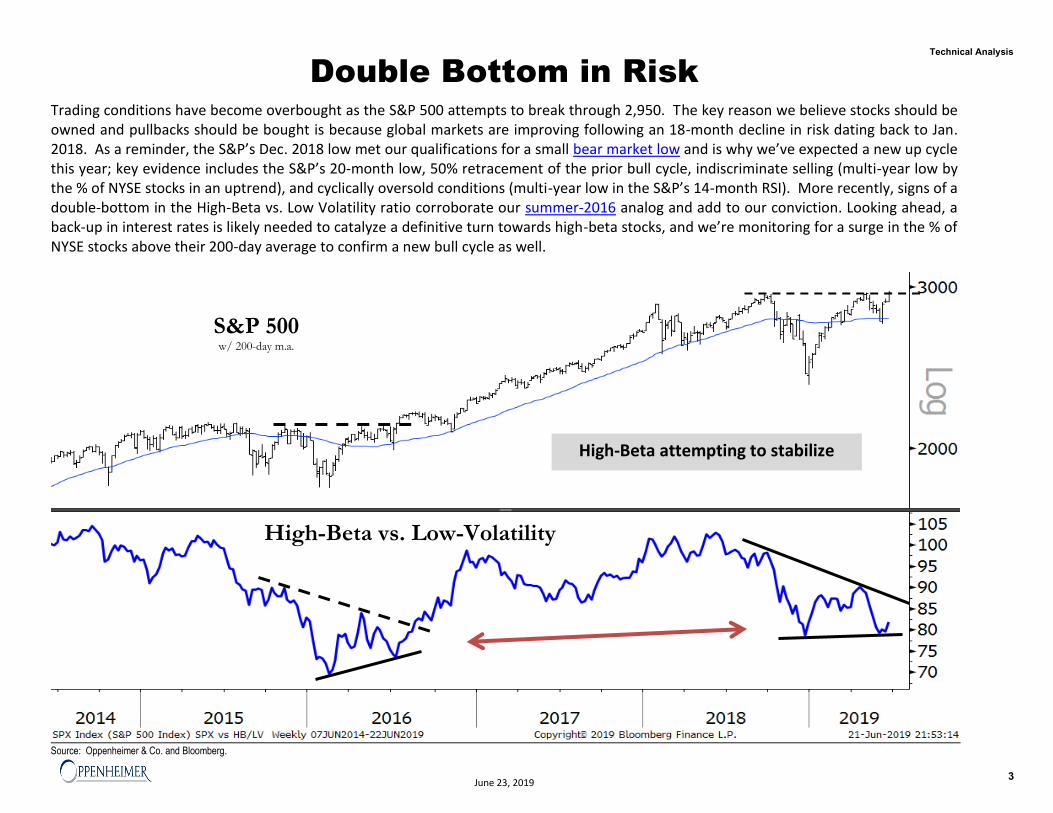
Trading conditions have become overbought as the S&P 500 attempts to break through 2,950. The key reason we believe stocks should be owned and pullbacks should be bought is because global markets are improving following an 18-month decline in risk dating back to Jan. 2018. As a reminder, the S&P’s Dec. 2018 low met our qualifications for a small bear market low and is why we’ve expected a new up cycle this year; key evidence includes the S&P’s 20-month low, 50% retracement of the prior bull cycle, indiscriminate selling (multi-year low by the % of NYSE stocks in an uptrend), and cyclically oversold conditions (multi-year low in the S&P’s 14-month RSI). More recently, signs of a double-bottom in the High-Beta vs. Low Volatility ratio corroborate our summer-2016 analog and add to our conviction. Looking ahead, a back-up in interest rates is likely needed to catalyze a definitive turn towards high-beta stocks, and we’re monitoring for a surge in the % of NYSE stocks above their 200-day average to confirm a new bull cycle as well.
Source: Oppenheimer & Co. and Bloomberg.
High-Beta attempting to stabilize
S&P 500 w/ 200-day m.a.
High-Beta vs. Low-Volatility
3
Technical Analysis
June 23, 2019
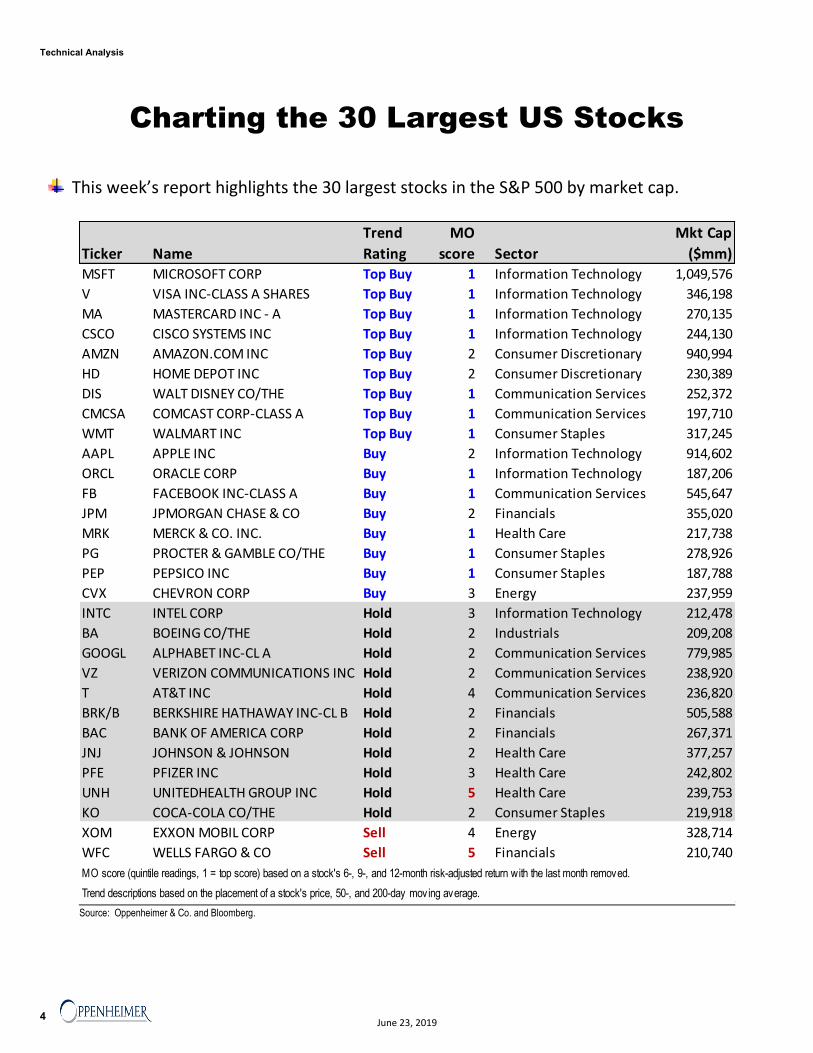
Charting the 30 Largest US Stocks
This week’s report highlights the 30 largest stocks in the S&P 500 by market cap.
Source: Oppenheimer & Co. and Bloomberg.
Ticker Name
Trend
Rating
MO
score Sector
Mkt Cap
($mm)MSFT MICROSOFT CORP Top Buy 1 Information Technology 1,049,576
V VISA INC-CLASS A SHARES Top Buy 1 Information Technology 346,198
MA MASTERCARD INC - A Top Buy 1 Information Technology 270,135
CSCO CISCO SYSTEMS INC Top Buy 1 Information Technology 244,130
AMZN AMAZON.COM INC Top Buy 2 Consumer Discretionary 940,994
HD HOME DEPOT INC Top Buy 2 Consumer Discretionary 230,389
DIS WALT DISNEY CO/THE Top Buy 1 Communication Services 252,372
CMCSA COMCAST CORP-CLASS A Top Buy 1 Communication Services 197,710
WMT WALMART INC Top Buy 1 Consumer Staples 317,245
AAPL APPLE INC Buy 2 Information Technology 914,602
ORCL ORACLE CORP Buy 1 Information Technology 187,206
FB FACEBOOK INC-CLASS A Buy 1 Communication Services 545,647
JPM JPMORGAN CHASE & CO Buy 2 Financials 355,020
MRK MERCK & CO. INC. Buy 1 Health Care 217,738
PG PROCTER & GAMBLE CO/THE Buy 1 Consumer Staples 278,926
PEP PEPSICO INC Buy 1 Consumer Staples 187,788
CVX CHEVRON CORP Buy 3 Energy 237,959
INTC INTEL CORP Hold 3 Information Technology 212,478
BA BOEING CO/THE Hold 2 Industrials 209,208
GOOGL ALPHABET INC-CL A Hold 2 Communication Services 779,985
VZ VERIZON COMMUNICATIONS INC Hold 2 Communication Services 238,920
T AT&T INC Hold 4 Communication Services 236,820
BRK/B BERKSHIRE HATHAWAY INC-CL B Hold 2 Financials 505,588
BAC BANK OF AMERICA CORP Hold 2 Financials 267,371
JNJ JOHNSON & JOHNSON Hold 2 Health Care 377,257
PFE PFIZER INC Hold 3 Health Care 242,802
UNH UNITEDHEALTH GROUP INC Hold 5 Health Care 239,753
KO COCA-COLA CO/THE Hold 2 Consumer Staples 219,918
XOM EXXON MOBIL CORP Sell 4 Energy 328,714
WFC WELLS FARGO & CO Sell 5 Financials 210,740
MO score (quintile readings, 1 = top score) based on a stock's 6-, 9-, and 12-month risk-adjusted return with the last month removed.
Trend descriptions based on the placement of a stock's price, 50-, and 200-day moving average.
4
Technical Analysis
June 23, 2019
Microsoft Corp. (MSFT)
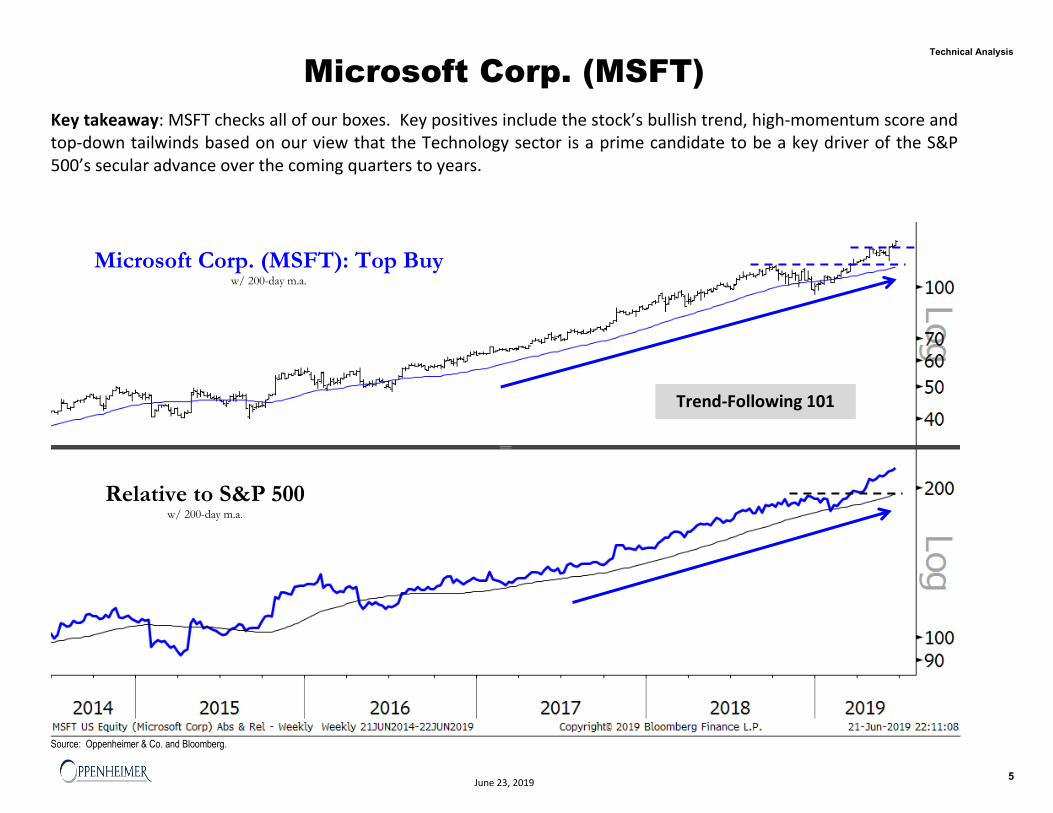
Key takeaway: MSFT checks all of our boxes. Key positives include the stock’s bullish trend, high-momentum score and top-down tailwinds based on our view that the Technology sector is a prime candidate to be a key driver of the S&P 500’s secular advance over the coming quarters to years.
Source: Oppenheimer & Co. and Bloomberg.
Microsoft Corp. (MSFT): Top Buy w/ 200-day m.a.
Relative to S&P 500 w/ 200-day m.a.
Trend-Following 101
5
Technical Analysis
June 23, 2019
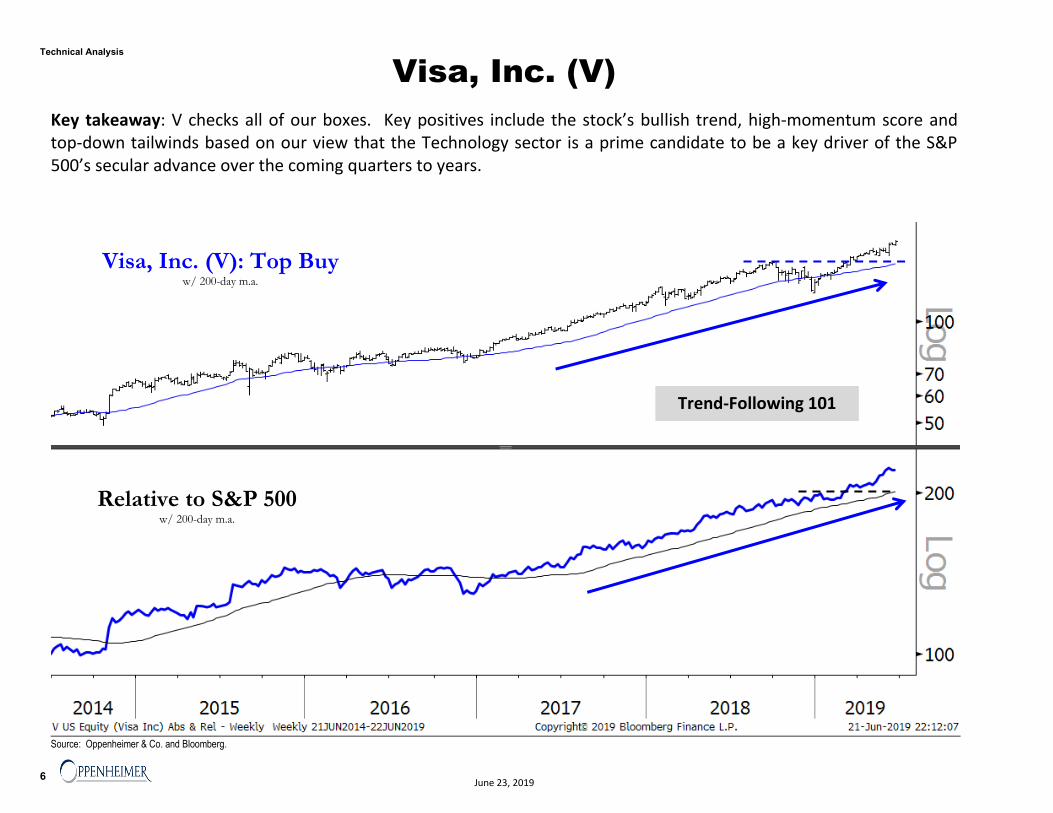
Visa, Inc. (V)
Key takeaway: V checks all of our boxes. Key positives include the stock’s bullish trend, high-momentum score and top-down tailwinds based on our view that the Technology sector is a prime candidate to be a key driver of the S&P 500’s secular advance over the coming quarters to years.
Source: Oppenheimer & Co. and Bloomberg.
Visa, Inc. (V): Top Buy w/ 200-day m.a.
Relative to S&P 500 w/ 200-day m.a.
Trend-Following 101
6
Technical Analysis
June 23, 2019
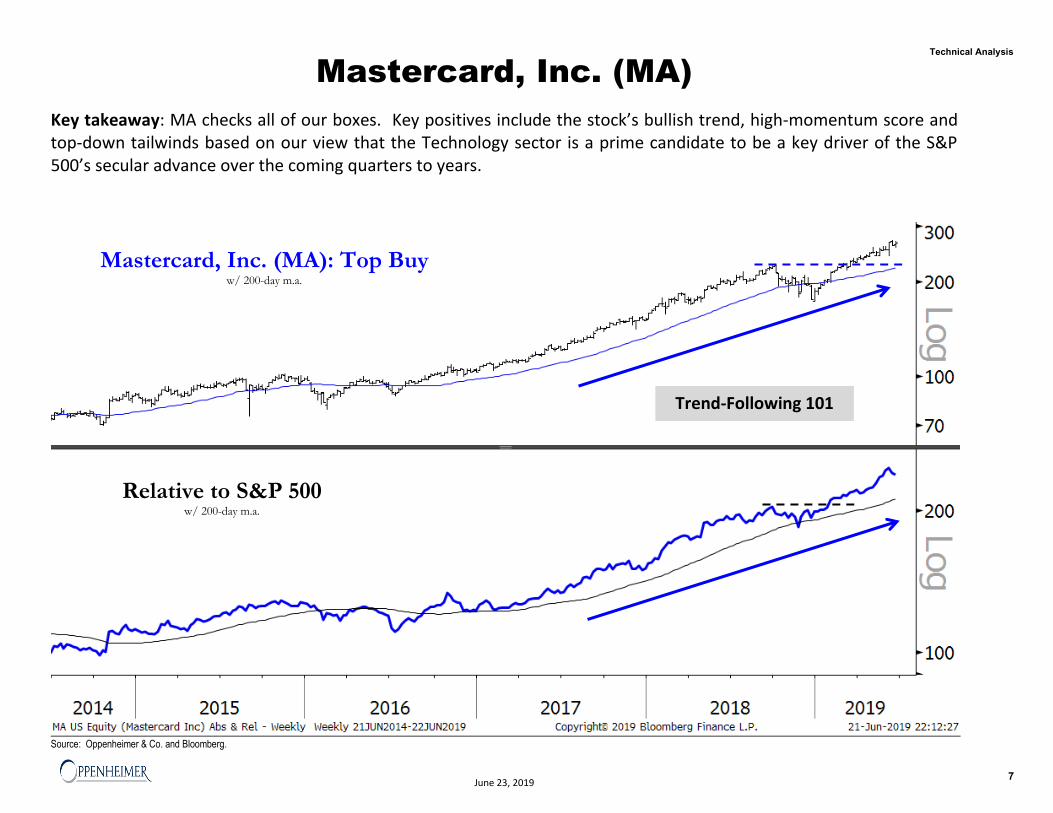
Mastercard, Inc. (MA)
Key takeaway: MA checks all of our boxes. Key positives include the stock’s bullish trend, high-momentum score and top-down tailwinds based on our view that the Technology sector is a prime candidate to be a key driver of the S&P 500’s secular advance over the coming quarters to years.
Source: Oppenheimer & Co. and Bloomberg.
Mastercard, Inc. (MA): Top Buy w/ 200-day m.a.
Relative to S&P 500 w/ 200-day m.a.
Trend-Following 101
7
Technical Analysis
June 23, 2019
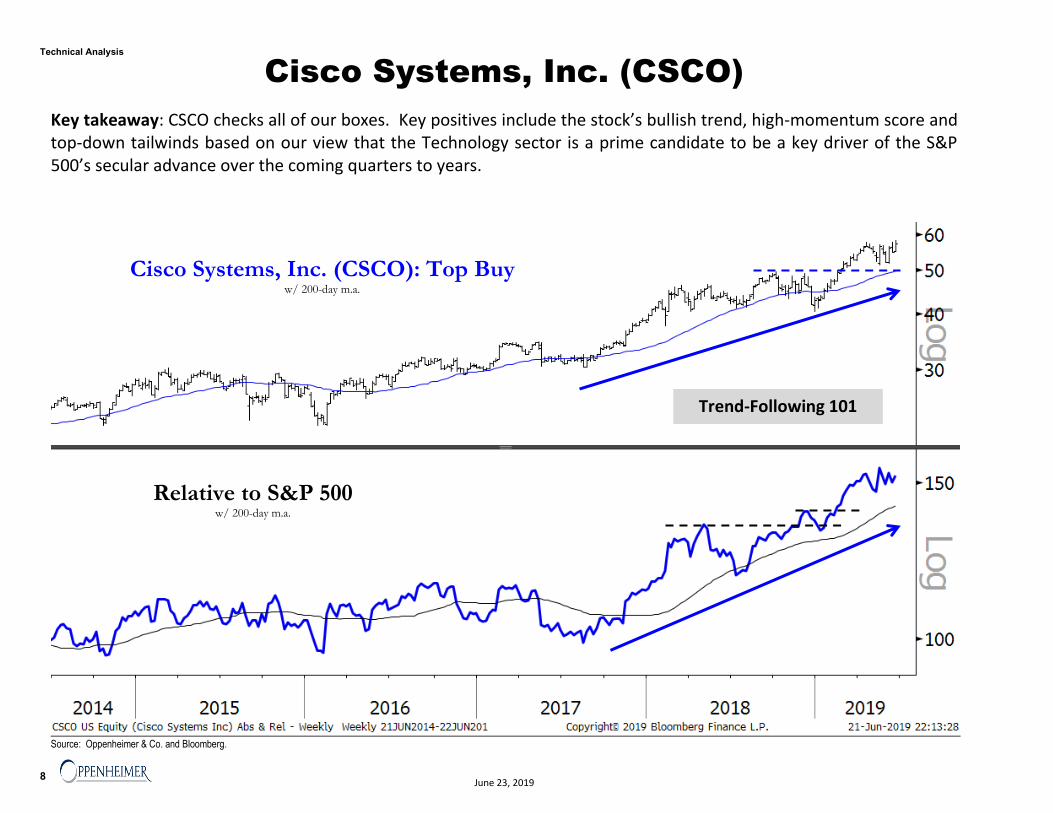
Cisco Systems, Inc. (CSCO)
Key takeaway: CSCO checks all of our boxes. Key positives include the stock’s bullish trend, high-momentum score and top-down tailwinds based on our view that the Technology sector is a prime candidate to be a key driver of the S&P 500’s secular advance over the coming quarters to years.
Source: Oppenheimer & Co. and Bloomberg.
Cisco Systems, Inc. (CSCO): Top Buy w/ 200-day m.a.
Relative to S&P 500 w/ 200-day m.a.
Trend-Following 101
8
Technical Analysis
June 23, 2019
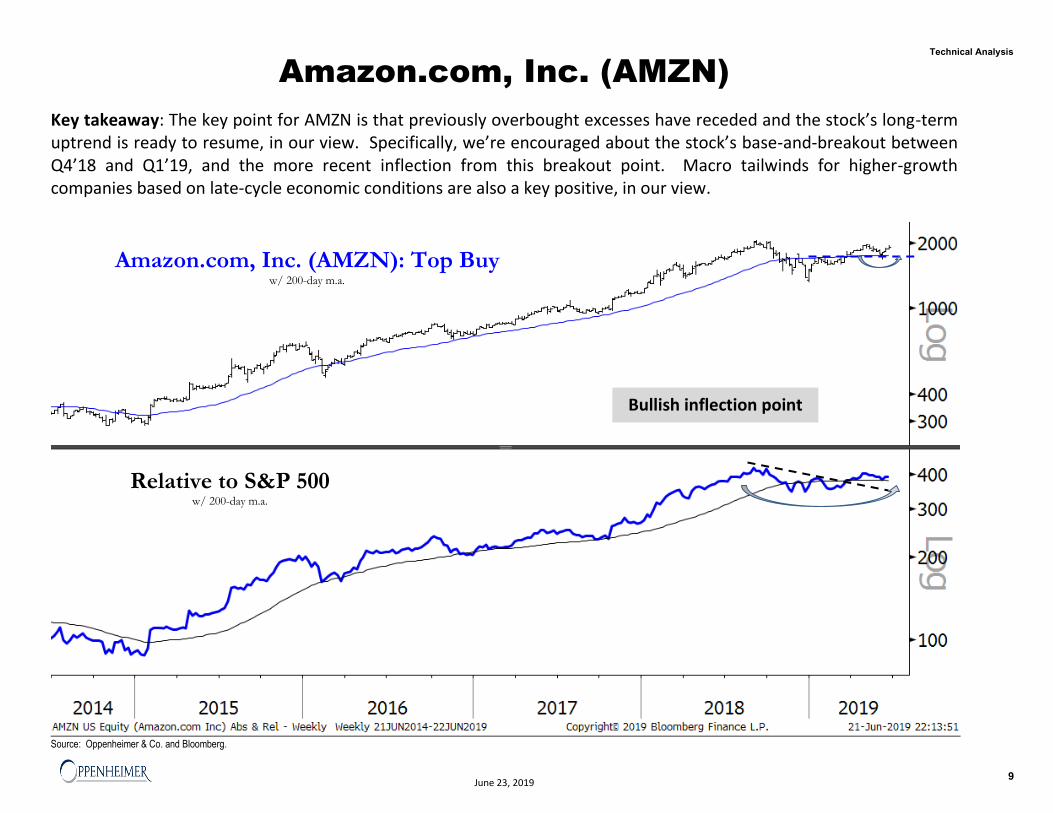
Amazon.com, Inc. (AMZN)
Key takeaway: The key point for AMZN is that previously overbought excesses have receded and the stock’s long-term uptrend is ready to resume, in our view. Specifically, we’re encouraged about the stock’s base-and-breakout between Q4’18 and Q1’19, and the more recent inflection from this breakout point. Macro tailwinds for higher-growth companies based on late-cycle economic conditions are also a key positive, in our view.
Source: Oppenheimer & Co. and Bloomberg.
Amazon.com, Inc. (AMZN): Top Buy w/ 200-day m.a.
Relative to S&P 500 w/ 200-day m.a.
Bullish inflection point
9
Technical Analysis
June 23, 2019
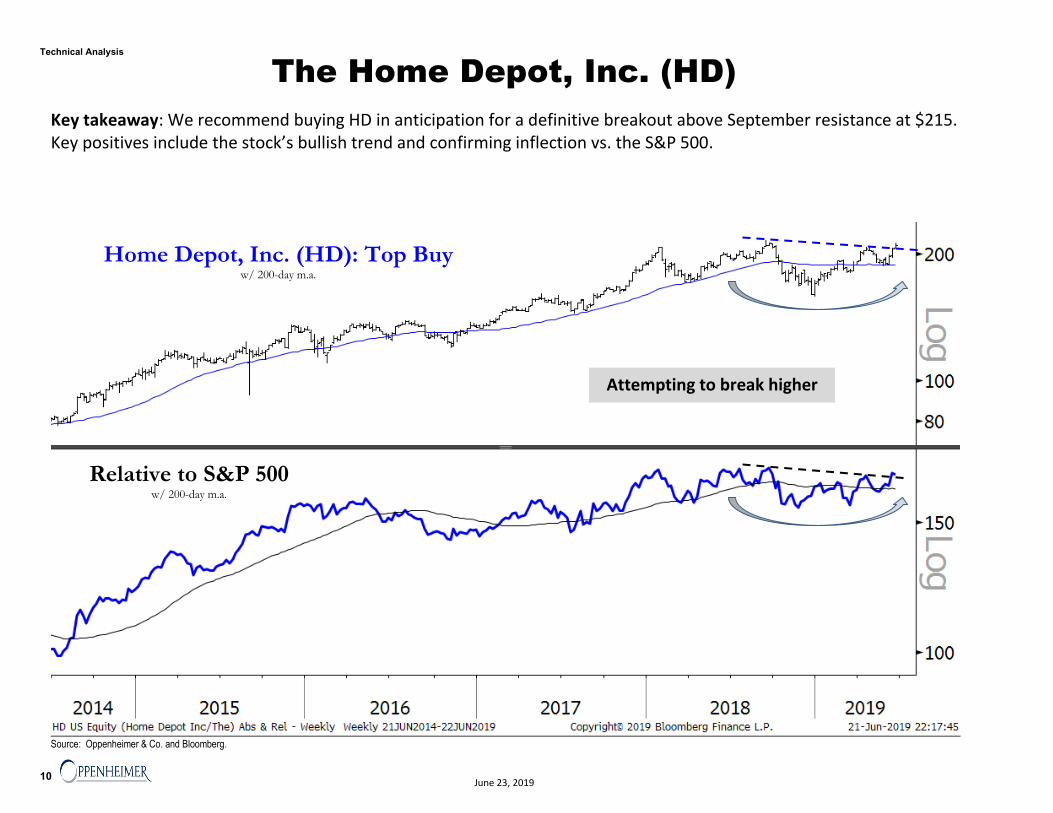
The Home Depot, Inc. (HD)
Key takeaway: We recommend buying HD in anticipation for a definitive breakout above September resistance at $215. Key positives include the stock’s bullish trend and confirming inflection vs. the S&P 500.
Source: Oppenheimer & Co. and Bloomberg.
Home Depot, Inc. (HD): Top Buy w/ 200-day m.a.
Relative to S&P 500 w/ 200-day m.a.
Attempting to break higher
10
Technical Analysis
June 23, 2019
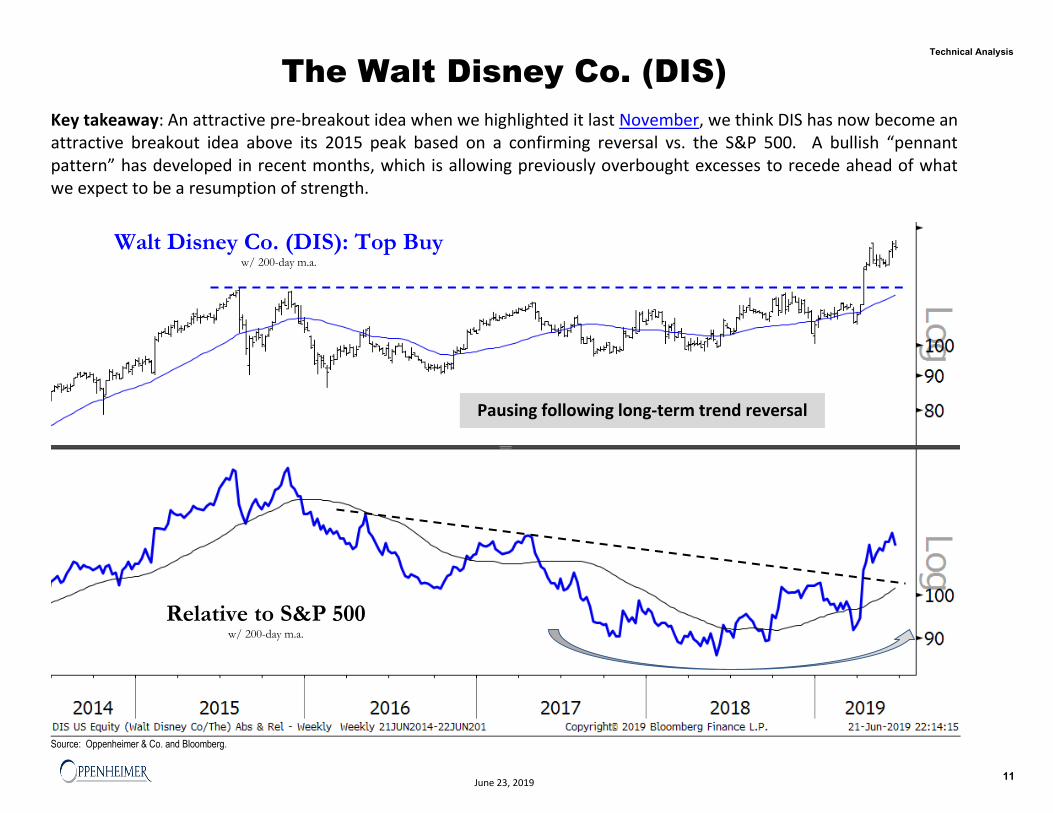
The Walt Disney Co. (DIS)
Key takeaway: An attractive pre-breakout idea when we highlighted it last November, we think DIS has now become an attractive breakout idea above its 2015 peak based on a confirming reversal vs. the S&P 500. A bullish “pennant pattern” has developed in recent months, which is allowing previously overbought excesses to recede ahead of what we expect to be a resumption of strength.
Source: Oppenheimer & Co. and Bloomberg.
Walt Disney Co. (DIS): Top Buy w/ 200-day m.a.
Relative to S&P 500 w/ 200-day m.a.
Pausing following long-term trend reversal
11
Technical Analysis
June 23, 2019
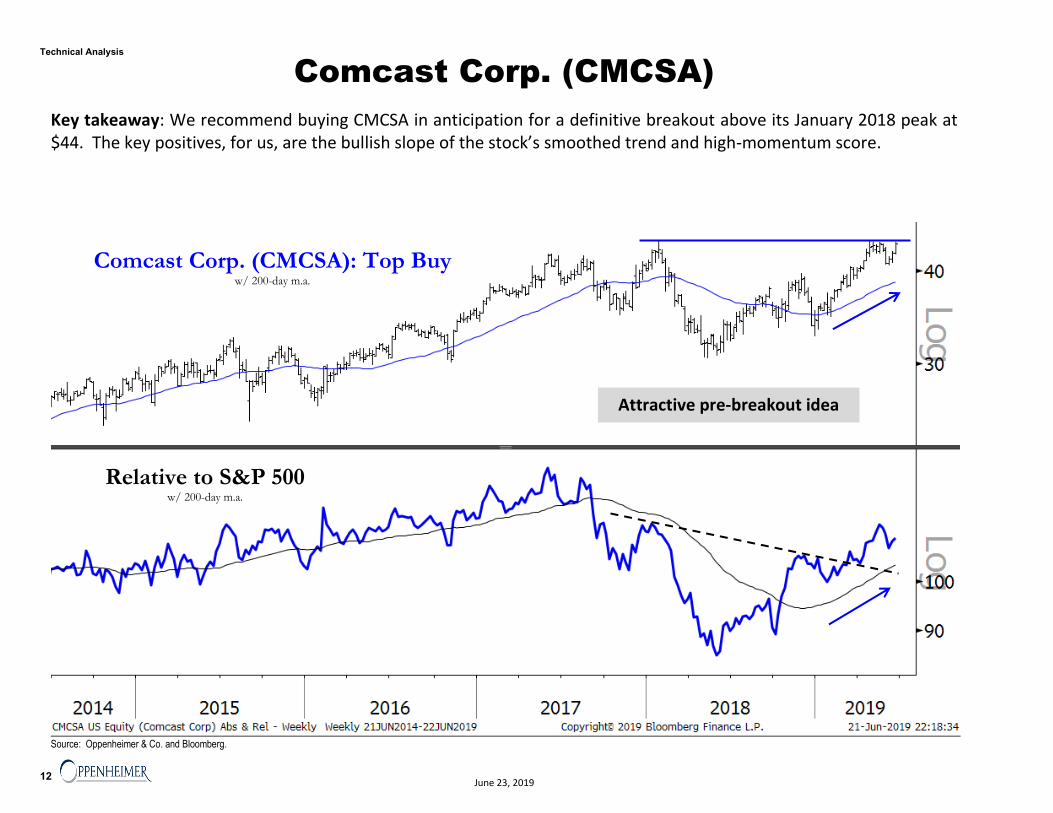
Comcast Corp. (CMCSA)
Key takeaway: We recommend buying CMCSA in anticipation for a definitive breakout above its January 2018 peak at $44. The key positives, for us, are the bullish slope of the stock’s smoothed trend and high-momentum score.
Source: Oppenheimer & Co. and Bloomberg.
Comcast Corp. (CMCSA): Top Buy w/ 200-day m.a.
Relative to S&P 500 w/ 200-day m.a.
Attractive pre-breakout idea
12
Technical Analysis
June 23, 2019
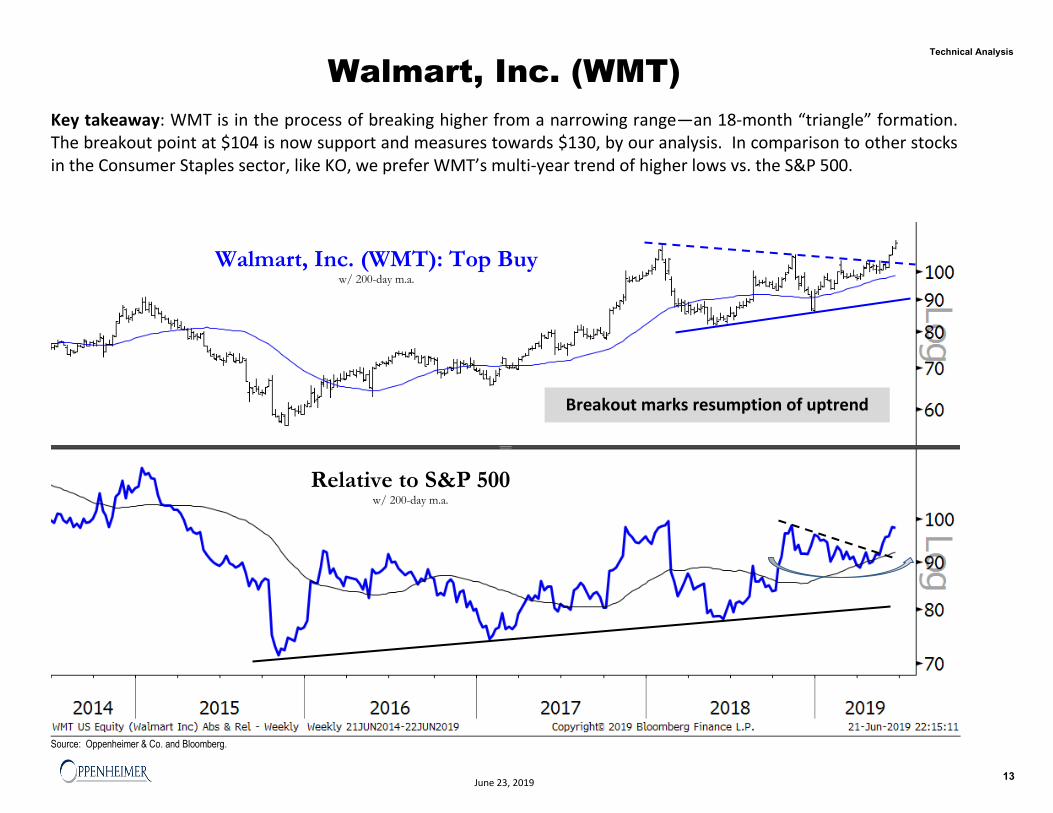
Walmart, Inc. (WMT)
Key takeaway: WMT is in the process of breaking higher from a narrowing range—an 18-month “triangle” formation. The breakout point at $104 is now support and measures towards $130, by our analysis. In comparison to other stocks in the Consumer Staples sector, like KO, we prefer WMT’s multi-year trend of higher lows vs. the S&P 500.
Source: Oppenheimer & Co. and Bloomberg.
Walmart, Inc. (WMT): Top Buy w/ 200-day m.a.
Relative to S&P 500 w/ 200-day m.a.
Breakout marks resumption of uptrend
13
Technical Analysis
June 23, 2019
Apple, Inc. (AAPL)
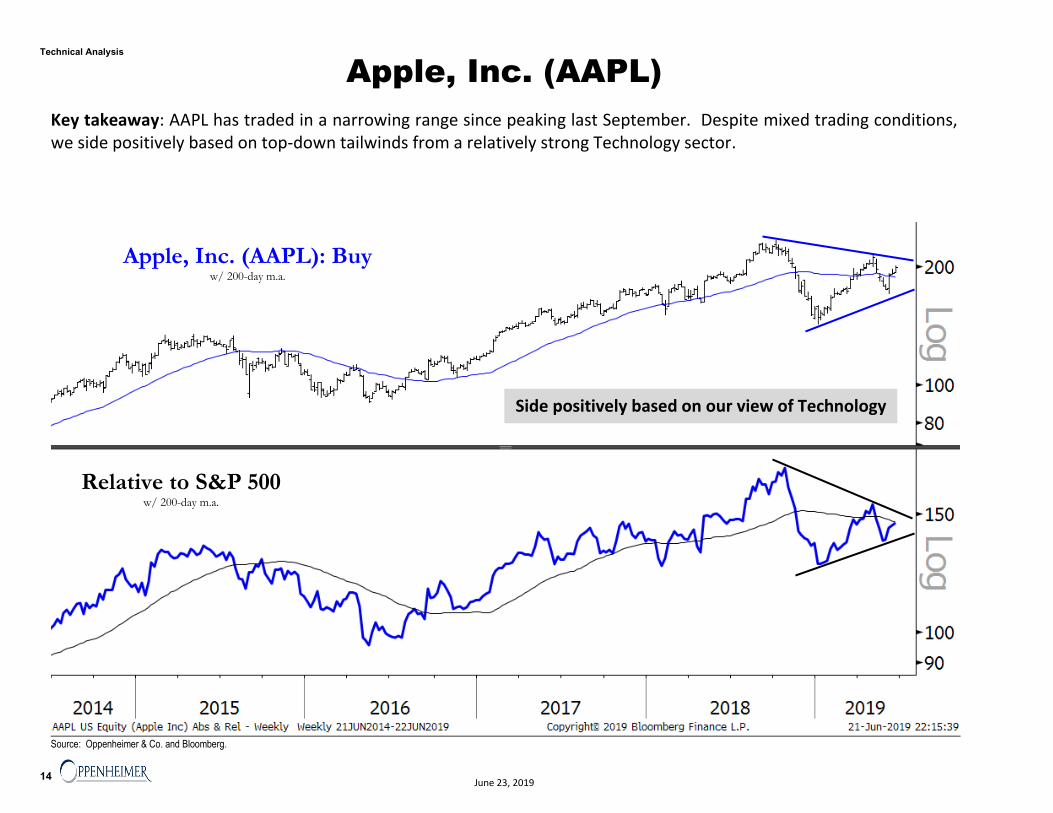
Key takeaway: AAPL has traded in a narrowing range since peaking last September. Despite mixed trading conditions, we side positively based on top-down tailwinds from a relatively strong Technology sector.
Source: Oppenheimer & Co. and Bloomberg.
Apple, Inc. (AAPL): Buy w/ 200-day m.a.
Relative to S&P 500 w/ 200-day m.a.
Side positively based on our view of Technology
14
Technical Analysis
June 23, 2019
Oracle Corp. (ORCL)
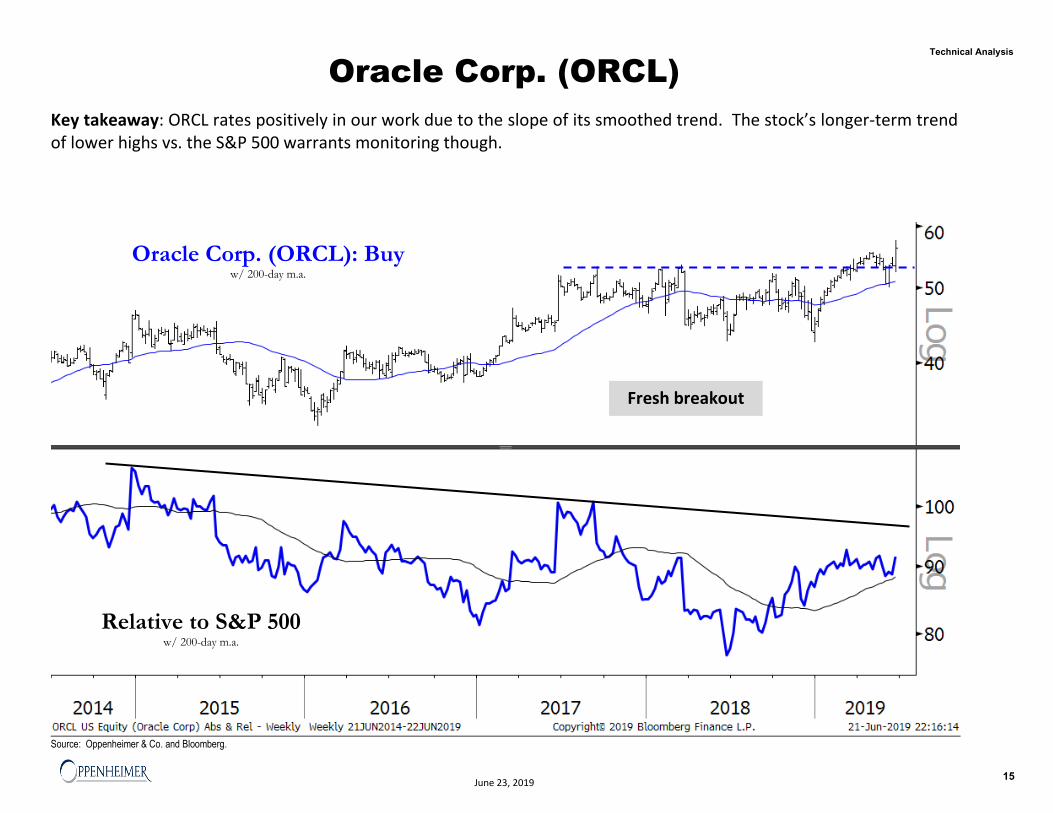
Key takeaway: ORCL rates positively in our work due to the slope of its smoothed trend. The stock’s longer-term trend of lower highs vs. the S&P 500 warrants monitoring though.
Source: Oppenheimer & Co. and Bloomberg.
Oracle Corp. (ORCL): Buy w/ 200-day m.a.
Relative to S&P 500 w/ 200-day m.a.
Fresh breakout
15
Technical Analysis
June 23, 2019
Facebook, Inc. (FB)
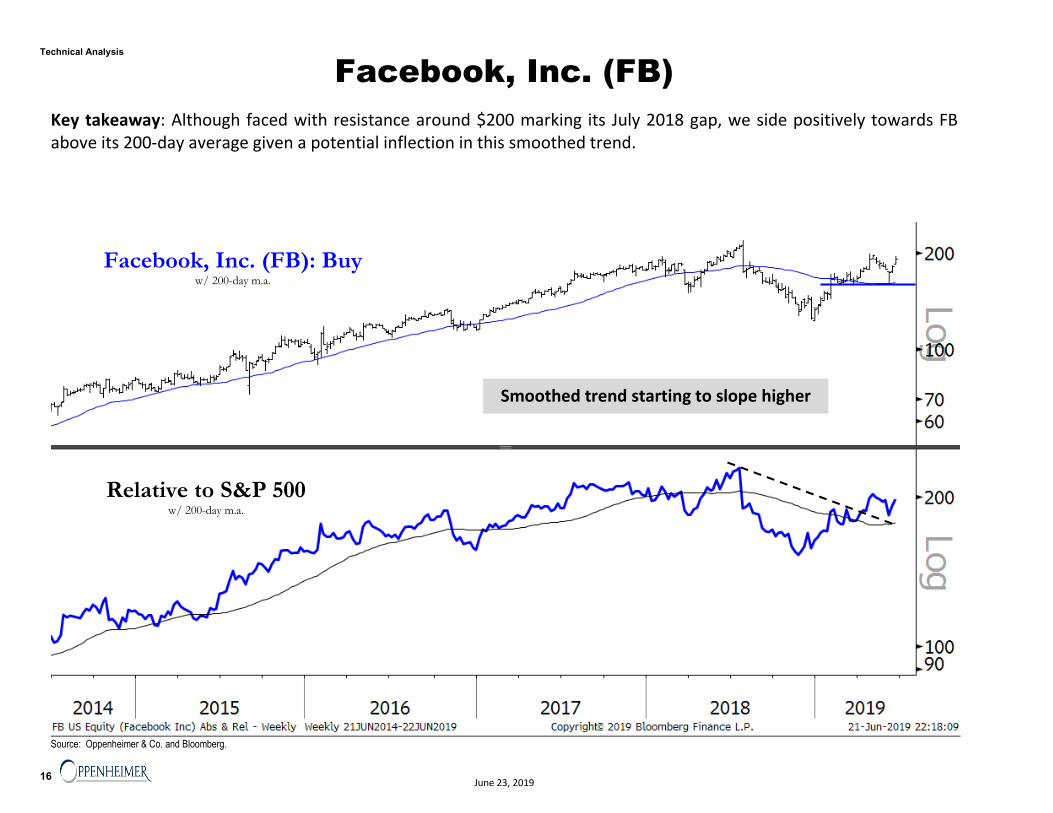
Key takeaway: Although faced with resistance around $200 marking its July 2018 gap, we side positively towards FB above its 200-day average given a potential inflection in this smoothed trend.
Source: Oppenheimer & Co. and Bloomberg.
Facebook, Inc. (FB): Buy w/ 200-day m.a.
Relative to S&P 500 w/ 200-day m.a.
Smoothed trend starting to slope higher
16
Technical Analysis
June 23, 2019
JPMorgan Chase & Co. (JPM)
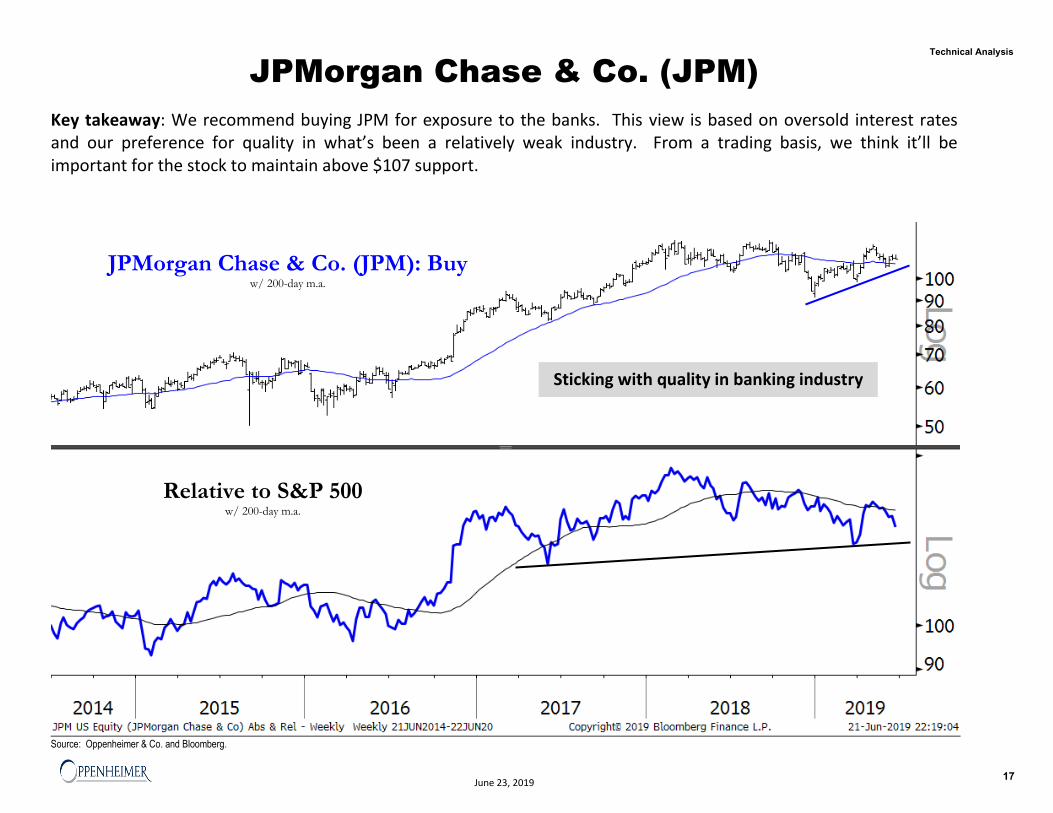
Key takeaway: We recommend buying JPM for exposure to the banks. This view is based on oversold interest rates and our preference for quality in what’s been a relatively weak industry. From a trading basis, we think it’ll be important for the stock to maintain above $107 support.
Source: Oppenheimer & Co. and Bloomberg.
JPMorgan Chase & Co. (JPM): Buy w/ 200-day m.a.
Relative to S&P 500 w/ 200-day m.a.
Sticking with quality in banking industry
17
Technical Analysis
June 23, 2019
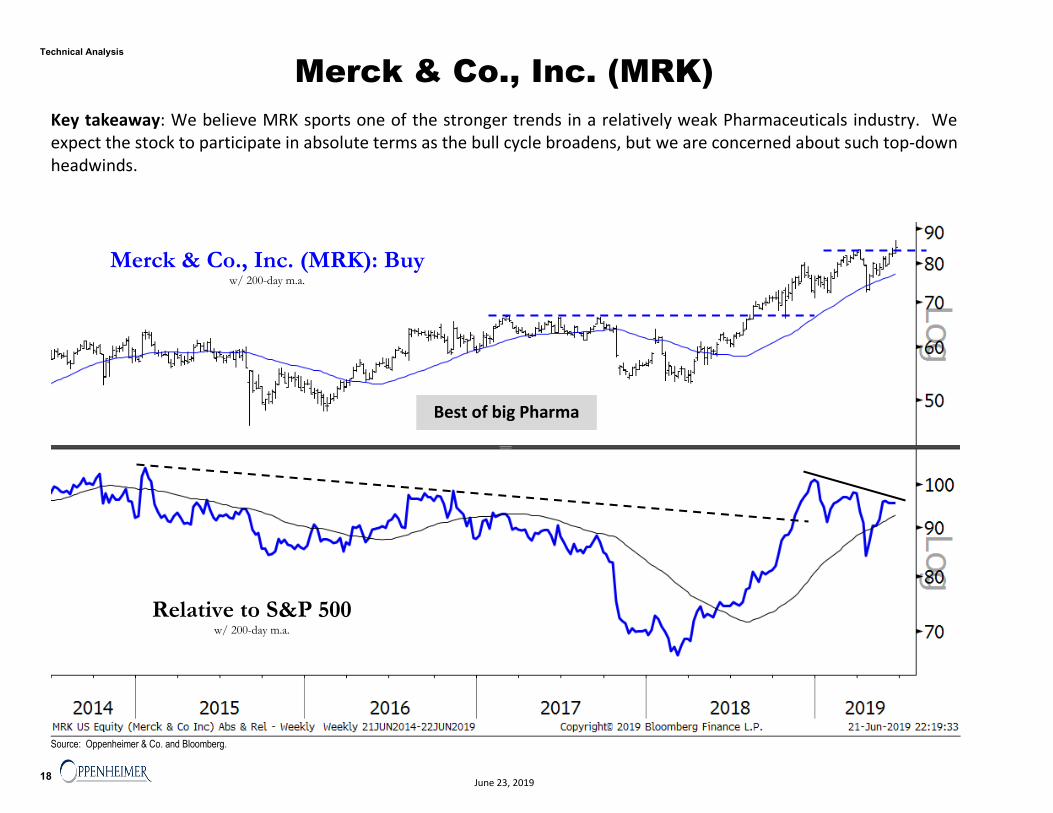
Merck & Co., Inc. (MRK)
Key takeaway: We believe MRK sports one of the stronger trends in a relatively weak Pharmaceuticals industry. We expect the stock to participate in absolute terms as the bull cycle broadens, but we are concerned about such top-down headwinds.
Source: Oppenheimer & Co. and Bloomberg.
Merck & Co., Inc. (MRK): Buy w/ 200-day m.a.
Relative to S&P 500 w/ 200-day m.a.
Best of big Pharma
18
Technical Analysis
June 23, 2019
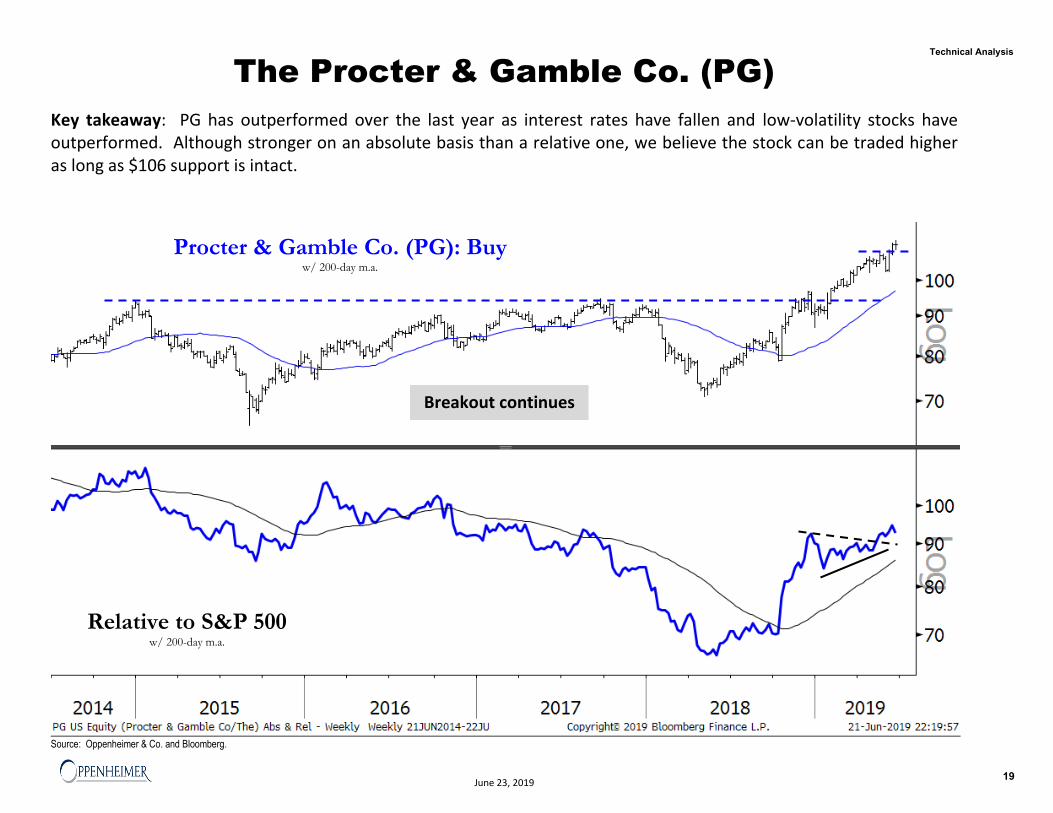
The Procter & Gamble Co. (PG)
Key takeaway: PG has outperformed over the last year as interest rates have fallen and low-volatility stocks have outperformed. Although stronger on an absolute basis than a relative one, we believe the stock can be traded higher as long as $106 support is intact.
Source: Oppenheimer & Co. and Bloomberg.
Procter & Gamble Co. (PG): Buy w/ 200-day m.a.
Relative to S&P 500 w/ 200-day m.a.
Breakout continues
19
Technical Analysis
June 23, 2019
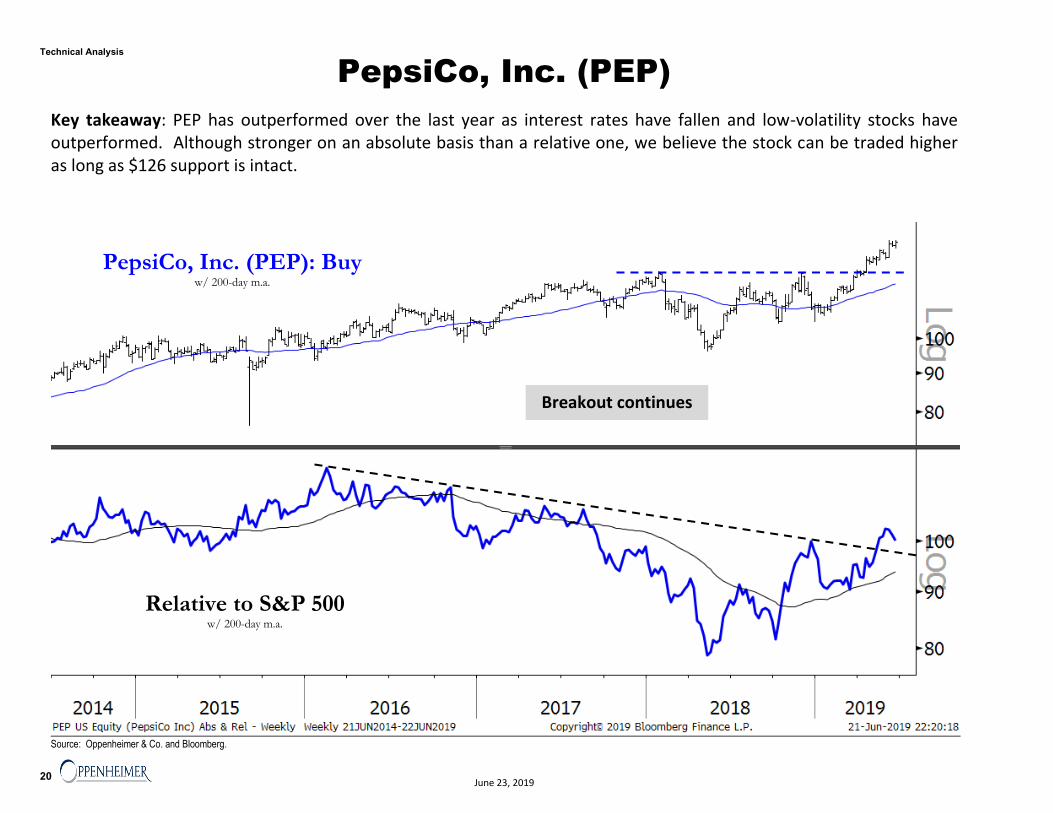
PepsiCo, Inc. (PEP)
Key takeaway: PEP has outperformed over the last year as interest rates have fallen and low-volatility stocks have outperformed. Although stronger on an absolute basis than a relative one, we believe the stock can be traded higher as long as $126 support is intact.
Source: Oppenheimer & Co. and Bloomberg.
PepsiCo, Inc. (PEP): Buy w/ 200-day m.a.
Relative to S&P 500 w/ 200-day m.a.
Breakout continues
20
Technical Analysis
June 23, 2019
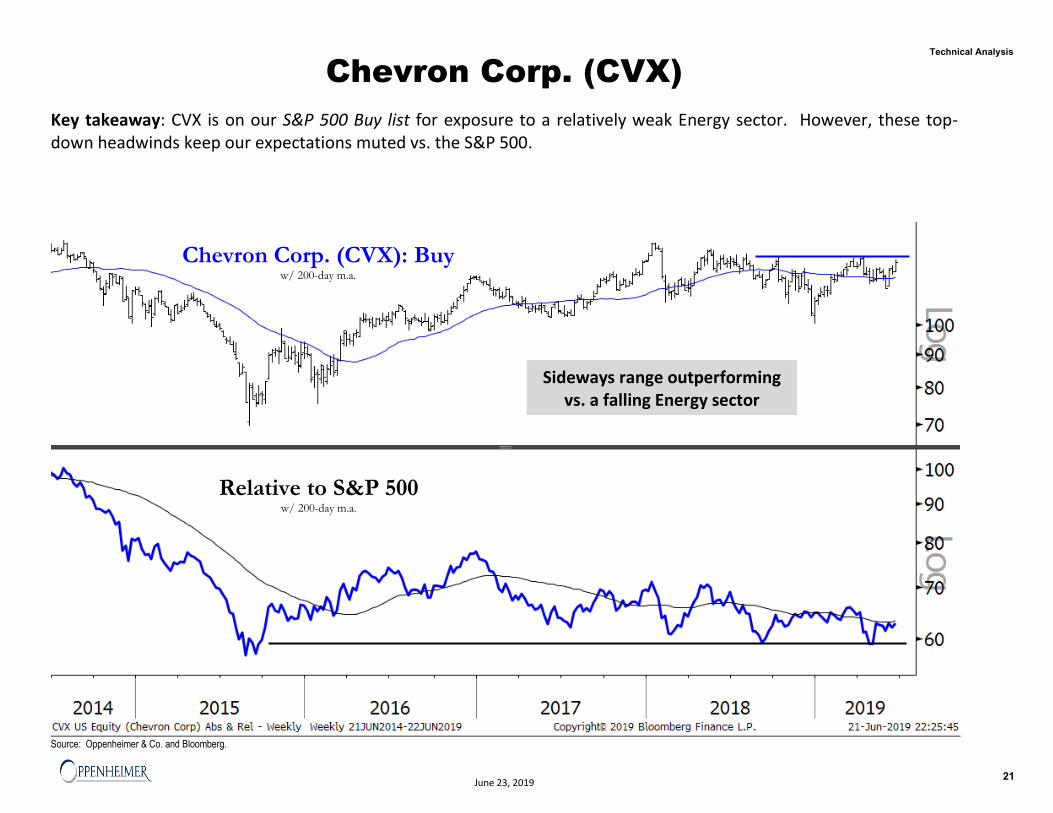
Chevron Corp. (CVX)
Key takeaway: CVX is on our S&P 500 Buy list for exposure to a relatively weak Energy sector. However, these top-down headwinds keep our expectations muted vs. the S&P 500.
Source: Oppenheimer & Co. and Bloomberg.
Chevron Corp. (CVX): Buy w/ 200-day m.a.
Relative to S&P 500 w/ 200-day m.a.
Sideways range outperforming vs. a falling Energy sector
21
Technical Analysis
June 23, 2019
Intel Corp. (INTC)
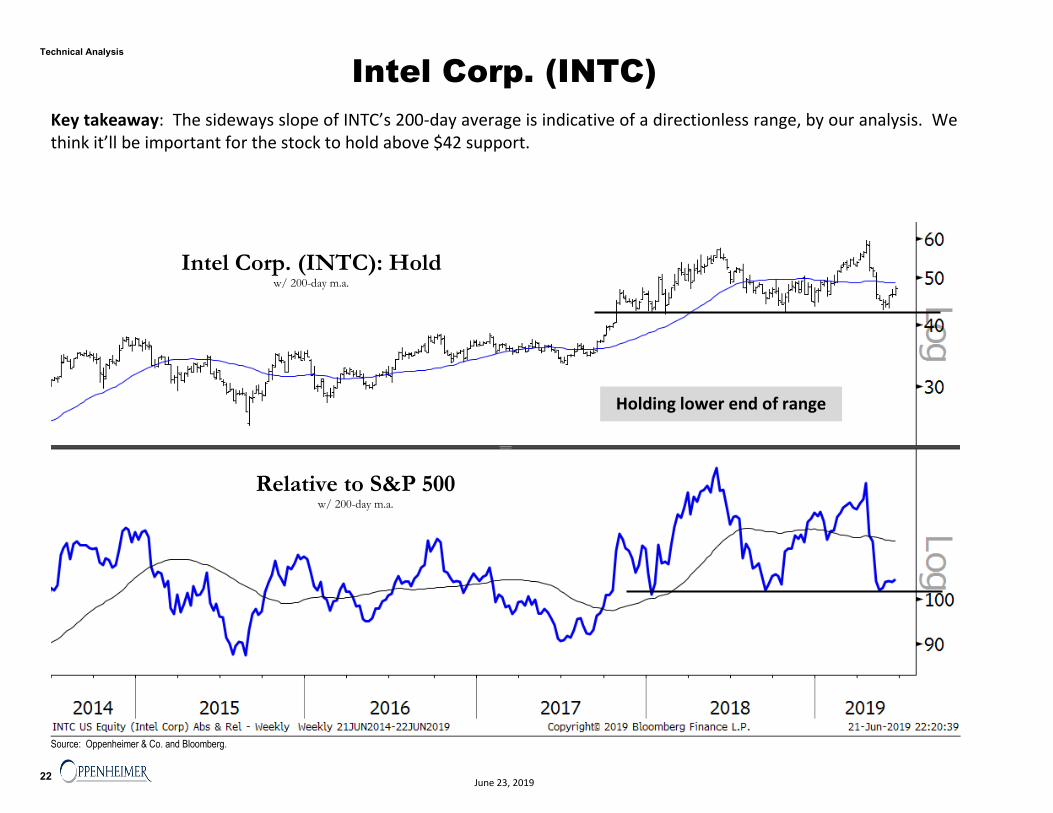
Key takeaway: The sideways slope of INTC’s 200-day average is indicative of a directionless range, by our analysis. We think it’ll be important for the stock to hold above $42 support.
Source: Oppenheimer & Co. and Bloomberg.
Intel Corp. (INTC): Hold w/ 200-day m.a.
Relative to S&P 500 w/ 200-day m.a.
Holding lower end of range
22
Technical Analysis
June 23, 2019
The Boeing Co. (BA)
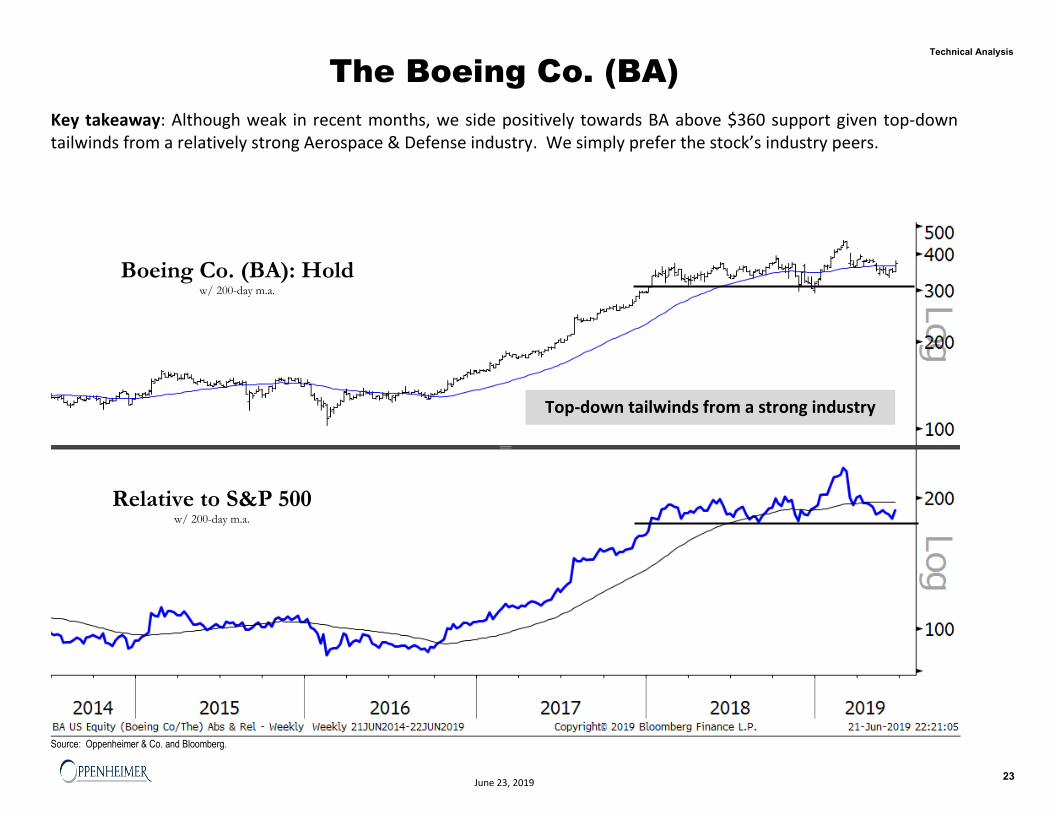
Key takeaway: Although weak in recent months, we side positively towards BA above $360 support given top-down tailwinds from a relatively strong Aerospace & Defense industry. We simply prefer the stock’s industry peers.
Source: Oppenheimer & Co. and Bloomberg.
Boeing Co. (BA): Hold w/ 200-day m.a.
Relative to S&P 500 w/ 200-day m.a.
Top-down tailwinds from a strong industry
23
Technical Analysis
June 23, 2019
Alphabet, Inc. (GOOGL)
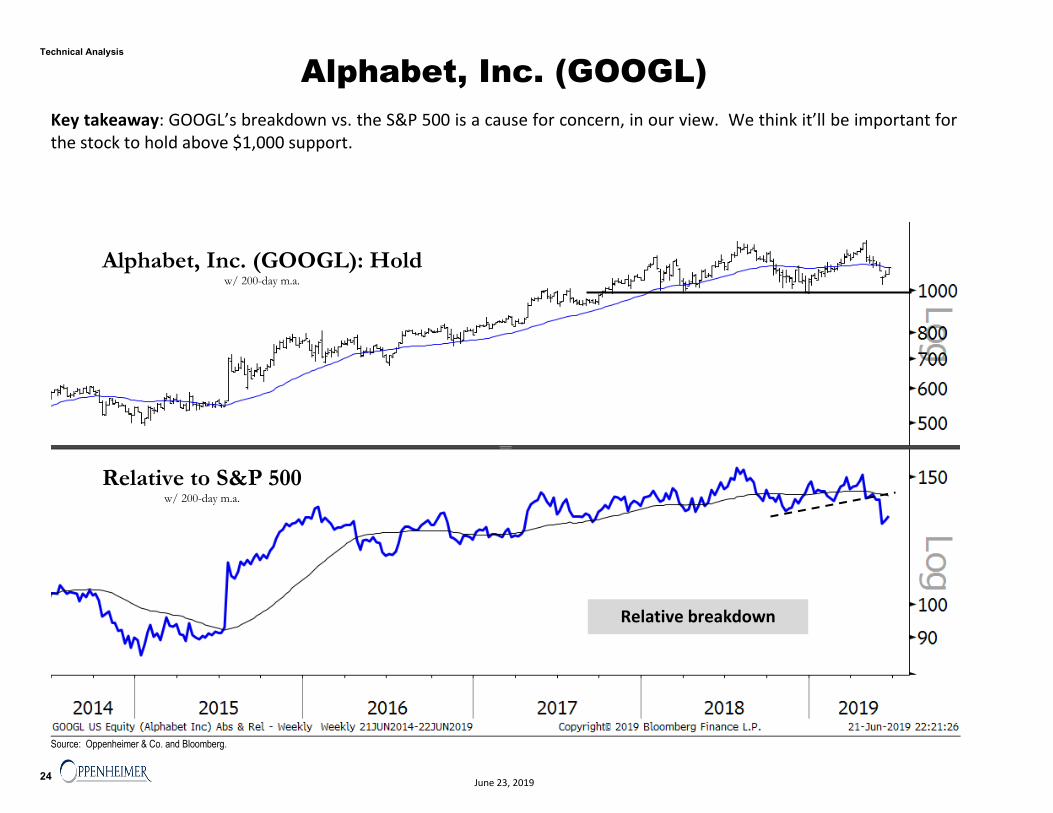
Key takeaway: GOOGL’s breakdown vs. the S&P 500 is a cause for concern, in our view. We think it’ll be important for the stock to hold above $1,000 support.
Source: Oppenheimer & Co. and Bloomberg.
Alphabet, Inc. (GOOGL): Hold w/ 200-day m.a.
Relative to S&P 500 w/ 200-day m.a.
Relative breakdown
24
Technical Analysis
June 23, 2019
Verizon Communications Inc. (VZ)
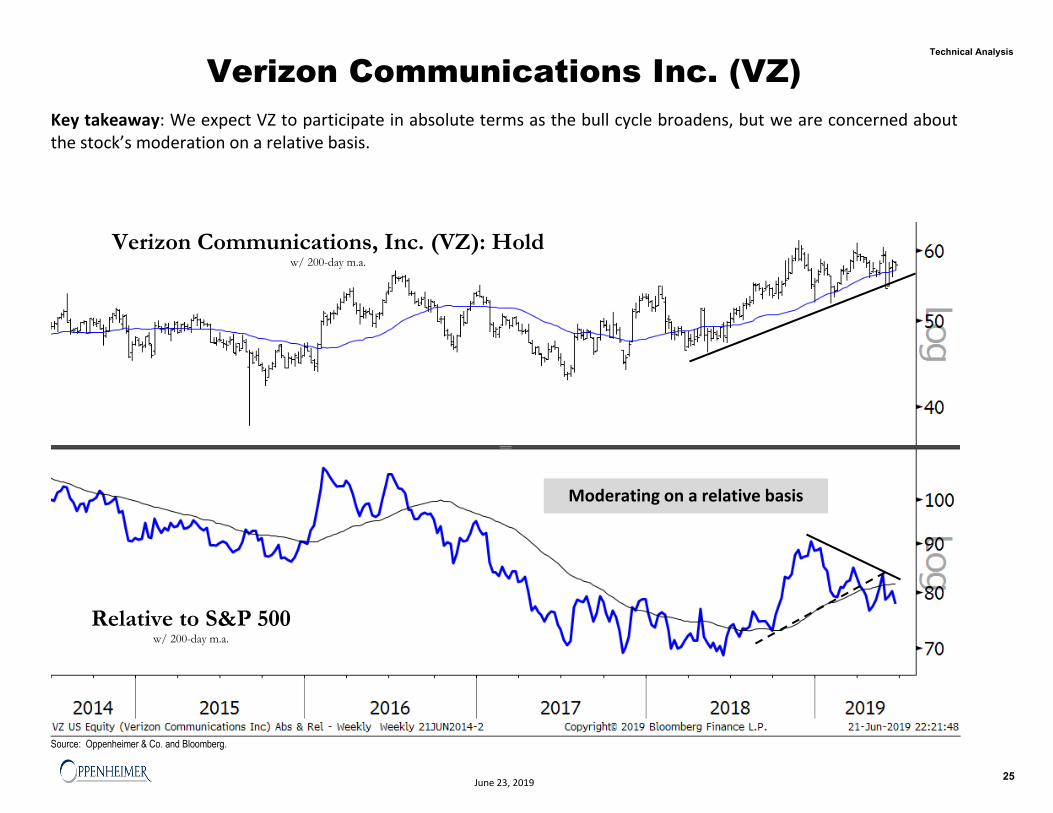
Key takeaway: We expect VZ to participate in absolute terms as the bull cycle broadens, but we are concerned about the stock’s moderation on a relative basis.
Source: Oppenheimer & Co. and Bloomberg.
Verizon Communications, Inc. (VZ): Hold w/ 200-day m.a.
Relative to S&P 500 w/ 200-day m.a.
Moderating on a relative basis
25
Technical Analysis
June 23, 2019
AT&T, Inc. (T)
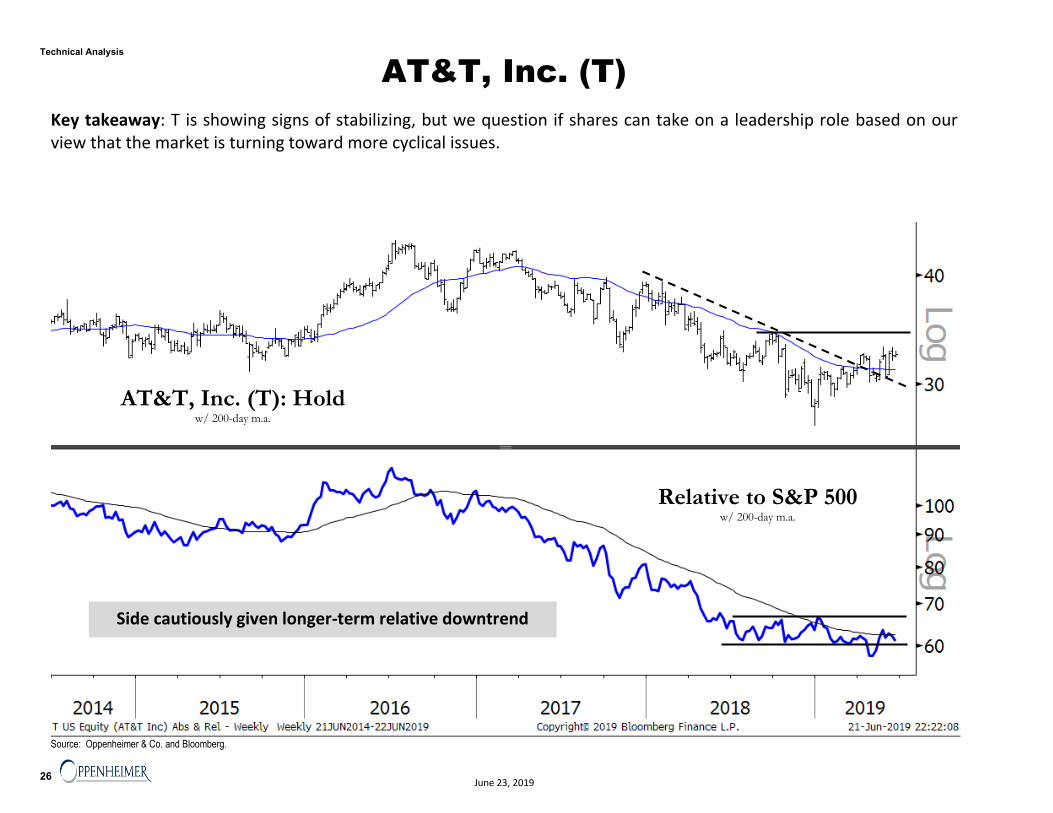
Key takeaway: T is showing signs of stabilizing, but we question if shares can take on a leadership role based on our view that the market is turning toward more cyclical issues.
Source: Oppenheimer & Co. and Bloomberg.
AT&T, Inc. (T): Hold w/ 200-day m.a.
Relative to S&P 500 w/ 200-day m.a.
Side cautiously given longer-term relative downtrend
26
Technical Analysis
June 23, 2019
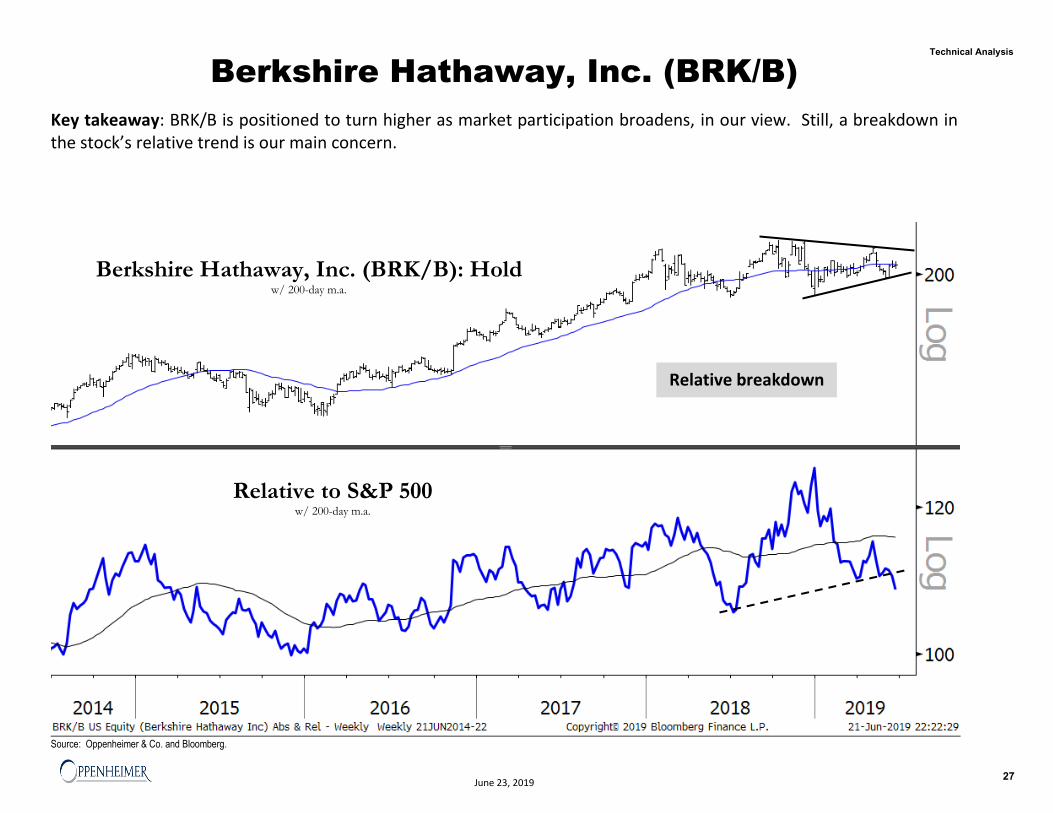
Berkshire Hathaway, Inc. (BRK/B)
Key takeaway: BRK/B is positioned to turn higher as market participation broadens, in our view. Still, a breakdown in the stock’s relative trend is our main concern.
Source: Oppenheimer & Co. and Bloomberg.
Berkshire Hathaway, Inc. (BRK/B): Hold w/ 200-day m.a.
Relative to S&P 500 w/ 200-day m.a.
Relative breakdown
27
Technical Analysis
June 23, 2019
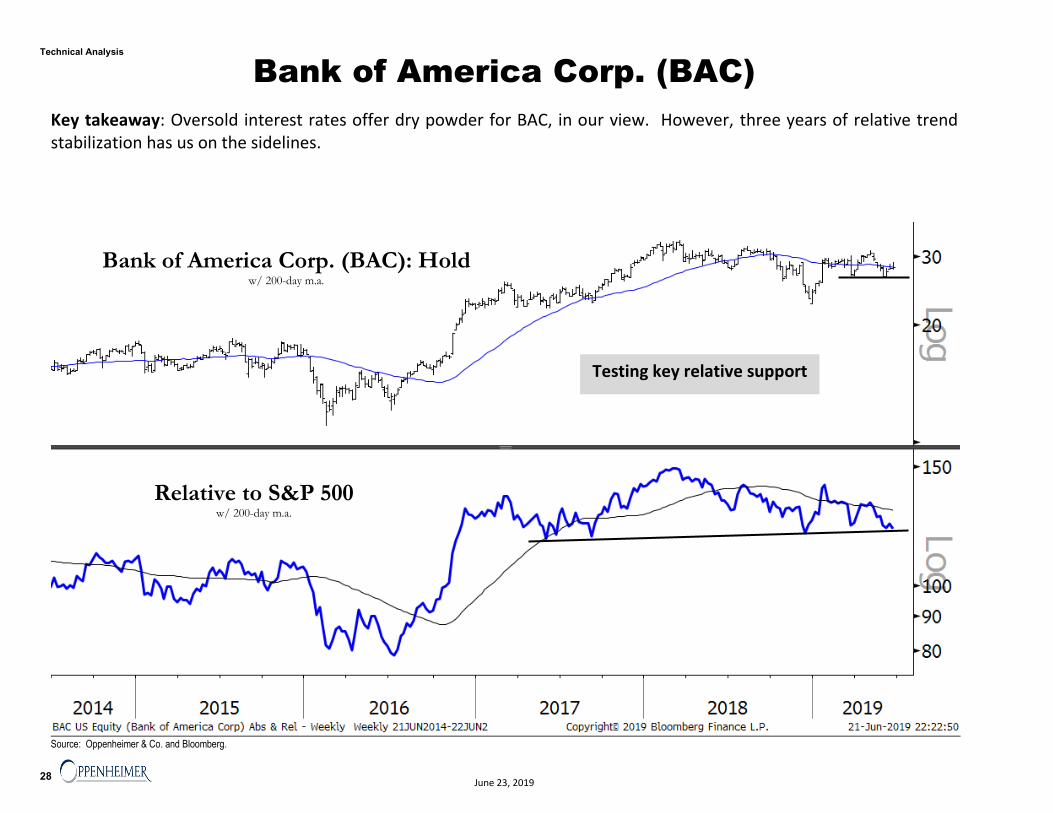
Bank of America Corp. (BAC)
Key takeaway: Oversold interest rates offer dry powder for BAC, in our view. However, three years of relative trend stabilization has us on the sidelines.
Source: Oppenheimer & Co. and Bloomberg.
Bank of America Corp. (BAC): Hold w/ 200-day m.a.
Relative to S&P 500 w/ 200-day m.a.
Testing key relative support
28
Technical Analysis
June 23, 2019
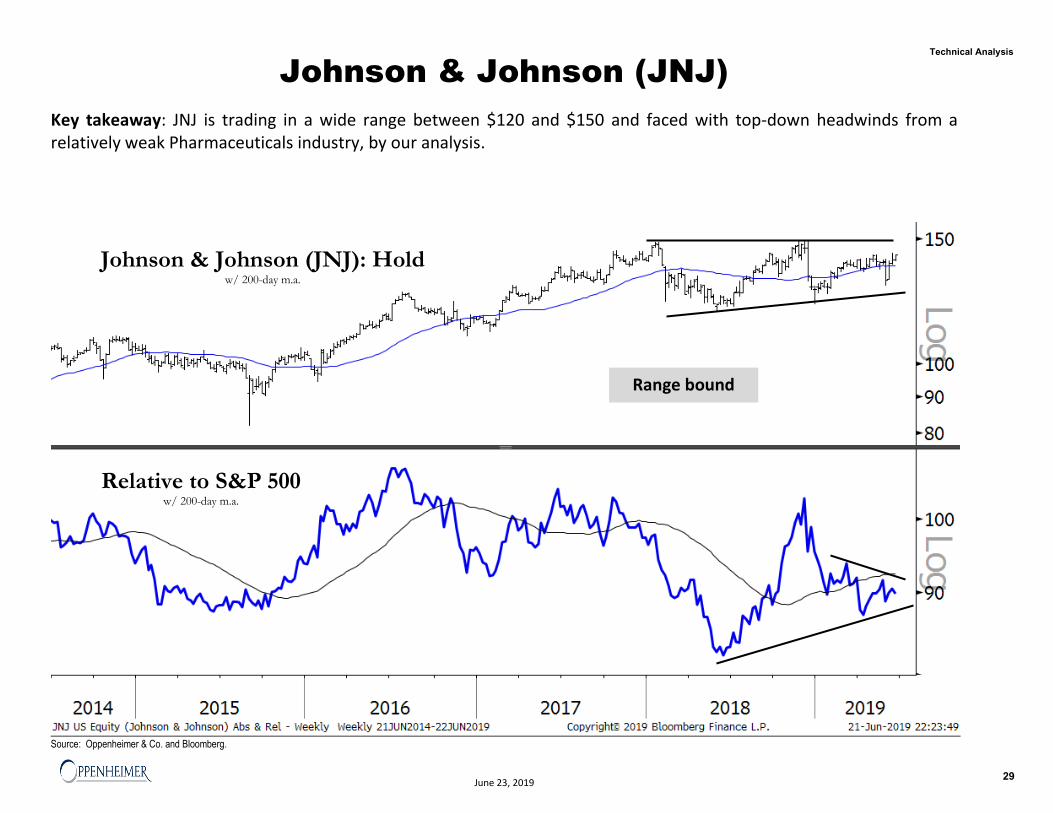
Johnson & Johnson (JNJ)
Key takeaway: JNJ is trading in a wide range between $120 and $150 and faced with top-down headwinds from a relatively weak Pharmaceuticals industry, by our analysis.
Source: Oppenheimer & Co. and Bloomberg.
Johnson & Johnson (JNJ): Hold w/ 200-day m.a.
Relative to S&P 500 w/ 200-day m.a.
Range bound
29
Technical Analysis
June 23, 2019
Pfizer, Inc. (PFE)
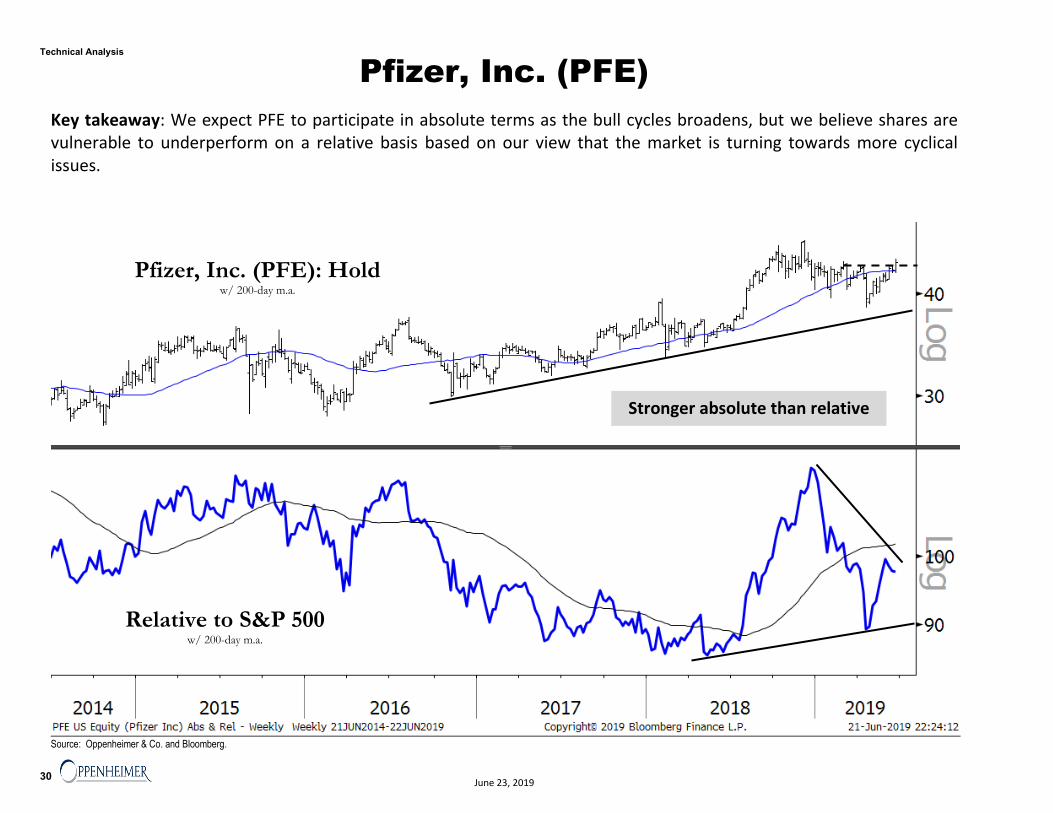
Key takeaway: We expect PFE to participate in absolute terms as the bull cycles broadens, but we believe shares are vulnerable to underperform on a relative basis based on our view that the market is turning towards more cyclical issues.
Source: Oppenheimer & Co. and Bloomberg.
Pfizer, Inc. (PFE): Hold w/ 200-day m.a.
Relative to S&P 500 w/ 200-day m.a.
Stronger absolute than relative
30
Technical Analysis
June 23, 2019
UnitedHealth Group, Inc. (UNH)
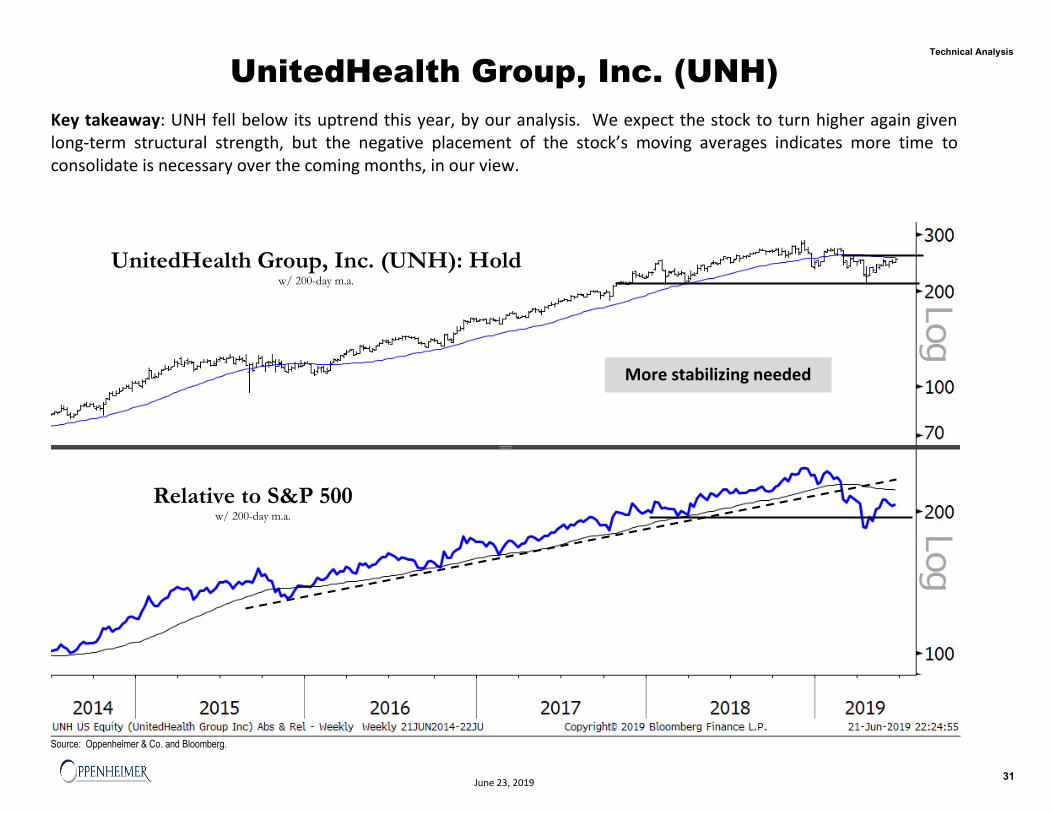
Key takeaway: UNH fell below its uptrend this year, by our analysis. We expect the stock to turn higher again given long-term structural strength, but the negative placement of the stock’s moving averages indicates more time to consolidate is necessary over the coming months, in our view.
Source: Oppenheimer & Co. and Bloomberg.
UnitedHealth Group, Inc. (UNH): Hold w/ 200-day m.a.
Relative to S&P 500 w/ 200-day m.a.
More stabilizing needed
31
Technical Analysis
June 23, 2019
The Coca-Cola Co. (KO)
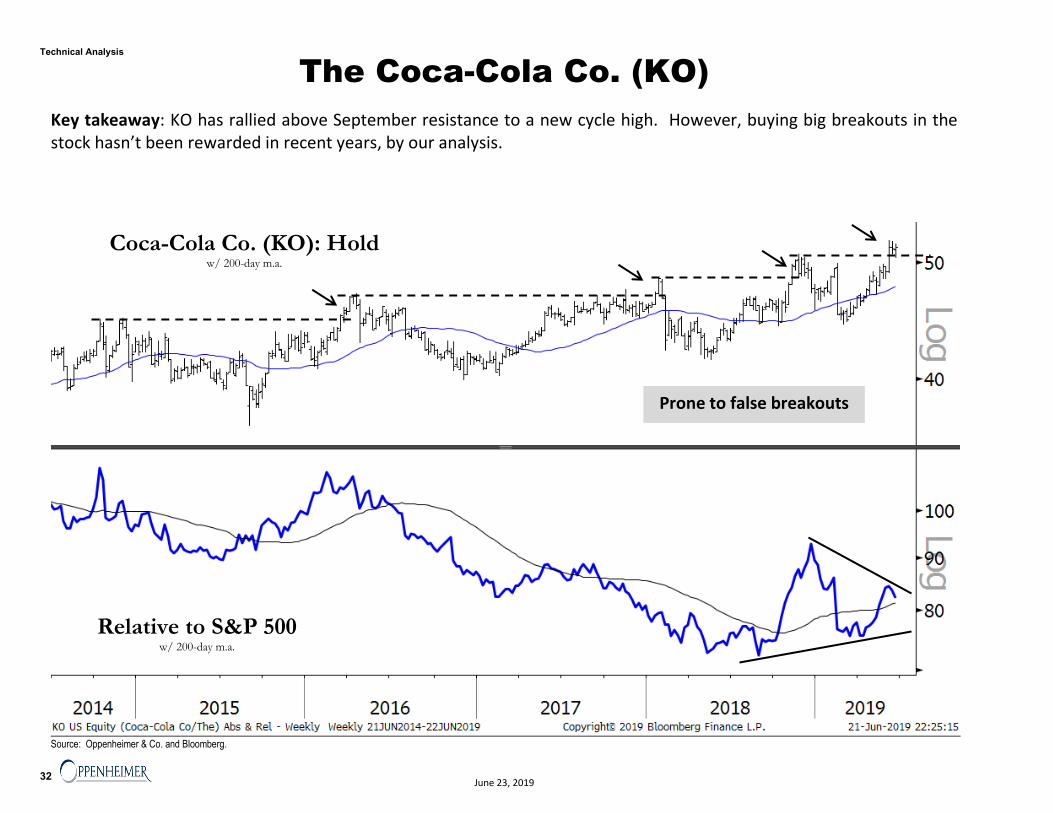
Key takeaway: KO has rallied above September resistance to a new cycle high. However, buying big breakouts in the stock hasn’t been rewarded in recent years, by our analysis.
Source: Oppenheimer & Co. and Bloomberg.
Coca-Cola Co. (KO): Hold w/ 200-day m.a.
Relative to S&P 500 w/ 200-day m.a.
Prone to false breakouts
32
Technical Analysis
June 23, 2019
Exxon Mobil Corp. (XOM)
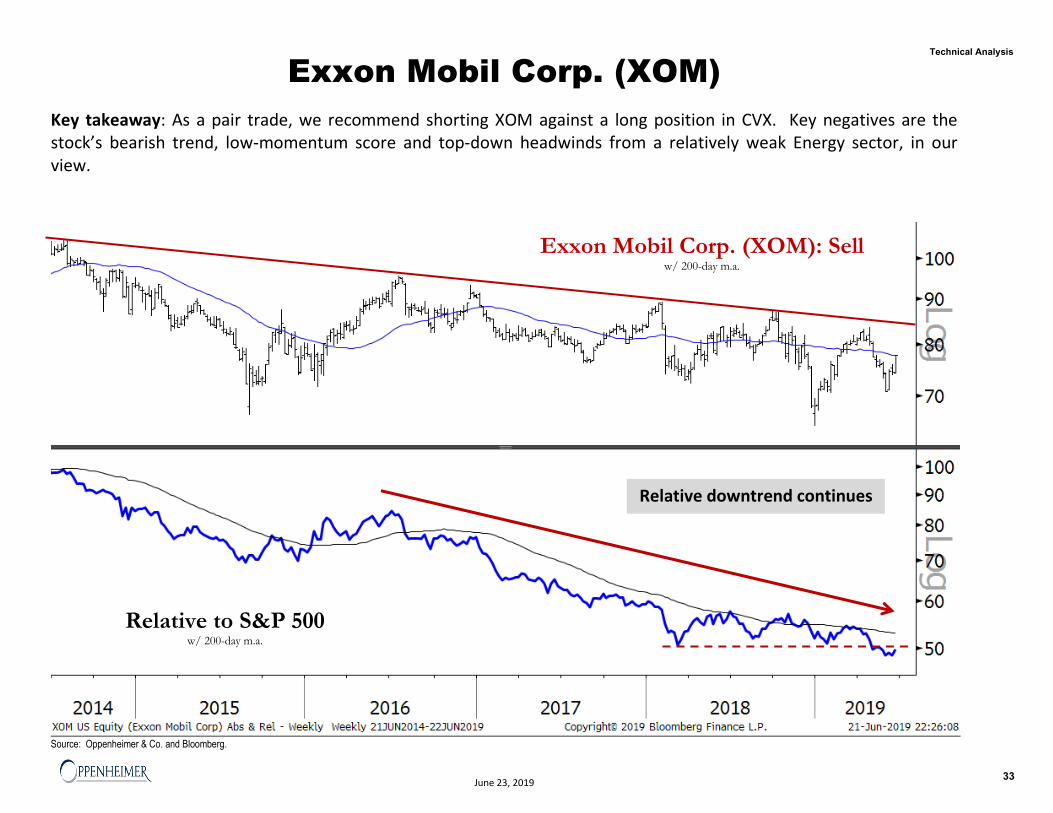
Key takeaway: As a pair trade, we recommend shorting XOM against a long position in CVX. Key negatives are the stock’s bearish trend, low-momentum score and top-down headwinds from a relatively weak Energy sector, in our view.
Source: Oppenheimer & Co. and Bloomberg.
Exxon Mobil Corp. (XOM): Sell w/ 200-day m.a.
Relative to S&P 500 w/ 200-day m.a.
Relative downtrend continues
33
Technical Analysis
June 23, 2019
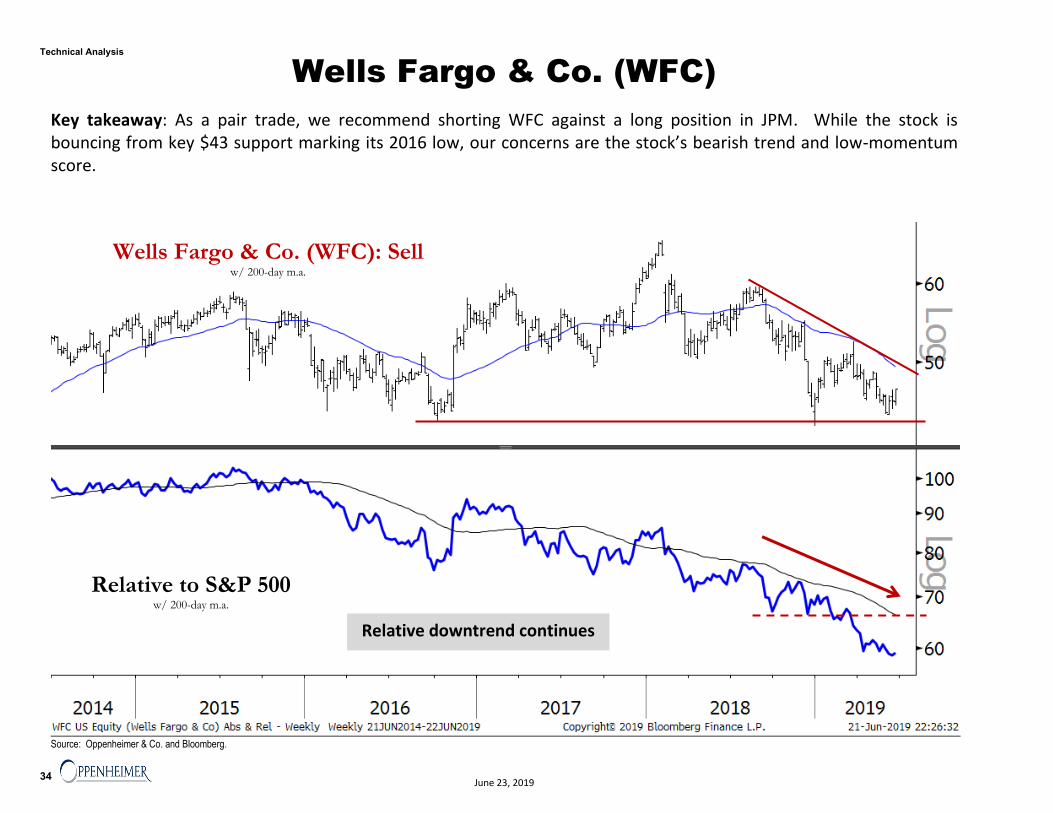
Wells Fargo & Co. (WFC)
Key takeaway: As a pair trade, we recommend shorting WFC against a long position in JPM. While the stock is bouncing from key $43 support marking its 2016 low, our concerns are the stock’s bearish trend and low-momentum score.
Source: Oppenheimer & Co. and Bloomberg.
Wells Fargo & Co. (WFC): Sell w/ 200-day m.a.
Relative to S&P 500 w/ 200-day m.a.
Relative downtrend continues
34
Technical Analysis
June 23, 2019
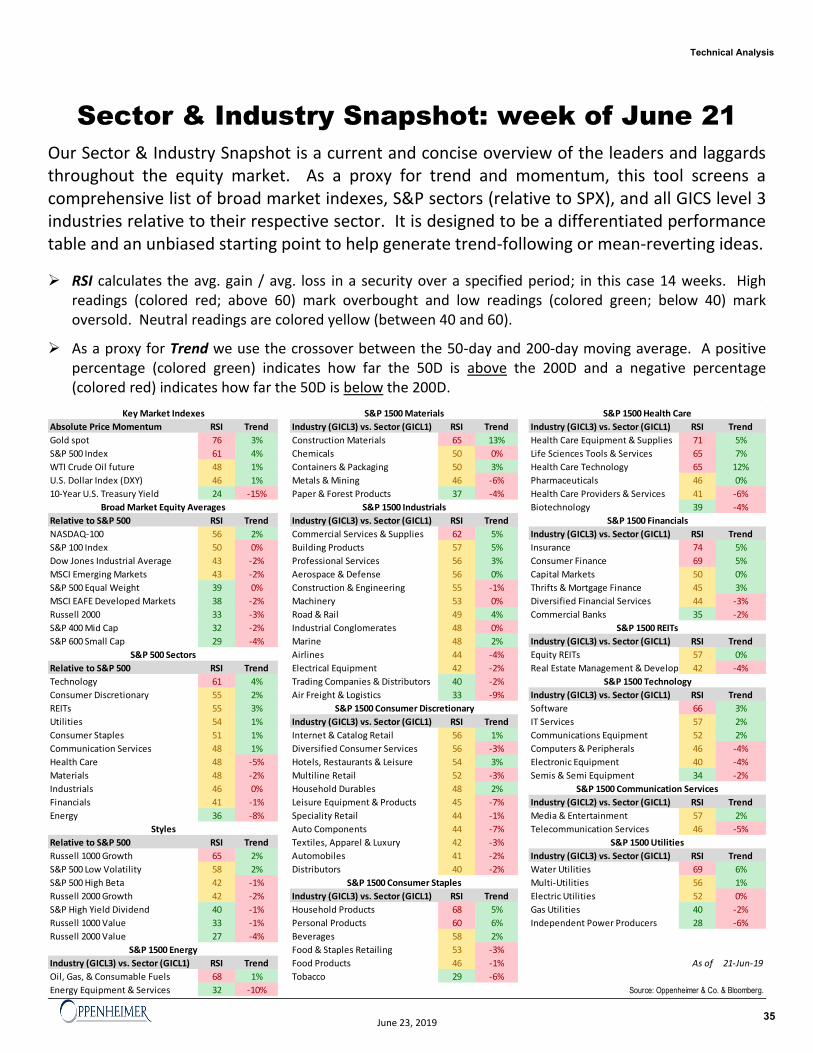
Sector & Industry Snapshot: week of June 21
Our Sector & Industry Snapshot is a current and concise overview of the leaders and laggards throughout the equity market. As a proxy for trend and momentum, this tool screens a comprehensive list of broad market indexes, S&P sectors (relative to SPX), and all GICS level 3 industries relative to their respective sector. It is designed to be a differentiated performance table and an unbiased starting point to help generate trend-following or mean-reverting ideas.
RSI calculates the avg. gain / avg. loss in a security over a specified period; in this case 14 weeks. High readings (colored red; above 60) mark overbought and low readings (colored green; below 40) mark oversold. Neutral readings are colored yellow (between 40 and 60).
As a proxy for Trend we use the crossover between the 50-day and 200-day moving average. A positive percentage (colored green) indicates how far the 50D is above the 200D and a negative percentage (colored red) indicates how far the 50D is below the 200D.
Absolute Price Momentum RSI Trend Industry (GICL3) vs. Sector (GICL1) RSI Trend Industry (GICL3) vs. Sector (GICL1) RSI Trend
Gold spot 76 3% Construction Materials 65 13% Health Care Equipment & Supplies 71 5%
S&P 500 Index 61 4% Chemicals 50 0% Life Sciences Tools & Services 65 7%
WTI Crude Oil future 48 1% Containers & Packaging 50 3% Health Care Technology 65 12%
U.S. Dollar Index (DXY) 46 1% Metals & Mining 46 -6% Pharmaceuticals 46 0%
10-Year U.S. Treasury Yield 24 -15% Paper & Forest Products 37 -4% Health Care Providers & Services 41 -6%
Biotechnology 39 -4%
Relative to S&P 500 RSI Trend Industry (GICL3) vs. Sector (GICL1) RSI Trend
NASDAQ-100 56 2% Commercial Services & Supplies 62 5% Industry (GICL3) vs. Sector (GICL1) RSI Trend
S&P 100 Index 50 0% Building Products 57 5% Insurance 74 5%
Dow Jones Industrial Average 43 -2% Professional Services 56 3% Consumer Finance 69 5%
MSCI Emerging Markets 43 -2% Aerospace & Defense 56 0% Capital Markets 50 0%
S&P 500 Equal Weight 39 0% Construction & Engineering 55 -1% Thrifts & Mortgage Finance 45 3%
MSCI EAFE Developed Markets 38 -2% Machinery 53 0% Diversified Financial Services 44 -3%
Russell 2000 33 -3% Road & Rail 49 4% Commercial Banks 35 -2%
S&P 400 Mid Cap 32 -2% Industrial Conglomerates 48 0%
S&P 600 Small Cap 29 -4% Marine 48 2% Industry (GICL3) vs. Sector (GICL1) RSI Trend
Airlines 44 -4% Equity REITs 57 0%
Relative to S&P 500 RSI Trend Electrical Equipment 42 -2% Real Estate Management & Develop 42 -4%
Technology 61 4% Trading Companies & Distributors 40 -2%
Consumer Discretionary 55 2% Air Freight & Logistics 33 -9% Industry (GICL3) vs. Sector (GICL1) RSI Trend
REITs 55 3% Software 66 3%
Utilities 54 1% Industry (GICL3) vs. Sector (GICL1) RSI Trend IT Services 57 2%
Consumer Staples 51 1% Internet & Catalog Retail 56 1% Communications Equipment 52 2%
Communication Services 48 1% Diversified Consumer Services 56 -3% Computers & Peripherals 46 -4%
Health Care 48 -5% Hotels, Restaurants & Leisure 54 3% Electronic Equipment 40 -4%
Materials 48 -2% Multiline Retail 52 -3% Semis & Semi Equipment 34 -2%
Industrials 46 0% Household Durables 48 2%
Financials 41 -1% Leisure Equipment & Products 45 -7% Industry (GICL2) vs. Sector (GICL1) RSI Trend
Energy 36 -8% Speciality Retail 44 -1% Media & Entertainment 57 2%
Auto Components 44 -7% Telecommunication Services 46 -5%
Relative to S&P 500 RSI Trend Textiles, Apparel & Luxury 42 -3%
Russell 1000 Growth 65 2% Automobiles 41 -2% Industry (GICL3) vs. Sector (GICL1) RSI Trend
S&P 500 Low Volatility 58 2% Distributors 40 -2% Water Utilities 69 6%
S&P 500 High Beta 42 -1% Multi-Utilities 56 1%
Russell 2000 Growth 42 -2% Industry (GICL3) vs. Sector (GICL1) RSI Trend Electric Utilities 52 0%
S&P High Yield Dividend 40 -1% Household Products 68 5% Gas Utilities 40 -2%
Russell 1000 Value 33 -1% Personal Products 60 6% Independent Power Producers 28 -6%
Russell 2000 Value 27 -4% Beverages 58 2%
Food & Staples Retailing 53 -3%
Industry (GICL3) vs. Sector (GICL1) RSI Trend Food Products 46 -1% As of 21-Jun-19
Oil, Gas, & Consumable Fuels 68 1% Tobacco 29 -6%
Energy Equipment & Services 32 -10%
Styles
Source: Oppenheimer & Co. & Bloomberg.
S&P 1500 Consumer Staples
S&P 1500 Energy
S&P 1500 Technology
S&P 1500 REITs
S&P 1500 Communication Services
S&P 1500 Utilities
S&P 1500 Health CareS&P 1500 Materials
S&P 1500 Industrials
S&P 1500 Consumer Discretionary
S&P 1500 Financials
Key Market Indexes
Broad Market Equity Averages
S&P 500 Sectors
35
Technical Analysis
June 23, 2019
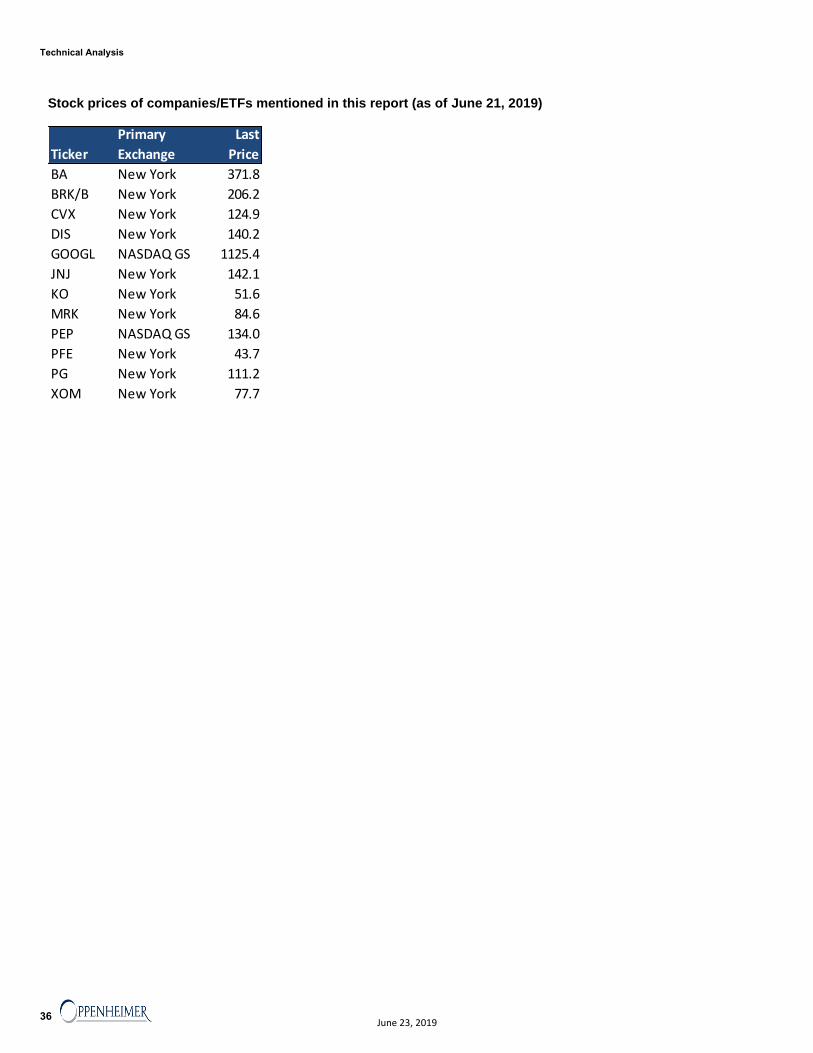
Stock prices of companies/ETFs mentioned in this report (as of June 21, 2019)
Ticker
Primary
Exchange
Last
Price
BA New York 371.8
BRK/B New York 206.2
CVX New York 124.9
DIS New York 140.2
GOOGL NASDAQ GS 1125.4
JNJ New York 142.1
KO New York 51.6
MRK New York 84.6
PEP NASDAQ GS 134.0
PFE New York 43.7
PG New York 111.2
XOM New York 77.7
36
Technical Analysis
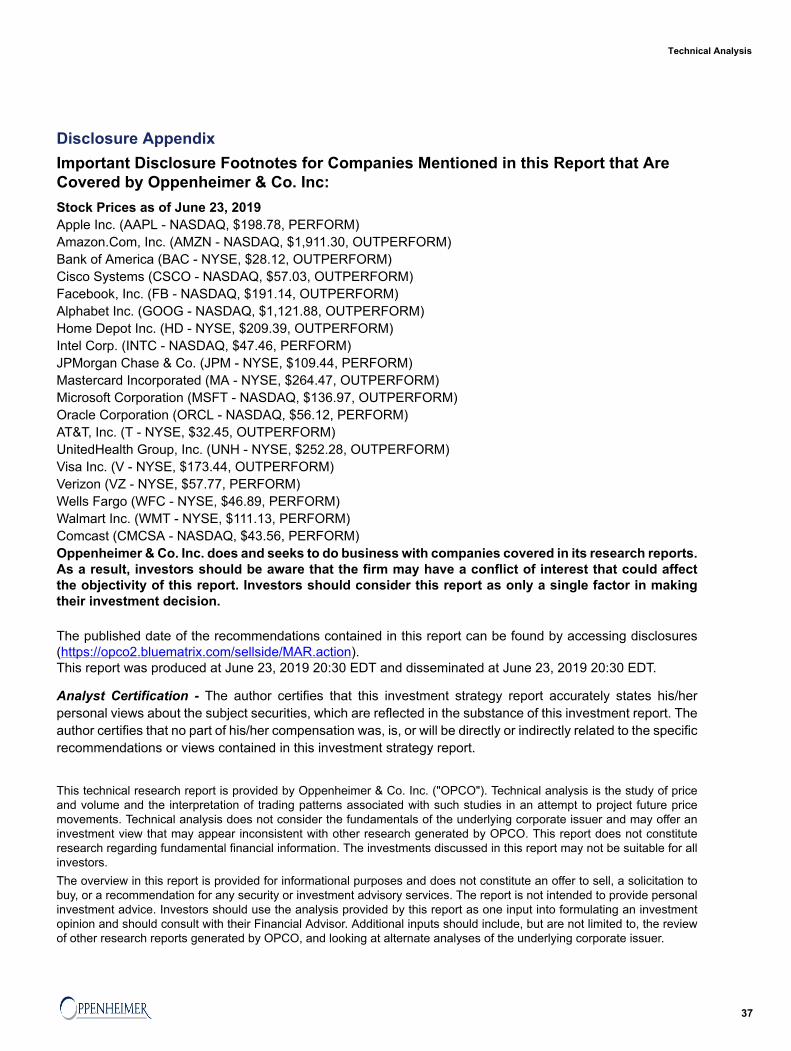
Disclosure AppendixImportant Disclosure Footnotes for Companies Mentioned in this Report that AreCovered by Oppenheimer & Co. Inc:Stock Prices as of June 23, 2019Apple Inc. (AAPL - NASDAQ, $198.78, PERFORM)Amazon.Com, Inc. (AMZN - NASDAQ, $1,911.30, OUTPERFORM)Bank of America (BAC - NYSE, $28.12, OUTPERFORM)Cisco Systems (CSCO - NASDAQ, $57.03, OUTPERFORM)Facebook, Inc. (FB - NASDAQ, $191.14, OUTPERFORM)Alphabet Inc. (GOOG - NASDAQ, $1,121.88, OUTPERFORM)Home Depot Inc. (HD - NYSE, $209.39, OUTPERFORM)Intel Corp. (INTC - NASDAQ, $47.46, PERFORM)JPMorgan Chase & Co. (JPM - NYSE, $109.44, PERFORM)Mastercard Incorporated (MA - NYSE, $264.47, OUTPERFORM)Microsoft Corporation (MSFT - NASDAQ, $136.97, OUTPERFORM)Oracle Corporation (ORCL - NASDAQ, $56.12, PERFORM)AT&T, Inc. (T - NYSE, $32.45, OUTPERFORM)UnitedHealth Group, Inc. (UNH - NYSE, $252.28, OUTPERFORM)Visa Inc. (V - NYSE, $173.44, OUTPERFORM)Verizon (VZ - NYSE, $57.77, PERFORM)Wells Fargo (WFC - NYSE, $46.89, PERFORM)Walmart Inc. (WMT - NYSE, $111.13, PERFORM)Comcast (CMCSA - NASDAQ, $43.56, PERFORM)Oppenheimer & Co. Inc. does and seeks to do business with companies covered in its research reports.As a result, investors should be aware that the firm may have a conflict of interest that could affectthe objectivity of this report. Investors should consider this report as only a single factor in makingtheir investment decision.
The published date of the recommendations contained in this report can be found by accessing disclosures(https://opco2.bluematrix.com/sellside/MAR.action).This report was produced at June 23, 2019 20:30 EDT and disseminated at June 23, 2019 20:30 EDT.
Analyst Certification - The author certifies that this investment strategy report accurately states his/herpersonal views about the subject securities, which are reflected in the substance of this investment report. Theauthor certifies that no part of his/her compensation was, is, or will be directly or indirectly related to the specificrecommendations or views contained in this investment strategy report.
This technical research report is provided by Oppenheimer & Co. Inc. ("OPCO"). Technical analysis is the study of priceand volume and the interpretation of trading patterns associated with such studies in an attempt to project future pricemovements. Technical analysis does not consider the fundamentals of the underlying corporate issuer and may offer aninvestment view that may appear inconsistent with other research generated by OPCO. This report does not constituteresearch regarding fundamental financial information. The investments discussed in this report may not be suitable for allinvestors.The overview in this report is provided for informational purposes and does not constitute an offer to sell, a solicitation tobuy, or a recommendation for any security or investment advisory services. The report is not intended to provide personalinvestment advice. Investors should use the analysis provided by this report as one input into formulating an investmentopinion and should consult with their Financial Advisor. Additional inputs should include, but are not limited to, the reviewof other research reports generated by OPCO, and looking at alternate analyses of the underlying corporate issuer.
37
Technical Analysis
With respect to any specific company discussed herein, allow this report to serve as both an initiation and termination ofcoverage. Given the nature of technical research, such company may or may not appear in future reports for a variety oftechnical reasons.Securities and other financial instruments discussed in this report or recommended or sold by OPCO are not insuredby the Federal Deposit Insurance Corporation and are not deposits or obligations of any insured depository institution.Investments involve numerous risks including market risk, counterparty default risk and liquidity risk. Securities and otherfinancial investments at times may be difficult to value or sell. The value of financial instruments may fluctuate, and investorsmay lose their entire principal investment.
Potential Conflicts of Interest:Technical or strategic analysts employed by OPCO are compensated from revenues generated by the firm. OPCO generallyprohibits any analyst and any member of his or her household from executing trades in the securities of a company that suchanalyst covers. Additionally, OPCO generally prohibits any analyst from serving as an officer, director or advisory boardmember of a company that such analyst covers. In addition to 1% (or more) ownership positions in covered companiesthat are required to be specifically disclosed in this report, OPCO may have a long positon of less than 1% or a shortposition or deals as principal in the securities discussed herein, related securities or in options, futures or other derivativeinstruments based thereon and makes a market in the securities discussed herein. Recipients of this report are advisedthat any or all of the foregoing arrangements, as well as more specific disclosures set forth below, may at times give riseto potential conflicts of interest.
Company Specific Disclosures
Oppenheimer & Co. Inc. makes a market in the securities of AAPL, AMZN, BA, CMCSA, CSCO, CVX, FB,GOOG, INTC, MSFT, ORCL and T.
The Oppenheimer & Co. Inc. analyst/associate(s) who covers this company also has a long position in CVX,JPM and XOM.
A member of the household of an Oppenheimer & Co. Inc. research analyst who covers this company has along position in CVX, JPM, V and XOM.
Oppenheimer & Co. Inc. expects to receive or intends to seek compensation for investment banking servicesin the next 3 months from FB.
Additional Information Available
Company-Specific Disclosures: Important disclosures, including price charts, are available for compendiumreports and all Oppenheimer & Co. Inc.-covered companies by logging on to https://www.oppenheimer.com/client-login.aspx or writing to Oppenheimer & Co. Inc., 85 Broad Street, New York, NY 10004, Attention: EquityResearch Department, Business Manager.
Other Disclosures
This report is issued and approved by OPCO, Oppenheimer Europe Ltd. and Oppenheimer Investments Asia Limited. Thisreport may be further distributed by OPCO for informational purposes only, to its institutional and retail investor clients.OPCO transacts business on all principal Exchanges and is a member of SIPC. This report does not constitute an offeror solicitation to buy or sell any securities discussed herein in any jurisdiction where such offer or solicitation would beprohibited. The securities mentioned in this report may not be suitable for all types of investors. This report does nottake into account the investment objectives, financial situation or specific needs of any particular client of OPCO or itsaffiliates. Recipients should consider this report as only a single factor in making an investment decision and should notrely solely on investment recommendations contained herein, if any, as a substitution for the exercise of independentjudgment of the merits and risks of investments. The analyst writing the report is not a person or company with actual,implied or apparent authority to act on behalf of any issuer mentioned in the report. Before making an investment decisionwith respect to any security recommended in this report, the recipient should consider whether such recommendation is
38
Technical Analysis
appropriate given the recipient's particular investment needs, objectives and financial circumstances. We recommend thatinvestors independently evaluate particular investments and strategies, and encourage investors to seek the advice of afinancial advisor. OPCO will not treat non-client recipients as its clients solely by virtue of their receiving this report. Pastperformance is not a guarantee of future results, and no representation or warranty, express or implied, is made regardingfuture performance of any security mentioned in this report. The price of the securities mentioned in this report and theincome they produce may fluctuate and/or be adversely affected by exchange rates, and investors may realize losses oninvestments in such securities, including the loss of investment principal. OPCO accepts no liability for any loss arising fromthe use of information contained in this report. All information, opinions and statistical data contained in this report wereobtained or derived from public sources believed to be reliable, but OPCO does not represent that any such information,opinion or statistical data is accurate or complete (with the exception of information contained in the Disclosure Appendixsection of this report provided by OPCO or individual research analysts), and they should not be relied upon as such. Allestimates, opinions and recommendations expressed herein constitute judgments as of the date of this report and aresubject to change without notice. Nothing in this report constitutes legal, accounting or tax advice. Since the levels andbases of taxation can change, any reference in this report to the impact of taxation should not be construed as offering taxadvice on the tax consequences of investments. As with any investment having potential tax implications, clients shouldconsult with their own independent tax adviser. This report may provide addresses of, or contain hyperlinks to, Internet websites. OPCO has not reviewed the linked Internet web site of any third party and takes no responsibility for the contentsthereof. Each such address or hyperlink is provided solely for the recipient's convenience and information, and the contentof linked third party web sites is not in any way incorporated into this document. Recipients who choose to access suchthird-party web sites or follow such hyperlinks do so at their own risk.The S & P 500 Index is an unmanaged value-weighted index of 500 common stocks that is generally consideredrepresentative of the U.S. stock market. The S & P 500 index figures do not reflect any fees, expenses or taxes. Indices areunmanaged, hypothetical portfolios of securities that are often used as a benchmark in evaluating the relative performanceof a particular investment. An index should only be compared with a mandate that has a similar investment objective.An index is not available for direct investment, and does not reflect any of the costs associated with buying and sellingindividual securities or management fees. The Volatility Index (VIX) shows the market's expectations of 30-day volatility. Itis constructed using the implied volatilities of a wide range of S&P 500 index options. The VIX is a widely used measureof market risk.This research report may also be distributed in the UK and elsewhere throughout Europe, as third party research byOppenheimer Europe Ltd, which is authorized and regulated by the Financial Conduct Authority (FCA). This research isfor information purposes only and is not to be construed as a solicitation or an offer to purchase or sell investments orrelated financial instruments. This research is for distribution only to persons who are eligible counterparties or professionalclients. It is not intended to be distributed or passed on, directly or indirectly, to any other class of persons. In particular,this material is not for distribution to, and should not be relied upon by, retail clients, as defined under the rules of the FCA.Neither the FCA’s protection rules nor compensation scheme may be applied.This research report may be distributed in Hong Kong by Oppenheimer Investments Asia Limited (OIAL) to professionalinvestors, persons whose business involves the acquisition, disposal or holding of securities, whether as principal oragent. OIAL, an affiliate of Oppenheimer Asset Management Inc., is regulated by the Securities and Futures Commissionfor the conduct of dealing in securities and advising on securities. Professional investors in Hong Kong should [email protected] for all matters and queries relating to this report.The above is for informational purposes only and should not be considered as an offer, or solicitation, to deal in any ofthe investments mentioned herein. OPCO does not warrant the accuracy, adequacy or completeness of the informationand materials contained in this document and expressly disclaims liability for errors or omissions in such information andmaterials.Some of the information in this document may contain projections or other forward looking statements regarding futureevents or future financial performance of countries, markets or companies. These statements are only predictions andactual events or results may differ materially. The reader must make his/her own assessment of the relevance, accuracyand adequacy of the information contained in this document, and make such independent investigations, as he/she mayconsider necessary or appropriate for the purpose of such assessment.Any opinion or estimate contained in this document is made on a general basis and is not to be relied on by the reader asadvice. Neither OPCO nor any of its agents have given any consideration to nor have they made any investigation of theinvestment objectives, financial situation or particular need of the reader, any specific person or group of persons.Accordingly, no warranty whatsoever is given and no liability whatsoever is accepted for any loss arising whether directly orindirectly as a result of the reader, any person or group of persons acting on any information, opinion or estimate containedin this document.OPCO reserves the right to make changes and corrections to its opinions expressed in this document at any time, withoutnotice.
39
Technical Analysis

This report or any portion hereof may not be reprinted, sold, or redistributed without the written consent ofOppenheimer & Co. Inc. Copyright © Oppenheimer & Co. Inc. 2019.
40
Technical Analysis