Embed Size (px)
Citation preview

Oil market and NCS outlookJune 9, 2017
Teodor Sveen-NilsenPhone : (+47) 24 13 36 06Mobile : (+47) 95 74 36 26E-mail : [email protected]

Agenda
2
Introduction
Do we need more oil?
Oil market balance
Oil demand
Oil supply
Future of NCS
Summary

Financials
Oil ServicesUtilities & Renewables
3
A full-service investment bank
SB1 Markets’ – Strategic position
Nordic-focus with international reach Core sectors
SB1M has a strong position in the Nordic markets, with a global reach and client base
1
2
3
OsloHQ
Core markets
Client base
A leading full-service investment bank based in Oslo
130 employees1) in total, highly research driven approached
Backed by Norway’s #2 banking group with more than USD 100bn in assets
Natural Resources TMT
Seafood
Real estate
Industrials and Services
1) Including core incoming team from 1 June / 1 September 2017

Jørgen Haug
Teodor Sveen-Nilsen
4
Top-ranked research team and broad sector coverage 1)
Research team – selected members
1) Including core incoming team from 1 June / 1 September 2017
#1 in macro
#1 in credit
Pål Ringholm
• Ranked #1 in credit, top ranked for a decade
• 18 years of experience from investment banking and finance
#1 in strategy
Coverage of 10-15 E&P companies, 75+ companies in total
Harald Magnus Andreassen
• Ranked #1 in macro for 15 consecutive years with clear margin
• 22 years of experience from investment banking research
Peter Hermanrud
• Ranked #1 in strategy for 15 consecutive years with clear margin
• 24 years of experience from asset management and research
Top rated in E&P
Top rated in High Yield
• Ranked top 3 in E&P sector, covers Nordic companies
• Experience from sell-side research and consulting
• M.Sc. in Business and Administration from BI, MBA in Corporate Finance from NHH
OTHER
• Ranked top 4 in credit in Norway
• 7 years of high yield credit research experience
• M. Phil., Finance, University of Cambridge
Agenda
5
Introduction
Do we need more oil?
Oil market balance
Oil demand
Oil supply
Future of NCS
Summary

09/06/20176
Do we need more oil and gas?
Most forecasters agree on:
• World population will grow
• World energy demand will increase
• Oil and gas will probably lose market share vs. other energy carriers
• Renewable will grow at high rates (but from a very low base)
In the public debate, it looks like may forget:
• In its nature, oil and gas are declining and substantial investments are needed to keep production flat
• Losing market share ≠ lower absolute demand

1.0 %
2.0 %
0.5 %
2.1 %
2.4 %
1.4 %
0.0 %
0.5 %
1.0 %
1.5 %
2.0 %
2.5 %
3.0 %
CAGR
CA
GR
Liquids (crude + NGL) Natural gas
Coal Nuclear
Other (hydro, renewable, other) Sum energy demand
EIA: Energy demand will increase by 1.4% per year, all sources expected grow. Oil will lose market share, but still grow ~1% per year
09/06/20177
Demand per energy source CAGR per energy source
Source: EIA, Sb1 Markets. 1 quadrillion btu = 170 mill boe
0
50
100
150
200
250
300
350
400
450
0
100
200
300
400
500
600
700
800
900
2016 2020 2025 2030 2035 2040
mill
bo
e/d
qu
adri
llio
n B
tu
Liquids (crude + NGL) Natural gas
Coal Nuclear
Other (hydro, renewable, other) mill boe/d
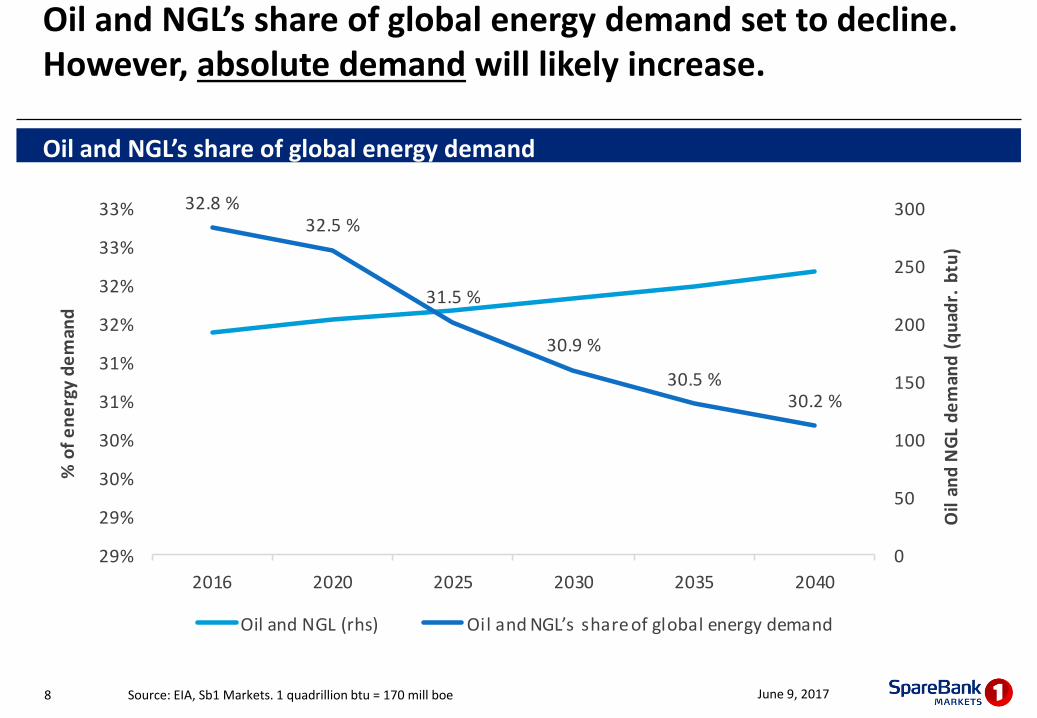
Oil and NGL’s share of global energy demand set to decline. However, absolute demand will likely increase.
June 9, 2017Source: EIA, Sb1 Markets. 1 quadrillion btu = 170 mill boe8
Oil and NGL’s share of global energy demand
32.8 %32.5 %
31.5 %
30.9 %
30.5 %30.2 %
29%
29%
30%
30%
31%
31%
32%
32%
33%
33%
2016 2020 2025 2030 2035 2040
0
50
100
150
200
250
300
% o
f e
ne
rgy
de
man
d
Oil
and
NG
L d
em
and
(q
uad
r. b
tu)
Oil and NGL (rhs) Oil and NGL’s share of global energy demand

Energy intensity will probably increase
• According to UN, the world population will grow to 9.2 bn by 2040, or 0.9% per year
• If EIA’s energy demand forecasts are correct, the global energy intensity will increase
• Total emery demand per billion is set to increase from 79 quadrillion btu in 2016 to 89 per quadrillion btu in 2040, or 0.5% per year
June 9, 2017Source: EIA, UN, IMF, Sb1 Markets9
World population and energy intensity UN and EIA projections to 2040
7.4
7.8
8.1
8.5
8.8
9.2
5
6
6
7
7
8
8
9
9
10
10
75
77
79
81
83
85
87
89
91
93
95
2016 2020 2025 2030 2035 2040
Glo
bal
po
pu
lati
on
, b
n
Ene
rgy
inte
nsi
ty p
er
pe
rso
n
Energy consumption per bn Global population bn, (rhs)

Agenda
10
Introduction
Do we need more oil?
Oil market balance
Oil demand
Oil supply
Future of NCS
Summary

The oil market is rebalanced
09/06/201711
Global oil market balance
90
91
92
93
94
95
96
97
98
99
100
Jan
14
Mar
14
May
14
Jul
14
Sep
14
Nov
14
Jan
15
Mar
15
May
15
Jul
15
Sep
15
Nov
15
Jan
16
Mar
16
May
16
Jul
16
Sep
16
Nov
16
Jan
17
Mar
17
May
17
Jul
17
Sep
17
Nov
17
mb
/d
Oil demand Oil production
Source: IEA, Sb1 Markets.

Agenda
12
Introduction
Do we need more oil?
Oil market balance
Oil demand
Oil supply
Future of NCS
Summary

Oil demand is not a problem: Demand estimates revised up…but growth estimates revised significantly less up due to baseline revisions
June 9, 201713
REGIONAL: Oil demand 2017e (mb/d) GLOBAL: Oil demand 2017e (mb/d)
Average of IEA, EIA and OPEC estimates: +0.8 mb/d since September 2016
44.0
45.0
46.0
47.0
48.0
49.0
50.0
51.0
sep. 16 okt. 16 nov. 16 des. 16 jan. 17 feb. 17 mar. 17 apr. 17 mai. 17
mb
/d
OEDC demand Non-OEDC demand
95.8
96.0
96.2
96.4
96.6
96.8
97.0
97.2
97.4
97.6
sep. 16 okt. 16 nov. 16 des. 16 jan. 17 feb. 17 mar. 17 apr. 17 mai. 17
mb
/d
Global demand
Source: IEA, Sb1 Markets.

We estimate 2017e demand growth of 1.4-1.5 mb/d, vs. average of ~1.2 mb/d last 30 years
June 9, 201714
Oil demand growth y/y
1.10
1.15
1.20
1.25
1.30
1.35
1.40
1.45
1.50
2017 demand growth Average demand growth last 30 yrs
mb
/d
Sb1 forecast: 1.4-1.5 mb/d based on three different models
Source: IEA, EIA, OPEC, Sb1 Markets.

y/ y changes 2017,
mb/ d
OED C
demand
N o n-OED C
demand
Glo bal
demand
N o n-OP EC
supply +
OP EC N GL
C all o n
OP EC
IEA -0.2 1.4 1.3 0.7 0.6
EIA 0.3 1.3 1.6 1.4 0.2
OPEC 0.2 1.1 1.3 0.1 1.2
Average 0.1 1.3 1.4 0.7 0.7
Consensus: 2017e demand growth at 1.4 mb/d vs average of ~1.2 mb/d last 30 years
June 9, 201715
y/y estimates
y/y oil demand growth
Average growth = 1.2 mb/d
Source: MacrobondOECD, Sb1 Markets.
Agenda
16
Introduction
Do we need more oil?
Oil market balance
Oil demand
Oil supply
Future of NCS
Summary

June 9, 201717
Key issues oil supply
1. Non-OPEC production and US shale companies’ return to the market
2. Long term:
» Reserve replacement ratio
» Impact of low capex on future production

OPEC cut positive, surging non-OPEC production forecast adds risk
• The OPEC cut in late 2016 and increased global oil demand are the key reason for a balance oil market.
• However, with higher oil prices, we have seen that a number of forecasters have increased 2017e non-OPEC supply forecast (particularly US), which is negative for oil prices
• In the short to medium term, increased non-OPEC production is the key risk for the oil market
June 9, 201718
2017 non-OPEC supply estimates
60.0
61.0
62.0
63.0
64.0
65.0
66.0
67.0
mb
/d
IEA EIA OPEC Average all sources

Shale companies: Positive EBIT, still negative free cash flow
June 9, 201719
Shale oil companies’ EBIT Shale oil companies’ free cash flow*
Gulfport Energy CorporationLaredo Petroleum, Inc.Memorial Resource Development CorpNewfield Exploration CompanyOasis Petroleum Inc.QEP Resources, Inc.Range Resources CorporationRSP Permian, Inc.SM Energy CompanySouthwestern Energy CompanyWPX Energy, Inc. Class A
Continental Resources, Inc.EOG Resources, Inc.Pioneer Natural Resources CompanyWhiting Petroleum CorporationApache CorporationCabot Oil & Gas CorporationChesapeake Energy CorporationConcho Resources Inc.Denbury Resources Inc.Devon Energy CorporationDiamondback Energy, Inc.
Companies included in sample:
-7 000
-6 000
-5 000
-4 000
-3 000
-2 000
-1 000
0
Q4 15 Q1 16 Q2 16 Q3 16 Q4 16 Q1 17
USD
m
-5 000
-4 000
-3 000
-2 000
-1 000
0
1 000
2 000
3 000
Q4 15 Q1 16 Q2 16 Q3 16 Q4 16 Q1 17
USD
m
* Free cash flow = operational cash flow less capex. Source: Factset, company reports, Sb1 Markets

June 9, 201720
Long term supply considerations
1. Reserve replacement ratio
2. Long-term impact of low capex

Declining trend for majors’ reserve replacement ratio
June 9, 2017Source: Company reports *Includes, Statoil, ENI, BP, Total, Shell, Repsol, Chevron, Exxon, ConocoPillips21
Average RRR E&P majors*
60
70
80
90
100
110
120
130
140
2007 2008 2009 2010 2011 2012 2013 2014 2015 2016
Re
serv
e r
ep
lace
me
nt
rati
o
Average majors

Capex drives production, but a lot of noise in dataIntuitively, capex is the most important variable for production growth
June 9, 201722
Non-OPEC capex vs. production
1971
1972
1973
19741975
197619771978
19791980
1981
1982
1983
19841985
19861987
1988
1989
1990
1991
19921993
1994
1995
1996
1997
1998
1999
20002001
2002
2003 2004
2005
2006
2007
2008
2009
2010
2011
2012
y = 0.0384x + 0.0124R² = 0.1795
-6 %
-4 %
-2 %
0 %
2 %
4 %
6 %
8 %
-40 % -20 % 0 % 20 % 40 % 60 % 80 % 100 %
No
n-O
PEC
pro
du
ctio
n, t
+3
Non-OPEC capex
Source: Rystad, IEA Sb1 Markets

June 9, 201723
• Why look at capex vs. production?
» Intuitively correct. With no investments, declining oil production will accelerate decline.
» History gives support to the thesis that lower capex = lower production, in particular in certain areas
» However, on a aggregated basis, non-OPEC capex vs. non-OPEC production does not give any statistical significance.
• Why exclude OPEC in the analysis?
» OPEC is a cartel
» Production and investments decisions are made on different criteria that in non-OPEC (social security, national security, market share, prestige more important than NPV and IRR?)

Agenda
24
Introduction
Do we need more oil?
Oil market balance
Oil demand
Oil supply
Future of NCS
Summary

June 9, 201725
Two key challenges for NCS:
1. Declining production past 15 years
2. Investments back to 2007 levels

1: Norway has reduced its global market share by 50%
June 9, 2017Soure: Rystad uCube26
Global vs. NCS liquids production (mb/d)
1.5 %
1.7 %
1.9 %
2.4 %2.6 %
3.0 %
3.4 %
3.6 %
4.0 %
4.2 %
4.5 % 4.4 %
4.2 %4.3 %
4.4 %4.5 %
4.4 %
4.1 %
3.8 %
3.5 %
3.3 %
3.0 %2.9 %
2.8 %
2.5 %2.3 %
2.1 %2.0 % 2.0 % 2.0 % 2.1 %
0.0 %
0.5 %
1.0 %
1.5 %
2.0 %
2.5 %
3.0 %
3.5 %
4.0 %
4.5 %
5.0 %
0
20
40
60
80
100
120
1986 1987 1988 1989 1990 1991 1992 1993 1994 1995 1996 1997 1998 1999 2000 2001 2002 2003 2004 2005 2006 2007 2008 2009 2010 2011 2012 2013 2014 2015 2016
NCS liquids production RoW NCS % of global oil production (rhs)

2: E&P investments dropped significantly1) Global and NCS investments back to 2007 levels, 2) NCS correlates with global capex
Global vs NCS E&P capex (including exploration), USDm
Correlation global vs. NCS capex: 0.98
Soure: Rystad uCube
-
5 000
10 000
15 000
20 000
25 000
30 000
35 000
40 000
-
100 000
200 000
300 000
400 000
500 000
600 000
700 000
800 000
900 000
1 000 000
1986 1987 1988 1989 1990 1991 1992 1993 1994 1995 1996 1997 1998 1999 2000 2001 2002 2003 2004 2005 2006 2007 2008 2009 2010 2011 2012 2013 2014 2015 2016
Sum World Sum Norway (rhs)

0
10
20
30
40
50
60
70
80
90
100
Produced Reserves* Resources Resources in discoveries Other** Undiscovered resources Total
bn
bo
e
09/06/201728
Vast resources left, even after almost 40 years of production!
*Includes resource classes 1, 2 and 3, **Production not evaluated. Source: NPD
NPD says: 48% of total resources were produced as of end 2016
Not produced
Produced

NCS exploration: Set to increase
09/06/201729
NCS exploration wells vs oil price
33
51
3742
34
5749
45
27
6
43
4
17
13
1
5
10
13
98
62
80
111 112 109
99
54
45
0
20
40
60
80
100
120
0
10
20
30
40
50
60
2008 2009 2010 2011 2012 2013 2014 2015 2016 2017e 2018e 2019e
Nu
mb
er
of
we
lls
Completed In porgress Firm Planned Likley* DoD Avg. Brent oil price (rhs)
* Drill-or-drop wells risked with 25% in 2016, 2017 and 2018, and 35% thereafter. Likely wells risked with 50%. Soure: Rystad, NPD, company presentations
2017-19e: Estimates likely to increase as new information becomes available

Zero sanctions = flat NCS capex. Sanctions = capex growth…zero sanctions highly unlikely
09/06/201730
NCS capex (USDm)
-
5 000
10 000
15 000
20 000
25 000
30 000
35 000
2012 2013 2014 2015 2016 2017 2018 2019 2020 2021
USD
m
Abandoned Producing Under development Discovery
Soure: Rystad, NPD
2017e-2020e: Sverdrup 10-25% of NCS capex
09/06/201731
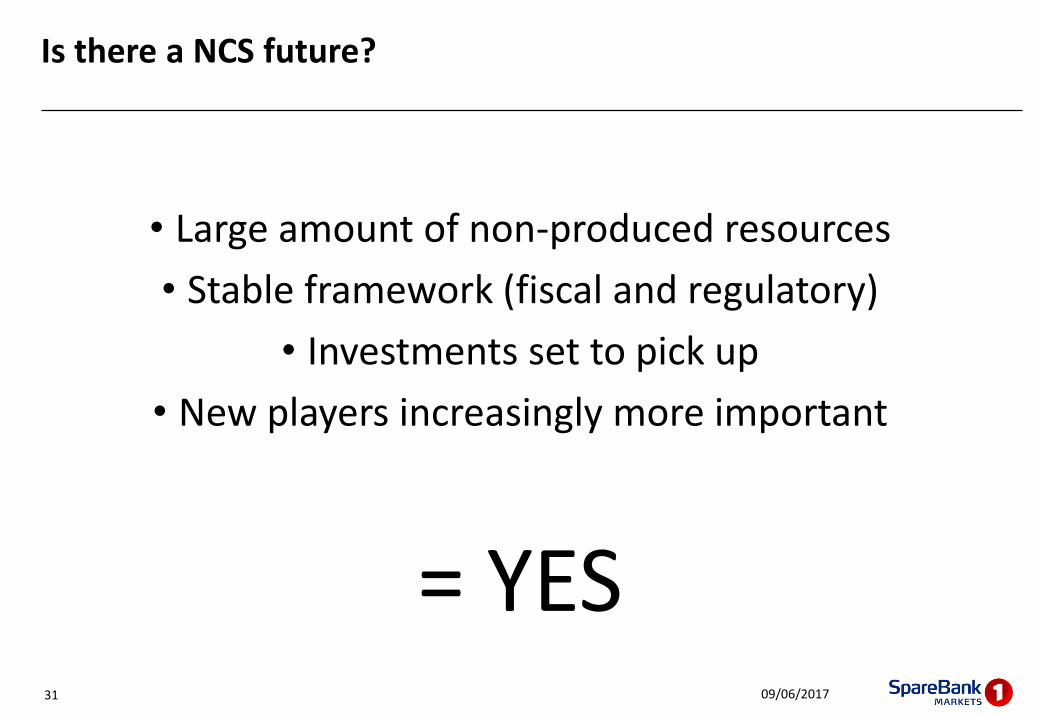
Is there a NCS future?
• Large amount of non-produced resources
• Stable framework (fiscal and regulatory)
• Investments set to pick up
• New players increasingly more important
= YES

Agenda
32
Introduction
Do we need more oil?
Oil market balance
Oil demand
Oil supply
Future of NCS
Summary

Summary
• The oil market is rebalanced
• Global oil demand is not a problem, we forecast 1.4-1.5 mb/d growth for 2017 (above historical average of 1.2 mb/d)
• OPEC cut positive, surging non-OPEC production forecast adds risk (but US shale oil companies not able to report positive cash flow)
• NCS activity set to increase

June 9, 2017
Teodor Sveen-NilsenPhone : (+47) 24 13 36 06Mobile : (+47) 95 74 36 26E-mail : [email protected]

09/06/201735
No Solicitation
This report or summary is provided for informational purposes only and under no circumstances is it to be used or considered as an offer to sell, or a solicitation of any offer to buy any securities. This report or summary is prepared for general circulation and general information only. It does not have regard to the specific investment objectives, financial situation or the particular needs of any person who may receive this report or summary. Investors should seek financial advice regarding the appropriateness of investing in any securities or investment strategies discussed or recommended in this report or summary and should understand that statements regarding future prospects may not be realized.
Performance in the past is not a guide to future performance. SpareBank 1 Markets accepts no liability whatsoever for any direct or consequential loss arising from the use of this publication or its contents.
These materials may not be reproduced, distributed or published by any recipient for any purpose. Please cite source when quoting.
Notice to U.S. Investors
If this report is being furnished directly to U.S. recipients by a non-U.S. SpareBank 1 Markets entity in reliance on section (a)(2) of Rule 15a-6 under the U.S. Securities Exchange Act of 1934, as amended (each a “direct U.S. recipient”), each such direct U.S. recipient of this report represents and agrees, by virtue of its acceptance thereof, that it is “major U.S. institutional investor” (as such term is defined in section (b)(4) of Rule 15a-6) and that it understands the risks involved in executing transactions in such securities. Any direct U.S. recipient of this report that wishes to discuss or receive additional information regarding any security or issuer mentioned herein, or engage in any transaction to purchase or sell or solicit or offer the purchase or sale of such securities, should contact a registered representative of SpareBank 1 Capital Markets Inc. (“SpareBank 1 Capital Markets”), a registered U.S. broker-dealer and member of FINRA and SIPC.
In certain cases, unless prohibited by the provisions of Regulation S under the U.S. Securities Act of 1933, as amended, this report may be provided by SpareBank 1 Capital Markets to a U.S. recipient (a “SpareBank 1 Capital Markets U.S. recipient”), in which case each such SpareBank 1 Capital Markets U.S. recipient of this report represents and agrees, by virtue of its acceptance thereof, that it is “major U.S. institutional investor” (as such term is defined in section (b)(4) of Rule 15a-6), or that it is a U.S. institutional investor (as such term is defined in section (b)(7) of Rule 15a-6), and that it understands the risks involved in executing transactions in such securities. In such cases, SpareBank 1 Capital Markets accepts responsibility for the content of this report; however, although it has accepted responsibility for the content of this report in such cases, SpareBank 1 Capital Markets did not contribute to the preparation of this report, and the specific authors of the report are not employed by, and are not associated persons of, SpareBank 1 Capital Markets. The SpareBank 1 Markets entity that prepared the report, and the authors of this report, may not be subject to all of the registration, qualification, disclosure, independence and other U.S. regulatory requirements that apply to SpareBank 1 Capital Markets and its employees and associated persons. Any SpareBank 1 Capital Markets U.S. recipient of this report that wishes to discuss or receive additional information regarding any security or issuer mentioned herein, or to engage in any transaction to purchase or sell or solicit or offer the purchase or sale of such securities, should contact a registered representative of SpareBank 1 Capital Markets.
Any transaction in the securities discussed in this report by U.S. persons (other than a registered U.S. broker-dealer or bank acting in a broker-dealer capacity) must be effected with or through SpareBank 1 Capital Markets.
The securities referred to in this report may not be registered under the U.S. Securities Act of 1933, as amended, and the issuer of such securities may not be subject to U.S. reporting and/or other requirements. Available information regarding the issuers of such securities may be limited, and such issuers may not be subject to the same auditing and reporting standards as U.S. issuers.
Such information is provided for informational purposes only and does not constitute a solicitation to buy or an offer to sell any securities under the Securities Act of 1933, as amended, or under any other U.S. federal or state securities laws, rules or regulations. The investment opportunities discussed in this report may be unsuitable for certain investors depending on their specific investment objectives, risk tolerance and financial position. In jurisdictions where SpareBank 1 Capital Markets is not registered or licensed to trade in securities, commodities or other financial products, transactions may be executed only in accordance with applicable law and legislation, which may vary from jurisdiction to jurisdiction and which may require that a transaction be made in accordance with applicable exemptions from registration or licensing requirements.
The information in this publication is based on carefully selected sources believed to be reliable, but SpareBank 1 Capital Markets does not make any representation with respect to its completeness or accuracy. All opinions expressed herein reflect the author’s judgment at the original time of publication, without regard to the date on which you may receive such information, and are subject to change without notice.
The information contained herein may include forward-looking statements as described above within the meaning of U.S. federal securities laws that are subject to risks and uncertainties. Factors that could cause a company’s actual results and financial condition to differ from expectations include, without limitation: political uncertainty, changes in general economic conditions that adversely affect the level of demand for the company’s products or services, changes in foreign exchange markets, changes in international and domestic financial markets and in the competitive environment, and other factors relating to the foregoing. All forward-looking statements contained in this report are qualified in their entirety by this cautionary statement.
Disclaimer