Embed Size (px)
Citation preview

EVALUATION OF CONTAMINANT MIXING IN
RAINWATER HARVESTING FIRST FLUSH DIVERTERS
A Thesis
by
JUSTIN KEITH MECHELL
Submitted to the Office of Graduate Studies of Texas A&M University
in partial fulfillment of the requirements for the degree of
MASTER OF SCIENCE
August 2009
Major Subject: Biological and Agricultural Engineering

EVALUATION OF CONTAMINANT MIXING IN
RAINWATER HARVESTING FIRST FLUSH DIVERTERS
A Thesis
by
JUSTIN KEITH MECHELL
Submitted to the Office of Graduate Studies of Texas A&M University
in partial fulfillment of the requirements for the degree of
MASTER OF SCIENCE
Approved by:
Chair of Committee, Bruce Lesikar Committee Members, Binayak Mohanty Don Wilkerson Fouad Jaber Dana Porter Head of Department, Gerald Riskowski
August 2009
Major Subject: Biological and Agricultural Engineering

iii
ABSTRACT
Evaluation of Contaminant Mixing in Rainwater Harvesting First Flush Diverters.
(August 2009)
Justin Keith Mechell, B.S., Texas A&M University
Chair of Advisory Committee: Dr. Bruce J. Lesikar
As the world population increases, the demand increases for quality drinking
water. The harvesting of rainwater has the potential to assist in alleviating pressures on
current water supplies and storm water drainage systems. Diversion of a portion of the
collected water away from storage is a technique used to improve harvested rainwater
water quality prior to storage. Six configurations of a downspout first flush diverter
were constructed and tested in the laboratory. The configurations of diverters were
evaluated for their affinity to allow diverted water in the diverter chamber to interact
with the flow of water to storage. Experiments were conducted at flow rates ranging
from 0.76 L/min to 113.56 L/min. This range of flow rates adequately represents a wide
range of common storm intensity patterns across the United States to which downspout
first flush diverters are subjected.
The diverter chamber to downspout transition fittings tested on a 10.16 cm
diameter diverter chamber, upward and downward oriented sanitary and straight tee, do
not have a significant impact on the mean difference in initial and final total dissolved
solids concentrations observed at multiple sample ports. No statistical difference was

iv
observed when comparing upward and downward oriented sanitary tees used as diverter
chambers to downspout transition fittings on 10.16 and 15.24 cm diverter chambers.
Utilizing a straight tee as a transition fitting with a floating ball, acting as a barrier
between water collected in the diverter chamber of a downspout first flush diverter and
the flow passing through the transition fitting, limited diverted water from interacting
with the subsequent flow of harvested rainwater. There is not a significant difference
between the use of a downspout first flush diverter with diverter chamber diameters of
10.16 and 15.24 cm utilizing upward and downward oriented sanitary tees as downspout
to diverter chamber transition fittings. Tests at flow rates less than or equal to 12.11
L/min exhibited limited changes in total dissolved solids concentrations in the
downspout first flush diverters with 15.24 cm diameter diverter chambers. Tests at flow
rates less than or equal to 1.51 L/min exhibited limited changes in total dissolved solids
concentrations in the downspout first flush diverters with 10.16 cm diameter diverter
chambers. The diverter chamber drain flow rate and volume impacts the observed
differences in initial and final TDS concentrations at all sample ports on the diverter
chamber of a downspout first flush diverter regardless of flow rate. The diverter
chamber drain flow rate impacts the flow rate of water entering the diverter chamber
through the transition fitting.

v
ACKNOWLEDGEMENTS
I would like to thank my committee chair, Dr. Lesikar, and my committee
members, Dr. Mohanty, Dr. Wilkerson, Dr. Jaber, and Dr. Porter, for their guidance and
support throughout the course of this research.
Thanks also go to my friends and colleagues and the department faculty and staff
for making my time at Texas A&M University a great experience. I would also like to
thank all of our student workers who assisted with my research, Nick Kaechler, Shannon
Reagan, Kyle Jackson, and Ryan Gerlich.
I would like to thank Clifton and Molly Griffin for encouraging me to pursue my
master’s degree.
Last but not least, thanks to my family for their encouragement and support
throughout my entire educational career. Most importantly, I would like to thank my
wife, Jordan, for her patience and support throughout the entire process of me earning
my degree.

vi
TABLE OF CONTENTS
Page
ABSTRACT ..................................................................................................................... iii
ACKNOWLEDGEMENTS ............................................................................................... v
TABLE OF CONTENTS .................................................................................................. vi
LIST OF FIGURES ........................................................................................................ viii
LIST OF TABLES ........................................................................................................... xii
INTRODUCTION .............................................................................................................. 1
RESEARCH OBJECTIVES .............................................................................................. 6
LITERATURE REVIEW ................................................................................................... 7
Runoff Water Quality ..................................................................................................... 7 First Flush Diversion .................................................................................................... 10 First Flush Diversion Volume ...................................................................................... 10 Downspout First Flush Diverter Configurations .......................................................... 11 Catchment Size and Rainfall Characteristics ............................................................... 13 Diverter Chamber Drain ............................................................................................... 14
METHODS AND PROCEDURES .................................................................................. 16
Test Apparatus .............................................................................................................. 16 First Flush Diverters ..................................................................................................... 18 Testing Scenarios ......................................................................................................... 23 Flow Control and Testing Equipment .......................................................................... 29 Sampling Protocol ........................................................................................................ 30
ANALYSIS AND RESULTS .......................................................................................... 31
Statistical Analysis ....................................................................................................... 31
vii
Page
Confidence Intervals .................................................................................................... 34 Diverter A ..................................................................................................................... 35 Diverter B ..................................................................................................................... 37 Diverter C ..................................................................................................................... 40 Diverter D ..................................................................................................................... 44 Diverter E ..................................................................................................................... 47 Diverter F ..................................................................................................................... 49 Diverter Chamber Drain Open ..................................................................................... 52
DISCUSSION .................................................................................................................. 55
Comparison of 10.16 and 15.24 cm Diameter Diverter Chambers .............................. 56 Comparison of Upward and Downward Oriented Sanitary Tees as Transition Fittings ... 65 Comparison of Four Transition Fittings ....................................................................... 73 Observation of Recommended First Flush Diversion Volumes ................................... 81 Rainfall Characteristics ................................................................................................ 82
CONCLUSIONS .............................................................................................................. 84
FUTURE RESEARCH .................................................................................................... 86
REFERENCES ................................................................................................................. 87
APPENDIX A .................................................................................................................. 92
APPENDIX B ................................................................................................................ 140
VITA .............................................................................................................................. 182

viii
LIST OF FIGURES
Page
Figure 1. Diagram and basic components of a downspout first flush diverter. ... 12 Figure 2. Applicable region for various SCS Type curves. ................................. 13 Figure 3. Downspout first flush diverter mounted on the test stand. ................... 16 Figure 4. Six downspout first flush diverter configurations utilized for
experiments ......................................................................................... 20 Figure 5. Diverter chamber sampling port locations relative to the diverter
chamber to downspout transition fitting .............................................. 23 Figure 6. 2.5, 5.1, 10.2, and 20.3 cm SCS storm curve generated storm events
for Austin, Texas ................................................................................. 25 Figure 7. Diverter A’s relationship between the mean total dissolved solids
concentration and location of sampling ports in the diverter chamber at various flow rates with a closed diverter chamber drain ................. 35
Figure 8. Diverter B’s relationship between the mean total dissolved solids
concentration and location of sampling ports in the diverter chamber at various flow rates with a closed diverter chamber drain. ................ 38
Figure 9. Diverter C’s relationship between the mean total dissolved solids
concentration and location of sampling ports in the diverter chamber at various flow rates with a closed diverter chamber drain ................. 41
Figure 10. Diverter D’s relationship between the mean total dissolved solids
concentration and location of sampling ports in the diverter chamber at various flow rates with a closed diverter chamber drain .. 44
Figure 11. Diverter E’s relationship between the mean total dissolved solids
concentration and location of sampling ports in the diverter chamber at various flow rates with a closed diverter chamber drain .. 47

ix
Page Figure 12. Diverter F’s relationship between the mean total dissolved solids
concentration and location of sampling ports in the diverter chamber at various flow rates with a closed diverter chamber drain .. 50
Figure 13. Comparison of the mean differences in initial and final total
dissolved solids concentration in two 10.16 cm (left) and two 15.24 cm (right) diverter chambers at a flow rate of 0.76 L/min ................ 57
Figure 14. Comparison of the mean differences in initial and final total
dissolved solids concentration in two 10.16 cm (left) and two 15.24 cm (right) diverter chambers at a flow rate of 1.51 L/min ................ 57
Figure 15. Comparison of the mean differences in initial and final total
dissolved solids concentration in two 10.16 cm (left) and two 15.24 cm (right) diverter chambers at a flow rate of 3.03 L/min ................ 58
Figure 16. Comparison of the mean differences in initial and final total
dissolved solids concentration in two 10.16 cm (left) and two 15.24 cm (right) diverter chambers at a flow rate of 12.11 L/min .............. 59
Figure 17. Comparison of the mean differences in initial and final total
dissolved solids concentration in two 10.16 cm (left) and two 15.24 cm (right) diverter chambers at a flow rate of 22.71 L/min .............. 60
Figure 18. Comparison of the mean differences in initial and final total
dissolved solids concentration in two 10.16 cm (left) and two 15.24 cm (right) diverter chambers at a flow rate of 43.91 L/min .............. 61
Figure 19. Comparison of the mean differences in initial and final total
dissolved solids concentration in two 10.16 cm (left) and two 15.24 cm (right) diverter chambers at a flow rate of 75.71 L/min .............. 62
Figure 20. Comparison of the mean differences in initial and final total
dissolved solids concentration in two 10.16 cm (left) and two 15.24 cm (right) diverter chambers at a flow rate of 113.56 L/min ............ 63
Figure 21. Comparison of the mean differences in initial and final total
dissolved solids concentration in four downspout first flush diverters utilizing two downward oriented (left) and two upward oriented (right) sanitary tees at a flow rate of 0.76 L/min ................. 65

x
Page Figure 22. Comparison of the mean differences in initial and final total
dissolved solids concentration in four downspout first flush diverters utilizing two downward oriented (left) and two upward oriented (right) sanitary tees at a flow rate of 1.51 L/min ................. 66
Figure 23. Comparison of the mean differences in initial and final total
dissolved solids concentration in four downspout first flush diverters utilizing two downward oriented (left) and two upward oriented (right) sanitary tees at a flow rate of 3.03 L/min ................. 67
Figure 24. Comparison of the mean differences in initial and final total
dissolved solids concentration in four downspout first flush diverters utilizing two downward oriented (left) and two upward oriented (right) sanitary tees at a flow rate of 12.11 L/min ............... 68
Figure 25. Comparison of the mean differences in initial and final total
dissolved solids concentration in four downspout first flush diverters utilizing two downward oriented (left) and two upward oriented (right) sanitary tees at a flow rate of 22.71 L/min ............... 69
Figure 26. Comparison of the mean differences in initial and final total
dissolved solids concentration in four downspout first flush diverters utilizing two downward oriented (left) and two upward oriented (right) sanitary tees at a flow rate of 43.91 L/min ............... 70
Figure 27. Comparison of the mean differences in initial and final total
dissolved solids concentration in four downspout first flush diverters utilizing two downward oriented (left) and two upward oriented (right) sanitary tees at a flow rate of 75.71 L/min ............... 71
Figure 28. Comparison of the mean differences in initial and final total
dissolved solids concentration in four downspout first flush diverters utilizing two downward oriented (left) and two upward oriented (right) sanitary tees at a flow rate of 113.56 L/min ............. 72
Figure 29. Comparison of the mean differences in initial and final total
dissolved solids concentration in four downspout first flush diverters with a 10.16 cm diverter chamber at a flow rate of 0.76 L/min ................................................................................................. 73

xi
Page Figure 30. Comparison of the mean differences in initial and final total
dissolved solids concentration in four downspout first flush diverters with a 10.16 cm diverter chamber at a flow rate of 1.51 L/min ................................................................................................. 74
Figure 31. Comparison of the mean differences in initial and final total
dissolved solids concentration in four downspout first flush diverters with a 10.16 cm diverter chamber at a flow rate of 3.03 L/min ................................................................................................. 75
Figure 32. Comparison of the mean differences in initial and final total
dissolved solids concentration in four downspout first flush diverters with a 10.16 cm diverter chamber at a flow rate of 12.11 L/min ................................................................................................. 76
Figure 33. Comparison of the mean differences in initial and final total
dissolved solids concentration in four downspout first flush diverters with a 10.16 cm diverter chamber at a flow rate of 22.71 L/min ................................................................................................. 77
Figure 34. Comparison of the mean differences in initial and final total
dissolved solids concentration in four downspout first flush diverters with a 10.16 cm diverter chamber at a flow rate of 43.91 L/min ................................................................................................. 78
Figure 35. Comparison of the mean differences in initial and final total
dissolved solids concentration in four downspout first flush diverters with a 10.16 cm diverter chamber at a flow rate of 75.71 L/min ................................................................................................. 79
Figure 36. Comparison of the mean differences in initial and final total
dissolved solids concentration in four downspout first flush diverters with a 10.16 cm diverter chamber at a flow rate of 113.56 L/min ................................................................................................. 80

xii
LIST OF TABLES
Page
Table 1. Various recommended first flush diversion volumes for rainwater harvesting systems. .............................................................................. 11
Table 2. Sizing of gutters based on a 20.9 mm per meter slope ......................... 17 Table 3. Sizing roof drain, leaders, and vertical rainwater piping ..................... 18 Table 4. Diverter chamber volumes of the various downspout first flush
diverter configurations ........................................................................ 21 Table 5. Coordinates for SCS Type III curve ..................................................... 24 Table 6. SCS storm curve generated rainfall rates for various 9 hour storm
events in Austin, TX and corresponding runoff flow rates to simulate the storms based on a 93 square meter catchment area ........ 26
Table 7. Experimental flow rates tested in each downspout first flush diverter
configuration ....................................................................................... 27 Table 8. Statistical model characteristics for diverter configurations A, B, D,
and E ................................................................................................... 32 Table 9. Analysis of variance for diverter configurations A, B, D, and E ......... 32 Table 10. Statistical model characteristics for diverter configurations C, D, E,
and F ................................................................................................... 33 Table 11. Analysis of variance for diverter configurations C, D, E, and F ........ 33 Table 12. Mean differences in initial and final total dissolved solids
concentrations at various sample port locations in diverter A’s diverter chamber at experimental flow rates presented with 95% confidence intervals ............................................................................ 36
Table 13. Mean differences in initial and final total dissolved solids concentrations at various sample port locations in diverter B’s diverter chamber at experimental flow rates presented with 95% confidence intervals ............................................................................ 39
xiii
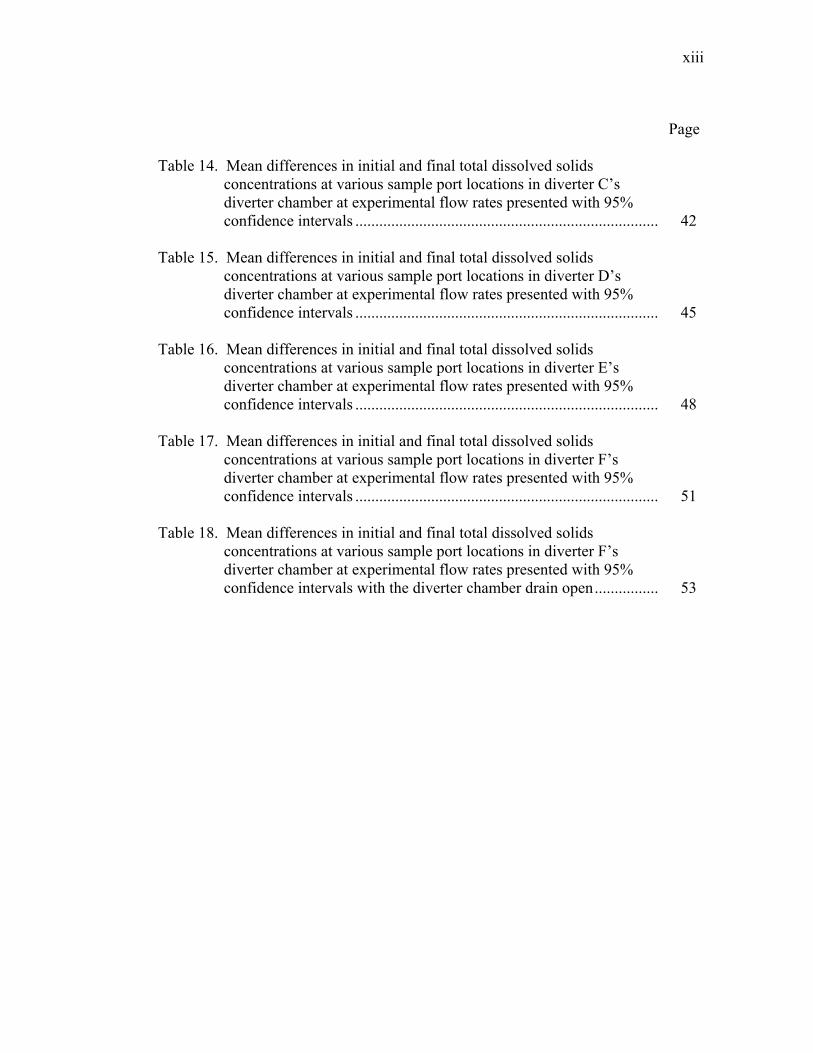
Page Table 14. Mean differences in initial and final total dissolved solids
concentrations at various sample port locations in diverter C’s diverter chamber at experimental flow rates presented with 95% confidence intervals ............................................................................ 42
Table 15. Mean differences in initial and final total dissolved solids
concentrations at various sample port locations in diverter D’s diverter chamber at experimental flow rates presented with 95% confidence intervals ............................................................................ 45
Table 16. Mean differences in initial and final total dissolved solids
concentrations at various sample port locations in diverter E’s diverter chamber at experimental flow rates presented with 95% confidence intervals ............................................................................ 48
Table 17. Mean differences in initial and final total dissolved solids
concentrations at various sample port locations in diverter F’s diverter chamber at experimental flow rates presented with 95% confidence intervals ............................................................................ 51
Table 18. Mean differences in initial and final total dissolved solids
concentrations at various sample port locations in diverter F’s diverter chamber at experimental flow rates presented with 95% confidence intervals with the diverter chamber drain open ................ 53

1
INTRODUCTION
As the world population increases, the demand increases for quality drinking
water. Surface and groundwater resources are being utilized faster than they can be
recharged. Rainwater harvesting is an old practice that is being adopted by many nations
as a viable decentralized water source. Individual rainwater harvesting systems are one
of the many tools to meeting the growing water demand. Abbott (2008) stated that
rainwater harvesting is an environmentally sound solution to address issues brought forth
by large projects utilizing centralized water management approaches. Population growth
all over the world is causing similar problems and concerns of how to supply quality
water to all. This problem is demonstrated by cities like Las Vegas, Nevada, Tuscon,
Arizona, and Los Angeles, California where population is growing even though water
resources are scarce.
According to Kim et al. (2005), rainwater harvesting may be one of the best
methods available to recovering the natural hydrologic cycle and enabling urban
development to become sustainable. The harvesting of rainwater has the potential to
assist in alleviating pressures on current water supplies and storm water drainage
systems. Alleviation of pressure on storm water drainage systems occurs as a result of
rainwater harvesting due to the fact that rain falling on the impervious surfaces is being
_________________________ This thesis follows the style of Applied Engineering in Agriculture.

2
captured and utilized instead of causing immediate runoff.
Rainwater collection has the potential to impact many people in the world. In the
Texas Rainwater Harvesting Evaluation Committee’s report to the 80th Legislature,
Rainwater Harvesting Potential and Guidelines for Texas (2006), it was stated that if
10% of the roof surfaces in Texas collected their rainwater, it would accumulate to
approximately 38 billion gallons per year. The United States of America is behind
countries such as Germany, Denmark, Japan, India, and Australia, who lead the world in
the number of rainwater harvesting systems serving individual houses.
While the number of rainwater harvesting systems is growing in Texas, there is
not a comprehensive set of guidelines that governs or regulates the industry or its
products. The Texas Commission on Environmental Quality (TCEQ) as of January 2007
has published a set of minimum guidelines for individual rainwater harvesting systems
that set a base line for design. Lye (1996) states that adoption by the general public and
governing agencies of rainwater as a source of water for use in the home has been
slowed due to a lack of knowledge regarding the quality of roof captured runoff.
Multiple studies around the world have indicated that chemical and microbial
contamination of rooftop rainwater harvesting systems is common (Polkowska et al.,
2002; Simmons et al., 2001; Magyar et al., 2007; Melidis, 2007; Lye, 2002; Evans,
2006). If individual rainwater harvesting systems in Texas are going to fall in to the
private water supply category, individuals relying on rainwater for in-home use must
consider the risk and assume reasonable and necessary precautions. The precautions
should be enacted to ensure that the household and any visitors are protected from

3
contaminated water. Individuals with weak immune systems such as children, the
elderly, and individuals with health problems will be at the highest risk of problems
associated with contaminated water. While a healthy individual may be able to tolerate
certain levels of constituents in drinking water, those with weakened immune systems
will be susceptible to serious health problems related to bacteria, viruses, parasites, or
chemical contaminants.
The current literature regarding the quality of rainwater harvested from rooftop
surfaces is in agreement that multiple constituents have the opportunity to be present in
collected rainwater. All rainwater harvesting systems are at risk for different
contaminants based on location, design, construction, operation, and maintenance.
While a portion of the contaminants are picked up by the rain droplets falling through
the atmosphere, the majority of impurities are picked up by the rainwater from their
deposition on collection surfaces.
Prior to the storage of harvested rainwater, screening and diversion are the
primary techniques utilized for improving the raw water quality. Improvement in the
quality of stored raw water decreases the treatment needed by the water to bring it up to
potable water standards. Screening has been implemented in many locations along the
collection and piping system. Screens are commonly located on gutters, downspouts,
and along conveyance piping.
Diversion of a portion of the collected water away from storage is a technique
used to improve harvested rainwater quality prior to storage. Diversion can occur at the
downspout or along the collection piping. It has been documented that the first volume

4
of runoff from a storm event has the highest concentrations of contaminants as
catchment and conveyances surfaces are washed by the initial flow of rainwater
(Coombes et al., 2000 and Kim et al., 2005). Historically the action of diverting this first
portion of runoff that has the highest concentrations was completed by manually moving
the downspout from a diversion position to a location leading to storage during the
rainfall event. This technique required the individual to determine when ample water
was diverted and then physically move the downspout, directing water into the storage
container. Today, devices that perform the same function have been designed to operate
with limited interaction or automatically, with periodic maintenance. The devices that
are utilized to divert water are commonly referred to as first flush diverters or roof
washers. While these terms are used interchangeably in industry practice, this paper will
refer to them as first flush diverters.
The first flush diverter is a device that collects the first portion of runoff from a
rooftop rainwater collection system and diverts it away from the rainwater storage
system. The Mid-West Plan Service Private Water Systems Handbook (1979) states that
“A roof washer traps the first flow of dirty water off the roof.” The diverted water is
discarded or used in applications that do not require high quality water. Currently design
guidelines for first flush diverters are based on diversion volume and do not take into
consideration the catchment location or the diverter type or style. The catchment
location determines the type of rainfall events that the diverter will be exposed to.
Rainfall events of differing intensities and patterns affect the flow of water to the
diverter.

5
A preliminary study evaluated the effectiveness of utilizing a continuous drain to
empty the diverter chamber on the downspout first flush diverter as a maintenance
technique and its applicability in various rainfall conditions. The primary study
evaluated the influence of flow rate, diverter chamber diameter, and diverter chamber to
downspout transition fitting on the movement of contaminants within a downspout first
flush diverter.

6
RESEARCH OBJECTIVES
The goal of this study is to understand the influence of flow rate, diverter
chamber diameter, and diverter chamber to downspout transition fitting on the
movement of contaminants within a downspout first flush diverter. This goal will be
met by addressing the four listed research objectives.
Objective 1:
Determine, at various flow rates, the influence of diverter chamber to downspout
transition fittings on the difference in initial and final TDS concentrations in the diverter
chamber of a downspout first flush diverter at multiple sample ports.
Objective 2:
Determine, at various flow rates, the influence of diverter chamber diameters on the
difference in initial and final TDS concentrations in the diverter chamber of a downspout
first flush diverter at multiple sample ports.
Objective 3:
Evaluate, at various flow rates, the impact of utilizing a floating barrier in a downspout
first flush diverter on the difference in initial and final TDS concentrations in the
diverter chamber at multiple sample ports.
Objective 4:
Evaluate, at various flow rates, the influence of utilizing a drain on a downspout first
flush diverter in relation to the difference in initial and final TDS concentrations in the
diverter chamber at multiple sample ports.

7
LITERATURE REVIEW
The Mid-West Plan Service (1979) and the Draft American Rainwater
Catchment Systems Association (ARCSA) Rainwater Catchment Design and Installation
Standards (2008) similarly define a first flush diverter as a device or method of diverting
the first flow of water off the roof and preventing its entry to storage containers. While
first flush diverters are recommended only as an additional treatment method to reduce
the collection of contaminants entrained in collected rainwater (enHealth, 2004), they
add an additional level of safety to protect water quality. The use of first flush diverters
to improve the quality of collected water has been recommended or presented in multiple
reports and guidance documents (enHealth Council, 2004; Krishna, 2005; Wade, 2003;
MWPS, 1979; Ntale and Moses, 2003; MOH, 2005; Standards Australia, 2006; MOH,
2006; Branz, 2006).
Runoff Water Quality
Understanding the quality of runoff from rooftop surfaces and their potential for
public health concerns reinforces the need for use of a first flush diverter as an additional
level of protection. Microbial contamination and other water quality problems
associated with rainwater harvesting systems are most often derived from the catchment
area, conveyance system, or storage components (Lye, 1996).
Microbial and Viral Contamination
Bacterial and viral contaminants found in collected rainwater can lead to
gastrointestinal, respiratory, blood infections, and stomach ulcers (Koplan et al., 1978;

8
Schlech, 1985; Moore, 1995; Klein, 1991). These contaminants are most likely
transferred to the catchment surface as a result of contact with animals such as birds,
rodents, and insects. Typical, healthy adults tend to tolerate the low levels of bacteria
that are present in properly maintained rainwater harvesting systems (Lye, 1996)
although the effect of these contaminants, just like others, are amplified in the very
young, elderly, and those with weakened immune systems. One-hundred and twenty-
five individual residential rainwater collection systems were sampled by Simmons et al.
(2001) and microbial pathogens such as aeromanas, cryptosporidium, and salmonella
were found in samples.
Massey University in New Zealand conducted a 5 year study of microbial roof
water quality from individual homes (Abbott et al., 2008). The study collected samples
from 560 homes and determined that at least half of the samples exceeded the local
acceptable standards. It was also found that more than 40% of the samples were found
to have heavy fecal contamination (Abbot et al., 2008). In these systems, Abbot et al.
(2008) found evidence that they were poorly maintained, collected water was not
properly disinfected, the conveyance and storage components were poorly designed, and
in most cases, even simple measures were not taken to ensure the quality of the water.
The likely sources of the problems were determined to be deposition of fecal material
and dead animals and insects on the roof, in gutters, and in storage containers.
A study conducted by Abbott, et al. (2006) testing 6 different devices designed to
reduce microbial contamination on 6 different tanks, concluded that a tank linked to a
first flush diverter yielded very low counts of total coli-forms and Escherichia coli

9
during the study. Abbott, et al. (2006) stated that high levels of these constituents were
found in the diverter. This result suggests that first flush diverters are effective in
reducing microbial contamination in stored rainwater.
Chemical Contamination
Many volatile chemical and organic compounds have also been found to be
present in rainwater harvesting systems across the world. Water samples from roof tops
along major transportation routes inside Gdansk, Poland were taken and analyzed for
petroleum hydrocarbons, volatile organohalogen compounds, and various pesticides and
ions (Polkowska et al., 2002). This study revealed that more than half of the samples
taken tested positive for elevated levels of the contaminants in question.
Chemical characteristics of rainwater and rainwater runoff samples in Xanthi,
Greece were collected by Melidis et al. (2007). In order to get a representative sample
of data, ten sites within the city were selected and sampled that represented various land
uses, densities, and traffic volumes. Two years of data and 130 samples were collected.
Although rooftop runoff was found to have higher chemical pollutant levels than that of
the rainwater alone, Melidis et al. (2007) reported that both were below levels set forth
by the Grecian drinking water guidelines.
A study performed by Simmons et al. (2001) found that 14% of 125 rural homes
tested had high levels of lead in their collected rainwater that exceeded New Zealand
standards for drinking water. In the same study, 1% of the sites were found to exceed
zinc guidelines and 2% were found to exceed copper guidelines.

10
First Flush Diversion
Knowing that constituents have the possibility of being present in the collected
rainwater leads to the task of addressing the concern. Kim et al. (2005) and Coombes et
al. (2000) stated that the initial periods of runoff from a rainwater catchment contain the
highest levels of contamination due to constituents being washed off of the roof surfaces.
Due to the fact that the initial periods contain the highest levels of contamination,
diverting this water can reduce the concentration of contaminants in the storage
component of rainwater harvesting systems. Massey University, home to the Rooftop
Water Research Center, has found that there is an increased quality of water in water
tanks that utilize first flush diverters (Abbot et al., 2006). Abbot et al. (2006) utilized a
first flush diverter that employed a floating ball as a barrier to prevent the diverted water
from continuing to flow through the collection system.
First Flush Diversion Volume
While contaminant concentrations have been found to be reduced by first flush
diverters, it is known that microbial contaminants still pass through to the storage
component in concentrations that are not considered safe for potable use (Ruskin et al.,
1992 and Lye, 1991). Recommendations for optimal volumes of first flush water to be
diverted vary greatly. The goal for many of the diversion volumes is to divert enough
water to effectively reduce contaminant loading without substantially decreasing stored
water volumes. Based on current literature there are many suggestions and
recommendations to properly size the volume of first flush diverters (Table 1).

11
Table 1. Various recommended first flush diversion volumes for rainwater harvesting systems.
First flush volume Target criteria Source 0.25 mm typical household Jenkins and Pearson, 1978
0.4-0.8 mm 100 m2 Krishna, 2005 25 L average size roof EnHealth Council, 2004
20-25 L - WHO, 2004 2 mm 100 m2 Wade, 2003 5 L - Yaziz et al., 1989
0.5-1 mm - Gardner et al., 2004 3.5-8.4 mm based on target turbidities Martinson and Thomas, 2004
5.5 mm per m2/ 24 hour period ARCSA, 2008
Many of the recommended diversion volumes are based on rules of thumb due to
the fact that contaminant loading to a rainwater harvesting system varies based on
rainfall characteristics, debris characteristics, catchment location, number of dry days,
catchment area, slope, and material, as well as other site specific variables (Krishna,
2005). Evans et al. (2006) concluded that local weather and environmental conditions
highly influence microbial loading and profiles to rooftop collection systems. Abbot et
al. (2006) also found that bacterial loading was influenced by the orientation of
catchment surfaces to prevailing winds. Evans et al. (2006) and Abbot et al. (2006) are
in agreement that bacterial loading on catchment surfaces facing prevailing winds were
increased.
Downspout First Flush Diverter Configurations
The types of first flush diverters utilized throughout the world vary greatly. First
flush diverters are commercially available, but first flush diverters are commonly
constructed from polyvinylchloride (PVC) pipe and fittings. While there is
12
recommendation and guidance on the volume of water to be diverted, there is not
guidance on their construction or design. Further complicating the issue is the fact that
first flush diverters vary in where they are positioned in the collection system. The first
flush diverters can be located at the downspout or somewhere else along the collection
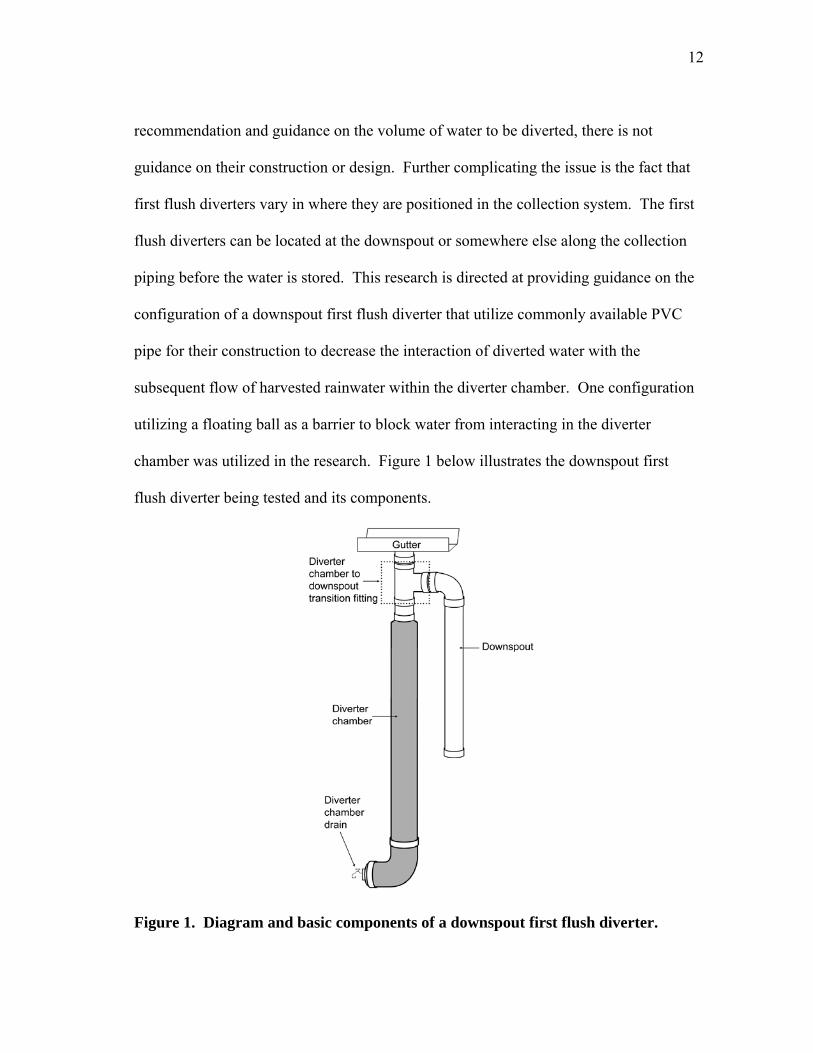
piping before the water is stored. This research is directed at providing guidance on the
configuration of a downspout first flush diverter that utilize commonly available PVC
pipe for their construction to decrease the interaction of diverted water with the
subsequent flow of harvested rainwater within the diverter chamber. One configuration
utilizing a floating ball as a barrier to block water from interacting in the diverter
chamber was utilized in the research. Figure 1 below illustrates the downspout first
flush diverter being tested and its components.
Figure 1. Diagram and basic components of a downspout first flush diverter.

13
Catchment Size and Rainfall Characteristics As previously stated, the size of a catchment and rainfall characteristics play a
role in determining the volume of water that the first flush diverters should divert. These
variables ultimately control the flow rate of collected water interacting with first flush
diverters. The catchment area contributing to the flow of water to the first flush diverter
is typically known or can be altered by altering the collection and diversion system
configuration. The rainfall characteristics such as frequency, volume, and intensity are
highly variable based on geographic location. The Soil Conservation Service, which is
now the Natural Resource Conservation Service, has developed a map of the United
States that is broken down into regional categories of common storm intensity patterns
(Figure 2).
Figure 2. Applicable region for various SCS Type curves (Soil Conservation Service, 1986).

14
The northwestern portion of the United States is shown in Figure 2 to be of type I
rainfall distribution. This designation represents the area with the least intense storm
patterns. According to rainfall data collected from storm events over 25 years from 1973
to 1998 from the National Climate Data Center’s (NCDC) (2009) Seattle Portage Bay,
Washington data collection site, the average storm size was 1.0 centimeters (cm) with a
mean storm intensity of 0.09 centimeters per hour (cph). This varies greatly from other
locations such as New Orleans, Louisiana, which falls in the type III rainfall distribution
category, where the 36 year average (1963-1999) for mean storm depth was 2.1 cm with
a mean intensity of 0.43 cph (NCDC, 2009).
While the rainfall characteristics has been shown to affect the volume of diverted
water in relation to removal of contaminants, the flow rate may also affect the ability of
the diverter to function properly and keep diverted water from interacting with the
subsequent flow of harvested rainwater and being transported to storage. Questions
regarding the impact of flow rate in relation to diverter feasibility in variable locations
are widely asked but largely undocumented. An objective of this research is to evaluate
the influence of flow rate on the downspout first flush diverter’s ability to retain diverted
water.
Diverter Chamber Drain
In order for a first flush diverter to function, the diverter chamber must be empty
at the onset of a rainfall event. The first water that flows off a catchment area during a
rainfall event is diverted from storage and collected in the first flush diverter chamber.
Once the diverter chamber is filled, the remaining runoff from the catchment surface is

15
directed through the diverter chamber to downspout transition fitting to the next step in
the collection process, which is typically storage. At the end of the rainfall event, the
diverter chamber must be emptied to prepare for the next rainfall event. The use of a
continuous drain on a downspout first flush diverter is a maintenance technique that
allows the diverted water to drain between rainfall events without human attention. This
maintenance technique is recommended for first flush diverters (ARCSA, 2008). The
technique is pertinent for systems that will not receive routine maintenance after each
rainfall event. An objective of this research is to evaluate the continuous drain’s
influence on diverter function.

16
METHODS AND PROCEDURES
Test Apparatus
In order to understand the influence of flow rate, diverter chamber diameter, and
diverter chamber to downspout transition fitting on the movement of contaminants
within a downspout first flush diverter, 3 test stands were constructed to hold the
different diverters being tested (Figure 3). The experimental set up was designed to
simulate actual field applications.
Figure 3. Downspout first flush diverter mounted on the test stand.
The frame of the stand was constructed of 3.8 cm metal square tubing. Plywood
was used to cover the frame and mount the gutters and the downspout first flush diverter

17
assembly. Simulated rainwater flows were piped to both ends of each gutter through
PVC pipe and allowed to flow freely through the gutter to the downspout first flush
diverter entrance. The gutter and downspout utilized were selected due to the fact that
they are commonly used in industry, and they meet gutter sizing guidelines (Table 2) and
vertical rainwater piping guidelines (Table 3) set forth by the Uniform Plumbing Code
(UPC) (IAPMO, 2000) for a catchment located in Austin, Texas, and the selected
catchment size of 93 square meters (m2). Austin, Texas, was selected as a reference
location to select system components and experimental conditions. The gutter was a
3.66 meter section of 12.7 cm wide aluminum gutter. The downspout first flush
diverters were located in the center of the gutter and fabricated from 7.62, 10.16, and
15.24 cm schedule (SCH) 40 PVC pipe and fittings. Simulated rain flows through the
gutters were supplied by 2.54 cm SCH 40 PVC pipe.
Table 2. Sizing of gutters based on a 20.9 mm per m slope (highlighted area denotes experiment operating range) (IAPMO, 2000).
Diameter of gutter
Maximum allowable horizontal projected roof areas (square meters) at various rainfall rates
mm 50.8 mm/hr 76.2 mm/hr 101.6 mm/hr 127 mm/hr 152.4mm/hr 80 63.2 42.2 31.6 25.3 29.7
100 133.8 89.2 66.9 53.5 63.2 125 232.3 155.0 116.1 92.9 109.6 150 356.7 237.8 178.4 142.7 171.9 175 512.8 341.9 256.4 204.9 241.4 200 739.5 493.3 369.7 295.4 346.5 250 133.8 891.8 668.9 534.2 618.7

18
Table 3. Sizing roof drain, leaders, and vertical rainwater piping (highlighted area denotes experiment operating range) (IAPMO, 2000). Size of drain,
leader or pipe
Flow Maximum allowable horizontal projected roof areas (square meters) at various rainfall rates
mm L/s 25 mm/hr 50 mm/hr 75 mm/hr 100 mm/hr 125 mm/hr 150 mm/hr 50 1.5 202 101 67 51 40 3480 4.2 600 300 200 150 120 100100 9.1 1286 643 429 321 257 214125 16.5 2334 1117 778 583 467 389150 26.8 3790 1895 1263 948 758 632200 57.6 8175 4088 2725 2044 1635 1363
Notes: 1. The sizing data for vertical conductors, leaders, and drains is based on the pipes flowing 7/24 full. 2. For rainfall rates other than those listed, determine the allowable roof area by dividing the area given in the 25 mm/hour column by the desired rainfall rate. 3. Vertical piping may be round, square, or rectangular. Square pipe shall be sized to enclose its equivalent round pipe. Rectangular pipe shall have at least the same cross-sectional area as its equivalent round pipe, except that the ratio of its side dimensions shall not exceed 3 to 1.
First Flush Diverters
The downspout first flush diverter configurations were custom fabricated and are
commonly used by installers. Six different configurations were tested. Four downspout
first flush diverters utilized a 10.16 cm diameter diverter chamber and 2 utilized a 15.24
cm diameter diverter chamber. All diverters tested utilized 7.62 cm SCH 40 PVC for the
transition fitting from the diverter chamber to the downspout, which carries water past
the diverter chamber once it is full. Configurations of diverters A and D utilized an
upward oriented sanitary tee for the transition fitting from the diverter chamber to the
downspout (Figure 4). Diverter A utilized a 15.24 cm diameter PVC diverter chamber,
and diverter D utilized a 10.16 cm diameter PVC diverter chamber.

19
Configurations of diverters B and E utilized a downward oriented sanitary tee as
the transition fitting from the diverter chamber to the downspout (Figure 4). Diverter B
utilized a 15.24 cm diameter PVC diverter chamber, and diverter E utilized a 10.16 cm
diameter PVC diverter chamber.
Configurations of diverters C and F utilized a straight tee to provide the transition
from the diverter to the downspout (Figure 4). Diverters C and F utilized a 10.16 cm
diameter PVC diverter chamber. Diverter C was selected due to its wide use in
rainwater harvesting system applications in Australia and New Zealand. Diverter C
utilized a floating ball in the diverter chamber to block the diverted water from the water
flowing through the transition fitting. This configuration has been used extensively in
testing of first flush diverters by the Massey University Rooftop Catchment Research
Center in Wellington, New Zealand.
The two 15.24 cm diameter diverters were designed to meet the ARCSA standard
volume for first flush diverters. The recommendation from the Draft ARCSA Rainwater
Catchment Design and Installation Standards (2008) of diverting 5.5 mm/m2 of rainfall

20
Figure 4. Six downspout first flush diverter configurations utilized for experiments.

21
per 24 hour rainfall period was used to determine diverter volume for the two
15.24 cm diameter diverters.
Applying this standard, a diverter capacity of 47.16 liters was targeted for the
15.24 cm diameter diverter chambers tested, based on the selection of a 93 square meter
catchment area being serviced by the diverter. This volume requires that the diverter be
a length of 253 cm of 15.24 cm schedule 40 PVC pipe. The 10.16 cm diameter diverters
tested were also 253 cm long. The actual volumes of each diverter’s diverter chamber
are listed in Table 4.
Table 4. Diverter chamber volumes of the various downspout first flush diverter configurations.
Downspout first flush diverter configuration
Diverter chamber
volume (L) A 47.9 B 47.8 C 20.7 D 20.8 E 20.7 F 20.7
Each diverter chamber was fitted with 7 sampling ports oriented along the
chamber’s vertical axis to enable sampling of water from multiple locations on each
diverter. The top 6 sampling ports were positioned in 30.5 cm increments with the first
port located 30.5 cm below the diverter chamber and downspout transition fitting (Figure
5). The sampling port located at the bottom of the diverter chamber also served as the
diverter chamber drain during the preliminary experiments.

22
While primary experiments were conducted on the downspout first flush
diverters with the diverter chamber drain closed, preliminary experiments were
conducted with the diverter chamber drain open. In order to ensure common drain flow
rates between experiments, each diverter chamber’s bottom sampling port was fitted
with a removable cap that had a 4 millimeter drain hole to allow the diverter to slowly
drain during the preliminary experiments to simulate draining during a rainfall event.
The drain flow rate of each diverter is a function of its standing water column height.
While the theoretical drain flow rates of each diverter were 3.14 liters per minute
(L/min) (Equation 1), the measured flow rates were different. Measured drain flow rates
were measured to be 0.98 L/min. This difference in flow rate is likely due to the
additional friction encountered as the water flows through the diverter chamber drain
valve.
q=11.79*d2*h1/2 Equation 1
Where: q= orifice flow rate (gpm)
d= orifice diameter (in)
h= head (ft)

23
Figure 5. Diverter chamber sampling port locations relative to the diverter chamber to downspout transition fitting.
Testing Scenarios Supply Flow Rates
Flow rates run through the first flush diverters were selected based on model
storm events in Austin, Texas, using rainfall data from the NOAA’s Austin Bergstrom
Airport collection site. Selected flow rate ranges were determined by analyzing
NOAA’s National Climate Data Center (NCDC) rainfall data from storm events over 57
years from 1942 to 1999 (2009). Based on the NCDC data, the mean storm duration for
Austin was 9 hours, the mean storm size is 1.8 cm, and the mean intensity of a storm
event is 0.25 centimeters per hour (cph).

24
In order to determine reasonable flow rates from the modeled storms to be used
in the experiments, representative storms were modeled according to the Soil
Conservation Service (SCS) rainfall pattern method (1973). The NOAA data summary
was utilized to develop four representative storms for the Austin area. The SCS rainfall
pattern selection divides rainfall events into incremental time steps with varying
intensities that simulate an actual storm event. Selected storm sizes to model were 2.5,
5.1, 10.2, and 20.3 cm. The incremental flows for each time step were developed based
on the coordinates for the SCS type curve for a Type III curve (Table 5). The selection
of a Type III curve was based on Austin’s geographic location within the SCS’s map of
regional common storm intensity patterns (Figure 2).
Table 5. Coordinates for SCS Type III curve (Haan et al., 1994). Time (hrs) P/P24
7.50 0.10 8.00 0.11 8.50 0.13 9.00 0.15 9.50 0.17 10.00 0.19 10.50 0.22 11.00 0.25 11.50 0.30 12.00 0.50 12.50 0.70 13.00 0.75 13.50 0.78 14.00 0.81 14.50 0.83 15.00 0.85 15.50 0.87 16.00 0.89 16.50 0.90

25
The ordinates of the Type III curve were multiplied by the desired 24 hour storm
size to obtain an estimated rainfall depth. The differences of these depths were then
obtained and divided by the time step to represent the incremental rainfall intensity for
the denoted time period. Figure 6 below illustrates the cumulative SCS storm curves
generated.
Figure 6. 2.5, 5.1, 10.2, and 20.3 cm SCS storm curve generated storm events for Austin, Texas.
The modeled storm durations were selected to be 9 hours based on the calculated
mean storm duration of the Austin, Texas, data collection site. The 2.5 cm storm event
was selected due to the fact that the 9 hour SCS simulation of this event produces 2 cm

26
of runoff, which is near the mean storm depth of 1.8 cm. The 10.2 and 20.3 cm storm
events were selected due to the fact that respectively, they are the 2- and 25-year 24 hour
rainfall storm events for Austin. Time steps in the storm were selected to be 30 minutes.
Simulated rainfall rates and their corresponding runoff flow rates from the storm events
on a 93 square meter catchment area are detailed in Table 6.
Table 6. SCS Storm Curve generated rainfall rates for various 9 hour storm events in Austin, TX and corresponding runoff flow rates to simulate the storms based on a 93 square meter catchment area.
Storm event time
2.5 cm storm event flow rate
5.1 cm storm event flow rate
10.2 cm storm event flow rate
20.3 cm storm event flow rate
(hrs) (cm/hr) (L/min) (cm/hr) (L/min) (cm/hr) (L/min) (cm/hr) (L/min) 0.0 0.0 0.0 0.0 0.0 0.0 0.0 0.0 0.0 0.5 0.1 0.9 0.1 1.9 0.2 3.8 0.5 7.5 1.0 0.1 1.1 0.1 2.2 0.3 4.4 0.6 8.8 1.5 0.1 1.4 0.2 2.8 0.4 5.7 0.7 11.3 2.0 0.1 1.6 0.2 3.1 0.4 6.3 0.8 12.6 2.5 0.1 1.8 0.2 3.6 0.5 7.2 0.9 14.5 3.0 0.1 2.2 0.3 4.4 0.6 8.8 1.1 17.6 3.5 0.2 2.6 0.3 5.2 0.7 10.4 1.3 20.8 4.0 0.2 3.8 0.5 7.5 1.0 15.1 2.0 30.2 4.5 1.0 15.9 2.1 31.8 4.1 63.5 8.2 127.0 5.0 1.0 15.9 2.1 31.8 4.1 63.5 8.2 127.0 5.5 0.2 3.8 0.5 7.5 1.0 15.1 2.0 30.2 6.0 0.2 2.6 0.3 5.2 0.7 10.4 1.3 20.8 6.5 0.1 2.2 0.3 4.4 0.6 8.8 1.1 17.6 7.0 0.1 1.8 0.2 3.6 0.5 7.2 0.9 14.5 7.5 0.1 1.6 0.2 3.1 0.4 6.3 0.8 12.6 8.0 0.1 1.4 0.2 2.8 0.4 5.7 0.7 11.3 8.5 0.1 1.1 0.1 2.2 0.3 4.4 0.6 8.8 9.0 0.1 0.9 0.1 1.9 0.2 3.8 0.5 7.5
In order to effectively represent the range of flows generated from the storms,
test flow rates ranged from 0.76 to 113.56 liters per minute (L/min) (Table 7). While the

27
flow rates were selected to represent the simulated storm events on the selected
catchment area of 93 square meters, the data and results obtained in this study from these
flow rates can be utilized for other storm events and catchment sizes. Due to the fact
that testing was based on flow rates, collected data at the flow rates can be equated to
various rainfall rates and catchment area sizes. For example, the 0.76 L/min flow rate
comparable to both a rainfall rate of 0.5 cph on a catchment area of 93 square meters and
a rainfall rate of 1.0 cph on a catchment area of 46.5 square meters.
Table 7. Experimental flow rates tested in each downspout first flush diverter configuration.
Flow rates (L/min)0.76 1.51 3.03 12.11 22.71 43.91 75.71 113.56
Downspout First Flush Diverter Testing Configurations
Results from the comparison of the diverter configurations with differing diverter
to downspout transition fittings will be utilized to address the first objective. That
objective is to determine, at the various flow rates, the effect of the diverter chamber to
downspout transition fitting on the change in total dissolved solids (TDS) in the diverter
chamber at multiple sample ports.

28
Results collected based on comparison of the diverter configurations with
differing diverter chamber diameters will be utilized to address the second objective.
That objective is to determine, at various flow rates, the effect of diverter chamber
diameter on the change in TDS in the diverter chamber of a downspout first flush
diverter at multiple sample locations.
Results collected based on comparison of the diverter configuration utilizing a
floating ball in the diverter chamber as a barrier to other diverter configurations without
the floating ball were utilized to address the third objective. That objective is to
evaluate, at various flow rates the impact of utilizing a floating ball as a barrier in the
diverter chamber of a downspout first flush diverter on the interaction of diverted water
with the subsequent flow of collected water.
The downspout first flush diverters were tested with the diverter chamber drain
open and closed. The collection and analysis of the preliminary data aided in addressing
the fourth objective of this research, the impact of utilizing a drain on a downspout first
flush diverter in relation to the change in TDS in the diverter chamber.
While each experimental flow rates was tested on each diverter with the drain
valve closed, all flow rates, except for 0.76 L/min, were run during preliminary
experiments with the drain valve open. The 0.76 L/min flow rate was omitted due to the
fact that the diverter chamber drain flow rate was greater than this resulting in no flow
through the downspout.
29
Flow Control and Testing Equipment
In order to provide the needed flow of water for the experiments, two different
pumps were used to produce the range of flow rates necessary. Pump A, a SHURflo
Power Twin Model #4111-035, was used to produce flows ranging from 0.76 to 43.91
L/min. Pump B, a 5.1 cm Banjo self priming pump powered by a Briggs and Stratton 6
horsepower engine, mounted on a 3,785 liter water trailer was used to produce flows of
75.71 and 113.65 L/min. Flow rates were controlled and adjusted by brass gate valves.
An 11,356 liter fiberglass tank was utilized to supply sufficient water to pump A and a
3,785 liter fiberglass tank mounted on a trailer was utilized to supply pump B. During
experiments with the lower range of flow rates that utilized pump A, up to 3 pumps were
utilized to supply 3 experiments concurrently. During experiments at the larger flow
rates that utilized pump B, only 1 experiment was conducted at a time to allow an
adequate supply of water in the tank to be maintained. Flow rates were measured by 2
different flow meters to accurately measure the wide range of flows in the experiment.
Flow meter A, an Omega FPR 303 low flow meter with an Omega DPF701 controller,
was utilized to monitor flow rates ranging from 0.76 to 43.91 L/min. This flow meter
has an accuracy of ±1% of the meter reading. Flow meter B, a GPI Industrial turbine
meter Model 10, was utilized to monitor flows from 75.71 to 113.56 L/min. This flow
meter has an accuracy of ±1.5% of the meter reading.
An Omega Model CDH-287 conductivity meter along with a CDE-5001-GD1
glass dip probe (K=1.0) with an ATC sensor was utilized in collecting electrical

30
conductivity, total dissolved solids, saline concentration, and temperature of each
sample. This meter’s TDS accuracy was rated at ± 0.3% of the meter reading.
Sampling Protocol
The purpose of the experiment was to evaluate the influence of flow rate, diverter
chamber diameter, and transition fitting on the movement of contaminants within a
downspout first flush diverter. In order to do so, prior to the start of each experiment,
the diverter chamber of each downspout first flush diverter was filled with a known
concentrated solution of saline water. The saline water solution was produced by mixing
table salt (sodium chloride) into tap water at a rate to achieve a total dissolved solids
(TDS) level of approximately 29.3 grams per liter. Tap water was utilized during the
experiment to simulate rain flows. The tap water had a TDS level of 0.6-0.8 grams per
liter throughout the experiment. Once the experiment was run, the difference in the
initial and final TDS concentration in the diverter chambers was recorded at 7 different
sampling ports oriented vertically along the length of the diverter chamber. Experiments
were replicated three times to account for variability in the collected data. The initial
TDS concentrations are denoted by collection at time equals 0 minutes and final TDS
concentrations are denoted by collection at time equals 30 minutes. The differences in
the initial and final TDS concentration values collected at each sampling port were used
to give insight to the mixing regime within each diverter.

31
ANALYSIS AND RESULTS
Statistical Analysis Analysis of Variance
The differences in initial and final TDS concentrations determined at each
sample port, of each experiment, were used to determine the decrease in TDS due to the
various treatments and variations of downspout first flush diverters. Experiments were
replicated 3 times to account for variation in the collected data. In order to facilitate
comparison of collected data, two separate general linear models were developed. The
SAS Version 9.2 statistical package was utilized in the development of the general linear
models.
The first general linear model was developed for diverter configurations A, B, D,
and E. This model was constructed to analyze the influence of flow rate, diverter
chamber diameter, diverter chamber to downspout transition fitting, and port location,
which is nested within the other classes, on the difference between initial and final TDS
concentrations at each sample port. The transition fitting values were an upward and
downward oriented sanitary tee. The diverter chamber diameter values were 10.16 and
15.24 cm. The flow rate values were 0.76, 1.51, 3.03, 12.11, 22.71, 43.91, 75.71, and
113.56 L/min. The sampling port locations were ports 1 through 7. There were three
replications for each experiment. The general linear model for comparing downspout
diverter configurations A, B, D, and E had an R-square value of 0.937. Table 8 below
details the statistical model characteristics.

32
Table 8. Statistical model characteristics for diverter configurations A, B, D, and E.
Source Degrees of freedom
Sum of squares
Mean square F-value Pr > F
Model 223 39754 178.3 29.8 <0.0001 Error 448 2681 6.0
Corrected total 671 42435
The analysis of variance (ANOVA) table for the first general linear model is
summarized in Table 9 below. Due to the significance of the most complex source
interactions, the only conclusion that can be made is that all the variables vary together.
Table 9. Analysis of variance for diverter configurations A, B, D, and E.
Source* Degrees of freedom
Type I sum of squares
Mean square F-value Pr > F
T 1 6.4 6.4 1.1 0.3016 D 1 1.1 1.1 0.2 0.6637
T x D 1 83.0 83.0 13.9 0.0002 F 7 4040.4 577.2 96.4 <0.0001
T x F 7 162.9 23.3 3.9 0.0004 D x F 7 453.7 64.8 10.8 <0.0001
T x D x F 7 749.0 107.0 17.9 <0.0001 L (T x D x F) 192 34257.6 178.4 29.8 <0.0001
*T= Transition fitting, D= Diverter chamber diameter, F= Flow rate, L= Sample port location
The second general linear model was developed for diverter configurations C, D,
E, and F. This model was constructed to analyze the influence of flow rate, diverter
chamber to downspout transition fitting, and port location, which is nested within the
other classes, on the difference between initial and final TDS concentrations at each
sample port. The transition fitting values were an upward and downward oriented

33
sanitary tee, a straight tee, and a straight tee that utilized a floating ball as a barrier in the
diverter chamber. The flow rate values were 0.76, 1.51, 3.03, 12.11, 22.71, 43.91, 75.71,
and 113.56 L/min. The sampling port locations were ports 1 through 7. There were
three replications for each experiment. The general linear model for comparing
downspout diverter configurations C, D, E, and F had an R-square value of 0.945. Table
10 below details the statistical model characteristics.
Table 10. Statistical model characteristics for diverter configurations C, D, E, and F.
Source Degrees of freedom
Sum of squares
Mean square F-value Pr > F
Model 223 3295 144.8 34.4 <0.0001 Error 448 1886 4.2
Corrected total 671 34181
The ANOVA table for the second general linear model is summarized in Table
11 below. Due to the significance of the most complex source interactions, the only
conclusion that can be made is that all the variables vary together.
Table 11. Analysis of variance for diverter configurations C, D, E, and F.
Source* Degrees of freedom
Type I sum of squares
Mean square F-value Pr > F
T 3 1083.0 361.0 85.8 <0.0001F 7 2421.0 345.9 82.2 <0.0001
T x F 21 945.9 45.0 10.7 <0.0001L (T x F) 192 27845.1 145.0 34.5 <0.0001
*T= Transition fitting, F= Flow rate, L= Sample port location

34
Confidence Intervals
The differences between the initial and final TDS concentrations from each
replicate experiment were averaged to acquire the mean decrease for each experimental
port location. Once the mean and standard deviation of each experiment’s decrease in
TDS was determined, the 95% confidence interval (C.I.) of the decreases was calculated
according to equation 2.
nstXIC n ×±= −1,2/.. α Equation 2
Where: X = mean of sample
s = sample standard deviation
n= sample size
1,2/ −ntα =4.303
α= 0.05
n = 3
The mean decrease in TDS at each sample port and its associated 95%
confidence intervals are presented for each diverter, flow rate, and sampling port
location. The confidence interval determination utilized is designed for small sample
tests assuming a normal distribution. Diverter relationships between TDS and sampling
port location on the diverter chamber, at various flow rates, were determined and are
presented below.

35
Diverter A
Diverter A utilized a 15.24 cm PVC diverter chamber and a 7.62 cm upward
oriented sanitary tee as the transition fitting from the diverter chamber to the downspout.
This configuration with the diverter chamber drain closed displayed larger mean
differences in initial and final TDS in the diverter chamber as flow rate increased (Figure
7). A large mean difference in the initial and final TDS did not occur until the 22.7
L/min flow rate. These differences in TDS only appeared in the upper sampling ports.
Figure 7. Diverter A’s relationship between the mean total dissolved solids concentration and location of sampling ports in the diverter chamber at various flow rates with a closed diverter chamber drain.
The numerical values for diverter A’s mean difference in initial and final TDS
concentrations at various flow rates, along with each set’s 95% confidence interval about
the mean, are presented in Table 12 below.

36
Table 12. Mean differences in initial and final total dissolved solids concentrations at various sample port locations in diverter A’s diverter chamber at experimental flow rates presented with 95% confidence intervals. Flow rate (L/min)
Sample port n Mean TDS
difference (g/L) Lower
limit (g/L) Upper
limit (g/L) Average initial
TDS (g/L)
0.76
1 3 2.3 0* 7.7 29.2
2 3 1.4 0* 4.8 29.2
3 3 1.2 0* 2.9 29.2
4 3 1.4 0* 3.4 29.2
5 3 1.3 0* 3.3 29.2
6 3 0.8 0* 1.9 29.2
7 3 1.1 0.3 2.0 29.2
1.51
1 3 1.0 0* 2.1 29.3
2 3 0.8 0* 2.1 29.3
3 3 0.7 0* 1.6 29.3
4 3 0.6 0.1 1.2 29.3
5 3 0.6 0.1 1.2 29.3
6 3 0.6 0.1 1.1 29.3
7 3 0.7 0* 1.4 29.3
3.03
1 3 1.3 0 2.5 29.1
2 3 0.7 0* 1.5 29.1
3 3 0.5 0* 1.4 29.1
4 3 0.4 0* 1.3 29.1
5 3 0.4 0* 1.1 29.1
6 3 0.4 0* 1.1 29.1
7 3 0.6 0.4 0.8 29.1
12.11
1 3 1.5 0* 4.3 29.3
2 3 0.9 0.4 1.4 29.3
3 3 0.8 0.6 0.9 29.3
4 3 0.7 0.5 0.8 29.3
5 3 0.7 0.7 0.7 29.3
6 3 0.7 0.5 0.8 29.3
7 3 0.5 0* 1.3 29.3
22.71
1 3 27.5 26.9 28.1 29.2
2 3 1.8 1.5 2.1 29.2
3 3 0.8 0.4 1.1 29.2
4 3 0.5 0* 1.3 29.2

37
Table 12. Continued. Flow rate (L/min)
Sample port n Mean TDS
difference (g/L) Lower
limit (g/L) Upper
limit (g/L) Average initial
TDS (g/L)
22.71
5 3 0.5 0* 1.2 29.2
6 3 0.5 0* 1.4 29.2
7 3 0.6 0* 1.6 29.2
43.91
1 3 27.8 27.5 28.2 29.3
2 3 1.1 0.4 1.7 29.3
3 3 0.3 0* 1.0 29.3
4 3 0.2 0* 1.2 29.3
5 3 0.2 0* 0.9 29.3
6 3 0.1 0* 0.9 29.3
7 3 0.4 0* 1.7 29.3
75.71
1 3 27.3 26.5 28.2 29.4
2 3 27.3 26.2 28.4 29.4
3 3 1.5 0.4 2.6 29.4
4 3 1.0 0.3 1.7 29.4
5 3 0.9 0.4 1.5 29.4
6 3 0.9 0.4 1.4 29.4
7 3 1.0 0.7 1.4 29.4
113.56
1 3 27.3 26.2 28.3 29.4
2 3 27.8 27.8 27.8 29.4
3 3 18.3 0* 53.3 29.4
4 3 1.7 0.2 3.3 29.4
5 3 1.4 0.2 2.7 29.4
6 3 1.3 0.1 2.4 29.4
7 3 1.3 0.4 2.1 29.4 *Denotes statistical values that extended beyond the physical limitations of the system that were
truncated to fit within the systems physical dimensions.
Diverter B Diverter B utilized a 15.24 cm diameter PVC diverter chamber and a 7.62 cm
downward oriented sanitary tee as the transition fitting from the diverter chamber to the
downspout. This configuration with the diverter chamber drain closed displayed similar

38
mean differences in initial and final TDS concentration in the diverter chamber at all
sample ports at flow rates of 12.11 L/min and below (Figure 8). A large mean difference
in the initial and final TDS did not occur until the 22.7 L/min flow rate. These
differences in TDS only appeared in the upper sampling ports.
Figure 8. Diverter B’s relationship between the mean total dissolved solids concentration and location of sampling ports in the diverter chamber at various flow rates with a closed diverter chamber drain.
The numerical values for diverter B’s mean difference in initial and final TDS
concentrations at various flow rates, along with each set’s 95% confidence interval about
the mean, are presented in Table 13 below.

39
Table 13. Mean differences in initial and final total dissolved solids concentrations at various sample port locations in diverter B’s diverter chamber at experimental flow rates presented with 95% confidence intervals. Flow rate (L/min)
Sample port n Mean TDS
difference (g/L)Lower
limit (g/L) Upper
limit (g/L) Average initial
TDS (g/L)
0.76
1 3 2.2 0.8 3.7 29.2
2 3 1.5 0* 3.0 29.2
3 3 1.6 1.1 2.2 29.2
4 3 0.7 0.4 1.0 29.2
5 3 1.0 0* 2.8 29.2
6 3 0.7 0.1 1.4 29.2
7 3 0.8 0.7 1.0 29.2
1.51
1 3 0.9 0.6 1.2 29.3
2 3 0.7 0.5 0.9 29.3
3 3 0.6 0* 1.3 29.3
4 3 0.6 0.1 1.1 29.3
5 3 0.6 0.0 1.1 29.3
6 3 0.6 0.0 1.1 29.3
7 3 0.8 0.3 1.4 29.3
3.03
1 3 1.1 0.0 2.1 29.1
2 3 0.8 0* 1.6 29.1
3 3 0.7 0.0 1.3 29.1
4 3 0.6 0.0 1.3 29.1
5 3 0.6 0.2 1.0 29.1
6 3 0.6 0* 1.3 29.1
7 3 1.0 0.2 1.7 29.1
12.11
1 3 1.9 0* 4.0 29.3
2 3 1.3 0.4 2.2 29.3
3 3 1.1 0.9 1.3 29.3
4 3 1.0 0.8 1.2 29.3
5 3 1.0 0.6 1.3 29.3
6 3 0.9 0.7 1.1 29.3
7 3 0.9 0.6 1.2 29.3
22.71
1 3 27.6 27.1 28.1 29.2
2 3 1.6 1.3 2.0 29.2
3 3 1.0 0.6 1.3 29.2
4 3 0.8 0.6 1.0 29.2

40
Table 13. Continued. Flow rate (L/min)
Sample port n Mean TDS
difference (g/L)Lower
limit (g/L) Upper
limit (g/L) Average initial
TDS (g/L)
22.71
5 3 0.7 0.6 0.9 29.2
6 3 0.7 0.7 0.7 29.2
7 3 0.9 0.4 1.4 29.2
43.91
1 3 27.8 27.5 28.2 29.3
2 3 18.9 0* 55.5 29.3
3 3 1.3 0.5 2.0 29.3
4 3 0.7 0.0 1.3 29.3
5 3 0.7 0.3 1.1 29.3
6 3 0.5 0.1 0.8 29.3
7 3 0.5 0* 1.2 29.3
75.71
1 3 27.5 27 28.0 29.4
2 3 10.5 0* 48.1 29.4
3 3 1.2 0* 2.5 29.4
4 3 0.9 0.2 1.6 29.4
5 3 0.8 0.1 1.4 29.4
6 3 0.7 0.1 1.4 29.4
7 3 0.9 0.7 1.0 29.4
113.56
1 3 16.2 3.4 29.1 29.4
2 3 1.9 0.7 3.0 29.4
3 3 1.3 0.6 2.0 29.4
4 3 1.0 0* 2.2 29.4
5 3 1.0 0* 2.6 29.4
6 3 0.6 0* 2.2 29.4
7 3 0.8 0* 2.8 29.4 *Denotes statistical values that extended beyond the physical limitations of the system that were
truncated to fit within the systems physical dimensions.
Diverter C Diverter C utilized a 10.16 cm diameter PVC diverter chamber and a straight
7.62 cm tee as the transition fitting from the diverter chamber to downspout. This
diverter chamber also had a floating ball that floated to the top of the diverter chamber

41
when full to block the diverted water from the water that continued to flow through the
downspout. This configuration with the diverter chamber drain closed displayed
virtually no mean difference in initial and final TDS concentration throughout the range
of flow rates tested at all sample ports (Figure 9). The 22.7 L/min flow rate set had one
test that resulted in a slight difference in initial and final TDS concentration in the
diverter chamber, although this only occurred in one replication at one flow rate. All
other tests in that set and all other flow rates did not display large mean differences in
initial and final TDS concentrations in the diverter chamber at any sample port.
Figure 9. Diverter C’s relationship between the mean total dissolved solids concentration and location of sampling ports in the diverter chamber at various flow rates with a closed diverter chamber drain.
The numerical values for diverter C’s mean difference in initial and final TDS
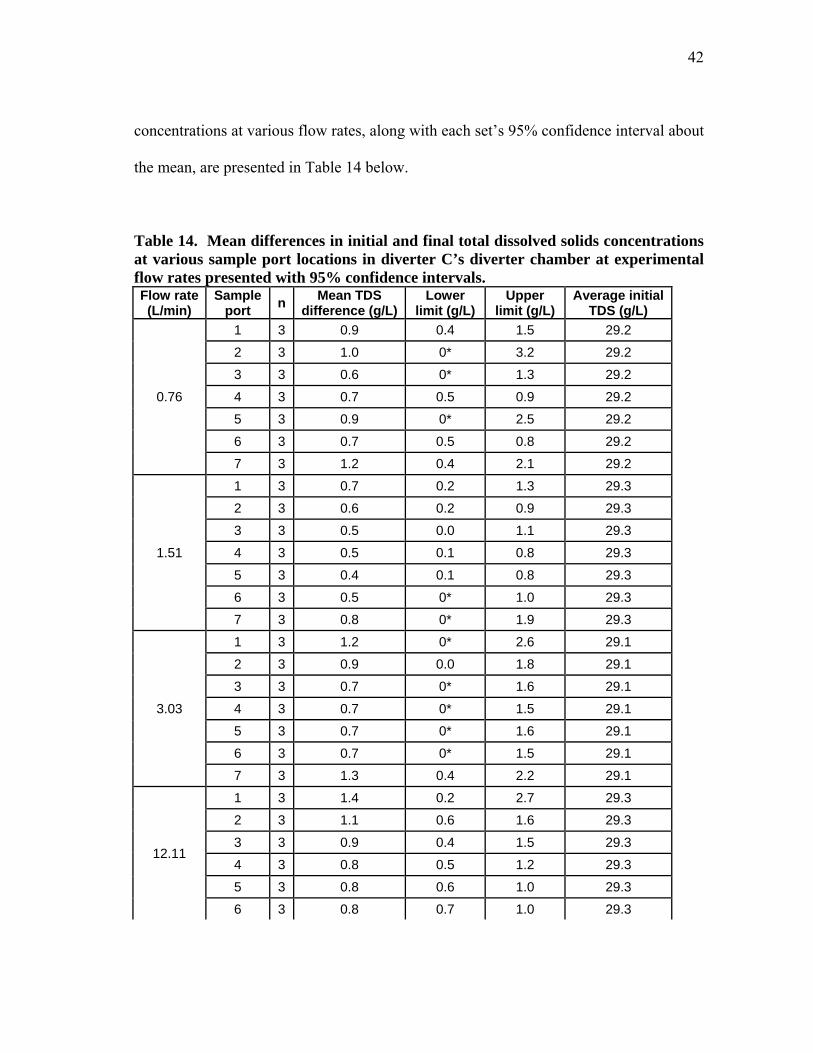
42
concentrations at various flow rates, along with each set’s 95% confidence interval about
the mean, are presented in Table 14 below.
Table 14. Mean differences in initial and final total dissolved solids concentrations at various sample port locations in diverter C’s diverter chamber at experimental flow rates presented with 95% confidence intervals. Flow rate (L/min)
Sample port n Mean TDS
difference (g/L)Lower
limit (g/L) Upper
limit (g/L) Average initial
TDS (g/L)
0.76
1 3 0.9 0.4 1.5 29.2
2 3 1.0 0* 3.2 29.2
3 3 0.6 0* 1.3 29.2
4 3 0.7 0.5 0.9 29.2
5 3 0.9 0* 2.5 29.2
6 3 0.7 0.5 0.8 29.2
7 3 1.2 0.4 2.1 29.2
1.51
1 3 0.7 0.2 1.3 29.3
2 3 0.6 0.2 0.9 29.3
3 3 0.5 0.0 1.1 29.3
4 3 0.5 0.1 0.8 29.3
5 3 0.4 0.1 0.8 29.3
6 3 0.5 0* 1.0 29.3
7 3 0.8 0* 1.9 29.3
3.03
1 3 1.2 0* 2.6 29.1
2 3 0.9 0.0 1.8 29.1
3 3 0.7 0* 1.6 29.1
4 3 0.7 0* 1.5 29.1
5 3 0.7 0* 1.6 29.1
6 3 0.7 0* 1.5 29.1
7 3 1.3 0.4 2.2 29.1
12.11
1 3 1.4 0.2 2.7 29.3
2 3 1.1 0.6 1.6 29.3
3 3 0.9 0.4 1.5 29.3
4 3 0.8 0.5 1.2 29.3
5 3 0.8 0.6 1.0 29.3
6 3 0.8 0.7 1.0 29.3

43
Table 14. Continued. Flow rate (L/min)
Sample port n Mean TDS
difference (g/L)Lower
limit (g/L) Upper
limit (g/L) Average initial
TDS (g/L) 12.11 7 3 0.9 0.8 1.1 29.3
22.71
1 3 3.7 0* 15.1 29.2
2 3 1.0 0.4 1.7 29.2
3 3 0.9 0.6 1.3 29.2
4 3 0.7 0.2 1.3 29.2
5 3 0.8 0.2 1.3 29.2
6 3 0.8 0.2 1.3 29.2
7 3 1.0 0.2 1.8 29.2
43.91
1 3 0.9 0* 2.8 29.3
2 3 0.7 0* 2.3 29.3
3 3 0.7 0* 1.8 29.3
4 3 0.8 0* 2.5 29.3
5 3 0.3 0* 1.2 29.3
6 3 0.4 0* 1.1 29.3
7 3 0.6 0* 1.9 29.3
75.71
1 3 1.1 0* 2.6 29.2
2 3 0.7 0.3 1.1 29.2
3 3 0.7 0.4 1.1 29.2
4 3 0.8 0.2 1.3 29.2
5 3 0.7 0.1 1.4 29.2
6 3 0.8 0.2 1.3 29.2
7 3 1.4 1.2 1.6 29.2
113.56
1 3 1.1 0.1 2.0 29.4
2 3 1.1 0.0 2.2 29.4
3 3 1.1 0.0 2.2 29.4
4 3 1.1 0* 2.4 29.4
5 3 1.1 0* 2.6 29.4
6 3 1.2 0* 2.7 29.4
7 3 1.4 0* 2.7 29.4 *Denotes statistical values that extended beyond the physical limitations of the system that were
truncated to fit within the systems physical dimensions.

44
Diverter D Diverter D utilized a 10.16 cm diameter PVC diverter chamber and a 7.62 cm
upward oriented sanitary tee as the transition fitting from the diverter chamber to the
downspout. This configuration with the diverter chamber drain closed displayed large
mean differences in initial and final TDS concentrations at flow rates of 12.1, 43.9, 75.7,
and 113.6 L/min (Figure 10). Only small mean differences in initial and final TDS
concentrations were observed at flow rates of 3.03 L/min and less. Sample ports 3
through 7 displayed small mean differences in initial and final TDS concentrations at all
flow rates tested.
Figure 10. Diverter D’s relationship between the mean total dissolved solids concentration and location of sampling ports in the diverter chamber at various flow rates with a closed diverter drain.
The numerical values for diverter D’s mean difference in initial and final TDS

45
concentrations at various flow rates, along with each set’s 95% confidence interval about
the mean, are presented in Table 15 below.
Table 15. Mean differences in initial and final total dissolved solids concentrations at various sample port locations in diverter D’s diverter chamber at experimental flow rates presented with 95% confidence intervals. Flow rate (L/min)
Sample port n
Mean TDS difference
(g/L) Lower
limit (g/L) Upper
limit (g/L) Average initial
TDS (g/L)
0.76
1 3 1.5 0.8 2.2 29.1
2 3 0.7 0.5 0.9 29.1
3 3 0.6 0.3 0.9 29.1
4 3 0.7 0.5 0.8 29.1
5 3 0.6 0.3 0.9 29.1
6 3 0.7 0.5 0.9 29.1
7 3 1.0 0.4 1.5 29.1
1.51
1 3 0.7 0* 1.9 29.4
2 3 0.4 0* 1.1 29.4
3 3 0.4 0.2 0.6 29.4
4 3 0.5 0.3 0.7 29.4
5 3 0.5 0.2 0.8 29.4
6 3 0.6 0.4 0.7 29.4
7 3 1.1 0.9 1.2 29.4
3.03
1 3 5.5 0* 19.7 29.3
2 3 0.8 0* 1.6 29.3
3 3 0.5 0* 1.2 29.3
4 3 0.5 0* 1.2 29.3
5 3 0.5 0* 1.1 29.3
6 3 0.5 0.1 0.9 29.3
7 3 1.0 0.2 1.8 29.3
12.11
1 3 23.4 4.9 41.9 29.3
2 3 1.6 0.5 2.8 29.3
3 3 1.0 0.1 1.8 29.3
4 3 0.9 0* 1.9 29.3
5 3 1.0 0.4 1.5 29.3

46
Table 15. Continued. Flow rate (L/min)
Sample port n
Mean TDS difference
(g/L) Lower
limit (g/L) Upper
limit (g/L) Average initial
TDS (g/L)
12.11 6 3 0.9 0.3 1.6 29.3
7 3 1.3 1.1 1.5 29.3
22.71
1 3 18.5 0* 53.3 29
2 3 1.0 0.3 1.7 29
3 3 0.6 0.4 0.8 29
4 3 0.6 0.2 1.0 29
5 3 0.6 0.3 0.9 29
6 3 0.7 0.5 0.8 29
7 3 0.9 0.7 1.1 29
43.91
1 3 27.4 25.7 29 29.2
2 3 17.2 0* 45.8 29.2
3 3 1.4 0.0 2.8 29.2
4 3 1.0 0.3 1.7 29.2
5 3 0.9 0.1 1.6 29.2
6 3 0.8 0.0 1.6 29.2
7 3 1.2 0.2 2.1 29.2
75.71
1 3 27.4 26.8 28.1 29.5
2 3 1.8 0.2 3.4 29.5
3 3 1.2 0* 2.5 29.5
4 3 1.0 0.2 1.7 29.5
5 3 0.8 0.4 1.2 29.5
6 3 0.7 0.4 1.0 29.5
7 3 1.1 0.7 1.4 29.5
113.56
1 3 27.7 26.5 28.9 29.2
2 3 2.1 0* 4.6 29.2
3 3 1.1 0.1 2.1 29.2
4 3 1.0 0.1 1.9 29.2
5 3 1.0 0.0 2.0 29.2
6 3 1.0 0* 2.0 29.2
7 3 1.0 0.3 1.8 29.2 *Denotes statistical values that extended beyond the physical limitations of the system that were
truncated to fit within the systems physical dimensions.

47
Diverter E Diverter E utilized a 10.16 cm diameter PVC diverter chamber and a 7.62 cm
downward oriented sanitary tee as the transition fitting from the diverter chamber to the
downspout. This configuration with the diverter chamber drain closed displayed larger
mean differences in initial and final TDS concentrations in the upper sample ports as
flow rate increased (Figure 11). Only slight mean differences in initial and final TDS
concentrations were observed at flow rates of 3.03 L/min and less.
Figure 11. Diverter E’s relationship between the mean total dissolved solids concentration and location of sampling ports in the diverter chamber at various flow rates with a closed diverter chamber drain.
The numerical values for diverter E’s mean difference in initial and final TDS
concentrations at various flow rates, along with each set’s 95% confidence interval about
the mean, are presented in Table 16 below.

48
Table 16. Mean differences in initial and final total dissolved solids concentrations at various sample port locations in diverter E’s diverter chamber at experimental flow rates presented with 95% confidence intervals. Flow rate (L/min)
Sample port n Mean TDS
difference (g/L)Lower
limit (g/L) Upper
limit (g/L) Average initial
TDS (g/L)
0.76
1 3 1.5 0.3 2.6 29.1
2 3 1.0 0.4 1.5 29.1
3 3 0.8 0.5 1.1 29.1
4 3 0.8 0.6 0.9 29.1
5 3 0.7 0.7 0.7 29.1
6 3 0.7 0.6 0.9 29.1
7 3 0.9 0.8 1.1 29.1
1.51
1 3 1.0 0* 2.4 29.4
2 3 0.6 0* 1.3 29.4
3 3 0.5 0* 1.3 29.4
4 3 0.4 0* 0.9 29.4
5 3 0.3 0.2 0.5 29.4
6 3 0.4 0.1 0.7 29.4
7 3 0.9 0.7 1.0 29.4
3.03
1 3 4.0 0* 13.8 29.3
2 3 0.9 0.2 1.6 29.3
3 3 0.7 0.3 1.0 29.3
4 3 0.5 0.2 0.9 29.3
5 3 0.5 0.4 0.7 29.3
6 3 0.5 0.4 0.7 29.3
7 3 0.9 0.7 1.1 29.3
12.11
1 3 27.5 26.6 28.4 29.3
2 3 1.5 1.3 1.7 29.3
3 3 0.8 0.4 1.1 29.3
4 3 0.8 0.4 1.1 29.3
5 3 0.8 0.4 1.1 29.3
6 3 0.8 0.6 1 29.3
7 3 1.2 0.8 1.6 29.3
22.71
1 3 24.9 13.7 36.1 29
2 3 1.3 1.2 1.5 29
3 3 0.7 0.5 0.8 29
4 3 0.6 0.5 0.8 29

49
Table 16. Continued. Flow rate (L/min)
Sample port n Mean TDS
difference (g/L)Lower
limit (g/L) Upper
limit (g/L) Average initial
TDS (g/L)
22.71
5 3 0.6 0.5 0.8 29
6 3 0.7 0.6 0.9 29
7 3 0.8 0.7 1.0 29
43.91
1 3 27.7 27.1 28.3 29.2
2 3 13.5 0* 47.3 29.2
3 3 0.7 0* 2.0 29.2
4 3 0.6 0* 1.9 29.2
5 3 0.5 0* 1.6 29.2
6 3 0.6 0* 1.5 29.2
7 3 0.8 0.5 1.2 29.2
75.71
1 3 27.6 27 28.2 29.2
2 3 1.5 0.7 2.3 29.2
3 3 0.8 0* 1.7 29.2
4 3 0.8 0* 1.7 29.2
5 3 0.6 0* 1.3 29.2
6 3 0.5 0* 1.2 29.2
7 3 0.8 0.6 1.0 29.2
113.56
1 3 27.5 27.1 28 29.4
2 3 27.8 27.3 28.4 29.4
3 3 1.7 1.3 2.1 29.4
4 3 1.2 0.8 1.5 29.4
5 3 1.1 0.4 1.7 29.4
6 3 1.0 0.3 1.6 29.4
7 3 0.9 0.2 1.5 29.4 *Denotes statistical values that extended beyond the physical limitations of the system that were
truncated to fit within the systems physical dimensions.
Diverter F Diverter F utilized a 10.16 cm diameter PVC diverter chamber and a straight 7.62
cm tee as the transition fitting from the diverter chamber to the downspout. This
configured is similar to diverter C except without the floating ball to block the diverted

50
water from interacting with water that is bypassing the diverter chamber. This diverter
configuration with the diverter chamber drain closed displayed larger mean differences
in initial and final TDS concentrations in the upper sample ports as flow rate increased
(Figure 12). Only slight mean differences in initial and final TDS concentrations were
observed at all sample ports at flow rates of 3.03 L/min and lower.
Figure 12. Diverter F’s relationship between the mean total dissolved solids concentration and location of sampling ports in the diverter chamber at various flow rates with a closed diverter chamber drain.
The numerical values for diverter F’s mean difference in initial and final TDS
concentrations at various flow rates, along with each set’s 95% confidence interval about
the mean, are presented in Table 17 below.

51
Table 17. Mean differences in initial and final total dissolved solids concentrations at various sample port locations in diverter F’s diverter chamber at experimental flow rates presented with 95% confidence intervals. Flow rate (L/min)
Sample port n Mean TDS
difference (g/L)Lower
limit (g/L) Upper
limit (g/L) Average initial
TDS (g/L)
0.76
1 3 1.2 0* 3.4 29.3
2 3 0.9 0* 2.7 29.3
3 3 0.6 0* 2.0 29.3
4 3 0.5 0* 1.7 29.3
5 3 0.6 0* 1.3 29.3
6 3 0.5 0* 1.2 29.3
7 3 0.9 0.3 1.4 29.3
1.51
1 3 1.3 1.0 1.6 29.4
2 3 1.0 0.9 1.2 29.4
3 3 0.8 0.7 1.0 29.4
4 3 0.7 0.6 0.9 29.4
5 3 0.7 0.5 0.9 29.4
6 3 0.7 0.5 0.9 29.4
7 3 1.0 0.8 1.1 29.4
3.03
1 3 1.8 0* 5.7 29.3
2 3 0.9 0* 2.1 29.3
3 3 0.7 0.0 1.4 29.3
4 3 0.6 0.2 1.0 29.3
5 3 0.6 0.2 0.9 29.3
6 3 0.6 0.4 0.8 29.3
7 3 0.9 0.7 1.1 29.3
12.11
1 3 27.4 27.3 27.6 29.2
2 3 1.7 1.3 2.0 29.2
3 3 0.9 0.8 1.1 29.2
4 3 0.8 0.8 0.8 29.2
5 3 0.8 0.6 0.9 29.2
6 3 0.7 0.7 0.7 29.2
7 3 1.0 0.8 1.2 29.2
22.71
1 3 23.2 14.6 31.7 29.3
2 3 1.6 1.4 1.7 29.3
3 3 0.8 0.6 1.0 29.3
4 3 0.7 0.1 1.2 29.3

52
Table 17. Continued. Flow rate (L/min)
Sample port n Mean TDS
difference (g/L)Lower
limit (g/L) Upper
limit (g/L) Average initial
TDS (g/L)
22.71
5 3 0.6 0.0 1.1 29.3
6 3 0.6 0.0 1.1 29.3
7 3 0.9 0.7 1.1 29.3
43.91
1 3 27.9 26.9 28.9 29.5
2 3 10.5 0* 48.3 29.5
3 3 1.2 0.6 1.9 29.5
4 3 1.0 0.8 1.1 29.5
5 3 0.8 0.5 1.1 29.5
6 3 0.8 0.6 1.0 29.5
7 3 1.0 0.8 1.1 29.5
75.71
1 3 27.5 27.3 27.8 29.4
2 3 8.0 0* 18.3 29.4
3 3 1.0 0.7 1.4 29.4
4 3 0.7 0.4 1.0 29.4
5 3 0.7 0.5 0.9 29.4
6 3 0.7 0.5 0.9 29.4
7 3 0.8 0.5 1.2 29.4
113.56
1 3 27.5 26.9 28.1 29.3
2 3 28.0 27.7 28.3 29.3
3 3 3.1 0* 6.4 29.3
4 3 1.0 0.7 1.3 29.3
5 3 0.8 0.7 1.0 29.3
6 3 0.8 0.6 1.0 29.3
7 3 1.0 0.8 1.1 29.3 *Denotes statistical values that extended beyond the physical limitations of the system that were
truncated to fit within the systems physical dimensions.
Diverter Chamber Drain Open
As previously stated a preliminary study evaluated the effectiveness of
utilizing a continuous drain to empty the diverter chamber on the downspout first
flush diverter as a maintenance technique and its applicability in various rainfall

53
conditions. It was found that in this experimental design the diverter chamber
volume and drain flow rate of the diverter chamber controls the resulting mean
differences in initial and final TDS concentrations. Regardless of flow rate or
transition fitting, all results were similar. The observed mean difference found
between the 10.16 and 15.24 cm diameter diverter chambers were only a result of a
difference in initial diversion volume. Table 18 below shows a sample of results
from diverter F with the diverter chamber drain open. All other diverters displayed
similar results with the diverter chamber drain open.
Table 18. Mean differences in initial and final total dissolved solids concentrations at various sample port locations in diverter F’s diverter chamber at experimental flow rates presented with 95% confidence intervals with the diverter chamber drain open. Flow rate (L/min)
Sample port n Mean TDS
difference (g/L)Lower
limit (g/L) Upper
limit (g/L) Average initial
TDS (g/L)
1.51
1 3 28.4 27.4 29.4 29.5
2 3 28.8 28.8 28.9 29.5
3 3 28.9 28.8 28.9 29.5
4 3 28.9 28.8 28.9 29.5
5 3 28.9 28.8 28.9 29.5
6 3 28.8 28.8 28.9 29.5
7 3 23.9 23.1 24.7 29.5
3.03
1 3 28.1 26.9 29.4 29.4
2 3 28.7 28.7 28.8 29.4
3 3 28.8 28.7 28.8 29.4
4 3 28.8 28.7 28.8 29.4
5 3 28.8 28.8 28.8 29.4
6 3 28.8 28.7 28.8 29.4
7 3 24.4 24.2 24.6 29.4
12.11
1 3 28.3 28.2 28.4 29.5
2 3 28.8 28.8 28.9 29.5
3 3 28.9 28.9 28.9 29.5

54
Table 18. Continued. Flow rate (L/min)
Sample port n Mean TDS
difference (g/L)Lower
limit (g/L) Upper
limit (g/L) Average initial
TDS (g/L)
12.11
4 3 28.9 28.8 28.9 29.5
5 3 28.9 28.8 28.9 29.5
6 3 28.9 28.8 28.9 29.5
7 3 23.7 23.6 23.7 29.5
22.71
1 3 28.0 27.3 28.6 29.3
2 3 28.6 28.5 28.7 29.3
3 3 28.6 28.4 28.8 29.3
4 3 28.6 28.5 28.7 29.3
5 3 28.6 28.5 28.8 29.3
6 3 28.6 28.5 28.8 29.3
7 3 24.0 22.5 25.4 29.3
43.91
1 3 27.8 26.7 28.9 29
2 3 28.3 28.2 28.4 29
3 3 28.3 28.2 28.4 29
4 3 28.3 28.2 28.4 29
5 3 28.3 28.1 28.4 29
6 3 28.3 28.2 28.4 29
7 3 23.7 22.6 24.8 29
75.71
1 3 27.9 27.7 28.1 29.1
2 3 28.5 28.4 28.5 29.1
3 3 28.5 28.4 28.6 29.1
4 3 28.5 28.4 28.5 29.1
5 3 28.4 28.3 28.5 29.1
6 3 28.4 28.3 28.5 29.1
7 3 24.3 24.0 24.6 29.1
113.56
1 3 28.6 28.5 28.7 29.3
2 3 28.5 27.9 29.1 29.3
3 3 28.6 28.4 28.8 29.3
4 3 28.7 28.6 28.7 29.3
5 3 28.6 28.6 28.7 29.3
6 3 28.6 28.6 28.7 29.3
7 3 23.2 22.4 23.9 29.3 *Denotes statistical values that extended beyond the physical limitations of the system that were
truncated to fit within the systems physical dimensions.

55
DISCUSSION
Two general linear models were developed to evaluate the results of the
experiments. The differences in the initial and final TDS concentrations at each sample
port location were utilized to evaluate the influence of the various first flush diverter
configurations. The first general linear model, which was developed for diverter
configurations A, B, D, and E, allows us to evaluate the influence of diverter chamber
diameter, diverter chamber to downspout transition fitting, flow rate, and port location,
which is nested, on the difference in initial and final TDS concentrations. The ANOVA
from the first general linear model (Table 9) concluded that all of the variables varied
together. This result does not allow for statistically significant conclusions to be made
on individual variables. It only allows general comparisons between variables, which is
discussed below.
The results from the second general linear model, which was developed for
diverter configurations C, D, E, and F, allows us to evaluate the influence of diverter
chamber to downspout transition fitting, flow rate, and port location, which is nested, on
the difference in initial and final TDS concentrations. Similar to the results from the
ANOVA for the first general linear model, the ANOVA for the second general linear
model (Table 11) concluded that all of the variables varied together. This result does not
allow for statistically significant conclusions to be made on individual variables. It only
allows general comparisons between variables, which is discussed below.
The decreases in TDS concentrations measured after each experiment can be
attributed to the initial solution in the diverter chamber, which had high TDS

56
concentrations, being diluted by the simulated rainwater flows, which had a lower
concentration of TDS. The dilution of the initial solution in the diverter chamber shows
an interaction of the diverted water initially in the diverter chamber with the simulated
rainwater that is passing through to the downspout and to the next step in collection,
typically storage. Evaluating the mean differences in initial and final TDS concentration
observed at different sampling ports locations gives insight to how suspended
contaminants may react and be transported out of the diverter chamber.
Comparison of 10.16 and 15.24 cm Diameter Diverter Chambers Comparison of the mean differences in TDS concentrations observed at each
sample port, at experimental flow rates, allow for comparison between experimental
variables. When comparing 10.16 cm and 15.24 cm diverter chambers with upward and
downward oriented sanitary tees as transition fittings at the experimental flow rate of
0.76 L/min, there are minimal differences in the mean differences in initial and final
TDS concentrations at every sample port (Figure 13). Figure 13 shows the minimal
differences in the 10.16 and 15.24 cm diverter chamber results.

57
Figure 13. Comparison of the mean differences in initial and final total dissolved solids concentration in two 10.16 cm (left) and two 15.24 cm (right) diverter chambers at a flow rate of 0.76 L/min.
When comparing 10.16 cm and 15.24 cm diverter chambers with upward and
downward oriented sanitary tees as transition fittings at the experimental flow rate of
1.51 L/min, there are minimal differences in the mean differences in initial and final
TDS concentrations at every sample port (Figure 14). Figure 14 shows the minimal
mean differences in the 10.16 and 15.24 cm diverter chamber results.
Figure 14. Comparison of the mean differences in initial and final total dissolved solids concentration in two 10.16 cm (left) and two 15.24 cm (right) diverter chambers at a flow rate of 1.51 L/min.

58
When comparing 10.16 cm and 15.24 cm diverter chambers with upward and
downward oriented sanitary tees as transition fittings at the experimental flow rate of
3.03 L/min, there are minimal differences in the mean differences in initial and final
TDS concentrations at sample ports on the 15.24 cm diverter chamber (Figure 15). The
mean differences in the initial and final TDS concentrations at different sample ports are
slightly increased in the 10.16 cm diverter chamber at 3.03 L/min. Figure 15 also shows
the minimal differences between the upward and downward oriented sanitary tees in
both the 10.16 and 15.24 cm diverter chamber results.
Figure 15. Comparison of the mean differences in initial and final total dissolved solids concentration in two 10.16 cm (left) and two 15.24 cm (right) diverter chambers at a flow rate of 3.03 L/min.
Similar to results at the 3.03 L/min flow rate, mean differences between the
initial and final TDS concentrations at all sample ports in the 15.24 cm diverter chamber
are relatively similar at 12.11 L/min (Figure 16). When comparing the results of both
transition fittings in the 10.16 and 15.24 cm diverter chamber, the 10.16 diverter
chamber results show a large difference between sample port 1 and the rest of the sample

59
ports. The mean differences in the initial and final TDS concentrations at different
sample ports show the dilution of the initial solution at the sample port location. Similar
to previous comparisons, figure 16 also shows the minimal differences between the
upward and downward oriented sanitary tees in both the 10.16 and 15.24 cm diverter
chamber results at the 12.11 L/min flow rate.
Figure 16. Comparison of the mean differences in initial and final total dissolved solids concentration in two 10.16 cm (left) and two 15.24 cm (right) diverter chambers at a flow rate of 12.11 L/min.
Figure 17 shows a large difference between the mean differences in initial and
final TDS concentrations observed at the top sample port, sample port 1. The mean
differences in the initial and final TDS concentrations at different sample ports show the
dilution of the initial solution at the sample port location. Similar to previous
comparisons, figure 17 also shows the minimal differences between the upward and
downward oriented sanitary tees in both the 10.16 and 15.24 cm diverter chamber results
at the 22.71 L/min flow rate.

60
Figure 17. Comparison of the mean differences in initial and final total dissolved solids concentration in two 10.16 cm (left) and two 15.24 cm (right) diverter chambers at a flow rate of 22.71 L/min.
Figure 18 shows a large difference between the mean differences in initial and
final TDS concentrations observed at the top two sample ports, sample port 1 and 2, in
both the 10.16 and 15.24 cm diverter chambers. The mean differences in the initial and
final TDS concentrations at different sample ports show the dilution of the initial
solution at the sample port location. Overall, figure 18 shows minimal differences
between the upward and downward oriented sanitary tees in both the 10.16 and 15.24 cm
diverter chamber results at the 43.91 L/min flow rate. The downward oriented sanitary
tee in the 15.24 cm diverter chamber did allow a greater mean differences in initial and
final TDS concentration than the upward oriented sanitary tee at sample port 2.

61
Figure 18. Comparison of the mean differences in initial and final total dissolved solids concentration in two 10.16 cm (left) and two 15.24 cm (right) diverter chambers at a flow rate of 43.91 L/min.
Figure 19 shows a large difference between the mean differences in initial and
final TDS concentrations observed at the top sample port, sample port 1, in both the
10.16 and 15.24 cm diverter chambers at 75.71 L/min. The mean differences in the
initial and final TDS concentrations at different sample ports show the dilution of the
initial solution at the sample port location. Overall, figure 19 shows minimal differences
between the upward and downward oriented sanitary tees in both the 10.16 and 15.24 cm
diverter chamber results at the 75.71 L/min flow rate. The upward oriented sanitary tee
in the 15.24 cm diverter chamber did allow a greater mean differences in initial and final
TDS concentration than the downward oriented sanitary tee at sample port 2.

62
Figure 19. Comparison of the mean differences in initial and final total dissolved solids concentration in two 10.16 cm (left) and two 15.24 cm (right) diverter chambers at a flow rate of 75.71 L/min.
Figure 20 shows more variable results than the previous flow rates. large
difference between the mean differences in initial and final TDS concentrations were
observed at the top sample port, sample port 1, in both the 10.16 and 15.24 cm diverter
chambers at 113.56 L/min for both transition fittings. The mean differences in the initial
and final TDS concentrations at different sample ports show the dilution of the initial
solution at the sample port location. Except for sample port 2 on the 10.16 cm diverter
chamber and sample ports 1, 2, and 3 on the 15.24 cm diverter chamber, figure 20 shows
minimal differences between the upward and downward oriented sanitary tees in both
the 10.16 and 15.24 cm diverter chamber results at the 113.56 L/min flow rate. The
downward oriented sanitary tee in the 10.16 cm diverter chamber allowed greater mean
differences in initial and final TDS concentration than the upward oriented sanitary tee at
sample port 1. The upward oriented sanitary tee in the 15.24 cm diverter chamber did
allow a greater mean differences in initial and final TDS concentration than the
downward oriented sanitary tee at sample ports 1, 2 and 3.

63
Figure 20. Comparison of the mean differences in initial and final total dissolved solids concentration in two 10.16 cm (left) and two 15.24 cm (right) diverter chambers at a flow rate of 113.56 L/min.
When comparing the overall performance of the upward oriented sanitary tee
against the downward oriented sanitary tee, there is not a clear advantage for either one
in its ability to limit the interaction of diverted water with simulated rainwater flows.
When comparing the diverter configurations utilizing 15.24 cm diameter diverter
chambers to their 10.16 cm diameter counterparts, results showed that a large mean
difference in the initial and final TDS concentration was found starting at the flow rate
of 12.11 L/min for the 10.16 cm diverter chambers and 22.71 L/min for the 15.24 cm
diverter chambers At flow rates of 15.71 and 113.56 L/min, the 15.25 cm diverter
chamber displayed a large mean difference in initial and final TDS concentrations at
sample ports 1 and 2.
These results suggest the depths of interaction, based on the location of the
sample ports, due to the dilution of the initial solution in the diverter chamber in each
experimental test. The experimental results suggest that an interaction between the

64
diverted water in the diverter chamber and the simulated flow of rainwater does not
occur in the 10.16 cm diverter chambers at flow rates of 3.03 L/min or less and does not
occur in the 15.24 cm diverter chambers at flow rates of 12.11 L/min or less. The results
also suggest that at flows of 12.11 L/min and greater in the 10.16 cm diverter chambers
and 22.71 L/min and greater in the 15.24 cm diverter chambers, an interaction occurs at
sample port 1 which is located at a depth of 30.5 cm in the diverter chamber (Figure 5).
Large mean differences between the initial and final TDS concentrations are also
observed in sample ports 1 and 2, which are located at a depth of 30.5 and 61 cm,
respectively, in the diverter chamber, in the 15.24 cm diverter chambers at flows of
43.91 L/min and greater. The 10.16 cm diverter chambers displayed large mean
differences in sample ports 1 and 2, which are located at a depth of 30.5 and 61.0 cm,
respectively, in the diverter chamber, at flow rates of 43.91 and 113.56 L/min. Based on
the results, it was determined that there is not a difference between the use of a
downspout first flush diverter with diameters of 10.16 and 15.24 cm utilizing upward
and downward oriented sanitary tees as downspout to diverter chamber transition
fittings. The data suggests that diverter chamber diameter should be more dependent on
the volume of water that the system designer wants to divert rather than utilizing the
diverter chamber diameter to promote decreased interaction of the diverted water with
the subsequent flow of rainwater.

65
Comparison of Upward and Downward Oriented Sanitary Tees as Transition Fittings Comparison of the mean differences in TDS concentrations observed at each
sample port, at experimental flow rates, allow for comparison between experimental
variables. When comparing upward and downward oriented sanitary tees as transition
fittings on 10.16 and 15.24 cm diverter chambers at the experimental flow rate of 0.76
L/min, there are minimal differences in the mean differences in initial and final TDS
concentrations at every sample port (Figure 21). Figure 21 shows the minimal
differences in the upward and downward oriented sanitary tees results.
Figure 21. Comparison of the mean differences in initial and final total dissolved solids concentration in four downspout first flush diverters utilizing two downward oriented (left) and two upward oriented (right) sanitary tees at a flow rate of 0.76 L/min.
When comparing upward and downward oriented sanitary tees as transition
fittings on 10.16 and 15.24 cm diverter chambers at the experimental flow rate of 1.51
L/min, there are minimal differences in the mean differences in initial and final TDS

66
concentrations at every sample port (Figure 22). Figure 22 shows the minimal
differences in the upward and downward oriented sanitary tees results.
Figure 22. Comparison of the mean differences in initial and final total dissolved solids concentration in four downspout first flush diverters utilizing two downward oriented (left) and two upward oriented (right) sanitary tees at a flow rate of 1.51 L/min.
Similar to results at the flow rate of 1.51 L/min, when comparing upward and
downward oriented sanitary tees as transition fittings on 10.16 and 15.24 cm diverter
chambers at the experimental flow rate of 3.03 L/min, there are minimal differences in
the mean differences in initial and final TDS concentrations at every sample port (Figure
23). While figure 23 shows the minimal differences in the upward and downward
oriented sanitary tees results, a trend of larger mean differences at sample port 1 is
beginning to develop.

67
Figure 23. Comparison of the mean differences in initial and final total dissolved solids concentration in four downspout first flush diverters utilizing two downward oriented (left) and two upward oriented (right) sanitary tees at a flow rate of 3.03 L/min.
Figure 24 shows a large mean difference between the initial and final TDS
concentration in the downward and upward oriented sanitary tee at sample port 1, at a
flow rate of 12.11 L/min. The downward oriented sanitary tee shows a large mean
difference at sample port 1 with the 15.24 cm diverter chamber while the upward
oriented sanitary tee shows a large difference at sample port 1 with the 10.16 cm diverter
chamber. At all other sample ports for both the 10.16 and 15.24 cm diverter chambers
there are minimal mean differences in the differences in initial and final TDS
concentrations (Figure 24). Similar to the pattern of figure 23, figure 24 shows the
minimal mean differences in the 10.16 and 15.24 cm diverter chamber’s results at the
experimental flow rate of 12.11 L/min.

68
Figure 24. Comparison of the mean differences in initial and final total dissolved solids concentration four downspout first flush diverters utilizing two downward oriented (left) and two upward oriented (right) sanitary tees at a flow rate of 12.11 L/min.
Figure 25 shows a large mean difference between the initial and final TDS
concentration in the downward and upward oriented sanitary tee at sample port 1, at a
flow rate of 22.71 L/min. The downward and upward oriented sanitary tees show a large
mean difference at sample port 1 with both the 10.16 and 15.24 cm diverter chamber. At
all other sample ports for both the 10.16 and 15.24 cm diverter chambers there are
minimal differences in the mean differences in initial and final TDS concentrations
(Figure 25). Similar to the pattern of figure 24, figure 25 shows the minimal differences
in the 10.16 and 15.24 cm diverter chamber’s results at the experimental flow rate of
22.17 L/min.

69
Figure 25. Comparison of the mean differences in initial and final total dissolved solids concentration in four downspout first flush diverters utilizing two downward oriented (left) and two upward oriented (right) sanitary tees at a flow rate of 22.71 L/min.
Figure 26 shows large mean differences between the initial and final TDS
concentration in the downward and upward oriented sanitary tee at sample ports 1and 2,
at a flow rate of 43.91 L/min. The downward and upward oriented sanitary tees show a
large mean difference at sample port 1 with both the 10.16 and 15.24 cm diverter
chamber. At sample port 2 the downward oriented sanitary tee shows a large mean
difference in initial and final TDS concentrations for both the 10.16 and 15.24 cm
diverter chambers. The upward oriented sanitary tee at sample port 2 only shows a large
mean difference in initial and final TDS concentrations in the 15.24 cm diverter
chamber. At all other sample ports for both the 10.16 and 15.24 cm diverter chambers
there are minimal differences in the mean differences in initial and final TDS
concentrations (Figure 26). Similar to the pattern of figure 25, figure 26 shows the
minimal differences in the 10.16 and 15.24 cm diverter chamber’s results at the
experimental flow rate of 43.91 L/min.

70
Figure 26. Comparison of the mean differences in initial and final total dissolved solids concentration in four downspout first flush diverters utilizing two downward oriented (left) and two upward oriented (right) sanitary tees at a flow rate of 43.91 L/min.
Figure 27 shows a large mean difference between the initial and final TDS
concentration in the downward and upward oriented sanitary tee at sample port 1 at a
flow rate of 75.71 L/min. The downward and upward oriented sanitary tees show a large
mean difference at sample port 1 with both the 10.16 and 15.24 cm diverter chambers.
At sample port 2 the downward oriented sanitary tee shows a large mean difference in
initial and final TDS concentrations for the 15.24 cm diverter chamber. The upward
oriented sanitary tee at sample port 2 shows a large mean difference in initial and final
TDS concentrations in the 10.16 cm diverter chamber. At all other sample ports for both
the 10.16 and 15.24 cm diverter chambers there are minimal differences in the mean
differences in initial and final TDS concentrations (Figure 27). Similar to the pattern of
figure 26, figure 27 shows the minimal differences in the 10.16 and 15.24 cm diverter
chamber’s results at the experimental flow rate of 75.71 L/min.
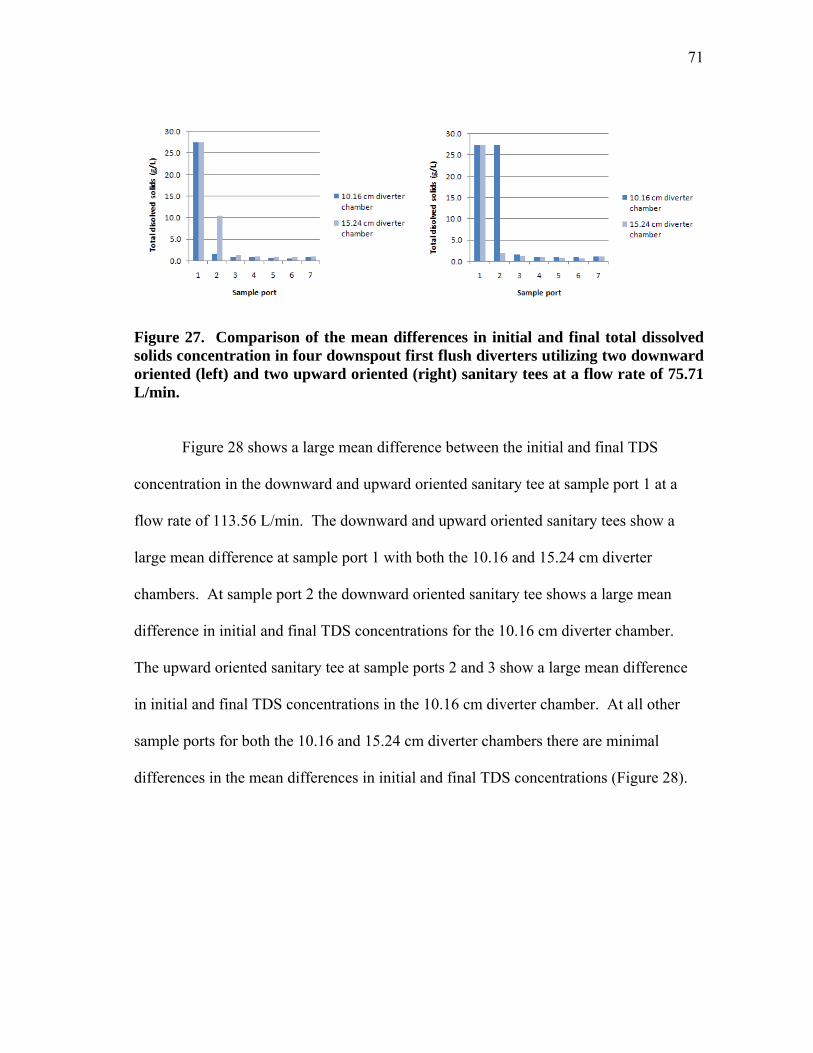
71
Figure 27. Comparison of the mean differences in initial and final total dissolved solids concentration in four downspout first flush diverters utilizing two downward oriented (left) and two upward oriented (right) sanitary tees at a flow rate of 75.71 L/min.
Figure 28 shows a large mean difference between the initial and final TDS
concentration in the downward and upward oriented sanitary tee at sample port 1 at a
flow rate of 113.56 L/min. The downward and upward oriented sanitary tees show a
large mean difference at sample port 1 with both the 10.16 and 15.24 cm diverter
chambers. At sample port 2 the downward oriented sanitary tee shows a large mean
difference in initial and final TDS concentrations for the 10.16 cm diverter chamber.
The upward oriented sanitary tee at sample ports 2 and 3 show a large mean difference
in initial and final TDS concentrations in the 10.16 cm diverter chamber. At all other
sample ports for both the 10.16 and 15.24 cm diverter chambers there are minimal
differences in the mean differences in initial and final TDS concentrations (Figure 28).

72
Figure 28. Comparison of the mean differences in initial and final total dissolved solids concentration four downspout first flush diverters utilizing two downward oriented (left) and two upward oriented (right) sanitary tees at a flow rate of 113.56 L/min.
These results suggest the depths of interaction, based on the location of the
sample ports, due to the dilution of the initial solution in the diverter chamber in each
experimental test. The experimental results suggest that an interaction between the
diverted water in the diverter chamber and the simulated flow of rainwater does not
occur in the upward and downward oriented sanitary tees at flow rates of 3.03 L/min or
less. The results also suggest that at flows between 12.11 and 22.71 L/min both the
upward and downward oriented sanitary tees display an interaction that occurs only at
sample port 1 which is located at a depth of 30.5 cm in the diverter chamber (Figure 5).
Large mean differences in the initial and final TDS concentrations are observed in
sample ports 1 and 2, which are located at a depth of 30.5 and 61 cm, respectively, in the
diverter chamber, in the upward and downward oriented sanitary tee transition fittings at
flows of 43.91 L/min and greater. While there were some minor mean differences in
initial and final TDS concentrations, no pattern was observed when comparing upward

73
and downward oriented sanitary tees used as diverter chamber to downspout transition
fittings on 10.16 and 15.24 cm diverter chambers.
Comparison of Four Transition Fittings Comparison of the mean differences in TDS concentrations observed at each
sample port, at experimental flow rates, allow for comparison between experimental
variables. When comparing the 10.16 cm diverter chambers with an upward and
downward oriented sanitary tee, a straight tee, and a straight tee with a floating ball as
transition fittings at the experimental flow rate of 0.76 L/min, there are minimal mean
differences in the differences in initial and final TDS concentrations at every sample port
(Figure 29).
Figure 29. Comparison of the mean differences in initial and final total dissolved solids concentration in four downspout first flush diverters with a 10.16 cm diverter chamber at a flow rate of 0.76 L/min.

74
The results at the flow rate of 1.51 L/min are similar to results at 0.76 L/min.
When comparing the 10.16 cm diverter chambers with an upward and downward
oriented sanitary tee, a straight tee, and a straight tee with a floating ball as transition
fittings at the experimental flow rate of 1.51 L/min, there are minimal differences in the
mean differences in initial and final TDS concentrations at every sample port (Figure
30).
Figure 30. Comparison of the mean differences in initial and final total dissolved solids concentration in four downspout first flush diverters with a 10.16 cm diverter chamber at a flow rate of 1.51 L/min.
The results at a flow rate of 3.03 L/min begin to show a trend of larger mean
differences in initial and final TDS concentrations at sample port 1. When comparing
the 10.16 cm diverter chambers with an upward and downward oriented sanitary tee, a
straight tee, and a straight tee with a floating ball as transition fittings at the experimental

75
flow rate of 3.03 L/min, there are minimal differences in the mean differences in initial
and final TDS concentrations at every sample port (Figure 31).
Figure 31. Comparison of the mean differences in initial and final total dissolved solids concentration in four downspout first flush diverters with a 10.16 cm diverter chamber at a flow rate of 3.03 L/min.
The results at a flow rate of 12.11 L/min show larger mean differences in initial
and final TDS concentrations at sample port 1 for all transition fittings except the
straight tee with floating barrier (Figure 32). When comparing the 10.16 cm diverter
chambers with an upward and downward oriented sanitary tee, a straight tee, and a
straight tee with a floating ball as transition fittings at the experimental flow rate of
12.11 L/min, there are minimal differences in the mean differences in initial and final
TDS concentrations at sample ports 2-7 (Figure 32).

76
Figure 32. Comparison of the mean differences in initial and final total dissolved solids concentration in four downspout first flush diverters with a 10.16 cm diverter chamber at a flow rate of 12.11 L/min.
Similar to the results at a flow rate of 12.11 L/min, the results at 22.71 L/min
show a large mean difference in initial and final TDS concentrations at sample port 1 for
all transition fittings except the straight tee with floating barrier (Figure 33). When
comparing the 10.16 cm diverter chambers with an upward and downward oriented
sanitary tee, a straight tee, and a straight tee with a floating ball as transition fittings at
the experimental flow rate of 22.71 L/min, there are minimal differences in the mean
differences in initial and final TDS concentrations at sample ports 2-7 (Figure 33).
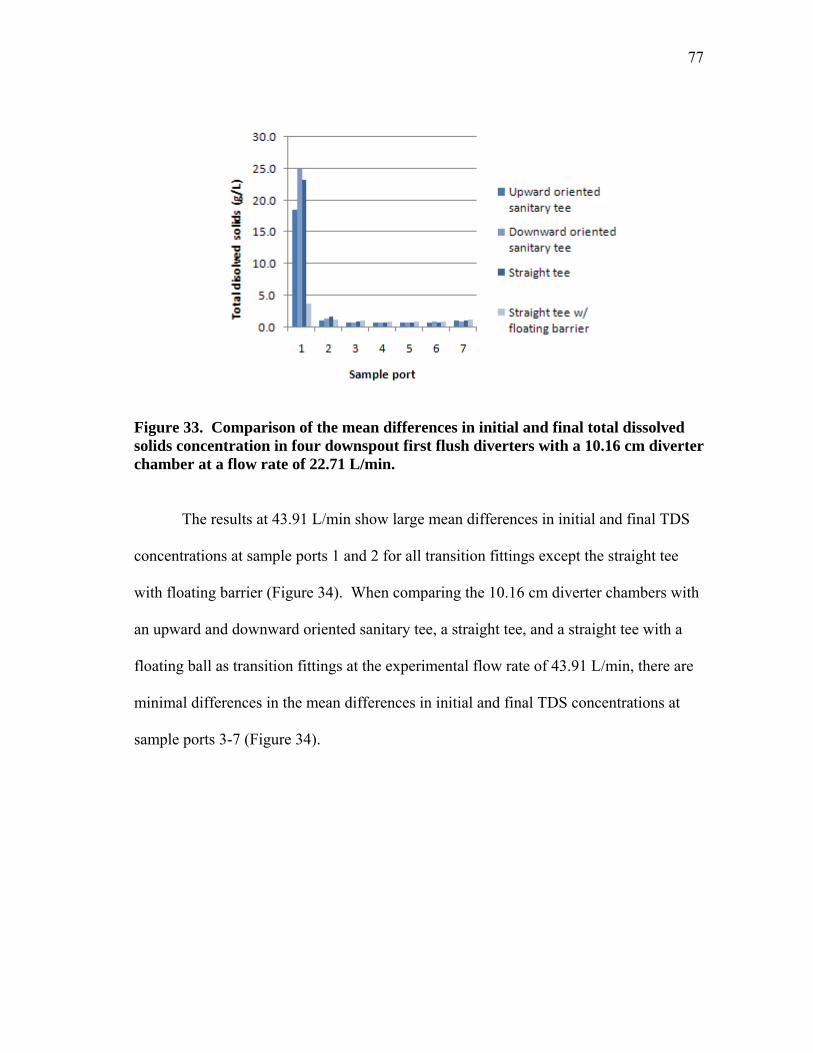
77
Figure 33. Comparison of the mean differences in initial and final total dissolved solids concentration in four downspout first flush diverters with a 10.16 cm diverter chamber at a flow rate of 22.71 L/min.
The results at 43.91 L/min show large mean differences in initial and final TDS
concentrations at sample ports 1 and 2 for all transition fittings except the straight tee
with floating barrier (Figure 34). When comparing the 10.16 cm diverter chambers with
an upward and downward oriented sanitary tee, a straight tee, and a straight tee with a
floating ball as transition fittings at the experimental flow rate of 43.91 L/min, there are
minimal differences in the mean differences in initial and final TDS concentrations at
sample ports 3-7 (Figure 34).
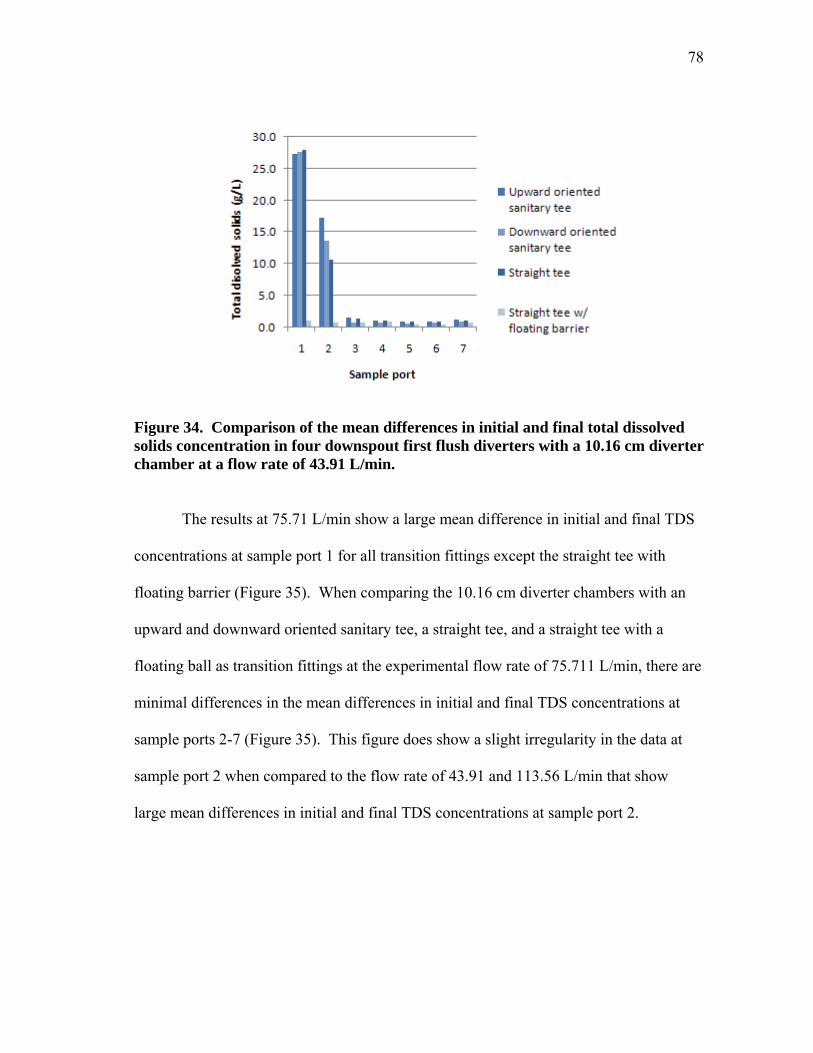
78
Figure 34. Comparison of the mean differences in initial and final total dissolved solids concentration in four downspout first flush diverters with a 10.16 cm diverter chamber at a flow rate of 43.91 L/min.
The results at 75.71 L/min show a large mean difference in initial and final TDS
concentrations at sample port 1 for all transition fittings except the straight tee with
floating barrier (Figure 35). When comparing the 10.16 cm diverter chambers with an
upward and downward oriented sanitary tee, a straight tee, and a straight tee with a
floating ball as transition fittings at the experimental flow rate of 75.711 L/min, there are
minimal differences in the mean differences in initial and final TDS concentrations at
sample ports 2-7 (Figure 35). This figure does show a slight irregularity in the data at
sample port 2 when compared to the flow rate of 43.91 and 113.56 L/min that show
large mean differences in initial and final TDS concentrations at sample port 2.

79
Figure 35. Comparison of the mean differences in initial and final total dissolved solids concentration in four downspout first flush diverters with a 10.16 cm diverter chamber at a flow rate of 75.71 L/min.
The results at 113.56 L/min show a large mean difference in initial and final TDS
concentrations at sample ports 1 and 2 for all transition fittings except the straight tee
with floating barrier (Figure 36). The straight tee transition fitting also shows a minimal
mean difference in initial and final TDS concentration at sample port 2. When
comparing the 10.16 cm diverter chambers with an upward and downward oriented
sanitary tee, a straight tee, and a straight tee with a floating ball as transition fittings at
the experimental flow rate of 113.56 L/min, there are minimal differences in the mean
differences in initial and final TDS concentrations at sample ports 3-7 (Figure 36).

80
Figure 36. Comparison of the mean differences in initial and final total dissolved solids concentration in four downspout first flush diverters with a 10.16 cm diverter chamber at a flow rate of 113.56 L/min.
These results suggest the depths of interaction, based on the location of the
sample ports, due to the dilution of the initial solution in the diverter chamber in each
experimental test. The experimental results suggest that an interaction between the
diverted water in the diverter chamber and the simulated flow of rainwater does not
occur with any of the tested transition fittings at flow rates of 3.03 L/min or less. The
results also suggest that at all flow rates tested the straight tee with a floating barrier
displayed no interaction at any sample port. The results show that at flows of 12.11 ,
22.71, and 75.71 L/min large mean differences in the initial and final TDS
concentrations were observed only at sample port 1, which is located at a depth of 30.5
cm in the diverter chamber (Figure 5), in the diverter chambers utilizing the a straight
tee, upward and downward oriented sanitary tees. The results also show large mean

81
differences in the initial and final TDS concentrations were observed at flows of 43.91
and 113.56 L/min the diverters with a straight tee, upward and downward oriented
sanitary tees at sample ports 1 and 2, which are located at a depth of 30.5 and 61 cm,
respectively, in the diverter chamber (Figure 5).
Overall, the downspout first flush diverter that utilized the straight tee with a
floating ball as the downspout to diverter chamber transition fitting outperformed all
other transition fittings. While utilizing the floating ball as a barrier, the straight tee was
the most effective at deterring diverted water from interacting with the subsequent flow
of harvested rainwater. It was determined that utilizing a straight tee as a transition
fitting with a floating ball acting as a barrier between water collected in the diverter
chamber of a downspout first flush diverter and the flow passing through the transition
fitting limits water from interacting with the subsequent flow of harvested rainwater.
Results of the remaining transition fittings, the straight tee and the upward and
downward oriented sanitary tees showed that there are minimal differences in the mean
differences in initial and final TDS concentrations observed at experimental flow rates
and sample ports.
Observation of Recommended First Flush Diversion Volumes
Results may be utilized to aid in observing the various recommendations on
volumes of rainwater to be diverted by the first flush diverters. Since the results suggest
the depths of interaction, based on the location of the sample ports due to the dilution of
the initial solution in the diverter chamber, we can assume that diverted water located
below the sample ports that showed an interaction is effectively diverted. Diverter

82
chamber designs that account for the interaction of diverted water require additional
length. This additional length allows the desired volume of diverted water to be located
below the level at which an interaction between the diverted water and subsequent flow
of rainwater occurs. To account for this additional length of diverter chamber needed,
downspout first flush diverters of similar configurations to the ones tested in the
experiment should be designed with additional length to allow for an interaction layer in
the diverter chamber while keeping the diverted water in the diverter chamber.
Rainfall Characteristics
Based on the preliminary experiment, if rainfall characteristics and system
configurations allow, it is advantageous to allow the diverter chamber to drain during
rainfall events. In certain areas where rainfall patterns and frequencies produce rain
events with low intensities, utilizing a drain on a diverter chamber will result in the loss
of a significant volume of water through the diverter chamber. In this situation, the
diverter chamber drain should either be closed, the flow rate should be decreased, or an
automatic control valve on the drain should be installed. In the case that the diverter
chamber drain is normally closed, the diverter chamber should be drained after every
rainfall event, the diverter should be designed with an increased length to compensate
for the interaction of diverted water, or the treatment system after storage should be
designed for the additional constituents that may be present in the diverted water that
bypasses or is transported out of the diverter chamber. In locations where rainfall
patterns and frequencies produce rain events with high intensities, the volume of water
lost through the diverter chamber drain will be minimal. Although the volume of water

83
lost will be minimal compared to the volume collected in storage, care should be taken
when selecting a diverter chamber drain flow rate. When the diverter chamber drain is
continuously open, a properly selected flow rate may effectively decrease the volume of
water that diverter chamber must contain, assuming the initial design has added
additional length to account for interaction of the diverted water and the subsequent flow
of harvested rainwater. This is due to the fact that the diverted water collected at the
beginning of the rainfall event begins to drain immediately, thereby decreasing the
additional depth of diverted water recommended.

84
CONCLUSIONS
The goal of the experiment was focused on understanding the influence of flow
rate, diverter chamber diameter, and diverter chamber to downspout transition fitting on
the movement of contaminants within a downspout first flush diverter. Through this
research the following conclusions were developed:
1. The diverter chamber to downspout transition fittings tested on a 10.16 cm
diameter diverter chamber, upward and downward oriented sanitary and
straight tee, do not have a significant impact on the mean difference in initial
and final TDS concentrations observed at multiple sample ports.
2. No statistical difference was observed when comparing upward and
downward oriented sanitary tees used as diverter chamber to downspout
transition fittings on 10.16 and 15.24 cm diverter chambers.
3. Utilizing a straight tee as a transition fitting with a floating ball, acting as a
barrier between water collected in the diverter chamber of a downspout first
flush diverter and the flow passing through the transition fitting, limited
diverted water from interacting with the subsequent flow of harvested
rainwater.
4. There is not a significant difference between the use of a downspout first flush
diverter with diameters of 10.16 and 15.24 cm utilizing upward and
downward oriented sanitary tees as downspout to diverter chamber transition
fittings.

85
5. Tests at flow rates less than or equal to 12.1 L/min exhibited limited changes
in total dissolved solids concentrations in the downspout first flush diverters
with 15.24 cm diameter diverter chambers.
6. Tests at flow rates less than or equal to 1.5 L/min exhibited limited changes in
total dissolved solids concentrations in the downspout first flush diverters
with 10.16 cm diameter diverter chambers.
7. The diverter chamber drain flow rate and volume impacts the observed
differences in initial and final TDS concentrations at all sample ports on the
diverter chamber of a downspout first flush diverter regardless of flow rate.
8. The diverter chamber drain flow rate impacts the flow rate of water entering
the diverter chamber through the transition fitting.

86
FUTURE RESEARCH
Many areas surrounding the subject of rainwater harvesting first flush diverters
still must be addressed in order to understand all processes at work. Future work should
look at additional downspout first flush diverter configurations that promote decreased
interaction of diverted water with the subsequent flow of harvested rainwater.
Additional research is also needed for determining the time it takes for the layers of
interaction in the diverter chamber to form and its boundary characteristics. Knowing
the boundary characteristics between the diverted and layer of interaction would enable
more accurate determination of the location of that layer boundary. Understanding the
time it takes for the layers to form would allow one to more accurately determine the
effectiveness of the diverter chamber drain. Analysis of rainfall characteristics to
determine acceptable diverter chamber drain flow rates would allow for application of
the first flush diverters with diverter drains in locations with challenging rainfall
characteristics.

87
REFERENCES
Abbott, S.E., J. Douwes, and B.P. Caughley. 2006. A systematic evaluation of measures
improving the quality of roof-collected rainwater. In Proc. NZWWA’s 48 Annual Water Conference. Christchurch, New Zealand.
Abbott, S.E., B.P. Caughley, A. Ward, G. Gowan, and M. Heinrich. 2007. Quantifying
first flush diversion volumes for potable roof-collected rainwater. In Proc. NZWWA 49th Annual Conference. Rotorua, New Zealand.
Abbott, S. E. 2008. Overcoming Impediments to Rainwater Harvesting. In Proc. New
Zealand Institute of Environmental Health Conference. Auckland, New Zealand. American Rainwater Catchment Systems Association (ARCSA). 2008. Austin, TX.
Draft Rainwater Catchment Design and Installation Standards. Branz. 2006. Rainwater Collection for Domestic Use. No. 478. Wellington, New
Zealand. Building Research Association, New Zealand. Coombes, R., J. Argue, and G. Kuczera. 2000. Rainwater quality from roofs tanks, and
hot water systems at Fig Tree Place. In Proc. Third International Hydrological and Water Resources Symposium. Perth, Australia.
enHealth Council. 2004. Guidance on Use of Rainwater Tanks. Canberra, Australia.
Department of Health and Ageing. Australian Government. Evans, C.A., Coombes, P.J., Dunstan, R.H. 2006. Wind, rain and bacteria: The effect of
weather on the microbial composition of roof harvested rainwater. Water Research. 40:37-44.
Gardner, T., J. Baisden, and G. Millar. 2004. Rainwater Catchment Systems for
Domestic Supply: Design, Construction, and Implementation. London: Intermediate Technology Publications Ltd.

88
Haan, C. T., J. C. Barfield. 1994. Design Hydrology and Sedimentology for Small
Catchments. San Diego, CA: Academic Press, Inc. IAPMO. 2000. Uniform Plumbing Code 2000. Los Angeles, CA: The International
Association of Plumbing and Mechanical Codes (IAPMO). Jenkins, D. and F. Pearson 1978. Feasibility of rainwater collection systems in
California. Davis, CA: California Water Resources Centre, University of California.
Kim, R. H., S. Lee, Y. M Kim, J. H Lee, S. K Kim, S. G Kim. 2005. Pollutants in
rainwater runoff in Korea: Their impacts on rainwater utilization. Environmental Technology. 26:11-420.
Klein, P.D., D. Y. Graham, A. Gaillour, A.R. Opekun, and E. O’Brian Smith. 1991.
Water sources as risk factor for helicobacter pylori infection in Peruvian children. The Lancelet. 377: 1503-1506.
Koplan, J.P., R. D. Deen, W. H. Swanston, and B. Tota. 1978. Contaminated roof-
collected rainwater as a possible cause of an outbreak of samnolellosis. Journal of Hygiene. 81: 303-309.
Krishna, J. 2005. The Texas Manual of Rainwater Harvesting, 3rd Ed. Austin, TX:
Texas Water Development Board (TWDB). Lye, D.J. 1991. Microbial Levels in Cistern Systems: Acceptable or Unacceptable. In
Proc. Fifth International Conference on Rain Water Cistern Systems. Taiwan, Republic of China.
Lye, D.J. 1996. Water Quality of American Cistern Systems. Austin, TX: American
Rainwater Catchment Systems Association (ARCSA).

89
Lye, D. J. 2002. Health risks associated with consumption of untreated water from household roof catchment systems. American Water Resources Association. 38: 1301-1306.
Magyar, M. I., V. G. Mitchell, A. R. Ladson, C. Diaper. 2007. An investigation of
rainwater tanks quality and sediment dynamics. Water Science and Technology. 56(9): 21-28.
Martinson, D., and T. Thomas. 2004. Quantifying the first flush phenomenon. In Proc.
12th International Rainwater Catchment Systems Association Conference. New Delhi, India.
Melidis, P., C.S. Akratos, V. A. Tsihrintzis, and E. Trikilidou. 2007. Characterization of
rain and roof drainage water quality in Xanthi, Greece. Environmental Monitoring Assessment. 127: 15-27.
Mid-West Plan Service (MWPS). 1979. Private Water Systems Handbook. Ames, IA:
MWPS-14. Iowa State University. Ministry of Health (MOH). 2005. Small, Individual and Roof Water Supplies:
Guidelines for drinking water quality management for New Zealand. Wellington, New Zealand.
Ministry of Health (MOH). 2006. Water collections tanks and safe household water:
Code 10148. Wellington, New Zealand. Moore, C., and R. Norton. 1995. Corynebacterium aquaticumsepticaemi in neuropenic
patient. Journal of Clinical Pathology. 48: 971-972. National Climate Data Center (NCDC). 2009. Hourly Precipitation Data Rainfall Event
Statistics. Date accessed: 7/30/2008. In: http://hurricane.ncdc.noaa.gov/cgi-bin/HPD/HPDStats.pl.
90
Ntale, H.K., and N. Moses. 2003. Improving quality of harvested rainwater by using first flush interceptors/retainers. In Proc. 11th International Conference on Rainwater Catchment Systems. Texcaco, Mexico.
Polkowska, Z., T. Gorecki, J. Namiesnik. 2002. Quality roof runoff waters from an
urban region. Gdansk, Poland. Chemosphere. 49: 1275-1283. Ruskin, R.H., D.J. Lye, and J.H. Krishna. 1992. The Need to Separate Water Quality
Standards for Cistern Water Systems: A Review. London: Journal of Environmental Science and Health. Part A, 27:8,2123 — 2166.
Schlech, W.F., G.W. Gorman, M.C. Payne, and C.V. Broome. 1985. Legionnaires
Disease in the Caribbean: an outbreak associated with a resort hotel. Archives Internal Medicine. 145:2067-2079.
Simmons, G., V. Hope, G. Lewis, J. Whitmore, and W. Gao. 2001. Contamination of
potable roof-collected rainwater in Auckland, New Zealand. Water Research. 35(6): 1518-1524.
Soil Conservation Service. 1973. A Method for Estimating Volume and Rate of Runoff
in Small Watersheds. SCS-TP-149. Washington, D.C: U.S. Department of Agriculture, Soil Conservation Services.
Soil Conservation Service. 1986. Urban Hydrology for Small Watersheds. Technical
Release No. 55. Washington, D.C: U.S: Department of Agriculture, Soil Conservation Service.
Standards Australia. 2006. Rainwater Tank Design and Installation Handbook. HB 230-
2006. 1st Ed. Sydney. Standards Australia. Texas Rainwater Harvesting Evaluation Committee. 2006. Rainwater Harvesting
Potential and Guidelines for Texas. Report to the 80th Texas Legislature. Austin, TX: Texas Water Development Board.
Wade, R. 2003. Sustainable Water from Rain Harvesting. 3rd Edition. Queensland,
Australia. Environmental Conservation Planning and Consultancy, Pty Ltd.

91
World Health Organization (WHO). 2004. Guidelines for Drinking Water Quality. 3rd
Ed. Vol. 1. Geneva, Switzerland. Yaziz, M.I., H. Gunting, N. Sapari, and A.W. Ghazali. 1989. Variations in rainwater
quality from roof catchments. Water Research. 23: 761-765.
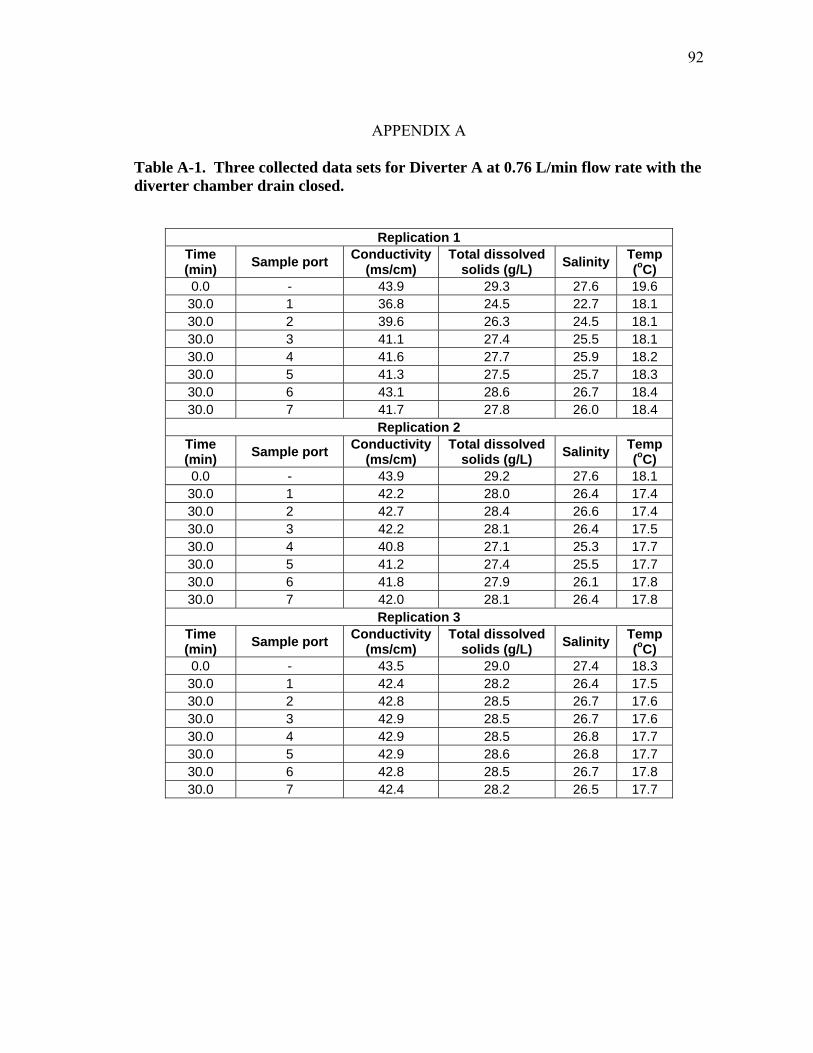
92
APPENDIX A
Table A-1. Three collected data sets for Diverter A at 0.76 L/min flow rate with the diverter chamber drain closed.
Replication 1 Time (min) Sample port Conductivity
(ms/cm) Total dissolved
solids (g/L) Salinity Temp (oC)
0.0 - 43.9 29.3 27.6 19.6 30.0 1 36.8 24.5 22.7 18.1 30.0 2 39.6 26.3 24.5 18.1 30.0 3 41.1 27.4 25.5 18.1 30.0 4 41.6 27.7 25.9 18.2 30.0 5 41.3 27.5 25.7 18.3 30.0 6 43.1 28.6 26.7 18.4 30.0 7 41.7 27.8 26.0 18.4
Replication 2 Time (min) Sample port Conductivity
(ms/cm) Total dissolved
solids (g/L) Salinity Temp (oC)
0.0 - 43.9 29.2 27.6 18.1 30.0 1 42.2 28.0 26.4 17.4 30.0 2 42.7 28.4 26.6 17.4 30.0 3 42.2 28.1 26.4 17.5 30.0 4 40.8 27.1 25.3 17.7 30.0 5 41.2 27.4 25.5 17.7 30.0 6 41.8 27.9 26.1 17.8 30.0 7 42.0 28.1 26.4 17.8
Replication 3 Time (min) Sample port Conductivity
(ms/cm) Total dissolved
solids (g/L) Salinity Temp (oC)
0.0 - 43.5 29.0 27.4 18.3 30.0 1 42.4 28.2 26.4 17.5 30.0 2 42.8 28.5 26.7 17.6 30.0 3 42.9 28.5 26.7 17.6 30.0 4 42.9 28.5 26.8 17.7 30.0 5 42.9 28.6 26.8 17.7 30.0 6 42.8 28.5 26.7 17.8 30.0 7 42.4 28.2 26.5 17.7

93
Table A-2. Three collected data sets for Diverter B at 0.76 L/min flow rate with the diverter chamber drain closed.
Replication 1 Time (min) Sample port Conductivity
(ms/cm) Total dissolved
solids (g/L) Salinity Temp (oC)
0.0 - 43.9 29.3 27.6 19.6 30.0 1 39.5 26.4 24.5 18.1 30.0 2 41.4 27.5 25.7 18.1 30.0 3 41.8 27.8 26.0 18.1 30.0 4 43.2 28.7 27.9 18.2 30.0 5 43.5 28.9 27.2 18.4 30.0 6 43.3 28.8 27.1 18.5 30.0 7 42.7 28.5 26.8 18.4
Replication 2 Time (min) Sample port Conductivity
(ms/cm) Total dissolved
solids (g/L) Salinity Temp (oC)
0.0 - 43.9 29.2 27.6 18.1 30.0 1 40.8 27.2 25.7 17.7 30.0 2 42.6 28.4 26.5 17.7 30.0 3 41.1 27.3 25.4 17.7 30.0 4 42.9 28.6 26.8 17.7 30.0 5 41.2 27.4 25.5 17.7 30.0 6 42.4 28.2 26.4 17.7 30.0 7 42.6 28.4 26.6 17.8
Replication 3 Time (min) Sample port Conductivity
(ms/cm) Total dissolved
solids (g/L) Salinity Temp (oC)
0.0 - 43.5 29.0 27.4 18.3 30.0 1 40.9 27.2 25.5 18.1 30.0 2 40.8 27.1 25.4 18.1 30.0 3 41.3 27.5 25.6 18.1 30.0 4 42.4 28.2 26.5 18.1 30.0 5 42.4 28.2 26.5 18.1 30.0 6 42.4 28.3 26.5 18.1 30.0 7 42.1 28.1 26.3 18.0

94
Table A-3. Three collected data sets for Diverter C at 0.76 L/min flow rate with the diverter chamber drain closed.
Replication 1 Time (min) Sample port Conductivity
(ms/cm) Total dissolved
solids (g/L) Salinity Temp (oC)
0.0 - 43.9 29.3 27.6 19.6 30.0 1 42.4 28.3 26.5 17.6 30.0 2 43.4 28.9 27.0 17.8 30.0 3 43.5 29.0 27.2 17.9 30.0 4 43.2 28.6 26.9 18.1 30.0 5 43.6 29.0 27.2 18.2 30.0 6 43.3 28.7 27.0 18.3 30.0 7 42.7 28.4 26.7 18.2
Replication 2 Time (min) Sample port Conductivity
(ms/cm) Total dissolved
solids (g/L) Salinity Temp (oC)
0.0 - 43.9 29.2 27.6 18.1 30.0 1 42.2 28.1 26.4 17.7 30.0 2 41.0 27.2 25.5 17.5 30.0 3 42.6 28.3 26.5 17.5 30.0 4 42.9 28.4 26.6 17.6 30.0 5 41.4 27.6 25.8 17.6 30.0 6 42.9 28.5 26.8 17.6 30.0 7 41.4 27.6 25.6 17.5
Replication 3 Time (min) Sample port Conductivity
(ms/cm) Total dissolved
solids (g/L) Salinity Temp (oC)
0.0 - 43.5 29.0 27.4 18.3 30.0 1 42.6 28.3 26.6 18.0 30.0 2 42.7 28.4 26.7 17.8 30.0 3 42.7 28.4 26.7 17.8 30.0 4 42.7 28.4 26.6 17.8 30.0 5 42.6 28.3 26.6 17.9 30.0 6 42.6 28.3 26.6 17.9 30.0 7 42.6 27.8 26.1 17.7

95
Table A-4. Three collected data sets for Diverter D at 0.76 L/min flow rate with the diverter chamber drain closed.
Replication 1 Time (min) Sample port Conductivity
(ms/cm) Total dissolved
solids (g/L) Salinity Temp (oC)
0.0 - 43.6 29.0 27.4 21.8 30.0 1 41.3 27.8 26.2 21.7 30.0 2 42.7 28.4 26.9 21.7 30.0 3 42.8 28.5 26.9 21.7 30.0 4 42.7 28.4 26.9 21.8 30.0 5 42.8 28.5 27.0 21.8 30.0 6 42.7 28.4 26.9 21.8 30.0 7 42.4 28.2 26.7 21.8
Replication 2 Time (min) Sample port Conductivity
(ms/cm) Total dissolved
solids (g/L) Salinity Temp (oC)
0.0 - 43.8 29.2 27.7 21.8 30.0 1 41.3 27.4 25.9 21.8 30.0 2 42.6 28.4 26.8 21.8 30.0 3 42.8 28.5 27.0 21.9 30.0 4 42.8 28.5 27.0 21.9 30.0 5 42.7 28.5 26.8 21.9 30.0 6 42.6 28.4 26.9 21.9 30.0 7 42.2 28.0 26.5 21.8
Replication 3 Time (min) Sample port Conductivity
(ms/cm) Total dissolved
solids (g/L) Salinity Temp (oC)
0.0 - 43.7 29.1 27.6 21.8 30.0 1 41.5 27.6 26.1 21.9 30.0 2 42.6 28.4 26.8 21.9 30.0 3 42.7 28.4 26.9 21.9 30.0 4 42.6 28.4 26.9 21.9 30.0 5 42.6 28.4 26.9 21.9 30.0 6 42.6 28.4 26.8 21.9 30.0 7 42.3 28.2 26.7 21.8

96
Table A-5. Three collected data sets for Diverter E at 0.76 L/min flow rate with the diverter chamber drain closed.
Replication 1 Time (min) Sample port Conductivity
(ms/cm) Total dissolved
solids (g/L) Salinity Temp (oC)
0.0 - 43.6 29.0 27.4 21.8 30.0 1 40.7 27.1 25.5 21.7 30.0 2 41.8 27.8 26.2 21.7 30.0 3 42.2 28.1 26.5 21.8 30.0 4 42.4 28.2 26.7 21.8 30.0 5 42.5 28.3 26.8 21.8 30.0 6 42.4 28.3 26.7 21.8 30.0 7 42.0 28.0 26.5 21.8
Replication 2 Time (min) Sample port Conductivity
(ms/cm) Total dissolved
solids (g/L) Salinity Temp (oC)
0.0 - 43.8 29.2 27.7 21.8 30.0 1 41.8 27.7 26.2 21.8 30.0 2 42.5 28.3 26.7 21.8 30.0 3 42.9 28.5 27.0 21.8 30.0 4 42.8 28.5 27.0 21.8 30.0 5 42.8 28.5 27.0 21.8 30.0 6 42.7 28.4 26.9 21.8 30.0 7 42.4 28.3 26.6 21.8
Replication 3 Time (min) Sample port Conductivity
(ms/cm) Total dissolved
solids (g/L) Salinity Temp (oC)
0.0 - 43.7 29.1 27.6 21.8 30.0 1 42.2 28.1 26.4 21.8 30.0 2 42.6 28.3 26.8 21.8 30.0 3 42.7 28.4 26.9 21.8 30.0 4 42.6 28.3 26.8 21.9 30.0 5 42.7 28.4 26.8 21.9 30.0 6 42.6 28.4 26.8 21.8 30.0 7 42.3 28.2 26.7 21.8

97
Table A-6. Three collected data sets for Diverter F at 0.76 L/min flow rate with the diverter chamber drain closed.
Replication 1 Time (min) Sample port Conductivity
(ms/cm) Total dissolved
solids (g/L) Salinity Temp (oC)
0.0 - 44.3 29.5 27.8 18.2 30.0 1 41.1 27.4 25.7 18.6 30.0 2 42.0 27.9 26.2 18.6 30.0 3 42.5 28.3 26.6 18.5 30.0 4 42.9 28.5 26.8 18.4 30.0 5 43.0 28.6 26.9 18.4 30.0 6 43.0 28.7 26.9 18.3 30.0 7 42.5 28.4 26.7 18.2
Replication 2 Time (min) Sample port Conductivity
(ms/cm) Total dissolved
solids (g/L) Salinity Temp (oC)
0.0 - 43.9 29.2 27.5 18.4 30.0 1 42.1 28.0 26.3 18.4 30.0 2 42.5 28.3 26.5 18.3 30.0 3 42.9 28.6 26.8 18.2 30.0 4 43.0 28.7 26.9 18.2 30.0 5 43.2 28.7 27.0 18.1 30.0 6 43.2 28.8 27.0 18.1 30.0 7 42.5 28.4 26.8 18.0
Replication 3 Time (min) Sample port Conductivity
(ms/cm) Total dissolved
solids (g/L) Salinity Temp (oC)
0.0 - 43.9 29.2 27.5 18.4 30.0 1 43.5 28.9 26.9 16.9 30.0 2 43.8 29.1 27.3 17.1 30.0 3 43.8 29.1 27.3 17.2 30.0 4 43.7 29.1 27.3 17.5 30.0 5 43.5 28.9 27.2 17.6 30.0 6 43.4 28.9 27.2 17.7 30.0 7 42.7 28.5 26.7 17.7

98
Table A-7. Three collected data sets for Diverter A at 1.51 L/min flow rate with the diverter chamber drain closed.
Replication 1 Time (min) Sample port Conductivity
(ms/cm) Total dissolved
solids (g/L) Salinity Temp (oC)
0.0 - 44.1 29.4 27.6 18.0 30.0 1 43.2 28.7 27.0 17.9 30.0 2 43.3 28.8 27.1 17.9 30.0 3 43.4 28.9 27.2 17.9 30.0 4 43.0 28.9 27.2 17.9 30.0 5 43.5 28.9 27.2 17.9 30.0 6 43.5 29.0 27.3 17.8 30.0 7 43.4 28.9 27.2 17.8
Replication 2 Time (min) Sample port Conductivity
(ms/cm) Total dissolved
solids (g/L) Salinity Temp (oC)
0.0 - 43.9 29.3 27.6 18.4 30.0 1 41.6 27.8 26.1 19.0 30.0 2 41.9 27.9 26.3 18.8 30.0 3 42.4 28.2 26.6 18.6 30.0 4 42.6 28.4 26.7 18.6 30.0 5 42.7 28.4 26.7 18.5 30.0 6 42.7 28.5 26.7 18.4 30.0 7 42.4 28.3 26.6 18.3
Replication 3 Time (min) Sample port Conductivity
(ms/cm) Total dissolved
solids (g/L) Salinity Temp (oC)
0.0 - 43.8 29.2 27.6 19.7 30.0 1 42.8 28.5 26.8 18.9 30.0 2 43.3 28.7 27.0 18.9 30.0 3 43.2 28.8 27.0 19.0 30.0 4 43.2 28.7 27.1 19.0 30.0 5 43.1 28.7 27.0 19.1 30.0 6 43.0 28.6 27.0 19.2 30.0 7 42.9 28.7 26.9 19.2

99
Table A-8. Three collected data sets for Diverter B at 1.51 L/min flow rate with the diverter chamber drain closed.
Replication 1 Time (min) Sample port Conductivity
(ms/cm) Total dissolved
solids (g/L) Salinity Temp (oC)
0.0 - 44.1 29.4 27.6 18.0 30.0 1 43.1 28.6 26.9 17.7 30.0 2 43.2 28.7 27.0 17.7 30.0 3 43.5 29.0 27.2 17.7 30.0 4 43.5 29.0 27.2 17.7 30.0 5 43.5 29.0 27.2 17.7 30.0 6 43.5 29.0 27.2 17.7 30.0 7 43.3 28.8 27.1 17.7
Replication 2 Time (min) Sample port Conductivity
(ms/cm) Total dissolved
solids (g/L) Salinity Temp (oC)
0.0 - 43.9 29.3 27.6 18.4 30.0 1 42.5 28.3 26.6 18.7 30.0 2 42.8 28.5 26.8 18.6 30.0 3 43.6 28.4 26.7 18.5 30.0 4 42.7 28.5 26.8 18.5 30.0 5 42.8 28.5 26.8 18.4 30.0 6 42.8 28.5 26.8 18.4 30.0 7 42.4 28.3 26.6 18.3
Replication 3 Time (min) Sample port Conductivity
(ms/cm) Total dissolved
solids (g/L) Salinity Temp (oC)
0.0 - 43.8 29.2 27.6 19.7 30.0 1 42.7 28.4 26.7 19.1 30.0 2 43.0 28.6 26.9 19.0 30.0 3 43.1 28.7 27.0 19.0 30.0 4 43.1 28.6 27.0 19.1 30.0 5 43.1 28.7 27.0 19.1 30.0 6 43.1 28.7 27.0 19.1 30.0 7 42.5 28.3 26.7 19.1
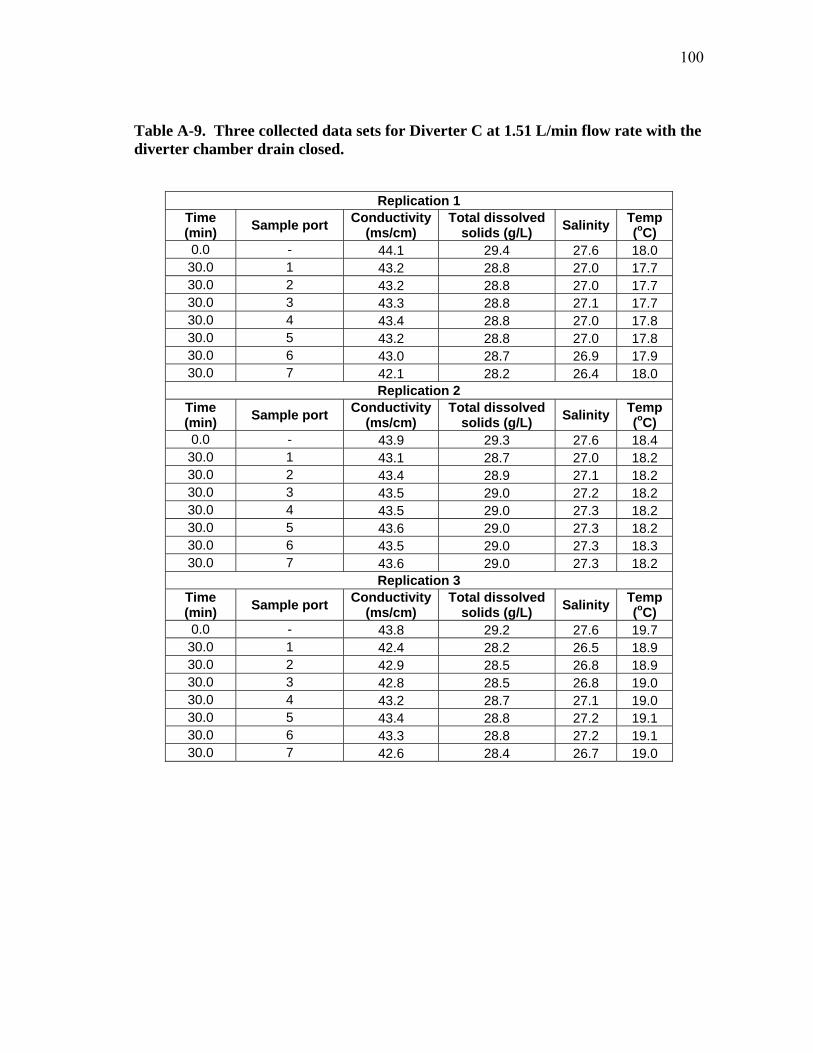
100
Table A-9. Three collected data sets for Diverter C at 1.51 L/min flow rate with the diverter chamber drain closed.
Replication 1 Time (min) Sample port Conductivity
(ms/cm) Total dissolved
solids (g/L) Salinity Temp (oC)
0.0 - 44.1 29.4 27.6 18.0 30.0 1 43.2 28.8 27.0 17.7 30.0 2 43.2 28.8 27.0 17.7 30.0 3 43.3 28.8 27.1 17.7 30.0 4 43.4 28.8 27.0 17.8 30.0 5 43.2 28.8 27.0 17.8 30.0 6 43.0 28.7 26.9 17.9 30.0 7 42.1 28.2 26.4 18.0
Replication 2 Time (min) Sample port Conductivity
(ms/cm) Total dissolved
solids (g/L) Salinity Temp (oC)
0.0 - 43.9 29.3 27.6 18.4 30.0 1 43.1 28.7 27.0 18.2 30.0 2 43.4 28.9 27.1 18.2 30.0 3 43.5 29.0 27.2 18.2 30.0 4 43.5 29.0 27.3 18.2 30.0 5 43.6 29.0 27.3 18.2 30.0 6 43.5 29.0 27.3 18.3 30.0 7 43.6 29.0 27.3 18.2
Replication 3 Time (min) Sample port Conductivity
(ms/cm) Total dissolved
solids (g/L) Salinity Temp (oC)
0.0 - 43.8 29.2 27.6 19.7 30.0 1 42.4 28.2 26.5 18.9 30.0 2 42.9 28.5 26.8 18.9 30.0 3 42.8 28.5 26.8 19.0 30.0 4 43.2 28.7 27.1 19.0 30.0 5 43.4 28.8 27.2 19.1 30.0 6 43.3 28.8 27.2 19.1 30.0 7 42.6 28.4 26.7 19.0

101
Table A-10. Three collected data sets for Diverter D at 1.51 L/min flow rate with the diverter chamber drain closed.
Replication 1 Time (min) Sample port Conductivity
(ms/cm) Total dissolved
solids (g/L) Salinity Temp (oC)
0.0 - 44.0 29.3 27.6 18.2 30.0 1 42.3 28.4 26.5 18.0 30.0 2 43.1 28.7 26.9 17.9 30.0 3 43.3 28.8 27.0 17.9 30.0 4 43.3 28.7 27.0 18.0 30.0 5 43.2 28.7 27.0 18.0 30.0 6 43.2 28.7 27.0 18.0 30.0 7 43.4 28.3 26.6 17.9
Replication 2 Time (min) Sample port Conductivity
(ms/cm) Total dissolved
solids (g/L) Salinity Temp (oC)
0.0 - 44.0 29.3 27.6 18.1 30.0 1 42.5 28.2 26.4 17.1 30.0 2 43.4 28.8 27.0 17.4 30.0 3 43.4 28.9 27.1 17.5 30.0 4 43.2 28.8 27.0 17.6 30.0 5 43.1 28.7 26.9 17.7 30.0 6 43.0 28.7 26.8 17.8 30.0 7 42.3 28.2 26.5 17.6
Replication 3 Time (min) Sample port Conductivity
(ms/cm) Total dissolved
solids (g/L) Salinity Temp (oC)
0.0 - 44.2 29.5 27.7 18.1 30.0 1 44.0 29.3 27.4 16.8 30.0 2 44.2 29.4 27.5 17.1 30.0 3 44.1 29.2 27.5 17.4 30.0 4 43.9 29.1 27.4 17.5 30.0 5 43.6 29.1 27.3 17.7 30.0 6 43.5 29.0 27.2 17.7 30.0 7 42.6 28.4 26.7 17.7

102
Table A-11. Three collected data sets for Diverter E at 1.51 L/min flow rate with the diverter chamber drain closed.
Replication 1 Time (min) Sample port Conductivity
(ms/cm) Total dissolved
solids (g/L) Salinity Temp (oC)
0.0 - 44.0 29.3 27.6 18.2 30.0 1 42.2 27.9 26.1 17.8 30.0 2 42.7 28.4 26.6 17.7 30.0 3 42.9 28.5 26.7 17.8 30.0 4 43.1 28.7 26.9 17.7 30.0 5 43.6 29.0 27.3 17.7 30.0 6 43.6 29.0 27.3 17.8 30.0 7 43.8 28.5 26.8 17.7
Replication 2 Time (min) Sample port Conductivity
(ms/cm) Total dissolved
solids (g/L) Salinity Temp (oC)
0.0 - 44.0 29.3 27.6 18.1 30.0 1 42.4 28.1 26.3 18.1 30.0 2 43.2 28.8 27.0 18.0 30.0 3 43.3 28.8 27.1 18.0 30.0 4 43.3 28.9 27.1 18.0 30.0 5 43.4 28.9 27.2 17.9 30.0 6 43.3 28.8 27.1 17.9 30.0 7 42.5 28.4 26.7 17.9
Replication 3 Time (min) Sample port Conductivity
(ms/cm) Total dissolved
solids (g/L) Salinity Temp (oC)
0.0 - 44.2 29.5 27.7 18.1 30.0 1 43.9 29.2 27.4 17.6 30.0 2 43.8 29.2 27.5 17.7 30.0 3 44.2 29.4 27.7 17.9 30.0 4 44.0 29.3 27.6 17.9 30.0 5 43.9 29.2 27.5 18.0 30.0 6 43.8 29.2 27.5 18.0 30.0 7 42.9 28.6 26.9 17.9

103
Table A-12. Three collected data sets for Diverter F at 1.51 L/min flow rate with the diverter chamber drain closed.
Replication 1 Time (min) Sample port Conductivity
(ms/cm) Total dissolved
solids (g/L) Salinity Temp (oC)
0.0 - 44.2 29.5 27.8 19.6 30.0 1 42.4 28.3 26.6 19.3 30.0 2 42.9 28.5 26.9 19.3 30.0 3 43.0 28.6 27.0 19.3 30.0 4 43.1 28.7 27.1 19.2 30.0 5 43.1 28.7 27.1 19.2 30.0 6 43.2 28.8 27.1 19.1 30.0 7 42.7 28.5 26.8 19.1
Replication 2 Time (min) Sample port Conductivity
(ms/cm) Total dissolved
solids (g/L) Salinity Temp (oC)
0.0 - 44.1 29.4 27.7 19.0 30.0 1 42.1 28.0 26.3 18.9 30.0 2 42.5 28.3 26.6 18.7 30.0 3 43.0 28.6 26.9 18.7 30.0 4 43.2 28.7 27.0 18.6 30.0 5 43.3 28.8 27.1 18.6 30.0 6 43.3 28.8 27.1 18.6 30.0 7 42.8 28.5 26.8 18.6
Replication 3 Time (min) Sample port Conductivity
(ms/cm) Total dissolved
solids (g/L) Salinity Temp (oC)
0.0 - 44.2 29.4 27.7 18.6 30.0 1 42.3 28.2 26.5 18.8 30.0 2 42.7 28.4 26.7 18.8 30.0 3 42.9 28.6 26.9 18.7 30.0 4 43.1 28.7 27.0 18.6 30.0 5 43.1 28.7 27.0 18.6 30.0 6 43.0 28.6 26.9 18.6 30.0 7 42.5 28.4 26.7 18.4

104
Table A-13. Three collected data sets for Diverter A at 3.03 L/min flow rate with the diverter chamber drain closed.
Replication 1 Time (min) Sample port Conductivity
(ms/cm) Total dissolved
solids (g/L) Salinity Temp (oC)
0.0 - 43.8 29.2 27.5 19.0 30.0 1 41.2 27.4 25.5 17.0 30.0 2 42.9 28.4 26.6 17.4 30.0 3 43.6 29.0 27.2 17.7 30.0 4 43.8 29.1 27.3 18.0 30.0 5 43.8 29.1 27.4 18.1 30.0 6 43.6 29.1 27.3 18.2 30.0 7 43.1 28.7 27.0 18.2
Replication 2 Time (min) Sample port Conductivity
(ms/cm) Total dissolved
solids (g/L) Salinity Temp (oC)
0.0 - 43.9 29.2 27.5 18.5 30.0 1 42.8 28.4 26.7 17.6 30.0 2 43.4 28.8 27.0 17.7 30.0 3 43.4 28.9 27.1 17.7 30.0 4 43.4 28.9 27.1 17.9 30.0 5 43.4 28.9 27.2 17.9 30.0 6 43.2 28.9 27.1 18.0 30.0 7 42.7 28.5 26.7 18.0
Replication 3 Time (min) Sample port Conductivity
(ms/cm) Total dissolved
solids (g/L) Salinity Temp (oC)
0.0 - 43.3 28.9 27.3 19.3 30.0 1 41.6 27.7 25.9 18.4 30.0 2 41.9 27.9 26.2 18.4 30.0 3 42.1 28.0 26.3 18.4 30.0 4 42.3 28.1 26.3 18.5 30.0 5 42.3 28.2 26.4 18.6 30.0 6 42.0 28.2 26.5 18.6 30.0 7 42.6 28.3 26.6 18.5

105
Table A-14. Three collected data sets for Diverter B at 3.03 L/min flow rate with the diverter chamber drain closed.
Replication 1 Time (min) Sample port Conductivity
(ms/cm) Total dissolved
solids (g/L) Salinity Temp (oC)
0.0 - 43.8 29.2 27.5 19.0 30.0 1 41.8 27.8 26.0 18.2 30.0 2 42.6 28.3 26.6 18.2 30.0 3 42.9 28.5 26.8 18.2 30.0 4 43.0 28.6 26.9 18.3 30.0 5 43.1 28.7 27.0 18.4 30.0 6 43.2 28.7 27.0 18.4 30.0 7 42.7 28.4 26.7 18.3
Replication 2 Time (min) Sample port Conductivity
(ms/cm) Total dissolved
solids (g/L) Salinity Temp (oC)
0.0 - 43.9 29.2 27.5 18.5 30.0 1 42.9 28.6 26.8 17.7 30.0 2 43.3 28.8 27.0 17.8 30.0 3 43.3 28.8 27.1 17.9 30.0 4 43.2 28.8 27.0 18.0 30.0 5 43.2 28.7 27.0 18.1 30.0 6 43.2 28.8 27.0 18.1 30.0 7 42.7 28.4 26.7 18.1
Replication 3 Time (min) Sample port Conductivity
(ms/cm) Total dissolved
solids (g/L) Salinity Temp (oC)
0.0 - 43.3 28.9 27.3 19.3 30.0 1 41.6 27.7 25.9 18.4 30.0 2 41.9 27.9 26.1 18.4 30.0 3 42.1 28.0 26.3 18.5 30.0 4 42.1 28.0 26.3 18.5 30.0 5 42.1 28.1 26.3 18.6 30.0 6 42.0 28.0 26.3 18.6 30.0 7 41.4 27.6 25.8 18.6
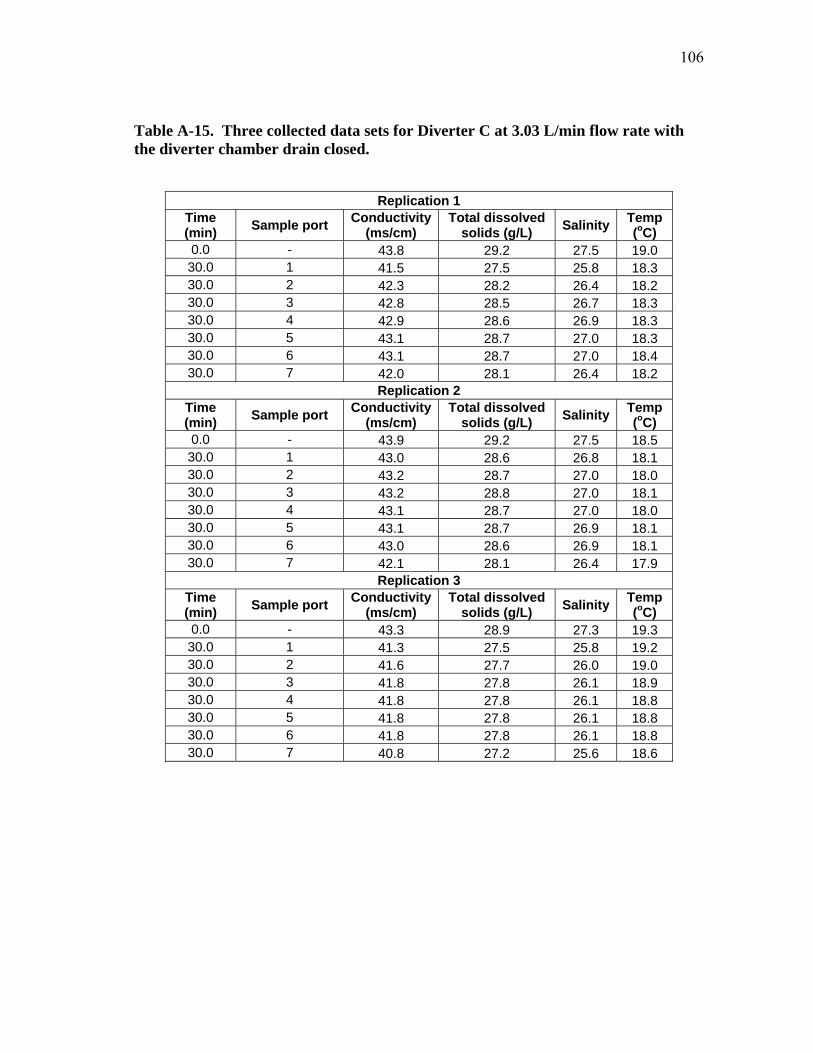
106
Table A-15. Three collected data sets for Diverter C at 3.03 L/min flow rate with the diverter chamber drain closed.
Replication 1 Time (min) Sample port Conductivity
(ms/cm) Total dissolved
solids (g/L) Salinity Temp (oC)
0.0 - 43.8 29.2 27.5 19.0 30.0 1 41.5 27.5 25.8 18.3 30.0 2 42.3 28.2 26.4 18.2 30.0 3 42.8 28.5 26.7 18.3 30.0 4 42.9 28.6 26.9 18.3 30.0 5 43.1 28.7 27.0 18.3 30.0 6 43.1 28.7 27.0 18.4 30.0 7 42.0 28.1 26.4 18.2
Replication 2 Time (min) Sample port Conductivity
(ms/cm) Total dissolved
solids (g/L) Salinity Temp (oC)
0.0 - 43.9 29.2 27.5 18.5 30.0 1 43.0 28.6 26.8 18.1 30.0 2 43.2 28.7 27.0 18.0 30.0 3 43.2 28.8 27.0 18.1 30.0 4 43.1 28.7 27.0 18.0 30.0 5 43.1 28.7 26.9 18.1 30.0 6 43.0 28.6 26.9 18.1 30.0 7 42.1 28.1 26.4 17.9
Replication 3 Time (min) Sample port Conductivity
(ms/cm) Total dissolved
solids (g/L) Salinity Temp (oC)
0.0 - 43.3 28.9 27.3 19.3 30.0 1 41.3 27.5 25.8 19.2 30.0 2 41.6 27.7 26.0 19.0 30.0 3 41.8 27.8 26.1 18.9 30.0 4 41.8 27.8 26.1 18.8 30.0 5 41.8 27.8 26.1 18.8 30.0 6 41.8 27.8 26.1 18.8 30.0 7 40.8 27.2 25.6 18.6

107
Table A-16. Three collected data sets for Diverter D at 3.03 L/min flow rate with the diverter chamber drain closed.
Replication 1 Time (min) Sample port Conductivity
(ms/cm) Total dissolved
solids (g/L) Salinity Temp (oC)
0.0 - 44.0 29.3 27.8 21.3 30.0 1 41.5 27.6 26.0 20.1 30.0 2 43.6 28.9 27.2 20.2 30.0 3 43.7 29.0 27.4 20.3 30.0 4 43.6 29.0 27.4 20.4 30.0 5 43.6 28.9 27.3 20.5 30.0 6 43.5 28.9 27.3 20.6 30.0 7 42.7 28.5 26.9 20.6
Replication 2 Time (min) Sample port Conductivity
(ms/cm) Total dissolved
solids (g/L) Salinity Temp (oC)
0.0 - 43.7 29.2 27.5 20.2 30.0 1 39.8 26.5 24.8 20.4 30.0 2 42.4 28.2 26.4 20.5 30.0 3 42.7 28.4 26.8 20.5 30.0 4 42.7 28.4 26.8 20.5 30.0 5 42.7 28.4 26.7 20.5 30.0 6 42.8 28.5 26.8 20.5 30.0 7 42.0 27.8 26.3 20.4
Replication 3 Time (min) Sample port Conductivity
(ms/cm) Total dissolved
solids (g/L) Salinity Temp (oC)
0.0 - 44.2 29.4 27.9 21.8 30.0 1 26.0 17.3 15.6 20.6 30.0 2 42.9 28.5 26.8 20.8 30.0 3 43.5 28.9 27.4 21.0 30.0 4 43.6 29.0 27.5 21.1 30.0 5 43.4 29.0 27.5 21.2 30.0 6 43.3 29.0 27.3 21.3 30.0 7 42.8 28.5 27.0 21.3

108
Table A-17. Three collected data sets for Diverter E at 3.03 L/min flow rate with the diverter chamber drain closed.
Replication 1 Time (min) Sample port Conductivity
(ms/cm) Total dissolved
solids (g/L) Salinity Temp (oC)
0.0 - 44.0 29.3 27.8 21.3 30.0 1 31.3 20.8 19.1 20.4 30.0 2 42.8 28.5 26.9 20.5 30.0 3 43.3 28.8 27.2 20.6 30.0 4 43.4 28.9 27.3 20.7 30.0 5 43.3 28.8 27.3 20.7 30.0 6 43.3 28.8 27.3 20.7 30.0 7 42.5 28.4 26.8 20.7
Replication 2 Time (min) Sample port Conductivity
(ms/cm) Total dissolved
solids (g/L) Salinity Temp (oC)
0.0 - 44.0 29.2 27.7 20.4 30.0 1 42.0 27.9 26.2 19.5 30.0 2 43.0 28.5 26.7 19.6 30.0 3 43.1 28.5 27.0 19.8 30.0 4 43.1 28.7 27.0 19.9 30.0 5 43.2 28.7 27.1 20.0 30.0 6 43.0 28.7 27.1 20.0 30.0 7 42.4 28.4 26.8 20.0
Replication 3 Time (min) Sample port Conductivity
(ms/cm) Total dissolved
solids (g/L) Salinity Temp (oC)
0.0 - 44.2 29.4 27.9 21.8 30.0 1 41.1 27.3 25.7 21.3 30.0 2 42.4 28.2 26.7 21.2 30.0 3 43.0 28.6 27.1 21.2 30.0 4 43.1 28.7 27.1 21.3 30.0 5 43.2 28.8 27.2 21.3 30.0 6 43.2 28.8 27.2 21.3 30.0 7 42.6 28.4 26.9 21.3

109
Table A-18. Three collected data sets for Diverter F at 3.03 L/min flow rate with the diverter chamber drain closed.
Replication 1 Time (min) Sample port Conductivity
(ms/cm) Total dissolved
solids (g/L) Salinity Temp (oC)
0.0 - 44.0 29.3 27.8 21.3 30.0 1 31.3 20.8 19.1 20.4 30.0 2 42.8 28.5 26.9 20.5 30.0 3 43.3 28.8 27.2 20.6 30.0 4 43.4 28.9 27.3 20.7 30.0 5 43.3 28.8 27.3 20.7 30.0 6 43.3 28.8 27.3 20.7 30.0 7 42.5 28.4 26.8 20.7
Replication 2 Time (min) Sample port Conductivity
(ms/cm) Total dissolved
solids (g/L) Salinity Temp (oC)
0.0 - 44.2 29.4 27.8 19.6 30.0 1 38.7 25.8 24.0 19.5 30.0 2 42.1 28.0 26.3 19.5 30.0 3 42.8 28.5 26.8 19.5 30.0 4 43.0 28.7 27.0 19.5 30.0 5 43.2 28.8 27.2 19.4 30.0 6 43.3 28.8 27.2 19.4 30.0 7 42.9 28.6 26.9 19.3
Replication 3 Time (min) Sample port Conductivity
(ms/cm) Total dissolved
solids (g/L) Salinity Temp (oC)
0.0 - 44.2 29.4 27.8 19.6 30.0 1 42.3 28.2 26.5 19.5 30.0 2 42.8 28.5 26.8 19.5 30.0 3 43.0 28.6 27.0 19.4 30.0 4 43.1 28.7 27.1 19.3 30.0 5 43.2 28.7 27.1 19.3 30.0 6 43.1 28.7 27.1 19.3 30.0 7 42.7 28.4 26.8 19.2

110
Table A-19. Three collected data sets for Diverter A at 12.11 L/min flow rate with the diverter chamber drain closed.
Replication 1 Time (min) Sample port Conductivity
(ms/cm) Total dissolved
solids (g/L) Salinity Temp (oC)
0.0 - 44.2 29.4 27.8 19.9 30.0 1 40.0 26.6 24.8 19.2 30.0 2 42.6 28.3 26.6 19.5 30.0 3 43.0 28.6 27.0 19.6 30.0 4 43.2 28.8 27.1 19.8 30.0 5 43.2 28.7 27.1 19.8 30.0 6 43.2 28.8 27.2 19.9 30.0 7 43.1 28.7 27.1 19.9
Replication 2 Time (min) Sample port Conductivity
(ms/cm) Total dissolved
solids (g/L) Salinity Temp (oC)
0.0 - 44.1 29.3 27.7 18.8 30.0 1 43.0 28.6 27.0 19.3 30.0 2 42.9 28.6 26.9 19.4 30.0 3 43.0 28.6 27.0 19.3 30.0 4 42.9 28.6 26.9 19.3 30.0 5 43.0 28.6 27.0 19.3 30.0 6 43.0 28.6 27.0 19.3 30.0 7 43.6 29.1 27.4 19.2
Replication 3 Time (min) Sample port Conductivity
(ms/cm) Total dissolved
solids (g/L) Salinity Temp (oC)
0.0 - 44.1 29.3 27.8 20.7 30.0 1 42.3 28.2 26.6 20.7 30.0 2 42.7 28.4 26.8 20.7 30.0 3 42.8 28.5 26.9 20.7 30.0 4 42.9 28.6 27.0 20.7 30.0 5 42.9 28.6 27.0 20.7 30.0 6 42.9 28.6 27.0 20.7 30.0 7 42.8 28.6 27.0 20.6

111
Table A-20. Three collected data sets for Diverter B at 12.11 L/min flow rate with the diverter chamber drain closed.
Replication 1 Time (min) Sample port Conductivity
(ms/cm) Total dissolved
solids (g/L) Salinity Temp (oC)
0.0 - 44.2 29.4 27.8 19.9 30.0 1 40.1 26.7 25.0 19.9 30.0 2 41.7 27.8 26.1 20.0 30.0 3 42.5 28.3 26.7 20.0 30.0 4 42.7 28.5 26.8 20.1 30.0 5 43.0 28.6 27.0 20.1 30.0 6 43.0 28.6 27.0 20.1 30.0 7 42.9 28.6 27.0 20.1
Replication 2 Time (min) Sample port Conductivity
(ms/cm) Total dissolved
solids (g/L) Salinity Temp (oC)
0.0 - 44.1 29.3 27.7 18.8 30.0 1 41.0 27.3 25.6 20.4 30.0 2 41.8 27.9 26.3 20.2 30.0 3 42.1 28.1 26.5 20.0 30.0 4 42.3 28.2 26.6 19.8 30.0 5 42.3 28.3 26.7 19.7 30.0 6 42.4 28.3 26.7 19.5 30.0 7 42.5 28.3 26.7 19.5
Replication 3 Time (min) Sample port Conductivity
(ms/cm) Total dissolved
solids (g/L) Salinity Temp (oC)
0.0 - 44.1 29.3 27.8 20.7 30.0 1 42.5 28.3 26.7 20.6 30.0 2 42.6 28.4 26.8 20.6 30.0 3 42.5 28.3 26.7 20.7 30.0 4 42.4 28.3 26.7 20.7 30.0 5 42.4 28.2 26.7 20.7 30.0 6 42.6 28.4 26.8 20.6 30.0 7 42.5 28.3 26.8 20.6

112
Table A-21. Three collected data sets for Diverter C at 12.11 L/min flow rate with the diverter chamber drain closed.
Replication 1 Time (min) Sample port Conductivity
(ms/cm) Total dissolved
solids (g/L) Salinity Temp (oC)
0.0 - 44.2 29.4 27.8 19.9 30.0 1 41.3 27.5 25.8 20.1 30.0 2 42.5 28.3 26.7 20.1 30.0 3 43.0 28.6 27.0 20.2 30.0 4 43.1 28.7 27.1 20.2 30.0 5 43.1 28.7 27.1 20.3 30.0 6 42.9 28.6 27.0 20.3 30.0 7 42.7 28.4 26.9 20.2
Replication 2 Time (min) Sample port Conductivity
(ms/cm) Total dissolved
solids (g/L) Salinity Temp (oC)
0.0 - 44.1 29.3 27.7 18.8 30.0 1 42.6 28.4 26.7 19.4 30.0 2 42.6 28.4 26.7 19.5 30.0 3 42.8 28.5 26.8 19.5 30.0 4 42.8 28.5 26.9 19.5 30.0 5 42.7 28.5 26.8 19.5 30.0 6 42.7 28.5 26.9 19.4 30.0 7 42.7 28.4 26.8 19.4
Replication 3 Time (min) Sample port Conductivity
(ms/cm) Total dissolved
solids (g/L) Salinity Temp (oC)
0.0 - 44.1 29.3 27.8 20.7 30.0 1 41.8 27.8 26.2 21.1 30.0 2 42.0 28.0 26.4 21.1 30.0 3 42.2 28.1 26.6 21.1 30.0 4 42.4 28.3 26.7 20.9 30.0 5 42.6 28.4 26.8 20.9 30.0 6 42.7 28.4 26.9 20.9 30.0 7 42.6 28.4 26.9 20.8

113
Table A-22. Three collected data sets for Diverter D at 12.11 L/min flow rate with the diverter chamber drain closed.
Replication 1 Time (min) Sample port Conductivity
(ms/cm) Total dissolved
solids (g/L) Salinity Temp (oC)
0.0 - 44.0 29.3 27.7 19.9 30.0 1 1.7 1.2 20.5 30.0 2 40.8 27.2 25.6 20.3 30.0 3 42.0 28.0 26.4 20.5 30.0 4 42.1 28.0 26.4 20.4 30.0 5 42.1 28.1 26.5 20.3 30.0 6 42.2 28.1 26.5 20.1 30.0 7 41.8 27.9 26.3 19.9
Replication 2 Time (min) Sample port Conductivity
(ms/cm) Total dissolved
solids (g/L) Salinity Temp (oC)
0.0 - 44.0 29.3 27.7 19.8 30.0 1 21.7 14.5 12.9 20.5 30.0 2 41.4 27.7 26.1 20.3 30.0 3 42.3 28.3 26.5 20.2 30.0 4 42.5 28.3 26.6 20.1 30.0 5 42.6 28.4 26.8 20.0 30.0 6 42.6 28.4 26.8 19.9 30.0 7 42.0 28.0 26.9 19.8
Replication 3 Time (min) Sample port Conductivity
(ms/cm) Total dissolved
solids (g/L) Salinity Temp (oC)
0.0 - 43.8 29.2 27.6 19.9 30.0 1 2.9 1.9 19.5 30.0 2 42.0 28.0 26.1 19.5 30.0 3 43.0 28.6 26.8 19.6 30.0 4 42.8 28.7 27.0 19.7 30.0 5 43.0 28.4 26.8 19.7 30.0 6 42.8 28.5 26.9 19.7 30.0 7 42.0 28.0 26.5 19.6

114
Table A-23. Three collected data sets for Diverter E at 12.11 L/min flow rate with the diverter chamber drain closed.
Replication 1 Time (min) Sample port Conductivity
(ms/cm) Total dissolved
solids (g/L) Salinity Temp (oC)
0.0 - 44.0 29.3 27.7 19.9 30.0 1 3.2 2.1 19.8 30.0 2 41.7 27.8 26.1 19.8 30.0 3 42.7 28.4 26.8 19.8 30.0 4 42.7 28.4 26.8 19.8 30.0 5 42.6 28.4 26.7 19.8 30.0 6 42.6 28.4 26.8 19.7 30.0 7 41.8 27.9 26.3 19.6
Replication 2 Time (min) Sample port Conductivity
(ms/cm) Total dissolved
solids (g/L) Salinity Temp (oC)
0.0 - 44.0 29.3 27.7 19.8 30.0 1 2.1 1.4 19.5 30.0 2 42.0 27.9 26.3 19.5 30.0 3 43.1 28.7 27.1 19.6 30.0 4 42.0 28.7 27.0 19.6 30.0 5 43.1 28.7 27.0 19.7 30.0 6 43.0 28.6 27.0 19.6 30.0 7 42.6 28.2 26.6 19.5
Replication 3 Time (min) Sample port Conductivity
(ms/cm) Total dissolved
solids (g/L) Salinity Temp (oC)
0.0 - 43.8 29.2 27.6 19.9 30.0 1 2.6 1.7 19.9 30.0 2 41.4 27.6 25.9 19.9 30.0 3 42.6 28.4 26.8 19.9 30.0 4 42.6 28.4 26.7 19.9 30.0 5 42.7 28.4 26.8 19.8 30.0 6 42.7 28.4 26.8 19.8 30.0 7 42.2 28.1 26.5 19.7

115
Table A-24. Three collected data sets for Diverter F at 12.11 L/min flow rate with the diverter chamber drain closed.
Replication 1 Time (min) Sample port Conductivity
(ms/cm) Total dissolved
solids (g/L) Salinity Temp (oC)
0.0 - 43.9 29.2 27.8 22.8 30.0 1 2.7 1.8 22.9 30.0 2 41.1 27.4 26.1 23.0 30.0 3 42.2 28.2 26.7 22.9 30.0 4 42.6 28.4 26.9 22.8 30.0 5 42.8 28.5 27.0 22.7 30.0 6 42.8 28.5 27.0 22.6 30.0 7 42.4 28.3 26.8 22.4
Replication 2 Time (min) Sample port Conductivity
(ms/cm) Total dissolved
solids (g/L) Salinity Temp (oC)
0.0 - 43.9 29.2 27.8 22.8 30.0 1 2.7 1.8 22.8 30.0 2 41.5 27.7 26.2 22.9 30.0 3 42.5 28.3 26.9 22.8 30.0 4 42.7 28.4 26.9 22.7 30.0 5 42.6 28.4 26.9 22.8 30.0 6 42.8 28.5 26.9 22.6 30.0 7 42.1 28.1 26.6 22.4
Replication 3 Time (min) Sample port Conductivity
(ms/cm) Total dissolved
solids (g/L) Salinity Temp (oC)
0.0 - 44.0 29.2 27.8 22.8 30.0 1 2.7 1.7 22.7 30.0 2 41.2 27.5 26.0 22.8 30.0 3 42.4 28.3 26.8 22.7 30.0 4 42.7 28.4 26.9 22.6 30.0 5 42.7 28.4 27.0 22.5 30.0 6 42.8 28.5 27.0 22.4 30.0 7 42.1 28.2 26.7 22.2

116
Table A-25. Three collected data sets for Diverter A at 22.71 L/min flow rate with the diverter chamber drain closed.
Replication 1 Time (min) Sample port Conductivity
(ms/cm) Total dissolved
solids (g/L) Salinity Temp (oC)
0.0 - 43.9 29.2 27.7 21.6 30.0 1 2.2 1.5 21.5 30.0 2 41.0 27.3 25.7 21.5 30.0 3 42.9 28.6 27.0 21.4 30.0 4 43.5 29.0 27.4 21.4 30.0 5 43.6 29.0 27.5 21.4 30.0 6 43.7 29.1 27.6 21.4 30.0 7 43.6 29.0 27.5 21.4
Replication 2 Time (min) Sample port Conductivity
(ms/cm) Total dissolved
solids (g/L) Salinity Temp (oC)
0.0 - 43.7 29.1 27.6 21.6 30.0 1 2.7 1.8 21.8 30.0 2 41.4 27.4 25.8 21.8 30.0 3 42.6 28.3 26.8 21.7 30.0 4 42.7 28.4 26.9 21.6 30.0 5 42.8 28.5 27.0 21.7 30.0 6 42.6 28.4 26.9 21.7 30.0 7 42.4 28.2 26.8 21.6
Replication 3 Time (min) Sample port Conductivity
(ms/cm) Total dissolved
solids (g/L) Salinity Temp (oC)
0.0 - 44.1 29.3 27.9 22.2 30.0 1 2.8 1.9 22.1 30.0 2 41.5 27.6 26.1 22.1 30.0 3 42.7 28.4 26.9 22.1 30.0 4 42.9 28.6 27.1 22.1 30.0 5 43.0 28.6 27.1 22.1 30.0 6 42.9 28.6 27.1 22.1 30.0 7 42.7 28.5 27.0 22.1

117
Table A-26. Three collected data sets for Diverter B at 22.71 L/min flow rate with the diverter chamber drain closed.
Replication 1 Time (min) Sample port Conductivity
(ms/cm) Total dissolved
solids (g/L) Salinity Temp (oC)
0.0 - 43.9 29.2 27.7 21.6 30.0 1 2.7 1.8 21.4 30.0 2 41.5 27.7 26.1 21.4 30.0 3 42.3 28.2 26.6 21.5 30.0 4 42.7 28.4 26.9 21.5 30.0 5 42.8 28.5 26.9 21.5 30.0 6 42.9 28.5 27.0 21.5 30.0 7 42.8 28.5 27.0 21.5
Replication 2 Time (min) Sample port Conductivity
(ms/cm) Total dissolved
solids (g/L) Salinity Temp (oC)
0.0 - 43.7 29.1 27.6 21.6 30.0 1 2.0 1.4 22.0 30.0 2 41.0 27.3 25.7 21.9 30.0 3 42.3 28.0 26.5 21.8 30.0 4 42.3 28.2 26.6 21.8 30.0 5 42.4 28.3 26.7 21.8 30.0 6 42.5 28.4 26.2 21.8 30.0 7 42.4 28.2 26.5 21.7
Replication 3 Time (min) Sample port Conductivity
(ms/cm) Total dissolved
solids (g/L) Salinity Temp (oC)
0.0 - 44.1 29.3 27.9 22.2 30.0 1 2.3 1.6 22.0 30.0 2 41.5 27.7 26.1 22.0 30.0 3 42.9 28.5 27.0 22.0 30.0 4 43.0 28.6 27.1 22.1 30.0 5 43.0 28.6 27.1 22.1 30.0 6 42.9 28.6 27.1 22.1 30.0 7 42.3 28.2 28.2 22.1

118
Table A-27. Three collected data sets for Diverter C at 22.71 L/min flow rate with the diverter chamber drain closed.
Replication 1 Time (min) Sample port Conductivity
(ms/cm) Total dissolved
solids (g/L) Salinity Temp (oC)
0.0 - 43.9 29.2 27.7 21.6 30.0 1 30.3 20.2 18.6 21.6 30.0 2 41.9 27.9 26.3 21.5 30.0 3 42.7 28.4 26.8 21.5 30.0 4 42.9 28.6 27.0 21.5 30.0 5 43.0 28.6 27.1 21.6 30.0 6 43.0 28.6 27.1 21.6 30.0 7 42.7 28.4 26.9 21.5
Test run 2 Time (min) Sample port Conductivity
(ms/cm) Total dissolved
solids (g/L) Salinity Temp (oC)
0.0 - 43.7 29.1 27.6 21.6 30.0 1 42.6 28.2 26.7 21.8 30.0 2 42.6 28.3 26.8 21.8 30.0 3 42.4 28.2 26.7 21.7 30.0 4 42.7 28.5 26.9 21.7 30.0 5 42.6 28.4 26.9 21.7 30.0 6 42.6 28.4 26.8 21.7 30.0 7 42.3 28.2 26.6 21.7
Replication 3 Time (min) Sample port Conductivity
(ms/cm) Total dissolved
solids (g/L) Salinity Temp (oC)
0.0 - 44.1 29.3 27.9 22.2 30.0 1 42.4 28.2 26.6 22.6 30.0 2 42.4 28.3 26.7 22.6 30.0 3 42.5 28.2 26.8 22.5 30.0 4 42.4 28.3 26.8 22.5 30.0 5 42.5 28.3 26.8 22.4 30.0 6 42.5 28.3 26.8 22.3 30.0 7 41.7 27.9 26.3 22.2

119
Table A-28. Three collected data sets for Diverter D at 22.71 L/min flow rate with the diverter chamber drain closed.
Replication 1 Time (min) Sample port Conductivity
(ms/cm) Total dissolved
solids (g/L) Salinity Temp (oC)
0.0 - 43.6 29.1 27.6 21.8 30.0 1 39.9 26.7 25.5 21.8 30.0 2 42.7 28.4 26.7 21.9 30.0 3 42.7 28.5 26.9 21.9 30.0 4 42.6 28.4 26.9 21.9 30.0 5 42.6 28.4 26.9 21.9 30.0 6 42.6 28.4 26.9 21.9 30.0 7 42.2 28.1 26.6 21.9
Replication 2 Time (min) Sample port Conductivity
(ms/cm) Total dissolved
solids (g/L) Salinity Temp (oC)
0.0 - 43.5 29.0 27.5 21.8 30.0 1 4.4 2.9 22.0 30.0 2 41.8 27.8 26.2 21.9 30.0 3 42.5 28.3 26.7 21.9 30.0 4 42.5 28.3 26.8 21.9 30.0 5 42.5 28.3 26.8 21.9 30.0 6 42.5 28.3 26.8 21.9 30.0 7 42.1 28.1 26.6 21.9
Replication 3 Time (min) Sample port Conductivity
(ms/cm) Total dissolved
solids (g/L) Salinity Temp (oC)
0.0 - 43.5 29.0 27.5 21.8 30.0 1 2.8 1.8 22.0 30.0 2 42.0 27.9 26.4 22.0 30.0 3 42.9 28.5 27.0 22.0 30.0 4 42.9 28.6 27.0 22.1 30.0 5 42.8 28.5 26.9 22.1 30.0 6 42.7 28.4 27.0 22.1 30.0 7 42.3 28.2 26.7 22.1

120
Table A-29. Three collected data sets for Diverter E at 22.71 L/min flow rate with the diverter chamber drain closed
Replication 1 Time (min) Sample port Conductivity
(ms/cm) Total dissolved
solids (g/L) Salinity Temp (oC)
0.0 - 43.6 29.1 27.6 21.8 30.0 1 2.4 1.6 21.7 30.0 2 41.6 27.7 26.1 21.7 30.0 3 42.8 28.4 26.8 21.8 30.0 4 42.7 28.4 26.9 21.8 30.0 5 42.8 28.5 26.9 21.8 30.0 6 42.5 28.3 26.8 21.9 30.0 7 42.3 28.2 26.7 21.8
Replication 2 Time (min) Sample port Conductivity
(ms/cm) Total dissolved
solids (g/L) Salinity Temp (oC)
0.0 - 43.5 29.0 27.5 21.8 30.0 1 14.0 9.3 8.0 21.8 30.0 2 41.7 27.7 26.2 21.8 30.0 3 42.6 28.3 26.6 21.9 30.0 4 42.6 28.4 26.8 21.9 30.0 5 42.6 28.3 26.8 21.9 30.0 6 42.5 28.3 26.8 21.9 30.0 7 42.3 28.2 26.7 21.9
Replication 3 Time (min) Sample port Conductivity
(ms/cm) Total dissolved
solids (g/L) Salinity Temp (oC)
0.0 - 43.5 29.0 27.5 21.8 30.0 1 2.3 1.5 22.0 30.0 2 41.5 27.7 26.1 22.0 30.0 3 42.7 28.4 26.8 22.0 30.0 4 42.7 28.4 26.7 22.1 30.0 5 42.6 28.4 26.9 22.1 30.0 6 42.5 28.3 26.8 22.1 30.0 7 42.3 28.2 26.6 22.1

121
Table A-30. Three collected data sets for Diverter F at 22.71 L/min flow rate with the diverter chamber drain closed.
Replication 1 Time (min) Sample port Conductivity
(ms/cm) Total dissolved
solids (g/L) Salinity Temp (oC)
0.0 - 44.3 29.5 28.1 23.3 30.0 1 3.6 2.4 23.2 30.0 2 41.8 27.9 26.4 23.0 30.0 3 43.1 28.7 27.2 22.8 30.0 4 43.6 29.0 27.5 22.6 30.0 5 43.7 29.1 27.6 22.5 30.0 6 43.8 29.1 27.6 22.5 30.0 7 43.1 28.7 27.3 22.5
Replication 2 Time (min) Sample port Conductivity
(ms/cm) Total dissolved
solids (g/L) Salinity Temp (oC)
0.0 - 44.0 29.2 28.1 23.1 30.0 1 11.3 7.6 6.4 23.2 30.0 2 41.5 27.7 26.3 23.2 30.0 3 42.7 28.5 27.1 23.1 30.0 4 43.0 28.6 27.2 23.0 30.0 5 43.1 28.7 27.2 22.9 30.0 6 43.1 28.7 27.2 22.8 30.0 7 42.4 28.3 26.9 22.7
Replication 3 Time (min) Sample port Conductivity
(ms/cm) Total dissolved
solids (g/L) Salinity Temp (oC)
0.0 - 43.9 29.2 27.8 22.9 30.0 1 12.5 8.4 7.0 23.3 30.0 2 41.3 27.6 26.2 23.3 30.0 3 42.4 28.3 26.8 23.3 30.0 4 42.5 28.3 26.9 23.1 30.0 5 42.6 28.4 26.9 23.0 30.0 6 42.7 28.4 27.0 22.8 30.0 7 42.4 28.2 26.6 22.7

122
Table A-31. Three collected data sets for Diverter A at 43.91 L/min flow rate with the diverter chamber drain closed.
Replication 1 Time (min) Sample port Conductivity
(ms/cm) Total dissolved
solids (g/L) Salinity Temp (oC)
0.0 - 44.1 29.4 28.3 32.8 30.0 1 2.2 1.5 32.3 30.0 2 42.2 28.3 27.3 32.2 30.0 3 43.8 29.2 28.2 31.7 30.0 4 44.1 29.4 28.3 31.5 30.0 5 44.1 29.4 28.4 31.3 30.0 6 44.2 29.4 28.4 31.2 30.0 7 44.1 29.4 28.3 31.1
Replication 2 Time (min) Sample port Conductivity
(ms/cm) Total dissolved
solids (g/L) Salinity Temp (oC)
0.0 - 44.0 29.3 28.2 31.3 30.0 1 2.5 1.6 30.5 30.0 2 42.8 28.5 27.4 30.0 30.0 3 43.9 29.2 28.0 29.9 30.0 4 44.0 29.3 28.2 29.9 30.0 5 43.9 29.2 28.1 29.7 30.0 6 44.0 29.3 28.2 29.6 30.0 7 43.6 29.1 27.9 29.6
Replication 3 Time (min) Sample port Conductivity
(ms/cm) Total dissolved
solids (g/L) Salinity Temp (oC)
0.0 - 44.2 29.3 28.0 22.8 30.0 1 2.1 1.4 22.1 30.0 2 42.2 28.0 26.5 22.0 30.0 3 43.0 28.7 27.1 22.2 30.0 4 43.0 28.6 27.1 22.2 30.0 5 43.2 28.8 27.3 22.2 30.0 6 43.3 28.8 27.3 22.3 30.0 7 42.5 28.3 26.8 22.5

123
Table A-32. Three collected data sets for Diverter B at 43.91 L/min flow rate with the diverter chamber drain closed.
Replication 1 Time (min) Sample port Conductivity
(ms/cm) Total dissolved
solids (g/L) Salinity Temp (oC)
0.0 - 44.1 29.4 28.3 32.8 30.0 1 2.1 1.4 34.5 30.0 2 41.3 27.6 26.5 33.1 30.0 3 42.5 28.3 27.3 33.4 30.0 4 42.6 28.5 27.3 33.4 30.0 5 42.7 28.5 27.5 33.3 30.0 6 42.8 28.9 27.8 32.4 30.0 7 43.7 28.9 27.8 32.3
Replication 2 Time (min) Sample port Conductivity
(ms/cm) Total dissolved
solids (g/L) Salinity Temp (oC)
0.0 - 44.0 29.3 28.2 31.3 30.0 1 2.3 1.5 31.0 30.0 2 2.6 1.7 30.4 30.0 3 42.4 28.2 27.0 30.3 30.0 4 43.4 28.9 27.8 30.2 30.0 5 43.3 28.7 27.6 30.1 30.0 6 43.7 29.0 28.0 30.0 30.0 7 43.5 29.0 27.9 29.9
Replication 3 Time (min) Sample port Conductivity
(ms/cm) Total dissolved
solids (g/L) Salinity Temp (oC)
0.0 - 44.2 29.3 28.0 22.8 30.0 1 2.3 1.6 22.4 30.0 2 3.2 2.1 22.5 30.0 3 41.7 27.7 26.3 22.5 30.0 4 42.8 28.6 27.0 22.4 30.0 5 43.1 28.7 27.2 22.4 30.0 6 43.0 28.7 27.2 22.4 30.0 7 42.6 28.5 26.9 22.3

124
Table A-33. Three collected data sets for Diverter C at 43.91 L/min flow rate with the diverter chamber drain closed.
Replication 1 Time (min) Sample port Conductivity
(ms/cm) Total dissolved
solids (g/L) Salinity Temp (oC)
0.0 - 44.1 29.4 28.3 32.8 30.0 1 44.0 29.3 28.3 33.6 30.0 2 44.1 29.4 28.4 33.1 30.0 3 43.9 29.2 28.3 33.4 30.0 4 43.9 29.3 28.2 33.5 30.0 5 44.0 29.3 28.3 33.4 30.0 6 43.7 29.1 28.1 33.5 30.0 7 43.3 28.3 28.0 33.4
Replication 2 Time (min) Sample port Conductivity
(ms/cm) Total dissolved
solids (g/L) Salinity Temp (oC)
0.0 - 44.0 29.3 28.2 31.3 30.0 1 41.6 27.7 26.5 32.2 30.0 2 42.0 28.0 26.9 32.1 30.0 3 42.3 28.2 27.7 30.2 30.0 4 41.8 27.8 26.5 30.0 30.0 5 43.9 29.2 28.1 30.0 30.0 6 43.9 29.2 28.0 30.0 30.0 7 43.1 28.7 27.5 29.9
Replication 3 Time (min) Sample port Conductivity
(ms/cm) Total dissolved
solids (g/L) Salinity Temp (oC)
0.0 - 44.2 29.3 28.0 22.8 30.0 1 42.2 28.2 26.9 22.7 30.0 2 42.9 28.5 27.0 22.4 30.0 3 43.0 28.6 27.1 22.4 30.0 4 43.0 28.6 27.0 22.3 30.0 5 43.0 28.6 26.9 22.4 30.0 6 43.1 28.6 26.8 22.6 30.0 7 44.0 29.3 28.0 22.2

125
Table A-34. Three collected data sets for Diverter D at 43.91 L/min flow rate with the diverter chamber drain closed.
Replication 1 Time (min) Sample port Conductivity
(ms/cm) Total dissolved
solids (g/L) Salinity Temp (oC)
0.0 - 44.0 29.2 27.7 20.4 30.0 1 2.5 1.6 20.1 30.0 2 2.7 1.8 20.2 30.0 3 41.3 27.6 26.0 20.3 30.0 4 42.5 28.3 26.7 20.3 30.0 5 42.8 28.5 26.9 20.3 30.0 6 42.9 28.6 27.0 20.3 30.0 7 42.3 28.2 26.7 20.3
Replication 2 Time (min) Sample port Conductivity
(ms/cm) Total dissolved
solids (g/L) Salinity Temp (oC)
0.0 - 43.8 29.2 27.6 20.3 30.0 1 1.9 1.3 22.3 30.0 2 14.8 9.8 8.5 22.1 30.0 3 40.8 27.3 25.8 21.9 30.0 4 41.7 27.9 26.3 21.5 30.0 5 41.9 28.0 26.4 21.2 30.0 6 42.0 28.0 26.5 21.0 30.0 7 41.4 27.6 26.1 20.7
Replication 3 Time (min) Sample port Conductivity
(ms/cm) Total dissolved
solids (g/L) Salinity Temp (oC)
0.0 - 43.9 29.2 27.7 22.1 30.0 1 3.6 2.6 22.3 30.0 2 38.0 24.5 24.0 22.3 30.0 3 42.8 28.4 26.7 22.4 30.0 4 42.8 28.4 26.9 22.5 30.0 5 42.8 28.5 27.0 22.4 30.0 6 42.9 28.5 27.0 22.3 30.0 7 42.4 28.3 26.8 22.2

126
Table A-35. Three collected data sets for Diverter E at 43.91 L/min flow rate with the diverter chamber drain closed.
Replication 1 Time (min) Sample port Conductivity
(ms/cm) Total dissolved
solids (g/L) Salinity Temp (oC)
0.0 - 44.0 29.2 27.7 20.4 30.0 1 2.3 1.5 20.3 30.0 2 22.7 18.5 16.7 20.5 30.0 3 42.1 28.1 26.5 20.6 30.0 4 42.5 28.2 26.7 20.5 30.0 5 42.7 28.4 26.8 20.5 30.0 6 42.7 28.4 26.9 20.4 30.0 7 42.2 28.2 26.6 20.3
Replication 2 Time (min) Sample port Conductivity
(ms/cm) Total dissolved
solids (g/L) Salinity Temp (oC)
0.0 - 43.8 29.2 27.6 20.3 30.0 1 1.9 1.2 19.5 30.0 2 1.4 0.9 19.9 30.0 3 43.7 29.1 27.4 20.3 30.0 4 44.2 29.2 27.6 20.7 30.0 5 44.0 29.2 27.6 20.9 30.0 6 43.6 29.0 27.6 21.1 30.0 7 42.5 28.4 26.8 21.1
Replication 3 Time (min) Sample port Conductivity
(ms/cm) Total dissolved
solids (g/L) Salinity Temp (oC)
0.0 - 43.9 29.2 27.7 22.1 30.0 1 2.6 1.7 22.4 30.0 2 41.5 27.6 26.1 22.4 30.0 3 42.6 28.3 26.8 22.5 30.0 4 42.7 28.4 26.9 22.5 30.0 5 42.8 28.5 26.9 22.4 30.0 6 42.7 28.4 27.0 22.4 30.0 7 42.6 28.5 26.9 22.3

127
Table A-36. Three collected data sets for Diverter F at 43.91 L/min flow rate with the diverter chamber drain closed.
Replication 1 Time (min) Sample port Conductivity
(ms/cm) Total dissolved
solids (g/L) Salinity Temp (oC)
0.0 - 44.2 29.5 28.1 24.1 30.0 1 2.2 1.4 24.4 30.0 2 41.6 27.8 26.4 24.6 30.0 3 42.8 28.5 27.2 24.6 30.0 4 42.9 28.6 27.2 24.5 30.0 5 43.2 28.8 27.4 24.4 30.0 6 43.3 28.8 27.4 24.3 30.0 7 42.9 28.6 27.2 24.2
Replication 2 Time (min) Sample port Conductivity
(ms/cm) Total dissolved
solids (g/L) Salinity Temp (oC)
0.0 - 44.2 29.5 28.1 24.1 30.0 1 2.0 1.3 24.7 30.0 2 2.2 1.4 25.2 30.0 3 42.1 28.0 26.6 25.2 30.0 4 42.7 28.5 27.1 25.0 30.0 5 42.9 28.6 27.2 24.7 30.0 6 43.0 28.6 27.3 24.4 30.0 7 42.7 28.5 27.1 24.2
Replication 3 Time (min) Sample port Conductivity
(ms/cm) Total dissolved
solids (g/L) Salinity Temp (oC)
0.0 - 44.2 29.5 28.1 24.1 30.0 1 3.3 2.0 24.7 30.0 2 41.4 27.7 26.4 25.5 30.0 3 42.5 28.3 27.0 25.3 30.0 4 42.7 28.5 27.1 25.0 30.0 5 42.9 28.6 27.2 24.7 30.0 6 43.1 28.7 27.3 24.3 30.0 7 42.8 28.5 27.2 24.0

128
Table A-37. Three collected data sets for Diverter A at 75.71 L/min flow rate with the diverter chamber drain closed.
Replication 1 Time (min) Sample port Conductivity
(ms/cm) Total dissolved
solids (g/L) Salinity Temp (oC)
0.0 - 44.3 29.5 28.1 23.3 30.0 1 3.3 2.2 23.4 30.0 2 3.4 2.5 23.5 30.0 3 41.4 27.6 26.1 23.5 30.0 4 42.5 28.3 26.9 23.5 30.0 5 42.8 28.5 27.1 23.5 30.0 6 43.0 28.6 27.2 23.5 30.0 7 42.9 28.6 27.1 23.4
Replication 2 Time (min) Sample port Conductivity
(ms/cm) Total dissolved
solids (g/L) Salinity Temp (oC)
0.0 - 44.0 29.4 27.8 20.7 30.0 1 2.6 1.7 19.1 30.0 2 2.4 1.6 19.7 30.0 3 42.6 28.4 26.8 20.1 30.0 4 43.1 28.7 27.2 20.3 30.0 5 43.2 28.7 27.2 20.3 30.0 6 43.1 28.7 27.1 20.4 30.0 7 42.7 28.4 26.8 20.3
Replication 3 Time (min) Sample port Conductivity
(ms/cm) Total dissolved
solids (g/L) Salinity Temp (oC)
0.0 - 44.1 29.4 27.8 20.9 30.0 1 3.7 2.4 20.7 30.0 2 3.5 2.3 21.3 30.0 3 41.6 27.8 26.2 21.5 30.0 4 42.3 28.3 26.7 21.5 30.0 5 42.4 28.3 26.7 21.3 30.0 6 42.5 28.3 26.7 21.0 30.0 7 42.3 28.2 26.6 20.6

129
Table A-38. Three collected data sets for Diverter B at 75.71 L/min flow rate with the diverter chamber drain closed.
Replication 1 Time (min) Sample port Conductivity
(ms/cm) Total dissolved
solids (g/L) Salinity Temp (oC)
0.0 - 44.3 29.5 28.1 23.3 30.0 1 2.9 2.0 23.4 30.0 2 2.3 1.5 23.6 30.0 3 41.7 27.7 26.3 23.7 30.0 4 42.5 28.3 26.9 23.7 30.0 5 428.0 28.5 27.1 23.6 30.0 6 42.9 28.5 27.1 23.6 30.0 7 42.8 28.6 27.1 23.5
Replication 2 Time (min) Sample port Conductivity
(ms/cm) Total dissolved
solids (g/L) Salinity Temp (oC)
0.0 - 44.0 29.4 27.8 20.7 30.0 1 2.5 1.7 20.4 30.0 2 41.8 27.8 26.2 20.5 30.0 3 42.7 28.5 26.9 20.5 30.0 4 43.2 28.7 27.2 20.5 30.0 5 43.4 28.9 27.3 20.4 30.0 6 43.4 28.9 27.3 20.4 30.0 7 42.9 28.6 27.0 20.3
Replication 3 Time (min) Sample port Conductivity
(ms/cm) Total dissolved
solids (g/L) Salinity Temp (oC)
0.0 - 44.1 29.4 27.8 20.9 30.0 1 3.1 2.1 21.4 30.0 2 41.3 27.5 26.0 21.4 30.0 3 42.8 28.5 27.0 21.3 30.0 4 43.1 28.6 27.1 21.2 30.0 5 43.0 28.6 27.2 21.0 30.0 6 43.1 28.7 27.2 20.9 30.0 7 42.8 28.5 27.0 20.6
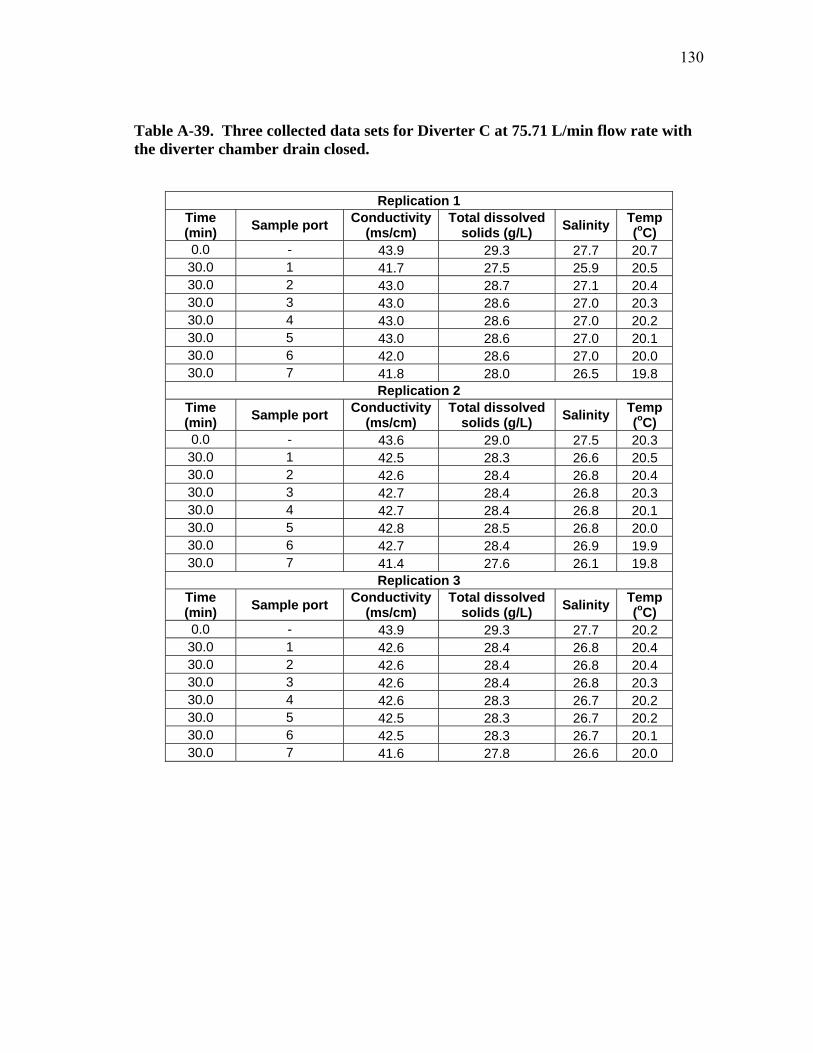
130
Table A-39. Three collected data sets for Diverter C at 75.71 L/min flow rate with the diverter chamber drain closed.
Replication 1 Time (min) Sample port Conductivity
(ms/cm) Total dissolved
solids (g/L) Salinity Temp (oC)
0.0 - 43.9 29.3 27.7 20.7 30.0 1 41.7 27.5 25.9 20.5 30.0 2 43.0 28.7 27.1 20.4 30.0 3 43.0 28.6 27.0 20.3 30.0 4 43.0 28.6 27.0 20.2 30.0 5 43.0 28.6 27.0 20.1 30.0 6 42.0 28.6 27.0 20.0 30.0 7 41.8 28.0 26.5 19.8
Replication 2 Time (min) Sample port Conductivity
(ms/cm) Total dissolved
solids (g/L) Salinity Temp (oC)
0.0 - 43.6 29.0 27.5 20.3 30.0 1 42.5 28.3 26.6 20.5 30.0 2 42.6 28.4 26.8 20.4 30.0 3 42.7 28.4 26.8 20.3 30.0 4 42.7 28.4 26.8 20.1 30.0 5 42.8 28.5 26.8 20.0 30.0 6 42.7 28.4 26.9 19.9 30.0 7 41.4 27.6 26.1 19.8
Replication 3 Time (min) Sample port Conductivity
(ms/cm) Total dissolved
solids (g/L) Salinity Temp (oC)
0.0 - 43.9 29.3 27.7 20.2 30.0 1 42.6 28.4 26.8 20.4 30.0 2 42.6 28.4 26.8 20.4 30.0 3 42.6 28.4 26.8 20.3 30.0 4 42.6 28.3 26.7 20.2 30.0 5 42.5 28.3 26.7 20.2 30.0 6 42.5 28.3 26.7 20.1 30.0 7 41.6 27.8 26.6 20.0

131
Table A-40. Three collected data sets for Diverter D at 75.71 L/min flow rate with the diverter chamber drain closed.
Replication 1 Time (min) Sample port Conductivity
(ms/cm) Total dissolved
solids (g/L) Salinity Temp (oC)
0.0 - 44.2 29.5 27.9 19.9 30.0 1 3.1 2.0 20.3 30.0 2 40.4 27.0 25.5 20.5 30.0 3 41.6 27.7 26.1 20.5 30.0 4 42.3 28.2 26.6 20.3 30.0 5 42.8 28.5 26.9 20.1 30.0 6 43.0 28.7 27.0 19.9 30.0 7 42.5 28.3 26.8 19.7
Replication 2 Time (min) Sample port Conductivity
(ms/cm) Total dissolved
solids (g/L) Salinity Temp (oC)
0.0 - 44.2 29.5 27.9 19.9 30.0 1 3.1 1.9 20.4 30.0 2 41.5 27.7 26.1 20.7 30.0 3 42.8 28.5 27.0 20.7 30.0 4 43.2 28.7 27.3 20.5 30.0 5 43.2 28.8 27.3 20.3 30.0 6 43.5 28.9 27.3 20.0 30.0 7 42.9 28.6 27.0 19.7
Replication 3 Time (min) Sample port Conductivity
(ms/cm) Total dissolved
solids (g/L) Salinity Temp (oC)
0.0 - 44.3 29.5 27.9 19.7 30.0 1 3.5 2.4 20.3 30.0 2 42.3 28.3 26.8 20.6 30.0 3 43.0 28.7 27.1 20.5 30.0 4 43.0 28.7 17.3 20.3 30.0 5 43.2 28.8 27.2 20.0 30.0 6 43.4 28.9 27.3 19.8 30.0 7 42.7 28.4 26.9 19.6

132
Table A-41. Three collected data sets for Diverter E at 75.71 L/min flow rate with the diverter chamber drain closed.
Replication 1 Time (min) Sample port Conductivity
(ms/cm) Total dissolved
solids (g/L) Salinity Temp (oC)
0.0 - 43.9 29.3 27.7 20.7 30.0 1 2.3 1.5 19.7 30.0 2 41.8 27.9 26.2 19.8 30.0 3 43.2 28.8 27.2 19.8 30.0 4 43.3 28.8 27.2 19.8 30.0 5 43.6 28.9 27.4 19.9 30.0 6 43.7 29.0 27.4 19.9 30.0 7 42.8 28.6 27.0 19.7
Replication 2 Time (min) Sample port Conductivity
(ms/cm) Total dissolved
solids (g/L) Salinity Temp (oC)
0.0 - 43.6 29.0 27.5 20.3 30.0 1 2.6 1.7 20.0 30.0 2 41.6 27.7 26.1 20.2 30.0 3 42.5 28.3 26.7 20.2 30.0 4 42.6 28.4 26.8 20.2 30.0 5 42.8 28.5 26.8 19.9 30.0 6 43.0 28.6 26.9 19.8 30.0 7 42.0 28.2 26.6 19.7
Replication 3 Time (min) Sample port Conductivity
(ms/cm) Total dissolved
solids (g/L) Salinity Temp (oC)
0.0 - 43.9 29.3 27.7 20.2 30.0 1 2.5 1.7 20.3 30.0 2 41.1 27.4 25.8 20.5 30.0 3 42.1 28.1 26.5 20.6 30.0 4 42.3 28.1 26.6 20.4 30.0 5 42.7 28.4 26.8 20.3 30.0 6 42.8 28.5 26.9 20.2 30.0 7 42.6 28.4 26.8 20.1

133
Table A-42. Three collected data sets for Diverter F at 75.71 L/min flow rate with the diverter chamber drain closed.
Replication 1 Time (min) Sample port Conductivity
(ms/cm) Total dissolved
solids (g/L) Salinity Temp (oC)
0.0 - 44.2 29.4 28.1 23.2 30.0 1 2.9 1.9 23.7 30.0 2 34.3 22.9 21.3 24.1 30.0 3 42.5 28.4 27.0 24.1 30.0 4 42.9 28.6 27.2 23.9 30.0 5 43.0 28.6 27.2 23.8 30.0 6 43.0 28.6 27.2 23.6 30.0 7 42.6 28.4 27.0 23.4
Replication 2 Time (min) Sample port Conductivity
(ms/cm) Total dissolved
solids (g/L) Salinity Temp (oC)
0.0 - 44.2 29.4 28.1 23.2 30.0 1 3.0 2.0 23.8 30.0 2 36.7 24.5 22.9 23.9 30.0 3 42.7 28.5 27.0 23.9 30.0 4 43.2 28.8 27.4 23.9 30.0 5 43.2 28.8 27.4 23.9 30.0 6 43.2 28.8 27.4 23.9 30.0 7 43.1 28.7 27.3 23.8
Replication 3 Time (min) Sample port Conductivity
(ms/cm) Total dissolved
solids (g/L) Salinity Temp (oC)
0.0 - 44.2 29.4 28.1 23.2 30.0 1 2.8 1.8 24.0 30.0 2 25.1 16.7 15.2 24.4 30.0 3 42.3 28.2 26.8 24.4 30.0 4 42.9 28.6 27.2 24.2 30.0 5 43.0 28.7 27.3 24.1 30.0 6 43.0 28.7 27.3 24.0 30.0 7 42.8 28.6 27.2 23.9

134
Table A-43. Three collected data sets for Diverter A at 113.56 L/min flow rate with the diverter chamber drain closed.
Replication 1 Time (min) Sample port Conductivity
(ms/cm) Total dissolved
solids (g/L) Salinity Temp (oC)
0.0 - 44.0 29.3 27.7 19.9 30.0 1 3.7 2.5 20.7 30.0 2 2.2 1.5 21.2 30.0 3 40.8 27.2 25.6 21.3 30.0 4 41.3 27.7 26.2 21.1 30.0 5 41.7 27.8 26.2 20.8 30.0 6 42.0 28.0 26.4 20.5 30.0 7 42.0 28.0 26.5 20.2
Replication 2 Time (min) Sample port Conductivity
(ms/cm) Total dissolved
solids (g/L) Salinity Temp (oC)
0.0 - 44.4 29.6 28.0 20.1 30.0 1 2.9 2.0 22.2 30.0 2 2.7 1.8 22.4 30.0 3 3.2 2.1 22.7 30.0 4 40.6 27.2 25.7 22.6 30.0 5 41.4 27.7 26.3 22.1 30.0 6 41.8 27.9 26.4 21.5 30.0 7 42.0 28.0 26.4 20.8
Replication 3 Time (min) Sample port Conductivity
(ms/cm) Total dissolved
solids (g/L) Salinity Temp (oC)
0.0 - 44.1 29.4 27.9 22.7 30.0 1 3.0 2.0 22.8 30.0 2 2.4 1.6 23.1 30.0 3 6.1 4.0 23.4 30.0 4 42.1 28.2 26.7 23.3 30.0 5 42.7 28.5 27.1 23.1 30.0 6 42.8 28.6 27.2 22.8 30.0 7 42.6 28.5 27.0 22.4

135
Table A-44. Three collected data sets for Diverter B at 113.56 L/min flow rate with the diverter chamber drain closed.
Replication 1 Time (min) Sample port Conductivity
(ms/cm) Total dissolved
solids (g/L) Salinity Temp (oC)
0.0 - 44.0 29.3 27.7 19.9 30.0 1 26.1 17.4 15.6 20.3 30.0 2 41.8 27.9 26.3 20.4 30.0 3 42.5 28.3 26.7 20.3 30.0 4 43.4 28.9 27.2 19.2 30.0 5 43.8 29.0 27.3 18.9 30.0 6 43.9 29.2 27.6 18.9 30.0 7 44.0 29.3 27.8 18.9
Replication 2 Time (min) Sample port Conductivity
(ms/cm) Total dissolved
solids (g/L) Salinity Temp (oC)
0.0 - 44.4 29.6 28.0 20.1 30.0 1 22.1 14.8 13.2 22.7 30.0 2 40.6 27.3 25.9 22.4 30.0 3 41.9 28.1 26.6 21.9 30.0 4 42.7 28.5 27.0 21.4 30.0 5 43.2 28.2 27.3 20.9 30.0 6 43.6 29.1 27.5 20.6 30.0 7 43.4 28.9 27.4 20.2
Replication 3 Time (min) Sample port Conductivity
(ms/cm) Total dissolved
solids (g/L) Salinity Temp (oC)
0.0 - 44.1 29.4 27.9 22.7 30.0 1 10.9 7.5 6.3 22.6 30.0 2 41.2 27.5 26.0 22.7 30.0 3 41.8 28.0 26.5 22.6 30.0 4 42.0 28.0 26.5 22.5 30.0 5 42.1 28.0 26.5 22.2 30.0 6 42.2 28.1 26.6 22.1 30.0 7 41.7 27.8 26.3 21.8

136
Table A-45. Three collected data sets for Diverter C at 113.56 L/min flow rate with the diverter chamber drain closed.
Replication 1 Time (min) Sample port Conductivity
(ms/cm) Total dissolved
solids (g/L) Salinity Temp (oC)
0.0 - 44.0 29.3 27.9 21.7 30.0 1 41.8 27.8 26.3 21.7 30.0 2 41.7 27.7 26.2 21.8 30.0 3 41.6 27.7 26.1 21.8 30.0 4 41.4 27.6 26.0 21.8 30.0 5 41.3 27.5 26.0 21.8 30.0 6 41.2 27.4 25.9 21.8 30.0 7 40.9 27.3 25.7 21.8
Replication 2 Time (min) Sample port Conductivity
(ms/cm) Total dissolved
solids (g/L) Salinity Temp (oC)
0.0 - 44.3 29.5 28.0 21.7 30.0 1 43.2 28.7 27.3 22.2 30.0 2 43.1 28.7 27.3 22.1 30.0 3 43.1 28.7 27.2 22.1 30.0 4 43.1 28.7 27.2 22.1 30.0 5 43.1 28.7 27.2 22.0 30.0 6 43.0 28.7 27.2 22.0 30.0 7 42.7 28.5 27.0 21.9
Replication 3 Time (min) Sample port Conductivity
(ms/cm) Total dissolved
solids (g/L) Salinity Temp (oC)
0.0 - 44.1 29.4 27.9 21.8 30.0 1 42.7 28.5 27.0 22.7 30.0 2 42.8 28.5 27.1 22.6 30.0 3 42.8 28.5 27.0 22.5 30.0 4 42.9 28.6 26.9 22.4 30.0 5 42.9 28.6 27.1 22.4 30.0 6 42.9 28.6 27.1 22.3 30.0 7 42.5 28.3 26.9 22.2

137
Table A-46. Three collected data sets for Diverter D at 113.56 L/min flow rate with the diverter chamber drain closed.
Replication 1 Time (min) Sample port Conductivity
(ms/cm) Total dissolved
solids (g/L) Salinity Temp (oC)
0.0 - 44.5 29.5 28.9 20.3 30.0 1 2.2 1.4 22.1 30.0 2 39.7 26.4 24.7 22.2 30.0 3 42.2 28.0 26.6 22.1 30.0 4 42.4 28.2 26.8 21.9 30.0 5 42.3 28.1 26.6 21.7 30.0 6 42.3 28.2 26.7 21.5 30.0 7 42.3 28.2 26.7 21.3
Replication 2 Time (min) Sample port Conductivity
(ms/cm) Total dissolved
solids (g/L) Salinity Temp (oC)
0.0 - 43.6 29.1 27.6 21.9 30.0 1 2.96 1.95 22.7 30.0 2 41.9 28.0 26.5 23.0 30.0 3 42.6 28.4 26.9 23.0 30.0 4 42.8 28.5 27.0 23.1 30.0 5 43.0 28.5 27.1 22.6 30.0 6 42.9 28.6 27.1 22.5 30.0 7 42.8 28.4 26.9 22.3
Replication 3 Time (min) Sample port Conductivity
(ms/cm) Total dissolved
solids (g/L) Salinity Temp (oC)
0.0 - 43.6 29.1 27.6 21.7 30.0 1 1.9 1.3 23.1 30.0 2 40.4 27.0 25.6 23.3 30.0 3 41.8 27.9 26.5 23.2 30.0 4 41.9 28.0 26.5 23.0 30.0 5 42.1 28.0 26.6 22.7 30.0 6 42.1 28.0 26.6 22.5 30.0 7 41.9 28.0 26.4 22.4

138
Table A-47. Three collected data sets for Diverter E at 113.56 L/min flow rate with the diverter chamber drain closed.
Replication 1 Time (min) Sample port Conductivity
(ms/cm) Total dissolved
solids (g/L) Salinity Temp (oC)
0.0 - 44.0 29.3 27.9 21.7 30.0 1 2.6 1.7 21.9 30.0 2 2.3 1.5 22.4 30.0 3 41.4 27.7 26.2 22.6 30.0 4 42.5 28.3 26.9 22.6 30.0 5 42.8 28.5 27.1 22.5 30.0 6 42.9 28.6 27.1 22.4 30.0 7 43.0 28.7 27.2 22.2
Replication 2 Time (min) Sample port Conductivity
(ms/cm) Total dissolved
solids (g/L) Salinity Temp (oC)
0.0 - 44.3 29.5 28.0 21.7 30.0 1 2.7 1.8 22.3 30.0 2 2.1 1.4 22.7 30.0 3 41.8 27.9 26.5 22.9 30.0 4 42.5 28.3 26.9 22.8 30.0 5 42.6 28.4 26.9 22.7 30.0 6 42.7 28.5 27.0 22.6 30.0 7 42.7 28.6 27.0 22.4
Replication 3 Time (min) Sample port Conductivity
(ms/cm) Total dissolved
solids (g/L) Salinity Temp (oC)
44.1 - 44.1 29.4 27.9 21.8 3.1 1 3.1 2.1 23.4 2.6 2 2.6 1.8 23.6 41.2 3 41.2 27.5 26.2 23.5 41.9 4 41.9 28.1 26.6 23.3 42.5 5 42.5 28.1 26.7 23.1 42.5 6 42.5 28.2 26.8 22.8 42.5 7 42.5 28.3 26.9 22.6
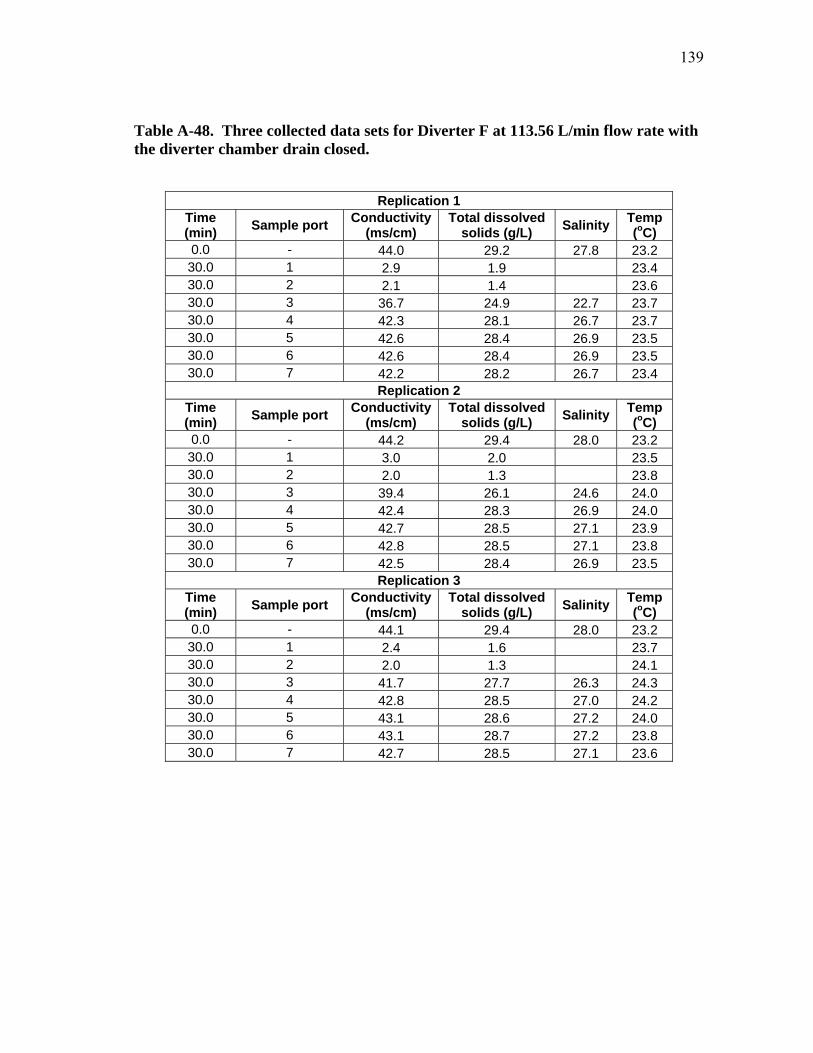
139
Table A-48. Three collected data sets for Diverter F at 113.56 L/min flow rate with the diverter chamber drain closed.
Replication 1 Time (min) Sample port Conductivity
(ms/cm) Total dissolved
solids (g/L) Salinity Temp (oC)
0.0 - 44.0 29.2 27.8 23.2 30.0 1 2.9 1.9 23.4 30.0 2 2.1 1.4 23.6 30.0 3 36.7 24.9 22.7 23.7 30.0 4 42.3 28.1 26.7 23.7 30.0 5 42.6 28.4 26.9 23.5 30.0 6 42.6 28.4 26.9 23.5 30.0 7 42.2 28.2 26.7 23.4
Replication 2 Time (min) Sample port Conductivity
(ms/cm) Total dissolved
solids (g/L) Salinity Temp (oC)
0.0 - 44.2 29.4 28.0 23.2 30.0 1 3.0 2.0 23.5 30.0 2 2.0 1.3 23.8 30.0 3 39.4 26.1 24.6 24.0 30.0 4 42.4 28.3 26.9 24.0 30.0 5 42.7 28.5 27.1 23.9 30.0 6 42.8 28.5 27.1 23.8 30.0 7 42.5 28.4 26.9 23.5
Replication 3 Time (min) Sample port Conductivity
(ms/cm) Total dissolved
solids (g/L) Salinity Temp (oC)
0.0 - 44.1 29.4 28.0 23.2 30.0 1 2.4 1.6 23.7 30.0 2 2.0 1.3 24.1 30.0 3 41.7 27.7 26.3 24.3 30.0 4 42.8 28.5 27.0 24.2 30.0 5 43.1 28.6 27.2 24.0 30.0 6 43.1 28.7 27.2 23.8 30.0 7 42.7 28.5 27.1 23.6

140
APPENDIX B
Table B-1. Three collected data sets for Diverter A at 1.51 L/min flow rate with the diverter chamber drain open.
Replication 1 Time (min) Sample port Conductivity
(ms/cm) Total dissolved
solids (g/L) Salinity Temp (oC)
0.0 - 44.1 29.3 28.0 23.6 30.0 1 1.7 1.1 23.7 30.0 2 1.2 0.8 23.5 30.0 3 1.0 0.7 23.3 30.0 4 1.0 0.7 23.2 30.0 5 3.6 2.4 23.1 30.0 6 37.2 24.9 23.2 23.0 30.0 7 42.0 27.9 26.4 22.9
Replication 2 Time (min) Sample port Conductivity
(ms/cm) Total dissolved
solids (g/L) Salinity Temp (oC)
0.0 - 44.2 29.3 27.9 23.9 30.0 1 1.1 0.8 22.8 30.0 2 0.9 0.6 22.9 30.0 3 0.9 0.6 22.9 30.0 4 0.9 0.6 22.9 30.0 5 28.9 19.2 17.5 22.8 30.0 6 41.6 27.7 26.2 22.8 30.0 7 43.2 28.8 27.3 22.8
Replication 3 Time (min) Sample port Conductivity
(ms/cm) Total dissolved
solids (g/L) Salinity Temp (oC)
0.0 - 44.0 29.3 27.9 23.3 30.0 1 1.1 0.7 23.3 30.0 2 0.9 0.6 23.2 30.0 3 0.9 0.6 23.2 30.0 4 1.0 0.6 22.9 30.0 5 35.7 23.9 22.3 22.9 30.0 6 39.6 26.4 24.9 23.0 30.0 7 42.1 28.1 26.6 22.7

141
Table B-2. Three collected data sets for Diverter B at 1.51 L/min flow rate with the diverter chamber drain open.
Replication 1 Time (min) Sample port Conductivity
(ms/cm) Total dissolved
solids (g/L) Salinity Temp (oC)
0.0 - 44.1 29.3 28.0 23.6 30.0 1 1.9 1.3 23.1 30.0 2 1.0 0.7 22.9 30.0 3 1.1 0.7 23.1 30.0 4 1.1 0.7 23.2 30.0 5 6.7 3.8 23.1 30.0 6 38.9 25.9 24.4 23.0 30.0 7 42.3 28.1 26.8 22.8
Replication 2 Time (min) Sample port Conductivity
(ms/cm) Total dissolved
solids (g/L) Salinity Temp (oC)
0.0 - 44.2 29.3 27.9 23.9 30.0 1 1.4 1.0 24.0 30.0 2 0.9 0.6 24.0 30.0 3 0.9 0.6 23.7 30.0 4 0.9 0.6 23.5 30.0 5 11.0 7.5 6.7 23.6 30.0 6 40.0 26.6 25.1 23.5 30.0 7 42.5 28.2 26.8 23.3
Replication 3 Time (min) Sample port Conductivity
(ms/cm) Total dissolved
solids (g/L) Salinity Temp (oC)
0.0 - 44.0 29.3 27.9 23.3 30.0 1 2.0 1.3 22.8 30.0 2 0.9 0.6 22.7 30.0 3 0.9 0.6 22.7 30.0 4 0.9 0.6 22.8 30.0 5 12.6 8.3 7.0 23.0 30.0 6 40.1 26.7 25.1 22.8 30.0 7 42.3 28.2 26.7 22.8

142
Table B-3. Three collected data sets for Diverter C at 1.51 L/min flow rate with the diverter chamber drain open.
Replication 1 Time (min) Sample port Conductivity
(ms/cm) Total dissolved
solids (g/L) Salinity Temp (oC)
0.0 - 44.1 29.3 28.0 23.6 30.0 1 2.0 1.4 22.8 30.0 2 1.1 0.7 22.9 30.0 3 1.1 0.8 23.0 30.0 4 1.0 0.7 23.0 30.0 5 1.1 0.7 23.2 30.0 6 1.1 0.7 23.1 30.0 7 8.8 5.7 22.9
Replication 2 Time (min) Sample port Conductivity
(ms/cm) Total dissolved
solids (g/L) Salinity Temp (oC)
0.0 - 44.2 29.3 27.9 23.9 30.0 1 2.0 1.4 23.3 30.0 2 1.0 0.6 23.3 30.0 3 0.9 0.6 23.3 30.0 4 0.9 0.6 23.3 30.0 5 0.9 0.6 23.1 30.0 6 0.9 0.6 23.1 30.0 7 8.5 5.7 22.8
Replication 3 Time (min) Sample port Conductivity
(ms/cm) Total dissolved
solids (g/L) Salinity Temp (oC)
0.0 - 44.0 29.3 27.9 23.3 30.0 1 1.6 1.1 23.9 30.0 2 0.9 0.6 23.7 30.0 3 0.9 0.6 23.5 30.0 4 0.9 0.6 23.5 30.0 5 0.9 0.6 23.3 30.0 6 0.9 0.6 23.5 30.0 7 9.4 6.3 5.2 23.3

143
Table B-4. Three collected data sets for Diverter D at 1.51 L/min flow rate with the diverter chamber drain open.
Replication 1 Time (min) Sample port Conductivity
(ms/cm) Total dissolved
solids (g/L) Salinity Temp (oC)
0.0 - 43.9 29.2 27.7 21.7 30.0 1 1.3 0.8 22.1 30.0 2 1.1 0.7 22.1 30.0 3 1.0 0.7 22.2 30.0 4 1.1 0.8 22.2 30.0 5 1.0 0.7 22.2 30.0 6 1.0 0.7 22.3 30.0 7 8.9 5.9 22.2
Replication 2 Time (min) Sample port Conductivity
(ms/cm) Total dissolved
solids (g/L) Salinity Temp (oC)
0.0 - 44.0 29.3 27.8 22.9 30.0 1 1.9 1.3 21.8 30.0 2 1.1 0.7 21.9 30.0 3 1.0 0.7 22.4 30.0 4 1.0 0.7 22.4 30.0 5 1.0 0.7 22.4 30.0 6 1.0 0.7 22.4 30.0 7 9.5 6.3 5.3 22.4
Replication 3 Time (min) Sample port Conductivity
(ms/cm) Total dissolved
solids (g/L) Salinity Temp (oC)
0.0 - 43.5 29.1 27.5 20.0 30.0 1 1.9 1.2 20.3 30.0 2 1.2 0.8 20.7 30.0 3 1.2 0.8 20.9 30.0 4 1.0 0.7 21.2 30.0 5 1.0 0.7 21.4 30.0 6 1.0 0.7 21.5 30.0 7 8.8 5.9 21.6

144
Table B-5. Three collected data sets for Diverter E at 1.51 L/min flow rate with the diverter chamber drain open.
Replication 1 Time (min) Sample port Conductivity
(ms/cm) Total dissolved
solids (g/L) Salinity Temp (oC)
0.0 - 43.9 29.2 27.7 21.7 30.0 1 1.8 1.2 21.7 30.0 2 1.0 0.7 21.8 30.0 3 1.0 0.7 21.9 30.0 4 1.0 0.7 22.0 30.0 5 1.0 0.7 22.1 30.0 6 1.0 0.7 22.2 30.0 7 9.2 6.2 5.1 22.2
Replication 2 Time (min) Sample port Conductivity
(ms/cm) Total dissolved
solids (g/L) Salinity Temp (oC)
0.0 - 44.0 29.3 27.8 22.9 30.0 1 1.2 0.9 22.4 30.0 2 1.0 0.7 22.4 30.0 3 1.0 0.7 22.5 30.0 4 1.0 0.7 22.5 30.0 5 1.0 0.7 22.5 30.0 6 1.0 0.7 22.5 30.0 7 9.5 6.3 5.2 22.5
Replication 3 Time (min) Sample port Conductivity
(ms/cm) Total dissolved
solids (g/L) Salinity Temp (oC)
0.0 - 43.5 29.1 27.5 20.0 30.0 1 1.2 0.8 21.7 30.0 2 1.0 0.7 21.7 30.0 3 1.0 0.7 21.8 30.0 4 1.0 0.7 22.0 30.0 5 1.0 0.7 22.0 30.0 6 1.0 0.7 22.1 30.0 7 8.3 5.5 22.0

145
Table B-6. Three collected data sets for Diverter F at 1.51 L/min flow rate with the diverter chamber drain open.
Replication 1 Time (min) Sample port Conductivity
(ms/cm) Total dissolved
solids (g/L) Salinity Temp (oC)
0.0 - 44.2 29.5 27.9 20.5 30.0 1 1.8 1.2 21.0 30.0 2 1.0 0.6 21.1 30.0 3 1.0 0.6 21.2 30.0 4 1.0 0.7 21.4 30.0 5 1.0 0.6 21.4 30.0 6 1.0 0.7 21.7 30.0 7 8.5 5.7 21.0
Replication 2 Time (min) Sample port Conductivity
(ms/cm) Total dissolved
solids (g/L) Salinity Temp (oC)
0.0 - 44.2 29.5 27.9 20.5 30.0 1 2.3 1.5 20.6 30.0 2 1.0 0.7 20.9 30.0 3 1.0 0.6 21.1 30.0 4 1.0 0.7 21.3 30.0 5 1.0 0.6 21.5 30.0 6 1.0 0.6 21.6 30.0 7 7.9 5.2 21.6
Replication 3 Time (min) Sample port Conductivity
(ms/cm) Total dissolved
solids (g/L) Salinity Temp (oC)
0.0 - 44.2 29.5 27.9 20.5 30.0 1 1.0 0.7 20.6 30.0 2 1.0 0.7 21.1 30.0 3 1.0 0.7 21.3 30.0 4 1.0 0.6 21.7 30.0 5 1.0 0.7 21.6 30.0 6 1.0 0.7 21.4 30.0 7 8.8 5.9 21.3

146
Table B-7. Three collected data sets for Diverter A at 3.03 L/min flow rate with the diverter chamber drain open.
Replication 1 Time (min) Sample port Conductivity
(ms/cm) Total dissolved
solids (g/L) Salinity Temp (oC)
0.0 - 43.9 29.2 27.9 25.9 30.0 1 1.4 1.0 25.5 30.0 2 1.0 0.6 25.6 30.0 3 0.8 0.6 25.8 30.0 4 0.9 0.6 25.7 30.0 5 31.1 20.7 19.0 25.5 30.0 6 39.3 26.2 24.7 25.5 30.0 7 40.8 27.7 25.8 25.3
Replication 2 Time (min) Sample port Conductivity
(ms/cm) Total dissolved
solids (g/L) Salinity Temp (oC)
0.0 - 43.7 29.1 27.8 25.9 30.0 1 1.0 0.7 26.6 30.0 2 0.9 0.6 26.7 30.0 3 0.9 0.6 26.7 30.0 4 1.0 0.7 26.7 30.0 5 29.2 19.5 17.9 26.7 30.0 6 40.3 26.9 25.5 26.6 30.0 7 41.4 27.6 26.2 26.5
Replication 3 Time (min) Sample port Conductivity
(ms/cm) Total dissolved
solids (g/L) Salinity Temp (oC)
0.0 - 44.2 29.4 28.2 26.2 30.0 1 1.1 0.7 27.0 30.0 2 0.8 0.6 27.0 30.0 3 0.9 0.6 27.1 30.0 4 0.9 0.6 27.1 30.0 5 28.3 18.9 17.1 27.1 30.0 6 40.7 27.1 25.8 27.0 30.0 7 41.9 27.9 26.6 26.8

147
Table B-8. Three collected data sets for Diverter B at 3.03 L/min flow rate with the diverter chamber drain open.
Replication 1 Time (min) Sample port Conductivity
(ms/cm) Total dissolved
solids (g/L) Salinity Temp (oC)
0.0 - 43.9 29.2 27.9 25.9 30.0 1 1.6 1.1 25.6 30.0 2 0.8 0.6 25.7 30.0 3 0.9 0.6 25.8 30.0 4 0.9 0.6 26.0 30.0 5 13.4 9.0 7.6 25.9 30.0 6 39.6 26.4 25.0 25.8 30.0 7 40.6 27.1 25.5 25.6
Replication 2 Time (min) Sample port Conductivity
(ms/cm) Total dissolved
solids (g/L) Salinity Temp (oC)
0.0 - 43.7 29.1 27.8 25.9 30.0 1 1.7 1.2 27.1 30.0 2 0.9 0.6 27.0 30.0 3 0.9 0.6 27.0 30.0 4 0.9 0.6 27.0 30.0 5 2.5 1.7 26.9 30.0 6 38.0 25.4 24.0 26.8 30.0 7 40.7 27.1 25.8 26.6
Replication 3 Time (min) Sample port Conductivity
(ms/cm) Total dissolved
solids (g/L) Salinity Temp (oC)
0.0 - 44.2 29.4 28.2 26.2 30.0 1 2.0 1.3 26.4 30.0 2 0.9 0.6 26.5 30.0 3 0.9 0.6 26.6 30.0 4 0.9 0.6 26.7 30.0 5 4.9 3.3 26.7 30.0 6 40.7 27.2 25.8 26.5 30.0 7 42.9 28.6 27.3 26.5

148
Table B-9. Three collected data sets for Diverter C at 3.03 L/min flow rate with the diverter chamber drain open.
Replication 1 Time (min) Sample port Conductivity
(ms/cm) Total dissolved
solids (g/L) Salinity Temp (oC)
0.0 - 43.9 29.2 27.9 25.9 30.0 1 1.8 1.2 25.6 30.0 2 0.9 0.6 25.7 30.0 3 0.9 0.6 25.7 30.0 4 0.9 0.6 25.8 30.0 5 0.9 0.6 26.0 30.0 6 0.9 0.6 26.0 30.0 7 8.8 5.9 25.9
Replication 2 Time (min) Sample port Conductivity
(ms/cm) Total dissolved
solids (g/L) Salinity Temp (oC)
0.0 - 43.7 29.1 27.8 25.9 30.0 1 1.9 1.3 26.7 30.0 2 0.9 0.6 26.7 30.0 3 0.9 0.6 26.8 30.0 4 0.9 0.6 26.8 30.0 5 0.9 0.5 26.8 30.0 6 0.9 0.6 26.9 30.0 7 0.9 6.1 5.1 26.7
Replication 3 Time (min) Sample port Conductivity
(ms/cm) Total dissolved
solids (g/L) Salinity Temp (oC)
0.0 - 44.2 29.4 28.2 26.2 30.0 1 2.1 1.4 27.2 30.0 2 0.9 0.6 27.2 30.0 3 0.8 0.6 27.3 30.0 4 0.8 0.6 27.3 30.0 5 0.9 0.6 27.3 30.0 6 0.8 0.6 27.3 30.0 7 9.4 6.3 5.3 27.3

149
Table B-10. Three collected data sets for Diverter D at 3.03 L/min flow rate with the diverter chamber drain open.
Replication 1 Time (min) Sample port Conductivity
(ms/cm) Total dissolved
solids (g/L) Salinity Temp (oC)
0.0 - 44.0 29.2 27.7 21.7 30.0 1 1.1 0.8 22.0 30.0 2 1.1 0.7 22.1 30.0 3 1.0 0.7 22.1 30.0 4 1.0 0.7 22.2 30.0 5 1.0 0.7 22.3 30.0 6 1.0 0.7 22.4 30.0 7 9.2 6.2 5.1 22.4
Replication 2 Time (min) Sample port Conductivity
(ms/cm) Total dissolved
solids (g/L) Salinity Temp (oC)
0.0 - 44.1 29.3 27.9 21.9 30.0 1 1.2 0.8 22.6 30.0 2 1.1 0.7 22.6 30.0 3 1.0 0.7 22.6 30.0 4 1.0 0.7 22.6 30.0 5 1.0 0.7 22.7 30.0 6 1.2 0.8 22.7 30.0 7 9.4 6.3 5.2 22.6
Replication 3 Time (min) Sample port Conductivity
(ms/cm) Total dissolved
solids (g/L) Salinity Temp (oC)
0.0 - 43.8 29.1 26.7 26.7 30.0 1 1.2 0.8 22.8 30.0 2 1.1 0.7 22.8 30.0 3 1.0 0.7 22.8 30.0 4 1.0 0.7 22.8 30.0 5 1.0 0.7 22.8 30.0 6 1.0 0.7 22.8 30.0 7 6.1 6.2 5.1 22.8

150
Table B-11. Three collected data sets for Diverter E at 3.03 L/min flow rate with the diverter chamber drain open.
Replication 1 Time (min) Sample port Conductivity
(ms/cm) Total dissolved
solids (g/L) Salinity Temp (oC)
0.0 - 44.0 29.2 27.7 21.7 30.0 1 1.8 0.8 22.4 30.0 2 1.0 0.7 22.4 30.0 3 1.0 0.7 22.5 30.0 4 1.0 0.7 22.6 30.0 5 1.0 0.7 22.6 30.0 6 1.0 0.7 22.6 30.0 7 9.6 6.2 5.3 22.6
Replication 2 Time (min) Sample port Conductivity
(ms/cm) Total dissolved
solids (g/L) Salinity Temp (oC)
0.0 - 44.1 29.3 27.9 21.9 30.0 1 1.9 1.3 22.3 30.0 2 1.9 0.7 22.4 30.0 3 1.0 0.7 22.4 30.0 4 1.0 0.7 22.5 30.0 5 1.0 0.7 22.6 30.0 6 1.0 0.7 22.7 30.0 7 9.4 6.2 5.2 22.7
Replication 3 Time (min) Sample port Conductivity
(ms/cm) Total dissolved
solids (g/L) Salinity Temp (oC)
0.0 - 43.8 29.1 26.7 26.7 30.0 1 1.8 1.2 23.0 30.0 2 1.0 0.7 23.0 30.0 3 1.0 0.7 23.0 30.0 4 1.0 0.7 23.0 30.0 5 1.0 0.7 23.0 30.0 6 1.0 0.7 22.9 30.0 7 9.3 6.2 5.1 22.9

151
Table B-12. Three collected data sets for Diverter F at 3.03 L/min flow rate with the diverter chamber drain open.
Replication 1 Time (min) Sample port Conductivity
(ms/cm) Total dissolved
solids (g/L) Salinity Temp (oC)
0.0 - 44.1 29.4 27.8 20.5 30.0 1 2.5 1.6 20.4 30.0 2 1.0 0.7 20.7 30.0 3 1.0 0.6 20.8 30.0 4 1.0 0.6 21.0 30.0 5 1.0 0.6 21.1 30.0 6 1.0 0.6 21.2 30.0 7 7.6 5.1 21.3
Replication 2 Time (min) Sample port Conductivity
(ms/cm) Total dissolved
solids (g/L) Salinity Temp (oC)
0.0 - 2.7 29.4 27.8 20.5 30.0 1 1.0 0.7 21.1 30.0 2 1.0 0.7 21.3 30.0 3 1.0 0.6 21.3 30.0 4 1.0 0.6 21.7 30.0 5 1.0 0.6 21.6 30.0 6 1.0 0.7 21.7 30.0 7 7.4 5.0 21.3
Replication 3 Time (min) Sample port Conductivity
(ms/cm) Total dissolved
solids (g/L) Salinity Temp (oC)
0.0 - 2.3 29.4 27.8 20.5 30.0 1 1.0 1.5 20.6 30.0 2 1.0 0.7 20.8 30.0 3 1.0 0.7 21.2 30.0 4 1.0 0.7 21.3 30.0 5 1.0 0.6 21.3 30.0 6 1.0 0.6 21.6 30.0 7 7.3 4.9 21.6

152
Table B-13. Three collected data sets for Diverter A at 12.11 L/min flow rate with the diverter chamber drain open.
Replication 1 Time (min) Sample port Conductivity
(ms/cm) Total dissolved
solids (g/L) Salinity Temp (oC)
0.0 - 43.9 29.2 27.9 26.0 30.0 1 1.8 1.2 26.6 30.0 2 1.0 0.7 26.6 30.0 3 0.9 0.6 26.7 30.0 4 0.9 0.6 26.8 30.0 5 1.1 0.7 26.9 30.0 6 41.7 27.9 26.6 26.8 30.0 7 42.6 28.4 27.1 26.7
Replication 2 Time (min) Sample port Conductivity
(ms/cm) Total dissolved
solids (g/L) Salinity Temp (oC)
0.0 - 43.7 29.1 27.8 26.3 30.0 1 1.0 0.7 27.0 30.0 2 0.9 0.6 26.7 30.0 3 0.9 0.6 26.7 30.0 4 0.8 0.5 26.6 30.0 5 9.5 6.4 5.3 26.6 30.0 6 38.8 25.9 24.6 26.5 30.0 7 42.4 28.3 27.0 26.3
Replication 3 Time (min) Sample port Conductivity
(ms/cm) Total dissolved
solids (g/L) Salinity Temp (oC)
0.0 - 44.1 29.4 28.1 26.8 30.0 1 1.6 1.0 26.9 30.0 2 0.9 0.6 26.8 30.0 3 0.8 0.5 26.8 30.0 4 0.8 0.5 26.8 30.0 5 0.8 0.6 26.7 30.0 6 1.0 0.7 26.7 30.0 7 42.0 28.0 26.7 26.5

153
Table B-14. Three collected data sets for Diverter B at 12.11 L/min flow rate with the diverter chamber drain open.
Replication 1 Time (min) Sample port Conductivity
(ms/cm) Total dissolved
solids (g/L) Salinity Temp (oC)
0.0 - 43.9 29.2 27.9 26.0 30.0 1 1.9 1.3 26.5 30.0 2 0.9 0.6 26.5 30.0 3 0.9 0.6 26.7 30.0 4 0.9 0.6 26.8 30.0 5 0.9 0.6 26.8 30.0 6 1.3 0.9 26.7 30.0 7 40.6 27.1 25.8 26.7
Replication 2 Time (min) Sample port Conductivity
(ms/cm) Total dissolved
solids (g/L) Salinity Temp (oC)
0.0 - 43.7 29.1 27.8 26.3 30.0 1 0.8 0.5 28.2 30.0 2 0.8 0.6 27.8 30.0 3 1.0 0.7 26.6 30.0 4 1.0 0.7 27.5 30.0 5 1.1 0.7 27.3 30.0 6 39.4 26.4 25.1 27.1 30.0 7 41.9 27.9 26.6 26.8
Replication 3 Time (min) Sample port Conductivity
(ms/cm) Total dissolved
solids (g/L) Salinity Temp (oC)
0.0 - 44.1 29.4 28.1 26.8 30.0 1 1.8 1.2 26.4 30.0 2 1.1 0.7 26.4 30.0 3 0.9 0.6 26.4 30.0 4 0.9 0.6 26.5 30.0 5 1.5 1.0 26.3 30.0 6 39.4 26.3 24.9 26.3 30.0 7 43.2 28.8 27.5 26.1

154
Table B-15. Three collected data sets for Diverter C at 12.11 L/min flow rate with the diverter chamber drain open.
Replication 1 Time (min) Sample port Conductivity
(ms/cm) Total dissolved
solids (g/L) Salinity Temp (oC)
0.0 - 43.9 29.2 27.9 26.0 30.0 1 1.6 1.1 26.5 30.0 2 0.9 0.6 26.5 30.0 3 0.9 0.6 26.5 30.0 4 0.9 0.6 26.6 30.0 5 0.9 0.6 26.6 30.0 6 0.9 0.6 26.5 30.0 7 9.0 6.0 26.7
Replication 2 Time (min) Sample port Conductivity
(ms/cm) Total dissolved
solids (g/L) Salinity Temp (oC)
0.0 - 43.7 29.1 27.8 26.3 30.0 1 1.7 1.1 26.6 30.0 2 0.9 0.6 26.6 30.0 3 0.9 0.6 26.6 30.0 4 0.9 0.6 26.7 30.0 5 0.9 0.6 26.7 30.0 6 0.9 0.6 26.8 30.0 7 9.5 6.3 5.3 26.7
Replication 3 Time (min) Sample port Conductivity
(ms/cm) Total dissolved
solids (g/L) Salinity Temp (oC)
0.0 - 44.1 29.4 28.1 26.8 30.0 1 2.1 1.4 26.0 30.0 2 0.9 0.6 26.1 30.0 3 0.9 0.6 26.1 30.0 4 0.9 0.6 26.2 30.0 5 0.9 0.6 26.2 30.0 6 0.9 0.6 26.3 30.0 7 9.5 6.3 5.3 26.1

155
Table B-16. Three collected data sets for Diverter D at 12.11 L/min flow rate with the diverter chamber drain open.
Replication 1 Time (min) Sample port Conductivity
(ms/cm) Total dissolved
solids (g/L) Salinity Temp (oC)
0.0 - 43.6 29.0 27.5 22.5 30.0 1 1.3 0.8 22.4 30.0 2 1.1 0.7 22.4 30.0 3 1.0 0.7 22.4 30.0 4 1.0 0.7 22.4 30.0 5 1.0 0.6 22.5 30.0 6 1.0 0.7 22.5 30.0 7 9.1 6.1 5.1 22.5
Replication 2 Time (min) Sample port Conductivity
(ms/cm) Total dissolved
solids (g/L) Salinity Temp (oC)
0.0 - 44.0 29.2 27.7 21.6 30.0 1 1.2 0.8 21.9 30.0 2 1.1 0.7 21.9 30.0 3 1.0 0.7 22.1 30.0 4 1.0 0.7 22.1 30.0 5 1.0 0.7 22.2 30.0 6 1.0 0.7 22.2 30.0 7 9.1 6.1 5.1 22.1
Replication 3 Time (min) Sample port Conductivity
(ms/cm) Total dissolved
solids (g/L) Salinity Temp (oC)
0.0 - 44.3 29.5 28.1 22.8 30.0 1 1.9 1.3 22.9 30.0 2 1.1 0.7 22.8 30.0 3 1.0 0.7 22.7 30.0 4 1.0 0.7 22.7 30.0 5 1.0 0.7 22.6 30.0 6 1.0 0.7 22.6 30.0 7 8.7 5.8 22.6
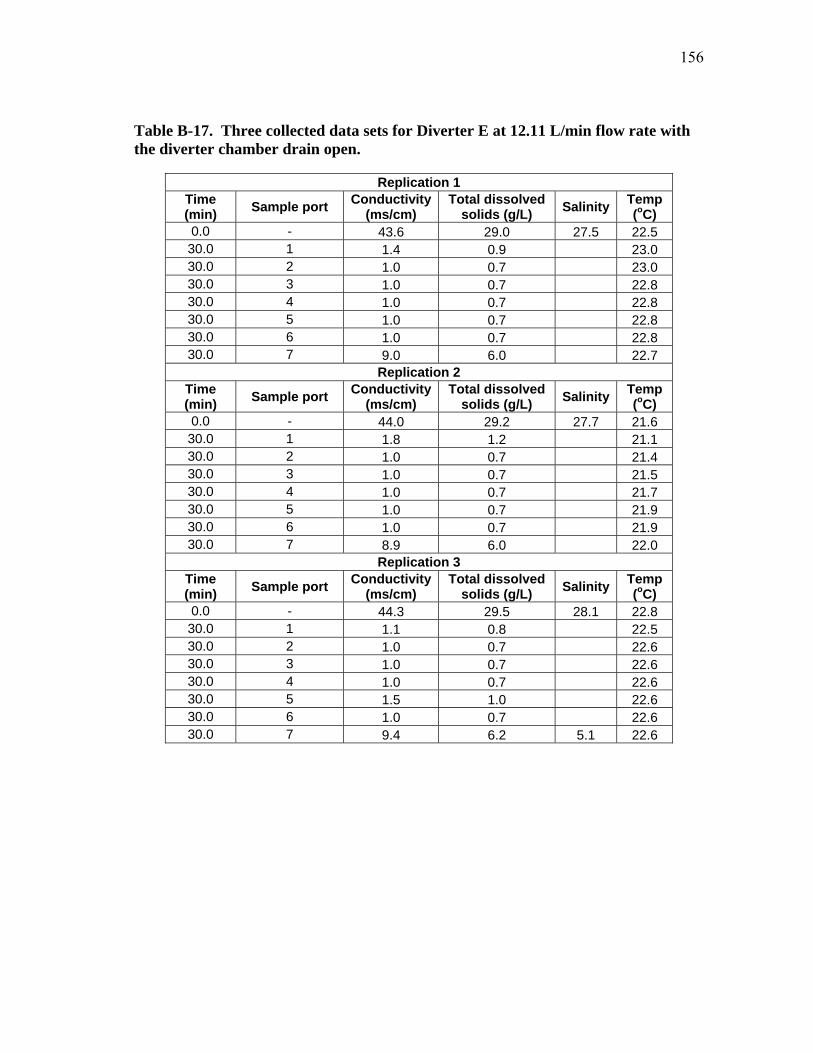
156
Table B-17. Three collected data sets for Diverter E at 12.11 L/min flow rate with the diverter chamber drain open.
Replication 1 Time (min) Sample port Conductivity
(ms/cm) Total dissolved
solids (g/L) Salinity Temp (oC)
0.0 - 43.6 29.0 27.5 22.5 30.0 1 1.4 0.9 23.0 30.0 2 1.0 0.7 23.0 30.0 3 1.0 0.7 22.8 30.0 4 1.0 0.7 22.8 30.0 5 1.0 0.7 22.8 30.0 6 1.0 0.7 22.8 30.0 7 9.0 6.0 22.7
Replication 2 Time (min) Sample port Conductivity
(ms/cm) Total dissolved
solids (g/L) Salinity Temp (oC)
0.0 - 44.0 29.2 27.7 21.6 30.0 1 1.8 1.2 21.1 30.0 2 1.0 0.7 21.4 30.0 3 1.0 0.7 21.5 30.0 4 1.0 0.7 21.7 30.0 5 1.0 0.7 21.9 30.0 6 1.0 0.7 21.9 30.0 7 8.9 6.0 22.0
Replication 3 Time (min) Sample port Conductivity
(ms/cm) Total dissolved
solids (g/L) Salinity Temp (oC)
0.0 - 44.3 29.5 28.1 22.8 30.0 1 1.1 0.8 22.5 30.0 2 1.0 0.7 22.6 30.0 3 1.0 0.7 22.6 30.0 4 1.0 0.7 22.6 30.0 5 1.5 1.0 22.6 30.0 6 1.0 0.7 22.6 30.0 7 9.4 6.2 5.1 22.6
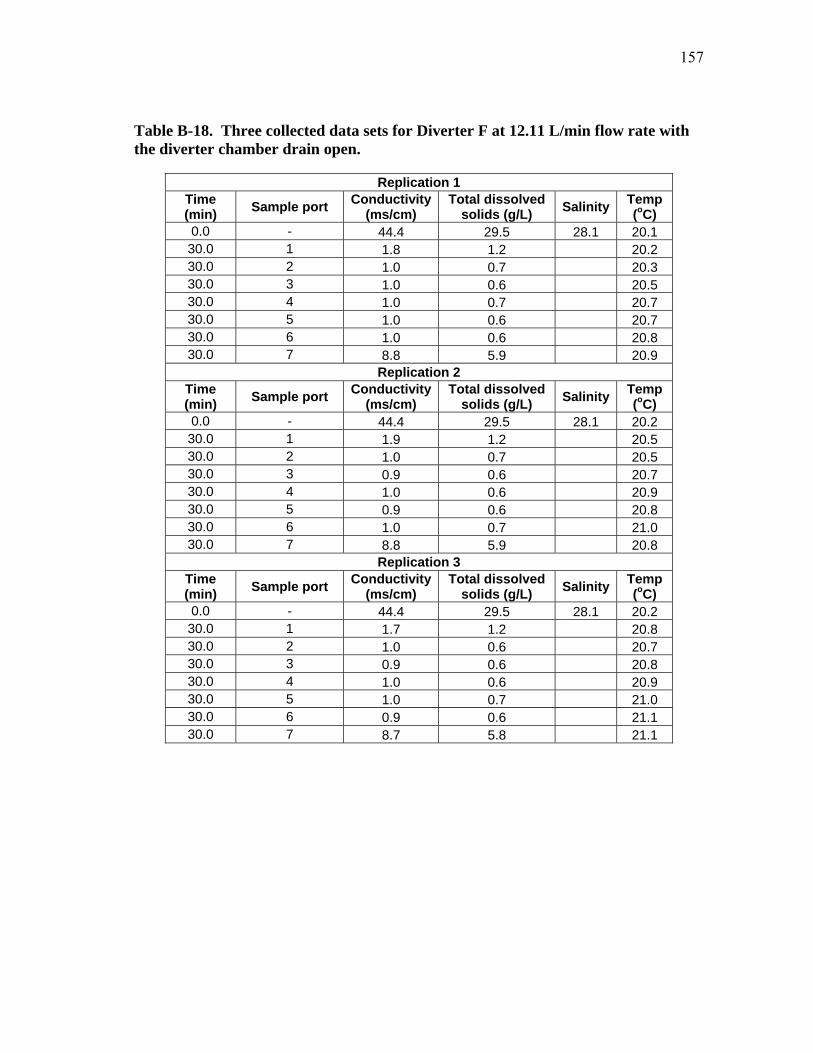
157
Table B-18. Three collected data sets for Diverter F at 12.11 L/min flow rate with the diverter chamber drain open.
Replication 1 Time (min) Sample port Conductivity
(ms/cm) Total dissolved
solids (g/L) Salinity Temp (oC)
0.0 - 44.4 29.5 28.1 20.1 30.0 1 1.8 1.2 20.2 30.0 2 1.0 0.7 20.3 30.0 3 1.0 0.6 20.5 30.0 4 1.0 0.7 20.7 30.0 5 1.0 0.6 20.7 30.0 6 1.0 0.6 20.8 30.0 7 8.8 5.9 20.9
Replication 2 Time (min) Sample port Conductivity
(ms/cm) Total dissolved
solids (g/L) Salinity Temp (oC)
0.0 - 44.4 29.5 28.1 20.2 30.0 1 1.9 1.2 20.5 30.0 2 1.0 0.7 20.5 30.0 3 0.9 0.6 20.7 30.0 4 1.0 0.6 20.9 30.0 5 0.9 0.6 20.8 30.0 6 1.0 0.7 21.0 30.0 7 8.8 5.9 20.8
Replication 3 Time (min) Sample port Conductivity
(ms/cm) Total dissolved
solids (g/L) Salinity Temp (oC)
0.0 - 44.4 29.5 28.1 20.2 30.0 1 1.7 1.2 20.8 30.0 2 1.0 0.6 20.7 30.0 3 0.9 0.6 20.8 30.0 4 1.0 0.6 20.9 30.0 5 1.0 0.7 21.0 30.0 6 0.9 0.6 21.1 30.0 7 8.7 5.8 21.1

158
Table B-19. Three collected data sets for Diverter A at 22.71 L/min flow rate with the diverter chamber drain open.
Replication 1 Time (min) Sample port Conductivity
(ms/cm) Total dissolved
solids (g/L) Salinity Temp (oC)
0.0 - 44.0 29.2 27.8 23.4 30.0 1 1.7 1.1 23.2 30.0 2 0.9 0.6 23.1 30.0 3 1.0 0.6 23.0 30.0 4 1.0 0.7 22.9 30.0 5 1.0 0.7 22.8 30.0 6 40.9 27.2 25.7 22.8 30.0 7 43.1 28.7 27.2 22.8
Replication 2 Time (min) Sample port Conductivity
(ms/cm) Total dissolved
solids (g/L) Salinity Temp (oC)
0.0 - 43.9 29.1 27.7 23.2 30.0 1 1.1 0.7 22.6 30.0 2 0.9 0.6 22.6 30.0 3 1.0 0.6 22.7 30.0 4 1.0 0.7 22.6 30.0 5 1.1 0.7 22.7 30.0 6 41.7 27.2 26.2 22.6 30.0 7 43.5 28.8 27.4 22.8
Replication 3 Time (min) Sample port Conductivity
(ms/cm) Total dissolved
solids (g/L) Salinity Temp (oC)
0.0 - 44.1 29.4 28.0 23.2 30.0 1 1.9 1.3 23.8 30.0 2 0.9 0.6 23.6 30.0 3 1.0 0.6 23.5 30.0 4 1.0 0.7 23.4 30.0 5 1.0 0.7 23.3 30.0 6 39.6 26.4 24.9 23.3 30.0 7 42.0 28.0 26.5 23.3

159
Table B-20. Three collected data sets for Diverter B at 22.71 L/min flow rate with the diverter chamber drain open.
Replication 1 Time (min) Sample port Conductivity
(ms/cm) Total dissolved
solids (g/L) Salinity Temp (oC)
0.0 - 44.0 29.2 27.8 23.4 30.0 1 1.7 1.2 22.7 30.0 2 1.0 0.6 22.6 30.0 3 0.9 0.6 22.6 30.0 4 0.9 0.6 22.6 30.0 5 1.0 0.6 22.6 30.0 6 42.0 28.0 25.3 22.7 30.0 7 43.0 27.3 25.6 22.8
Replication 2 Time (min) Sample port Conductivity
(ms/cm) Total dissolved
solids (g/L) Salinity Temp (oC)
0.0 - 43.9 29.1 27.7 23.2 30.0 1 1.7 1.1 23.2 30.0 2 0.9 0.6 23.1 30.0 3 0.9 0.6 23.1 30.0 4 0.9 0.6 23.0 30.0 5 1.0 0.7 23.0 30.0 6 39.9 26.5 25.0 23.0 30.0 7 42.2 28.1 26.5 22.9
Replication 3 Time (min) Sample port Conductivity
(ms/cm) Total dissolved
solids (g/L) Salinity Temp (oC)
0.0 - 44.1 29.4 28.0 23.2 30.0 1 1.7 1.2 23.3 30.0 2 1.0 0.6 23.3 30.0 3 0.9 0.6 23.3 30.0 4 0.9 0.6 23.3 30.0 5 1.0 0.6 23.3 30.0 6 40.1 26.7 25.2 23.2 30.0 7 42.6 28.3 25.9 23.2

160
Table B-21. Three collected data sets for Diverter C at 22.71 L/min flow rate with the diverter chamber drain open.
Replication 1 Time (min) Sample port Conductivity
(ms/cm) Total dissolved
solids (g/L) Salinity Temp (oC)
0.0 - 44.0 29.2 27.8 23.4 30.0 1 1.9 1.3 22.7 30.0 2 1.0 0.7 22.6 30.0 3 1.0 0.7 22.6 30.0 4 0.9 0.6 22.6 30.0 5 0.9 0.6 22.5 30.0 6 1.0 0.6 22.5 30.0 7 7.0 4.7 22.3
Replication 2 Time (min) Sample port Conductivity
(ms/cm) Total dissolved
solids (g/L) Salinity Temp (oC)
0.0 - 43.9 29.1 27.7 23.2 30.0 1 1.9 1.2 22.9 30.0 2 0.9 0.6 22.9 30.0 3 0.9 0.6 22.9 30.0 4 0.9 0.6 22.8 30.0 5 0.9 0.6 22.8 30.0 6 0.9 0.6 22.8 30.0 7 8.8 5.9 22.8
Replication 3 Time (min) Sample port Conductivity
(ms/cm) Total dissolved
solids (g/L) Salinity Temp (oC)
0.0 - 44.1 29.4 28.0 23.2 30.0 1 1.8 1.2 23.3 30.0 2 1.0 0.7 23.2 30.0 3 0.9 0.6 23.2 30.0 4 0.9 0.6 23.2 30.0 5 0.9 0.6 23.2 30.0 6 0.9 0.6 23.2 30.0 7 8.7 5.8 23.1

161
Table B-22. Three collected data sets for Diverter D at 22.71 L/min flow rate with the diverter chamber drain open.
Replication 1 Time (min) Sample port Conductivity
(ms/cm) Total dissolved
solids (g/L) Salinity Temp (oC)
0.0 - 43.8 29.2 27.7 21.5 30.0 1 1.3 0.9 20.5 30.0 2 1.2 0.8 20.4 30.0 3 1.1 0.8 20.5 30.0 4 1.0 0.7 20.5 30.0 5 1.0 0.7 20.6 30.0 6 1.0 0.7 20.7 30.0 7 9.5 6.4 5.3 20.6
Replication 2 Time (min) Sample port Conductivity
(ms/cm) Total dissolved
solids (g/L) Salinity Temp (oC)
0.0 - 44.0 29.3 27.8 21.3 30.0 1 1.2 0.8 21.9 30.0 2 1.2 0.8 21.9 30.0 3 1.1 0.7 21.9 30.0 4 1.6 1.6 21.8 30.0 5 1.2 0.8 21.9 30.0 6 1.2 0.8 21.9 30.0 7 9.6 6.4 5.3 21.9
Replication 3 Time (min) Sample port Conductivity
(ms/cm) Total dissolved
solids (g/L) Salinity Temp (oC)
0.0 - 44.0 29.3 27.9 21.8 30.0 1 1.8 1.2 21.8 30.0 2 1.4 0.7 21.9 30.0 3 1.0 0.6 21.9 30.0 4 1.0 0.6 22.0 30.0 5 1.0 0.7 22.1 30.0 6 1.1 0.7 22.1 30.0 7 9.2 6.1 5.1 22.1

162
Table B-23. Three collected data sets for Diverter E at 22.71 L/min flow rate with the diverter chamber drain open.
Replication 1 Time (min) Sample port Conductivity
(ms/cm) Total dissolved
solids (g/L) Salinity Temp (oC)
0.0 - 43.8 29.2 27.7 21.5 30.0 1 1.8 1.2 20.9 30.0 2 1.2 0.8 20.8 30.0 3 1.2 0.8 20.7 30.0 4 1.2 0.8 20.7 30.0 5 1.2 0.8 20.7 30.0 6 1.1 0.7 20.7 30.0 7 9.2 6.1 5.0 20.6
Replication 2 Time (min) Sample port Conductivity
(ms/cm) Total dissolved
solids (g/L) Salinity Temp (oC)
0.0 - 44.0 29.3 27.8 21.3 30.0 1 1.0 1.3 21.5 30.0 2 1.2 0.8 21.6 30.0 3 1.2 0.8 21.7 30.0 4 1.2 0.8 21.8 30.0 5 1.2 0.8 21.9 30.0 6 1.2 0.8 21.9 30.0 7 9.3 6.2 5.1 21.9
Replication 3 Time (min) Sample port Conductivity
(ms/cm) Total dissolved
solids (g/L) Salinity Temp (oC)
0.0 - 44.0 29.3 27.9 21.8 30.0 1 1.1 0.7 22.0 30.0 2 1.0 0.6 22.1 30.0 3 1.0 0.7 22.1 30.0 4 1.0 0.7 22.1 30.0 5 1.0 0.7 22.2 30.0 6 1.0 0.6 22.2 30.0 7 9.4 6.2 5.2 22.2

163
Table B-24. Three collected data sets for Diverter F at 22.71 L/min flow rate with the diverter chamber drain open.
Replication 1 Time (min) Sample port Conductivity
(ms/cm) Total dissolved
solids (g/L) Salinity Temp (oC)
0.0 - 44.1 29.3 27.8 20.1 30.0 1 1.7 1.1 20.2 30.0 2 1.0 0.7 20.2 30.0 3 0.9 0.6 20.4 30.0 4 1.0 0.6 20.4 30.0 5 1.0 0.6 20.3 30.0 6 1.0 0.7 20.3 30.0 7 8.9 5.9 20.4
Replication 2 Time (min) Sample port Conductivity
(ms/cm) Total dissolved
solids (g/L) Salinity Temp (oC)
0.0 - 44.1 29.3 27.8 20.1 30.0 1 2.5 1.6 20.2 30.0 2 1.0 0.7 20.3 30.0 3 1.0 0.6 20.6 30.0 4 1.0 0.7 20.8 30.0 5 1.0 0.6 21.0 30.0 6 1.0 0.6 21.3 30.0 7 7.9 5.3 21.5
Replication 3 Time (min) Sample port Conductivity
(ms/cm) Total dissolved
solids (g/L) Salinity Temp (oC)
0.0 - 44.0 29.2 27.8 20.2 30.0 1 1.8 1.1 20.4 30.0 2 1.0 0.6 20.5 30.0 3 1.0 0.7 20.5 30.0 4 1.0 0.6 20.4 30.0 5 1.0 0.7 20.4 30.0 6 1.0 0.6 20.4 30.0 7 7.0 4.7 20.3

164
Table B-25. Three collected data sets for Diverter A at 43.91 L/min flow rate with the diverter chamber drain open.
Replication 1 Time (min) Sample port Conductivity
(ms/cm) Total dissolved
solids (g/L) Salinity Temp (oC)
0.0 - 44.0 29.3 27.8 20.9 30.0 1 1.7 1.2 20.8 30.0 2 1.0 0.6 21.0 30.0 3 1.0 0.6 21.1 30.0 4 1.0 0.7 21.2 30.0 5 1.0 0.7 21.3 30.0 6 24.4 16.3 14.6 21.3 30.0 7 42.1 28.1 26.5 21.2
Replication 2 Time (min) Sample port Conductivity
(ms/cm) Total dissolved
solids (g/L) Salinity Temp (oC)
0.0 - 44.0 29.3 27.7 21.8 30.0 1 1.1 0.7 20.3 30.0 2 1.0 0.7 20.5 30.0 3 1.0 0.6 20.7 30.0 4 1.0 0.6 20.9 30.0 5 1.0 0.7 21.0 30.0 6 41.0 27.3 25.7 21.1 30.0 7 42.5 28.3 26.8 21.1
Replication 3 Time (min) Sample port Conductivity
(ms/cm) Total dissolved
solids (g/L) Salinity Temp (oC)
0.0 - 44.0 29.3 27.8 22.4 30.0 1 1.1 0.7 20.7 30.0 2 1.0 0.6 21.0 30.0 3 1.0 0.6 21.3 30.0 4 1.0 0.7 21.4 30.0 5 1.7 1.1 21.6 30.0 6 41.6 27.8 26.2 21.7 30.0 7 42.9 28.6 27.0 21.7

165
Table B-26. Three collected data sets for Diverter B at 43.91 L/min flow rate with the diverter chamber drain open.
Replication 1 Time (min) Sample port Conductivity
(ms/cm) Total dissolved
solids (g/L) Salinity Temp (oC)
0.0 - 44.0 29.3 27.8 20.9 30.0 1 1.5 1.0 19.9 30.0 2 1.1 0.8 20.2 30.0 3 1.0 0.6 20.4 30.0 4 1.0 0.6 20.7 30.0 5 1.0 0.6 20.9 30.0 6 41.5 27.6 26.1 20.9 30.0 7 42.6 28.4 26.8 20.9
Replication 2 Time (min) Sample port Conductivity
(ms/cm) Total dissolved
solids (g/L) Salinity Temp (oC)
0.0 - 44.0 29.3 27.7 21.8 30.0 1 1.7 1.1 20.3 30.0 2 1.0 0.7 20.5 30.0 3 1.0 0.7 20.8 30.0 4 1.1 0.7 21.1 30.0 5 1.2 0.8 21.2 30.0 6 1.2 0.8 21.3 30.0 7 41.3 27.5 25.9 21.4
Replication 3 Time (min) Sample port Conductivity
(ms/cm) Total dissolved
solids (g/L) Salinity Temp (oC)
0.0 - 44.0 29.3 27.8 22.4 30.0 1 2.0 1.3 20.9 30.0 2 1.2 0.8 21.1 30.0 3 1.2 0.8 21.3 30.0 4 1.0 0.6 21.5 30.0 5 1.0 0.7 21.7 30.0 6 1.1 0.7 21.8 30.0 7 41.5 27.6 26.1 21.9

166
Table B-27. Three collected data sets for Diverter C at 43.91 L/min flow rate with the diverter chamber drain open.
Replication 1 Time (min) Sample port Conductivity
(ms/cm) Total dissolved
solids (g/L) Salinity Temp (oC)
0.0 - 44.0 29.3 27.8 20.9 30.0 1 1.6 1.0 20.0 30.0 2 0.9 0.6 20.3 30.0 3 0.9 0.6 20.5 30.0 4 0.9 0.6 20.7 30.0 5 1.0 0.6 20.9 30.0 6 0.9 0.6 21.1 30.0 7 9.1 6.0 21.1
Replication 2 Time (min) Sample port Conductivity
(ms/cm) Total dissolved
solids (g/L) Salinity Temp (oC)
0.0 - 44.0 29.3 27.7 21.8 30.0 1 1.9 1.3 22.2 30.0 2 1.0 0.7 22.1 30.0 3 0.9 0.6 22.0 30.0 4 0.9 0.6 22.0 30.0 5 0.9 0.6 21.9 30.0 6 0.9 0.6 21.9 30.0 7 7.2 4.8 21.8
Replication 3 Time (min) Sample port Conductivity
(ms/cm) Total dissolved
solids (g/L) Salinity Temp (oC)
0.0 - 44.0 29.3 27.8 22.4 30.0 1 2.0 1.3 21.3 30.0 2 1.0 0.7 21.4 30.0 3 1.0 0.6 21.6 30.0 4 1.0 0.6 21.8 30.0 5 1.0 0.6 22.0 30.0 6 1.0 0.6 22.1 30.0 7 9.2 6.1 5.1 22.1

167
Table B-28. Three collected data sets for Diverter D at 43.91 L/min flow rate with the diverter chamber drain open.
Replication 1 Time (min) Sample port Conductivity
(ms/cm) Total dissolved
solids (g/L) Salinity Temp (oC)
0.0 - 43.9 29.2 27.7 22.3 30.0 1 1.1 0.7 23.0 30.0 2 1.1 0.7 23.0 30.0 3 1.2 0.8 23.1 30.0 4 1.2 0.8 23.1 30.0 5 1.2 0.8 23.1 30.0 6 1.1 0.7 23.1 30.0 7 9.4 6.3 5.2 23.1
Replication 2 Time (min) Sample port Conductivity
(ms/cm) Total dissolved
solids (g/L) Salinity Temp (oC)
0.0 - 43.9 29.2 27.8 23.8 30.0 1 1.6 1.1 23.3 30.0 2 1.0 0.7 23.2 30.0 3 1.0 0.7 23.1 30.0 4 1.0 0.7 23.1 30.0 5 1.0 0.7 23.1 30.0 6 1.0 0.7 23.1 30.0 7 9.6 6.4 5.3 23.0
Replication 3 Time (min) Sample port Conductivity
(ms/cm) Total dissolved
solids (g/L) Salinity Temp (oC)
0.0 - 44.0 29.3 28.0 23.4 30.0 1 1.6 1.1 23.4 30.0 2 1.0 0.7 23.4 30.0 3 1.0 0.7 23.4 30.0 4 1.0 0.7 23.4 30.0 5 1.0 0.7 23.3 30.0 6 1.0 0.7 23.3 30.0 7 8.9 5.9 23.2

168
Table B-29. Three collected data sets for Diverter E at 43.91 L/min flow rate with the diverter chamber drain open.
Replication 1 Time (min) Sample port Conductivity
(ms/cm) Total dissolved
solids (g/L) Salinity Temp (oC)
0.0 - 43.9 29.2 27.7 22.3 30.0 1 1.8 1.1 23.2 30.0 2 1.2 0.8 22.9 30.0 3 1.1 0.8 22.9 30.0 4 1.2 0.8 22.9 30.0 5 1.2 0.8 22.9 30.0 6 1.2 0.8 22.9 30.0 7 9.1 6.0 5.0 22.9
Replication 2 Time (min) Sample port Conductivity
(ms/cm) Total dissolved
solids (g/L) Salinity Temp (oC)
0.0 - 43.9 29.2 27.8 23.8 30.0 1 1.2 0.8 22.8 30.0 2 1.0 0.7 22.9 30.0 3 1.1 0.8 23.0 30.0 4 1.1 0.8 23.0 30.0 5 1.0 0.7 23.0 30.0 6 1.0 0.7 23.0 30.0 7 9.1 6.1 5.0 22.9
Replication 3 Time (min) Sample port Conductivity
(ms/cm) Total dissolved
solids (g/L) Salinity Temp (oC)
0.0 - 44.0 29.3 28.0 23.4 30.0 1 1.1 0.8 22.6 30.0 2 1.0 0.7 22.8 30.0 3 1.0 0.7 23.0 30.0 4 1.0 0.7 23.0 30.0 5 1.0 0.7 23.1 30.0 6 1.0 0.7 23.2 30.0 7 9.7 6.4 5.3 23.2

169
Table B-30. Three collected data sets for Diverter F at 43.91 L/min flow rate with the diverter chamber drain open.
Replication 1 Time (min) Sample port Conductivity
(ms/cm) Total dissolved
solids (g/L) Salinity Temp (oC)
0.0 - 43.6 29.0 27.4 19.8 30.0 1 2.7 1.7 20.1 30.0 2 1.1 0.8 20.4 30.0 3 1.0 0.7 20.5 30.0 4 1.1 0.7 20.5 30.0 5 1.1 0.7 20.5 30.0 6 1.1 0.8 20.3 30.0 7 7.6 5.1 20.3
Replication 2 Time (min) Sample port Conductivity
(ms/cm) Total dissolved
solids (g/L) Salinity Temp (oC)
0.0 - 43.6 29.0 27.4 19.8 30.0 1 1.8 1.1 20.2 30.0 2 1.0 0.7 20.5 30.0 3 1.0 0.7 20.6 30.0 4 1.0 0.6 20.4 30.0 5 1.0 0.7 20.4 30.0 6 1.0 0.7 20.3 30.0 7 7.1 5.0 20.3
Replication 3 Time (min) Sample port Conductivity
(ms/cm) Total dissolved
solids (g/L) Salinity Temp (oC)
0.0 - 43.6 29.0 27.4 19.8 30.0 1 1.3 0.9 20.3 30.0 2 1.0 0.7 20.5 30.0 3 1.2 0.8 20.6 30.0 4 1.1 0.7 20.6 30.0 5 1.2 0.8 20.6 30.0 6 1.0 0.7 20.4 30.0 7 8.7 5.8 20.4

170
Table B-31. Three collected data sets for Diverter A at 75.71 L/min flow rate with the diverter chamber drain open.
Replication 1 Time (min) Sample port Conductivity
(ms/cm) Total dissolved
solids (g/L) Salinity Temp (oC)
0.0 - 44.2 29.5 27.8 20.6 30.0 1 2.5 1.7 21.8 30.0 2 1.2 0.8 22.2 30.0 3 1.3 0.9 22.7 30.0 4 1.3 0.9 23.1 30.0 5 1.3 0.9 23.4 30.0 6 1.2 0.8 23.7 30.0 7 39.3 26.5 25.0 23.5
Replication 2 Time (min) Sample port Conductivity
(ms/cm) Total dissolved
solids (g/L) Salinity Temp (oC)
0.0 - 44.0 29.3 22.8 21.5 30.0 1 2.0 1.3 23.0 30.0 2 1.2 0.8 23.2 30.0 3 1.2 0.8 23.6 30.0 4 1.2 0.8 23.8 30.0 5 1.2 0.8 24.0 30.0 6 1.6 1.1 24.0 30.0 7 40.9 26.9 25.6 23.8
Replication 3 Time (min) Sample port Conductivity
(ms/cm) Total dissolved
solids (g/L) Salinity Temp (oC)
0.0 - 44.0 29.2 27.8 19.6 30.0 1 3.0 1.9 20.3 30.0 2 1.1 0.8 20.7 30.0 3 1.1 0.7 20.9 30.0 4 1.1 0.7 21.0 30.0 5 1.1 0.8 21.1 30.0 6 1.3 0.8 21.1 30.0 7 40.6 27.3 25.8 20.6

171
Table B-32. Three collected data sets for Diverter B at 75.71 L/min flow rate with the diverter chamber drain open.
Replication 1 Time (min) Sample port Conductivity
(ms/cm) Total dissolved
solids (g/L) Salinity Temp (oC)
0.0 - 44.2 29.5 27.8 20.6 30.0 1 2.4 1.6 23.4 30.0 2 1.1 0.7 23.5 30.0 3 1.2 0.8 23.6 30.0 4 1.1 0.8 23.7 30.0 5 10.8 7.3 6.1 23.6 30.0 6 39.1 26.2 24.8 23.3 30.0 7 40.8 27.3 25.8 22.3
Replication 2 Time (min) Sample port Conductivity
(ms/cm) Total dissolved
solids (g/L) Salinity Temp (oC)
0.0 - 44.0 29.3 22.8 21.5 30.0 1 2.1 1.3 21.8 30.0 2 1.3 0.8 22.5 30.0 3 1.3 0.9 23.4 30.0 4 1.1 0.8 23.7 30.0 5 4.2 2.8 23.8 30.0 6 39.1 26.2 24.8 23.8 30.0 7 40.6 27.3 25.9 23.1
Replication 3 Time (min) Sample port Conductivity
(ms/cm) Total dissolved
solids (g/L) Salinity Temp (oC)
0.0 - 44.0 29.2 27.8 19.6 30.0 1 2.1 1.3 20.4 30.0 2 1.5 0.8 20.4 30.0 3 1.1 0.7 20.6 30.0 4 1.2 0.8 20.7 30.0 5 2.1 1.4 20.7 30.0 6 37.5 25.2 23.6 20.2 30.0 7 40.3 27.0 25.4 19.7

172
Table B-33. Three collected data sets for Diverter C at 75.71 L/min flow rate with the diverter chamber drain open.
Replication 1 Time (min) Sample port Conductivity
(ms/cm) Total dissolved
solids (g/L) Salinity Temp (oC)
0.0 - 44.0 29.3 27.8 20.4 30.0 1 2.2 1.5 22.0 30.0 2 1.3 0.8 22.2 30.0 3 1.3 0.8 22.4 30.0 4 1.3 0.9 22.6 30.0 5 1.3 0.8 22.8 30.0 6 1.3 0.8 22.9 30.0 7 9.2 6.2 5.1 23.0
Replication 2 Time (min) Sample port Conductivity
(ms/cm) Total dissolved
solids (g/L) Salinity Temp (oC)
0.0 - 43.3 29.5 28.0 22.2 30.0 1 1.2 1.3 22.0 30.0 2 1.1 0.7 22.2 30.0 3 1.1 0.8 22.5 30.0 4 1.0 0.7 22.7 30.0 5 1.0 0.7 22.9 30.0 6 1.0 0.7 23.1 30.0 7 9.2 6.1 5.1 23.1
Replication 3 Time (min) Sample port Conductivity
(ms/cm) Total dissolved
solids (g/L) Salinity Temp (oC)
0.0 - 44.3 29.5 28.1 21.9 30.0 1 1.3 0.9 21.2 30.0 2 1.1 0.7 21.5 30.0 3 1.1 0.7 21.8 30.0 4 1.0 0.7 22.1 30.0 5 1.0 0.7 22.7 30.0 6 1.0 0.7 22.9 30.0 7 8.3 5.5 23.0

173
Table B-34. Three collected data sets for Diverter D at 75.71 L/min flow rate with the diverter chamber drain open.
Replication 1 Time (min) Sample port Conductivity
(ms/cm) Total dissolved
solids (g/L) Salinity Temp (oC)
0.0 - 44.2 29.4 27.8 19.5 30.0 1 3.1 2.1 21.8 30.0 2 1.3 0.9 22.4 30.0 3 1.3 0.9 22.8 30.0 4 1.3 0.9 23.0 30.0 5 1.3 0.8 23.2 30.0 6 1.2 0.8 23.2 30.0 7 8.5 5.7 23.1
Replication 2 Time (min) Sample port Conductivity
(ms/cm) Total dissolved
solids (g/L) Salinity Temp (oC)
0.0 - 44.2 29.4 27.9 20.0 30.0 1 2.2 1.6 20.3 30.0 2 1.1 0.8 20.5 30.0 3 1.1 0.7 20.7 30.0 4 1.1 0.7 20.8 30.0 5 1.1 0.7 20.9 30.0 6 1.0 0.7 20.9 30.0 7 8.8 5.9 20.8
Replication 3 Time (min) Sample port Conductivity
(ms/cm) Total dissolved
solids (g/L) Salinity Temp (oC)
0.0 - 44.2 29.4 27.9 20.0 30.0 1 2.9 2.0 20.7 30.0 2 1.2 0.8 21.1 30.0 3 1.1 0.7 21.5 30.0 4 1.1 0.7 21.7 30.0 5 1.1 0.7 21.9 30.0 6 1.1 0.7 22.1 30.0 7 8.9 5.9 22.1

174
Table B-35. Three collected data sets for Diverter E at 75.71 L/min flow rate with the diverter chamber drain open.
Replication 1 Time (min) Sample port Conductivity
(ms/cm) Total dissolved
solids (g/L) Salinity Temp (oC)
0.0 - 44.0 29.3 27.8 20.4 30.0 1 1.3 0.9 23.1 30.0 2 1.2 0.8 23.1 30.0 3 1.2 0.8 23.2 30.0 4 1.2 0.8 23.3 30.0 5 1.2 0.8 23.2 30.0 6 1.1 0.7 23.1 30.0 7 9.1 6.1 5.0 23.0
Replication 2 Time (min) Sample port Conductivity
(ms/cm) Total dissolved
solids (g/L) Salinity Temp (oC)
0.0 - 43.3 29.5 28.0 22.2 30.0 1 1.1 0.8 23.1 30.0 2 1.1 0.7 23.1 30.0 3 1.2 0.8 23.2 30.0 4 1.0 0.7 23.2 30.0 5 1.0 0.7 23.2 30.0 6 1.0 0.7 23.2 30.0 7 9.4 6.3 5.2 23.2
Replication 3 Time (min) Sample port Conductivity
(ms/cm) Total dissolved
solids (g/L) Salinity Temp (oC)
0.0 - 44.3 29.5 28.1 21.9 30.0 1 1.2 0.8 23.1 30.0 2 1.0 0.7 23.2 30.0 3 1.0 0.7 23.3 30.0 4 1.0 0.7 23.3 30.0 5 1.0 0.7 23.4 30.0 6 1.0 0.7 23.5 30.0 7 9.0 6.0 23.4

175
Table B-36. Three collected data sets for Diverter F at 75.71 L/min flow rate with the diverter chamber drain open.
Replication 1 Time (min) Sample port Conductivity
(ms/cm) Total dissolved
solids (g/L) Salinity Temp (oC)
0.0 - 43.8 29.1 27.8 22.0 30.0 1 1.7 1.1 22.4 30.0 2 1.0 0.6 22.5 30.0 3 0.9 0.6 22.5 30.0 4 1.0 0.6 22.7 30.0 5 1.0 0.7 22.9 30.0 6 1.0 0.7 22.9 30.0 7 7.0 4.7 23.0
Replication 2 Time (min) Sample port Conductivity
(ms/cm) Total dissolved
solids (g/L) Salinity Temp (oC)
0.0 - 43.8 29.1 27.8 22.0 30.0 1 1.9 1.3 22.2 30.0 2 1.0 0.7 22.4 30.0 3 1.0 0.7 22.5 30.0 4 0.9 0.6 22.4 30.0 5 1.0 0.7 22.3 30.0 6 1.0 0.6 22.5 30.0 7 7.3 4.9 22.9
Replication 3 Time (min) Sample port Conductivity
(ms/cm) Total dissolved
solids (g/L) Salinity Temp (oC)
0.0 - 43.8 29.1 27.8 22.0 30.0 1 1.7 1.2 22.9 30.0 2 0.9 0.6 22.8 30.0 3 0.9 0.6 22.8 30.0 4 1.0 0.7 22.6 30.0 5 1.1 0.7 22.6 30.0 6 1.1 0.7 22.5 30.0 7 7.2 4.8 22.6

176
Table B-37. Three collected data sets for Diverter A at 113.56 L/min flow rate with the diverter chamber drain open.
Replication 1 Time (min) Sample port Conductivity
(ms/cm) Total dissolved
solids (g/L) Salinity Temp (oC)
0.0 - 44.3 29.5 28.0 22.2 30.0 1 2.1 1.4 22.4 30.0 2 1.4 0.9 22.8 30.0 3 1.3 0.8 23.0 30.0 4 1.5 1.0 23.4 30.0 5 1.6 1.0 23.6 30.0 6 1.6 1.1 23.8 30.0 7 40.2 27.0 25.6 23.5
Replication 2 Time (min) Sample port Conductivity
(ms/cm) Total dissolved
solids (g/L) Salinity Temp (oC)
0.0 - 44.0 29.3 27.6 17.7 30.0 1 2.5 1.6 18.4 30.0 2 1.2 0.8 19.2 30.0 3 1.2 0.8 19.6 30.0 4 1.2 0.8 20.0 30.0 5 1.2 0.9 20.2 30.0 6 1.4 0.9 20.3 30.0 7 39.1 26.3 24.6 19.9
Replication 3 Time (min) Sample port Conductivity
(ms/cm) Total dissolved
solids (g/L) Salinity Temp (oC)
0.0 - 44.1 29.3 27.6 17.9 30.0 1 3.0 1.7 19.3 30.0 2 1.3 0.8 20.2 30.0 3 1.2 0.8 20.9 30.0 4 1.3 0.9 21.4 30.0 5 1.3 0.8 21.7 30.0 6 1.5 1.0 21.9 30.0 7 39.5 26.5 24.9 21.5

177
Table B-38. Three collected data sets for Diverter B at 113.56 L/min flow rate with the diverter chamber drain open.
Replication 1 Time (min) Sample port Conductivity
(ms/cm) Total dissolved
solids (g/L) Salinity Temp (oC)
0.0 - 44.3 29.5 28.0 22.2 30.0 1 2.2 1.5 19.3 30.0 2 1.5 1.0 20.0 30.0 3 1.4 0.9 20.8 30.0 4 1.5 1.0 21.5 30.0 5 1.5 1.0 22.1 30.0 6 40.3 26.9 25.4 22.2 30.0 7 42.6 28.5 27.0 22.1
Replication 2 Time (min) Sample port Conductivity
(ms/cm) Total dissolved
solids (g/L) Salinity Temp (oC)
0.0 - 44.0 29.3 27.6 17.7 30.0 1 2.5 1.7 18.3 30.0 2 1.2 0.8 19.2 30.0 3 1.1 0.8 20.1 30.0 4 1.2 0.8 20.6 30.0 5 1.4 0.9 20.8 30.0 6 40.1 26.7 24.9 20.5 30.0 7 40.9 27.4 25.8 19.2
Replication 3 Time (min) Sample port Conductivity
(ms/cm) Total dissolved
solids (g/L) Salinity Temp (oC)
0.0 - 44.1 29.3 27.6 17.9 30.0 1 2.1 1.4 17.1 30.0 2 1.2 0.8 18.3 30.0 3 1.4 0.9 19.5 30.0 4 1.2 0.8 20.6 30.0 5 1.5 1.0 21.1 30.0 6 39.0 26.0 24.4 21.0 30.0 7 41.3 27.5 25.8 20.3

178
Table B-39. Three collected data sets for Diverter C at 113.56 L/min flow rate with the diverter chamber drain open.
Replication 1 Time (min) Sample port Conductivity
(ms/cm) Total dissolved
solids (g/L) Salinity Temp (oC)
0.0 - 44.2 29.5 28.0 23.2 30.0 1 2.2 1.5 23.3 30.0 2 1.2 0.8 23.5 30.0 3 1.2 0.8 23.7 30.0 4 1.2 0.8 24.0 30.0 5 1.2 0.8 24.7 30.0 6 1.2 0.8 24.7 30.0 7 10.0 6.7 5.6 24.6
Replication 2 Time (min) Sample port Conductivity
(ms/cm) Total dissolved
solids (g/L) Salinity Temp (oC)
0.0 - 44.0 29.3 27.9 23.2 30.0 1 1.7 1.1 22.8 30.0 2 1.2 0.8 23.1 30.0 3 1.0 0.7 23.5 30.0 4 1.1 0.7 23.8 30.0 5 1.0 0.7 24.0 30.0 6 1.0 0.7 24.2 30.0 7 9.7 6.5 5.4 24.4
Replication 3 Time (min) Sample port Conductivity
(ms/cm) Total dissolved
solids (g/L) Salinity Temp (oC)
0.0 - 44.2 29.4 28.0 23.1 30.0 1 1.6 1.1 23.1 30.0 2 1.1 0.7 23.3 30.0 3 1.0 0.7 23.5 30.0 4 1.0 0.7 23.8 30.0 5 1.0 0.7 24.0 30.0 6 1.0 0.7 24.1 30.0 7 9.3 6.2 5.1 24.3

179
Table B-40. Three collected data sets for Diverter D at 113.56 L/min flow rate with the diverter chamber drain open.
Replication 1 Time (min) Sample port Conductivity
(ms/cm) Total dissolved
solids (g/L) Salinity Temp (oC)
0.0 - 44.2 29.4 28.0 23.2 30.0 1 1.3 0.8 22.3 30.0 2 1.0 0.7 22.6 30.0 3 1.0 0.7 22.7 30.0 4 1.0 0.7 23.0 30.0 5 1.0 0.7 23.0 30.0 6 1.0 0.7 23.1 30.0 7 9.0 6.0 5.1 23.0
Replication 2 Time (min) Sample port Conductivity
(ms/cm) Total dissolved
solids (g/L) Salinity Temp (oC)
0.0 - 44.3 29.5 28.1 22.2 30.0 1 1.2 0.8 22.4 30.0 2 1.8 1.2 22.6 30.0 3 1.1 0.7 22.5 30.0 4 1.2 0.8 22.6 30.0 5 1.2 0.8 22.7 30.0 6 1.3 0.8 22.8 30.0 7 9.2 6.1 5.2 22.4
Replication 3 Time (min) Sample port Conductivity
(ms/cm) Total dissolved
solids (g/L) Salinity Temp (oC)
0.0 - 44.2 29.4 28.0 22.3 30.0 1 3.1 2.0 22.6 30.0 2 1.1 0.8 22.4 30.0 3 1.1 0.7 22.4 30.0 4 1.1 0.7 21.9 30.0 5 1.0 0.7 21.9 30.0 6 1.0 0.7 22.0 30.0 7 8.8 5.9 21.8

180
Table B-41. Three collected data sets for Diverter E at 113.56 L/min flow rate with the diverter chamber drain open.
Replication 1 Time (min) Sample port Conductivity
(ms/cm) Total dissolved
solids (g/L) Salinity Temp (oC)
0.0 - 44.2 29.5 28.0 23.2 30.0 1 1.8 1.2 23.2 30.0 2 1.0 0.7 23.4 30.0 3 1.2 0.8 23.7 30.0 4 1.2 0.8 24.0 30.0 5 1.2 0.8 24.2 30.0 6 1.3 0.8 24.4 30.0 7 9.2 6.2 5.2 24.5
Replication 2 Time (min) Sample port Conductivity
(ms/cm) Total dissolved
solids (g/L) Salinity Temp (oC)
0.0 - 44.0 29.3 27.9 23.2 30.0 1 2.3 1.6 23.4 30.0 2 1.0 0.7 23.7 30.0 3 1.0 0.7 24.0 30.0 4 1.0 0.7 24.1 30.0 5 1.1 0.7 24.3 30.0 6 1.1 0.7 24.3 30.0 7 9.1 6.1 5.0 24.6
Replication 3 Time (min) Sample port Conductivity
(ms/cm) Total dissolved
solids (g/L) Salinity Temp (oC)
0.0 - 44.2 29.4 28.0 23.1 30.0 1 1.2 0.8 23.9 30.0 2 1.0 0.7 24.0 30.0 3 1.0 0.7 24.2 30.0 4 1.0 0.7 24.3 30.0 5 1.0 0.7 24.4 30.0 6 1.0 0.7 24.5 30.0 7 8.9 5.9 24.6

181
Table B-42. Three collected data sets for Diverter F at 113.56 L/min flow rate with the diverter chamber drain open.
Replication 1 Time (min) Sample port Conductivity
(ms/cm) Total dissolved
solids (g/L) Salinity Temp (oC)
0.0 - 44.1 29.3 27.8 22.5 30.0 1 1.1 0.7 23.6 30.0 2 1.0 0.7 23.9 30.0 3 1.0 0.7 24.1 30.0 4 1.0 0.7 23.9 30.0 5 1.0 0.7 23.9 30.0 6 1.0 0.7 24.0 30.0 7 9.5 6.3 5.2 23.4
Replication 2 Time (min) Sample port Conductivity
(ms/cm) Total dissolved
solids (g/L) Salinity Temp (oC)
0.0 - 44.1 29.3 27.8 22.6 30.0 1 1.1 0.7 23.7 30.0 2 1.6 1.1 23.8 30.0 3 1.2 0.8 24.0 30.0 4 1.0 0.7 24.0 30.0 5 1.1 0.7 23.9 30.0 6 1.0 0.7 24.0 30.0 7 9.5 6.3 5.2 23.7
Replication 3 Time (min) Sample port Conductivity
(ms/cm) Total dissolved
solids (g/L) Salinity Temp (oC)
0.0 - 44.1 29.3 27.8 22.5 30.0 1 1.0 0.7 23.8 30.0 2 1.0 0.7 24.0 30.0 3 0.9 0.6 24.0 30.0 4 0.9 0.6 24.1 30.0 5 1.0 0.6 24.2 30.0 6 1.0 0.6 24.0 30.0 7 6.7 5.8 23.9

182
VITA
Name: Justin Keith Mechell Address: Dept. of Biological and Agricultural Engineering MS 2117 TAMU College Station, TX, 77843 Email Address: [email protected] Education: B.S., Agricultural Engineering, Texas A&M University, 2006 M.S., Agricultural Engineering, Texas A&M University, 2009 Experience: Texas AgriLife Extension Service May 2006-Present Extension Assistant
• Develop engineering approaches to addressing water quantity and quality issues associated with the management of water and infrastructure. Develop and calculate example system design guidance documents.
• Manage various projects and tasks related to agricultural occupational safety, water quality and quantity, organic and commercial nutrient management, small scale solar distillation, low pressure drip irrigation and rainwater harvesting.
• Evaluate various innovative and alternative wastewater treatment systems through literature review and demonstration in the field.
• Develop and deliver educational material addressing abandoned water well closure, stormwater management, rainwater harvesting, agricultural safety, proper use of organic fertilizers and implementation of watershed management plans. Program delivery includes conducting presentations at local county meetings, field days, and regional, state, and national conferences.
• Perform activities related to literature searches and development of equipment drawings for use in printed materials and prepare written reports.
• Design and conduct research on issues related to low pressure drip irrigation, small scale solar distillation units, and rainwater harvesting first flush devices.
KP Engineering Ect., August 2005-February 2006
Contract Laborer • Developed training materials for the Texas Engineering
Extension Service 4-day training course on Onsite Sewage Facilities.
• Developed a course manual, PowerPoint presentations, and exercises related to onsite wastewater technologies and regulations.