Embed Size (px)
Citation preview
, -
f ..poclints? alma
150 153.
JOHOR ,Carroll, John B. k.
MXtlit.. Speed and ACcuracy of Absolute Pitch Judgments; SomeLatter-Day Results.
APTITUTION Educational Testing Service, Princeton, N.J.}SPORT` NO- ETS-R3 -75-35POB ,DATEr Oct 75'NOTE
.
77p.
ERRS "PRICE MF-$0.83 HC-$4.67 Plus Postage.DESCRIPTORS *Auditory Discrimination; Auditory Training; Error
Patterns; Music Activities; *Perception Tests;'*Performance Tests; *Reaction Time; *Tisk
TR 006 673
PerformanceIDENTIFIERS *Pitch (Music)
ABSTRACT /
Nine subjects, 5 of whoa claimed absolute pitch (AP)Ability were instructed to rapidly strike notes on the iano to matchiOanmiied tape-reOorded piano notes. Stimulus set size. were 64, 16,
lt,or -consecutive semitones, or 7 diatonic notes of a deli 'tedOctave., A control task involved motor movements to notes anno aced inadvance:- Accuracy, measured on the basis of deviations of respOisesfrom targets, significantly differentiated AP from NAP (non-AP)subjects at all set sizes except the control task. For both groups;'accuraci increased as set size decreased. Decision tiles- -that partOf 'total response time before a movement to the response notebegan--decreased as set size decreased, but did not differentiate APand ;NAP- subjects. The results are discussed in terms of a two-factortheory of AP ability whereby,NAP subjects use only relative tone
;/ height as the- basis of judgment, but AP' subjects also use standardsof tone chrome stored in long-term zemory: The abnormally highchannel capacities and rates of information gain for -AP subjects arebased on the transmission of information in two channels, whereas NAPsubjects transmit information in only one\chana1. (Author /MV)
44314#444gf4c*** *####4 #301431430******3044#3*******Mig***304314#*******443******Reproductions supplied by!EDRS are tile best that can be made
from the original document.*********************************************************4444**********
U S DEPARTMENT OF HEALTH,EDUCATION WELFARENATIONAL INSTITUTE OF
EDUCATION
THIS DOCUMENT HAS BEEN REPRO.DUCED EXACTLY AS RECEIVED FROM.THE PERSON OR ORGANIZATION ORIGINATING IT POINTS OF VIEW OR OPINIONSSTATED DO NOT NECESSARILY REPRE-SENT OFFICIAL NATIONAL INSTITUTE OFEDUCATION POSITION OR POLICY
RB -75735
"PERMISSION TO REPRODUCE THISMATERIAL HAS BEEN GRANTED BY
-7,4.11., ,, eco--1-611
TO THE EDUCATIONAL. RESOURCESINFORMATION CENTER (ERIC) ANDUSERS OF THE ERIC SYSTEM."
SPEED AND ACCURACY OF ABSOLUTE PITCH JUDGMENTS:
SOME,LATTER-DAY RESULTS
John B. Carroll
The L. L. Thurstone Psychometric LaboratoryUniversity of North Carolina at Chapel Hill
This Bulletin is a draft for interoffice circulation.
Corrections and suggestions for revision are solicited.
The Bulletin should not be cited as a reference without
the specific permission of the author. It is automati-
cally superseded upon formal publication of the material.
Educational Testing Service
Princeton, New Jersey
October 1975
2

Abstract
Nine subjects, 5 of whom claimed absolute pitch (AP) ability (4 from child-
hood, 1 by self-training) were given a pitch judgment task in which they
had to strike notes on the piano as rapidly as possible to match random{ -ed
tape-recorded piano notes. S'imulus set sizes were 64, 16, or 4 consecutive
semitones, or 7 diatonic notes of a designated octave. A control '-ask in-
volved mot'r movements to notes announced in advance, with the effect that
set size was 1. Accuracy, measured on the basis of deviations of responses
from targets, significantly differentiated AP from NAP (non-AP) subjects at
all set sizes except the control task. For both groups, accuracy increased
as set size decreased. Decision times, measured as that part of total3
response time before a movement to the response note began, decreased as
set size decreased, but did not differentiate AP and NAP subjects. The
performance of the trained AP subject was not distinguishable from that of
the remaining AP subjects either in accuracy or decision time. Results are
discussed in terms of a two-factor theory of AP ability whereby NAP subjects
use only relative tone height as the basis of judgment but AP subjects also
use standards of tone chroma stored in long-term memory. The abnormally
high channel. capacities and rates of information gain for AP subjects are
interpreted on the basis of transmission of information in two channels,
whereas NAP subjects transmit information in only one channel.
3

SPEED AND ACCURACY OF ABSOLUTE PITCH JUDGMENTS:
SOME LATTER-DAY RESULTS
John B. Car'r011i
The L. L. Taurstone Psychothetric LaboratoryUniversity 'of North Caroling at Chapel Hill
The phenomenon of "absolute pitch" (AP), whereby some individuals are able,
without use of a reference tone, to identify or produce tones of specified
frequengies or scale names with more than usual.accuracy, has been described
and discussed by psychologists, musicians, and acoust4cians for more than a
century (Abraham,, 1901; Bachem, 1937, 1955; Neu, 1947; Revesz, 1953; Seashore,A
.'1919.; Siegel, 1972; Slonimsky, 1930; Stumpf, 1883; von Kries, 1892; Ward, 1963a,
1963b;Weinert, 1929; Wynn, 1973), but there are as yet no definitive answers
as to whether pitch judgment ability is a continuous or a discontinuous trait,
to what extent AP is innate, acq ired, or improval-le by training, and through
what perceptual and/or neurological mechanisms_it operates.
The present paper, which is a report of pitch identification tests con-
ducted on nine subjects (five of whom claimed AP ability), takes no final posi-
tion on any of the major questions stated above. It is intended only to offer
data that are more adequately controlled and reported than was the case in
most of the earlier investigations, and to suggest answers to certain methodo-
logical and theoretical questions about AP ability, namely, (1) how pitch
judgment ability can best be measured and characterized, (2) whether superior
degrees of pitch judgment ability imply a greater-than-normal channel capacity
for the processing of information, and (3) what effect the range of pitch
This work was done, save for some final/data analyses, while the author
was ior Research Psychologist at Educatioinal Testing Service. Thanks go to
Mr. Liam Libby, then a research assistant at ETS, for help in developing the
instrumentation and procedures, and to theJsubjects who volunteered their
services. I am indebted to Roy Freedle of:Educational Testing Service and to
Thomas S. Wallsten of Lhe University of North Carolina for helpful comments on
an earlier draft of this article. The work was supported by general research
funds of Educational Testing Service.
4
-2-
stimuli has on the speed of AP judgments, As an incidental "bonus," it con-,
tains data on the performance of one subject who claimed to have acquir,i AP
ability through intensive self-training, us may be of some pertinence
to the question of the improvability, of AP j
dg it happens, the investigator hi self claims AP ability from
early childhood and served as one of the sub.ects. While this implies some
risk of a loss of objectivity, it may repreSent a considerable advantage in
..Y .
that the investigator is thereby betterrable to interpret the results.
4/rsachem (1950) complained that many of the investig ors of AP did not possess
AP and thus failed to understand the phenomenon.' StanawaY, Morley, and. ,
Anstis .(1970) remark t hat "Many of the published,studies of AP have'been ofI
little value because neither experimenter nor subjects possessed AP."...
/ The Measurement of AP Judgment Ability
Various procedures, reviewed by Ward (1963a, 1963b), have been employed
to measure AP ability. One of the most popular has been the categorization
task, in which the subject is required to identify or categorize a series of
pitch stimuli in terms of their names on the musical scale or in terms of
preassigned numbe'rs or other designations. Often the results have beenT
expressed simply in terms of proportions of correct responses, or in terms
of average absolute error in semitones (semits). Another type of task uses
the method of constant stimuli, in which graded stimuli are to be judged as
either higher or lower than, or thesame as, a designated pitch. Then there
is the method of adjustment, where the subject attempts eb adjust a tone
generator, a violin string, or other sound-generating device to match aP
designated pitch, and the method of production, where the subject is asked
to sing or hum a designates! note. These latter methods lend t4tmselves
5
-3-
readily to measurements in terms of average algebraic or absolute error, an
err being defined as the amount of deviation of the response from the target,
measured in Hz or '(preferably) in semits or cents.
Generally, the errors observed over a number of stimulus presentations
tend to be distributed normally, either around zero or some other value. What
seems.not to have been explicitly pointed out previously is that this form of
distrition implies a Thurstone-type discriminal ptocess whereby a stimulus
is perceived as walling within a region of a subjective continuum whose extent
can be measured in terms of a standard deviation. Further analysis suggeS',0
that this discriminal process is only one component of the total error variance--
a component that we may call the perceptual dispersion component. In an ideal
case, assume that this dispersion is the same, for a given individual, for any
region of the subjective continuum, even though the dispersion may diminish or
disappear at the extremes of the normal musical scale (Bachem, 1948), but that
-it varies reliauly over individuals. Two other major components of the total
error variance are the scale dispersion and the response dispersion components.
With regard to the former of these, assume that the subjective continuum
itself has some degree of yariation in the sense that, subject to such influ-
ences as recent past experiences (e.g., listening to music played at a certain
pitch standard) or the physiological state of the individual (Wynn, 1972), it
exhibits small translations up or down with respect to the physical scale,
either on different occasions for the same individual, or for different
individuals. Variations in pitch standards from a currently accepted inter-
national standard (at present, A4 = 440 H2) would contribute to the scale
dispersion component. The response dispersion component of error variance
arises when the responses that are elicited from the individual, given
$
-4-
presentations of the same stimulus on different occasions, exhibit deviations
with respect to the central tendency of the region of the subjective
continuum et which they are perceived. Such deviations may be the result
of cqgnitive confusions, motoric errors /in response, or the like.
On the assumption that the three components of variance are independent,
the variance of observed response errors is the sum of these variances.
Ordinarily, it maybe difficult to measure the three components separately,
but with appropriate experimental controls and method'S of analysis this may
be possible, at least to a limited extent. For example, in the present
experiment the scale dispersion component is reflepted in deviations of the
mean algebraic error from zero, and the variance due to the response
dispersion component is estimated by having subjects strike notes announced
in advance, i.e., with no involvement of absolute pitch judgments. In any
case, the usual teports of AP judgments in terms of proportions of correct
judgments, or in terms of absolute magnitudes of errors,- tend to mask the
separate components. tiso, the notion of a variance of a discriminal process
should lay to rest any idea that AP ability can ever be regarded as truly
"absolute" in the sense of being completely errorless--a point that was mad
0
even by a nonpsychologist, Slonimsky (1930), some years ago.
The magnitudes of these error variances may be influenced by specific
experimental procedures and designs. For example, to the\extent that the
stimulus and response categories in categorization tasks fail to have exact
correspondence with the categories of the individual's subjective continuum,
the scale and response dispersion components may be inflated, but to the extent
that the number of categories is limited, the perceptual dispersion component
ma; appear to be decreased because of end,effects and anchoring strategies on
the part of the subject (Ward, 1963a). In the method of production, the
7
response dispersion component may be inflated if the subject is unable reliably
tp adjust his vocal cords to produce the pitch he intends to produce.
In the present study, a pitch identification task was employed, partly be-
cause it lent itself most readily to the investigation of channel capacity and
response latency.' The study was designed and analyzed, however, in such a way
as to make'possible some estimates of the separate components of variance.
Both the pilot and the main experiments involved piano notes as stimuli,
rather than, say, sinusoidal tones produced by electronic means, and the
subjects were all at least reasonably accomplished pianists. There has been
frequent comment in the literatu (Abraham, 1901; Baird, 1917) to the effect
that piano notes seem to be easier to identify than pitches produced by other
musical instruments or the huan voice, at least by'AP subjects who are most
experienced with the piano / Ward (1963a) felt that studies of AP using piano
notes should be called st diet of "absolute piano," although ne was not ready
to discard such studies completely. In the ordinary usage of the term among
musicians, AP ability has to do with the ability to judge the pitch of musical
tones, or the tonality (" ey signature," in simple cases) ofitusical passages,
regardless of the instrum nts On which they are played. The writer has the
impression that his own AP ability is about equally good regardless of the
timbres of notes being judged (although latency of response might be affected);
pi ?no notes are in this respect merely representative of all musical notes.
This study, therefore, is concerned with AP ability in a real-life, naturalistic
sense. While a replication of the study with sinusoidal stimuli might yield
some interesting differences, the results tight not be directly relevant to AP
ability as observed in practice. Actually, several studies (Siegel, 102;
Stanaway, Morley, & Anstis, 1970) have demonstrated high degrees of AP ability .
using sinusoidal tones.

-6-
AP and Channel Capacity
The supposition that human channel capacity'in-a single sensory modality
is limited to about 2.5 bits, as suggested by Miller. (156), Attneave (1959),
and Garner (1962), is apparently contradicted by the fact that individuals
claiming AP ability can make absolute judgments of many more distinct musical
pitches than the five or six implied by the figure of 2.5 bits. In the case
of the pitch modality, the low estimate of channel capacity seems to have been
based primarily on the work of Pollack (1952, 1953), who found that his sub-
jecA were unable to make reliable absolute judgments of more than five equally
likely tones (2.3 bits) selected in various ways along the pitch continuum.
Pollack made no report that any of his subjects claimed AP ability, and0
admittedly made no attempt to investigate individual differences. In his
discussion of Pollack's findings, Miller (1956) decided to disregard the
evidence that "a musically sophisticated person with absolute pitch can `J
identify accurately any one of 50 or 60 different pitches" because he saw nor
wa, to explain this superiorsperformance. Earlier, Ward (1953) had cited a
case of an AP possessor who could make accurate judgments of over 70 pitche4
suggesting that this implied the transmission of over 6 bits_of information.
Attneave (1959) mentioned unpublished work by Miles Rogers reporting the
ability of a symphony orchestra concertmaster to transmit 5.5 bits (equivalent
to the accurate absolute judgment of 45, distinct tones), but made no attempt
-to square this finding with Pollack's results. While Pollack's findings have
been amended or criticized in various ways (Fulgosi & Zaja, 1972; Fullard,
Snelbecker, & Wolk, 1972; MacRae, 1970), the essential contradiction between
the fact of AP ability and the notion of a channel capacity limited to
around 3 bits has remained.
9
C-
-7-
One possible resolution has been suggested by Stanaway, Morley, & Anstis
(1970), namely, that if the pitch continuum is taken to have two components,
tone height and chroma (Bachem, 1937, 1950; Rgvgsz, 1913; Shepard, 1964), each
of these components may have its own limited channel capacity. Stanaway et al.
suggest that even for AP ects the channel capacity for chroma may be no
mode than about 3 bits; actually, subjects transmit information about this
componeat perfectly, and if it is assumed that the chroma component contains
exactly the 12 tones of the tempered musical scale, this transmission carries
log2(12) = 3.585 bits. The information carried by the tone height component
would depend upon the AP subject's ability to identify the octave in which a
given pitch lies, and, of course, the number of octaves embraced in the stimulus
set. The six or more bits of information assumed to be transmitted by AP
judgments in the general cjse would be the sum of the bits of information car-
ried by tone height and chroma; there is evidence (Levy & Norton, 1972) that
under some conditions information from different sensory dimensions is additive
(but see Miller, 1956, pp. 87-89 on this point).
While this interpretation may serve to explain the performance of AP sub-.
jects, it leaves open the question of whether AP subjects are in some 1.737
qualitatively different from subjects not claiming Or exhibiting AP ability, as
suggested by Bachem (1950). It would seem that an answer to this question
might be yielded by data in which the information for the twb components of the
pitch continuum is computed separately, both for AP and non-AP (NAP) subjects.
Such an analysis(might have a bearing on the question of whether there'are in
fact two components in the pitch continuum, a question that has been debated
endlessly. For example, Ward (1963a, p.19) appeared to doubt this, but the
kinds of demonstrations offered by Shepard (1964) and Risset (1969) seem
fo
completely convincing to this writer, who. would also claim that the distinction
between tone height and chroma is patently obvious from his subjective impres-
sions. (It would not be necessary, as Ward seemed to require, that recognition
of tone height and chroma be a two-stage process. Furthermore, later on Ward
svmslto_hale changed his mind [1970, p. 413].)
!Reed of AP Judgments
From the time of the earliest discussions (Stumpf, 1883) it has been noted
that pitch judgments made by AP subjects are much faster than those of NAP sub-
jects, who often require at lealit a few seconds to deliberate about their judg-
ments. It has also been claimed (Whipple, 1903) that even for AP subjects, the
correct judgments are f;ster than the incorrect ones. There are, nevertheless,
'few studies of the latencies of AP judgments--either for AP or NAP subjects, and
those that exist (Abraham, 1901; Baird, 1917; Weinert, 1929) are of limited
value either because of primitive technology, limited design, or inadequate-
reporting. The present study was designed to obtain data on accuracies and
latencies of AP judgments as a function of stimulus set size both for AP and
NAP subjects, the judgments being obtained under instructions to the subjects
to respond as accurately and rapidly as possible. The data willialso be
pertinent to an assessment of the rate of gain of information in the pitch4
modality, in terms of what is known Hick's law (Brainard, Irby, Fitts, &
Alluisi, .1962; Bricker, 1955; Briggs, 1972; Hick, 1952; Hyman, 1953; Pachella &
Fisher, 1972).
In a pilot experiment in which the writer used himself as a subject, the
task was to strike, as rapidly as possible, a note on a piano that would exactly
111
-9- .64
match a note that was heard struck on another piano by an assistLnt from
computer-generated lists of randomly selected notes. Lists contained notes
chosen from sets of 4, 8, 16, or 32 consecutive semitones centered at the
approximate middle of the piano keyboard. Under one condition, the subject »
cwild use either hand in responding; in a, second condition, he had to use his
preferred (right) hand only. Although there were striking regularities in
the data, their interpretatiOn was clouded by the fact that the response times
included an unknown amount of time for the Movement required to find and strike
the response note. No significant differences-in total response time were
traceable to the one-hand vs, two-hand conditions, however. The pilor-data
also suggested that- trials must be well separated in time, and that constraints
,must be put on the randomization of note lists, in order to minimize the possi-,..
hie effects orrelative pitch judgments of successive notes that are identical
or closely similar (modulo,an octave). The main experiment, described below,
attempted to capitalize on wha was learned in the pilot experiment.
Subjects
There were 9 subjects in all. Four of these, including the writer, claimed
to have had AP ability since childhood; '..hey are subsequently designated as EAP
(early AP) subjects. They consisted of two males and two females ranging in age
from 20 to 60. A fifth subject was P. T. Brady,\aged 35, who in a published
article (Brady, 1970) claimed to have successLully acquired AP ability through
intensive self-training, starting from a state in which he was convinced that
he "qualified as an adult without AP" (p. 884); he is here designated asa TAP
(trained AP) subject. The remaining four subjects were amateur musicians, all
male, aged 22 to 40, who did not claim AP ability; they are here designated as
12

s',
-10-
NAP (non-AP) subjects. All subjects were pianists with at least average_
degrees of skill--some with excellent skill; other than the writer and Brady',
all were volunteers recruited by personal contacts either at Educational Test-
. ing Seivice or in the Princeton (N. J.) community.
Both the author and Brady shad established their AP ability by judging
one note per day soon aftevarising (avoiding exposure to musical sounds
/ before making the judgment). The author had his wife strike on the piano, each'
day, a note,from Petran's (1932) list of 50 random notes, spanning some 4 oc-
taves in the middle of the piano keyboard; 47 (94%) of his judgments, all made
promptly but without-a speed requirement, were absolutely correct, while the
remainder were errors of one semit. There were no octave errors. This per-
formance may be compared, incidentally, to that of Petran's best subject, who
had 37 (74%) correct, 10 errors of one semit, and 3 errors of 2 semits. (The
remainder of Petran's music-student subjects had generally much poorer perfor-
mance.), Brady (1970) reports, for a 577note randomized list for which he named
only the note and not its octave, 37 correct (65%), 18 one-semit errors (31%),
zxand two 2-semit errors (4%).
Whether the remaining AP subjects had "genuine" AP ability-in the sense
definedby Bachem (1937) can perhaps be judged from their performance in the
experiment. Interviews seemed to establish, however, that they did not report
experiences that would classify them as "pseudo-AP" or "quasi-LP" subjects
,according to Bachem's definitions.
Design and Procedure
While'being tested, the subject was seated comfortably and in the normal
playing position at a grand piano that had been professionally tuned to A4.=
440 Hz-, the standard international pitch adopted.in London in 1939 (replacing
13
a
.04

an old standard of A4 = 435 Hz set in Paris in 1859): The piano was instru-
mented with miCsibawitch bars ( tOuchp ates") fixed directly in front,of the
keyboard at four points, namely between the E and F keys of the C2, C3, C4,
and C5 octaves. (C4 is "middle C.") Immediately before each trial, the
-subject was required to place the index finger of his preferred hand (all sub-
jects were right-handed) on the microswitch bar that was at or near the center
of the range of notes from which the stimulus-notes to be judged were to be
chosen. With respect to 'the keyboard, this meant that the tip of the finger
Was approximately 1.6 cm, below the surface of the keyboard and 3 cm in froa
,
sof its- front edge. Red tabs were affixed to the notes just above and below,
the range In order to define`its bouQdaries for any given set of trials. Two
or three seconds prior to each stimulus note (these intervals being more or
less random), the. word "Ready" was heard, in earphones worn by the subject,
froM the tape recording containing the stimuli; the stimulus note was then
heard: Presentation was binaural. The subject's task was then to strike, as
rapidly as possible, the note on the keyboard that would exactly match, in
pitch, the note heard from the tape recording. Since this was a normal piano
rather than a "mute" keyboard, the note actually sounded, providing feedback.
It may be presumed that all subjects were continually aware of their hits and
misses since the sounding of the response note provided an immediate and
obvious comparison with the stimulus.
From the tape recording, which contain2d all instructions and which was
identical, for all subjects, each subject received a total of 344 trials,
divided into 4 blocks of 86 trials each. Each block, however, was divided
, intg,5-Subblocks as follows:
14
-12-
1
,(1)' 32 trials using stimulus notes selected from a range of 64 con-
secutive semitones from Al to C7 ,(the. touchplate usLd being between E4 and F4,
the center of this range);
(2) 16 trials using stimulus notes selected from a range of 16 consecutive
semitones from A3 to C5 (touchplate as before);
(3) 8 trials using stimulus notes selected from a range of 4 consecu-
tive semitones from -D//4 to F114 (touchplate al: before);
(4) 14 trials using stimulus notes selected from the 7 "white-key"
notes within one of 4 octaves, the octaves being those starting at C3, C2,
C4, and C5, respectively, over the four blocks, and the touchplate being
between the E and F keys of the given octave; and
(5) 16 trials using stimulus notes selected from the 64-note range
from Al to C7, as in subblock 1, but with the names of the notes announced int
advance. In these trials the touchplate used was that also used in subbloek
(1).
Between blocks, rest periods of 15 to 30 minutes were taken; the subblocks
were separated only by the time required to give any new instructions and
adjust the equipment when necessary. The interval between the stimuli of suc-
cessive trials was approximately 15 seconds; this time was regarded as long
enough to eliminate most of the effects of immediate memory for pitch (Bachem,
1954). The entire experimental session lasted about 2.5 hours.
Subblocks 1, 2, 3, and 4 required absolute pitch judgments transmitting
6, 4, 2, and 2.8 bits of stimulus information per trial, respectively. Sub-
block 5 was included to obtain reaction times to notes announced in advance,
and may be considered to involve zero bl.ts of Information per trial. Sub-7
block 4 was included in each block to replicate an experiment reported by
Abraham (1901).
15

-13-
No practice or warm -up preceded the trials; in the first block, the
instructions applicible to each subblock were given immediately preceding the
trials of that subblock and not subsequently repeated. In the course of the
general instructions for the experiment, the note C3 was sounded and identi-
Lied, but at leSst a minute intervened between this and the start of the
trials in the first block. ,
The stimuli were recorded on tape from the same piano that was used in
the experimental sessions, and played back duriig the sessions using the
same recording machine (a Tandberg Model 74B, at a tape speed of 9.5 cm/sec)
used in recording the stimuli. _Variations in tape speed were minimal and
seemed to present no problen,whqeby stimuli would be "out of tune" with the
piano. For each subblock, ,the stimuli had been selected by a computer-
programmed pseudo-random process designed so that in each range, each powi-
ble stimulus note would be,represented equally often over the 4 blocks; in
subblocks 1 (the 64-note range) and 2 (the 16-note range), the process Ass
constrained so that no two successive stimuli would be the same or within 2
semits at the given octave or at any other-octave in the range. For, example,
if a stimulus note was F4, the next stimulus could not be D#, E, F, F#, or G
at this or any Other octave. In subblocks 3 and 4 the randomization yes con-
strained so that no two successive stimuli would-be the same. Subjects were
not informed of these constraints, introduced in order to minimize or reduce
relative pitch effects, but there is little reason to believe th t their judg-
ments would have been influenced even if they had been informedfrf them.
\.!(The writer, of course, had knowledge of them, but has no memory of any aware-
ness or influence'of this knowledge while serving as a subject:)
The entire experimental session for each subj/Ct was recorded on "411 second
1
tape-recorder. Use of signals recorded on two channels of the tape,togethet
16
-14-
with use of a Hunter digital timer both during the experiment and afterwards,
made it possible to obtain measurements of two time intervals for each
trial: (1) the time from the onset of the stimulus note to the opening of the
circuit in the microswitch that occurred when the subject's finger left the
touchplate, and (2) the time from the opening of the microswitch circuit to
the onset of the response note as recorded on the tape. For convenience, the
fir,t of these intervals will be called the decision time (DT), and the second,
movement time (MT). DT and MT are analogous, respectively, to the RT (reaction
time) and MT (movement time) measured in an experiment on movement accuracy
reported by Pitts and Peterson (1964), but they are not analogous, it may be
noted, to the reaction and motor times as measured in an experiment by Danev,
deWinter, and Wartna (1971). The sum of DT and MT constitutes total time (TT).
Listening to the tape for each subject after the experiment was completed,
the author made a record of the response note given to each stimulus note; in
this process he had access to the piano so that there would be no doubt as to
the accuracy of the scoring.
Results
Occasional problems in the conduct of the experiment and in its instrumenta-
tion resulted in a slight loss of data, ranging from 0.9% to 6.4% over subjects.
The analysis presented here is based on the 3014 responses (97.3% of a possi-
ble total of 3096) that are regarded as valid and measured with accuracy within
the limits of the instrumentation.
Accuracy of Judgments
Trends over blocks. Since the 4 blocks could be regarded as replicates
differing only in their pseudorandom selectiotiS'of stimulus notes, the accuracy
17

-15;I
ci
/
ata! from these bloCks (pooled proportions correct plotted in Figure 1
I r
1
,eparately for AP and NAP subjects) were examined for any indication of sig-
nificant practice,/ warm!.-up, or fatigue effects. The arcsin-transformed
Insert Figure 1 about here
r
proportions of strictly correct responses (i.e., responses exactly matching
stimulus hotes with no allowance for octave errors) for each block and each
subject were treated as the dependent variable in a 4 x.9 repeated-measures
A OVA for each subblock.r-The results, shown in Table lOndicate that while
SUbject was a significant (p < .01) variable in all subblocks except that
Insert Table 1 about here
for the 1-note range (where the task was purely motoric), Block was a ignifi-
cant variable (p < .05) only for the 64- and 7-note ranges. There was some
indication of improvement from Block 1 to Block 2, and decline from Block 3
to Block 4, but these trends were not particularly striking or consistent.
Also, AP and NAP, subjects did not appearto differ in trends over blocks,
- ,
although of course they differed strikingly in overall accuracy of performance.
Since the Block 1 data represent the most freshly pe ormed judgments (thus
with the least intrusion of relative pitch effects), it was decided to retain
them in the data set and to pool the data from all blocks for subsequent
analyses.
Distributions of errors. Each response was scored in terms of the alge-
braic number of semits that it deviated from the stimulus' note, positive
errors being those occurring when the response note was higher in pitch, and
negative errors wnen the response was ',lower. A zero error was recorded for a
-16-
correct response. Although there were minor differences among the error
distributions of the EAP and TAP subjects, 3S well as among those of the NAP
subjeCts, the major differences of interest are those revealed when the AP
(EAP and TAP) distributions are pooled and compared with the pooled error
//distributions for theINAP subjects. The resulting error distributions are
shown as histogra7s, separately for the 5 conditions (i.e., 5 subblocks,
pooled over block) in Figure 2. As appropriate chi-square tests confirm,,
Insert Figure 2 about here-the error distributions of the AP subjects are obviously different from those
of the NAP.subjects, except for the 1-note\range (where the task did not in-
volve absolute pitch judgments).
In the 64-note condition, 65.3% of the responses of i e 'AP subject have
11(
zero error, as compared to 9.6% of t:iose of the NAP subject . The remaining ')
,.,
responses of the AP subjects have errors close to zero, except for small 'pro-,
portions occurring in the neighborhood of +12 (5.9%) and -12 (1.9%) which
appear a; distinct Clusters in the histogram.( These are the familiar "oct v
errors" reported in the literature of AP ability (Bachem, 1937; Stumpf, 18
they represent responses where the subject perceivds (or misperceives) the
"chrome of a note but places it in the wrong octave. Itgv4sz (1953) argues
. -
that an error distribution with clusters of octave errors is strong evidence
for the presence of superior AP ability, but Ward (1963a) suggests that octave
errors may be an artifact of the use of complex tones such as notes struck on
the piano. In any event, there is little i dication of clustering around
octave errors in the pooled error distribution for the 64 -note, data from-the
NAP subjects (clustering does not occur, either, in the,individual error
1
distributions for these subjects), and in fact this distribution shows a very
wide diupersion, over about three octaves.
The clustering of octave errors occurs only in the data for the 64-note
range condition. e 16-note range comprised only 1 1/3 octaves and thus
provided Vitae opp1rtunity for octave errors; each of the other ranges com-
prised less than an octave (except that the notes given in the 1-note range
condition were spread over 5 1/3 octaves). The fact that octave errors occur
suggests that separate analyses may be made in terms of octave and chroma
cerrors. In such an an we take errors from -6 to +6 to be pure chroma
errors with zero octave error; errors on either side of this range are then
transposed, modulo 12, in such a way that they become chroma errors of -6 to
+6, with associated octave errors of, for example, -1 for errors in an octave
below an error of semits, and +1 for errors in an octave above ari error of
+6 semits. When this is done for both AP and NAP subjects, the former are
found to have 70.8% zero chroma errors under the 64-note condition, as comr-
pared.to 12.5% for the NAP subjects.
Measures of accuracy. Computations of various statistics can thus be
made separately for chroma and octave errors. Table 2 shows detailed results
4 for individual subjects in the 64-note range condition for total, chrome, and
octave errors: Table 3 contains results for other note-ranges, but since
errors beyond an octave were rare in these ranges even for NAP subjects, the
Statistics shown are only those fox chroma errors; except for four instances
\ (two in the 16-note condition and two in the i -note condition) these values
would be exactly the same as those computed from total error data.
Insert Tables 2 and 3 about here'
-18--
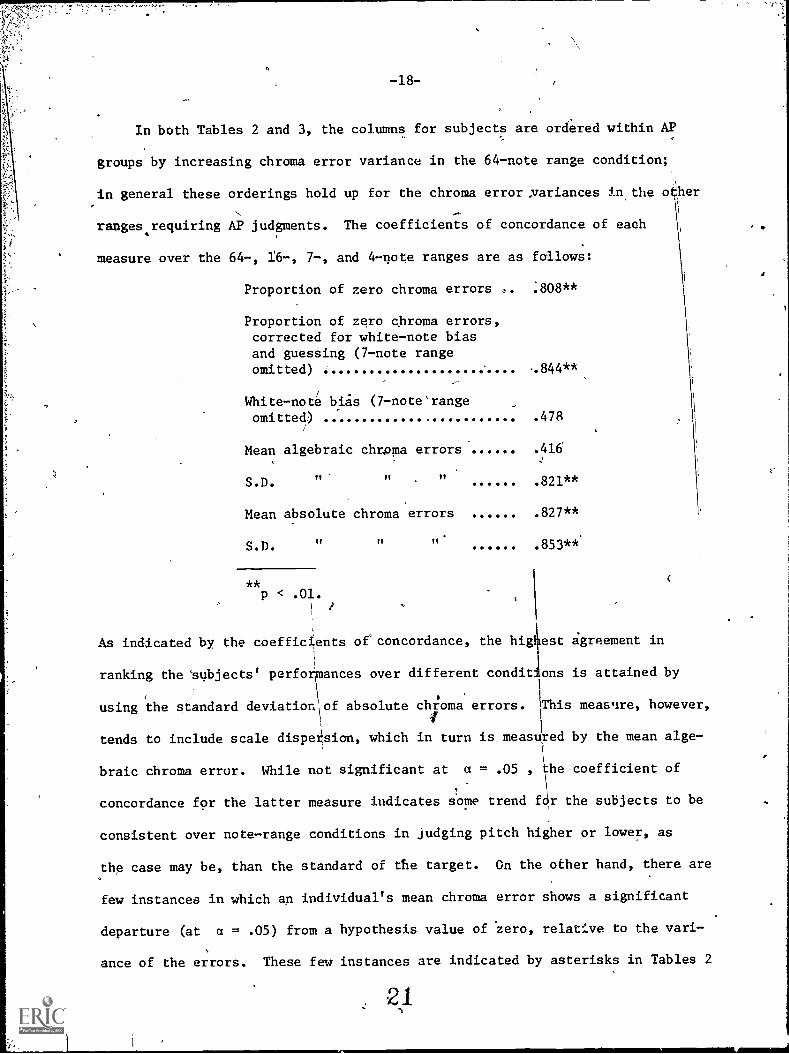
In both Tables 2 and 3, the columns for subjects are ordered within AP
groups by increasing chroma error variance in the 64-note range condition;
in general these orderings hold up for the chroma error variances in the 4her
ranges requiring AP judgments. The coefficients of concordance of each
measure over the 64-, 16-, 7-, and 4-note ranges are as follows:
Proportion of zero chroma errors ,. .808 **
Proportion of zero chroma errors,corrected for white-note biasand guessing (7-note rangeomitted) .844**
White-note bias (7-note'rangeomitted) .478
Mean algebraic chroma errors .416
S.D.n n n .821**
Mean absolute chroma errors .827**
S.D. .853**
* *P < .01.
.
As indicated by, the coefficients of concordance, the hig est agreement in
ranking the 'subjects' performances over different conditions is attained by
using the standard deviationof absolute chroma errors. liThis measnre, however,
tends to include scale dispesion, which in turn is measured by the mean alge-
braic chroma error. While not significant at a = .05 , he coefficient of
concordance for the latter measure indicates some trend fdr the subjects to be
consistent over note-range conditions in judging pitch higher or lower, as
the case may be, than the standard of the target. On the other hand, there are
few instances in which an individual's mean chroma error shows a significant
departure (at a = .05) from a hypothesis value of zero, relative to the vari-
ance of the errors. These few instances are indicated by asterisks in Tables 2
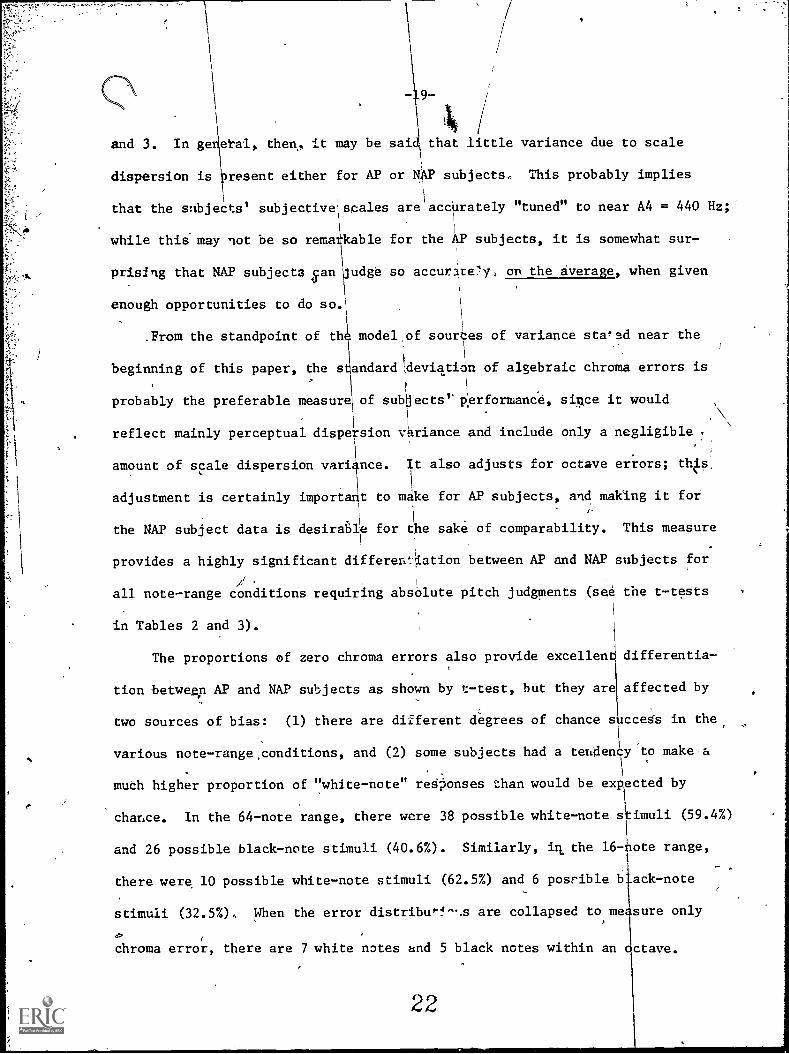
and 3. In ge etal, then, it may be sai that little variance due to scale
dispersion is resent either for AP or NAP subjects., This probably implies
that the snbjects' subjective scales are\
accUrately "tuned" to near A4 = 440 Hz;-1
while this may not be so remarkable for the AP subjects, it is somewhat sur-
prising that NAP subjects fudge so accur4e7y, on the average, when given
enough opportunities to do so.\
.From the standpoint of thi model of sour\ es of variance stated near the
beginning of this paper, the s andarddeviati4n of algebraic chroma errors is1
probably the preferable measure of subljects' Performance, since it would
reflect mainly perceptual dispersion variance and include only a negligible
amount of scale dispersion vari nce. It also adjusts for octave errors; t4s
adjustment is certainly important to make for AP subjects, and making it for
the NAP subject data is desirable for the sake of comparability. This measure
provides a highly significant different-iation between AP and NAP subjects for
/I
all note-range conditions requiring absolute pitch judgments (see the t-tests
in Tables 2 and 3).
The proportions of zero chroma errors also provide excellen differentia-
tion betweAp AP and NAP subjects as shown by t-test, but they are affected by
...
two sources of bias: (1) there are different degrees of chance s ccegs in the
various note - range, conditions, and (2) some subjects had a tendency to makea
\
much higher proportion of "white-note" responses than would be expected by
chance. In the 64-note range, there were 38 possible white-note stimuli (59.4%)
and 26 possible black-note stimuli (40.6%). Similarly, irt, the 16-ilote range,1
there were 10 possible white-note stimuli (62.5%) and 6 possible back-note
stimuli (32.5%)., When the error distribu0-1-s are collapsed to measure only,
chroma error, there are 7 white notes and 5 black notes within an c
22
ctave.
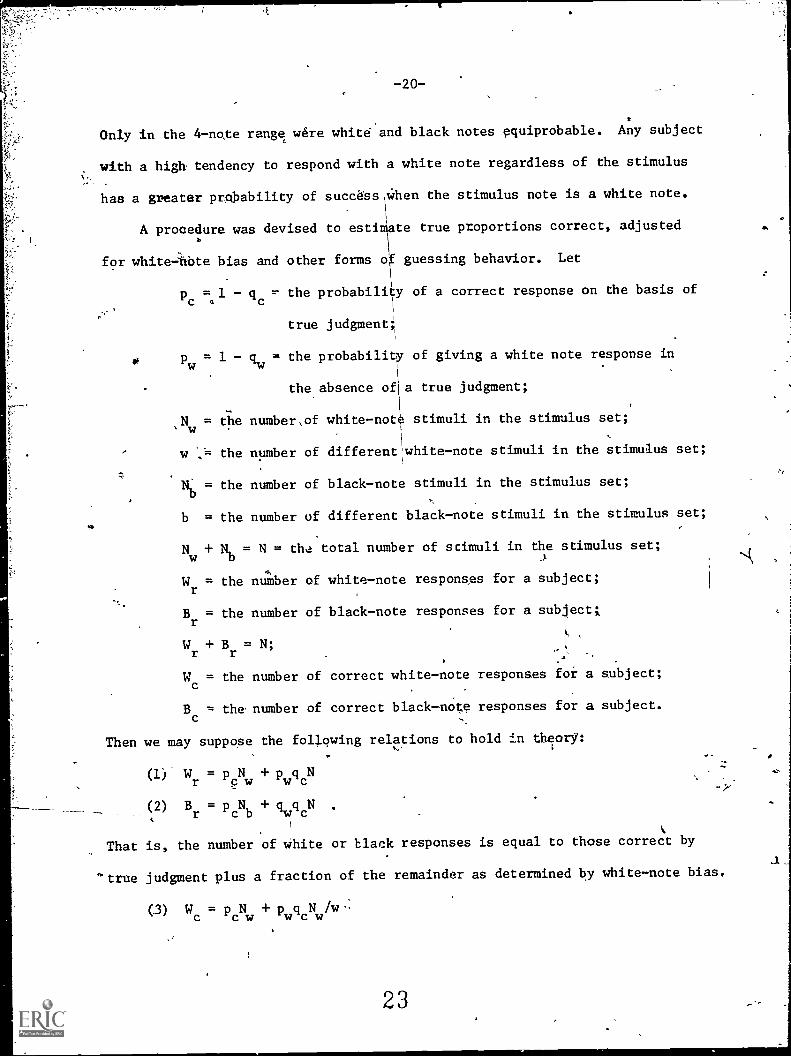
-20-
Only in the 4-note range were white- and black notes pquiprobable. Any subject
with a high tendency to respond with a white note regardless of the stimulus
has a greater probability of succdss\When the stimulus note is a white note.
A procedure was devised to estiniate true proportions correct, adjusted
\
for white=6te bias and other forms o
f
guessing behavior. Let
pc = =1 - qc = the probability of a correct response on the basis of
true judgment;
40pw = 1 - qw = the probability of giving a white note response in
the absence of\a true judgment;
Nw = the number,of white-note stimuli in the stimulus set;
w = the number of differentlwhite-note stimuli in the stimulus set;
Nb = the number of black-note stimuli in the stimulus set;
b = the number of different black-note stimuli in the stimulus set;
Nw
+ Nb = N = the total number of stimuli in the stimulus set;
Wr= the number of white-note responses for a subject;
Br= the number of black-note responses for a subject;
Wr+ B
r= N;
We = the number of correct white-note responses for a subject;
Bc
= the number of correct black-note responses for a subject.
Then we may suppose the following relations to hold in t4ory:
(1) Wr=pp
wN +
(2) Br = pcNb + otwqcN .
That is, the number of white or black responses is equal to those correct by
true judgment plus a fraction of the remainder as determined by white-note bias.
(3) WePc% PocNw/w
23

(4) Bc = pcNb + qwqcNb/b .
-21-
That is, the number of correct white or black responses is equal to those correct
by true judgment plus a fraction of the remaining white or black stimuli as
determined by both white-note bias and chance success.
Since we have four equations in only two unknowns, we may estimate the
unknowns separately for white-note and black-note data, and take weighted
averages of the parameters estimated from the two sources. Thus, solving
equations (1) and (3) for pc and pw , we have
(5) Pc [Wr N(Wr W)/(N N/w)]/INc w w
(6) Pw = (Wr - Wc)/[(N - Nw/w)qc]
The solutions for equations (2) and (4) are similar, except that the analogue
of equation (6) gives qw . While the respective values of pc and pw
resulting from the two solutions can be identical, they are in practice usally
slightly different. The values given in Tables 2 and 3 for pc (proportion
zero errors, corrected) and pw (white-note bias) are averages computed by
-weighting the values from the two solutions proportionately to the number of
white-and black-note stimuli ( Nw
and Nb
Z. In several cases the values of
pw
are either indeterminate (when pc
= 1 ) or slightly greater than unity,
apparently because of some chance departure of the data from the model.
It is to be noted that the corrected proportions of correct responses give
a slightly more consistent, ranking of the subjects over the 64-, 16-, and 4-note
conditions than the raw proportions correct, although the corrected proportions
provide no better differentiation between AP and NAP subjects. In any case, it
is believed that the corrected proportions yield a more accurate impression of
success rates over the three conditions; for NAP subjects they descend to near
zero for the 64-note range condition. The corrected-proportions are plotted
24
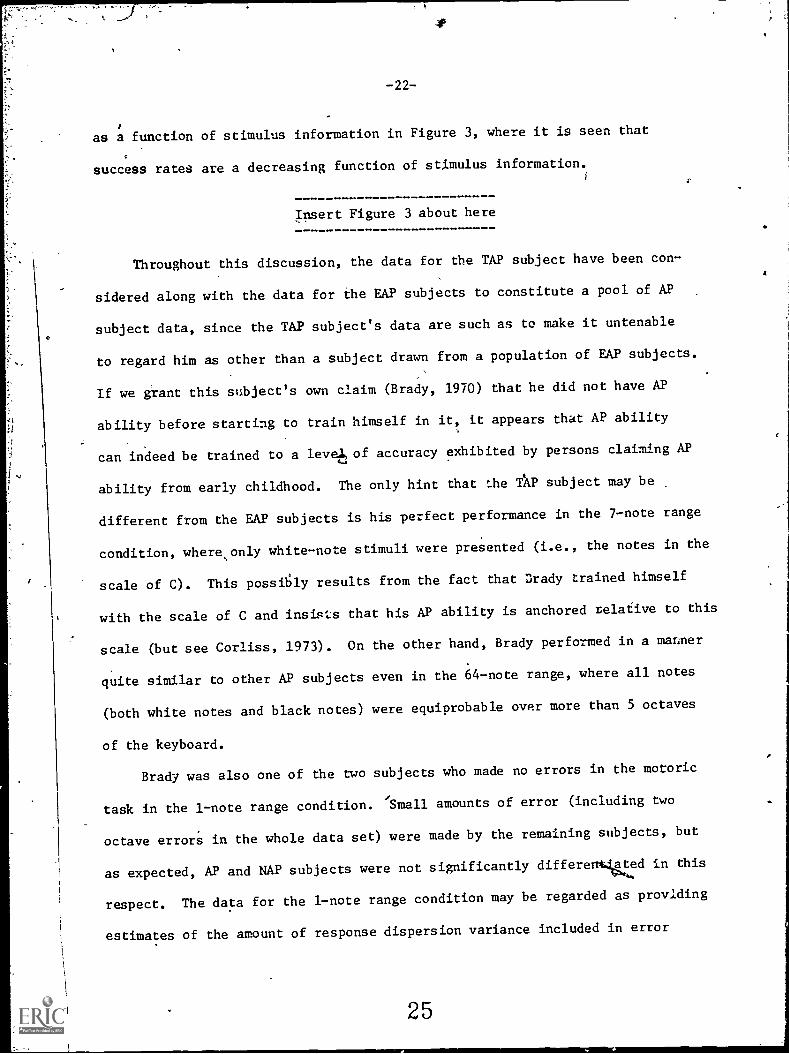
-22-
1
as a function of stimulus information in Figure 3, where it is seen that
success rates are a decreasing function of stimulus information.
Insert Figure 3 about here
Throughout this discussion, the data for the TAP subject have been con-
sidered along with the data for the EAP subjects to constitute a pool of AP
subject data, since the TAP subject's data are such as to make it untenable
to regard him as other than a subject drawn from a population of EAP subjects.
If we girant this subject's own claim (Brady, 1970) that he did not have AP
ability before starting to train himself in it, it appears that AP ability
can indeed be trained to a leveil of accuracy exhibited by persons claiming AP
ability from early childhood. The only hint that the TAP subject may be
different from the EAP subjects is his perfect performance in the 7-note range
condition, where,only white-note stimuli were presented (i.e., the notes in the
scale of C). This possibly results from the fact that Drady trained himself
with the scale of C and insists that his AP ability is anchored relative to this
scale (but see Corliss, 1973). On the other hand, Brady performed in a manner
quite similar to other AP subjects even in the 64-note range, where all notes
(both white notes and black notes) were equiprobable over more than 5 octaves
of the keyboard.
Brady was also one of the two subjects who made no errors in the motoric
task in the 1-note range condition. 'Small amounts of error (including two
octave errors in the whole data set) were made by the remaining subjects, but
as expected, AP and NAP subjects were not significantly differentdaLed in this
respect. The data for the 1-note range condition may be regarded as providing
estimates of the amount of response dispersion variance included in error
25

-23-
variances in the other conditions, particularly that o r the 64-note range
sfffice a compaable range of stimulus notes was involved.
Accuracy as a function of tone chroma. Several writers (Abraham, 1901;
Baird, 1917; Weinert, 1929) have discussed the possibility that notes of the
musical scale vary in their ease of recognition by AP subjects. They, and
others, have also observed that hite notes seem to be easier to recognizehite
than black notes. There appear to e no relevant data in the literature that
are reported with appropriate statistical tests, however. In the present
study,. repeatdd-measures ANOVA's were performed on arcsin-transformed propor-
tions of *rect responses for different notes of the musical scale, or groups
thereof. The five AP subjects were regarded as repeated meaiures.of the notes.
Because the total numbers of responses per note were relatively small, data
were pooled over the 64- and 16-note conditions; they were also pqoled over-
octaves. The overall test of variation in proportions correct over the 12
notes of the scale was not significant (F11, 44= 1.21, p > .05), and neither
were tests for variation among.white notes (F6 24= 0.96, ri.s.) and among
,
black notes (F4, 16
= 0.69, n.s.). Any variation in proportions correct over
different notes could therefore be said to be due to random error and the
idiosyncrasiesof particular subjects. Thus, the fact that C received the
highest proportion of correct responses both in the 64-note and the 16-note
conditions cannot be taken as being of any particular significance,at least
from the present experiment. On the other hand, thete was a highly significant
difference (F1, 4
= 199.02, p < .001) between the proportion correct for white
notes (.807) and that for black notes (.700), but this-difference can probably
for the most part be ascribed to the fact that for most subjects, in both con-
ditions, the white-note bias ( pw ) was greater that; .5 (see Tables 2 and 3).
26
-24- 9
Accuracy as a function of tone height. It has been suggested in the
literature of.AP ability (Stumpf, 1883; Ward, 1963a) that notes in the middle
of the k6board are easier to recognize than notes at the extremes. Pooled
data from the five AP subjects in the present experiment show nonsignificant
variation over five approximately equal note ranges in the 64-note condition
(F4, 16
= 0.63). Also,.in comparing data from the four blocks in the 7-note
condition, where a different octave was used in, each block, the variation was
only barely significant ate a = .05 (F3, 123.47). But this latter variation
is confounded with possible practice effects over the blocks; the proportions
correct for octaves C2, C3, C4, and C5 were .914, .884, 1.000,,and .986
respectively, with no obvious trend appearing. Furthermore, the use of arcsin
transformations with extremefroportiOns involving small N's makes this test
of significance of dubious value.
Information Transmitted
Response error data can be translated into measures of information trans-
mitted. In Studies of information transmission, this is usually done by the
'procedure suggested by Garner and Hake (1951) in which the information trans-
. witted is a function of the probabilities in the response categories conditional
1 1
upon the stimulus categories. Since musical pitch is a continuum, this pro-
cedure seemed inadequate for the piesent data since with the Garner and Hake
.omputations a maximum amount of information would be found to be transmitted
even if all the responses were incorrect (even far from their`targets), just
.as long as the responses were perfectly predictable from the stimuli. Theregore,
a procedure was devised for indexing the amount of information transmitted by
each response relative to its deviation from the correct stimulus. category.
27.
-25-
This procedure provided for separate estimations of chroma and octave informa-
tion, as well as total information.
Consider, for example, information transmitted by responses in the 64-
note condition. A strictly correct response would transmit log2 (64) = 6 bits
`of total'information. But this could be regarded as being composed of both ,
chroma information and octave informittion. Since under the conditions of the
present experiment there were 12 separate response categories in an octave,
a correct response would transmit:log (12) = 3.585 bits of chroma information,2
and since there are 5.33 octaves in the 64-note range, it would transmit
1002 (5.33) = 2.415.bits of octave information.
A response with an error of one semit in either direction has the effect
of carrying the amount of information transmitted if the 12 semitones of an
octave were divided into 4 sets of 3 semitones; that is, the response "correctly"
assigns-'a stimulus to one of these 4sets. Similarly, a response with an
error of 2 semits from the stimulus assigns the stimulus to one of 2.4 sets
of 5 semitones each. Generalizing for any given amount of response error
(e being the absolute magnitude of the error in semits), we find the amount
of chroma_information (Id) as
Ic= log
2[I2/(2e + 1)] .
The rationale for octave information (Io) is similar; this is given
by the formula
I0 = log2 [5.33/(2o + 1)] ,
where o is the absolute value of the error in octaves, or more generally
(for other note-range conditions)
10 = log2 [no/ (2o + 1) ] P
28
-26-
where no
n/12 = the number of octaves in the range ( n being the number
of semitones in the range). Regardless of the range, Ic + Io = It ,, For
note ranges less than 12, this results in negative octave information, but
this seems permissible, for the sake of generality, to reflect the fact that
in such ranges octave information is automatically given to the subject by
the experimental setting, and thus no decisions about it are necessary.
It is ,lso the case in the above calculations that a response error of
+ 6 semits results in negative chroma information, namely, -.116, but this is
unavoidable since such an error is at the intersection of octaves.
Each response in the present data set was scored for It , Io , and It .
The summarized results for the 64-, 16-, 7-, and 4-note range conditions are
given in Table 4. Computations of Ic'
Io , and It
were made for the 7-note
Insert Table 4 about here
range condition with errors counted in semits (as in other conditions) but on
1
the assumption that since there were only 7 response notes, the range comprised
7/12 of an octave. Thus a response with an absolute total error of 0 to 6 was
scored as transmitting Io = -.778; the few errors outside this range (all
committed by one NAP subject) received Io = -2.36 = log2 [7/(3 12)] . For
all conditions, it was necessary to compute the mean information transmitted
if all possible responses to each stimulus note were equiprobable; these
values are recorded as the "chance" values in the table, along with the maxi-
mum possible values expected (according to the methods of computation used)
if all responses were correct. Along with the means and estimated S.D.'s,
'values are given for the proportion of possible information transmitted
whereby the data are scaled in terms of their proportional distance from
29
-27-
chance along the scale from chance to maximum. The table also gives values
of t for the comparison of means for AP and NAP subjects. (Since the pro-
portions of possible information transmitted are linear 'transforms of values
of Ic , Io , or It
, the values of t apply also to them.) In the 4-note
range, no, data are given for octave and total information4since there were no
octave errors in this conditio%; Values of It
may be found by subtracting,
1.585 from values Of Ic
. ,
In each note-range condition, AP and NAP subjects are significantly
differentiated (p < .01) in terms of both chroma and total information.
They are significantly differentiated in octave information only in the 64-
note condition, but, the NAP subjects still transmit a fairly high proportion
of octave information in this condition (.710, on the average), as compared\
to the proportion (.908) for AP subjects. That is, they are fairly good at
identifying the octave in which a stimulus note lies, but poor at identifying
the particular note in an octave.
Data for individual subjects are plotted in Figures 4. and 5. AP subjects
transmit near the maximum possible total information in all note-range con-
ditions, although several of them falter slightly in the 64-note condition.
Insert Figure 4 about here
The best AP subject transmitted, on the average, 5.71 bits of total informatiOn
in this latter condition, 93.3% of the possible 6 bits. Even the poorest AP'
subject transmitted 4.86 bits (73.81 of possible). NAP subjects, on the other
hand, tended to transmit a constant fraction of the possible total information,
roughly 55%. The slightly better performance for the 4-note range may possibly
be accounted for by an end effect whereby errors tended to regrets toward the
30
-28-
middle of the range. In any case, the data for the NAP subjects (and even
more so for the AP subjects) seem to contradict the findings of Pollack (1952)
in at least two respects: first, at 2 bits of stimulus information, the
expected amount of information transmitted is not necessarily 2 bits; second,
maximum total information does"not have a limit of around 2.5 bits. With 6
bits of stimulus information, the average NAP subject transmitted 3.29 bits,
while the average AP subject transmitted 5.32 bits. Also, there is no evidence
of a decline of information transmitted with increasing stimulus information
such as MacRae (1970) found in reanalyzing Pollack's data.
As suggested previously, pitch may be a two-dimensional continuum con-
taining both chroma and octave information. It is thus possible that the high
estimates of channel capacity for AP subjects should be viewed as sums of
capacity values for these two dimensions. First, note that the values of 10
do not differ much between AP and NAP subjects. In the 64-note condition,
AP subjects transmitted 2.29 bits on the average, and NAP'subjects transmitted
2.02 bits, compared with the maximum possible of 2.415. From the data of the
present experiment, it is possible only to speculate as to what amount of octave
information could have been transmitted if a larger number of octaves had been
embraced in the timulus sets. As it happens, the 2.35 bits of octave informa-
tion transmitted by the best AP subject for the 64-note condition is close to
the claimed channel capacity of 2.5 bits suggested by Miller (1956) and others.
The case is different, however, for chroma information, individual data
for which are to be seen in Figure 5. AP subjects achieved at or near a
Insert figure 5 about here
a
maximum of 3.585 bits of chroma information in the 4-, 7-, and 16-note conditions,
31

er
-29-
and the best of them transmitted nearly all of that in the 64-note condition.
It must be remembered that the task invol ed a set for speed;*at least some
of the failure to transmit maximum informat n may be ascribed to this, altLough
AP subjects report that they generally wave an immediate impression as to th
chroma of a note and feel that that impression is "correct" evenshough it-may\
be later invalidated.
Although NAP subjects transmit significantly less chroma information than
AP subjects do under all conditions, in the 4-note condition they appear to
be transmitting as much information, about 3 bits, as the AP subjects do in
the 64-note condition. Some doubt, however, may be raised as to whether any
subject (even an AP subject) is actually transmitting as much as 3 bits of
information in the 4-note condition, since maximum total information is only
2 bits and octave information is consequently negative. The measures of chroma
information at the 4- and 7 -note conditions may be An artifact of the method
of scoring.
The fact remains, however, that all AP sCijects were found to transmit
well over 2.5 bits of chroma information, usually from 3.0 to 3.4 bits, under
the 64-note condition. This seems to be in clear contradiction to estimates
of channel capacity derived from the findings of Pollack and others. Only
Fulgosi and Zaja (1972) and Fullard, Snelbecker, and Wolk (1972) appear to
have obtained channel capacity estimates as,high as around 3 bits for the
dgmenz: of pitches by unselected subjects, but their stimuli were mere widely
spaced than semitones, and their experimental settings were quite different
from that employed in the present study. Further, their estimates were for
total information, not simply chri a information.
32

-30-
.
Latencies of Responses
Data treatment. Examination of each subject's distributions of total
response times (TT's), decision times O's), and mcvement times (MT's) over
bloAs for the various note-range conditions disclosed considerable tendency,
toward positive skewness and lack of homogeneity of Variance. RLponse times
were converted to their reciprocals for many types of analysis reported here;
this process tended to normalize the distributions and make the variances more
homogeneous across subjects. Where necessary, means of reciprocals are back-
transformed to values of response times in seconds or cosec, values which are
in effect the harmonic means of the original response times. A rationale for
the use of the reciprocal transforms of response times is that the reciprocals
are measures of speed or rate of response.
Since the TT for each response is a sum of its DT and MT, and since MT is
substantially correlated with the absolute distance of the response note from
the starting position (the "touchplate" on which the subject's finger rested
prior to the response), the main analyses are in terms of (the reciprocal of)
DT. As is shown below, DT is significantly affected by note-range condition
/ and is in general independent of note distance. This evidence suggests thaV°
DT's can indeed be regarded as "decision times," sfild4 it appears (as might
logically be expected) that the subject's finger ddes not leave the touchplate
until the subject has made at least a partial decision as to where on the key-
board the response will be made. For some subjects, this decision appears to
be practically complete within the DT phase of the response; for others, a part
of the MT is occupied with refining the decision or perhaps with the visuo-
perceptual and' motoric planning aspects of finding and striking the response
note. Observations of subjects during the experimental sessions suggest that
^3
k7i
in
-31-
it is mainly the latter: occasionally subjects would appear to move the finger
rapidly to a part cular region of.ehe keyboard and then "circle" that region
(like a bee or an airplane) before finally landing on,a particular note. This
sort of behaypar occurre4 particularly among the less skilled pianists, even
in the 1-note Condition wh ,the note to be struck had already been announced
in advance; it resulted in quite deviant MT values.
Latencies for correct and incorrect responses. Analysis of the data
presented the --oblem of whether the results should be reported for all responses
or only for correct responses, Mean reciprocals of DT's for correct responses
were compared with those for incorrect responses for each subject in each of the
4-note range conditions involving absolute judgment. Some of these comparisons
could not be made because there were no incorrect responses. Of 32 (out of 36.
possible) comparisons that could be made, three were significant (by two-tailed
t-test) at a. = .01, and two others at only a = .05. Ali five of these signif-
icant differences indicated correct responses as faster than incorrect ones;
of the remaining, nonsignificant differences, 19 indicated faster correct responses
and eight indicated faster incorrect responses. There was little consistency
in the results either by subjects or by note-range conditions, except that there
was only one instance of faster mean incorrect response for AP subjects. It
ma concluded that the data give some weak confirmation to Whipple's (1903)
obse ation that correct responses were faster than incorrect ones in an AP
subject.
For analyses using both AP and NAP subjects, times for all responses are
used, but for certain analyses of &P subject performance, times for correct
responses only are used.
34
-32-
Latencies by block. To check for any possible'warm-up, practice, or
''atigue effects, a repeated-measures ANOVA was performed on the mean recip- /
rocals of DT's for subjects and blocks, for each note-range condition. In
rio case was Block a significant variable at a = .05, although there was for
most conditions a trend suggesting that responses were slightly slower in
Blo8k 1, on the average, than in the remaining blocks. It was decided to
pool data from the four blocks for all subsequent analyses. _
Decision times as a -function of note range. In Figure 6, the harmonic
mean DT's are p]otted against note range in terms of stimulus information.
Insert Figure 6 about here
Generdlly, the relation is linear, with intercepts ranging from about 250 to
480 cosec and slopes ranging from about 66 to 150 for most subjects, and 525
fOr dne deviant NAP subject whose DT's were extremely slow and deliberate.
If the data for this deviant subject are ignored, AP subjects are snot differ-
',
(entiated from NAP subjects. In fact, the fastest performer, over'll, is an
NAP subject. Any statistical test of the differences in intercept ,nd slope
values bet een AP and NAP subjects would not seem worthwhile.
At the intercept, the decision time is similar to a simple reaction time;
the fact that the mean decision time (over subjects) is someiJhat 1 lger than'
typical values pf simple reaction time in other types of experiments may be due
to.the inclusion of some amount of time to prepare to make an accurate motor
response.
The slopes of the curves may be taken to represent the increase in pro-
cessing time necessary to make an absolute judgment, as a function of the
number of alternatives among which judgments are to be made. It can be
,) 35
-33-
demonstrated that the slopes are not an artifact resulting from an increase,
Jwith increasing stimulus set size:in average distance of the notes from the
starting position in the task. It could be argued that distant notes might
exert an influence on DT by causing an in rease in the preparation time to
move to such notes. Two kinds of evidence\can be brought to bear against any
claim -of such -an artifact. First, the corr lations of reciprocal DT with the
Absolute distance of response notes from the .starting point are low: in the
\ /
64-note range, where there is maximum variance\in note distance, these corre-
lations
!
range from -.314 to .170 with a median 9 .016 for the nine subjects,
and these results are similar to those in the li-nf)te condition, where the
correlations range from -.383'to .278 with a median of -.055. Second, mean
decision times differ significantly over conditions even for notes in identical
regions of the keyboard. This can be demontrated best with correct response
data for the AP subjects (since correct response data for NAP subjects under
some conditions are very scanty); the der9nstration is restricted to correct
1response d4ta because otheiwise the response notes are not controlled in the
same way as the stimulus notes. Table 5 gives, for each of the five AP sub-
jects, mean reciprocal DT's for the sank'. range of stimulus notes, D #4 to F414,
under the 64-, 16-, and 4-note conditions, along with t-tests of the differ-
ences between the mean times for the 64- and 16-note conditions combined and
those for the 4-note condition. (The combination of the 64- and 16-note data
is necessa-y because there are few instances of tHese stimulus notes in the
64-note condition, aad most of the t-tests betweer the 64- and I6-note means
are nonsignificant.) In every case, the difference is highly significant:
it takes longer for a subject to identify these notes when they are alterna-
tives in a large set than when they are alternatives in a small set. Since
36
-34-
similar revAts can be demonstrated with other note ranges that are in common
between conditions, this is true regardless of the position of the stimulus
in the -set of alternatives. These findings are in accord with Hick's law
(Hick, 1952) and other studies of the role of stimulus information in reaction
time (e.g., Hyman, 1/53). What is somewhat novel in the present data is the
large number Of alternatives included in the-stimulus set. Also, in its method
of measuring reaction time without the inclusion, of MT, this study does not
appear to have precedents in the literature on this subject.
Insert Table 5 about here
Movement times. As might be expected, harmonic means of MT's are a func-
tion of note range, but MT's are substantially correAga-With distance from
the starting point. For the nine subjects, the correlations of reciprocal
MT's with absolute note distance in the 64-nOte condition range from
-.517 to -.073 with a median of -.391 (r.05
.18); in the 1-note range, they=
run from -.691 to -.443 with a median of -.617 (r.05
= .25). In fact, the data
provide an excellent confirmation of Fitts' law (Fitts, 1954), whereby MT is a
linear function of log2 (2A/W), where A is the measured distance traveled in a
speeded motor response and W is the width of the target. (In the present experi-
ment, the white-note targets on the piano keyboard are about twice the width of
the black-note targets.) Since this demonstration is of no immediate interest
in-the present context, it will not be given here. Also, summary data on MT's
will be omitted.
Rate of gain of information for AP subjects. The MT's of the 1-note con-
dition as a function of absolute distance from the starting point can be used
ato adjust MT's in the other note-range conditions to estimate the amount of
those other MT's that is a function of note-range condition and hence is
37

-35-
presumably occupied with some of the decision processing involved in an
absolute judgment, or with motor planning and the like. The process of
adjustment is illustrated with data from one of the A subjects (the writer)
in Figures 7, 8, and 9. In Figure 7. harmonic mean MT for correct responses
is plotted for the 64-, 16-, and 4-note conditions as a function of the aver-
age distance of certain groups of stimulus from the starting point in the task.
The note-groups are those that are in common between one or more of the stimulus
sets; for example, the notes at a distance of -32 to -21 semits from the start-
ing point are among those that are in common to the 64- and 1-note sets; notes
at a distance of -2 to +2 semits are common to all four sets. (Data from the
7-note condition are not used in these analyses for various reasons, including
the fact that they do not include a'full range of semitones, 'and involved
different starting points over blocks.) It is evident that MT is a function
Insert Figures 7, 8, and 9 about here
not only of distance but also of note-range condition. In Figure 8, harmonic
mean DT'sfor this subject are shown As a function of note-range condition and
of note distance. While these DT's vary systematically with note-range con-
dition, they do not vary significantly as a function-of note distance. In ,
Figure 9, the differences between the values of harmonic mean MT at Hi and H0
for a given group of stimulus notes are added to the corresponding harmonic
mean DT's ( Hi = 0, 2, 4, 6) to give values of "DT plus adjusted MT" and the
means of the resulting values over note-groups are taken (despite some varia-
tion in these values, regarded as nonsignificant).
Similar procedures were followed for data from the remaining AP subjects,
and the resulting DT + adjusted MT values are plotted as a function of stimulus
38
-36--
information for each AP subject in Figure 10. The original DT values are
also Olotted. Since.,the adjusted MT values were extremely small for AP-1,
this subject can be regarded as having done practically all of the decision
processing during the DT phase of the task. For the remaining AP subjects,
a substantial portion of the MT appeared to have been occupied with some sort
of refinement of the decision process.
It would appear that both DT's and adjusted MT's are a linear function of
stimulus information. Departures from linearity are probably mainly a func
tion of error variance. Figure 10 shows lines fitted to the values; the
reciprocals of the slopes Of these lines are shown as values of the rate of
gain of information (IG) in bits per second. Those derived from the values
of DT's alone (IGd) are somewhat higher than those derived from values of
DT adjusted MT;'the former are based on the assumption that inforniatir;
proc ssing is completed within the DT phase of the task, while the latter
assum that some information is professed in the MT phase. In any event, the
values of IG for at least the faster of the AP subjects are much higher than
some valuesreported earlier for other stimulus modalities (Bricker, 1955).
Insert Figure 10 about here
Information transmitted in decision time. We may now make estimates of
rates of gain of informationafor all subjects, but since adjusted movement
times are difficult to estimate,for NAP subjects because of the paucity of
correct responses under some noterange conditions, we use only decision times
for all responses in conjunction with the associated estimates of information
transmitted. In'Figure 11, the harmonic means of decision times for all
responses are pl4ted for all subjects as a function of total information
39
-37-
transmitted under different note-range conditions (again excluding the data
from the 7-note Condition). In effect, this figure reinterprets the data of
wwInsert Figure 11 about here
-igure 6 in terms of the data reported in Table 4. .The general linearity of
the relation between DT and stimulus information is, again confirmed, for both
AP and NAP subjects. But while the AP'and NAP subjects do not generally differ
0in speed of.decision (i.e., in the slopes of the lines relating DT and informa-
tion transmitted), they differ greatly in the amount of information transmitted
per unit of time (i.e., in the rate of gait of information). RoUgh estimates Of0
these information rate gains are given in Table 6. These estimates are obtained
by dividing information transmitted in the 64-note condition by the increase in
, 4DT from the 1-note to the 64-note condition. Along with rates of gain for total
information, rates are given for octave and chroma,information separately. The
rates of gain of total information for AP subject's are slightly different from
those given previously because they are based on all responses (rather than onlyL,.
correct responses) and on a cruder estimation procedure.
Insert Table 6 about here 4
Because of the extremely fast (put inaccurate) responses of one of the
NAP subjects, and desplte the extremely slow responses of another of these sub-,
jects, the difference between total IG for AP and NAP subjects is significant
only at a = .10. As expected, the differences in octave 1G are nonsignificant,
but it is noteworthy that the differences in chroma 1G are significant at
a = .02. Even for the AP subjects, however, the rates of gain computed separately
for chrome and octave information, on the assumption that pitch is a two-
40
-38-
dimensional continuum, are generally not higher than comparable figures fdr.
other stimulus modalities as reported by Bricker (1955). This is a further
way in which facts about the performance of AP subjects in judging pitches
can be made to come in line with p9rameters estimated in other contexts, but
this doe's not eliminate the possibility that AP subjects represent extremes of
ability in the judgment'of chroma.
Discussion
Several persistent questions will doubtless have occurred to the reader.
Do the .persons claiming AP ability studied here truly "have" ability that is
somehow different from that of the -verage person? How good is their ability
relative to that of ethers claiming thid ability? Are persons who claim AP
ability and who are able to demonstrate it in some reasonable degree merely
those present at the upper end of a continuously distributed trait?
In thecwhole literature of AP ability, no more than around two hundred
persons claiming this ability have been reported on, and with few exceptions
the reports fail to yield the kind of information from which one could accurately
characterize the extent of ability demonstrated or draw any conclusions as to
the distribution of ability. Even the definition of AP ability has been under
---
dispute, largely b 'use-the methods of measuring it have never been adequately
standardized. As Wynn (1973) remarks, "Much of the published work in the field
is unfortunately of little value because the authors have not indicated the
type of absolute pitch which their subjects possess" (p. 114).
Some of the studies that have been quoted or cited with apparent approval
by such reviewers as Ward (1963a, b) and Wynn (1973) turn out. on close exam-
ination, to be highly suspect. For example, Oakes (1955) gave an AP test to
41

-39-
88 persons, including 22 persons who claimed AP ability or were regarded by
their instructors as having it, but reported and analyzed the data in such a
faulty and unsatisfying form that one hesitates to cite them. The test was
given by wire-recorder (an instrument of dubious quality) and required subjects
to identify 75 different notes struck on a piano tuned to A4 = 443 Hz. He
used three methods of scoring the results and displayed cumulative distri-
\
butions of scores that he claimed were "essentially normal" with no obvious
bimodality. Actually, anyone who takes the trouble to convert 0.4esT dis-
tributions to frequency histograms will recognize that these distributions
are highly skewed, positively, and reveal considerable evidence of bimodality
and outlying clusters. It is of interest to see how the subjects used in the
present study place on these distributions. One of the measures was "absolute
error"; apparently no adjustment was made for octave errors. Oakes' best 5
subjects made "average errors" of from 1.55 to 2.45; in the 64-note task of
the present study; the AP subjects made average errors (by the same scoring
system) ranging from .73 to 1.55 and thus placed for the most part above Oakes'
best subjects, wuile the NAP subjects made average errors ranging from 3.16 to
5.20 and thus placed a little above the median of Oakes' total distribution.
Another measure was the number correct out of the 75 notes; converting all
values to percentages, we find that the top five percentages in Oakes' dis-
tribution were 77, 73, 65, 63, and 62; these may be compared to the percentages
for our AP subjects, which were 93, 80, 67, 67, and 48. NAP subjects' per-
centages, 'ranging from 15 down to 8, place them slightly better than Oakes'
median, which was of course quite low on the scale. One further measure was
the number correct, counting octave and 1-semit errors as correct: on this
measure our AP subjects placed among or better than Oakes' top 8 performers,
I
42
-40-
and again our NAP subjects placed a little above the median of all 88 of Oakes'
subjects. If Oakes' data are to be regarded as in any way representative of
college student populations, our AP subjects appear to be rather exceptional,
and our NAP subjects little better than typical unselected persons not claiming
AP. It is striking that in each of Oakes' distributions, the region of the
scale between where our NAP subjects place and where our AP subjects place has
relatively few cases. Although the distributions may be regarded as "contin-
uous," this is largely because the scale itself may be laid out continuously.
A much more reliable and well-reported set of data is that published by
Weinert (1929), who, in the course of visits to the principal centers of
musical culture in Europe, was able to test 22 musicians claiming AP ability- -
orchestra conductors, concert performers, and the like. Requiring only chroma
judgments of 88 piano notes, he reported data from which it is possible to
compute several measures identical to those used in the present study and to
compare his subjects with ours (using data from our 64-note task). Among
Weinert's 22 AP-claiming subjects, our 5 AP subjects rank about 3, 10, 12, 12,
and 17, respectively, in prOportion of zero chroma error; they rank about 1.5,
7, 12, 14, and 19 in standard deviation of algebraic chroma error, and 1.5, 9,
11, 14, and 19 in mean absolute chrome error. Most of our AP subjects, there-
fore, are representative of the better half of Weinert's. Our NAP subjects
are clearly below any of Weinert's subjects on all these measures; Weinert
tested no NAP subjects.
Considering all these results, we may form a tentative conclusion about
the distribution of AP ability in typical cultures of Western civilization.
Persons claiming AP ability do indeed form a special class of individuals that
can perform AP judgment tasks much better than most individuals, although there
-41
is still considerable variation in their performance, and the mere fact that
a person claims AP ability cannot be taken to mean much unti this claith is
validated by appropriate tests. If it were possible to a large population
for AP judgment ability, the distribution would be very'much positively
skewed, with a minor mode toward the top end of the scale. Although cases
might occur at any point on the scale, there would/be very few cases in some
region lying between the two modes of the distribution; the point of division
between persons "having" AP 'And those not haVing it could be established by
finding the minimum value. of the fitted density function between theFtwo modes.
If our hypothesis abou5ithe distribution of AP judgment ability is correct,
there would be no necessity for setting some arbitrary criterion for the
possession of AP ability, such as Sachem's (1937) very stringent requirement
that persons be regarded as having "genuine" AP ability only if their average
error is less than .1 semit. We would simply conclude that AP ability is a
continuously but bimodally distributed trait. This would, however, say
nothing about the genesis of the trait; it is a purely descriptive statement.
From the present data, can we say anything about the nature of the
ability exhibited among individuals "having" AP ability? One thing seems
very clear: the perceptual dispersion variance of AP subjects is very much
smaller than that of NAP subjects, particularly when judgments must be made
of notes in a stimulus set with many alternatives. In establiShing the
distribution of AP judgment ability in a large population, as proposed above,
the best measure of the trait would be a measure of perceptual dispersion
variance, and it may be postulated that such a measure would be most likely
to reveal bimodality. It would have to be a measure, however, that would
adjust for "octave errors," such as the standard deviation of chrome error
developed in e present study.
44
-42-
.
In statistical theory, bimodality in the distribution of a trait can be
interpreted as suggesting that the distribution is a composite of two separate
normal distributions, and this lends credence to the idea that has been proposed
a number of times in the literature (Bachem, 1950; R41.4sz, 1913) that AP and
NAP subjects can use different mechanisms in judging pitches: AP subjects
can use tone chromas (i.e., the notes of the musical scale in an octave) as
the anchors for their judgments, while NAP subjects can use only tone height,
i.e., the pitch of a tone relative to the total pitch frequency spectrum or
some part thereof. The use of tone height is analogous to the use of per-
ceived spatial distances in judging the relative position of a point on a
line, e.g., judging that a particular point is about one-third of the distance
from the left-hand end of the line. We know (Keele, 1973) that people can
make fairly accurate judgments of relative position in various sensory dimen-.
Siods, and there is reason to believe that they can make such judgments in
the c e of the pitch dimension. In fact, this type of judgment is the basis
of major developments in te theory, of the scaling of pitches, i.e., according
'to a "mel" scale (Stevens & \olkman, 1940). Anyone who has reasonable
familiarity with the piano keyboard and what high and low notes sound like
can therefore make a reasonably accurate judgment of the relative height of
A tone with respect to the piano keyboard, the accuracy so-etimes being on'
the order of an absolute error of 2 or 3 semitones, as Reve'sz (1913, p. 92)
observed. Variance in the ability to make such judgments of relative one
height would account for the variance in the primary component of the bimodal
distribution of AP judgment ability. Variance in the accuracy with which
particular chromas are fixed in long-term memory would account for most of
the variance in the secondary component of the distribution.
45
-43-
In the present experiment, however, it was found that accuracy increased
for both AP and NAP subjects as size of'stimulus set decreased; AP subjects
always maintained their lead over NAP subjects, of course. In terms of, the
notions just.presented, this could be interpreted as implying that (1) as
stimulus set size decreas&S, the accuracy of judgment on the basis of tone
/height is enhanced because a unit of pitch distance, such as the semit,
becomes an increasingly larger proportion of the total note range--and thus
it is easier to judge relative positions of notes within the range; (2) this
fact is the sole basis of the NAP's increased accuracy for smaller set sizes;
and (3) AP subjects can use information from tone height just as well as NAP
subjects, agd this accounts largely for their increased accuracy with smaller
set sizes, but in addition they use information from long-term memory tra..es
of tone chromes, and this accounts for their continued superiority over NAP
subjects even at the smaller set sizes. However, if the pitch range of the
set becomes sufficiently small, such that the perceptual dispersion of a
particular tone chroma extends over the range of the stimulus set, the superi-
ority of AP subjects over NAP subjects would disappear. Evidence suggests
that this is in fact the case (Siegel, 1974).
One way in which this "two-factor" theory might be tested would be to
require judgments based on tone chrome only. If subjects were presented with
a note of a particular frequency and asked merely to state whether it is or
is not of a designated chrome, regardless of the octave in which it occurs,
we would expect AP subjects to be much more successful than NAP subjects,
because NAP subjects could not use tone height as a 'axis f r judgment if
the notes in this task were chosen from different octaves randomly.
46
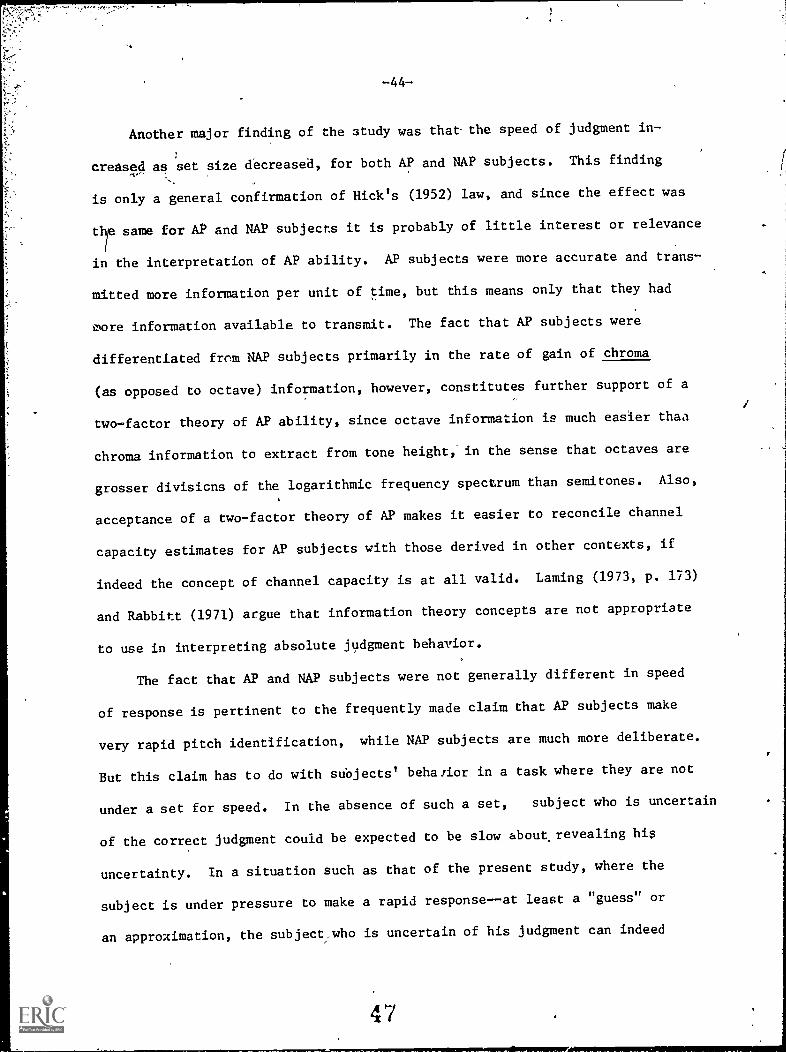
-44-
Another major finding of the Study was that- the speed of judgment in-
creased as set size decreased, for both AP and NAP subjects. This finding
is only a general confirmation of Hick's (1952) law, and since the effect was
le same for AP and NAP subjects it is probably of little interest or relevance
in the interpretation of AP ability. AP subjects were more accurate and trans-
mitted more information per unit of time, but this means only that they had
wore information available to transmit. The fact that AP subjects were
differentiated from NAP subjects primarily in the rate of gain of chroma
(as opposed to octave) information, however, constitutes further support of a
two-factor theory of AP ability, since octave information is much easier than
chroma information to extract from tone height,-in the sense that octaves are
grosser divisicns of the logarithmic frequency spectrum than semitones. Also,
acceptance of a two-factor theory of AP makes it easier to reconcile channel
capacity estimates for AP subjects with those derived in other contexts, if
indeed the concept of channel capacity is at all valid. Laming (1973, p. 173)
and Babbitt (1971) argue that information theory concepts are not appropriate
to use in interpreting absolute judgment behavior.
The fact that AP and NAP subjects were not generally different in speed
of response is pertinent to the frequently made claim that AP subjects make
very rapid pitch identification, while NAP subjects are much more deliberate.
But this claim has to do with subjects' behavior in a task where they are not
under a set for speed. In the absence of such a set, subject who is uncertain
of the correct judgment could be expected to be slow about, revealing his
uncertainty. In a situation such as that of the present study, where the
subject is under pressure to make a rapid response--at least a "guess" or
an approximation, the subject who is uncertain of his judgment can indeed
47
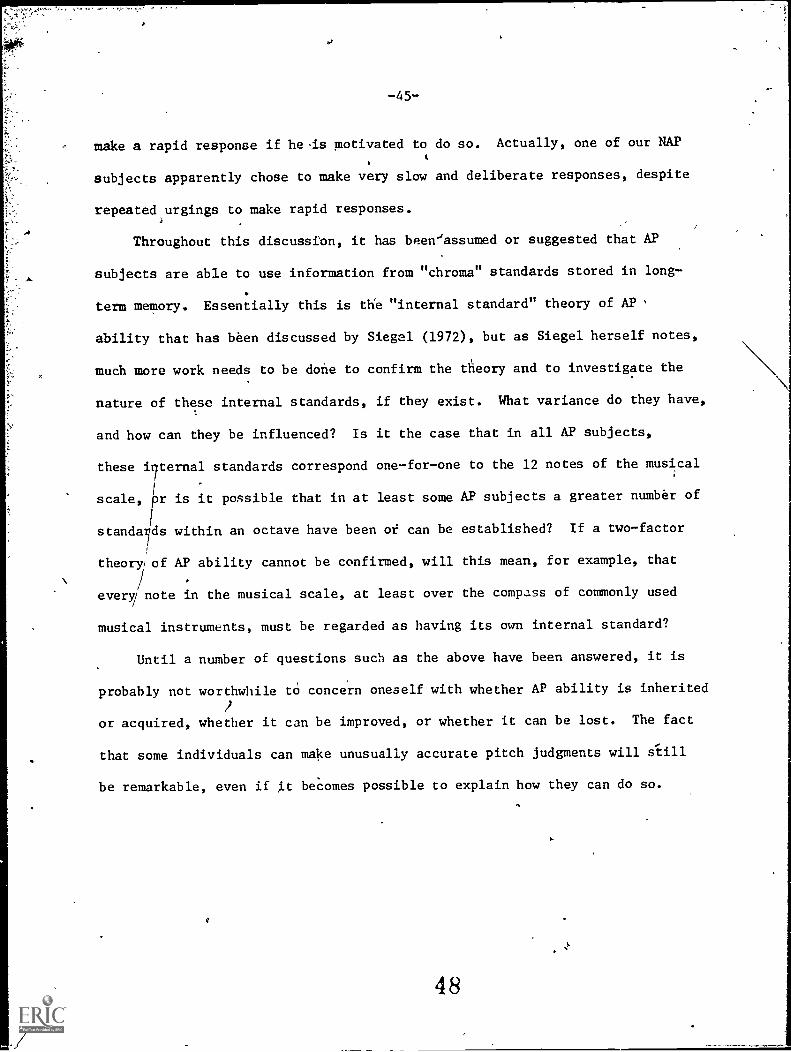
-45-
make a rapid response if heis motivated to do so. Actually, one of our NAP
subjects apparently chose to make very slow and deliberate responses, despite
repeated urgings to make rapid responses.
Throughout this discussion, it has been'assumed or suggested that AP
subjects are able to use information from "chroma" standards stored in long-
term memory. Essentially this is the "internal standard" theory of AP
ability that has been discussed by Siegel (1972), but as Siegel herself notes,
much more work needs to be done to confirm the theory and to investigate the
nature of these internal standards, if they exist. What variance do they have,
and how can they be influenced? Is it the case that in all AP subjects,
these internal standards correspond one-for-one to the 12 notes of the musical
scale, pr is it possible that in at least some AP subjects a greater number of
standa ds within an octave have been of can be established? If a two-factor
theoryiof AP ability cannot be confirmed, will this mean, for example, that
every/ note in the musical scale, at least over the compass of commonly used
musical instruments, must be regarded as having its own internal standard?
Until a number of questions such as the above have been answered, it is
probably not worthwhile to concern oneself with whether AP ability is inherited
or acquired, whether it can be improved, or whether it can be lost. The fact
that some individuals can make unusually accurate pitch judgments will still
be remarkable, even if it becomes possible to explain how they can do so.
48
-46-
References
\Abrah , 0. Das absolute Tonbewusstsein. SammelbAnde der Internationale11\1
Mus kgesellschaft, 1901, 3, 1-86.
Attneave, F. Applications of information theory to psychology. New York:
Ho;.;, 1959.1
Bachem, Various types of absolute pitch. Journal of the Acoustical
Society of America, 1937, 9, 14u-151.
BacheM, A. Chroma fixation at,the ends of the musical frequency scale.
Journal of the Acoustical Society of America, 1948: 20, 704-705.
Bachem, A. Tone height and tone chroma as two different pitch qualities.
Acta Psychologica, 1950, 7, 80-88.
Bachem, A.. Time factors in relative and absolute pitch determination.
Journal of the Acoustical Society of America, 1954, 26, 751-753.
Bachem, A. Absolute pitch. Journal of the Acoustical Society of America,
1955, 27, 1180-1185.
Baird, J. W. Memory for absolute pitch. In Studies in psychology: Titchener'
commemorative volume. Worcester, Mass.: Louis N. Wilson, 1917. Pp. 43-78.
Brady, P. T. Fixed-scale mechanism of absolute pitch. Journal of the
Acoustical Society of America, 1970, 48, 883-887.
Brainard, R. W., Irby, T. S., Fitts, P. M., & Alluisi, E. A. Some variables
influencing the rate of gain of information. Journal of Experimental
Psychology, 1962, 63, 105-110.N
Bricker; P. D. Information measurement and reaction time: A review. In
H. Quastler (Ed.), Information thtory in psychology. Glencoe, Ill.:
Free Press, 1955. Pp. 350-359.
49
-47-
Briggs, G. E. The additivity pr nciple in choice reaction time--a functionalist
approach to mental processes.\ In R. F. Thompson & J. F. Voss (Eds.), Topics
in learning and performance. N w York: Academic Press, 1972. Pp. 1-16,
Corliss, E. L. Remark on "fixed-scale echanism of absolute pitch." Journal
of the Acoustical Society of America 1973. 53, 1737-1739.
Danev, S. G., deWinter,,C. R., & Wartna, G. F. On the relation between re-
action and motion time in a choice react n task. Acta Psychologica, 1971,
35, 188-197.
Fitts, P. M. The information capacity of the huma motor system in controlling the
amplitude of movement. Journal of'Ex erimenta Ps cholo 1954, 47, 381-391.
Fitts, P. M., & Peterson, J. R. The information capacity of discrete motor
responses. Journal of Experimental Psychology, 1964, 67, 11 12.
Fulgosi, A., & Zaja, B. [Transmission of 3.1 bits'in absolute identification
of p_tch.) In Psiholoske razprave: IV. Kongres psihologov, SERJ.
Ljubljana, Yugoslavia: University of Ljubljana Press, 1972. [Psycho=
logical Abstracts, 1974, 51, 2169.j
Fullard, W., Snelbecker, G. F., & Wolk, S. Absolute judgments as a function
ot srimu!us uncertainty.and temporal effects: Methodological note.
Percmi. 1. grid Motor Skills, 1972, 34, 379-382.
Garner, W. R, Uncertainty and structure as psychological concepts. New York:
Wiley, 1962.
Garner,W. R., & Hake, H. W. The amo,..n_ or information in absolute judgments.
Psychological Review, 1951, 58, 446-459.
Hick, W. E. On the rate of gain of inforMation. Quarterly Journal of Experi-
mental Psychology, 1952, 4, 11-26,
Hyman, R. Stimulus information as a determinant of reaction time. Journal
of Experimental Psychology, 1953, 45, 188-196.
Keele,'S. W. Attention and human performance. Pacific Palisades, Calif.:
Goodyear Publishing Co., 1973.
Laming, D. Mathematical psychology. New Yolk: Academic Press, 1973.
Levy, R. M., & Norton, G. K. The effects el: stimulus dimensionality on the
rate of gain of information. Quarterly Journal of Experimental
Psychology, 1972, 24, 299-309.
MacRae, A. W. Channel capacity in absolute judgment tasks: An artifact of
information bias? Psychological Bulletin, 1970, 73, 112-121.
Miller, G. A. The magical number seven, plus or minus two. Psychological
Review, 1956, 63, 81-97.
Neu, D. M. A critical review of the literature on absolute pitch.
Psychological Bulletin, 1947, 44, 249-266.
Oakes, W. F. An experimental study of pitch naming and pitch discrimination
reactions. Journal of Genetic Psychology, 1955, 86, 237-259.
Pachella, R. G., & Fisher, D. Hick's law and the speed-accuracy trade-off in
absolute judgment. Journal of Experimental Psychology, 1972, 92, 378-384.
Petran, L. A. Experimental study of pitch recognition. Psychological
Monigraphs, 1932, 42, Whole No. 6.
Pollack, I. The Information of elementary auditory displays. Journal of
the Acoustical Society of America, 1952, 24, 745-749.
Pollack, I. The information of elemer_ary auditory displays, II. Journal
of the Acoustical Society of America, 1953, 25, 765-769.
Rabbitr, P. M. A. Times f r the analysis of stimuli and for the selection
of responses. Britis Medical Bulletin, 1971, 27, 259-265.
Revesz, G. Zur Grundlegung der Tonpsychologie. Leipiig: Veit & Co., 1913.
Rev4sz. G. Introduction to the psychology of music. London: Longmans, Green,
1953.
0
51
-49-
Risset, J. C. Pitch control and pitch paradoxes demonstrated with computer-
synthesized sounds. Journal of the Acoustical Society of America, 1969,
46, 88.
Seashore,, C. E. The psychology of musical talent. New York: Silver, Burdett,
1919.
Shepard, R. N. Circularity in judgments of relative pitch. Journal of the
Acoustical Society of America, 1964, 36, 2346-2353.
Siegel, J. A. The nature of absolute pitch. In E. Gordon (Ed.), Experimental
research in the psychology, of music, VIII. Iowa City: Iowa Univ. Press,
1972. Pp. 65-89.
Siegel, J. A. Sensory and verbal coding strategies in subjects with absolute
pitch. Journal of Experimental Psychology, 1974, 103:37-44.
Slonimsky, N. Absolute pitch. American Mercury, 1930, 21, 244-247.
Stanaway, R. G., Morley, T., & Anstis, S. M. Tinnitus not a reference signal
in judgments of absolute pitch. Quarterly Journal of Experimental
Psychology, 1970, 22, 230-238.
Stevens, S. S., & Volkman, J. The relation of pitch to frequency: A revised
scale. American Journal of Psychology, 1940, 53, 329-353.
Stumpf, C. Tonpsychologie. Leipzig: Hirzel, 1883.
'bon Kries, J. Uber das absolute GehOr. Zeitschrift four Psychologie and
Physiologie der Sinnesorgane, 1892, 3, 257-279.
Ward, W. D. Information and absolute pitch. Journal Of the Acoustical Society
of America, 195s, 25, 833.
Ward, W. D. Absolute pitch: Part I. Sound, 1963, 2, 14 -21. (a)
Ward, W. D. Absolute pitch: Part II. Sound, 1963, 2, 33-41. (b)
-50-11.
Waid W. D. Musical percepti'pn. In J. V. Tobias (Ed.), Foundations of modern
auditory theory: Vol. I. New York: Academic P.ress, 1970. Pp. 407-447.
Weinert, L. Untersuchungen 'Ube das absolute Gehor. Archie Hr die gesamte
Psychologie, 1929, 73, 1-128\
Whipple, G. M. Studies in pitch discrimination. American Journal of Psychology,
1903, 14, 289-309.
Wynn, V. T. Measurements of small variations in 'absolute' pitch. Journal of
Physioloa, 1972, 220, 627-637.
Wynn, V. T. Absolute pitch in humans, its variations and possible connec-
tions with other known rhythmic phenomena. In G. A-. Kerkut & J. W.
Phillis (Eds.), Progress in neurobiology, Vol. 1, Part 2. Oxford and
New York: Pergamon Press, 1973. Pp. 111-149.
53
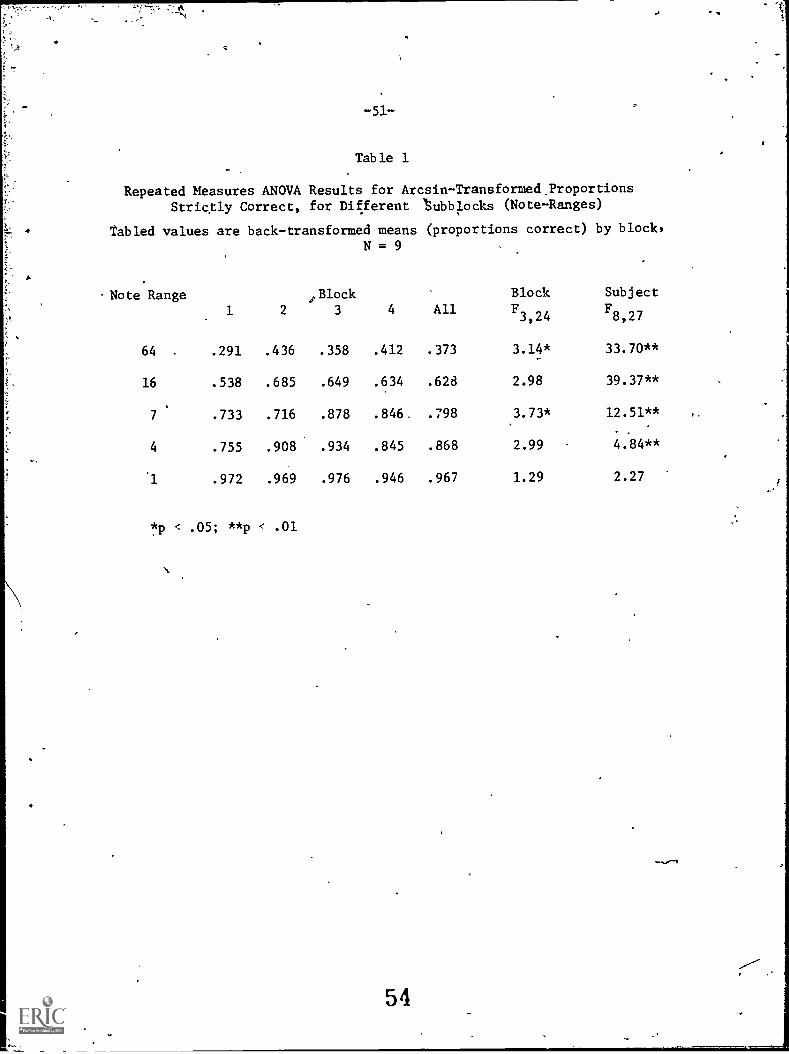
-5].-
Table 1
Repeated Measures ANOVA Results for Arcsin-Transformed.ProportionsStrictly Correct, for Different tubblocks (Note-Ranges)
tabled values are back-transformed means (proportions correct) by block,N = 9
.Note Range1 2
s Block3 4 All
BlockF3,24
SubjectF8,27
64 .291 .436 .358 .412 .373 3.14* 33.70**
16 .538 .685 .649 .634 .628 2.98 39.37**
7 .733 .716 .878 .846. .798 3.73* 12.51**.
4 .755 .908 .934 .845 .868 2.99 4.84**
.1 .972 .969 .976 .946 .967 1.29 2.27
*p < .05; **p < .01
54
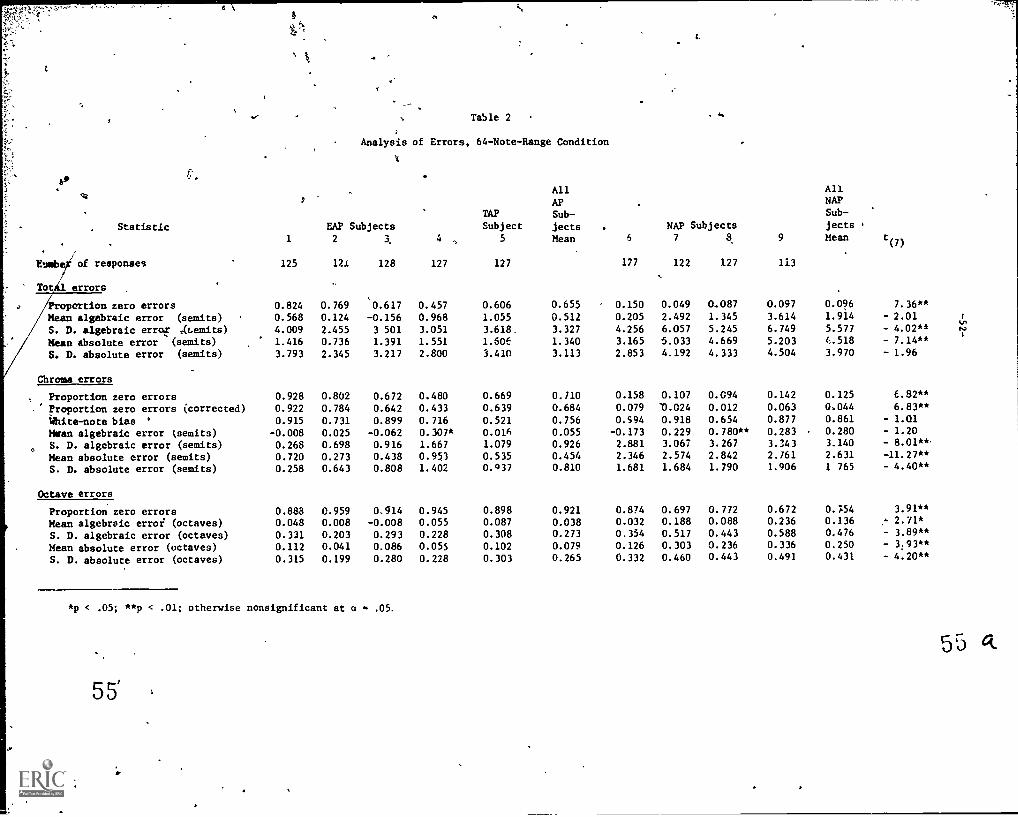
Statistic
Eumbe of responses
TotAl errors
Proportion zero errorsMean algebraic error (semits)
S. D. algebraic error `(remits)Mean Absolute error (semits)
S. D. absolute error (semits)
Chrome errors
Proportion zero errorsProportion zero errors (corrected)White-note bias '
Mean algebraic error (remits)S. D. algebraic error (semits)Mean absolute error (semits)S. D. absolute error (semits)
Octave errors
Proportion zero errorsMean algebraic error (octaves)S. D. algebraic error (octaves)Mean absolute error (octaves)S. D. absolute error (octaves)
6 .
s.
ae"
9
ti Table 2
Analysis of Errors, 64-Note-Range Condition
All
APTAP Sub-
EAP Subjects Subject jects2 4 , 5 Mean 6
NAP Subjects7 9
AllNAPSub-
jectst(7)
125 12i 128 127 127 177 122 127 113
0.824 0.769 0.617 0.457 0.606 0.655 0.150 0.049 0.087 0.097 0.096 7.36k*
0.568 0.124 -0.156 0.968 1.055 0.512 0.205 2.492 1.345 3.614 1.914 - 2.01 1
i...
4.009 2.455 3 501 3.051 3.618 3.327 4.256 6.057 5.245 6.749 5.577 - 4.02** na
1.416 0.736 1.391 1.551 1.606 1.340 3.165 5.033 4.669 5.203 4.518 - 7.14**
3.793 2.345 3.217 2.800 3.410 3.113 2.853 4.192 4.333 4.504 3.970 - 1.96
0.928 0.802 0.672 0.480 0.669 0.110 0.158 0.107 0.094 0.142 0.125 6.62**
0.922 0.784 0.642 0.433 0.639 0.684 0.079 10.024 0.012 0.063 0,044 6.83**
0.915 0.731 0.899 0.716 0.521 0.756 0.594 0.918 0.654 0.877 0.861 - 1.01
-0.008 0.025 -0.062 0.307* 0.016 0.055 -0.173 0.229 0.780** 0.283 0.280 - 1.20
0.268 0.698 0.916 1.667 1.079 0.926 2.881 3.067 3.267 3.343 3.140 - 8.01**,
0.720 0.273 0.438 0.953 0.535 0.454 2.346 2.574 2.842 2.161 2.631 -11.27**
0.258 0.643 0.808 1.402 0.037 0.810 1.681 1.684 1.790 1.906 1 765 - 4.40**
0.888 0.959 0.514 0.945 0.898 0.921 0.874 0.697 0.772 0.672 0.7.54 3.91**
0.048 0.008 -0.008 0.055 0.087 0.038 0.032 0.188 0.088 0.236 0.136 - 2.71*
0.331 0.203 0.293 0.228 0.308 0.273 0.354 0.517 0.443 0.588 0.476 - 3.89**
0.112 0.041 0.086 0.055 0.102 0.079 0.126 0.303 0.236 0.336 0.250 - 3.93 **
0.315 0.199 0.280 0.228 0.303 0.265 0.332 0.460 0.443 0.491 0.431 - 4.20**
*p < .05; **p < .01; otherwise nonsignificant at a + .05.
55'
5'5 4

Table 3-
Statistic
Analysis of Errors, 16-, 7-, 4-, and 1 -Note Ranges
AllAP
TAP Sub-
EAP Subjects Subject sects HAP Subjects
AllNAP
Sub-jects
1 2 3 4 5 Mean 6 7 8 9 Mean t(7j
16-Note RangeNumber of responses -'64 62 63 64 63 63 64 64 60 t
Proportion of zero chroma errors 0.953 0.919 0.857 0.797 0.857 0.877 0.286 0.266 0.281 0.167 0.250 15.88**
Proportion zero chrome errors (cor.) 0.949 0.912 0.845 0.779 0.845 0.866 0.217 0.197 0.214 0.091 0 194 14.15**
White-note bias 1.019 0.824 0.305 0.796 0.410 0.671 0.992 0.801 0.825 0.613 0.808 - 0.82
Mean algebraic chroma errors (semits) -0.016 0.081* 0.016 0.000 0.159* 0.048 -0.238 0.203 0.359 -0.550 -0.056 0.56
S. D. algebraic chrome errors (semits) 0.216 0.272 0.378 0.586 0.510 0.392 1.883 2.399 2.102 2.341 2.181 -13.69**
Mean absolute chrome errors (semits) 0.047 0.081 0.143 0.250 0.190 0.142 1.381 1.828 1.547. 1.850 1.652 -13.97**
S. D. absolute chrome errors (seats) 0.211 0.272 0.350 0.530 0.499 0.373 1.302 1.567 1.468 1.726 1.516 -10.87**
7-Note RangeNumber of responses 55 56 56 56 56 54 56 56 54
Proportion of zero chrome errors 0.964 0.929 0.893 0.946 1.000 0.946 0.531 0.500 0.518 0.411 0.490 14.60**
Mean algebraic chroma errors (semits) 0.018 0.107* n.000 -0.107 0.000 0.004 -0.185 -0.196 -0.036 -0.426 -0.211 2.66*
S. D. algebraic chroma errors (semits) 0.301 0.409 0.463 0.450 0.000 0.325 1.765 1.747 2.220 2.174 1.976 -11.11**
Mean absolute chroma errors (semits) 0.054 0.107 0.143 0.107 0.000 0.082 1.111 1.125 1.571 1.389 1.299 -11.99**
S. D. absolute chroma errors (semits) 0.294 0.409 0.440 0.450 0.000 0.318 1.383 1.350 1.568 1.726 1.507 - 9.69**
4-Note RangeNumber of responsesProportion of zero chrome errors
31
0.936
31
1.000
32 32
1.000
32
0.875 0.962
32
0.531
31
0.742
32
0.688
32
0.656 0.654 6.35**
Proportion zero chrome errors (cor.)White-note bias
0.9130.907
1.000(.778)+
1.000 1.000(.756)4'
0.833
0.691
0.9490.747
0.3750.500
0.6590.708
0.5830.575
0.5420.705
0.541
0.622
6.34**1.70
Mean algebraic chroma errors (semits) 0.000 0.000 0.000 0.000 0.125 0.025 0.000 0.129 0.094 -0.125 0.024 0.01
S. D. algebraic chroma errors (semits) 0.254Mean /absolute chroma errors (semits) 0.065
S. D. absolute cnroma errors (semits) 0.246
0.0000.0000.000
0.0000.0000.000
0.000
0.0000.000
0.331
0.125
00.331
0.117,0.0380.115
1.0000.6250.781
0.4910.2580.438
0.8790.4060.785
0.6500.3750.545
0.7550.416
0.637
- 4.92**- 5.18**- 4.67**
1-Note RangeNumber of responses 59 63 47 63 63 64 63 61 63
Proportion of zero chrome errors 0.932 0.936 1.000 0.952 1.000 0.964 0.969 0.952 0.934 0.984 0.960 0.22
Mean algebraic chrome errors (semits) -0.102 0.079 0.000 0.032 0.000 0.002 0.047 0.079 0.098 0.079 0.076 - 2.12
S. D. algebraic chrome errors (semits) 0.399 0.324 0.000 0.307 0.000 n 206 0.276 0.370 0.393 0.625 0.416 - 1.80
Mean absolute chroma errors (semits) 0.102 0.079 0.000 0.064 0.000 0.049 0.047 0.079 0.093 0.079 0.076 - 1.06
S. D. absolute chrome errors (semits) 0.399 0.324 0.000 0.302 0.000 0.205 0.276 0.370 0.393 0.370 0.352 - 1.48
+Since the values are indeterminate, the means of the values for the 64- and 16-note ranges have been substituted for the computation of t and W.
*p < .05; **p < .01; otherwise nonsignificant at e .05.
5657

Y
-54-
Table 4
Mean Information Transmitted
64-Note Range
Chance Max.
AP Subjects(N = 5)
NAP Subjects(N = 4)
t(7)
Chroma (Ic) .583 3.585 3.031 .350 1.268 .116 9.54**
Prop. possible .816 .117 .228 .034
Octave (Id 1.056 2.415 2.289 .048 2.022 .145 3.92**
Prop. possible .908' .036 .710 .107
Total (1t) 1.639 6.000 5.321 .334 3.290 .233 10.25**
jProp. possible .844 .077 .378 .053
16-Note Range
Chroma (Ic) 1.116 3.585 3.376 .111 1.872 .167 16.25**
Prop. possible .920 .043 .344 .064
Octave (Id - .142 .415 .415 .000 .389 .037 1.58
Prop. possible 1.000 .000 .937 .090
Total (It) .973 '4.000 3.791 .111 2.261 .194 14.95**
Prop. possible .931 .034 .426 .065
7-Note Range
Chroma (Ic) 1.137 3.585 3.479 .074 2.308 .170 14.02**
Prop. possible .959 .030 .478 .070
Octave (Id -1.166 .778 - .778 .000 - .800 .044 1.14
Prop. possible 1.000 .000 .943 .114
Total (It) - .029 2.807 2.701 .074 1.508 .175 13.96**
Prop. possible .963 .026 .542 .062
4-Note Range
Chroma (1c) 2.059 3.585 3.525 .089 2.992 .185 5.73**
Prop. possible .961 .058 .611 .121
**P < .01.
5&
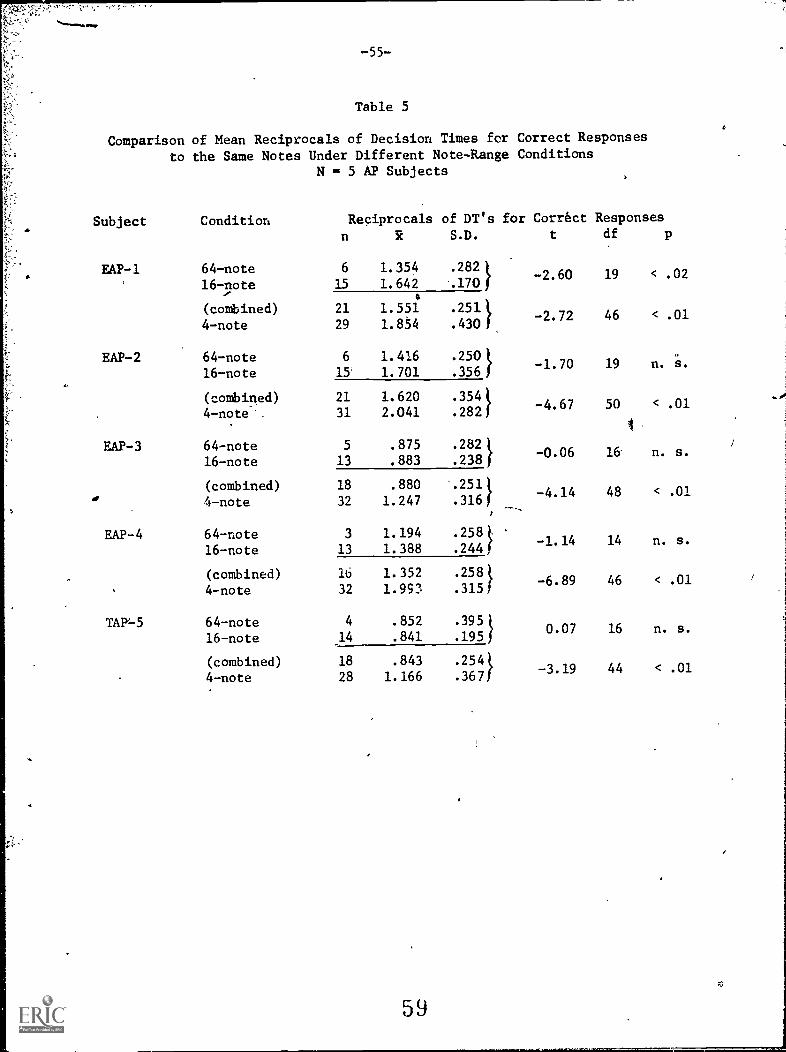
-55-
Table 5
Comparison of Mean Reciprocals of Decision Times for Correct Responsesto the Same Notes Under Different Note-Range Conditions
N = 5 AP Subjects
Subject Condition Reciprocals of DT's for Correct Responses
n R S.D. t df p
EAP-1 64-note 6 1.354 .2821
16-note 15 1.642 .170-2.60 19 < .02
1
(combined) 21 1.551 .251}4-note 29 1.854 .430
-2.72 46 < .01
EAP-2 64-note 6 1.416 .250k16-note 15' 1.701 .3561
-1.70 19 n. S.
(combined) 21 1.620 .354k-4.67 50 < .01
4-note 31 2.041 .2821.
EAP-3 64-note 5 .875 .282t-0.06 16 n. s.
/
16-note 13 .883 .238f
(combined) 18 .880 '.2511-4.14 48 < .01
4-note 32 1.247 .3161
EAP-4 64-note 3 1.194 .258t- 1.14 14 n. s.
16-note 13 1.388 .244f
TAP-5
(combined)4-note
Iii 1.35232 1.993 .
.258315 )
64-note 4 .852 .395
16-note 14 .841 .195
(combined) 18 .843 .254
4-note 28 1.166 .367
59
- 6.89 46 < .01
0.07 16 n. s
-3.19 44 < .01
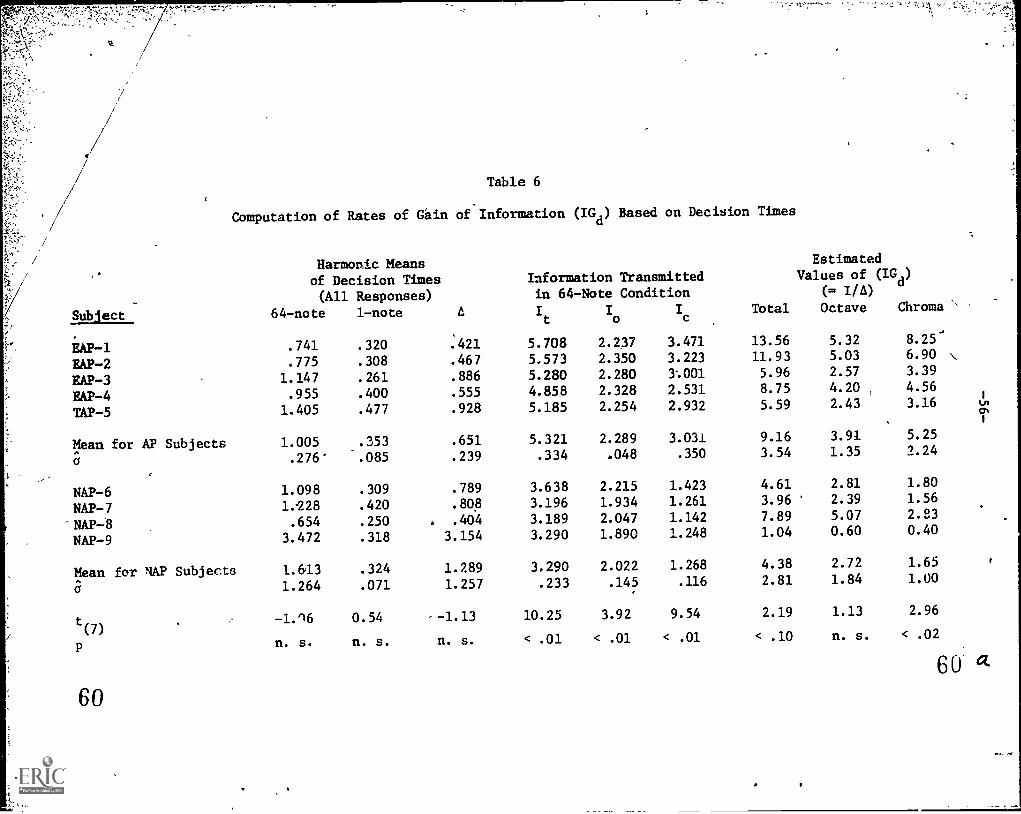
7
Table 6
Computation of Rates of Gain of Information (IGd) Based on Decision Times
Harmonic Meansof Decision Times(All Responses)
Information Transmittedin 64-Note Condition
EstimatedValues of (IG
d)
(= I/A)
Subject 64-note 1-note A It
Io
Ic
Total Octave Chrome
EAP-1 .741 .320 :421 5.708 2.237 3.471 13.56 5.32 8.25.
BAP -2 .775 .308 .467 5.573 2.350 3.223 11.93 5.03 6.90
EAP-3 1.147 .261 .886 5.280 2.280 3:001 5.96 2.57 3.39
EAP-4 .955 .400 .555 4.858 2.328 2.531 8.75 4.20 4.56
TAP-5 1.405 .477 .928 5.185 2.254 2.932 5.59 2.43 3.16 k.nrn
Mean for AP Subjects 1.005 .353 .651 5.321 2.289 3.031 9.16 3.91 5.25
a .276' .085 .239 .334 .048 .350 3.54 1.35 2.24
NAP-6 1.098 .309 .789 3.638 2.215 1.423 4.61 2.81 1.80
NAP - 7 1.228 .420 .8op 3.196 1.934 1.261 3.96 2.39 1.56
NAP-8 .654 .250 . .404 3.189 2.047 1.142 7.89 5.07 2.83
NAP-9 3.472 .318 3.154 3.290 1.890 1.248 1.04 0.60 0.40
Mean for NAP Subjects 1.613 .324 1.289 3.290 2.022 1.268 4.38 2.72 1.65
a 1.264 .071 1.257 .233 .145 .116 2.81 1.84 1.00
t(7)
-1/16 0.54 - -1.13 10.25 3.92 9.54 2.19 1.13 2.96
p n. s. n. s. n. s. < .01 < .01 < .01 < .10 n. s. < .02
6O a60
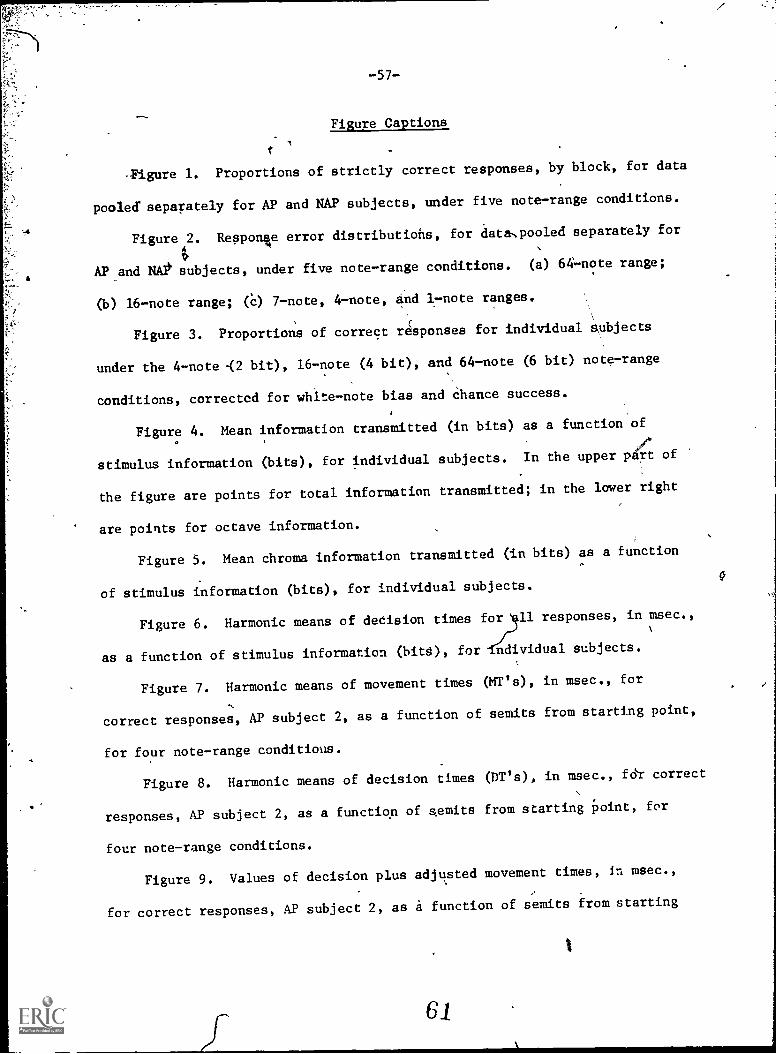
-57-
Figure Captions
-Figure 1. Proportions of strictly correct responses, by block, for data
pooled' separately for AP and NAP subjects, under five note-range conditions.
Figure 2. Response error distributions, for data pooled separately for
AP and NAB subjects, under five note-range conditions. (a) 64-note range;
(b) 16-note range; (C) 7-note, 4-note, and 1-note ranges.
Figure 3. Proportions of correct responses for individual Subjects
under the 4-note -(2 bit), 16-note (4 bit), and 64-note (6 bit) note-range
conditions, corrected for white-note bias and chance success.
Figure 4. Mean information transmitted (in bits) as a function of
stimulus information (bits), for individual subjects. In the upper p4; of
the figure are points for total information transmitted; in the lower right
are points for octave information.
Figure 5. Mean chroma information transmitted (in bits) as a function
of stimulus information (bits), for individual subjects.
Figure 6. Harmonic means of decision times for 11 responses, in msec.,
-f)as a function of stimulus information (bits), for ndividual subjects.
Figure 7. Harmonic means of movement times (MT's), in msec., for
correct responses, AP subject 2, as a function of semits from starting point,
for four note-range conditions.
Figure 8. Harmonic means of decision times (DT's), in msec., HI- correct
responses, AP subject 2, as a function of semits from starting point, for
four note-range conditions.
Figure 9. Values of decision plus adjusted movement times, in msec.,
for correct responses, AP subject 2, as a function of semits from starting
61
-58-
point, for four note-range conditions. Horii.ontal lines indicate means of
values over note groups.
Figure 10. Graphs for individual AP subjects showing response times
as a function of stimulus information (bits). Solid lines and filled circles
are for decision plus adjusted movement times; broken lines and open circles
are for decision times alone. All values are based on estimates from correct
responses only. The computation of values of IG is explained in the text.
Figure 11. Harmonic means of decision times, in cosec., as related to
total information transmitted under four note-range conditions, for individual
subjects.
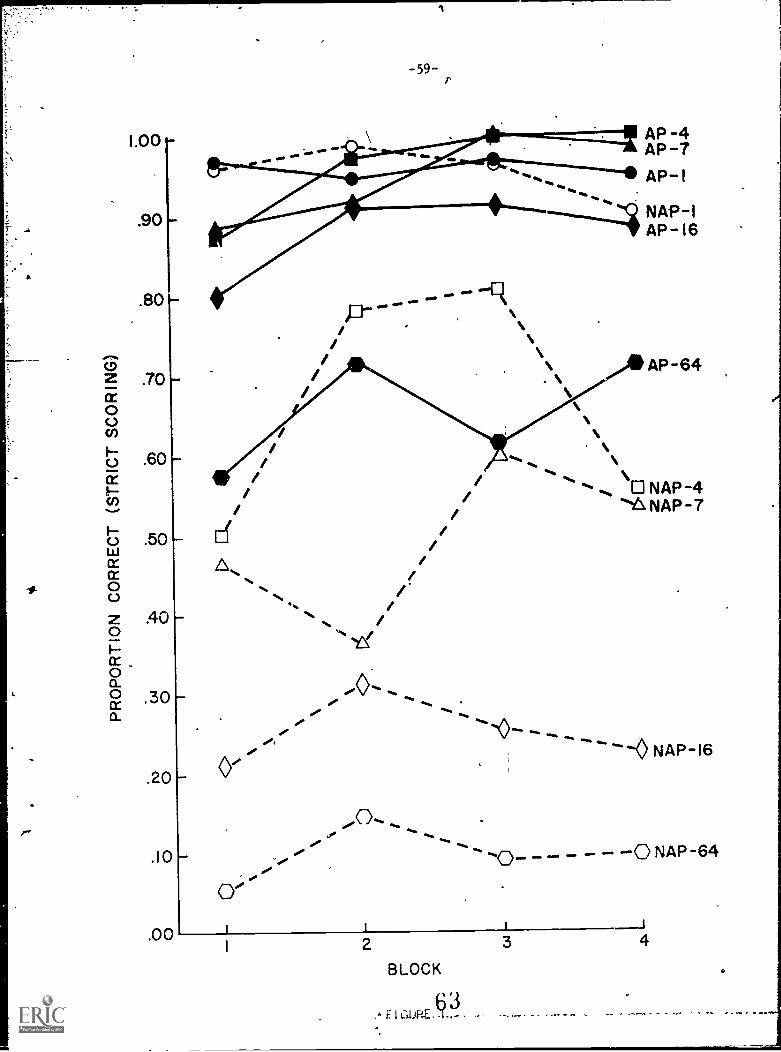
I
-59-p

50
POOLED RESPONSES
64-NOTE RANGE
AP SUBJECTS (N=5)
ym
,.
AA
NAP SUBJECTS (N=4)
-15
r--.----,----'1
0+ 1
t0 -10
-1
-5tT 5
DEVIATION FROM TARGET (SEMITS)
64FIGURE 2a .
I t10 0+1
15
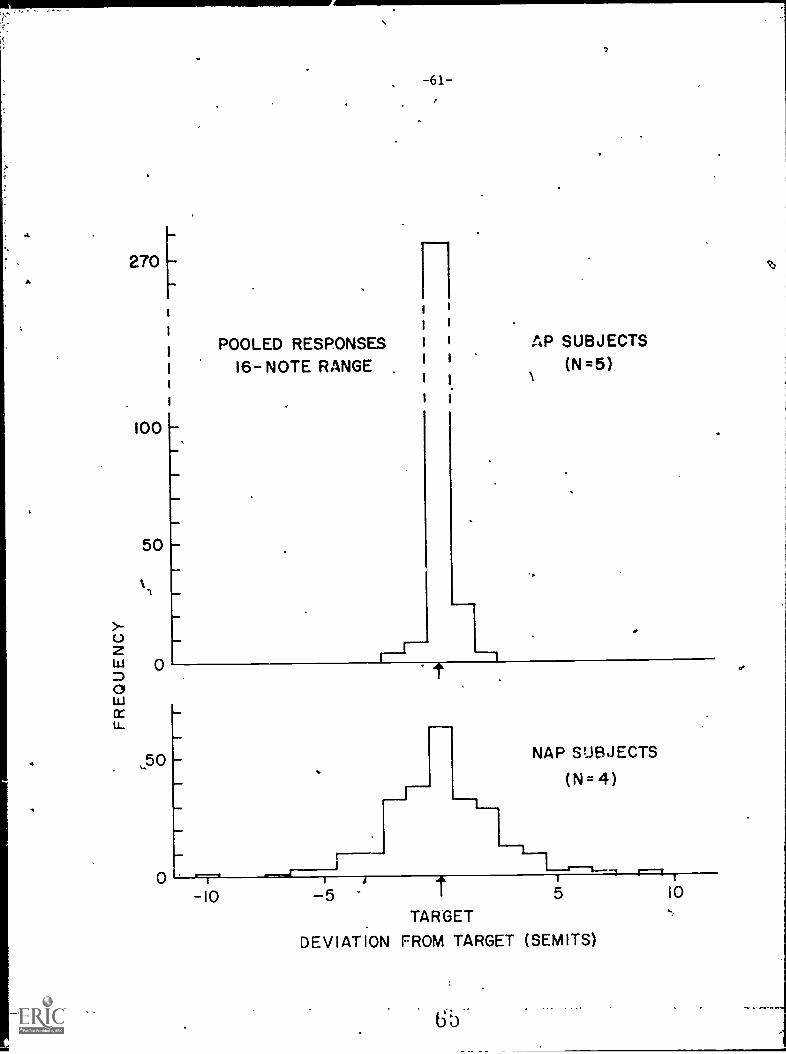
4
A
-61-
270
POOLED RESPONSES AP SUBJECTS
1 16- NOTE RANGE (N = 5)
100
1.
50
0 t
,50 NAP SUBJECTS
(N=4)
0 'I-10 -5 1 5
TARGET
DEVIATION FROM TARGET (SEMITS)
10
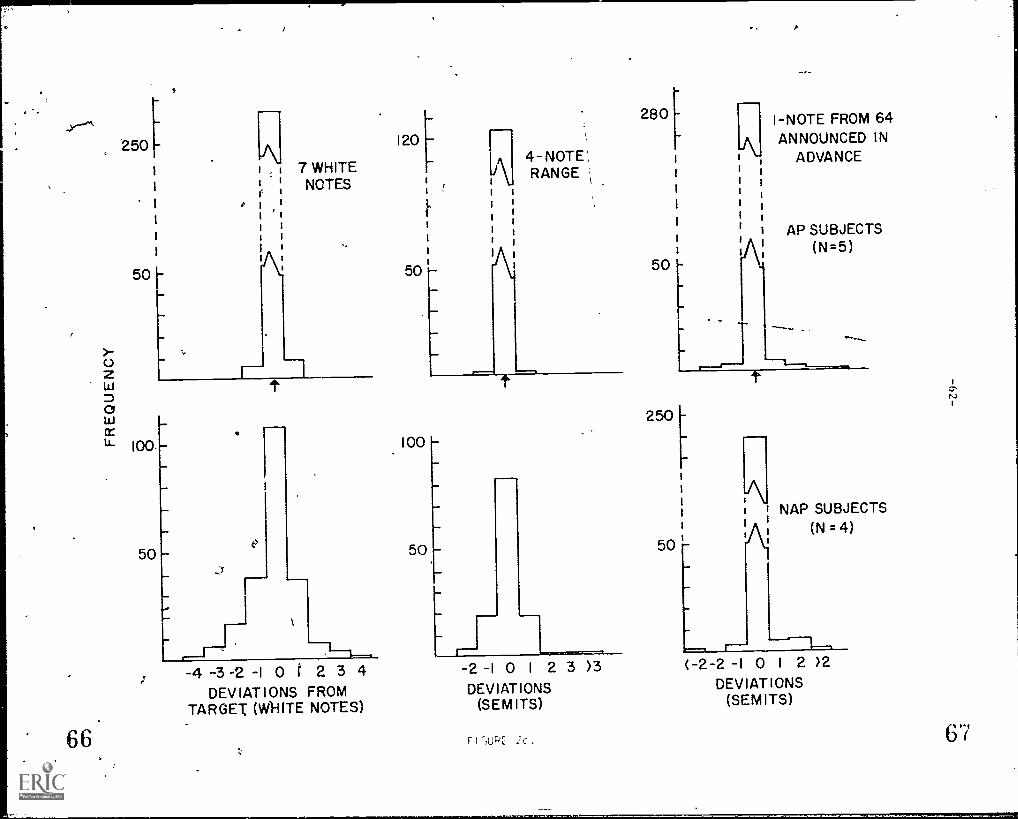
250I I 7 WHITE
NOTES
100
50
i
...
.
Je
120
50
j,..
A
A
t t
\
-4 -3-2 -1 0 r 2 3 4DEVIATIONS FROM
TARGET (WHITE NOTES)
100
50
4-NOTERANGE
,
111
280
1
50
250
50
I-NOTE FROM 64ANNOUNCED IN
ADVANCE
AP SUBJECTS(N=5)
...........
NAP SUBJECTS(N = 4)
- r-- -----1--,-2-1 0 I 2 3 >3 (-2-2 -I 0 I 2 )2DEVIATIONS DEVIATIONS
( SEMITS) (SEMITS)
IHUPE 2c. 67
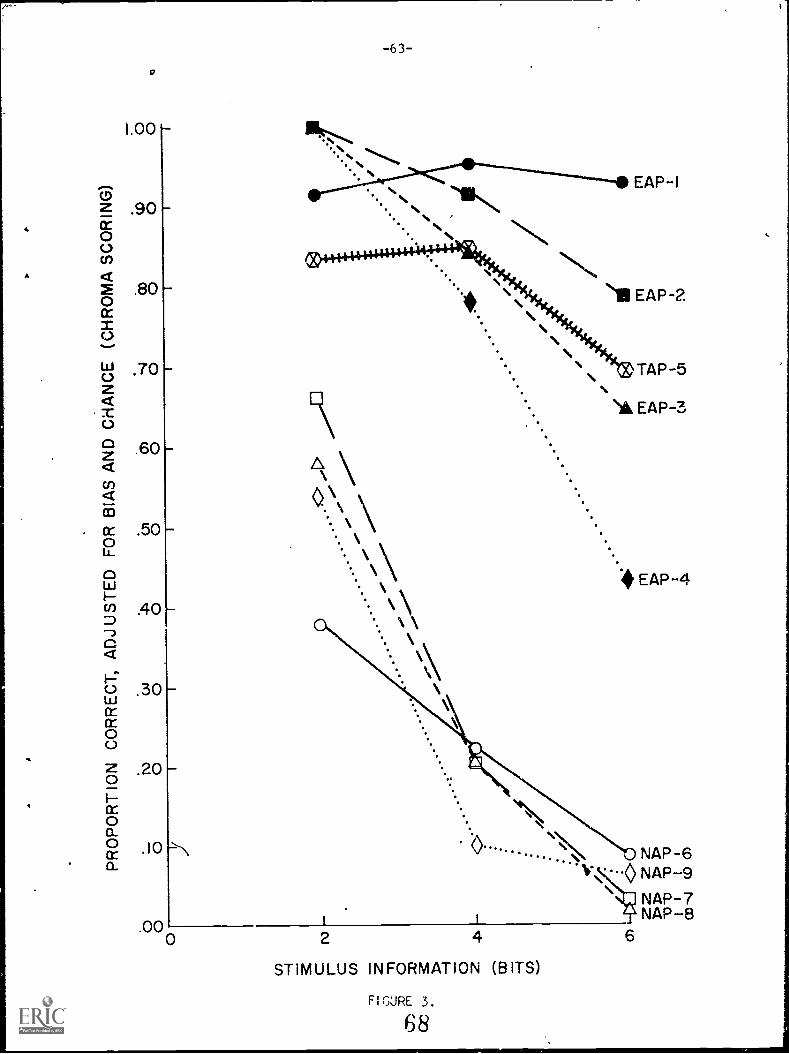
P
A
z0Uco
<MOcc=o
otuz4,T0z4U)4-c/3
cr0u_
c)u.i
cnDG412:0wcrcr00
0z}-crOa.ocra_
v
1.00
.90
.80
.70
.60
.50
.40
.30
.20
.10
.00
...
-\
0
-63-
. NIINe
.. e
EAP-I
\\
TAP-5
'A EAP-3
4 EAP-4
, 0NAP-6
\'..0 NAP-9T. NAP-7
NAP-8I I
62 4
STIMULUS INFORMATION (BITS)
FIGURE 3.
68
,

). ,
1
/
NAP-7NAP-8NAP-9'
2 3 4 5 6
STIMULUS INFORMATION (BIM)
FIGURE 4 .
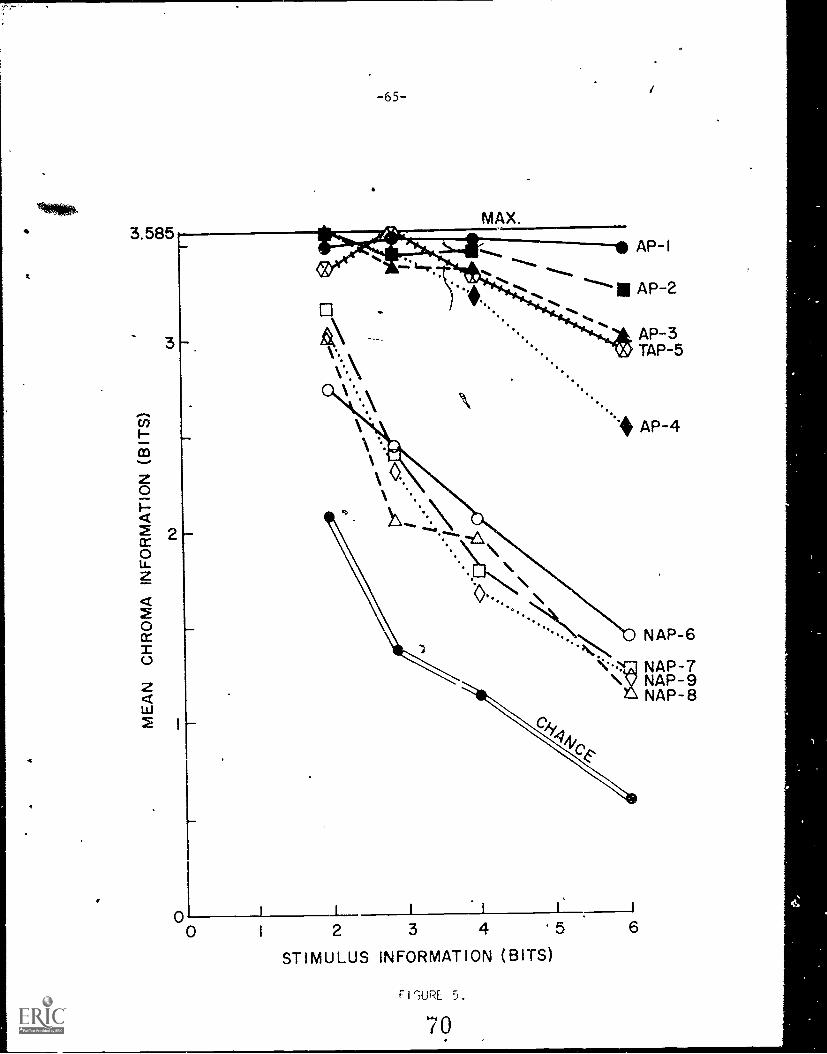
-65-
MAX.
0 1
NAP-6
\VNAP-7NAP-9NAP-8
0 I 2 3 4 .5 6
STIMULUS INFORMATION (BITS)
F I r;URE 5 .
70

3500
x (") 3W0
V3)
cn
o 2500
cc
12000
2Iz
1500
z
Ti)
1000
ca
02cr 500
66
.
0 NAP-9..**
--CI NAP-7EAP-3NAP-6
EAP-4 .
EAP-2EAP-I
A NAP-8
2 3 4 5
STIMULUS INFORMATION (BITS)
F I CURE 6 .
71
6
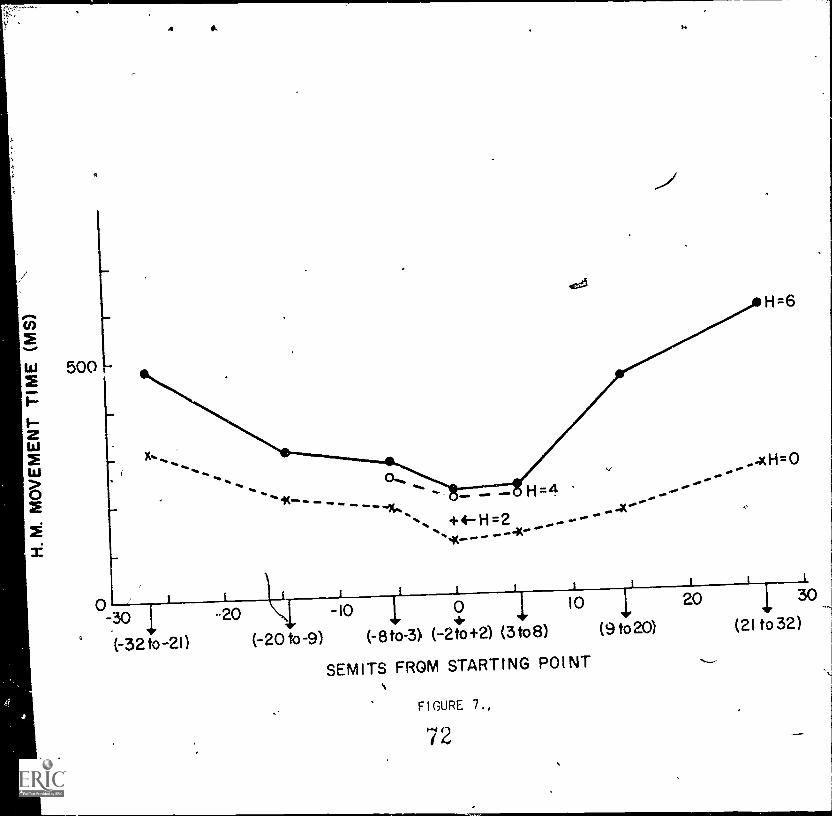
A
41.
moH=4
+4.-H=2
H=6
-30 20 0 30-10 10
(-32to-21)( -20 to -9) (-8to-3) (-2to+2) (3to6) (9t020) (2I to 32)
SEM1TS FROM STARTING POINTs
FIGURE 7 . ,
72

er
Z 5030cn
0x -... .... OM ,
o... ..7....01-1=4- --o-.."-----,---,
+4-H=2
--x -x -x-.-- --x-----
0-30 20 -10
a10 20 i. 30
.1______ t
(-32to-2I) (-2010-9) (-810-3) (-2100 (31o8) (9 tb20) (21 to 32)
SEMITS FROM STARTING POINT
,.
ORD WO .11 .111 ONO OM Milo
H=6
-x H=0
, FIGURE 8 .
73
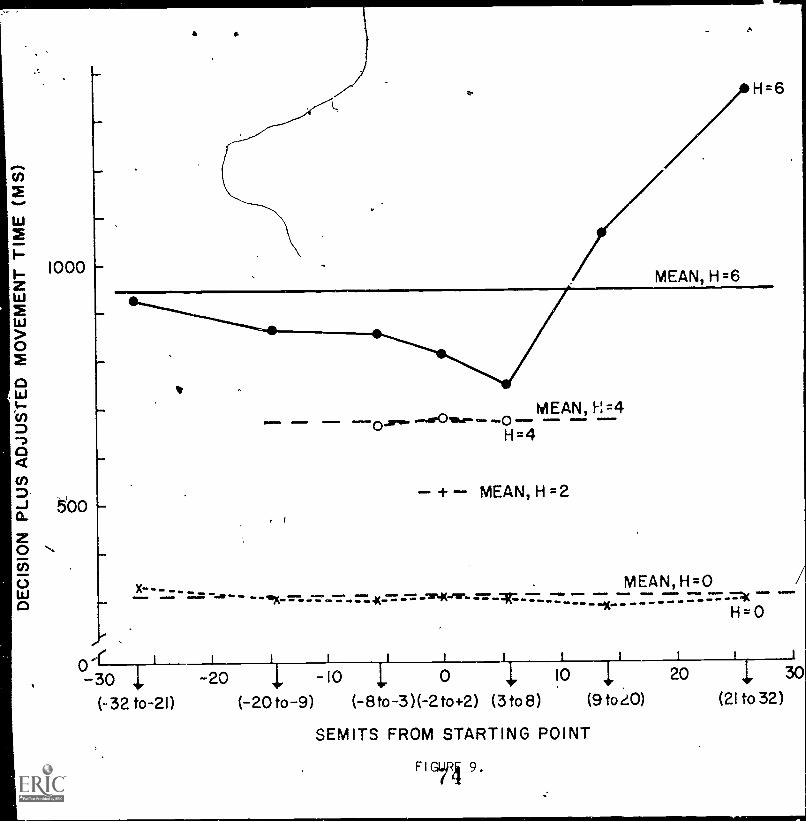
1000 MEAN H=6
H=6
es ea IOWaMaID alaala ode a.
eaMND - MEIN. INOMMI1 0...111.0111141... Oa.MEAN, H=4
H=4
-- +-- MEAN, H =2
OalmeD .110 IFIMMO lala0 .1114,4(.0W6 aaa MOM,
MEAN, H=0OM= 05.0 OnDala
H =0
aonlallo
0--30 -20 -10 0 10 20 30
(-32 to-2I) (-20 to-9) (-8to-3)(-2to+2) (3 to 8) (9 toe0) (21 to 32)
SEM ITS FROM STARTING POINT
FIGIri 9.
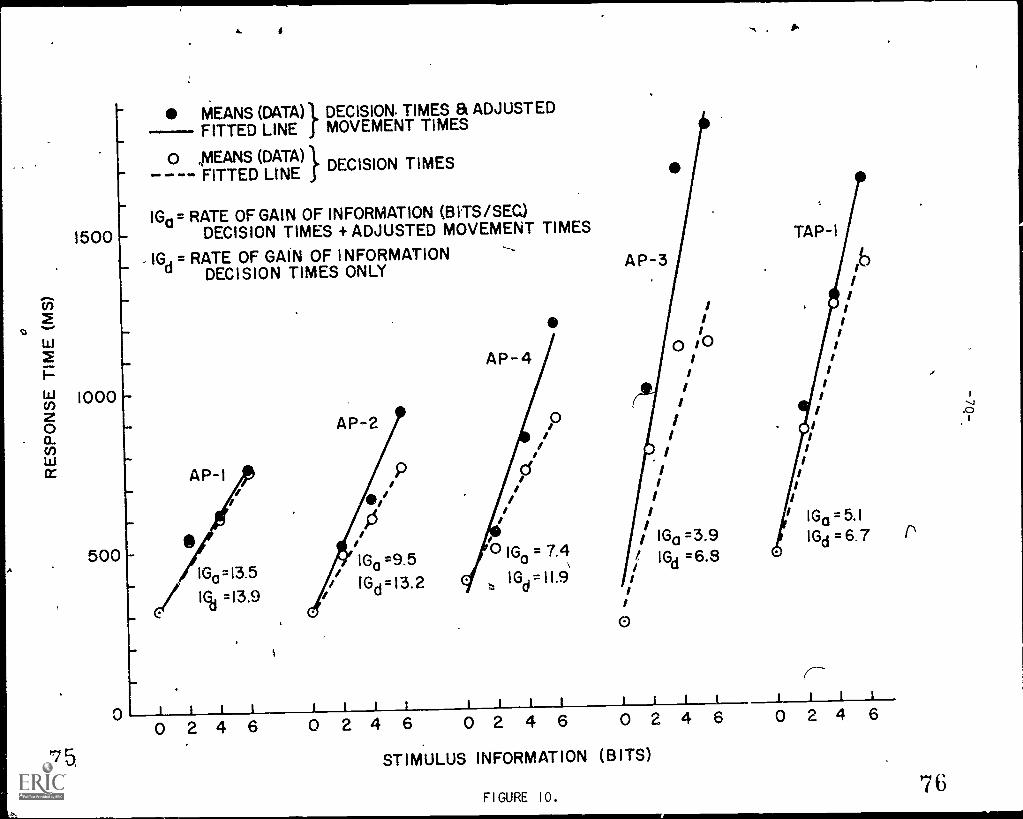
75
MEANS (DATA) } DECISION. TIMES a ADJUSTEDFITTED LINE J MOVEMENT TIMES
0 ,MEANS (DATA)-- FITTED LINE
DECISION TIMES
!Go= RATE OF GAIN OF INFORMATION (BITS/SEC)
1500 DECISION TIMES + ADJUSTED MOVEMENT TIMES
-1Gd = RATE OF GAIN OF INFORMATION---,.
DECISION TIMES ONLY
1000
500
AP-I
0IG0=13.5
iI% =13.9
0 2 4 6
AP-2
AP-3
iI
AP-4 0 :0Iii
r1 I
,i I1
II
I1, IG0 =3.9
0 !Go = 7.4 1 1Gd =6.9IG
d=11 9 I
iiI
II
II
p
0
TAP-I
/II
II
I
I
IiIIiIiII
IG0=5.1IGd =6.7 0
(---I 1 1 l
0 2 4 6 0 2 4 6 0 2 4 6 0 2 4 6
STIMULUS INFORMATION (BITS)
FIGURE 10.
/
'76
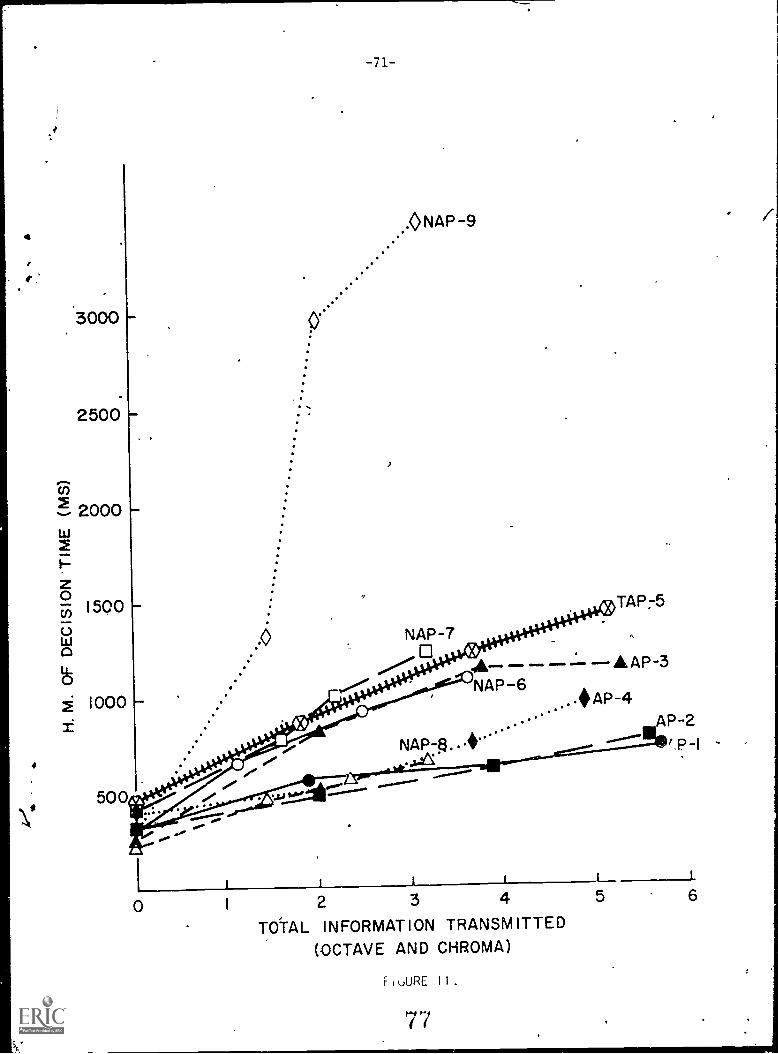
I
4r
4
iti... 2000w2I:::
z(T)
o1500
Uwo
i 1000±
-71-
.0 NAP -9
1 2 3 4 5 6
TOTAL INFORMATION TRANSMITTED(OCTAVE AND CHROMA)
FiuURE II.
77