Embed Size (px)
Citation preview
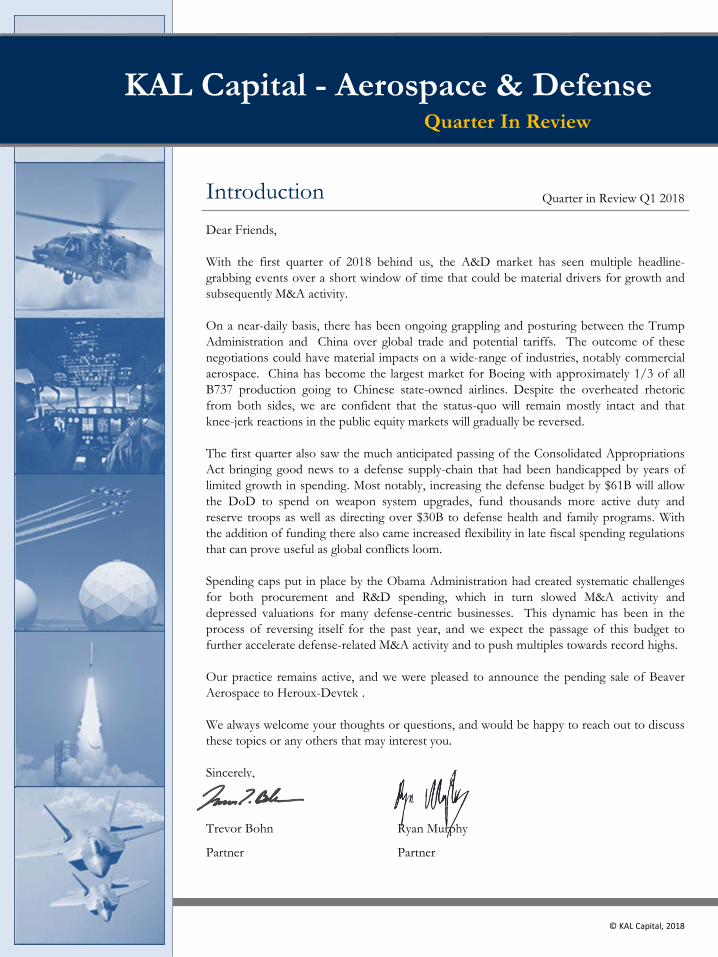
Dear Friends,
With the first quarter of 2018 behind us, the A&D market has seen multiple headline-
grabbing events over a short window of time that could be material drivers for growth and
subsequently M&A activity.
On a near-daily basis, there has been ongoing grappling and posturing between the Trump
Administration and China over global trade and potential tariffs. The outcome of these
negotiations could have material impacts on a wide-range of industries, notably commercial
aerospace. China has become the largest market for Boeing with approximately 1/3 of all
B737 production going to Chinese state-owned airlines. Despite the overheated rhetoric
from both sides, we are confident that the status-quo will remain mostly intact and that
knee-jerk reactions in the public equity markets will gradually be reversed.
The first quarter also saw the much anticipated passing of the Consolidated Appropriations
Act bringing good news to a defense supply-chain that had been handicapped by years of
limited growth in spending. Most notably, increasing the defense budget by $61B will allow
the DoD to spend on weapon system upgrades, fund thousands more active duty and
reserve troops as well as directing over $30B to defense health and family programs. With
the addition of funding there also came increased flexibility in late fiscal spending regulations
that can prove useful as global conflicts loom.
Spending caps put in place by the Obama Administration had created systematic challenges
for both procurement and R&D spending, which in turn slowed M&A activity and
depressed valuations for many defense-centric businesses. This dynamic has been in the
process of reversing itself for the past year, and we expect the passage of this budget to
further accelerate defense-related M&A activity and to push multiples towards record highs.
Our practice remains active, and we were pleased to announce the pending sale of Beaver
Aerospace to Heroux-Devtek .
We always welcome your thoughts or questions, and would be happy to reach out to discuss
these topics or any others that may interest you.
Sincerely,
Trevor Bohn Ryan Murphy
Partner Partner
Quarter in Review Q1 2018Introduction
KAL Capital - Aerospace & DefenseQuarter In Review
© KAL Capital, 2018
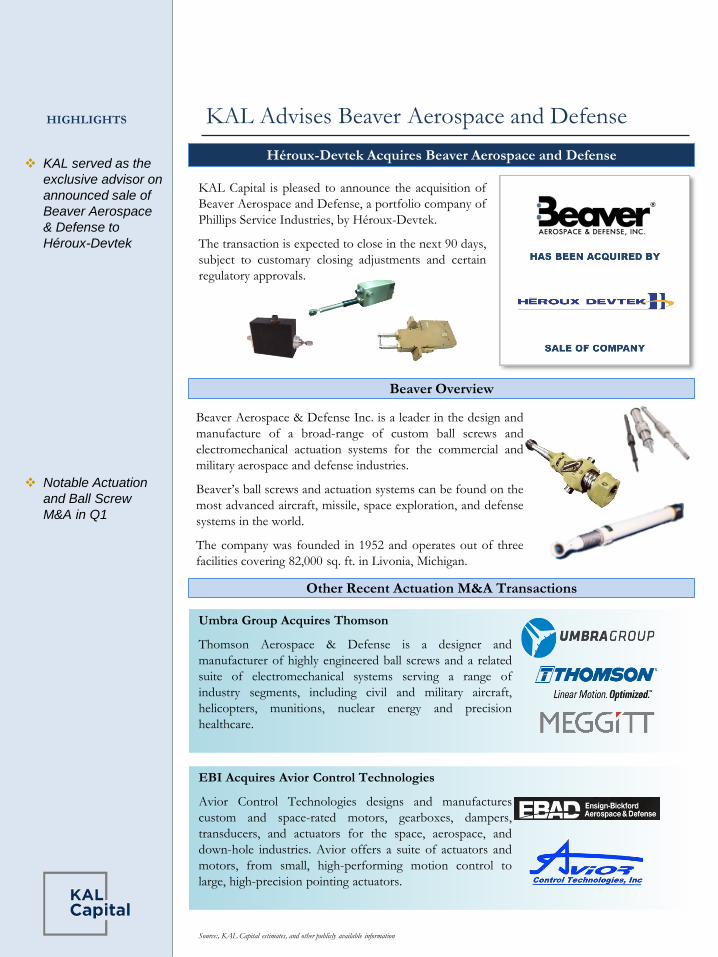
KAL Advises Beaver Aerospace and Defense
Héroux-Devtek Acquires Beaver Aerospace and Defense
HIGHLIGHTS
Beaver Aerospace & Defense Inc. is a leader in the design and
manufacture of a broad-range of custom ball screws and
electromechanical actuation systems for the commercial and
military aerospace and defense industries.
Beaver’s ball screws and actuation systems can be found on the
most advanced aircraft, missile, space exploration, and defense
systems in the world.
The company was founded in 1952 and operates out of three
facilities covering 82,000 sq. ft. in Livonia, Michigan.
Source:, KAL Capital estimates, and other publicly available information
Other Recent Actuation M&A Transactions
❖ KAL served as the
exclusive advisor on
announced sale of
Beaver Aerospace
& Defense to
Héroux-Devtek
❖ Notable Actuation
and Ball Screw
M&A in Q1
Beaver Overview
KAL Capital is pleased to announce the acquisition of
Beaver Aerospace and Defense, a portfolio company of
Phillips Service Industries, by Héroux-Devtek.
The transaction is expected to close in the next 90 days,
subject to customary closing adjustments and certain
regulatory approvals.
Umbra Group Acquires Thomson
Thomson Aerospace & Defense is a designer and
manufacturer of highly engineered ball screws and a related
suite of electromechanical systems serving a range of
industry segments, including civil and military aircraft,
helicopters, munitions, nuclear energy and precision
healthcare.
EBI Acquires Avior Control Technologies
Avior Control Technologies designs and manufactures
custom and space-rated motors, gearboxes, dampers,
transducers, and actuators for the space, aerospace, and
down-hole industries. Avior offers a suite of actuators and
motors, from small, high-performing motion control to
large, high-precision pointing actuators.
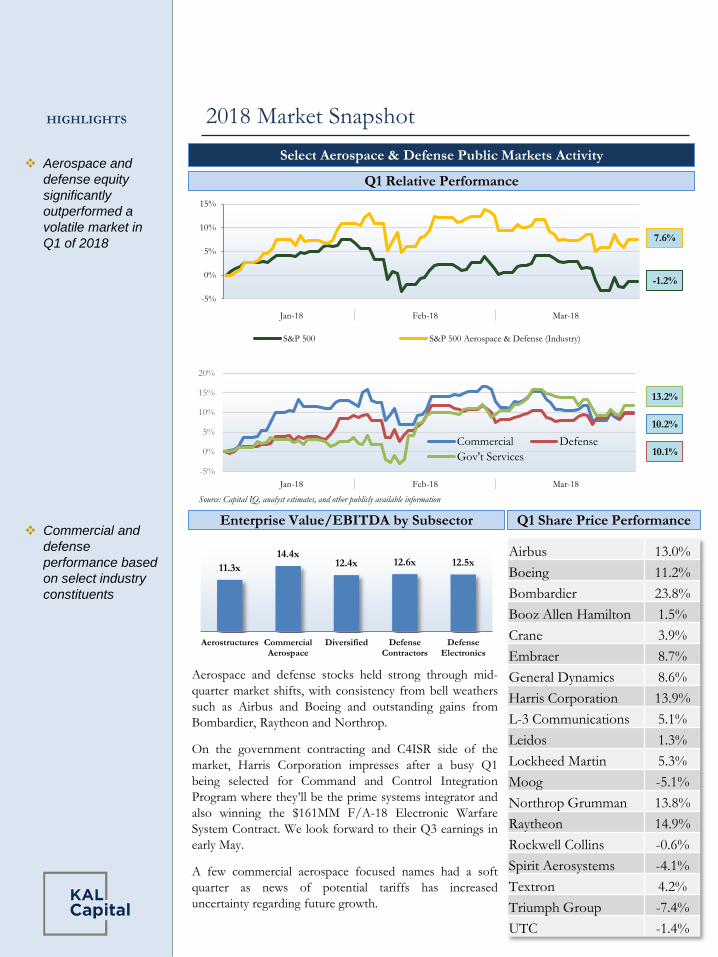
2018 Market Snapshot
Select Aerospace & Defense Public Markets Activity
Q1 Relative Performance
❖ Aerospace and
defense equity
significantly
outperformed a
volatile market in
Q1 of 2018
❖ Commercial and
defense
performance based
on select industry
constituents
HIGHLIGHTS
Source: Capital IQ, analyst estimates, and other publicly available information
Enterprise Value/EBITDA by Subsector Q1 Share Price Performance
Aerospace and defense stocks held strong through mid-
quarter market shifts, with consistency from bell weathers
such as Airbus and Boeing and outstanding gains from
Bombardier, Raytheon and Northrop.
On the government contracting and C4ISR side of the
market, Harris Corporation impresses after a busy Q1
being selected for Command and Control Integration
Program where they’ll be the prime systems integrator and
also winning the $161MM F/A-18 Electronic Warfare
System Contract. We look forward to their Q3 earnings in
early May.
A few commercial aerospace focused names had a soft
quarter as news of potential tariffs has increased
uncertainty regarding future growth.
-1.2%
7.6%
13.2%
10.1%
11.3x
14.4x12.4x 12.6x 12.5x
Aerostructures CommercialAerospace
Diversified DefenseContractors
DefenseElectronics
Airbus 13.0%
Boeing 11.2%
Bombardier 23.8%
Booz Allen Hamilton 1.5%
Crane 3.9%
Embraer 8.7%
General Dynamics 8.6%
Harris Corporation 13.9%
L-3 Communications 5.1%
Leidos 1.3%
Lockheed Martin 5.3%
Moog -5.1%
Northrop Grumman 13.8%
Raytheon 14.9%
Rockwell Collins -0.6%
Spirit Aerosystems -4.1%
Textron 4.2%
Triumph Group -7.4%
UTC -1.4%
-5%
0%
5%
10%
15%
20%
Commercial Defense
Gov't Services
10.2%
Jan-18 Feb-18 Mar-18
-5%
0%
5%
10%
15%
S&P 500 S&P 500 Aerospace & Defense (Industry)
Jan-18 Feb-18 Mar-18
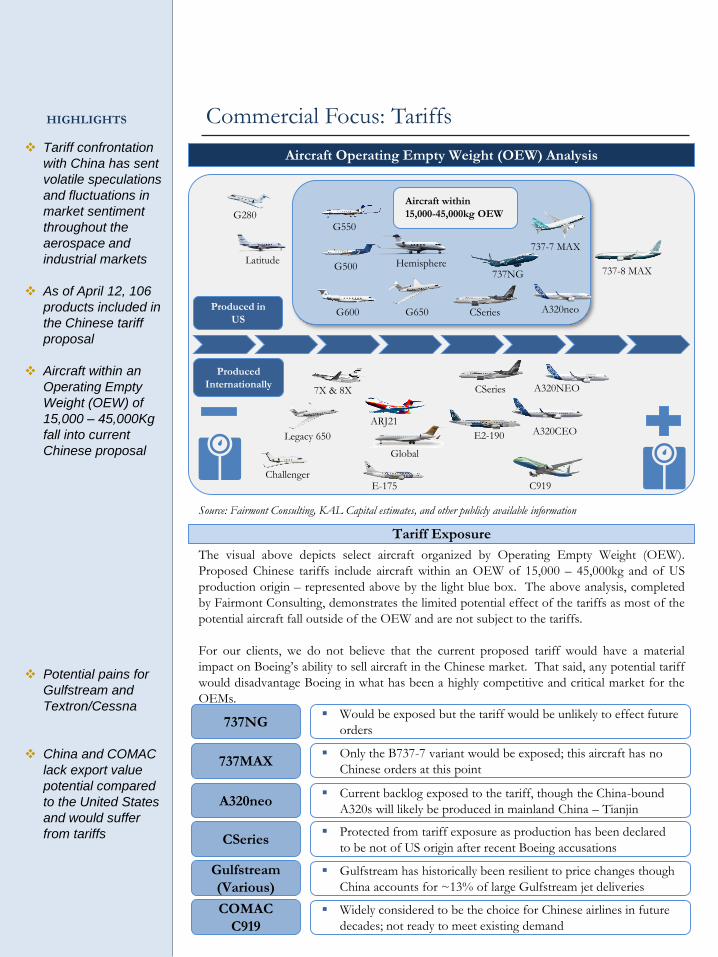
Commercial Focus: Tariffs
Aircraft Operating Empty Weight (OEW) Analysis❖ Tariff confrontation
with China has sent
volatile speculations
and fluctuations in
market sentiment
throughout the
aerospace and
industrial markets
❖ As of April 12, 106
products included in
the Chinese tariff
proposal
❖ Aircraft within an
Operating Empty
Weight (OEW) of
15,000 – 45,000Kg
fall into current
Chinese proposal
❖ Potential pains for
Gulfstream and
Textron/Cessna
❖ China and COMAC
lack export value
potential compared
to the United States
and would suffer
from tariffs
HIGHLIGHTS
Tariff Exposure
Source: Fairmont Consulting, KAL Capital estimates, and other publicly available information
Challenger
Legacy 650
7X & 8X
ARJ21
E-175
Global
E2-190
CSeries
CSeries
A320NEO
A320neo
A320CEO
C919
737-7 MAX
737-8 MAX737NGHemisphere
G650
G500
G600
G550G280
Latitude
Aircraft within
15,000-45,000kg OEW
Produced
Internationally
Produced in
US
CSeries
▪ Would be exposed but the tariff would be unlikely to effect future
orders
COMAC
C919
Gulfstream
(Various)
737NG
A320neo
737MAX▪ Only the B737-7 variant would be exposed; this aircraft has no
Chinese orders at this point
▪ Current backlog exposed to the tariff, though the China-bound
A320s will likely be produced in mainland China – Tianjin
▪ Protected from tariff exposure as production has been declared
to be not of US origin after recent Boeing accusations
▪ Gulfstream has historically been resilient to price changes though
China accounts for ~13% of large Gulfstream jet deliveries
▪ Widely considered to be the choice for Chinese airlines in future
decades; not ready to meet existing demand
The visual above depicts select aircraft organized by Operating Empty Weight (OEW).
Proposed Chinese tariffs include aircraft within an OEW of 15,000 – 45,000kg and of US
production origin – represented above by the light blue box. The above analysis, completed
by Fairmont Consulting, demonstrates the limited potential effect of the tariffs as most of the
potential aircraft fall outside of the OEW and are not subject to the tariffs.
For our clients, we do not believe that the current proposed tariff would have a material
impact on Boeing’s ability to sell aircraft in the Chinese market. That said, any potential tariff
would disadvantage Boeing in what has been a highly competitive and critical market for the
OEMs.
Space-Based SystemsGround-Based Systems
Missiles & Munitions C4I Systems
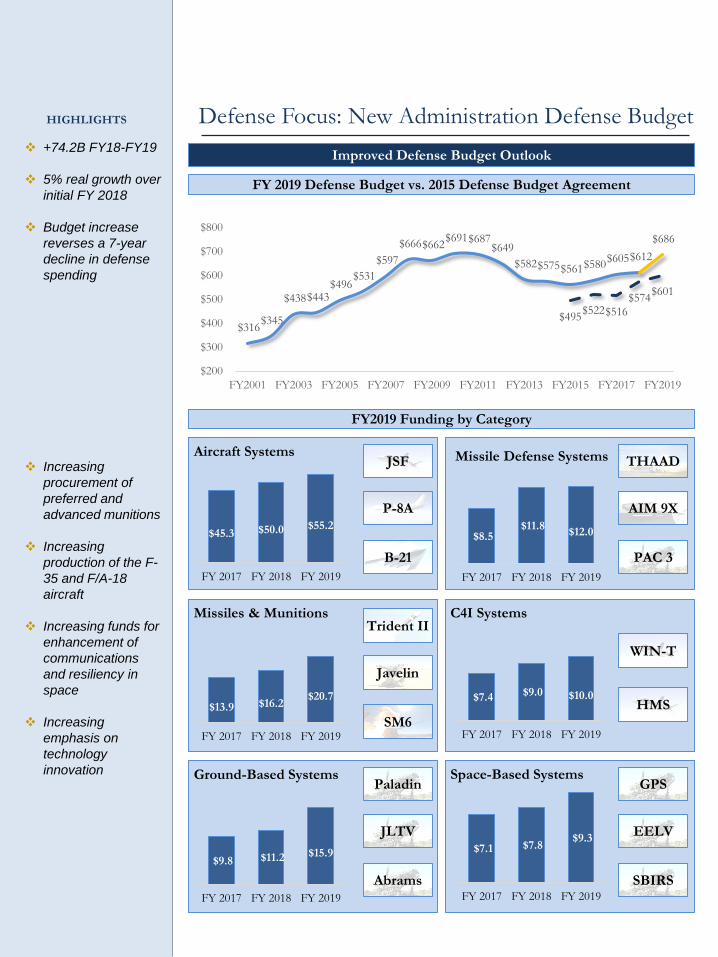
$7.1 $7.8 $9.3
FY 2017 FY 2018 FY 2019
$9.8 $11.2 $15.9
FY 2017 FY 2018 FY 2019
$7.4 $9.0 $10.0
FY 2017 FY 2018 FY 2019
$13.9 $16.2 $20.7
FY 2017 FY 2018 FY 2019
Missile Defense Systems
Defense Focus: New Administration Defense Budget
Improved Defense Budget Outlook❖ +74.2B FY18-FY19
❖ 5% real growth over
initial FY 2018
❖ Budget increase
reverses a 7-year
decline in defense
spending
❖ Increasing
procurement of
preferred and
advanced munitions
❖ Increasing
production of the F-
35 and F/A-18
aircraft
❖ Increasing funds for
enhancement of
communications
and resiliency in
space
❖ Increasing
emphasis on
technology
innovation
HIGHLIGHTS
$316 $345
$438 $443 $496
$531
$597
$666 $662 $691 $687
$649
$582 $575 $561 $580 $605 $612
$686
$495$522$516
$574$601
$200
$300
$400
$500
$600
$700
$800
FY2001 FY2003 FY2005 FY2007 FY2009 FY2011 FY2013 FY2015 FY2017 FY2019
FY 2019 Defense Budget vs. 2015 Defense Budget Agreement
FY2019 Funding by Category
Aircraft Systems
$45.3 $50.0 $55.2
FY 2017 FY 2018 FY 2019
JSF
P-8A
B-21
$8.5 $11.8
$12.0
FY 2017 FY 2018 FY 2019
THAAD
AIM 9X
PAC 3
Javelin
SM6
Trident II
HMS
WIN-T
Abrams
JLTV
Paladin
EELV
SBIRS
GPS

19
19
16
12
11
9
5
3
2
Electronics, Optics & Sensors
C4ISR
Aerostructures
MRO & Aftermarket
Engineering & Consulting
IT & Cybersecurity
Training, Testing & Simulation
Land & Soldier Systems
Marine & Naval Systems
Q1 2018 A&D M&A Deal Activity
Select Aerospace & Defense M&A
Analysis
Deals by End-Market
Source: DACIS, KAL Capital estimates, and other publicly available information
Electronics design and manufacturing and C4ISR services both
remain key priorities for commercial markets and the DoD. We can
expect these categories to continue an upward trajectory over the next
few quarters as the defense budget increases work into the supply
chain.
IT & Cybersecurity has found steady and strong demand from DoD
customers as well as the commercial market space. Growing
international concern for the protection of intellectual property
complimented with a defense budget increases have cybersecurity
services ready for a big year as the Pentagon demands an advantage in
cyber defense, big data analysis, and intelligence systems and
operations.
❖ Strong M&A
presence from
strategic buyers
lead the opening of
2018 for deal flow
❖ Electronics
manufacturers hold
their place as top
M&A priority for
strategic and private
equity buyers
❖ C4ISR services
firms jump to the
top of market M&A
priorities, joining the
longtime favorites of
MRO aftermarket
and aerostructures
businesses
51
2024
Commercial Defense Gov't Services
Deals by Buyer Type
Strate
gic,
72
Private-
Equity, 24
Deals by Product Category
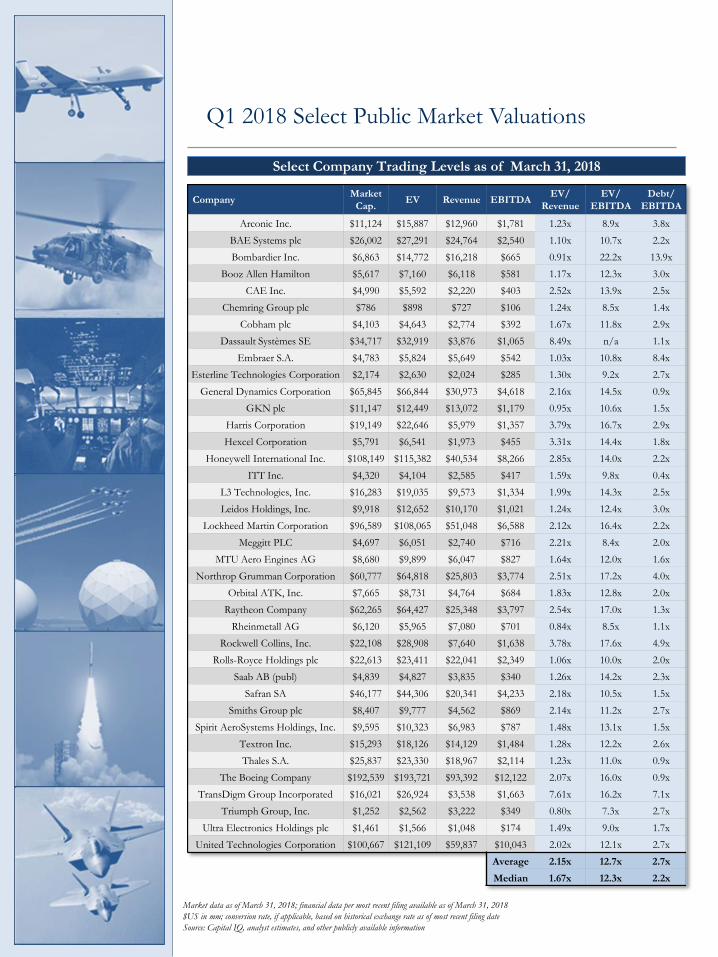
Q1 2018 Select Public Market Valuations
Select Company Trading Levels as of March 31, 2018
CompanyMarket
Cap.EV Revenue EBITDA
EV/
Revenue
EV/
EBITDA
Debt/
EBITDA
Arconic Inc. $11,124 $15,887 $12,960 $1,781 1.23x 8.9x 3.8x
BAE Systems plc $26,002 $27,291 $24,764 $2,540 1.10x 10.7x 2.2x
Bombardier Inc. $6,863 $14,772 $16,218 $665 0.91x 22.2x 13.9x
Booz Allen Hamilton $5,617 $7,160 $6,118 $581 1.17x 12.3x 3.0x
CAE Inc. $4,990 $5,592 $2,220 $403 2.52x 13.9x 2.5x
Chemring Group plc $786 $898 $727 $106 1.24x 8.5x 1.4x
Cobham plc $4,103 $4,643 $2,774 $392 1.67x 11.8x 2.9x
Dassault Systèmes SE $34,717 $32,919 $3,876 $1,065 8.49x n/a 1.1x
Embraer S.A. $4,783 $5,824 $5,649 $542 1.03x 10.8x 8.4x
Esterline Technologies Corporation $2,174 $2,630 $2,024 $285 1.30x 9.2x 2.7x
General Dynamics Corporation $65,845 $66,844 $30,973 $4,618 2.16x 14.5x 0.9x
GKN plc $11,147 $12,449 $13,072 $1,179 0.95x 10.6x 1.5x
Harris Corporation $19,149 $22,646 $5,979 $1,357 3.79x 16.7x 2.9x
Hexcel Corporation $5,791 $6,541 $1,973 $455 3.31x 14.4x 1.8x
Honeywell International Inc. $108,149 $115,382 $40,534 $8,266 2.85x 14.0x 2.2x
ITT Inc. $4,320 $4,104 $2,585 $417 1.59x 9.8x 0.4x
L3 Technologies, Inc. $16,283 $19,035 $9,573 $1,334 1.99x 14.3x 2.5x
Leidos Holdings, Inc. $9,918 $12,652 $10,170 $1,021 1.24x 12.4x 3.0x
Lockheed Martin Corporation $96,589 $108,065 $51,048 $6,588 2.12x 16.4x 2.2x
Meggitt PLC $4,697 $6,051 $2,740 $716 2.21x 8.4x 2.0x
MTU Aero Engines AG $8,680 $9,899 $6,047 $827 1.64x 12.0x 1.6x
Northrop Grumman Corporation $60,777 $64,818 $25,803 $3,774 2.51x 17.2x 4.0x
Orbital ATK, Inc. $7,665 $8,731 $4,764 $684 1.83x 12.8x 2.0x
Raytheon Company $62,265 $64,427 $25,348 $3,797 2.54x 17.0x 1.3x
Rheinmetall AG $6,120 $5,965 $7,080 $701 0.84x 8.5x 1.1x
Rockwell Collins, Inc. $22,108 $28,908 $7,640 $1,638 3.78x 17.6x 4.9x
Rolls-Royce Holdings plc $22,613 $23,411 $22,041 $2,349 1.06x 10.0x 2.0x
Saab AB (publ) $4,839 $4,827 $3,835 $340 1.26x 14.2x 2.3x
Safran SA $46,177 $44,306 $20,341 $4,233 2.18x 10.5x 1.5x
Smiths Group plc $8,407 $9,777 $4,562 $869 2.14x 11.2x 2.7x
Spirit AeroSystems Holdings, Inc. $9,595 $10,323 $6,983 $787 1.48x 13.1x 1.5x
Textron Inc. $15,293 $18,126 $14,129 $1,484 1.28x 12.2x 2.6x
Thales S.A. $25,837 $23,330 $18,967 $2,114 1.23x 11.0x 0.9x
The Boeing Company $192,539 $193,721 $93,392 $12,122 2.07x 16.0x 0.9x
TransDigm Group Incorporated $16,021 $26,924 $3,538 $1,663 7.61x 16.2x 7.1x
Triumph Group, Inc. $1,252 $2,562 $3,222 $349 0.80x 7.3x 2.7x
Ultra Electronics Holdings plc $1,461 $1,566 $1,048 $174 1.49x 9.0x 1.7x
United Technologies Corporation $100,667 $121,109 $59,837 $10,043 2.02x 12.1x 2.7x
Average 2.15x 12.7x 2.7x
Median 1.67x 12.3x 2.2x
Market data as of March 31, 2018; financial data per most recent filing available as of March 31, 2018
$US in mm; conversion rate, if applicable, based on historical exchange rate as of most recent filing date
Source: Capital IQ, analyst estimates, and other publicly available information
This presentation has been prepared by KAL Capital Markets LLC (“KAL Capital”) for the exclusive use of the party to whom KAL Capital delivers this
presentation (together with its subsidiaries and affiliates, the “Recipient”) using publicly available information. KAL Capital has not independently verified the
information contained herein, nor does Salem make any representation or warranty, either express or implied, as to the accuracy, completeness or reliability of the
information contained in this presentation, or any other information (whether communicated in written or oral form) transmitted to or made available to the
Recipient. Any estimates or projections as to events that may occur in the future (including projections of revenue, expense, net income and stock performance) are
based on publicly available information as of the date of this presentation. There is no guarantee that any of these estimates or projections will be achieved. Actual
results will vary from the projections and such variations may be material. Nothing contained herein is, or shall be relied upon as, a promise or representation as to
the past or future. KAL Capital expressly disclaims any and all liability relating to or resulting from the use of this presentation.
This presentation has been prepared solely for informational purposes and is not to be construed as a solicitation or an offer to buy or sell any securities or related
financial instruments. The Recipient should not construe the contents of this presentation as legal, tax, accounting or investment advice or a recommendation. The
Recipient is urged to consult its own counsel, tax and financial advisors as to legal and related matters concerning any information described herein. This
presentation does not purport to be all-inclusive or to contain all of the information that the Recipient may require. No investment, divestment or other financial
decisions or actions should be based solely on the information in this presentation. The Recipient should not rely on any information contained herein.
This presentation has been prepared on a confidential basis solely for the use and benefit of the Recipient. The Recipient agrees that the information contained
herein and in all related and ancillary documents is not to be used for any other purpose, that such information is of a confidential nature and that Recipient will
treat it in a confidential manner. Distribution of this presentation to any person other than the Recipient and those persons retained to advise the Recipient who
agree to maintain the confidentiality of this material and be bound by the limitations outlined herein, is unauthorized without the prior consent of KAL Capital. This
material must not be copied, reproduced, distributed or passed to others at any time without the prior written consent of KAL Capital.
Trevor Bohn
Partner
(949) 404-4203
Ryan Murphy
Partner
(949) 404-4204
100 West Broadway
Suite 205
Long Beach, CA 90802
www.kalcap.com
P: (949) 404-4201