Embed Size (px)
Citation preview
RIDE IN KANE SPONSORS
Association for Individual Development
Aurora Township Batavia Township
Blackberry Township
Campton Township City of Batavia
City of Elgin
City of Geneva City of St. Charles
Dundee Township Partners
(East Dundee, Dundee Township & Sleepy Hollow)
Elgin Township
Hesed House INC Board NFP
Kane County
Kaneville Township Pace Suburban Bus
St. Charles Township
Senior Services Associates
Village of Campton Hills
Village of Gilberts Village of South Elgin
KANE COUNTY PARATRANSIT COORDINATING COUNCIL
JIM ANDERSON-Council Chair
TRISH GLEES– Council Vice Chair BILL CATCHING—Council Vice Chair
41W011 Burlington Road
St. Charles, IL 60175
Phone:630-584-1170
Fax:630-584-5265
Kane County Paratransit Coordinating Council (KCPCC)
Agenda
Tuesday, December 4, 2018 9:00 a.m.
I. Opening Of Meeting
A. Introductions B. Approval of Meeting Minutes from September 4, 2018
II. Sub-Committee Reports
A. Membership Committee B. Consumer Advisory Committee C. Ride in Kane Committee
III. Other Business A. 2019 Meeting Schedule
Tuesday, March 5th Tuesday, June 4th Tuesday, September 10th (week after Labor Day) Tuesday, December 3rd
IV. Public Comment
V. Adjournment
KCPCC members are welcome to attend the RIK Sponsor Committee meeting which is held immediately after the Coordinating Council meeting
The meeting will be held at the Kane County Government Center Auditorium, Building A
719 S. Batavia Avenue, Geneva, IL 60134 (630)232-3400
The next meeting of the Kane County Paratransit Coordinating Council will be held Tuesday, March 5, 2019, 9:00 a.m. at the Kane County Government Center
Auditorium, 719 S. Batavia Avenue, Geneva 60134.
RIDE IN KANE SPONSORS
Association for Individual Development
Aurora Township Batavia Township
Blackberry Township
Campton Township City of Batavia
City of Elgin
City of Geneva City of St. Charles
Dundee Township Elgin Township
Hesed House
INC Board NFP Kane County
Pace Suburban Bus
Senior Services Associates St. Charles Township
Sugar Grove Township
Village of South Elgin
KANE COUNTY PARATRANSIT COORDINATING COUNCIL
JIM ANDERSON — Council Chair TRISH GLEES — Council Vice Chair
BILL CATCHING — Council Vice Chair
41W011 Burlington Road
St. Charles, IL 60175
Phone:630-584-1170
Fax:630-584-5265
Kane County Paratransit Coordinating Council MEETING MINUTES September 4, 2018
The meeting was called to order at 11:01 am by Jim Anderson, Council Chair. Introduc-tions were made. Upon a motion for approval made by Trish Glees and seconded by Franklin Ramirez, the March 6, 2018 meeting minutes were approved. Sub-Committee Reports: Membership Committee: All in attendance were present at the RIK Sponsor Meeting which was held immediately prior to this one, all new business was covered at that meeting. Consumer Advisory Committee: Nothing to report. Ride In Kane Committee: All in attendance were present at the RIK Sponsor Meeting which was held immediately prior to this one, all new business was covered at that meeting. Other Business: It was recommended to conduct the Kane County Paratransit Coordinating Council meeting before the RIK Sponsor Meeting on a quarterly basis. Upon a motion for approval made by Trish Glees and seconded by Franklin Ramirez, the KCPCC meeting will be held prior to the RIK Sponsor Meeting with a 9am start effective with the December meeting was ap-proved. Public Comment: There was no public comment. The meeting was adjourned by unanimous consent at 11:09 am.
In Attendance: Jackie Forbes, Kane County DOT Ryan Peterson, Kane County DOT Lynn O’Shea, AID Krystal Spracklen, AID Tricia Skibley, AID Jim Anderson, Batavia Township Trish Glees, Dundee Township Ruth Rottmann, Campton Township Peggy Gomez, Senior Services
Franklin Ramirez, Elgin Township Chris Ranney, Geneva Ron Johnson, St. Charles Township Lauren Blayney, South Elgin Fluturi Demirovski, RTA Rahman Burton, RTA Jim Mullaghy, PACE Amanda Gettes, PACE
RIDE IN KANE SPONSORS
Association for Individual Development
Aurora Township Batavia Township
Blackberry Township
Campton Township City of Batavia
City of Elgin
City of Geneva City of St. Charles
Dundee Township Elgin Township
Hesed House
INC Board NFP Kane County
Pace Suburban Bus
Senior Services Associates St. Charles Township
Sugar Grove Township
Village of South Elgin
KANE COUNTY PARATRANSIT COORDINATING COUNCIL
JIM ANDERSON-Council Chair TRISH GLEES– Council Vice Chair
BILL CATCHING—Council Vice Chair
41W011 Burlington Road
St. Charles, IL 60175
Phone:630-584-1170
Fax:630-584-5265
Ride In Kane Sponsor Committee
Meeting Agenda Tuesday, December 4, 2018
9:30 a.m. I. Opening of Meeting A. Call to Order Jim Anderson B. Introductions C. Approval of September 5, 2018 Meeting Minutes II. Ride In Kane Program Status Reports A. Registration and Ridership Reports J. Mullaghy B. Customer Feedback Report J. Mullaghy C. NF and JARC Budget Report/Billings K Spracklen III. Other Business A. RTA updates R Burton B. Riders Guide Update J Forbes C. 2019 Meeting Schedule
Tuesday, March 5th Tuesday, June 4th Tuesday, September 10th (week after Labor Day) Tuesday, December 3rd
IV. Public Comment
V. Adjournment
The meeting will be held at the Kane County Government Center Auditorium, Building A
719 S. Batavia Avenue, Geneva, IL 60134 – (630)232-3400
The next meeting of the Ride in Kane Sponsors Committee will be held Tuesday March 5, 2019 10:00 a.m. at the Kane County Government Center
Auditorium, 719 S. Batavia Avenue, Geneva 60134.
RIDE IN KANE SPONSORS
Association for Individual Development
Aurora Township Batavia Township
Blackberry Township
Campton Township City of Batavia
City of Elgin
City of Geneva City of St. Charles
Dundee Township Elgin Township
Hesed House
INC Board NFP Kane County
Pace Suburban Bus
Senior Services Associates St. Charles Township
Sugar Grove Township
Village of South Elgin
KANE COUNTY PARATRANSIT COORDINATING COUNCIL
JIM ANDERSON—Council Chair TRISH GLEES—Council Vice Chair
BILL CATCHING—Council Vice Chair
41W011 Burlington Road
St. Charles, IL 60175
Phone:630-584-1170
Fax:630-584-5265
Ride In Kane Sponsor Committee Meeting MEETING MINUTES September 4, 2018
The meeting was called to order at 9:01 am by Jim Anderson, Council Chair. Introductions were made. Upon a motion for approval made by Trish Glees and seconded by Franklin Ramirez, the June 5, 2018 meeting minutes were approved. RIK PROGRAM STATUS REPORTS: Registration and Ridership Reports and Customer Complaint Records: Jim Mullagy formally introduced himself as the new project manager for RIK. He stated that there will be more taxi contractors added to the RIK program within the next couple of months. We currently use 303, Freedom First, and 1
st Choice. The goal is to improve the
overall performance of the taxi vendors. Jim presented the RIK Ridership growth report which included the Productivity Data and Costs for review and discussion. No additional comments were made. Jim distributed the Customer Complaint report and introduced Amanda Gettes, who over-sees the RIK quality assurance department. Amanda recommends that all riders contact the Customer Relations Complaint line to formally document a complaint. After they file a complaint then they can call the sponsor to escalate it. The complaint is entered into the system and forwarded to the quality assurance department. The quality assurance depart-ment investigates the complaint. Amanda said there is approximately a 3 week turnaround to receive a follow up call from Pace. Trish stated that none of her riders have received a follow up call from Pace. Amanda said that the complaint department provides a resolution script to customer relations, who then contacts the rider. There was discussion on whether a rider with caller id will answer an unknown call. Lynn asked if the phone number that would display on caller id be incorporated into the complaint process sheet. Amanda was unsure what phone number would display or it could be more than one specific number used. 5310 and JARC Budget Report: Krystal referred to the Grant Fund total and Sponsor Cost spreadsheets in the agenda packet for review and discussion. Krystal noted an increase in the cost per trip year over year. The objective is to be around the $28 cost per trip and we are experiencing an uptick with an average of $29.82 cost per trip. She is looking into the overall increase. JARC rides are averaging a monthly cost of $26,246.38. There is enough JARC money remaining to last until 2/2023, still in Phase 7/8, not even into 9/10 yet. 5310 rides are averaging a monthly cost of $68,562.36. We are currently in Phase 13/14. There are enough 5310 funds (Phase 15/16) to last until 10/2021. Krystal referred to Nelson Nygaard reports in the agenda packet for review and discussion. Krystal noted no significant change since last meeting.
In Attendance:
Jackie Forbes, Kane County DOT Ryan Peterson, Kane County DOT Lynn O’Shea, AID Krystal Spracklen, AID Tricia Skibley, AID Jim Anderson, Batavia Township Jennifer Fox, Batavia Fred Dornback, Blackberry Township Trish Glees, Dundee Township Ruth Rottmann, Campton Township Peggy Gomez, Senior Services
Franklin Ramirez, Elgin Township Chris Ranney, Geneva Ron Johnson, St. Charles Township Sharon Bober, St. Charles Township Lauren Blayney, South Elgin Collette Jordan, NEIAAA Fluturi Demirovski, RTA Rahman Burton, RTA Jim Mullaghy, PACE Amanda Gettes, PACE
OTHER BUSINESS: Pace Meeting Recap: A meeting was held at AID on July 17, 2018, between Pace representatives and AID along with specific sponsors who have seen an increase in ridership complaints and service disruptions. It was also a formal meeting to introduce Jim Mullaghy, the new RIK project manager. A copy of the meeting minutes are included in the agenda packet for review. One of the handouts given at the meeting was Pace’s Complaint Process. As noted above, Trish questioned the response time to re-spond to the rider’s complaint. Specifically, the process states in line item # 4 - the Contractor has 3 business days to re-spond. Sponsors understand that means the bus or taxi provider has 3 business days to respond to Pace, but riders may interpret that as 3 business days for Pace to respond to the rider. Also noted was line item # 6 doesn’t list a specific time frame to respond to the rider. Amanda will remove line item # 4 and add a general time frame to respond to riders regarding line item # 6. GoGo Grandparent: Provides door to door rides to anyone. Just another ride option for users who aren’t smart phone equipped or savvy. This allows you to request a ride via a phone call. Cheaper than a taxi service but more expensive than RIK. It also provides the whereabouts of rider to guardian or caregiver. Additional information regarding this service is included in the agenda packet. RTA Updates: Fluturi Demirovski stated that the next Call for Projects will be Spring 2019. Title VI: Krystal received a letter from the RTA requesting the Title VI plan review and update. She is currently reviewing and making updates as needed. Updates include but not limited to: 2010 census results, updated board and sponsor information, and formatting modifications. Once she completes the updates within 45 days from the date of the RTA letter, the Title VI plan is sent to the RTA. RTA will review and provide comments regarding the plan. Krystal will review and update comments and then submit to AID board for approval. She reminded the sponsors to make sure the RIK notice is posted where RIK applica-tions are accepted, RIK website and Riders Guide. Riders Guide Update: Jackie presented the updated version of the Riders Guide. She will sent an editable copy to all sponsors so they can modify to meet their specific restrictions or requirements. She will also request the Kane County’s IT department convert the guide into Spanish as well as update the website to have google translate available. New Sponsors: Fred Dornback stated that the Village of Elburn will not be joining the RIK program at this time. They did not budget money for the current fiscal year for this service. They will consider becoming a sponsor the next fiscal year. Public Comment: There was no public comment. The meeting was adjourned by unanimous consent at 11:00 am.
Current Year:
2018
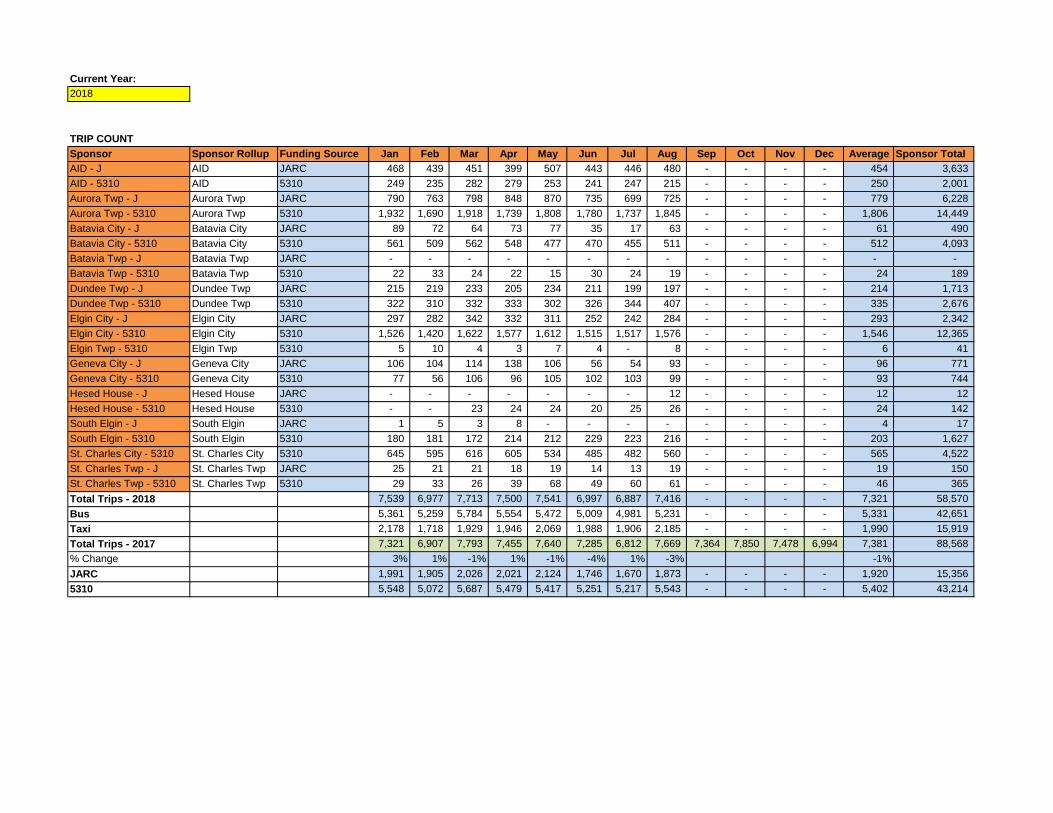
TRIP COUNT
Sponsor Sponsor Rollup Funding Source Jan Feb Mar Apr May Jun Jul Aug Sep Oct Nov Dec Average Sponsor Total
AID - J AID JARC 468 439 451 399 507 443 446 480 - - - - 454 3,633
AID - 5310 AID 5310 249 235 282 279 253 241 247 215 - - - - 250 2,001
Aurora Twp - J Aurora Twp JARC 790 763 798 848 870 735 699 725 - - - - 779 6,228
Aurora Twp - 5310 Aurora Twp 5310 1,932 1,690 1,918 1,739 1,808 1,780 1,737 1,845 - - - - 1,806 14,449
Batavia City - J Batavia City JARC 89 72 64 73 77 35 17 63 - - - - 61 490
Batavia City - 5310 Batavia City 5310 561 509 562 548 477 470 455 511 - - - - 512 4,093
Batavia Twp - J Batavia Twp JARC - - - - - - - - - - - - - -
Batavia Twp - 5310 Batavia Twp 5310 22 33 24 22 15 30 24 19 - - - - 24 189
Dundee Twp - J Dundee Twp JARC 215 219 233 205 234 211 199 197 - - - - 214 1,713
Dundee Twp - 5310 Dundee Twp 5310 322 310 332 333 302 326 344 407 - - - - 335 2,676
Elgin City - J Elgin City JARC 297 282 342 332 311 252 242 284 - - - - 293 2,342
Elgin City - 5310 Elgin City 5310 1,526 1,420 1,622 1,577 1,612 1,515 1,517 1,576 - - - - 1,546 12,365
Elgin Twp - 5310 Elgin Twp 5310 5 10 4 3 7 4 - 8 - - - - 6 41
Geneva City - J Geneva City JARC 106 104 114 138 106 56 54 93 - - - - 96 771
Geneva City - 5310 Geneva City 5310 77 56 106 96 105 102 103 99 - - - - 93 744
Hesed House - J Hesed House JARC - - - - - - - 12 - - - - 12 12
Hesed House - 5310 Hesed House 5310 - - 23 24 24 20 25 26 - - - - 24 142
South Elgin - J South Elgin JARC 1 5 3 8 - - - - - - - - 4 17
South Elgin - 5310 South Elgin 5310 180 181 172 214 212 229 223 216 - - - - 203 1,627
St. Charles City - 5310 St. Charles City 5310 645 595 616 605 534 485 482 560 - - - - 565 4,522
St. Charles Twp - J St. Charles Twp JARC 25 21 21 18 19 14 13 19 - - - - 19 150
St. Charles Twp - 5310 St. Charles Twp 5310 29 33 26 39 68 49 60 61 - - - - 46 365
Total Trips - 2018 7,539 6,977 7,713 7,500 7,541 6,997 6,887 7,416 - - - - 7,321 58,570
Bus 5,361 5,259 5,784 5,554 5,472 5,009 4,981 5,231 - - - - 5,331 42,651
Taxi 2,178 1,718 1,929 1,946 2,069 1,988 1,906 2,185 - - - - 1,990 15,919
Total Trips - 2017 7,321 6,907 7,793 7,455 7,640 7,285 6,812 7,669 7,364 7,850 7,478 6,994 7,381 88,568
% Change 3% 1% -1% 1% -1% -4% 1% -3% -1%
JARC 1,991 1,905 2,026 2,021 2,124 1,746 1,670 1,873 - - - - 1,920 15,356
5310 5,548 5,072 5,687 5,479 5,417 5,251 5,217 5,543 - - - - 5,402 43,214
Current Year:
2018
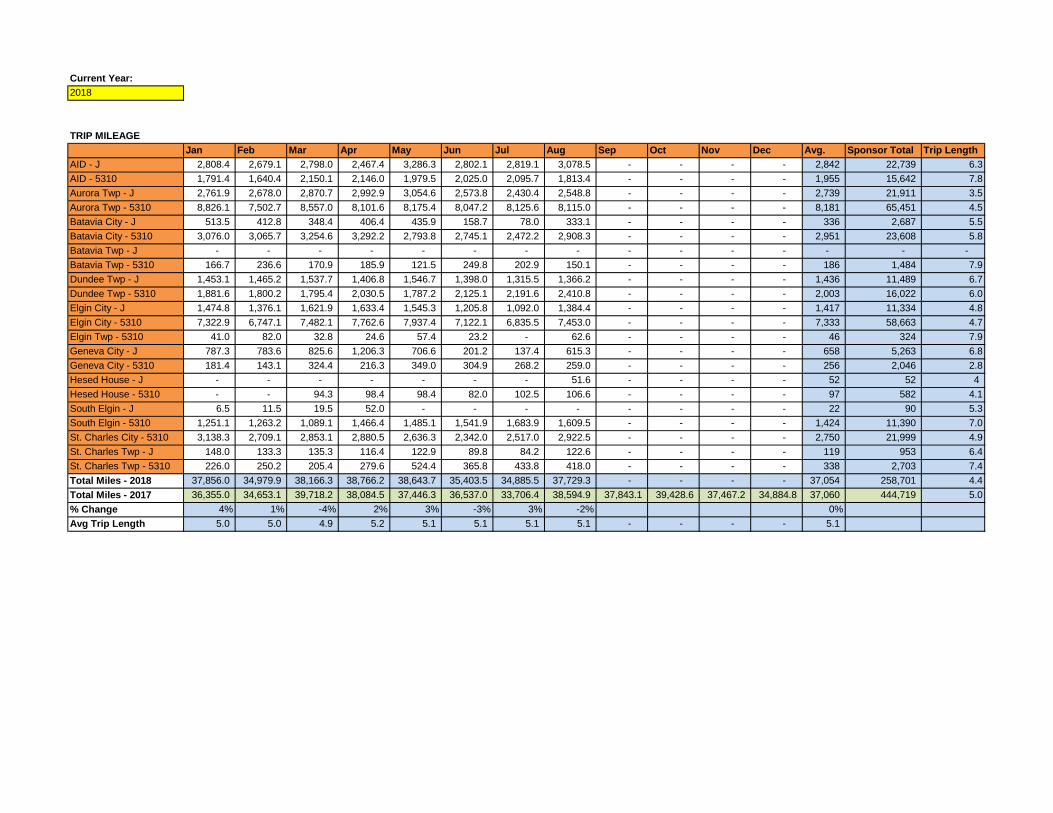
TRIP MILEAGE
Jan Feb Mar Apr May Jun Jul Aug Sep Oct Nov Dec Avg. Sponsor Total Trip Length
AID - J 2,808.4 2,679.1 2,798.0 2,467.4 3,286.3 2,802.1 2,819.1 3,078.5 - - - - 2,842 22,739 6.3
AID - 5310 1,791.4 1,640.4 2,150.1 2,146.0 1,979.5 2,025.0 2,095.7 1,813.4 - - - - 1,955 15,642 7.8
Aurora Twp - J 2,761.9 2,678.0 2,870.7 2,992.9 3,054.6 2,573.8 2,430.4 2,548.8 - - - - 2,739 21,911 3.5
Aurora Twp - 5310 8,826.1 7,502.7 8,557.0 8,101.6 8,175.4 8,047.2 8,125.6 8,115.0 - - - - 8,181 65,451 4.5
Batavia City - J 513.5 412.8 348.4 406.4 435.9 158.7 78.0 333.1 - - - - 336 2,687 5.5
Batavia City - 5310 3,076.0 3,065.7 3,254.6 3,292.2 2,793.8 2,745.1 2,472.2 2,908.3 - - - - 2,951 23,608 5.8
Batavia Twp - J - - - - - - - - - - - - - - -
Batavia Twp - 5310 166.7 236.6 170.9 185.9 121.5 249.8 202.9 150.1 - - - - 186 1,484 7.9
Dundee Twp - J 1,453.1 1,465.2 1,537.7 1,406.8 1,546.7 1,398.0 1,315.5 1,366.2 - - - - 1,436 11,489 6.7
Dundee Twp - 5310 1,881.6 1,800.2 1,795.4 2,030.5 1,787.2 2,125.1 2,191.6 2,410.8 - - - - 2,003 16,022 6.0
Elgin City - J 1,474.8 1,376.1 1,621.9 1,633.4 1,545.3 1,205.8 1,092.0 1,384.4 - - - - 1,417 11,334 4.8
Elgin City - 5310 7,322.9 6,747.1 7,482.1 7,762.6 7,937.4 7,122.1 6,835.5 7,453.0 - - - - 7,333 58,663 4.7
Elgin Twp - 5310 41.0 82.0 32.8 24.6 57.4 23.2 - 62.6 - - - - 46 324 7.9
Geneva City - J 787.3 783.6 825.6 1,206.3 706.6 201.2 137.4 615.3 - - - - 658 5,263 6.8
Geneva City - 5310 181.4 143.1 324.4 216.3 349.0 304.9 268.2 259.0 - - - - 256 2,046 2.8
Hesed House - J - - - - - - - 51.6 - - - - 52 52 4
Hesed House - 5310 - - 94.3 98.4 98.4 82.0 102.5 106.6 - - - - 97 582 4.1
South Elgin - J 6.5 11.5 19.5 52.0 - - - - - - - - 22 90 5.3
South Elgin - 5310 1,251.1 1,263.2 1,089.1 1,466.4 1,485.1 1,541.9 1,683.9 1,609.5 - - - - 1,424 11,390 7.0
St. Charles City - 5310 3,138.3 2,709.1 2,853.1 2,880.5 2,636.3 2,342.0 2,517.0 2,922.5 - - - - 2,750 21,999 4.9
St. Charles Twp - J 148.0 133.3 135.3 116.4 122.9 89.8 84.2 122.6 - - - - 119 953 6.4
St. Charles Twp - 5310 226.0 250.2 205.4 279.6 524.4 365.8 433.8 418.0 - - - - 338 2,703 7.4
Total Miles - 2018 37,856.0 34,979.9 38,166.3 38,766.2 38,643.7 35,403.5 34,885.5 37,729.3 - - - - 37,054 258,701 4.4
Total Miles - 2017 36,355.0 34,653.1 39,718.2 38,084.5 37,446.3 36,537.0 33,706.4 38,594.9 37,843.1 39,428.6 37,467.2 34,884.8 37,060 444,719 5.0
% Change 4% 1% -4% 2% 3% -3% 3% -2% 0%
Avg Trip Length 5.0 5.0 4.9 5.2 5.1 5.1 5.1 5.1 - - - - 5.1
Current Year:
2018
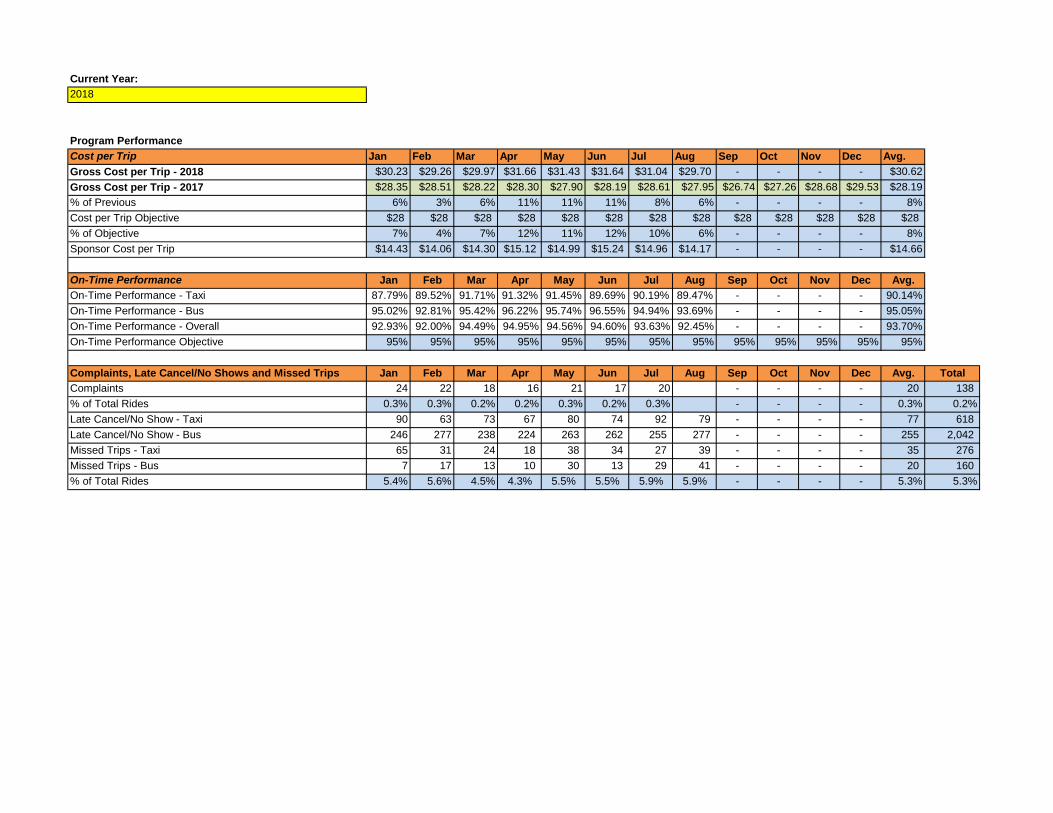
Program Performance
Cost per Trip Jan Feb Mar Apr May Jun Jul Aug Sep Oct Nov Dec Avg.
Gross Cost per Trip - 2018 $30.23 $29.26 $29.97 $31.66 $31.43 $31.64 $31.04 $29.70 - - - - $30.62
Gross Cost per Trip - 2017 $28.35 $28.51 $28.22 $28.30 $27.90 $28.19 $28.61 $27.95 $26.74 $27.26 $28.68 $29.53 $28.19
% of Previous 6% 3% 6% 11% 11% 11% 8% 6% - - - - 8%
Cost per Trip Objective $28 $28 $28 $28 $28 $28 $28 $28 $28 $28 $28 $28 $28
% of Objective 7% 4% 7% 12% 11% 12% 10% 6% - - - - 8%
Sponsor Cost per Trip $14.43 $14.06 $14.30 $15.12 $14.99 $15.24 $14.96 $14.17 - - - - $14.66
On-Time Performance Jan Feb Mar Apr May Jun Jul Aug Sep Oct Nov Dec Avg.
On-Time Performance - Taxi 87.79% 89.52% 91.71% 91.32% 91.45% 89.69% 90.19% 89.47% - - - - 90.14%
On-Time Performance - Bus 95.02% 92.81% 95.42% 96.22% 95.74% 96.55% 94.94% 93.69% - - - - 95.05%
On-Time Performance - Overall 92.93% 92.00% 94.49% 94.95% 94.56% 94.60% 93.63% 92.45% - - - - 93.70%
On-Time Performance Objective 95% 95% 95% 95% 95% 95% 95% 95% 95% 95% 95% 95% 95%
Complaints, Late Cancel/No Shows and Missed Trips Jan Feb Mar Apr May Jun Jul Aug Sep Oct Nov Dec Avg. Total
Complaints 24 22 18 16 21 17 20 - - - - 20 138
% of Total Rides 0.3% 0.3% 0.2% 0.2% 0.3% 0.2% 0.3% - - - - 0.3% 0.2%
Late Cancel/No Show - Taxi 90 63 73 67 80 74 92 79 - - - - 77 618
Late Cancel/No Show - Bus 246 277 238 224 263 262 255 277 - - - - 255 2,042
Missed Trips - Taxi 65 31 24 18 38 34 27 39 - - - - 35 276
Missed Trips - Bus 7 17 13 10 30 13 29 41 - - - - 20 160
% of Total Rides 5.4% 5.6% 4.5% 4.3% 5.5% 5.5% 5.9% 5.9% - - - - 5.3% 5.3%
Current Year:
2018
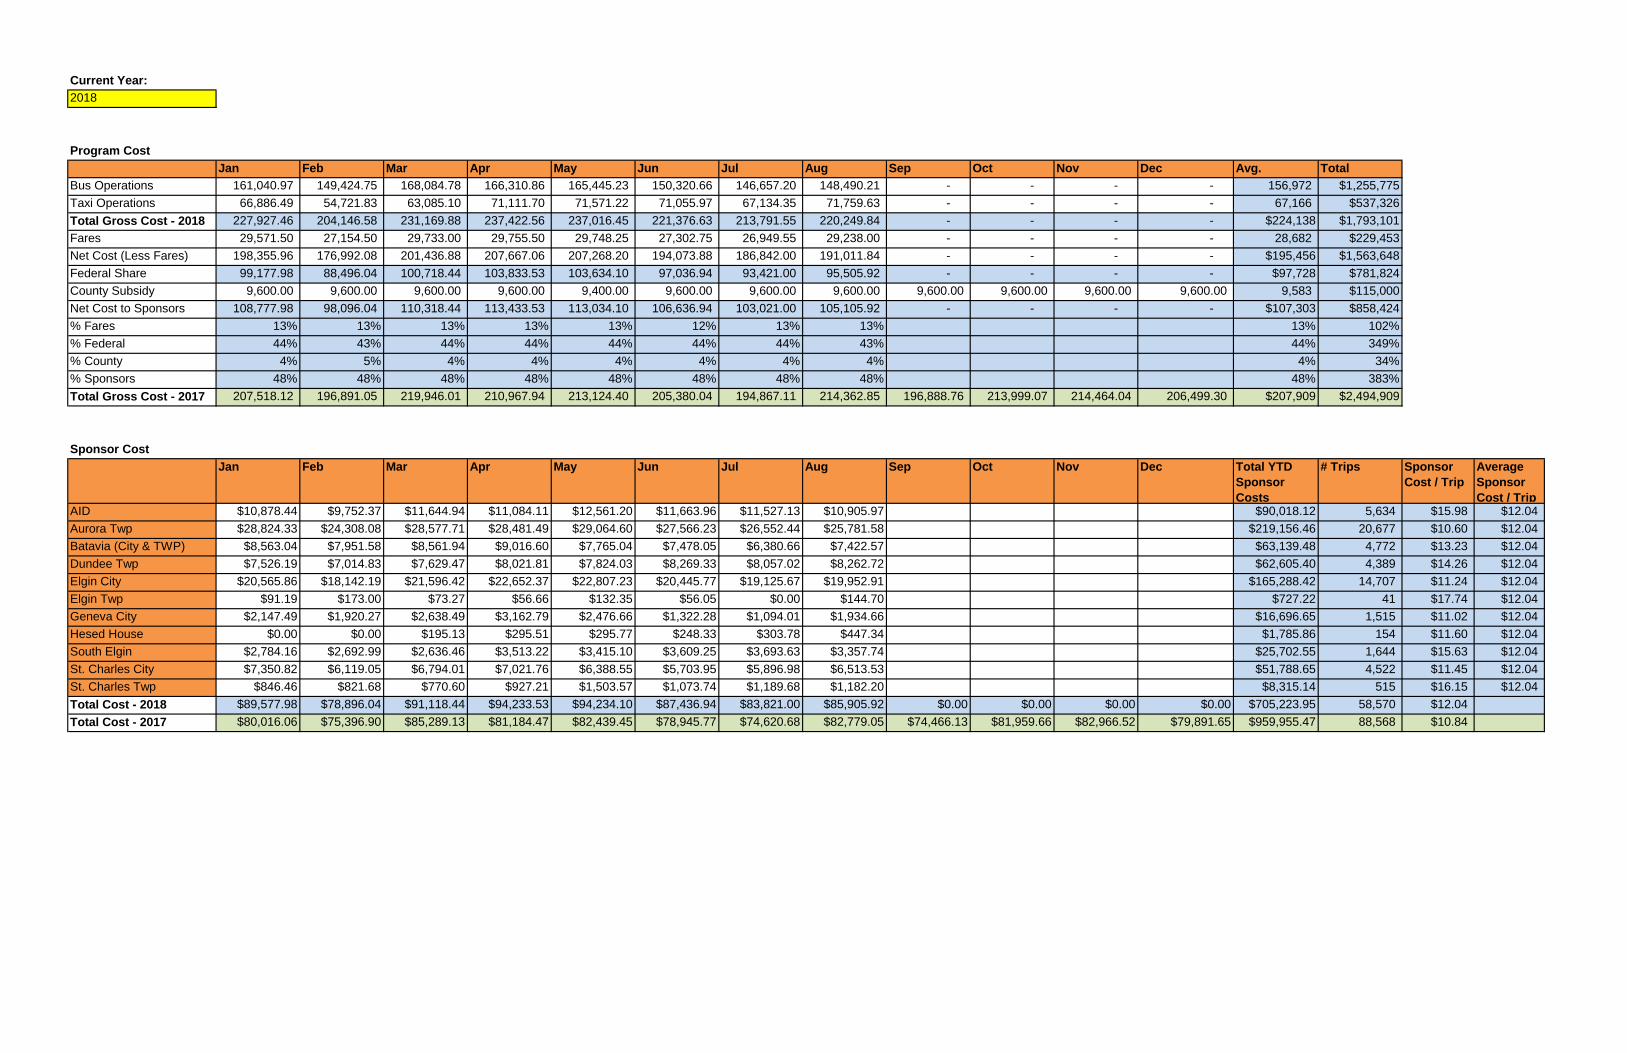
Program Cost
Jan Feb Mar Apr May Jun Jul Aug Sep Oct Nov Dec Avg. Total
Bus Operations 161,040.97 149,424.75 168,084.78 166,310.86 165,445.23 150,320.66 146,657.20 148,490.21 - - - - 156,972 $1,255,775
Taxi Operations 66,886.49 54,721.83 63,085.10 71,111.70 71,571.22 71,055.97 67,134.35 71,759.63 - - - - 67,166 $537,326
Total Gross Cost - 2018 227,927.46 204,146.58 231,169.88 237,422.56 237,016.45 221,376.63 213,791.55 220,249.84 - - - - $224,138 $1,793,101
Fares 29,571.50 27,154.50 29,733.00 29,755.50 29,748.25 27,302.75 26,949.55 29,238.00 - - - - 28,682 $229,453
Net Cost (Less Fares) 198,355.96 176,992.08 201,436.88 207,667.06 207,268.20 194,073.88 186,842.00 191,011.84 - - - - $195,456 $1,563,648
Federal Share 99,177.98 88,496.04 100,718.44 103,833.53 103,634.10 97,036.94 93,421.00 95,505.92 - - - - $97,728 $781,824
County Subsidy 9,600.00 9,600.00 9,600.00 9,600.00 9,400.00 9,600.00 9,600.00 9,600.00 9,600.00 9,600.00 9,600.00 9,600.00 9,583 $115,000
Net Cost to Sponsors 108,777.98 98,096.04 110,318.44 113,433.53 113,034.10 106,636.94 103,021.00 105,105.92 - - - - $107,303 $858,424
% Fares 13% 13% 13% 13% 13% 12% 13% 13% 13% 102%
% Federal 44% 43% 44% 44% 44% 44% 44% 43% 44% 349%
% County 4% 5% 4% 4% 4% 4% 4% 4% 4% 34%
% Sponsors 48% 48% 48% 48% 48% 48% 48% 48% 48% 383%
Total Gross Cost - 2017 207,518.12 196,891.05 219,946.01 210,967.94 213,124.40 205,380.04 194,867.11 214,362.85 196,888.76 213,999.07 214,464.04 206,499.30 $207,909 $2,494,909
Sponsor Cost
Jan Feb Mar Apr May Jun Jul Aug Sep Oct Nov Dec Total YTD
Sponsor
Costs
# Trips Sponsor
Cost / Trip
Average
Sponsor
Cost / TripAID $10,878.44 $9,752.37 $11,644.94 $11,084.11 $12,561.20 $11,663.96 $11,527.13 $10,905.97 $90,018.12 5,634 $15.98 $12.04
Aurora Twp $28,824.33 $24,308.08 $28,577.71 $28,481.49 $29,064.60 $27,566.23 $26,552.44 $25,781.58 $219,156.46 20,677 $10.60 $12.04
Batavia (City & TWP) $8,563.04 $7,951.58 $8,561.94 $9,016.60 $7,765.04 $7,478.05 $6,380.66 $7,422.57 $63,139.48 4,772 $13.23 $12.04
Dundee Twp $7,526.19 $7,014.83 $7,629.47 $8,021.81 $7,824.03 $8,269.33 $8,057.02 $8,262.72 $62,605.40 4,389 $14.26 $12.04
Elgin City $20,565.86 $18,142.19 $21,596.42 $22,652.37 $22,807.23 $20,445.77 $19,125.67 $19,952.91 $165,288.42 14,707 $11.24 $12.04
Elgin Twp $91.19 $173.00 $73.27 $56.66 $132.35 $56.05 $0.00 $144.70 $727.22 41 $17.74 $12.04
Geneva City $2,147.49 $1,920.27 $2,638.49 $3,162.79 $2,476.66 $1,322.28 $1,094.01 $1,934.66 $16,696.65 1,515 $11.02 $12.04
Hesed House $0.00 $0.00 $195.13 $295.51 $295.77 $248.33 $303.78 $447.34 $1,785.86 154 $11.60 $12.04
South Elgin $2,784.16 $2,692.99 $2,636.46 $3,513.22 $3,415.10 $3,609.25 $3,693.63 $3,357.74 $25,702.55 1,644 $15.63 $12.04
St. Charles City $7,350.82 $6,119.05 $6,794.01 $7,021.76 $6,388.55 $5,703.95 $5,896.98 $6,513.53 $51,788.65 4,522 $11.45 $12.04
St. Charles Twp $846.46 $821.68 $770.60 $927.21 $1,503.57 $1,073.74 $1,189.68 $1,182.20 $8,315.14 515 $16.15 $12.04
Total Cost - 2018 $89,577.98 $78,896.04 $91,118.44 $94,233.53 $94,234.10 $87,436.94 $83,821.00 $85,905.92 $0.00 $0.00 $0.00 $0.00 $705,223.95 58,570 $12.04
Total Cost - 2017 $80,016.06 $75,396.90 $85,289.13 $81,184.47 $82,439.45 $78,945.77 $74,620.68 $82,779.05 $74,466.13 $81,959.66 $82,966.52 $79,891.65 $959,955.47 88,568 $10.84
Current Year:
2018
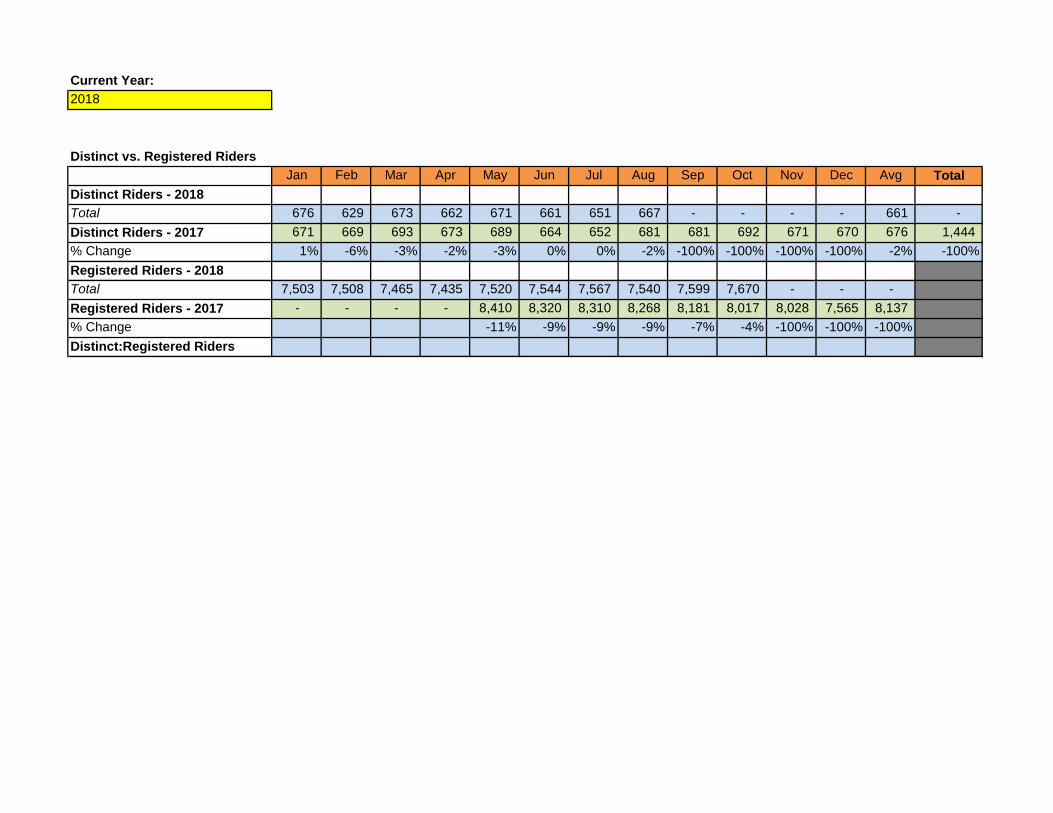
Distinct vs. Registered Riders
Jan Feb Mar Apr May Jun Jul Aug Sep Oct Nov Dec Avg Total
Distinct Riders - 2018
Total 676 629 673 662 671 661 651 667 - - - - 661 -
Distinct Riders - 2017 671 669 693 673 689 664 652 681 681 692 671 670 676 1,444
% Change 1% -6% -3% -2% -3% 0% 0% -2% -100% -100% -100% -100% -2% -100%
Registered Riders - 2018
Total 7,503 7,508 7,465 7,435 7,520 7,544 7,567 7,540 7,599 7,670 - - -
Registered Riders - 2017 - - - - 8,410 8,320 8,310 8,268 8,181 8,017 8,028 7,565 8,137
% Change -11% -9% -9% -9% -7% -4% -100% -100% -100%
Distinct:Registered Riders
# of rides sponsor cost
sponsor cost
per ride Fares collected Total Cost
Total Cost
per ride
Total Cost
per Ride
YTD*
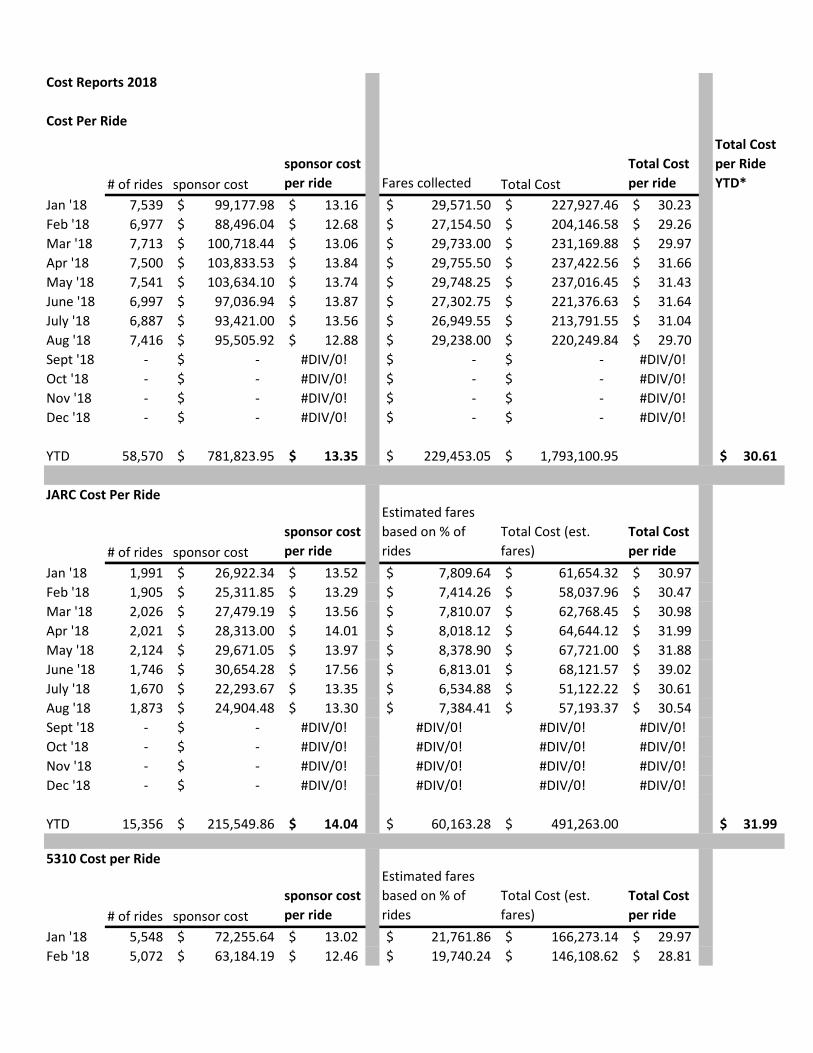
Jan '18 7,539 99,177.98$ 13.16$ 29,571.50$ 227,927.46$ 30.23$
Feb '18 6,977 88,496.04$ 12.68$ 27,154.50$ 204,146.58$ 29.26$
Mar '18 7,713 100,718.44$ 13.06$ 29,733.00$ 231,169.88$ 29.97$
Apr '18 7,500 103,833.53$ 13.84$ 29,755.50$ 237,422.56$ 31.66$
May '18 7,541 103,634.10$ 13.74$ 29,748.25$ 237,016.45$ 31.43$
June '18 6,997 97,036.94$ 13.87$ 27,302.75$ 221,376.63$ 31.64$
July '18 6,887 93,421.00$ 13.56$ 26,949.55$ 213,791.55$ 31.04$
Aug '18 7,416 95,505.92$ 12.88$ 29,238.00$ 220,249.84$ 29.70$
Sept '18 - -$ #DIV/0! -$ -$ #DIV/0!
Oct '18 - -$ #DIV/0! -$ -$ #DIV/0!
Nov '18 - -$ #DIV/0! -$ -$ #DIV/0!
Dec '18 - -$ #DIV/0! -$ -$ #DIV/0!
YTD 58,570 781,823.95$ 13.35$ 229,453.05$ 1,793,100.95$ 30.61$
# of rides sponsor cost
sponsor cost
per ride
Estimated fares
based on % of
rides
Total Cost (est.
fares)
Total Cost
per ride
Jan '18 1,991 26,922.34$ 13.52$ 7,809.64$ 61,654.32$ 30.97$
Feb '18 1,905 25,311.85$ 13.29$ 7,414.26$ 58,037.96$ 30.47$
Mar '18 2,026 27,479.19$ 13.56$ 7,810.07$ 62,768.45$ 30.98$
Apr '18 2,021 28,313.00$ 14.01$ 8,018.12$ 64,644.12$ 31.99$
May '18 2,124 29,671.05$ 13.97$ 8,378.90$ 67,721.00$ 31.88$
June '18 1,746 30,654.28$ 17.56$ 6,813.01$ 68,121.57$ 39.02$
July '18 1,670 22,293.67$ 13.35$ 6,534.88$ 51,122.22$ 30.61$
Aug '18 1,873 24,904.48$ 13.30$ 7,384.41$ 57,193.37$ 30.54$
Sept '18 - -$ #DIV/0! #DIV/0! #DIV/0! #DIV/0!
Oct '18 - -$ #DIV/0! #DIV/0! #DIV/0! #DIV/0!
Nov '18 - -$ #DIV/0! #DIV/0! #DIV/0! #DIV/0!
Dec '18 - -$ #DIV/0! #DIV/0! #DIV/0! #DIV/0!
YTD 15,356 215,549.86$ 14.04$ 60,163.28$ 491,263.00$ 31.99$
# of rides sponsor cost
sponsor cost
per ride
Estimated fares
based on % of
rides
Total Cost (est.
fares)
Total Cost
per ride
Jan '18 5,548 72,255.64$ 13.02$ 21,761.86$ 166,273.14$ 29.97$
Feb '18 5,072 63,184.19$ 12.46$ 19,740.24$ 146,108.62$ 28.81$
Cost Reports 2018
Cost Per Ride
JARC Cost Per Ride
5310 Cost per Ride
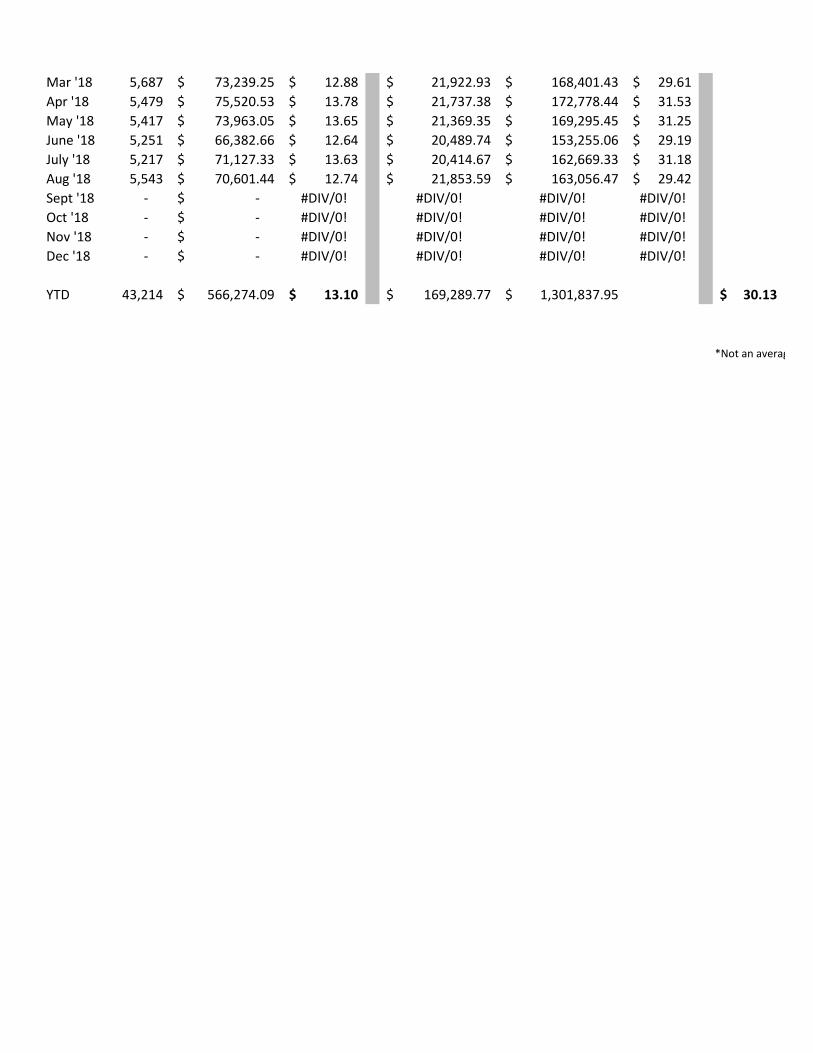
Mar '18 5,687 73,239.25$ 12.88$ 21,922.93$ 168,401.43$ 29.61$
Apr '18 5,479 75,520.53$ 13.78$ 21,737.38$ 172,778.44$ 31.53$
May '18 5,417 73,963.05$ 13.65$ 21,369.35$ 169,295.45$ 31.25$
June '18 5,251 66,382.66$ 12.64$ 20,489.74$ 153,255.06$ 29.19$
July '18 5,217 71,127.33$ 13.63$ 20,414.67$ 162,669.33$ 31.18$
Aug '18 5,543 70,601.44$ 12.74$ 21,853.59$ 163,056.47$ 29.42$
Sept '18 - -$ #DIV/0! #DIV/0! #DIV/0! #DIV/0!
Oct '18 - -$ #DIV/0! #DIV/0! #DIV/0! #DIV/0!
Nov '18 - -$ #DIV/0! #DIV/0! #DIV/0! #DIV/0!
Dec '18 - -$ #DIV/0! #DIV/0! #DIV/0! #DIV/0!
YTD 43,214 566,274.09$ 13.10$ 169,289.77$ 1,301,837.95$ 30.13$
*Not an average
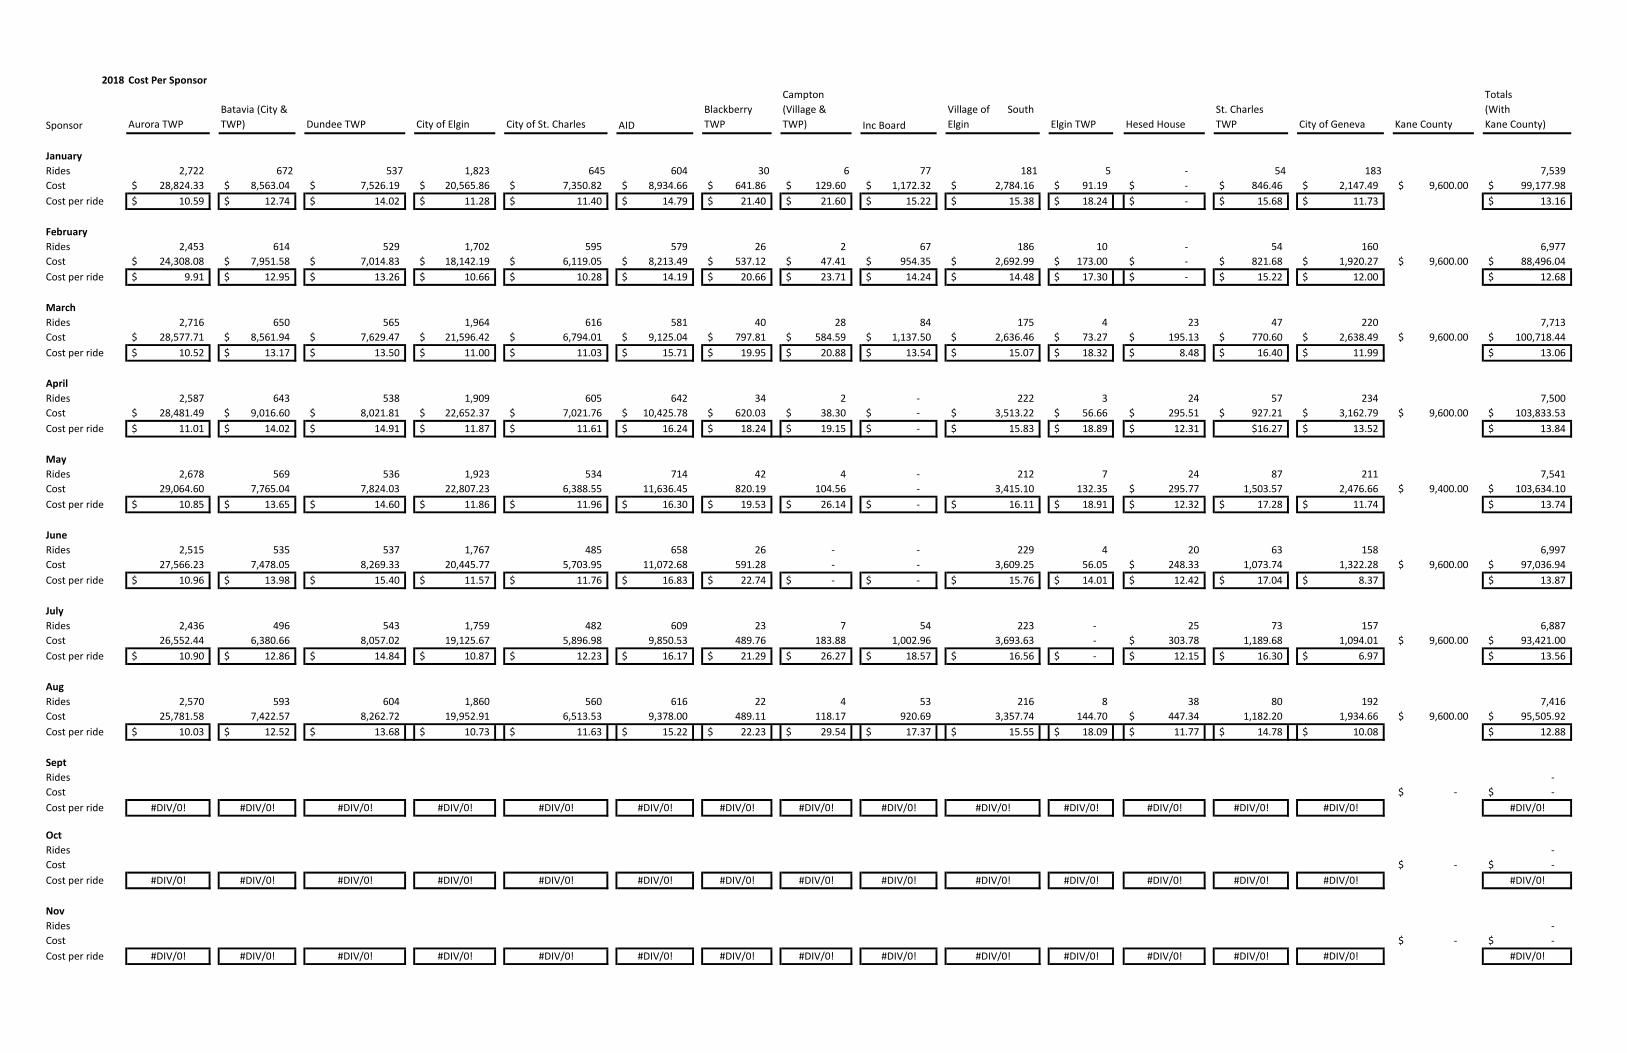
2018
Sponsor Aurora TWP
Batavia (City &
TWP) Dundee TWP City of Elgin City of St. Charles AID
Blackberry
TWP
Campton
(Village &
TWP) Inc Board
Village of South
Elgin Elgin TWP Hesed House
St. Charles
TWP City of Geneva Kane County
Totals
(With
Kane County)
January
Rides 2,722 672 537 1,823 645 604 30 6 77 181 5 - 54 183 7,539
Cost 28,824.33$ 8,563.04$ 7,526.19$ 20,565.86$ 7,350.82$ 8,934.66$ 641.86$ 129.60$ 1,172.32$ 2,784.16$ 91.19$ -$ 846.46$ 2,147.49$ 9,600.00$ 99,177.98$
Cost per ride 10.59$ 12.74$ 14.02$ 11.28$ 11.40$ 14.79$ 21.40$ 21.60$ 15.22$ 15.38$ 18.24$ -$ 15.68$ 11.73$ 13.16$
February
Rides 2,453 614 529 1,702 595 579 26 2 67 186 10 - 54 160 6,977
Cost 24,308.08$ 7,951.58$ 7,014.83$ 18,142.19$ 6,119.05$ 8,213.49$ 537.12$ 47.41$ 954.35$ 2,692.99$ 173.00$ -$ 821.68$ 1,920.27$ 9,600.00$ 88,496.04$
Cost per ride 9.91$ 12.95$ 13.26$ 10.66$ 10.28$ 14.19$ 20.66$ 23.71$ 14.24$ 14.48$ 17.30$ -$ 15.22$ 12.00$ 12.68$
March
Rides 2,716 650 565 1,964 616 581 40 28 84 175 4 23 47 220 7,713
Cost 28,577.71$ 8,561.94$ 7,629.47$ 21,596.42$ 6,794.01$ 9,125.04$ 797.81$ 584.59$ 1,137.50$ 2,636.46$ 73.27$ 195.13$ 770.60$ 2,638.49$ 9,600.00$ 100,718.44$
Cost per ride 10.52$ 13.17$ 13.50$ 11.00$ 11.03$ 15.71$ 19.95$ 20.88$ 13.54$ 15.07$ 18.32$ 8.48$ 16.40$ 11.99$ 13.06$
April
Rides 2,587 643 538 1,909 605 642 34 2 - 222 3 24 57 234 7,500
Cost 28,481.49$ 9,016.60$ 8,021.81$ 22,652.37$ 7,021.76$ 10,425.78$ 620.03$ 38.30$ -$ 3,513.22$ 56.66$ 295.51$ 927.21$ 3,162.79$ 9,600.00$ 103,833.53$
Cost per ride 11.01$ 14.02$ 14.91$ 11.87$ 11.61$ 16.24$ 18.24$ 19.15$ -$ 15.83$ 18.89$ 12.31$ $16.27 13.52$ 13.84$
May
Rides 2,678 569 536 1,923 534 714 42 4 - 212 7 24 87 211 7,541
Cost 29,064.60 7,765.04 7,824.03 22,807.23 6,388.55 11,636.45 820.19 104.56 - 3,415.10 132.35 295.77$ 1,503.57 2,476.66 9,400.00$ 103,634.10$
Cost per ride 10.85$ 13.65$ 14.60$ 11.86$ 11.96$ 16.30$ 19.53$ 26.14$ -$ 16.11$ 18.91$ 12.32$ 17.28$ 11.74$ 13.74$
June
Rides 2,515 535 537 1,767 485 658 26 - - 229 4 20 63 158 6,997
Cost 27,566.23 7,478.05 8,269.33 20,445.77 5,703.95 11,072.68 591.28 - - 3,609.25 56.05 248.33$ 1,073.74 1,322.28 9,600.00$ 97,036.94$
Cost per ride 10.96$ 13.98$ 15.40$ 11.57$ 11.76$ 16.83$ 22.74$ -$ -$ 15.76$ 14.01$ 12.42$ 17.04$ 8.37$ 13.87$
July
Rides 2,436 496 543 1,759 482 609 23 7 54 223 - 25 73 157 6,887
Cost 26,552.44 6,380.66 8,057.02 19,125.67 5,896.98 9,850.53 489.76 183.88 1,002.96 3,693.63 - 303.78$ 1,189.68 1,094.01 9,600.00$ 93,421.00$
Cost per ride 10.90$ 12.86$ 14.84$ 10.87$ 12.23$ 16.17$ 21.29$ 26.27$ 18.57$ 16.56$ -$ 12.15$ 16.30$ 6.97$ 13.56$
Aug
Rides 2,570 593 604 1,860 560 616 22 4 53 216 8 38 80 192 7,416
Cost 25,781.58 7,422.57 8,262.72 19,952.91 6,513.53 9,378.00 489.11 118.17 920.69 3,357.74 144.70 447.34$ 1,182.20 1,934.66 9,600.00$ 95,505.92$
Cost per ride 10.03$ 12.52$ 13.68$ 10.73$ 11.63$ 15.22$ 22.23$ 29.54$ 17.37$ 15.55$ 18.09$ 11.77$ 14.78$ 10.08$ 12.88$
Sept
Rides -
Cost -$ -$
Cost per ride #DIV/0! #DIV/0! #DIV/0! #DIV/0! #DIV/0! #DIV/0! #DIV/0! #DIV/0! #DIV/0! #DIV/0! #DIV/0! #DIV/0! #DIV/0! #DIV/0! #DIV/0!
Oct
Rides -
Cost -$ -$
Cost per ride #DIV/0! #DIV/0! #DIV/0! #DIV/0! #DIV/0! #DIV/0! #DIV/0! #DIV/0! #DIV/0! #DIV/0! #DIV/0! #DIV/0! #DIV/0! #DIV/0! #DIV/0!
Nov
Rides -
Cost -$ -$
Cost per ride #DIV/0! #DIV/0! #DIV/0! #DIV/0! #DIV/0! #DIV/0! #DIV/0! #DIV/0! #DIV/0! #DIV/0! #DIV/0! #DIV/0! #DIV/0! #DIV/0! #DIV/0!
Cost Per Sponsor

Dec
Rides -
Cost -$ -$
Cost per ride #DIV/0! #DIV/0! #DIV/0! #DIV/0! #DIV/0! #DIV/0! #DIV/0! #DIV/0! #DIV/0! #DIV/0! #DIV/0! #DIV/0! #DIV/0! #DIV/0! #DIV/0!
YTD Rides 20,677 4,772 4,389 14,707 4,522 5,003 243 53 335 1,644 41 154 515 1,515 58,570
YTD Cost 219,156.46$ 63,139.48$ 62,605.40$ 165,288.42$ 51,788.65$ 78,636.63$ 4,987.16$ 1,206.51$ 5,187.82$ 25,702.55$ 727.22$ 1,785.86$ 8,315.14$ 16,696.65$ 76,600.00$ 781,823.95$
Total Cost per
Ride YTD * not
an average 10.60 13.23 14.26 11.24 11.45 15.72 20.52 22.76 15.49 15.63 17.74 11.60 16.15 11.02 13.35
Average # of
rides per month 2,584.63 596.50 548.63 1,838.38 565 625.38 30.38 6.63 41.88 205.50 5.13 19.25 64.38 189.38 7,321 Average Cost per
month 27,394.56$ 7,892.44$ 7,825.68$ 20,661.05$ 6,473.58$ 9,829.58$ 623.40$ 150.81$ 648.48$ 3,212.82$ 90.90$ 223.23$ 1,039.39$ 2,087.08$ 97,727.99$
Update formulas based on # of months with data
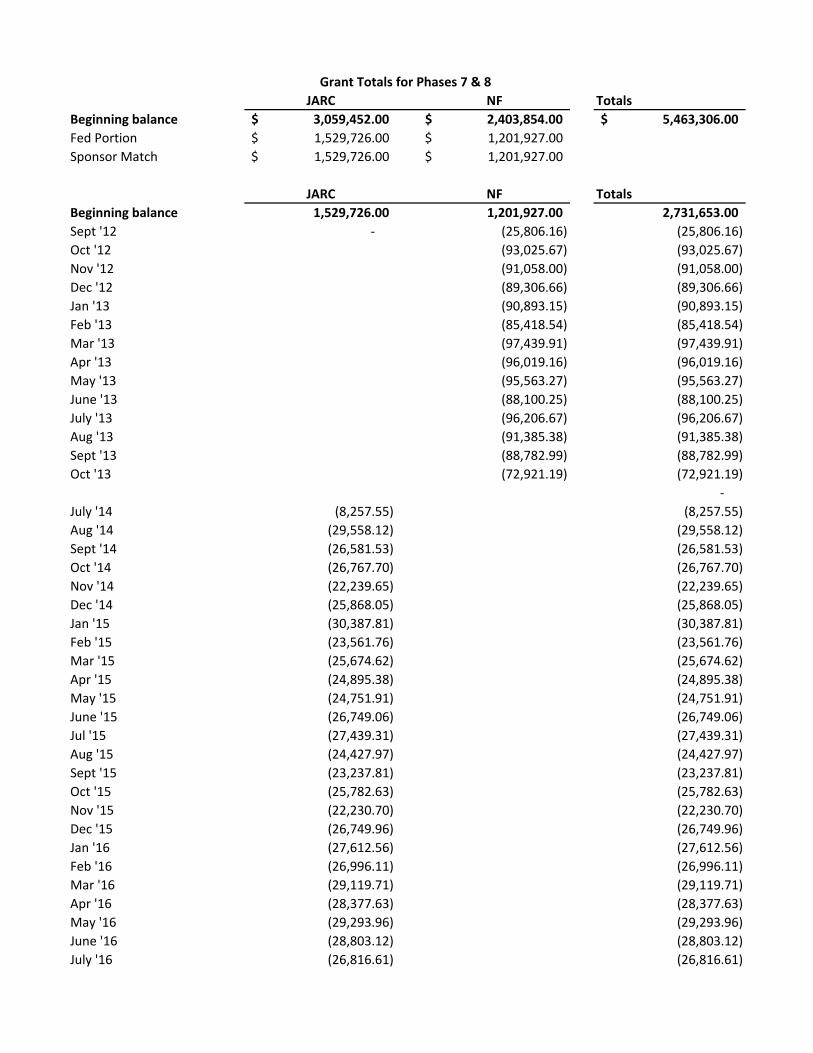
JARC NF Totals
Beginning balance 3,059,452.00$ 2,403,854.00$ 5,463,306.00$
Fed Portion 1,529,726.00$ 1,201,927.00$
Sponsor Match 1,529,726.00$ 1,201,927.00$
JARC NF Totals
Beginning balance 1,529,726.00 1,201,927.00 2,731,653.00
Sept '12 - (25,806.16) (25,806.16)
Oct '12 (93,025.67) (93,025.67)
Nov '12 (91,058.00) (91,058.00)
Dec '12 (89,306.66) (89,306.66)
Jan '13 (90,893.15) (90,893.15)
Feb '13 (85,418.54) (85,418.54)
Mar '13 (97,439.91) (97,439.91)
Apr '13 (96,019.16) (96,019.16)
May '13 (95,563.27) (95,563.27)
June '13 (88,100.25) (88,100.25)
July '13 (96,206.67) (96,206.67)
Aug '13 (91,385.38) (91,385.38)
Sept '13 (88,782.99) (88,782.99)
Oct '13 (72,921.19) (72,921.19)
-
July '14 (8,257.55) (8,257.55)
Aug '14 (29,558.12) (29,558.12)
Sept '14 (26,581.53) (26,581.53)
Oct '14 (26,767.70) (26,767.70)
Nov '14 (22,239.65) (22,239.65)
Dec '14 (25,868.05) (25,868.05)
Jan '15 (30,387.81) (30,387.81)
Feb '15 (23,561.76) (23,561.76)
Mar '15 (25,674.62) (25,674.62)
Apr '15 (24,895.38) (24,895.38)
May '15 (24,751.91) (24,751.91)
June '15 (26,749.06) (26,749.06)
Jul '15 (27,439.31) (27,439.31)
Aug '15 (24,427.97) (24,427.97)
Sept '15 (23,237.81) (23,237.81)
Oct '15 (25,782.63) (25,782.63)
Nov '15 (22,230.70) (22,230.70)
Dec '15 (26,749.96) (26,749.96)
Jan '16 (27,612.56) (27,612.56)
Feb '16 (26,996.11) (26,996.11)
Mar '16 (29,119.71) (29,119.71)
Apr '16 (28,377.63) (28,377.63)
May '16 (29,293.96) (29,293.96)
June '16 (28,803.12) (28,803.12)
July '16 (26,816.61) (26,816.61)
Grant Totals for Phases 7 & 8
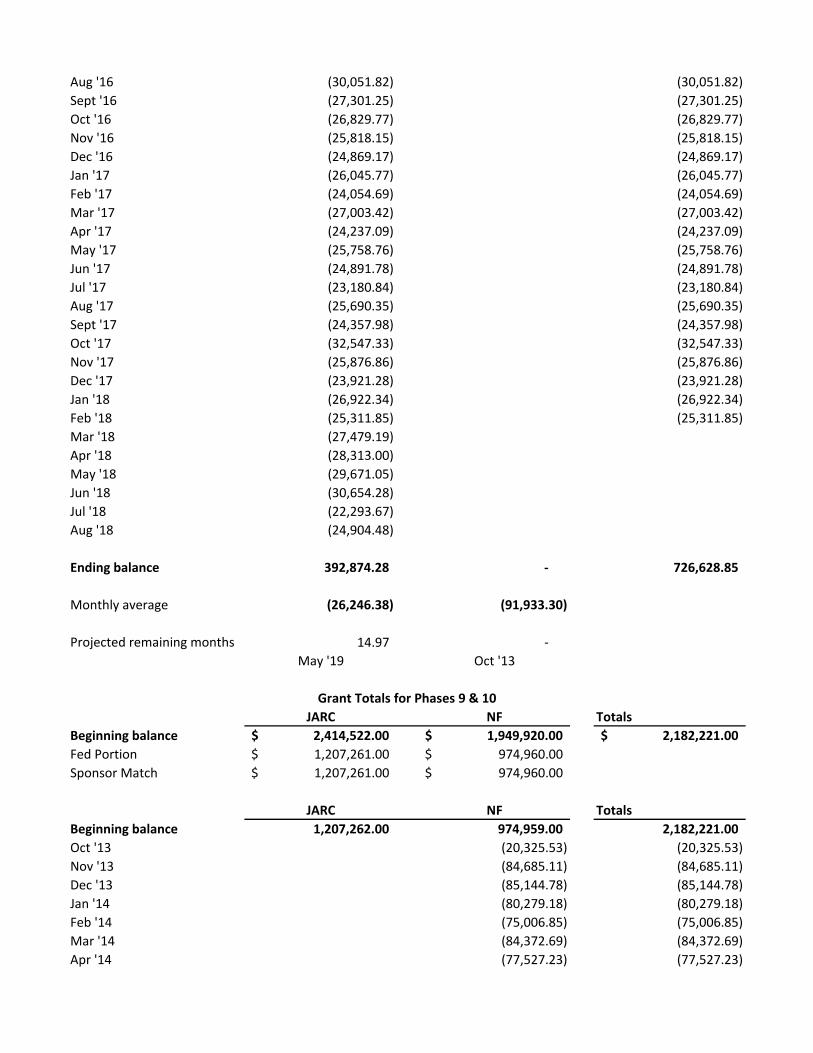
Aug '16 (30,051.82) (30,051.82)
Sept '16 (27,301.25) (27,301.25)
Oct '16 (26,829.77) (26,829.77)
Nov '16 (25,818.15) (25,818.15)
Dec '16 (24,869.17) (24,869.17)
Jan '17 (26,045.77) (26,045.77)
Feb '17 (24,054.69) (24,054.69)
Mar '17 (27,003.42) (27,003.42)
Apr '17 (24,237.09) (24,237.09)
May '17 (25,758.76) (25,758.76)
Jun '17 (24,891.78) (24,891.78)
Jul '17 (23,180.84) (23,180.84)
Aug '17 (25,690.35) (25,690.35)
Sept '17 (24,357.98) (24,357.98)
Oct '17 (32,547.33) (32,547.33)
Nov '17 (25,876.86) (25,876.86)
Dec '17 (23,921.28) (23,921.28)
Jan '18 (26,922.34) (26,922.34)
Feb '18 (25,311.85) (25,311.85)
Mar '18 (27,479.19)
Apr '18 (28,313.00)
May '18 (29,671.05)
Jun '18 (30,654.28)
Jul '18 (22,293.67)
Aug '18 (24,904.48)
Ending balance 392,874.28 - 726,628.85
Monthly average (26,246.38) (91,933.30)
Projected remaining months 14.97 -
May '19 Oct '13
JARC NF Totals
Beginning balance 2,414,522.00$ 1,949,920.00$ 2,182,221.00$
Fed Portion 1,207,261.00$ 974,960.00$
Sponsor Match 1,207,261.00$ 974,960.00$
JARC NF Totals
Beginning balance 1,207,262.00 974,959.00 2,182,221.00
Oct '13 (20,325.53) (20,325.53)
Nov '13 (84,685.11) (84,685.11)
Dec '13 (85,144.78) (85,144.78)
Jan '14 (80,279.18) (80,279.18)
Feb '14 (75,006.85) (75,006.85)
Mar '14 (84,372.69) (84,372.69)
Apr '14 (77,527.23) (77,527.23)
Grant Totals for Phases 9 & 10
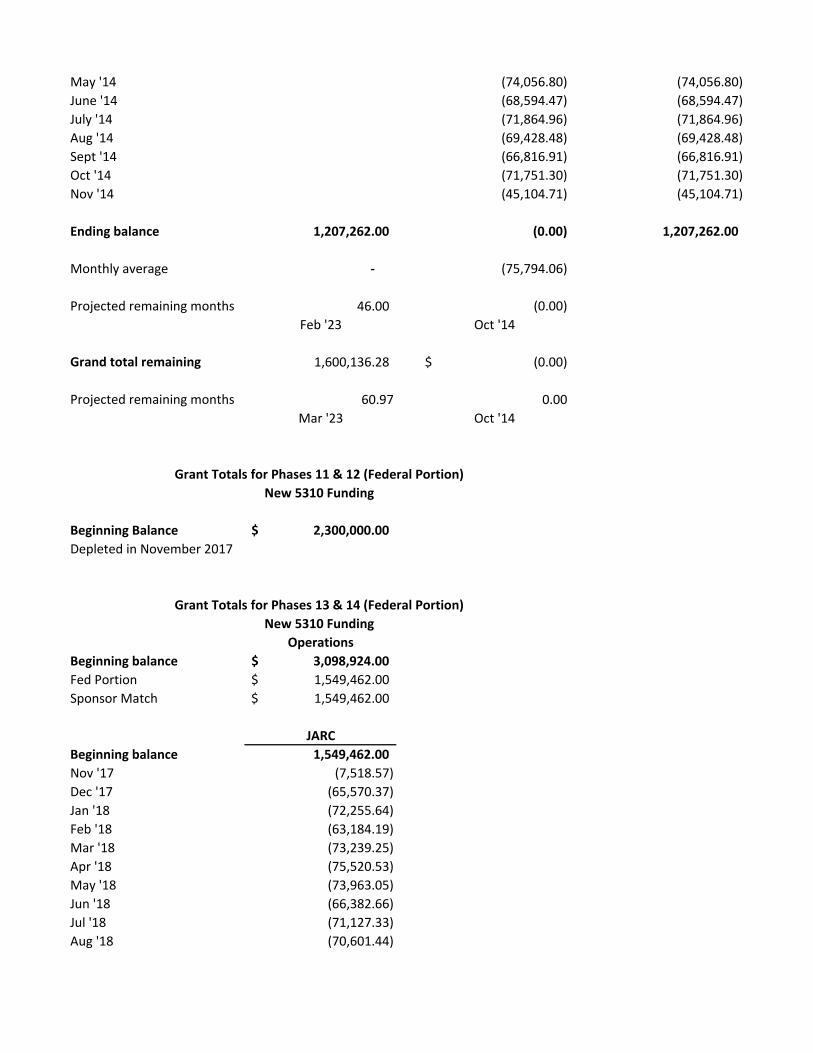
May '14 (74,056.80) (74,056.80)
June '14 (68,594.47) (68,594.47)
July '14 (71,864.96) (71,864.96)
Aug '14 (69,428.48) (69,428.48)
Sept '14 (66,816.91) (66,816.91)
Oct '14 (71,751.30) (71,751.30)
Nov '14 (45,104.71) (45,104.71)
Ending balance 1,207,262.00 (0.00) 1,207,262.00
Monthly average - (75,794.06)
Projected remaining months 46.00 (0.00)
Feb '23 Oct '14
Grand total remaining 1,600,136.28 (0.00)$
Projected remaining months 60.97 0.00
Mar '23 Oct '14
Beginning Balance 2,300,000.00$
Depleted in November 2017
Operations
Beginning balance 3,098,924.00$
Fed Portion 1,549,462.00$
Sponsor Match 1,549,462.00$
JARC
Beginning balance 1,549,462.00
Nov '17 (7,518.57)
Dec '17 (65,570.37)
Jan '18 (72,255.64)
Feb '18 (63,184.19)
Mar '18 (73,239.25)
Apr '18 (75,520.53)
May '18 (73,963.05)
Jun '18 (66,382.66)
Jul '18 (71,127.33)
Aug '18 (70,601.44)
Grant Totals for Phases 13 & 14 (Federal Portion)
New 5310 Funding
Grant Totals for Phases 11 & 12 (Federal Portion)
New 5310 Funding
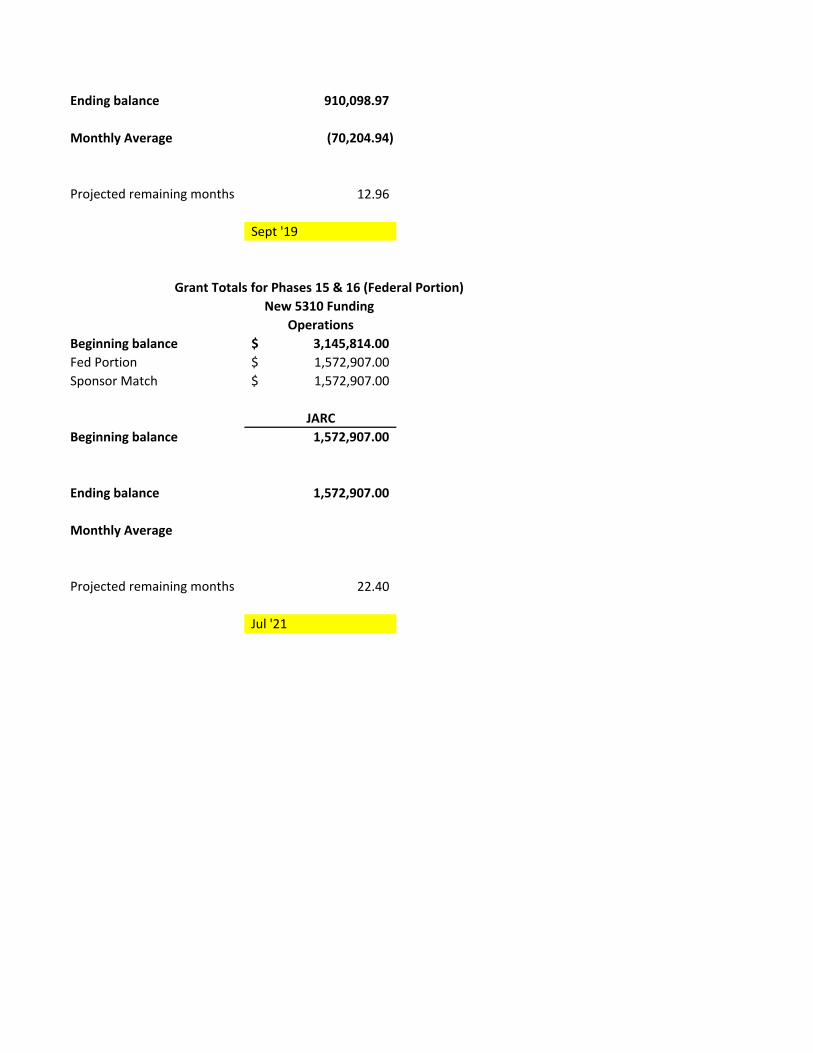
Ending balance 910,098.97
Monthly Average (70,204.94)
Projected remaining months 12.96
Sept '19
Operations
Beginning balance 3,145,814.00$
Fed Portion 1,572,907.00$
Sponsor Match 1,572,907.00$
JARC
Beginning balance 1,572,907.00
Ending balance 1,572,907.00
Monthly Average
Projected remaining months 22.40
Jul '21
Grant Totals for Phases 15 & 16 (Federal Portion)
New 5310 Funding