Embed Size (px)
Citation preview
47 International Research: Journal of Library & Information Science | Vol.7 No.1, Mar., 2017
Determinants of Television Media Libraries’ Use, Collections, and Services among the
Television Media Professionals in Bengaluru: A Study
Prasanna Kumara B. M.
Librarian
New Horizon College of Engineering
Bengaluru, India
Dr. K. Divyananda
Technical Officer,
Gas Turbine Research Establishment,
DRDO, Bengaluru, India
ABSTRACT
The purpose of this study is to examine the utilization of television media libraries use,
collections and services among the media professional working in various television media at
Bangalore, Karnataka. Keeping in view the objectives of the study, a survey method has been
adopted and well-structured questionnaire was distributed to collect data about television media
libraries’ usage behavior by the media professionals.
The scope of this study covers 1132 media professional working at various television media
(Total 29) in Bangalore. The scope of this study can be extended to additional national and local
television channels in Bangalore. The result of the study indicates the minimum usage of the
television media libraries by the television media professionals for their professional activities.
The overall statics shows the usage, collections and services of television media libraries as
somehow satisfactory.
There are number of studies on the usage, collections and other library services, but this study is
the first of its kind in Bangalore, specifically focusing on television media libraries. This study
covers the ways to accomplish the demands of television media professionals in the television
media of Bangalore, Karnataka.
Key Words: Maida Library Services, Television Media, Media Libraries, Information Retrieval,
Media Professionals.
1. INTRODUCTION
Today‟s world is a melting pot comprising of multi-ethnic and multi-cultural societies.
Geographical distances have been shortened by effective public communication, which has been
possible by diversifying the television media that now promotes the co-existence of these diverse
groups by educating the media professional on the new standards of civilization thereby breeding
tolerance and respect for the freedom of speech and expression of each and every individual.
48 International Research: Journal of Library & Information Science | Vol.7 No.1, Mar., 2017
Television Media Libraries play a significant role in satisfying the information needs of media
professionals. Television media, being the most popular source of information dissemination
requires the professionals involved to persistently gather information via all the available modes,
one such being the Television Media Library. With the advent of advanced technology, these
libraries are now equipped with various tools and services in system model design, information
repacking and dissemination of information.
A study was conducted to examine the utilization of television media libraries, collections and
services among the media professional working in various television media at Bangalore,
Karnataka.
2. TV MEDIA IN BANGALORE
Bangalore traces its introduction to television way back to 1981 upon the establishment of a
relay centre by Doordarshan. The steady mushrooming of numerous satellite TV channels, cable
operators and Direct to Home services available at Bangalore now has us spoilt for choice.
Doordarshan is the broadcaster of the Government of India and its channel DD Chandana is
dedicated to Kannada. Prominent Kannada channels include Udaya TV, Colors Kannada, Zee
Kannada, Suvarna, Suvarna pulse, Kasthuri TV, Kaliki Kannada, Udaya News, TV9 Kannada,
Suvarna News 24x7, Samaya News, Raj News Janashri, KasthuriNewz 24, Public TV, News9
Karnataka, BTV Kannda, Praja TV, ETV News Kannada, Udaya Music, Raj Music, Public
Music,Udaya Comedy, Udaya Movies, ChintuTV, Sri Sankara,and SaralaJivana.
3. REVIEW OF LITERATURE:
Previous studies and literature (1991-2014) on the subject of sources and modes of collecting
information by the media professionals have been reviewed and examined.
There were Media professionals who conducted studies on various research subjects, which
comprise of:
49 International Research: Journal of Library & Information Science | Vol.7 No.1, Mar., 2017
Rosamma Joseph, in 1993 studied on “How Indian Journalists Use Libraries”. The results of that
study showed that the journalists working on the eight Kerala newspapers used libraries for
conducting any research on their news, which were published in these Kerala newspapers. Also,
there were significant differences in the patterns of use of the library by senior editorial staff and
staff in other categories. This study concluded that there was a room for improvement in the
collections and services of the libraries concerned.
Gupta, in 2012 studied on information needs and information and sought behavior of print
and electronic media journalists in M.P. with special reference to Rewa division. The findingsof
this research showed that maximum number of journalists were graduate, maximum number of
journalist preferred to visit personally to obtain information, maximum number of journalists
desired to avail library services free of cost and few journalists prefer fee-based library services
in both print media and electronic media. 'Newspapers' were the top priority use of library
materials by the journalists in print media and electronic media.
Obijio for, in 2013 studied on “News channels professionals ‟ Perceptions and Use of the
Internet as a News Channel” and observed that second and third year journalism news channels
professionals relied basically on internet as most popular source for news. Results from this
study showed that news channels professionals were highly selective of the news media for
satisfaction their news needs.
Kemman, in 2013 in the research paper “Dutch Journalism in the Digital Age: Periodismo
Holandés en la Era Digital” provided an inventory of the ways in which journalists used digital
resources, and explored the differences between experts and beginners. Results of this study
showed that Dutch journalists used relatively used few digital tools to find online information.
However, journalists who were considered to be experts in their field of information used a wider
range of search engines and techniques for getting quicker and better results. Due to this reason
these experts required more time for writing their news story.
50 International Research: Journal of Library & Information Science | Vol.7 No.1, Mar., 2017
Gurdev Singh, in 2013in his study on “Information seeking behavior of newspaper journalists”
showed that different categories of journalists used various types of resources for acquiring their
information needs. These resources include periodicals, news magazines, current issues of
newspapers, newspaper clipping files and dictionaries/biographical dictionaries. On conducting a
research on the most preferred mode of journalists‟research, it was found that the journalists
during that period used newspaper clipping files mainly for the purpose of background
information. The difficulties which were faced by them in conducting their research includes
lack of modern communication gadgets, information scattered in many sources, inadequate
library services and sources.
Parveen Kumar, in 2014 in a study on “Usage of Print Television media libraries in North
India” attempted to know the usage of print television media libraries of north India. The results
of this study showed that majority of the users comprising 77.59% of the total users were in the
favor of digitization of the old newspapers. Also, majority of the users were not satisfied with the
reading environment, library services and library collection and resources. Based on the result of
the study, researcher suggested that newspaper libraries must strengthen their manpower support,
and try to equip their professionals and train them in automation, database creation and
computerization of housekeeping operations.
Nora Martin, in 2014 explored the study on Information Verification in the Age of Digital
Journalism andstudied on interview methods. It was envisaged that this would entail studying
on how journalists' retrospectively described processes for ensuring accuracy by conducting
qualitative interviews with 25 semi-randomly selected Australian journalists. Researcher
suggested that further research into the changing nature of journalists' information practices is
worthy of consideration, including research into issues of credibility and issue perception
relating to the use of Twitter as a news distribution tool.
Santosh Chavan, in 2014 conducted a study on journalists based on the survey of 47
questionnaires from the journalists from Dharwad District, Karnataka. He observed that most of
the journalists during that period used internet and television for accessingtheir information,
majority (80.85%) journalist used library for their reading habits, government publications were
51 International Research: Journal of Library & Information Science | Vol.7 No.1, Mar., 2017
used by 68.08% journalists for the purpose of specific information, 57.57% used information
archival sources for getting information and 44.68% used specific information from periodicals.
4. OBJECTIVE OF THE STUDY
The study has been carried out to achieve the following objectives
1. To identify various types of Information Resources available for usage of the media
professionals and their availability in media libraries.
2. To know the awareness level of media professionals with response to different
Information Resources available.
3. To study the purpose of information seeking by media professionals.
4. To know about the factors responsible for information gathering.
5. To find out difficulties & barriers faced by television media professionals while accessing
the information.
5. METHODOLOGY
For the study researcher used a descriptive survey method and well-structured
questionnaire as the data collection instrument. The researcher distributed 1320questionnaires to
media professionals and 1132 questionnaires were returned duly filled with the response rate of
85.8%. The data collected were tabulated and analyzed. Statistical techniques of percentage of
respondents have been mainly used to analyze the collective data.
6. DATA ANALYSIS
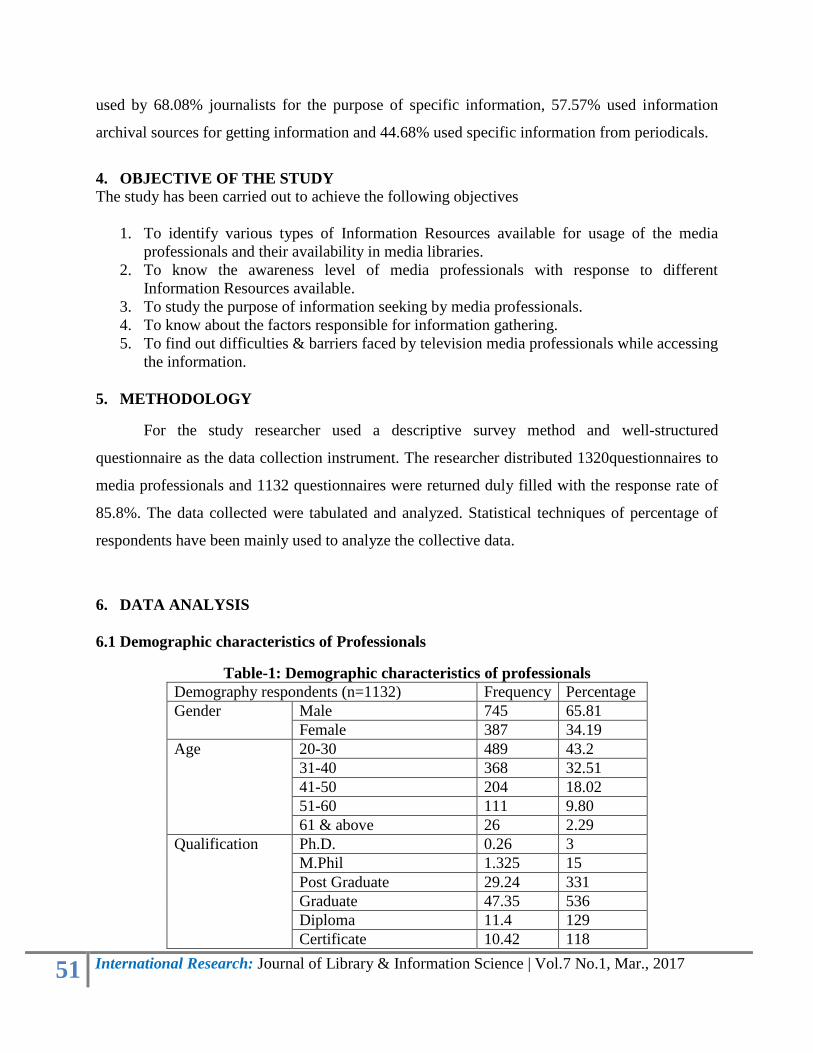
6.1 Demographic characteristics of Professionals
Table-1: Demographic characteristics of professionals
Demography respondents (n=1132) Frequency Percentage
Gender Male 745 65.81
Female 387 34.19
Age 20-30 489 43.2
31-40 368 32.51
41-50 204 18.02
51-60 111 9.80
61 & above 26 2.29
Qualification Ph.D. 0.26 3
M.Phil 1.325 15
Post Graduate 29.24 331
Graduate 47.35 536
Diploma 11.4 129
Certificate 10.42 118
52 International Research: Journal of Library & Information Science | Vol.7 No.1, Mar., 2017
The data summarized in the table-1 demonstrates the demographic characteristics of respondents.
It shows that 65.81% of respondents are male and only 34.19% respondents are Female from
Television media. Majority of the respondents i.e. 489 (43.2%) of respondents come under the
age group of below 20-30 years. 171 (31.66%) of respondents come under the age group of 31-
40 years, 368 (32.51%) of respondents come under the age group of 41-50 years, 204 (18.02%)
of respondents come under the age group of 51-60 years 111 (9.80%) and 26 (2.29%) of
respondents belongs to age group of 61 & above. Majority of the television media professionals
are Graduates i.e. 536 (47.35%); there are Media Professionals with good academic
qualifications, like PhD, M.Phil. Post Graduate, Graduate, Diploma, Certificate courses in
Journalism and Mass communication and few with other technical qualification.
6.2 Library Usage
The library visit among the respondents was studied and it was found that majority of
media professionals have the habit of visiting the library regularly. The Table-2 shows the
library visit by both entertainment and news professionals.
The Table-5 depicts that 995 (87.89 of respondents opine as „Yes‟ i.e. visit the library
and 137 (12.10) of respondents opine as „No‟ i.e. do not visit the library.
Table-2: Library Usage
Library Visit Entertainment
(N=313)
News
(N=819)
Total
(N=1132)
Yes 289 (92.33) 706 (86.20) 995 (87.89)
No 24 (07.66) 113 (13.79) 137 (12.10)
X2= 7.998, df=1, P= 0.004
The χ2-test conducted for 2 d.f. at the 5% level of significance shows that there is a significant
relationship between library visit and the respondents (X2= 7.998, df=1, P= 0.004).
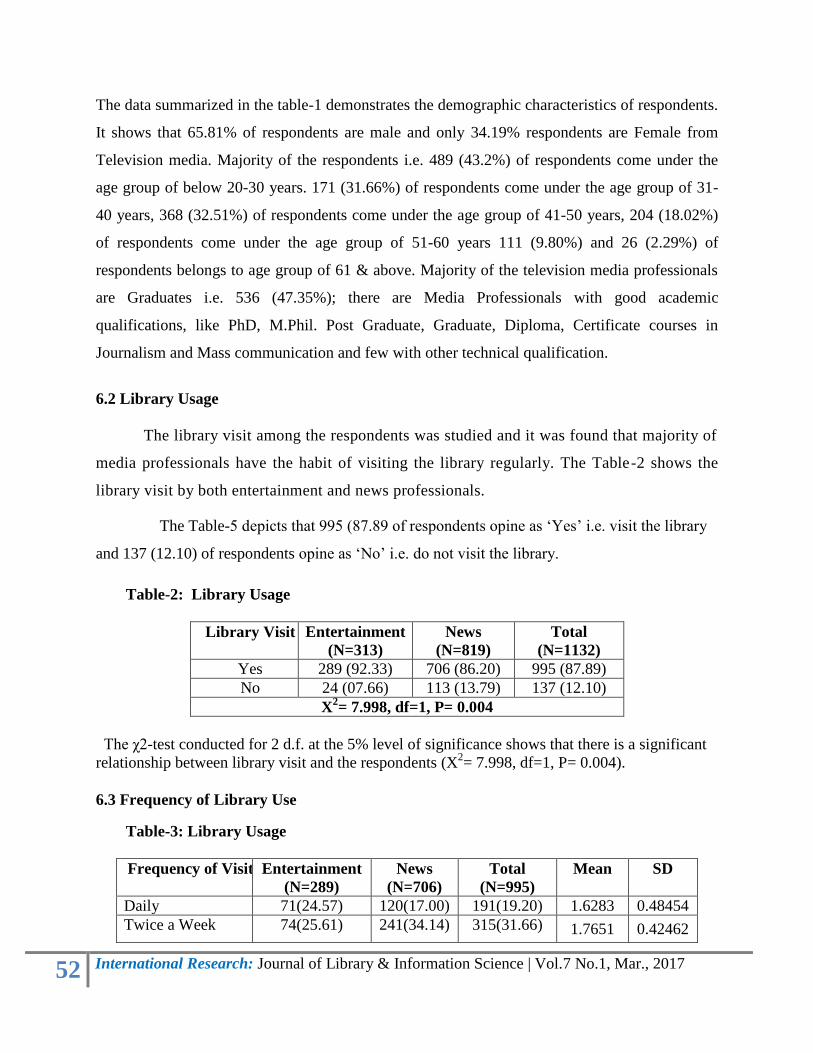
6.3 Frequency of Library Use
Table-3: Library Usage
Frequency of Visit Entertainment
(N=289)
News
(N=706)
Total
(N=995)
Mean SD
Daily 71(24.57) 120(17.00) 191(19.20) 1.6283 0.48454
Twice a Week 74(25.61) 241(34.14) 315(31.66) 1.7651 0.42462
53 International Research: Journal of Library & Information Science | Vol.7 No.1, Mar., 2017
Once in a Week 58(20.07) 75(10.62) 133(13.37) 1.5639 0.49777
Fortnightly 34(11.76) 81(11.47) 115(11.56) 1.7043 0.45833
Monthly 15(05.19) 63(08.92) 78(07.84) 1.8077 0.39666
Occasionally 37(12.80) 126(17.85) 163(16.38) 1.7730 0.42018
X2= 31.369, df=5, P=.000
The Table-3 also depicts that 71(24.57%) of entertainment channels professionals visit
the library „Daily‟, followed by 74 (25.61%) of entertainment channels professionals visit „Twice
a Week‟, 58(20.07) of entertainment channels professionals visit 58(20.07) „Once in a Week,
34(11.76%) of entertainment channels professionals visit „Fortnightly ‟, 15(05.19) of
entertainment channels professionals visit „Monthly‟ and 37(12.80) of entertainment channels
professionals visit „Occasionally‟ .
About 241(34.14) of news channels professionals visit the library „Twice a Week‟,
followed by 120(17.00%) of news channels professionals visit „Daily‟, 75(10.62%) visit „Once
in a week‟ 81(11.47) visit Fortnightly, 63(08.92) Monthly and 126(17.85) of news channels
professionals visit „Occasionally‟.
The χ2-test conducted for 2 d.f. at the 5% level of significance shows that there
is a significant relationship between frequency of visit to the library and the respondents (χ2=
1.151E2, df=3, p=0.000<0.05).
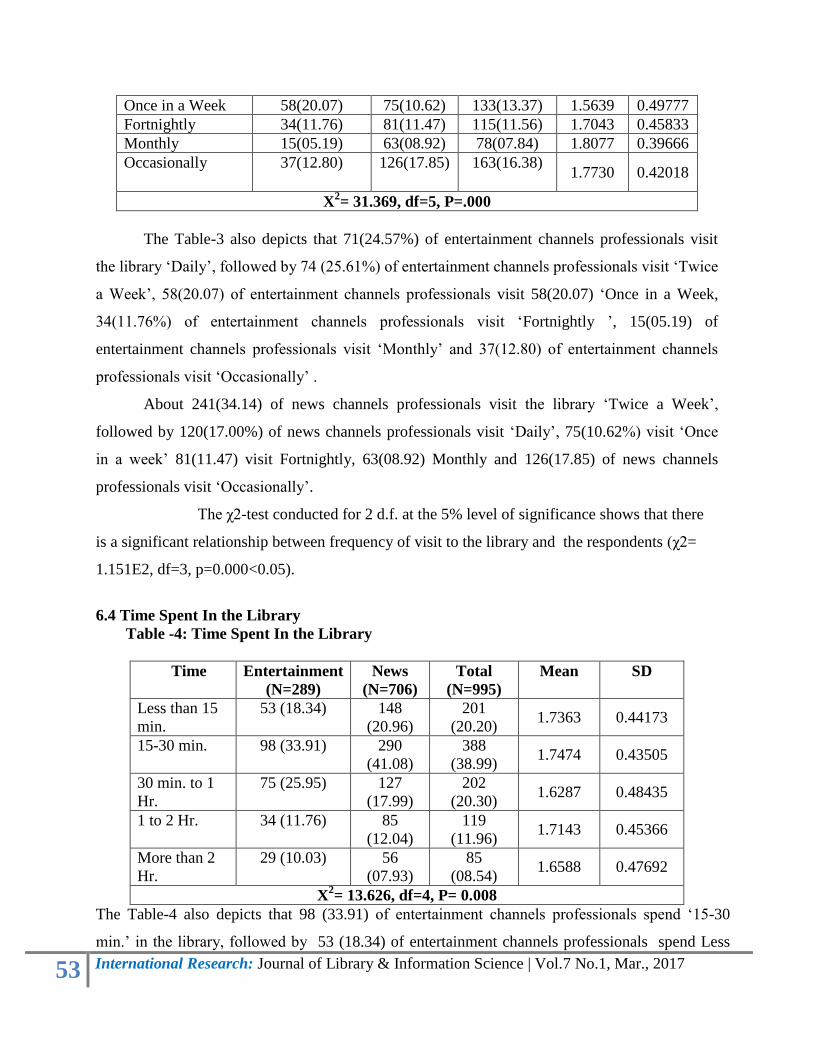
6.4 Time Spent In the Library
Table -4: Time Spent In the Library
Time Entertainment
(N=289)
News
(N=706)
Total
(N=995)
Mean SD
Less than 15
min.
53 (18.34) 148
(20.96)
201
(20.20) 1.7363 0.44173
15-30 min. 98 (33.91) 290
(41.08)
388
(38.99) 1.7474 0.43505
30 min. to 1
Hr.
75 (25.95) 127
(17.99)
202
(20.30) 1.6287 0.48435
1 to 2 Hr. 34 (11.76) 85
(12.04)
119
(11.96) 1.7143 0.45366
More than 2
Hr.
29 (10.03) 56
(07.93)
85
(08.54) 1.6588 0.47692
X2= 13.626, df=4, P= 0.008
The Table-4 also depicts that 98 (33.91) of entertainment channels professionals spend „15-30
min.‟ in the library, followed by 53 (18.34) of entertainment channels professionals spend Less
54 International Research: Journal of Library & Information Science | Vol.7 No.1, Mar., 2017
than 15 min. ‟, 75 (25.95) of entertainment channels professionals spend „30 min. to 1 Hours‟ and
36(10.31%) of entertainment channels professionals spend „More than 3 Hours‟ in the library.
About of 357 (40.84%) of students spend „2-3 Hours‟ in the library, followed by 223
(25.51) of students spend „1-2 Hour‟, 188 (21.51%) of students spend „More than 3 Hours‟ and 29
(10.03) of students spend „More than 2 Hours‟ in the library.
The χ2-test conducted for 2 d.f. at the 5% level of significance shows that there is a
significant relationship between average time spent in the library and the respondents (X2=
13.626, df=4, P= 0.008).
6.5 Purpose of using library
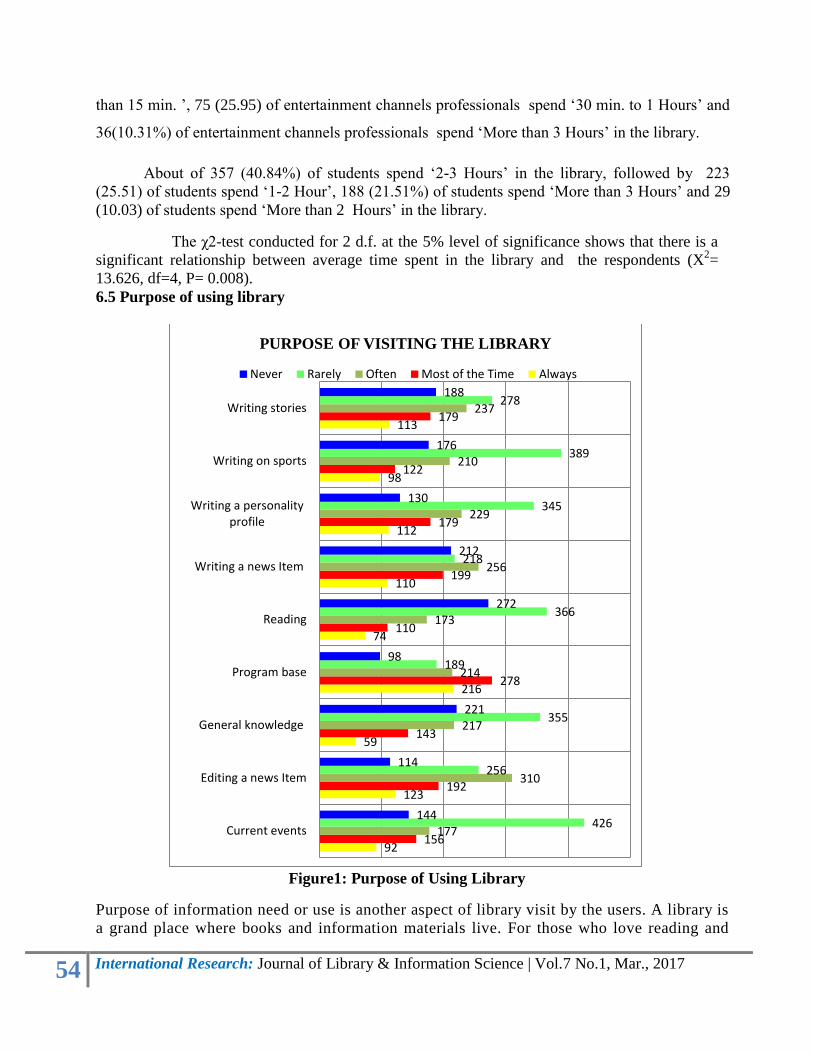
Figure1: Purpose of Using Library
Purpose of information need or use is another aspect of library visit by the users. A library is
a grand place where books and information materials live. For those who love reading and
92
123
59
216
74
110
112
98
113
156
192
143
278
110
199
179
122
179
177
310
217
214
173
256
229
210
237
426
256
355
189
366
218
345
389
278
144
114
221
98
272
212
130
176
188
Current events
Editing a news Item
General knowledge
Program base
Reading
Writing a news Item
Writing a personalityprofile
Writing on sports
Writing stories
PURPOSE OF VISITING THE LIBRARY
Never Rarely Often Most of the Time Always
55 International Research: Journal of Library & Information Science | Vol.7 No.1, Mar., 2017
collecting literature, a library can be a magical place of imagination. There are certain
purposes for which the respondents make use of the library, based on the facilities
available/provided in the library. The purpose of visiting the library has been summarized in
Table-5.
The Figure-1 depicts that the purpose Current Events is Rarely 426 (42.81), for Editing a
News Item is Often 310 (31.16), for General Knowledge is Rarely (35.68), for Program Base is
Most of the Time 278 (27.94), for Reading is Rarely 366 (36.78), for Writing a news Item is
Often 256(25.73), for Writing a personality profile is Rarely 345 (34.67), for Writing on sports
is Rarely 389 (39.10), and Writing stories purpose is Rarely 278 (27.94).
6.6 Specific Information needed from media library
Table- 5: Specific Information needed from media library
Type of
Information
Prefer
(N=995)
Very
Much
Preferable
Fairly
Preferable
Preferable Slightly
Preferable
Not at all
Preferable
Business/finance 140
(14.07)
156
(15.68)
272
(27.34)
316
(31.76)
111
(11.16)
Educational
activities
136
(13.67)
144
(14.47)
235
(23.62)
345
(34.67)
135
(13.57)
Entertainment 217
(21.81)
273
(27.44)
220
(22.11)
187
(18.79)
98
(09.85)
Health 152
(15.28)
219
(22.01)
244
(24.52)
210
(21.11)
170
(17.09)
Hobbies and
recreational
activities
127
(12.76)
205
(20.60)
254
(25.53)
215
(21.61)
194
(19.50)
Personalities 124
(12.46)
183
(18.39)
345
(34.67)
223
(22.41)
120
(12.06)
Political
activities
135
(13.57)
192
(19.30)
336
(33.77)
218
(21.91)
114
(11.46)
Religious
activities
139
(13.97)
218
(21.91)
245
(24.62)
218
(21.91)
175
(17.59)
Social activities 129
(12.96)
204
(20.50)
254
(25.53)
244
(24.52)
164
(16.48)
Sports 116
(11.66)
210
(21.11)
321
(32.26)
212
(21.31)
136
(13.67)
X2=337.762 , df=36, P=0.00
The Specific Information needed from media library by the respondents has been summarized in
Table-5.
56 International Research: Journal of Library & Information Science | Vol.7 No.1, Mar., 2017
Media Professionals, like their counterparts in their professional groups demonstrate a
wide diversity of information needs. They need all kinds of information on variety of
subjects; the larger the television, the greater the demand for precise and diversified
information.
Table 6 shows that Media Professionals mainly needed information on following information
and ranked this area first by the journalists. It shows the professionals preferred
Business/finance information Slightly Prefer 316 (31.76), Educational activities information
Slightly Prefer 345 (34.67), Entertainment information Fairly Prefer 273 (27.44), Health
information Preferable 244 (24.52), Hobbies and recreational activities information Preferable
254 (25.53), Personalities information Preferable 345 (34.67), Political activities information
Preferable 336 (33.77), Religious activities information Preferable245 (24.62), Social activities
information Preferable 254 (25.53), and Sports information Preferable 321 (32.26)
The χ2-test conducted for 2 d.f. at the 5% level of significance shows that there is a
significant relationship between type of information prefer and the respondents (χ2=337.762,
df=36, p=0.00<0.05).
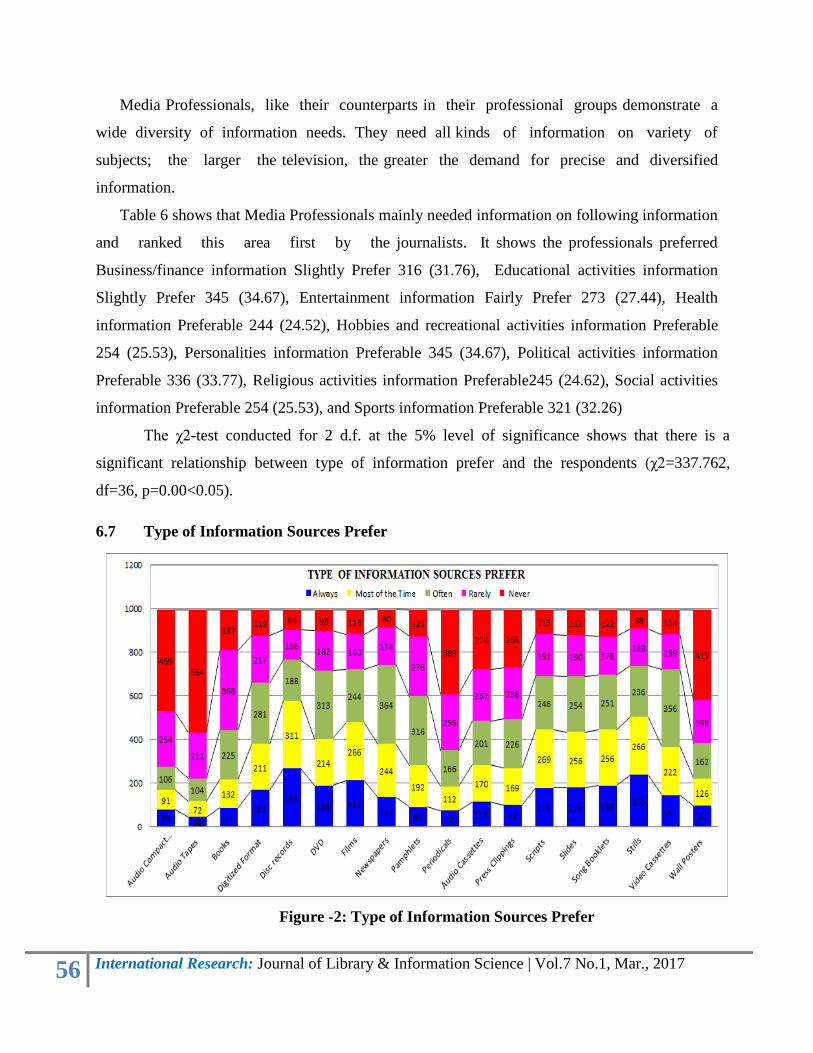
6.7 Type of Information Sources Prefer
Figure -2: Type of Information Sources Prefer
57 International Research: Journal of Library & Information Science | Vol.7 No.1, Mar., 2017
Figure 2 shows that Media Professionals mainly preferred types of information sources on
following and ranked this area first by the journalists. Most of the Media Professionals
preferred that 466 (46.83%) of respondents „Never‟ prefer audio compact discs, About 564
(56.68%) of respondents „Never‟ prefer Audio Tapes, About 366 (36.78%) of respondents
„Rarely‟ prefer Books, About 281 (28.24%) of respondents „Often‟ prefer Digitized format of
ancillary film material, About 311 (31.26%) of respondents „Most of the Time‟ prefer Disc
records, About 313 (31.46%) of respondents „Often‟ prefer DVD, About 266 (26.73%) of
respondents „Most of the Time‟ prefer Films, About 364 (36.58%) of respondents „Often‟
prefer Newspapers, About 316 (31.76%) of respondents „Often‟ prefer Pamphlets/Folders,
About 389 (39.10%) of respondents „Never‟ prefer Periodicals, About 274 (27.54%) of
respondents „Never‟ prefer Pre-recorded audio cassettes, About 266 (26.73%) of respondents
„Never‟ prefer Press Clipping, About 269 (27.04%) of respondents „Most of the Time‟ prefer
Scripts, About 256 (25.73%) of respondents „Most of the Time‟ prefer Slides, About 256
(25.73%) of respondents „Most of the Time‟ prefer Song Booklets, About 266 (26.73%) of
respondents „Most of the Time‟ prefer Stills, and About 356 (35.78%) of respondents „Often‟
prefer video cassettes, About 415 (41.71%) of respondents „Never‟ prefer wall posters.
6.8 Information Gathering on Definite Topic
Table- 6: Information Gathering on Definite Topic
Sources Consistently Rarely Never
Searching the Shelves 146(14.67) 341(34.27) 508(51.06)
Asking the Librarian 536(53.87) 346(34.77) 113(11.36)
Discussion with Colleagues 351(35.28) 391(39.3) 253(25.43)
Subject Bibliography 158(15.88) 236(23.72) 601(60.4)
Library OPAC 62(6.23) 114(11.46) 819(82.31)
X2= 1444.293, df=8, P=0.00
The Information Gathering on Definite Topic in the library for accessing needed
documents has been summarized in Table-6.
The Table-6 depicts that 508 (51.06%) of respondents „Never‟ Searching the information on
Shelves, followed by 341 (31.27%) of respondents search „Rarely‟, and 146 (14.61%) of
respondents „Consistently‟ search information on Shelves.
58 International Research: Journal of Library & Information Science | Vol.7 No.1, Mar., 2017
About 536 (53.87%) of respondents „Consistently‟ Searching the by information asking the
librarian, followed by 345 (31.77%) of respondents asking „Rarely‟, and 113 (11.36%) of
respondents „Never‟ asking librarian for information search.
About 391 (39.3%) of respondents „Rarely‟ Searching the information Discussion with
Colleagues, followed by 351 (35.28) of respondents discuss „Rarely‟, and 253 (25.43%) of
respondents „Never‟ Discuss with Colleagues for information search.
About 601 (60.04%) of respondents „Never‟ Searching the information on Subject
Bibliography, followed by 236 (23.72%) of respondents search „Rarely‟, and 158 (15.88%) of
respondents „Consistently‟ search information on Subject Bibliography.
About 819 (82.31%) of respondents „Never‟ Searching the information on Library OPAC,
followed by 114 (11.46%) of respondents search „Rarely‟, and 62 (6.23%) of respondents
„Consistently‟ search information on Library OPAC.
The χ2-test conducted for 2 d.f. at the 5% level of significance shows that there is a
significant relationship between access to information searching for professional activities and the
respondents (χ2=1444.293, df=8, p=0.000<0.05).
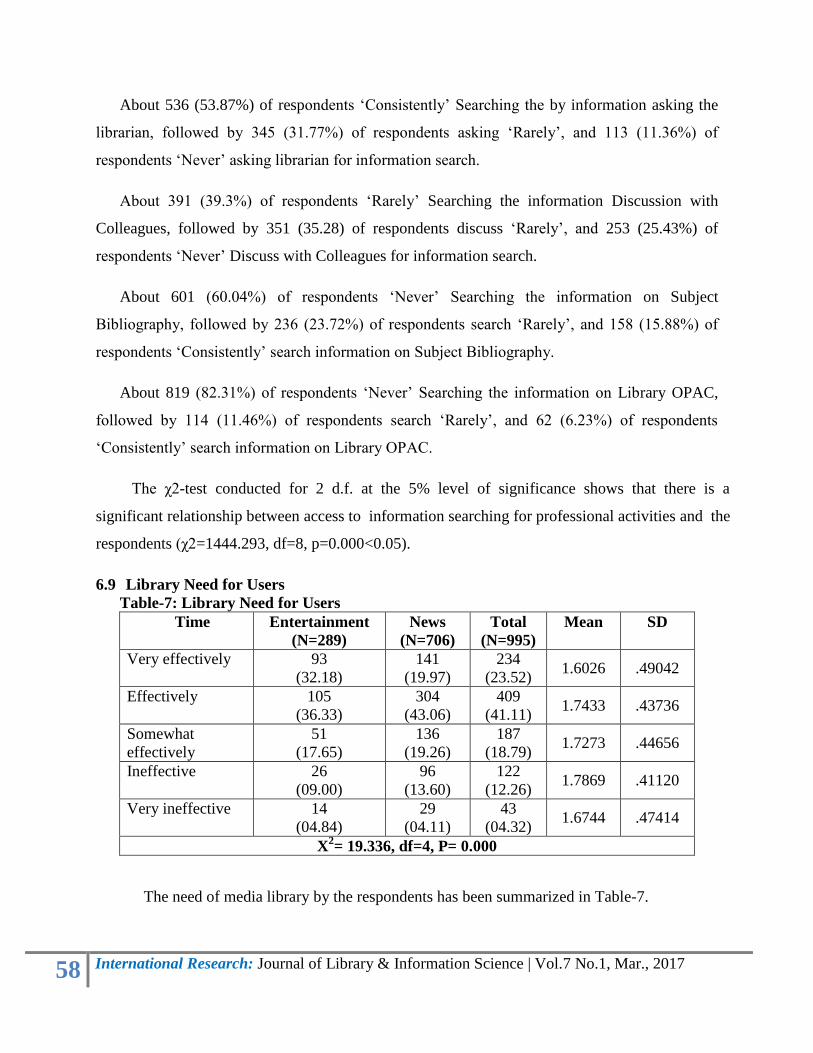
6.9 Library Need for Users
Table-7: Library Need for Users
Time Entertainment
(N=289)
News
(N=706)
Total
(N=995)
Mean SD
Very effectively 93
(32.18)
141
(19.97)
234
(23.52) 1.6026 .49042
Effectively 105
(36.33)
304
(43.06)
409
(41.11) 1.7433 .43736
Somewhat
effectively
51
(17.65)
136
(19.26)
187
(18.79) 1.7273 .44656
Ineffective 26
(09.00)
96
(13.60)
122
(12.26) 1.7869 .41120
Very ineffective 14
(04.84)
29
(04.11)
43
(04.32) 1.6744 .47414
X2= 19.336, df=4, P= 0.000
The need of media library by the respondents has been summarized in Table-7.
59 International Research: Journal of Library & Information Science | Vol.7 No.1, Mar., 2017
The Table-7 depicts that 409 (41.11%) of respondents are says „Effectively „with the
library collection with mean 1. 7433 and SD 0. 43736, followed by 234 (23.52%) of respondents
are „Very effectively‟ with 1.6026and SD 0.49042, 187 (18.79%) of respondents are „Somewhat
effectively‟ with 1.7273 and SD 0.44656, 122 (12.26%) of respondents are „Ineffective „ with
1.7869 and SD 0.41120 and 43 (04.32%) of respondents are says „Very ineffective „with 1.6744
and SD 0.47414.
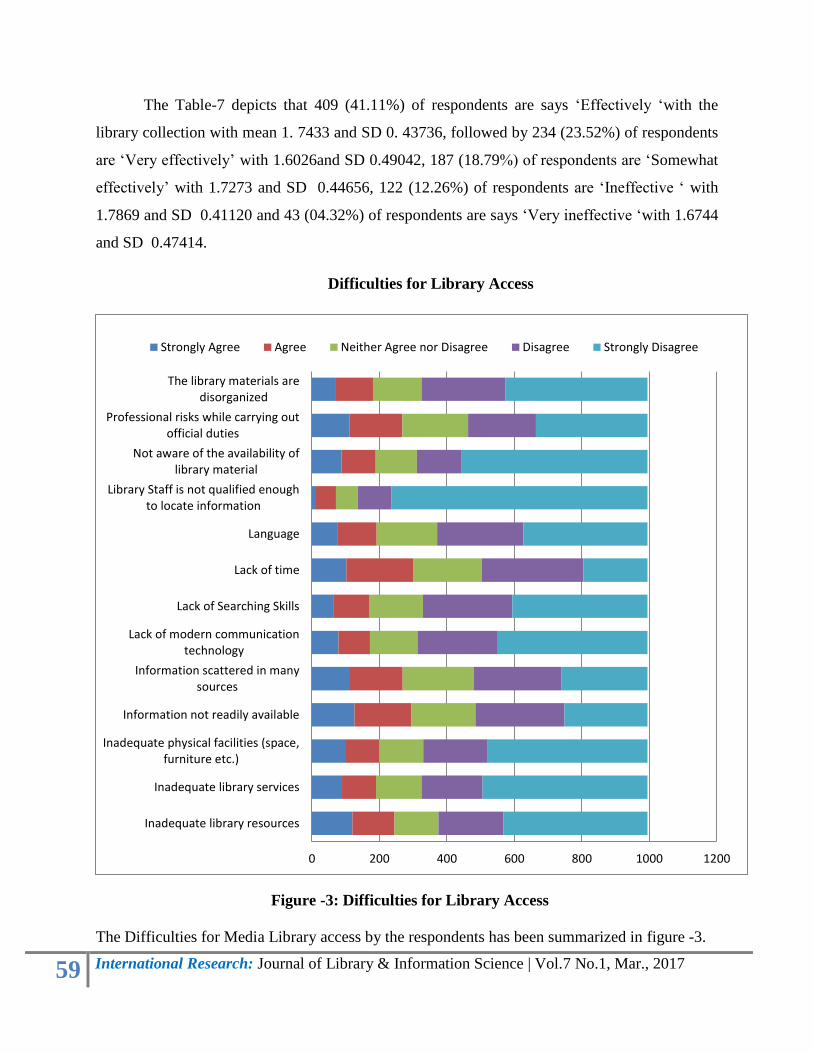
Difficulties for Library Access
Figure -3: Difficulties for Library Access
The Difficulties for Media Library access by the respondents has been summarized in figure -3.
0 200 400 600 800 1000 1200
Inadequate library resources
Inadequate library services
Inadequate physical facilities (space,furniture etc.)
Information not readily available
Information scattered in manysources
Lack of modern communicationtechnology
Lack of Searching Skills
Lack of time
Language
Library Staff is not qualified enoughto locate information
Not aware of the availability oflibrary material
Professional risks while carrying outofficial duties
The library materials aredisorganized
Strongly Agree Agree Neither Agree nor Disagree Disagree Strongly Disagree
60 International Research: Journal of Library & Information Science | Vol.7 No.1, Mar., 2017
Media Professionals face many difficulties while seeking information in their day to day
work. These difficulties are generally observed to hinder or come in the way of information
seeking by the journalists. The main difficulties faced while accessing libraries by the
respondents has been summarized in Table-8 depicts that 428 (43.02%) of respondents
„Strongly disagree‟ that there are Inadequate library resources, About 489 (49.15%) of
respondents „Strongly disagree‟ that there are Inadequate library services, About 474 (47.64%)
of respondents „Strongly disagree‟ that there are Inadequate physical facilities, About 264
(26.53%) of respondents „Disagree‟ because of Information not readily available, About 260
(26.13%) of respondents „Disagree‟ that the Information scattered in many sources, About 444
(44.62%) of respondents „Strongly Disagree‟ due to lack of modern communication
technology, About 401 (40.30%) of respondents „Strongly Disagree‟ due to lack of Searching
Skills, About 301 (30.25%) of respondents „Disagree‟ due to lack of time, About 368 (36.98%)
of respondents „Strongly Disagree‟ About 760 (76.38%) of respondents „Strongly Disagree‟
due to Library Staff are not qualified enough to locate information, About 551 (55.38%) of
respondents „Strongly Disagree‟ due to lack of awareness of the availability of library material,
About 331 (33.27%) of respondents „Strongly Disagree‟ due to Professional risks while
carrying out official duties, and About 421 (42.31%) of respondents „Strongly Disagree‟ that
the library materials are disorganized.
7. CONCLUSION:
The purpose of this study is to determine the library collections and services usage
behavior of television media professionals in Bangalore. They usually consult the source and
channel which is easily available and accessible. Most of their work assignments need
information seeking from specialized sources of information. Media professionals need good
library facilities and services as well as online data facilities. This study found that library
and specialized collations are the main channels of information in use. Media professionals in
this study also commonly use the libraries, as they are easily accessible and important
channel of information. And also television media professionals‟ information seeking behavior
is very distinct and pronounced as compared to other professionals.The study revealed that
the Television Professionals commonly use media library sources and facilities. Similarly, it is
61 International Research: Journal of Library & Information Science | Vol.7 No.1, Mar., 2017
also noted that program based information sources is the most used by the television
professionals, whereas other library services and applications are used moderately.
To improve the services and facilities of the library it is recommended that the libraries shall
adopt the practice of taking feedback from the users by circulating an online questionnaire which
will certainly help strengthen the library resources and services. Finally, it is suggested that the
media librarians need to work in collaboration with the media professional‟s information seeking
behaviour by re-evaluating the collection development policy, instructional programmes,
services and facilities based on the needs of the current users.
8. REFERENCE:
1. Joseph, R. (1993). How Indian journalists use libraries. Information development, 9(1-2),
70-75.Kemman, H.(2013). Dutch Journalism in the Digital Age. Icono 14, 11(2), 163-
181.
2. Kadli, J. H., & Hanchinal, V. B. (2015). Information seeking behaviour of law news
channels professionals in the changing digital environment. DESIDOC Journal of
Library & Information Technology, 35(1).
3. Ansari, M. N., & Zuberi, N. A. (2010). Information seeking behaviour of media
professionals in Karachi. Malaysian Journal of Library & Information Science, 15(2), 71-
84.
4. Santosh Chavan (2014). Information Seeking Behaviour in Electronic Environment: A
Study of Journalist in Dharwad District, Karnataka. International Journal of Digital
Library Services. 04(04), 162-171.
5. Singh, G., & Sharma, M. (2013). Information seeking behavior of newspaper journalists.
International Journal of Library and Information Science, 5(7), 225-234.
6. Kumar, P., & Mahajan, P. (2014). Information Resources Management of Print Media
Libraries of Chandigarh, Delhi and Punjab: A Study. International Journal of
Information Dissemination and Technology, 4(2), 183-186.
7. Gupta, Kamlesh Kumar(2015).A comparative study of information needs and
information seeking behaviour of print and electronic media journalists in MP with
special reference to Rewa division. (Unpublished doctoral dissertation). Dr. Harisingh
Gour Vishwavidyalaya, Sagar, Madhya Pradesh, India.
8. Martin, N., & Comm, B. A. (2014, June). Information Verification in the Age of Digital
Journalism. In Special Libraries Association Annual Conference, Vancouver.
9. Obijiofor, L & Hanusch, F (2013).News channels professionals perception and the
use of the Internet as a news channel. Covenant Journal of Communication (CJOC),
1(1), 1-18
Follow us on: IRJLIS, Facebook, Twitter