Embed Size (px)
Citation preview

BANKING It’s Time to Bank on Banks
JANUARY 16, 2013
Hatim Broachwala, CFA +91-22-6184 4329 hatim.broachwala @karvy.com Paresh Jain +91-22-6184 4324 paresh.jain @karvy.com

January 16, 2013
Banking Institutional Equities
India Research
THEME REPORT
Analysts Contact
Hatim Broachwala, CFA
022‐6184 4329
Paresh Jain
022 6184 4324
It’s Time to Bank on Banks The Banking sector has given a return of 42%, outperforming the broader
markets by whopping 20%, over last 12 months. While the large private banks
i.e. ICICI Bank, HDFC Bank & Axis Bank gave a return of >45% in last one
year, the PSU banks have notably outperformed over last month.
Key Sectoral Dynamics
Rate Cut – Likely from Q4FY13 Onwards: We expect interest rate to ease
by 125‐150bps in CY13, supported by significant correction in core
inflation, OIS rates and recent RBI’s policy statement. RBI is likely to shift
its focus towards protecting growth as against resisting inflation.
Asset Quality – Expected to Improve from FY14 Onwards: We believe
that the asset quality to start improving from FY14E onwards on the back
of improvement in PMI, series of reforms undertaken recently, likely
decline in slippages and moderation in NPA formations for the PSU banks.
Credit Growth – Likely to Remain Buoyant: Credit growth continues to
remain above RBI’s target despite sluggishness in the economy. We expect
improvement in demand, driven by lower interest rate and improvement
in lending climate.
Outlook & Valuation
Even after the recent rally, most of the PSU Banks are trading at discount to
their mean valuation, while few select banks are even trading closer to their 1‐
SD valuation. We believe that in a scenario of economic revival, the PSU banks
offer an attractive risk reward. We have upgraded our recommendations on
four PSU banks (Canara, PNB, SBI & UBI), and downgraded our stance on two
private sector banks (ING & Karur), while revising the target price of the banks
under our coverage except for CUB.
Valuation Summary
Rating Target Price P/E P/ABV
Company CMP New Old New Old FY14E FY15E FY14E FY15E
Axis Bank 1,424 BUY BUY 1,725 1,330 10.3 8.9 1.9 1.6
Bank of Baroda 878 HOLD HOLD 985 740 5.6 4.6 1.1 0.9
Bank of India 385 BUY BUY 465 395 4.8 4.2 1.0 0.8
Canara Bank 523 HOLD SELL 570 410 5.5 4.7 1.0 0.8
City Union Bank 61 HOLD HOLD 65 65 7.4 5.9 1.6 1.3
HDFC Bank 668 HOLD HOLD 690 630 21.0 18.2 3.8 3.3
ICICI Bank # 1,204 BUY BUY 1,520 1,155 13.6 11.2 1.7 1.5
Indian Overseas Bank 92 SELL SELL 96 70 5.4 4.4 0.7 0.7
ING Vysya Bank 581 HOLD BUY 625 495 12.3 10.2 1.8 1.5
J&K Bank 1,358 BUY BUY 1,560 1,500 6.2 5.3 1.2 1.0
Karur Vysya Bank 556 HOLD BUY 610 535 7.7 6.3 1.6 1.4
Oriental Bank of Commerce 347 HOLD HOLD 365 320 5.8 5.0 0.9 0.8
Punjab National Bank 901 BUY SELL 1045 695 4.9 4.3 1.0 0.9
State Bank of India # 2,490 BUY SELL 2,885 1,980 6.9 5.9 1.5 1.2
Syndicate Bank 144 BUY BUY 175 150 4.4 4.1 0.9 0.7
Union Bank of India 269 BUY HOLD 315 260 4.7 4.0 1.0 0.9
Source: Karvy Institutional Research; # Valuation after adjusting for subsidiaries; CMP is as of 15Jan2013

2
January 16, 2013
Banking
Table of contents. Executive Summary ∙∙∙∙∙∙∙∙∙∙∙∙∙∙∙∙∙∙∙∙∙∙∙∙∙∙∙∙∙∙∙∙∙∙∙∙∙∙∙∙∙∙∙∙∙∙∙∙∙∙∙∙∙∙∙∙∙∙∙∙∙∙∙∙∙∙∙∙∙∙∙∙∙∙∙∙∙∙∙∙∙∙∙∙∙∙∙∙∙∙∙∙∙∙∙∙∙∙∙∙∙∙∙∙∙∙∙∙∙∙∙∙∙∙∙∙∙∙∙∙∙∙∙∙∙∙∙∙∙∙∙∙∙∙∙∙∙∙∙∙∙∙∙∙∙∙∙∙∙∙∙∙∙ 3 Rate Cut – A Key Trigger to Watch Out For ∙∙∙∙∙∙∙∙∙∙∙∙∙∙∙∙∙∙∙∙∙∙∙∙∙∙∙∙∙∙∙∙∙∙∙∙∙∙∙∙∙∙∙∙∙∙∙∙∙∙∙∙∙∙∙∙∙∙∙∙∙∙∙∙∙∙∙∙∙∙∙∙∙∙∙∙∙∙∙∙∙∙∙∙∙∙∙∙∙∙∙∙∙∙∙∙∙∙∙∙∙∙∙∙∙∙∙∙∙∙∙∙∙∙∙ 4
A. Bankex Rallies on Expectations of Rate Cut ....................................................................................................................... 4 B. Core Inflation below 5% for 1st Time in 32 Months ............................................................................................................ 4 C. Correction in OIS also Suggests Correction in Rates ......................................................................................................... 5 D. RBI Turns Dovish – Expect Policy Rates to Start Easing in Q4FY13 ............................................................................... 6
Asset Quality to Improve from FY14 Onwards ∙∙∙∙∙∙∙∙∙∙∙∙∙∙∙∙∙∙∙∙∙∙∙∙∙∙∙∙∙∙∙∙∙∙∙∙∙∙∙∙∙∙∙∙∙∙∙∙∙∙∙∙∙∙∙∙∙∙∙∙∙∙∙∙∙∙∙∙∙∙∙∙∙∙∙∙∙∙∙∙∙∙∙∙∙∙∙∙∙∙∙∙∙∙∙∙∙∙∙∙∙∙∙∙∙∙∙∙∙ 7 A. Slippage to Ease Significantly especially for PSU Banks .................................................................................................... 7 B. PMI indicates Improvement in Business Sentiment ........................................................................................................... 7 C. Govt on Reform Mode – Added Optimism .......................................................................................................................... 8 D. NPA Formation Moderating for PSU Banks ...................................................................................................................... 8 E. Credit Cost to Moderate ...................................................................................................................................................... 9 F. Provision Coverage to Improve ............................................................................................................................................ 9
Credit Growth Momentum Continues ∙∙∙∙∙∙∙∙∙∙∙∙∙∙∙∙∙∙∙∙∙∙∙∙∙∙∙∙∙∙∙∙∙∙∙∙∙∙∙∙∙∙∙∙∙∙∙∙∙∙∙∙∙∙∙∙∙∙∙∙∙∙∙∙∙∙∙∙∙∙∙∙∙∙∙∙∙∙∙∙∙∙∙∙∙∙∙∙∙∙∙∙∙∙∙∙∙∙∙∙∙∙∙∙∙∙∙∙∙∙∙∙∙∙∙∙∙∙∙∙∙ 10 A. Credit Growth remains above RBI’s Target despite Slowdown ........................................................................................ 10 B. Credit Growth – Corporate Segment Rules the Roost ....................................................................................................... 10 C. Visible Slowdown in Credit to Vulnerable Sectors ............................................................................................................ 11 D. Engines for Retail Credit keep Altering ............................................................................................................................ 12 E. Lower Loan Origination – Minimal Default Risk ............................................................................................................. 12 F. Lower Deposit Growth – Pressure on Balance‐sheet ......................................................................................................... 13 G. Liquidation of Excess SLR can Provide Relief ................................................................................................................... 13
NIMs – Marginal Compression is Likely ∙∙∙∙∙∙∙∙∙∙∙∙∙∙∙∙∙∙∙∙∙∙∙∙∙∙∙∙∙∙∙∙∙∙∙∙∙∙∙∙∙∙∙∙∙∙∙∙∙∙∙∙∙∙∙∙∙∙∙∙∙∙∙∙∙∙∙∙∙∙∙∙∙∙∙∙∙∙∙∙∙∙∙∙∙∙∙∙∙∙∙∙∙∙∙∙∙∙∙∙∙∙∙∙∙∙∙∙∙∙∙∙∙∙∙∙∙ 14 A. Positive Correlation between Interest Rate & NIMs ........................................................................................................ 14 B. Improvement in CASA to Annul Sharp Fall in Margins ................................................................................................. 14
Valuations – Seem to be Reasonable ∙∙∙∙∙∙∙∙∙∙∙∙∙∙∙∙∙∙∙∙∙∙∙∙∙∙∙∙∙∙∙∙∙∙∙∙∙∙∙∙∙∙∙∙∙∙∙∙∙∙∙∙∙∙∙∙∙∙∙∙∙∙∙∙∙∙∙∙∙∙∙∙∙∙∙∙∙∙∙∙∙∙∙∙∙∙∙∙∙∙∙∙∙∙∙∙∙∙∙∙∙∙∙∙∙∙∙∙∙∙∙∙∙∙∙∙∙∙∙∙∙∙∙∙ 15 A. PSU Banks Trading at Discount to Mean Valuation ....................................................................................................... 15 B. ROA & P/ABV Matrix ...................................................................................................................................................... 15
Risk to Our Recommendations ∙∙∙∙∙∙∙∙∙∙∙∙∙∙∙∙∙∙∙∙∙∙∙∙∙∙∙∙∙∙∙∙∙∙∙∙∙∙∙∙∙∙∙∙∙∙∙∙∙∙∙∙∙∙∙∙∙∙∙∙∙∙∙∙∙∙∙∙∙∙∙∙∙∙∙∙∙∙∙∙∙∙∙∙∙∙∙∙∙∙∙∙∙∙∙∙∙∙∙∙∙∙∙∙∙∙∙∙∙∙∙∙∙∙∙∙∙∙∙∙∙∙∙∙∙∙∙∙∙∙∙∙∙ 16
Companies Section Axis Bank‐Superior Asset Quality & Business Growth; Maintain BUY ∙∙∙∙∙∙∙∙∙∙∙∙∙∙∙∙∙∙∙∙∙∙∙∙∙∙∙∙∙∙∙∙∙∙∙∙∙∙∙∙∙∙∙∙∙∙∙∙∙∙∙∙∙∙∙∙∙∙∙∙∙∙∙∙∙∙∙∙∙∙∙∙∙∙∙∙∙∙∙∙∙∙∙ 17
Bank of Baroda‐ Management change can be tricky; Maintain HOLD ∙∙∙∙∙∙∙∙∙∙∙∙∙∙∙∙∙∙∙∙∙∙∙∙∙∙∙∙∙∙∙∙∙∙∙∙∙∙∙∙∙∙∙∙∙∙∙∙∙∙∙∙∙∙∙∙∙∙∙∙∙∙∙∙∙∙∙∙∙∙∙∙∙∙∙∙∙∙∙∙∙∙∙∙ 20 Bank of India‐ Pressure on Asset Quality to Ease, NIMs Set to Improve; Maintain BUY ∙∙∙∙∙∙∙∙∙∙∙∙∙∙∙∙∙∙∙∙∙∙∙∙∙∙∙∙∙∙∙∙∙∙∙∙∙∙∙∙∙∙∙∙∙∙∙∙∙∙∙∙∙∙∙ 23
Canara Bank‐ Business Growth to Gain Momentum, Pressure on Asset Quality to Ease; Upgrade to HOLD ∙∙∙∙∙∙∙∙∙∙∙∙∙∙∙∙∙∙∙∙∙∙∙∙ 26
City Union Bank‐ Positives Priced‐in; Maintain HOLD ∙∙∙∙∙∙∙∙∙∙∙∙∙∙∙∙∙∙∙∙∙∙∙∙∙∙∙∙∙∙∙∙∙∙∙∙∙∙∙∙∙∙∙∙∙∙∙∙∙∙∙∙∙∙∙∙∙∙∙∙∙∙∙∙∙∙∙∙∙∙∙∙∙∙∙∙∙∙∙∙∙∙∙∙∙∙∙∙∙∙∙∙∙∙∙∙∙∙∙∙∙∙∙∙∙∙ 29
HDFC Bank‐ Superior Asset Quality, Earning Consistency; Maintain HOLD ∙∙∙∙∙∙∙∙∙∙∙∙∙∙∙∙∙∙∙∙∙∙∙∙∙∙∙∙∙∙∙∙∙∙∙∙∙∙∙∙∙∙∙∙∙∙∙∙∙∙∙∙∙∙∙∙∙∙∙∙∙∙∙∙∙∙∙∙∙∙∙∙ 32
ICICI Bank‐ Improved Asset Quality, NIMs to Sustain at Current Levels; Maintain BUY ∙∙∙∙∙∙∙∙∙∙∙∙∙∙∙∙∙∙∙∙∙∙∙∙∙∙∙∙∙∙∙∙∙∙∙∙∙∙∙∙∙∙∙∙∙∙∙∙∙∙∙∙∙ 35
Indian Overseas Bank‐ Worst not yet over; Stock to Continue to Trade at Discount to Peers; Maintain SELL ∙∙∙∙∙∙∙∙∙∙∙∙∙∙∙∙∙∙∙∙∙ 38
ING Vysya Bank‐ Steady Performer, but Positives Priced‐in; Downgrade to HOLD ∙∙∙∙∙∙∙∙∙∙∙∙∙∙∙∙∙∙∙∙∙∙∙∙∙∙∙∙∙∙∙∙∙∙∙∙∙∙∙∙∙∙∙∙∙∙∙∙∙∙∙∙∙∙∙∙∙∙∙∙∙ 41 J&K Bank‐ Improving Fundamentals – Case for Rerating; Maintain BUY ∙∙∙∙∙∙∙∙∙∙∙∙∙∙∙∙∙∙∙∙∙∙∙∙∙∙∙∙∙∙∙∙∙∙∙∙∙∙∙∙∙∙∙∙∙∙∙∙∙∙∙∙∙∙∙∙∙∙∙∙∙∙∙∙∙∙∙∙∙∙∙∙∙∙∙∙∙∙∙ 44
Karur Vysya Bank‐ Best in Class, but Positives Priced‐in; Downgrade to HOLD ∙∙∙∙∙∙∙∙∙∙∙∙∙∙∙∙∙∙∙∙∙∙∙∙∙∙∙∙∙∙∙∙∙∙∙∙∙∙∙∙∙∙∙∙∙∙∙∙∙∙∙∙∙∙∙∙∙∙∙∙∙∙∙∙∙∙∙ 47
Oriental Bank of Commerce‐ Moderate Business Growth amid Contraction in NIMs; Maintain HOLD ∙∙∙∙∙∙∙∙∙∙∙∙∙∙∙∙∙∙∙∙∙∙∙∙∙∙∙∙ 50
Punjab National Bank‐ Biggest Beneficiary of Likely Economic Turnaround; Upgrade to BUY ∙∙∙∙∙∙∙∙∙∙∙∙∙∙∙∙∙∙∙∙∙∙∙∙∙∙∙∙∙∙∙∙∙∙∙∙∙∙∙∙∙∙∙∙ 53
State Bank of India‐ Incremental Slippages & Credit Cost to Move Southwards; Upgrade to BUY ∙∙∙∙∙∙∙∙∙∙∙∙∙∙∙∙∙∙∙∙∙∙∙∙∙∙∙∙∙∙∙∙∙∙∙∙∙∙∙ 56
Syndicate Bank‐ Stable Earning, Better Asset Quality; Maintain BUY ∙∙∙∙∙∙∙∙∙∙∙∙∙∙∙∙∙∙∙∙∙∙∙∙∙∙∙∙∙∙∙∙∙∙∙∙∙∙∙∙∙∙∙∙∙∙∙∙∙∙∙∙∙∙∙∙∙∙∙∙∙∙∙∙∙∙∙∙∙∙∙∙∙∙∙∙∙∙∙∙∙∙∙ 59
Union Bank of India‐ Asset Quality Pressure to ease, Rally to Continue; Upgrade to BUY ∙∙∙∙∙∙∙∙∙∙∙∙∙∙∙∙∙∙∙∙∙∙∙∙∙∙∙∙∙∙∙∙∙∙∙∙∙∙∙∙∙∙∙∙∙∙∙∙∙∙∙ 62
3
January 16, 2013
Banking
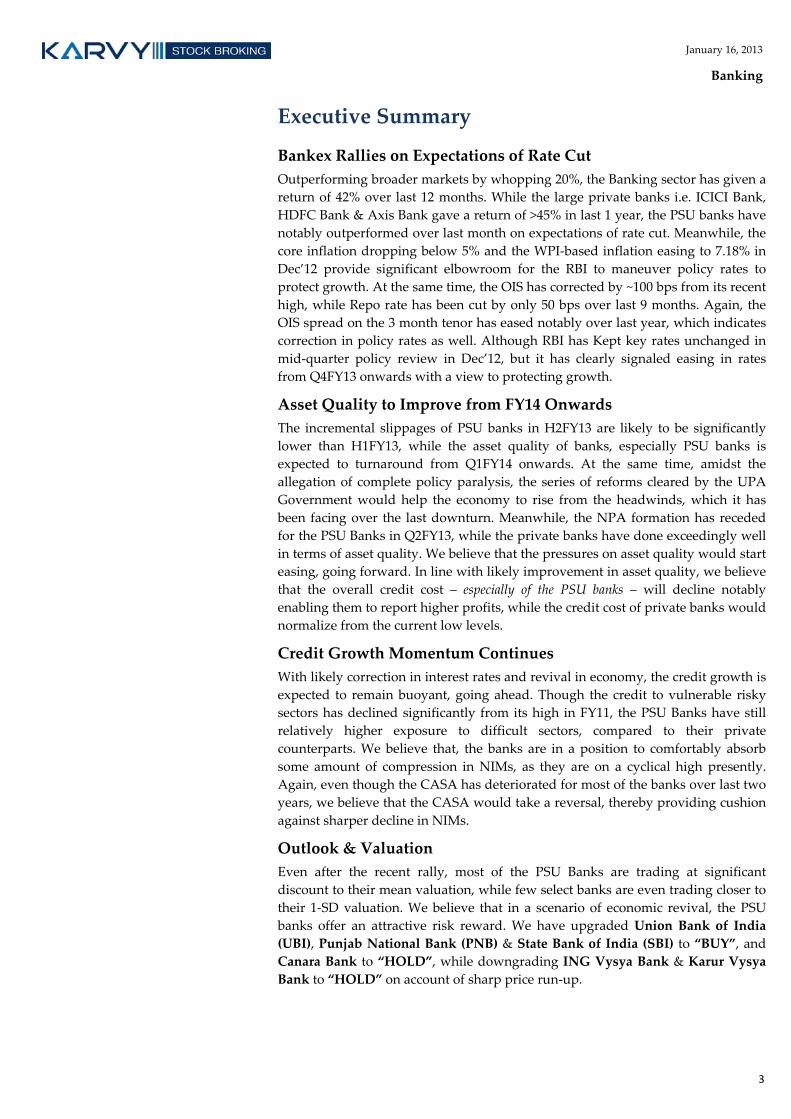
Executive Summary
Bankex Rallies on Expectations of Rate Cut
Outperforming broader markets by whopping 20%, the Banking sector has given a
return of 42% over last 12 months. While the large private banks i.e. ICICI Bank,
HDFC Bank & Axis Bank gave a return of >45% in last 1 year, the PSU banks have
notably outperformed over last month on expectations of rate cut. Meanwhile, the
core inflation dropping below 5% and the WPI‐based inflation easing to 7.18% in
Dec’12 provide significant elbowroom for the RBI to maneuver policy rates to
protect growth. At the same time, the OIS has corrected by ~100 bps from its recent
high, while Repo rate has been cut by only 50 bps over last 9 months. Again, the
OIS spread on the 3 month tenor has eased notably over last year, which indicates
correction in policy rates as well. Although RBI has Kept key rates unchanged in
mid‐quarter policy review in Dec’12, but it has clearly signaled easing in rates
from Q4FY13 onwards with a view to protecting growth.
Asset Quality to Improve from FY14 Onwards
The incremental slippages of PSU banks in H2FY13 are likely to be significantly
lower than H1FY13, while the asset quality of banks, especially PSU banks is
expected to turnaround from Q1FY14 onwards. At the same time, amidst the
allegation of complete policy paralysis, the series of reforms cleared by the UPA
Government would help the economy to rise from the headwinds, which it has
been facing over the last downturn. Meanwhile, the NPA formation has receded
for the PSU Banks in Q2FY13, while the private banks have done exceedingly well
in terms of asset quality. We believe that the pressures on asset quality would start
easing, going forward. In line with likely improvement in asset quality, we believe
that the overall credit cost – especially of the PSU banks – will decline notably
enabling them to report higher profits, while the credit cost of private banks would
normalize from the current low levels.
Credit Growth Momentum Continues
With likely correction in interest rates and revival in economy, the credit growth is
expected to remain buoyant, going ahead. Though the credit to vulnerable risky
sectors has declined significantly from its high in FY11, the PSU Banks have still
relatively higher exposure to difficult sectors, compared to their private
counterparts. We believe that, the banks are in a position to comfortably absorb
some amount of compression in NIMs, as they are on a cyclical high presently.
Again, even though the CASA has deteriorated for most of the banks over last two
years, we believe that the CASA would take a reversal, thereby providing cushion
against sharper decline in NIMs.
Outlook & Valuation
Even after the recent rally, most of the PSU Banks are trading at significant
discount to their mean valuation, while few select banks are even trading closer to
their 1‐SD valuation. We believe that in a scenario of economic revival, the PSU
banks offer an attractive risk reward. We have upgraded Union Bank of India
(UBI), Punjab National Bank (PNB) & State Bank of India (SBI) to “BUY”, and
Canara Bank to “HOLD”, while downgrading ING Vysya Bank & Karur Vysya
Bank to “HOLD” on account of sharp price run‐up.

4
January 16, 2013
Banking
Rate Cut – A Key Trigger to Watch Out For
A. Bankex Rallies on Expectations of Rate Cut Banking sector has given a return of 42%, outperforming broader markets by a
whopping 20% over last 12 months. The private banks i.e. ICICI Bank, HDFC Bank
& Axis Bank – which continued to be in flavor throughout the year – have given >45%
return in last 12 months. Though the PSU Bank traded weak in the early part of the
year, they have considerably outperformed over last month on expectations of rate
cut.
Exhibit 1: Repo & Bankex 1 year Return
Source: Bloomberg, Karvy Institutional Research
Our View: Bankex has rallied over 20% in just last 6 months, and we believe the
rally can be purely attributed to expectations of rate cut. As the Bankex has a very
strong negative correlation with movement in interest rates, we expect another
125‐150 bps of cut in repo in CY13 would enable Bankex to continue to outperform.
We have upgraded recommendation / target price for stocks under our coverage
universe, factoring in reduction in interest rates.
B. Core Inflation below 5% for 1st Time in 32 Months Core inflation has dropped below 5% for the first time in past 32 months, driven
by decline in prices of cement, iron & semis and steel. Correction in core inflation
has also contributed to easing of headline WPI‐based inflation which stood at
7.18% in Dec’12. Inflation in last nine months has expanded by 4.7% YTD, mainly
due to sharp rise in cereal prices.
Exhibit 2: Inflation
Source: Bloomberg, Karvy Institutional Research
‐100.0
‐50.0
0.0
50.0
100.0
150.0
200.0
0.0
2.0
4.0
6.0
8.0
10.0Dec/02
Jun/03
Dec/03
Jun/04
Dec/04
Jun/05
Dec/05
Jun/06
Dec/06
Jun/07
Dec/07
Jun/08
Dec/08
Jun/09
Dec/09
Jun/10
Dec/10
Jun/11
Dec/11
Jun/12
Dec/12
Repo Bankex Return
(%) (%)
‐
2.00
4.00
6.00
8.00
10.00
12.00
Feb‐10
Apr‐10
Jun‐10
Aug‐10
Oct‐10
Dec‐10
Feb‐11
Apr‐11
Jun‐11
Aug‐11
Oct‐11
Dec‐11
Feb‐12
Apr‐12
Jun‐12
Aug‐12
Oct‐12
Dec‐12
Core Inflation WPI
(%)

5
January 16, 2013
Banking
Our View: Expectation on inflation mainly depends on rainfall, going ahead.
Significant control in core inflation amid consistent ease in WPI‐based inflation –
which is now close to RBI’s comfort level – has given significant elbowroom for
the RBI to maneuver policy rates to protect growth.
C. Correction in OIS also Suggests Correction in Rates Overnight Indexed Swap (OIS) is a very good indicator of interbank credit market.
The fixed leg of the interest rate swap is determined by OIS, which can also be
interpreted as short‐term funding cost for the Indian banks. OIS and Repo rate has
a very high co‐relation of 0.92 over last 8 years. OIS has corrected by ~100 bps from
its recent high, whereas Repo is cut by only 50 bps over last 9 months.
Exhibit 3: Repo & OIS 3M
Source: Bloomberg, Karvy Institutional Research
OIS & G‐Sec: OIS also has a very high correlation with G‐Sec on the 3 month as
well as 1 year tenor.
Exhibit 4: OIS & G‐Sec (3M) are trending downwards
Source: Bloomberg, Karvy Institutional Research
Exhibit 5: OIS & G‐Sec (1Year) are relatively flattish
Source: Bloomberg, Karvy Institutional Research
OIS Spread: OIS spread – the difference between interbank rate (floating leg of OIS
swap) and OIS – is a gauge of perception of risk in credit market and also indicates
market expectations of movement in policy rates. OIS spread on the 3 month tenor
has eased significantly over last year which indicates increase in risk taking ability
as well as correction in policy rates.
3
5
7
9
11
13
0
2
4
6
8
10
May/05
Sep
/05
Jan/06
May/06
Sep
/06
Jan/07
May/07
Sep
/07
Jan/08
May/08
Sep
/08
Jan/09
May/09
Sep
/09
Jan/10
May/10
Sep
/10
Jan/11
May/11
Sep
/11
Jan/12
May/12
Sep
/12
Jan/13
Repo OIS 3m
(%) (%)
0
2
4
6
8
10
12
Jan/05
Jul/05
Jan/06
Jul/06
Jan/07
Jul/07
Jan/08
Jul/08
Jan/09
Jul/09
Jan/10
Jul/10
Jan/11
Jul/11
Jan/12
Jul/12
Jan/13
Gsec 3m OIS 3m
(%)
0
2
4
6
8
10
12
Jan/05
Jul/05
Jan/06
Jul/06
Jan/07
Jul/07
Jan/08
Jul/08
Jan/09
Jul/09
Jan/10
Jul/10
Jan/11
Jul/11
Jan/12
Jul/12
Jan/13
Gsec 1 Yr OIS 1 Yr
(%)

6
January 16, 2013
Banking
Exhibit 6: OIS Spread (3M) Indicates Optimism
Source: Bloomberg, Karvy Institutional Research
Our View: Correction in policy rates is imminent, as the OIS has corrected by ~90
bps from its recent high, while Repo is cut by only 50 bps over last 9 months.
Meanwhile, OIS spread on the 3 month tenor has eased notably over last year,
which indicates rise in risk taking ability and correction in policy rates as well.
D. RBI Turns Dovish – Expect Policy Rates to Start
Easing in Q4FY13 Although the RBI in its mid‐quarter policy review in Dec’12 has kept all its key
rates intact, the guidance has become much more dovish. The RBI seems to be very
comfortable with current inflation situation and will now start focusing on
protecting growth.
RBI’s Statement Mid‐Quarter Policy Review in Dec’12: “Headline inflation has
been below the Reserve Bank’s projected levels over the past two months. The
decline in core inflation has also been comforting. These emerging patterns
reinforce the likelihood of steady moderation in inflation going into 2013‐14,
though inflation may edge higher over the next two months. In view of inflation
pressures ebbing, monetary policy has to increasingly shift focus and respond to
the threats to growth from this point onwards … overall, recent inflation patterns
and projections provide a basis for reinforcing our October guidance about policy
easing in the fourth quarter,” the RBI said in its mid‐quarter policy review in
Dec’12, signaling that the policy rates would start easing in Q4FY13.
Our View: While the outlook for policy rate will be highly dependent on monsoon,
125‐150 bps of cut in repo over CY13 is expected with 50 bps cut in Q3FY policy
review on January 29, 2013.
‐1
0
1
2
3
4
5
6
7
Jan/03
Jun/03
Nov/03
Apr/04
Sep
/04
Feb/05
Jul/05
Dec/05
May/06
Oct/06
Mar/07
Aug/07
Jan/08
Jun/08
Nov/08
Apr/09
Sep
/09
Feb/10
Jul/10
Dec/10
May/11
Oct/11
Mar/12
Aug/12
Jan/13
OIS Spread 3m
(%)

7
January 16, 2013
Banking
Asset Quality to Improve from FY14 Onwards
A. Slippage to Ease Significantly especially for PSU
Banks We expect asset quality of banks, especially PSU banks to turnaround starting
from Q1FY14. As per the information we receive from our recent interaction with
the managements of several PSU banks, the incremental slippages in H2FY13 are
likely to be significantly lower than H1FY13. Incremental recovery / upgradation is
expected to excel and match incremental slippages thereby maintaining absolute
GNPA at current levels.
Exhibit 7: PSU Banks – Slippages to Ease
Source: Company, Karvy Institutional Research
On the other hand, private banks have done exceedingly well in terms of asset
quality. We have conservatively factored slippages to normalize over FY14‐15E.
Exhibit 8: Private Banks – Slippages Already at a Comfortable Levels
Source: Company, Karvy Institutional Research
Our View: PSU Banks have seen huge increase in slippages in H1FY13. Even after
accounting for relatively better H2FY13, slippages for FY13E will increase
substantially over FY12. We expect asset quality pressure to ease significantly
over FY14‐15E.
B. PMI indicates Improvement in Business Sentiment Improvement in business sentiment as indicated by HSBC PMI surged to a six
month high amid a spike in new orders.
0.0
1.0
2.0
3.0
4.0
5.0
BOB Canara UBI BOI IOB PNB Syndicate SBI OBC
FY12 FY13E FY14E FY15E
(%)
0.0
0.5
1.0
1.5
2.0
ING KVB HDFC J&K Axis ICICI CUB
FY12 FY13E FY14E FY15E
(%)

8
January 16, 2013
Banking
Exhibit 9: Strengthening PMI
Source: Bloomberg, Karvy Institutional Research
Our View: Improvement in business sentiment would contribute towards banks’
efforts on recovery as well as assist them in containing incremental slippages.
C. Govt on Reform Mode – Added Optimism The UPA Government has been able to clear few landmark bills which were
pending for a considerable period of time. Amidst the allegation of complete
policy paralysis with regard to reforms, the Government surprised everyone
including their most staunch supporters by clearing FDI in Multi‐band Retail,
Aviation, Insurance, & Pension, which along with other reforms spread a wave of
optimism amongst the investors’ community. Meanwhile, amendment to “Banking
Regulation Act & Banking Companies Acquisition & Transfer Act” will enable the RBI
to issue additional bank licenses along with additional powers to regulate banks.
Positive initiatives from government to address fuel issues are expected to bring
faster developments on policy. We also expect regular power tariff hikes by all
states would resolve power sector issues.
Our View: Such series of reforms would help the economy to rise from the
headwinds it has been facing over the last downturn, while the plan for gradual
hike in diesel prices to cut fuel subsidy and thereby moving towards fiscal
consolidation could be seen as the preparatory work for next phase of growth.
D. NPA Formation Moderating for PSU Banks
After series of turbulent quarters, the NPA formation has receded for PSU Banks
in Q2FY13, while the private banks have done exceedingly well in terms of asset
quality. The pressures on asset quality would start easing, as we progress into
policy rate cuts followed by economic recovery.
Exhibit 10: PSU Bank – GNPA has bottomed out
Source: Company, Karvy Institutional Research
44
49
54
59
64
Dec‐08
Mar‐09
Jun‐09
Sep‐09
Dec‐09
Mar‐10
Jun‐10
Sep‐10
Dec‐10
Mar‐11
Jun‐11
Sep‐11
Dec‐11
Mar‐12
Jun‐12
Sep‐12
Dec‐12
PMI Index
1.0
2.0
3.0
4.0
5.0
6.0
BOB Canara BOI Syndicate IOB PNB UBI OBC SBI
FY12 FY13E FY14E FY15E
(%)

9
January 16, 2013
Banking
Exhibit 11: Private Banks – Gross NPA to Normalize
Source: Company, Karvy Institutional Research
Our View: While the NPAs of PSU banks and ICICI Bank are likely improve; it
would remain flattish for other private banks.
E. Credit Cost to Moderate In line with likely improvement in asset quality, we believe that the overall credit
cost – especially of PSU banks – will decline notably enabling them to report higher
profits, while the credit cost of private banks would normalize from the current
low levels.
Exhibit 12: Credit Cost to Ease
Source: Company, Karvy Institutional Research
Our View: While the overall credit cost of PSU banks will decline significantly,
the credit cost of private banks would normalize from the current low levels.
F. Provision Coverage to Improve With expected slippage level to ease significantly, we expect provision coverage to
improve even after accounting for lower credit cost. Banks would also like to
buffer up for next down‐cycle.
Exhibit 13: Provision Coverage to Improve
Source: Company, Karvy Institutional Research
0.0
1.0
2.0
3.0
4.0
Axis CUB HDFC ICICI ING J&K KVB
FY12 FY13E FY14E FY15E
(%)
0.0
0.5
1.0
1.5
KVB
ING
J&K
HDFC
ICICI
CUB
Can
ara
Axis
BOB
BOI
PNB
UBI
OBC
IOB
Syndicate
SBI
FY12 FY13E FY14E FY15E
(%)
40.050.060.070.080.090.0100.0
OBC
UBI
PNB
BOI
SBI
IOB
Can
ara
KVB
CUB
BOB
Syndicate
ICICI
Axis
HDFC
ING
J&K
FY12 FY13E FY14E FY15E
(%)

10
January 16, 2013
Banking
Credit Growth Momentum Continues
A. Credit Growth remains above RBI’s Target despite
Slowdown Even though the credit growth has taken a hit on account of slowdown in the
economy and halt in capex cycle, it remains above the RBI’s FY13 target of 16%.
Exhibit 14: Credit Growing at Decent Pace
Source: Bloomberg, Karvy Institutional Research
Our View: With likely correction in interest rates and revival in economy, credit
growth is expected to remain buoyant, going ahead.
B. Credit Growth – Corporate Segment Rules the Roost Growth in corporate / industry segment is showing a declining trend, yet it
continues to be the fastest growing segment over last five years. After the burst in
unsecured personal loan segment in 2008, the retail segment has grown at a very
modest rate over last five years, though off late it is showing some signs of revival.
Agriculture has been the fastest growing segment this year, whereas services
continue to be sluggish.
Exhibit 15: Growth in Industry Segment – Better than Other Segments
Source: RBI, Karvy Institutional Research
Our View: Within the industry segment, the large corporates have contributed to
bulk of the growth. On account of cautious approach adopted by banks, growth in
small and medium segment has seen a significant downturn.
051015202530
Mar/09
Jun/09
Sep
/09
Dec/09
Mar/10
Jun/10
Sep
/10
Dec/10
Mar/11
Jun/11
Sep
/11
Dec/11
Mar/12
Jun/12
Sep
/12
Dec/12
Credit Growth
(%)
0.0
10.0
20.0
30.0
FY09 FY10 FY11 FY12 Nov‐12
Agriculture Industry Services Retail
(%

11
January 16, 2013
Banking
Exhibit 16: Large Industries Contributed to Growth
Source: RBI, Karvy Institutional Research
C. Visible Slowdown in Credit to Vulnerable Sectors Credit growth to risky sectors like Infrastructure, Metal/Mining & Textiles has
significantly slowed down from its high in FY10‐11.
Exhibit 17: Growth to Troubled Sectors has slowed down
Source: RBI, Karvy Institutional Research
The PSU Banks have relatively higher exposure to vulnerable sectors in
comparison to their private counterparts.
Exhibit 18: Vulnerable Sectors (% of Loan Book) – Pvt Banks are Well‐placed
Source: Company, Karvy Institutional Research
Our View: Though the credit to vulnerable risky sectors has declined significantly
from its high in FY11, the PSU Banks have still relatively higher exposure to
difficult sectors, compared to their private counterparts.
0.0
5.0
10.0
15.0
20.0
25.0
30.0
35.0
40.0
FY09 FY10 FY11 FY12 Nov‐12
Micro/Small Medium Large
(%)
0.0
10.0
20.0
30.0
40.0
50.0
FY09 FY10 FY11 FY12 Nov‐12
Infrastructure Metal/Mining Textiles
(%)
0.0
5.0
10.0
15.0
20.0
25.0
30.0
35.0
HDFC
ING
Axis
BOI
BOB
Syndicate
CUB
J&K
ICICI
PNB
OBC
UBI
KVB
IOB
Can
ara
SBI
Infrastructure Metal/Mining Textiles
(%)

12
January 16, 2013
Banking
D. Engines for Retail Credit keep Altering The mortgage segment has seen a decent growth, despite the recent slowdown on
account of higher real estate prices. After a brief lull in FY09‐10, the auto segment
is growing at brisk rate on the back of strong auto sales, while the education loans
have nosedived after rise in NPA post recession. Following a muted growth in
FY09‐12, the credit cards / personal loans have evidently grown at a higher rate.
Exhibit 19: Growth within Retail Segment
Source: RBI, Karvy Institutional Research
E. Lower Loan Origination – Minimal Default Risk In the following chart, we provide the loans origination by the banks under our
coverage during FY09‐12 period.
Exhibit 20: Loan Origination over FY09‐12
Source: Company, Karvy Institutional Research
Our View: The banks originating lower loans over last three years are at more
comfortable position than their peers, as the likelihood of default remains high for
loans originated during economic slowdown.
‐10.0
0.0
10.0
20.0
30.0
40.0
50.0
FY09 FY10 FY11 FY12 Nov‐12
Mortgage Auto Education Credit Cards/Personal
(%)
0.0
10.0
20.0
30.0
40.0
50.0
60.0
ICICI
Syndicate
J&K
SBI
OBC
Can
ara
ING
BOI
UBI
IOB
PNB
HDFC
BOB
Axis
CUB
KVB
Loan Origination over FY09‐12
(%)

13
January 16, 2013
Banking
F. Lower Deposit Growth – Pressure on Balance‐sheet Deposit growth, which has significantly declined over last year, has been putting
pressure on balance sheet of banks.
Exhibit 21: Languishing Deposit Growth
Source: Bloomberg, Karvy Institutional Research
Our View: Credit‐Deposit (CD) ratio has been hovering closer to its all time high
levels. Despite successive OMOs and CRR cuts, deficit in Liquidity Adjustment
Facility (LAF) has remained above the RBI’s comfort zone.
G. Liquidation of Excess SLR can Provide Relief Statutory Liquidity Ratio (SLR) is currently maintained by banks at ~28% is much
in excess of regulatory stipulated 23%. Dspite reduction in SLR by the RBI, banks
have not brought down their SLR ratios.
Exhibit 22: Excess SLR to Compensate for Lower Deposit Growth
Source: Bloomberg, Karvy Institutional Research
Our View: The banks prefer to park funds with government over lending in times
of tough conditions, but with initial signs of economic recovery, the banks can
now utilize excess SLR to fund credit compensating for lower deposit growth.
68.0
70.0
72.0
74.0
76.0
78.0
80.0
10.0
12.0
14.0
16.0
18.0
20.0
22.0
24.0
Mar/09
May/09
Jul/09
Sep
/09
Nov/09
Jan/10
Mar/10
May/10
Jul/10
Sep
/10
Nov/10
Jan/11
Mar/11
May/11
Jul/11
Sep
/11
Nov/11
Jan/12
Mar/12
May/12
Jul/12
Sep
/12
Nov/12
Deposit Growth CD Ratio (RHS)
(%)
22.0
24.0
26.0
28.0
30.0
32.0
Apr/06
Aug/06
Dec/06
Apr/07
Aug/07
Dec/07
Apr/08
Aug/08
Dec/08
Apr/09
Aug/09
Dec/09
Apr/10
Aug/10
Dec/10
Apr/11
Aug/11
Dec/11
Apr/12
Aug/12
Dec/12
SLR maintained by banks SLR Required by RBI
(%)

14
January 16, 2013
Banking
NIMs – Marginal Compression is Likely
A. Positive Correlation between Interest Rate & NIMs During last interest rate cycle, the Net Interest Margins (NIMs) of the banks have
shown a positive correlation with movement in the interest rates on account of
assets getting reprised faster than deposits.
Exhibit 23: NIMs off‐late has a Positive Co‐Relation with Interest Rates
Source: Bloomberg, Karvy Institutional Research
Our View: As the NIMs are on a cyclical high presently, the banks are in a
position to comfortably absorb some amount of compression.
B. Improvement in CASA to Annul Sharp Fall in
Margins CASA has deteriorated for most of the banks over last 2 years, as in times of high
interest rates canabilzation of saving to term deposits happens.
Exhibit 24: CASA to Improve with Fall in Rates
Source: Company, Karvy Institutional Research
Our View: With expectation of decline in interest rate, we believe that the CASA
should take a reversal, thereby providing cushion against sharper fall in NIMs.
Also the proposed direct cash transfer scheme would aid banks garner higher float
adding to accumulation of CASA.
2.5
2.6
2.7
2.8
2.9
3
3.1
3.2
0
2
4
6
8
10
Mar/03
Aug/03
Jan/04
Jun/04
Nov/04
Apr/05
Sep
/05
Feb/06
Jul/06
Dec/06
May/07
Oct/07
Mar/08
Aug/08
Jan/09
Jun/09
Nov/09
Apr/10
Sep
/10
Feb/11
Jul/11
Dec/11
May/12
Oct/12
Repo NIMs
(%)
10.0
20.0
30.0
40.0
50.0
60.0
HDFC
ICICI
SBI
Axis
J&K
PNB
ING
Syndicate
UBI
BOB
BOI
Can
ara
IOB
OBC
KVB
CUB
FY12 FY13E FY14E FY15E
(%)
15
January 16, 2013
Banking
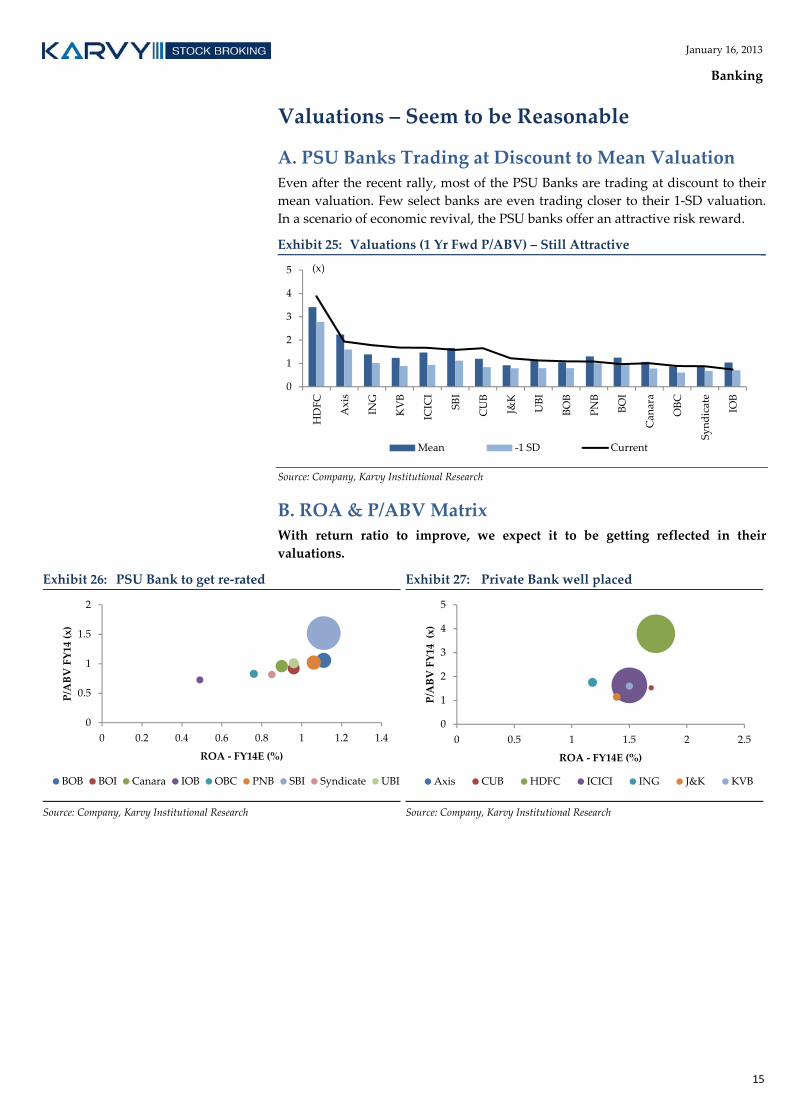
Valuations – Seem to be Reasonable
A. PSU Banks Trading at Discount to Mean Valuation Even after the recent rally, most of the PSU Banks are trading at discount to their
mean valuation. Few select banks are even trading closer to their 1‐SD valuation.
In a scenario of economic revival, the PSU banks offer an attractive risk reward.
Exhibit 25: Valuations (1 Yr Fwd P/ABV) – Still Attractive
Source: Company, Karvy Institutional Research
B. ROA & P/ABV Matrix With return ratio to improve, we expect it to be getting reflected in their
valuations.
Exhibit 26: PSU Bank to get re‐rated
Source: Company, Karvy Institutional Research
Exhibit 27: Private Bank well placed
Source: Company, Karvy Institutional Research
0
1
2
3
4
5
HDFC
Axis
ING
KVB
ICICI
SBI
CUB
J&K
UBI
BOB
PNB
BOI
Can
ara
OBC
Syndicate
IOB
Mean ‐1 SD Current
(x)
0
0.5
1
1.5
2
0 0.2 0.4 0.6 0.8 1 1.2 1.4
P/ABV FY14 (x)
ROA ‐ FY14E (%)
BOB BOI Canara IOB OBC PNB SBI Syndicate UBI
0
1
2
3
4
5
0 0.5 1 1.5 2 2.5
P/ABV FY14 (x)
ROA ‐ FY14E (%)
Axis CUB HDFC ICICI ING J&K KVB

16
January 16, 2013
Banking
Risk to Our Recommendations
Basel‐III Implementation: Migration to Basel‐III from Apr’13 will enhance the
need for core equity capital and restrict leverage flexibility especially for the
PSU banks.
Provisions for Wage Hike: As the wage hike agreement expired in Nov 12, the
new wage hike agreement would impact profitability of the PSU Banks.
Higher Provision on Restructured Assets: The RBI has increased provision on
restructured assets by 0.75% to 2.75% in the last quarter. In case the proposal
to increase the provision on restructured assets to 5% is implemented, it would
impact profitability of banks. However, excluding the accounts with
satisfactory performance of two years will bring down the quantum of
restructured book.
Banking January 16, 2013
Axis Bank
Bloomberg: AXSB INReuters: AXBK.BO BUY
Institutional Equities
India Research
COMPANY UPDATE
Recommendation
CMP: Rs1,424
Target Price: Rs1,725
Upside (%) 21%
Stock Information Market Cap. (Rs bn / US$ mn) 608/11,141
52‐week High/Low (Rs) 1,431/917
3m ADV (Rs mn /US$ mn) 2,280/41.8
Beta 1.2
Sensex/ Nifty 19,987/6,057
Share outstanding (mn) 427
Stock Performance (%) 1M 3M 12M YTD
Absolute 5.3 27.3 51.6 5.0
Rel. to Sensex 1.8 19.2 22.5 2.1
Performance
Source: Bloomberg
1 Year Forward P/ABV
Source: Karvy Institutional Research
Analysts Contact
Hatim Broachwala, CFA
022‐6184 4329
Paresh Jain
022 6184 4324
800
1,000
1,200
1,400
1,600
15,500
17,500
19,500
21,500
Jan‐12
Feb‐12
Apr‐12
May‐12
Jun‐12
Aug‐12
Sep‐12
Oct‐12
Dec‐12
Jan‐13
Sensex (LHS) Axis Bank (RHS)
‐
2.00
4.00
6.00
Feb‐07
Aug‐07
Feb‐08
Aug‐08
Feb‐09
Aug‐09
Feb‐10
Aug‐10
Feb‐11
Aug‐11
Feb‐12
Aug‐12
P/AdjBVPS Mean
+1 SD ‐1 SD
(x)
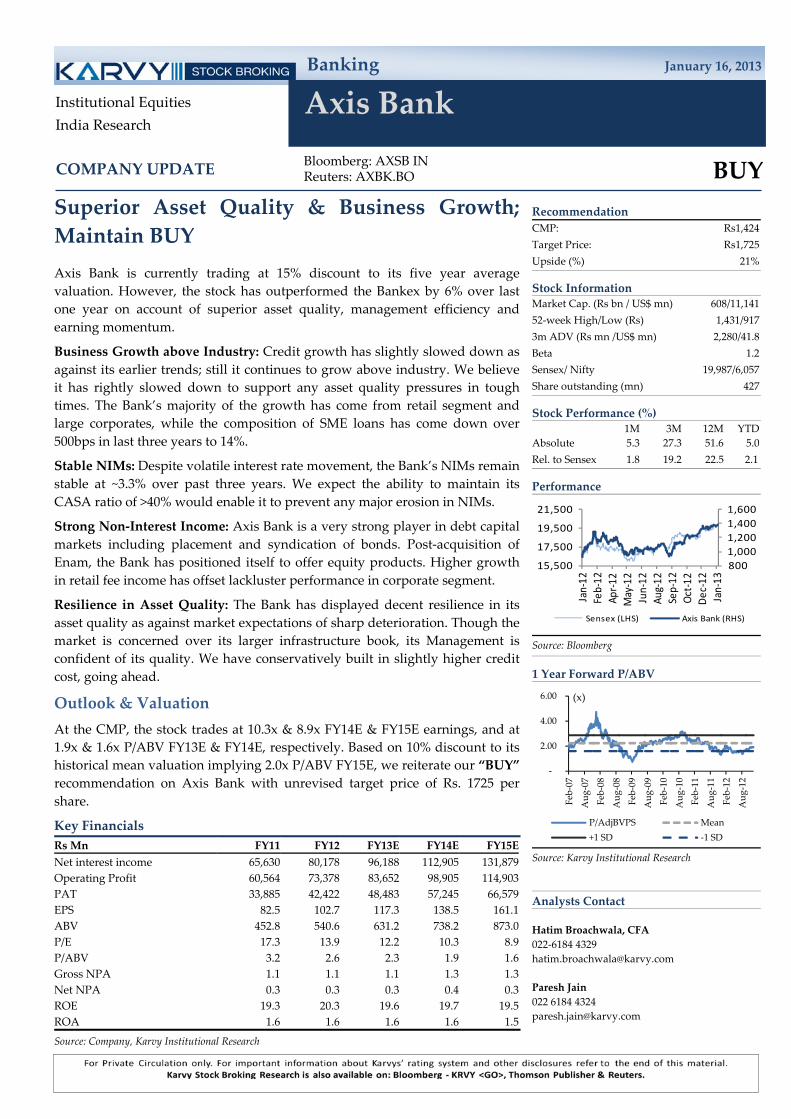
Superior Asset Quality & Business Growth;
Maintain BUY
Axis Bank is currently trading at 15% discount to its five year average
valuation. However, the stock has outperformed the Bankex by 6% over last
one year on account of superior asset quality, management efficiency and
earning momentum.
Business Growth above Industry: Credit growth has slightly slowed down as
against its earlier trends; still it continues to grow above industry. We believe
it has rightly slowed down to support any asset quality pressures in tough
times. The Bank’s majority of the growth has come from retail segment and
large corporates, while the composition of SME loans has come down over
500bps in last three years to 14%.
Stable NIMs: Despite volatile interest rate movement, the Bank’s NIMs remain
stable at ~3.3% over past three years. We expect the ability to maintain its
CASA ratio of >40% would enable it to prevent any major erosion in NIMs.
Strong Non‐Interest Income: Axis Bank is a very strong player in debt capital
markets including placement and syndication of bonds. Post‐acquisition of
Enam, the Bank has positioned itself to offer equity products. Higher growth
in retail fee income has offset lackluster performance in corporate segment.
Resilience in Asset Quality: The Bank has displayed decent resilience in its
asset quality as against market expectations of sharp deterioration. Though the
market is concerned over its larger infrastructure book, its Management is
confident of its quality. We have conservatively built in slightly higher credit
cost, going ahead.
Outlook & Valuation
At the CMP, the stock trades at 10.3x & 8.9x FY14E & FY15E earnings, and at
1.9x & 1.6x P/ABV FY13E & FY14E, respectively. Based on 10% discount to its
historical mean valuation implying 2.0x P/ABV FY15E, we reiterate our “BUY”
recommendation on Axis Bank with unrevised target price of Rs. 1725 per
share.
Key Financials
Rs Mn FY11 FY12 FY13E FY14E FY15E
Net interest income 65,630 80,178 96,188 112,905 131,879
Operating Profit 60,564 73,378 83,652 98,905 114,903
PAT 33,885 42,422 48,483 57,245 66,579
EPS 82.5 102.7 117.3 138.5 161.1
ABV 452.8 540.6 631.2 738.2 873.0
P/E 17.3 13.9 12.2 10.3 8.9
P/ABV 3.2 2.6 2.3 1.9 1.6
Gross NPA 1.1 1.1 1.1 1.3 1.3
Net NPA 0.3 0.3 0.3 0.4 0.3
ROE 19.3 20.3 19.6 19.7 19.5
ROA 1.6 1.6 1.6 1.6 1.5
Source: Company, Karvy Institutional Research

18
January 16, 2013
Axis Bank
Exhibit 1: Income Statement
FY11 FY12 FY13E FY14E FY15E
Interest Income 151,548 219,947 268,475 306,463 351,022
Interest expense 85,918 139,769 172,288 193,558 219,143
Net interest income 65,630 80,178 96,188 112,905 131,879
Fees 33,574 43,417 47,759 57,310 68,773
Other Income 9,154 9,854 9,426 12,113 14,642
Net Revenue 108,358 133,449 153,373 182,329 215,294
Operating Expense 47,794 60,071 69,720 83,424 100,391
‐Employee Exp 16,139 20,802 24,561 30,136 36,445
‐Other Exp 31,655 39,269 45,159 53,288 63,946
Operating Profit 60,564 73,378 83,652 98,905 114,903
Investment Profit 3,593 931 4,907 4,410 5,012
Pre‐provision Profit 64,157 74,309 88,560 103,315 119,915
Provisions 12,800 11,431 16,197 17,874 20,543
‐Loan Loss Provisions 11,364 10,996 17,631 18,478 21,377
‐Investment Depreciation 993 581 ‐1,488 ‐658 ‐888
‐Other Provisions 443 ‐146 54 54 54
PBT 51,357 62,878 72,362 85,441 99,372
Taxes 17,472 20,456 23,880 28,195 32,793
PAT 33,885 42,422 48,483 57,245 66,579
Source: Company, Karvy Institutional Research
Exhibit 2: Balance Sheet
FY11 FY12 FY13E FY14E FY15E
Equity Capital 4,105 4,132 4,132 4,132 4,132
Reserves & Surplus 185,883 223,954 263,493 310,587 365,564
Shareholderʹs Funds 189,988 228,086 267,625 314,719 369,696
Deposits 1,892,378 2,201,044 2,597,232 3,168,623 3,802,348
‐Current deposits 369,171 397,541 437,160 522,868 617,927
‐Saving deposits 408,503 516,680 615,727 787,144 977,262
‐Term deposit 1,114,704 1,286,823 1,544,345 1,858,610 2,207,159
Borrowings 262,679 340,717 394,732 449,778 510,828
‐Sub ordinate debt 69,932 105,740 121,944 138,458 156,773
Other liabilities 82,089 86,430 86,628 92,377 97,094
Total liabilities 2,427,134 2,856,277 3,346,217 4,025,496 4,779,965
Cash/Equivalent 214,087 139,339 189,392 261,579 341,642
Advances 1,424,078 1,697,595 2,022,469 2,468,154 2,962,459
Investments 719,916 931,921 1,030,968 1,173,816 1,332,247
Fixed Assets 22,732 22,593 25,593 28,593 31,593
Other assets 46,321 64,829 77,795 93,354 112,025
Total assets 2,427,134 2,856,277 3,346,217 4,025,496 4,779,965
Source: Company, Karvy Institutional Research

19
January 16, 2013
Axis Bank
Exhibit 3: Key Ratios
Ratioʹs FY11 FY12 FY13E FY14E FY15E
Growth (%)
NII growth 31.1 22.2 20.0 17.4 16.8
Pre‐provision profit growth 22.4 15.8 19.2 16.7 16.1
PAT growth 34.8 25.2 14.3 18.1 16.3
Business (%)
Deposit growth 33.9 16.3 18.0 22.0 20.0
Advance growth 36.5 19.2 19.1 22.0 20.0
Business growth 35.0 17.6 18.5 22.0 20.0
CD 75.3 77.1 77.9 77.9 77.9
CASA 41.1 41.5 40.5 41.3 42.0
Operating effeciency (%)
Cost‐to‐income 44.1 45.0 45.5 45.8 46.6
Cost‐to‐assets 2.4 2.4 2.4 2.4 2.4
Productivity (Rs mn)
Business per branch 2385.9 2403.6 2535.5 2787.7 3044.5
Business per employee 125.5 122.8 125.7 135.1 144.7
Profit per branch 24.4 26.2 26.6 28.3 30.0
Profit per employee 1.3 1.3 1.3 1.4 1.4
Spreads (%)
Yield on advances 8.4 9.9 10.2 9.7 9.3
Yield on investments 7.0 7.8 8.0 8.0 7.8
Cost of deposits 4.5 6.0 6.1 5.8 5.5
Yield on assets 7.7 8.9 9.2 8.9 8.5
Cost of funds 4.4 5.7 6.0 5.7 5.4
NIMs 3.3 3.2 3.3 3.3 3.2
Capital adequacy (%)
Tier I 9.4 9.5 9.5 9.3 9.2
Tier II 3.2 4.2 4.2 3.9 3.7
Total CAR 12.7 13.7 13.6 13.2 12.9
Asset Quality (%)
Gross NPA 1.1 1.1 1.1 1.3 1.3
Net NPA 0.3 0.3 0.3 0.4 0.3
Provision coverage 74.3 73.8 70.8 69.6 77.4
Provision coverage (incl w/off) 80.9 80.9 79.0 77.9 83.6
Slippage 1.2 1.2 1.1 1.3 1.2
Credit‐cost 0.8 0.6 0.8 0.7 0.7
Return (%)
ROE 19.3 20.3 19.6 19.7 19.5
ROA 1.6 1.6 1.6 1.6 1.5
Per share (Rs)
EPS 82.5 102.7 117.3 138.5 161.1
BV 462.8 552.0 647.7 761.7 894.7
ABV 452.8 540.6 631.2 738.2 873.0
Valuation (x)
P/E 17.3 13.9 12.2 10.3 8.9
P/BV 3.1 2.6 2.2 1.9 1.6
P/ABV 3.2 2.6 2.3 1.9 1.6
Source: Company, Karvy Institutional Research

Banking January 16, 2013
Bank Of Baroda
Bloomberg: BOB INReuters: BOB.BO HOLD
Institutional Equities
India Research
COMPANY UPDATE
Recommendation
CMP: Rs878
Target Price: Rs985
Upside (%) 12%
Stock Information Market Cap. (Rs bn / US$ mn) 361/6,609
52‐week High/Low (Rs) 900/606
3m ADV (Rs mn /US$ mn) 543/9.9
Beta 0.9
Sensex/ Nifty 19,987/6,057
Share outstanding (mn) 411
Stock Performance (%) 1M 3M 12M YTD
Absolute 4.3 12.6 20.7 1.3
Rel. to Sensex 0.8 5.4 (2.4) (1.5)
Performance
Source: Bloomberg
1 Year Forward P/ABV
Source: Karvy Institutional Research
Analysts Contact
Hatim Broachwala, CFA
022‐6184 4329
Paresh Jain
022 6184 4324
600
700
800
900
1,000
15,500
17,500
19,500
21,500
Jan‐12
Feb‐12
Apr‐12
May‐12
Jun‐12
Aug‐12
Sep‐12
Oct‐12
Dec‐12
Jan‐13
Sensex (LHS) Bank of Baroda (RHS)
‐
0.50
1.00
1.50
2.00
Feb‐07
Aug‐07
Feb‐08
Aug‐08
Feb‐09
Aug‐09
Feb‐10
Aug‐10
Feb‐11
Aug‐11
Feb‐12
Aug‐12
P/AdjBVPS Mean
+1 SD ‐1 SD
(x)
Management change can be tricky; Maintain
HOLD
Bank of Baroda (BoB) is currently trading at its five year average valuation.
However, the stock has underperformed the Bankex by 23% over last one
year reflecting incremental stress in last two quarters along with expectation
of further deterioration in asset portfolio in the aftermath of change in
management and partial correction of valuation premium over its peers.
Asset Quality Matrix – Better Placed: Bank of Baroda is better placed
amongst the large PSU banks in terms of total stress assets with Gross NPA
of 2% and restructured assets of 7.2%, though some amount of incremental
deterioration in asset quality is seen in H1FY13. The Bank enjoys comfortable
provision coverage of 76%.
Business Parameters – Good Show: The Bank has grown its business well
above the industry rate. The average growth for last four years has been 26%
in deposits and 28% in advances. But in the process, the Bank’s CASA has
taken a hit of ~500 bps during the same period. Its overseas business has
grown at an even higher average rate of 39% over last four years and now
forms 30% of its total business.
Change in Management – A Key Risk: With the change in management,
concern over deterioration in asset quality has risen. Higher growth in credit
along with resilience in asset quality has been strength, but it can turn into a
risk if slippages start increasing.
Outlook & Valuation
At the CMP, the stock trades at 5.6x & 4.6x FY14E & FY15E earnings, and at
1.1x & 0.9x P/ABV FY14E & FY15E, respectively. Based on its historical mean
valuation implying 1x P/ABV FY15E, we reiterate our “HOLD”
recommendation on Bank of Baroda with upwardly revised target price of
Rs. 985 per share (from Rs. 740 earlier).
Key Financials
Y/E Mar (Rs. mn) FY11 FY12 FY13E FY14E FY15E
Net interest income 88,022 103,170 119,262 144,362 170,415
Operating Profit 65,381 79,732 96,812 115,349 134,053
PAT 42,417 50,070 51,185 64,798 78,290
EPS (Rs) 108.0 121.4 124.1 157.1 189.8
ABV (Rs) 536.0 649.5 701.9 829.6 984.9
P/E (x) 8.1 7.2 7.1 5.6 4.6
P/ABV (x) 1.6 1.3 1.2 1.1 0.9
Gross NPA (%) 1.4 1.5 2.1 2.2 2.2
Net NPA (%) 0.3 0.5 0.8 0.7 0.6
ROE (%) 23.5 20.7 17.5 19.3 19.7
ROA (%) 1.3 1.2 1.0 1.1 1.1
Source: Company, Karvy Institutional Research

21
January 16, 2013
Bank Of Baroda
Exhibit 1: Income Statement
Y/E Mar (Rs. mn) FY11 FY12 FY13E FY14E FY15E
Interest Income 218,859 296,737 358,873 412,454 468,789
Interest expense 130,837 193,567 239,612 268,093 298,374
Net interest income 88,022 103,170 119,262 144,362 170,415
Fees 10,206 12,261 13,487 16,185 19,421
Other Income 13,451 15,888 18,830 20,048 22,180
Net Revenue 111,679 131,319 151,579 180,594 212,016
Operating Expense 46,298 51,587 54,767 65,246 77,963
‐Employee Exp 29,168 29,856 30,863 35,365 40,613
‐Other Exp 17,130 21,731 23,904 29,880 37,350
Operating Profit 65,381 79,732 96,812 115,349 134,053
Investment Profit 4,435 6,075 3,249 6,840 8,364
Pre‐provision Profit 69,816 85,807 100,061 122,189 142,417
Provisions 13,313 25,549 31,814 34,624 36,620
‐Loan Loss Provisions 12,640 20,171 28,462 33,418 35,564
‐Investment Depreciation 90 2,363 ‐567 ‐753 ‐904
‐Other Provisions 583 3,015 3,920 1,960 1,960
PBT 56,503 60,258 68,246 87,564 105,797
Taxes 14,086 10,188 17,062 22,767 27,507
PAT 42,417 50,070 51,185 64,798 78,290
Source: Company, Karvy Institutional Research
Exhibit 2: Balance Sheet
Y/E Mar (Rs. mn) FY11 FY12 FY13E FY14E FY15E
Equity Capital 3,928 4,124 4,124 4,124 4,124
Reserves & Surplus 206,003 270,645 305,157 359,354 425,602
Shareholderʹs Funds 209,931 274,769 309,281 363,478 429,726
Deposits 3,054,395 3,848,711 4,618,453 5,542,144 6,650,573
‐Current deposits 231,347 289,444 366,418 458,787 569,630
‐Saving deposits 644,540 745,795 861,256 1,045,994 1,267,680
‐Term deposit 2,178,508 2,813,472 3,390,779 4,037,362 4,813,262
Borrowings 223,079 235,730 289,612 354,270 431,860
‐Sub ordinate debt 107,487 109,280 125,445 144,842 168,119
Other liabilities 96,567 114,005 125,895 117,274 104,193
Total liabilities 3,583,972 4,473,215 5,343,240 6,377,166 7,616,351
Cash/Equivalent 499,341 641,686 729,744 826,732 943,117
Advances 2,286,764 2,873,773 3,451,080 4,143,848 4,975,169
Investments 712,606 832,094 1,024,530 1,255,452 1,532,559
Fixed Assets 22,997 23,415 25,415 27,415 29,415
Other assets 62,264 102,247 112,472 123,719 136,091
Total assets 3,583,972 4,473,215 5,343,240 6,377,166 7,616,351
Source: Company, Karvy Institutional Research

22
January 16, 2013
Bank Of Baroda
Exhibit 3: Ratios
FY11 FY12 FY13E FY14E FY15E
Growth(%)
NII growth 48.2 17.2 15.6 21.0 18.0
Pre‐provision profit growth 41.5 22.9 16.6 22.1 16.6
PAT growth 38.7 18.0 2.2 26.6 20.8
Business (%)
Deposit growth 26.7 26.0 20.0 20.0 20.0
Advance growth 30.6 25.7 20.1 20.1 20.1
Business growth 28.4 25.9 20.0 20.0 20.0
CD 74.9 74.7 74.7 74.8 74.8
CASA 28.7 26.9 26.6 27.2 27.6
Operating efficiency (%)
Cost‐to‐income 41.5 39.3 36.1 36.1 36.8
Cost‐to‐assets 1.6 1.4 1.2 1.2 1.2
Productivity (Rs mn)
Business per branch 1562.7 1698.0 1851.2 2035.3 2253.5
Business per employee 135.6 159.4 177.2 202.5 231.5
Profit per branch 12.4 12.6 11.7 13.6 15.2
Profit per employee 1.1 1.2 1.1 1.4 1.6
Spreads (%)
Yield on advances 8.0 8.7 8.7 8.2 7.7
Yield on investments 7.2 8.0 7.5 7.5 7.2
Cost of deposits 4.3 5.1 5.3 4.9 4.5
Yield on assets 7.4 8.0 7.9 7.6 7.2
Cost of funds 4.4 5.1 5.2 4.9 4.5
NIMs 3.0 2.8 2.6 2.6 2.6
Capital adequacy (%)
Tier I 10.0 10.8 8.3 8.1 8.1
Tier II 4.5 3.8 3.0 2.9 2.8
Total CAR 14.5 14.7 11.3 11.1 10.9
Asset Quality (%)
Gross NPA 1.4 1.5 2.1 2.2 2.2
Net NPA 0.3 0.5 0.8 0.7 0.6
Provision coverage 74.9 65.4 61.0 67.5 71.6
Provision coverage (incl w/off) 85.0 80.1 74.5 78.1 80.4
Slippage 0.9 1.3 1.6 1.3 1.2
Credit‐cost 0.5 0.6 0.9 0.8 0.7
Return (%)
ROE 23.5 20.7 17.5 19.3 19.7
ROA 1.3 1.2 1.0 1.1 1.1
Per share (Rs)
EPS 108.0 121.4 124.1 157.1 189.8
BV 534.4 666.3 750.0 881.4 1042.0
ABV 536.0 649.5 701.9 829.6 984.9
Valuation (x)
P/E 8.1 7.2 7.1 5.6 4.6
P/BV 1.6 1.3 1.2 1.0 0.8
P/ABV 1.6 1.3 1.2 1.1 0.9
Source: Company, Karvy Institutional Research

Banking January 16, 2013
Bank of India
Bloomberg: BOI INReuters: BOI.BO BUY
Institutional Equities
India Research
COMPANY UPDATE
Recommendation
CMP: Rs385
Target Price: Rs465
Upside (%) 21%
Stock Information Market Cap. (Rs bn / US$ mn) 221/4,044
52‐week High/Low (Rs) 408/253
3m ADV (Rs mn /US$ mn) 318/5.8
Beta 1.1
Sensex/ Nifty 19,987/6,057
Share outstanding (mn) 574
Stock Performance (%) 1M 3M 12M YTD
Absolute 24.2 26.9 27.6 12.2
Rel. to Sensex 20.0 18.8 3.1 9.1
Performance
Source: Bloomberg
1 Year Forward P/ABV
Source: Karvy Institutional Research
Analysts Contact
Hatim Broachwala, CFA
022‐6184 4329
Paresh Jain
022 6184 4324
250
300
350
400
450
15,500
17,500
19,500
21,500
Jan‐12
Feb‐12
Apr‐12
May‐12
Jun‐12
Aug‐12
Sep‐12
Oct‐12
Dec‐12
Jan‐13
Sensex (LHS) Bank of India (RHS)
‐
0.50
1.00
1.50
2.00
2.50
Feb‐07
Aug‐07
Feb‐08
Aug‐08
Feb‐09
Aug‐09
Feb‐10
Aug‐10
Feb‐11
Aug‐11
Feb‐12
Aug‐12
P/AdjBVPS Mean
+1 SD ‐1 SD
(x)
Pressure on Asset Quality to Ease, NIMs Set
to Improve; Maintain BUY
Bank of India (BoI) is currently trading at 20% discount to its five year
average valuation. Stock has underperformed the Bankex by 13% over last
one year reflecting pressure on asset quality. However, with the expected
improvement in macro conditions, such huge discount to its peers and to its
own average valuation seems to be unjustified.
Pressure on Asset Quality to Ease: After witnessing improving trend in
H2FY12, Bank of India’s asset quality has shown stress in H1FY13. As per
our recent interaction with BoI’s Management coupled with expected
improvement in economy and likely cut in interest rates, we believe that the
pressure on asset quality would ease from now onwards. Unlike its peers,
Bank of India has relatively lesser exposure to relatively vulnerable sectors
i.e. infrastructure, metals, mining and textiles etc.
NIMs – Set to Improve: Bank of India’s NIMs suffered by over 50 bps over
last three years. We expect the Bank’s NIMs to improve from now onwards
backed by lower proportion of high cost deposits, stable CASA and interest
recognized on recovered NPAs.
RoE Expansion – To Drive Valuation: Bank of India’s average RoE for
FY10‐12 has declined to 14.2% as against 23.3% for FY07‐09 on account of
compression in NIMs and rise in credit cost. We expect the Bank’s RoE
would improve to 18.2%, would lead to improvement in valuations.
Outlook & Valuation
At the CMP, the stock trades at 4.8x & 4.2x FY13E & FY14E earnings, and at
1.0x & 0.8x P/ABV FY14E & FY15E, respectively. Based on 20% discount to
its historical mean valuation implying 1.0x P/ABV FY15E, we reiterate our
“BUY” recommendation on Bank of India with upwardly revised target
price of Rs. 465 per share (from Rs. 395 earlier).
Key Financials
Y/E Mar (Rs. mn) FY11 FY12 FY13E FY14E FY15E
Net interest income 78,107 83,135 94,553 109,975 128,043
Operating Profit 50,624 62,852 74,516 83,184 95,033
PAT 24,887 26,775 32,790 46,528 52,933
EPS (Rs) 45.5 46.6 57.1 81.0 92.1
ABV (Rs) 290.4 310.7 330.4 394.9 463.0
P/E (x) 8.5 8.3 6.8 4.8 4.2
P/ABV (x) 1.3 1.2 1.1 1.0 0.8
Gross NPA (%) 2.2 2.3 3.2 2.9 2.8
Net NPA (%) 0.9 1.5 1.8 1.6 1.4
ROE (%) 15.8 14.0 14.7 18.2 17.9
ROA (%) 0.8 0.7 0.8 1.0 0.9
Source: Company, Karvy Institutional Research

24
January 16, 2013
Bank of India
Exhibit 1: Income Statement
Y/E Mar (Rs. mn) FY11 FY12 FY13E FY14E FY15E
Interest Income 217,517 284,807 323,871 360,924 401,582
Interest expense 139,410 201,672 229,318 250,949 273,539
Net interest income 78,107 83,135 94,553 109,975 128,043
Fees 11,811 12,715 12,715 15,258 18,310
Other Income 11,389 16,409 20,147 20,644 23,266
Net Revenue 101,307 112,259 127,414 145,877 169,618
Operating Expense 50,683 49,407 52,898 62,692 74,586
‐Employee Exp 34,754 30,534 30,251 34,383 39,199
‐Other Exp 15,929 18,873 22,648 28,310 35,387
Operating Profit 50,624 62,852 74,516 83,184 95,033
Investment Profit 3,218 4,088 3,708 6,337 7,244
Pre‐provision Profit 53,842 66,940 78,224 89,521 102,276
Provisions 18,888 31,165 35,079 26,645 30,745
‐Loan Loss Provisions 12,039 23,036 34,501 24,619 28,880
‐Investment Depreciation 1,369 4,369 ‐1,422 26 ‐135
‐Other Provisions 5,480 3,760 2,000 2,000 2,000
PBT 34,954 35,775 43,145 62,876 71,531
Taxes 10,067 9,000 10,355 16,348 18,598
PAT 24,887 26,775 32,790 46,528 52,933
Source: Company, Karvy Institutional Research
Exhibit 2: Balance Sheet
Y/E Mar (Rs. mn) FY11 FY12 FY13E FY14E FY15E
Equity Capital 5,472 5,745 5,745 5,745 5,745
Reserves & Surplus 167,435 203,873 230,150 268,885 312,090
Shareholderʹs Funds 172,907 209,618 235,895 274,630 317,835
Deposits 2,988,858 3,182,160 3,723,127 4,356,059 5,096,589
‐Current deposits 168,708 179,609 233,706 296,999 371,052
‐Saving deposits 590,968 668,446 749,591 876,177 1,024,283
‐Term deposit 2,229,182 2,334,105 2,739,830 3,182,883 3,701,254
Borrowings 220,214 321,142 388,019 434,618 489,139
‐Sub ordinate debt 91,598 93,655 120,406 139,045 160,854
Other liabilities 129,747 132,434 146,671 154,195 163,890
Total liabilities 3,511,726 3,845,354 4,493,712 5,219,502 6,067,453
Cash/Equivalent 373,101 347,112 430,218 495,805 572,542
Advances 2,130,962 2,488,333 2,921,107 3,427,452 4,019,876
Investments 858,724 867,536 986,549 1,125,794 1,288,710
Fixed Assets 24,807 27,716 29,716 31,716 33,716
Other assets 124,132 114,657 126,123 138,735 152,608
Total assets 3,511,726 3,845,354 4,493,712 5,219,502 6,067,453
Source: Company, Karvy Institutional Research

25
January 16, 2013
Bank of India
Exhibit 3: Ratios
FY11 FY12 FY13E FY14E FY15E
Growth (%)
NII growth 35.7 6.4 13.7 16.3 16.4
Pre‐provision profit growth 14.4 24.3 16.9 14.4 14.2
PAT growth 42.9 7.6 22.5 41.9 13.8
Business (%)
Deposit growth 30.1 6.5 17.0 17.0 17.0
Advance growth 26.5 16.8 17.4 17.3 17.3
Business growth 28.6 10.8 17.2 17.1 17.1
CD 71.3 78.2 78.5 78.7 78.9
CASA 25.4 26.7 26.4 26.9 27.4
Operating efficiency (%)
Cost‐to‐income 50.0 44.0 41.5 43.0 44.0
Cost‐to‐assets 1.8 1.5 1.4 1.4 1.4
Productivity (Rs mn)
Business per branch 1454.9 1400.5 1493.4 1605.2 1736.8
Business per employee 128.7 127.6 146.6 163.6 182.4
Profit per branch 7.1 6.6 7.4 9.6 10.1
Profit per employee 0.6 0.6 0.7 1.0 1.1
Spreads (%)
Yield on advances 8.1 8.8 8.8 8.3 7.9
Yield on investments 6.8 8.3 7.8 7.8 7.5
Cost of deposits 4.6 5.8 5.8 5.4 5.0
Yield on assets 7.7 8.5 8.4 8.0 7.7
Cost of funds 4.7 5.8 5.8 5.5 5.1
NIMs 2.8 2.5 2.5 2.5 2.5
Capital adequacy (%)
Tier I 8.3 8.6 8.4 8.5 8.4
Tier II 3.8 3.4 3.8 3.8 3.7
Total CAR 12.2 12.0 12.2 12.2 12.2
Asset Quality (%)
Gross NPA 2.2 2.3 3.2 2.9 2.8
Net NPA 0.9 1.5 1.8 1.6 1.4
Provision coverage 59.6 38.0 45.4 47.4 49.7
Provision coverage (incl w/off) 72.2 64.2 63.8 66.1 67.7
Slippage 1.5 2.3 2.8 1.8 1.8
Credit‐cost 0.6 0.9 1.2 0.7 0.7
Return (%)
ROE 15.8 14.0 14.7 18.2 17.9
ROA 0.8 0.7 0.8 1.0 0.9
Per share (Rs)
EPS 45.5 46.6 57.1 81.0 92.1
BV 316.0 364.9 410.6 478.0 553.2
ABV 290.4 310.7 330.4 394.9 463.0
Valuation (x)
P/E 8.5 8.3 6.8 4.8 4.2
P/BV 1.2 1.1 0.9 0.8 0.7
P/ABV 1.3 1.2 1.2 1.0 0.8
Source: Company, Karvy Institutional Research

Banking January 16, 2013
Canara Bank
Bloomberg: CBK INReuters: CBK.BO HOLD
Institutional Equities
India Research
COMPANY UPDATE
Recommendation
CMP: Rs523
Target Price: Rs570
Upside (%) 9%
Stock Information Market Cap. (Rs bn / US$ mn) 232/4,243
52‐week High/Low (Rs) 566/306
3m ADV (Rs mn /US$ mn) 417/7.6
Beta 1.1
Sensex/ Nifty 19,987/6,057
Share outstanding (mn) 443
Stock Performance (%) 1M 3M 12M YTD
Absolute 13.0 21.4 28.2 5.3
Rel. to Sensex 9.2 13.7 3.6 2.3
Performance
Source: Bloomberg
1 Year Forward P/ABV
Source: Karvy Institutional Research
Analysts Contact
Paresh Jain
022 6184 4324
Hatim Broachwala, CFA
022‐6184 4329
300350400450500550600
15,500
17,500
19,500
21,500
Jan‐12
Feb‐12
Apr‐12
May‐12
Jun‐12
Aug‐12
Sep‐12
Oct‐12
Dec‐12
Jan‐13
Sensex (LHS) Canara Bank (RHS)
0.0
1.0
2.0
Apr‐07
Aug‐07
Dec‐07
Apr‐08
Aug‐08
Dec‐08
Apr‐09
Aug‐09
Dec‐09
Apr‐10
Aug‐10
Dec‐10
Apr‐11
Aug‐11
Dec‐11
Apr‐12
Aug‐12
Dec‐12
1yr fwd P/Adj BV Mean + Std Dev
Mean ‐ Std Dev Mean
(x)
Business Growth to Gain Momentum,
Pressure on Asset Quality to Ease; Upgrade to
HOLD
Canara Bank is currently trading at 8% discount to mean valuation, while the
stock has underperformed the Bankex by 19% over last one year reflecting
weak balance sheet growth and concerns over asset quality.
Business Growth to Gain Momentum from H2FY13: Canara Bank’s
business growth has been under severe pressure since FY12. The Bank’s
credit has slowed down with 600 bps growth below system. Its C‐D ratio also
has declined by 700 bps since FY12. We expect business growth to gain
momentum from H2FY13 onwards on the back of lower base. However, the
overall growth in Bank’s loan book will remain muted for FY13 at 11%.
NIMs – Set to Improve The Bank’s NIM in H1FY13 declined by 15bps as
against FY12, partially owing to increase in cost of funds and decline in C‐D
ratio. We expect the Bank’s margin would improve in H2FY13 driven by rise
in CD ratio and reduction in cost of deposits.
Pressure on Asset Quality – Expected to Ease: Canara Bank’s NPAs have
shown deterioration in H1FY12. Though the Bank’s slippage ratio has
increased to 3% in H1FY13, its asset quality remains better than some of its
peers. The Bank’s restructured loan book stood at 7.9% of advances, and we
expect its asset quality to improve from now onwards.
Outlook & Valuation
At the CMP, the stock trades at 5.5x & 4.7x FY14E & FY15E earnings, and at
1.0x & 0.8x P/ABV FY14E & FY15E, respectively. Based on 20% discount to its
historical mean valuation implying 0.9x P/ABV FY15E, we have upgraded
our recommendation on Canara Bank to “HOLD” from “SELL” with
upwardly revised target price of Rs. 570 per share (from Rs. 410 earlier).
Key Financials
Y/E Mar (Rs. mn) FY11 FY12 FY13E FY14E FY15E
Net Interest Income 78,233 76,893 78,929 97,872 119,857
Operating profit 58,707 56,195 52,549 67,284 83,122
PAT 40,259 32,827 32,309 41,965 48,959
EPS (Rs) 97.8 74.1 72.9 94.7 110.5
ABV (Rs) 369.7 414.6 458.1 535.3 627.5
P/E (x) 5.3 7.1 7.2 5.5 4.7
P/ABV (x) 1.4 1.3 1.1 1.0 0.8
Gross NPA (%) 1.5 1.7 2.2 2.0 2.0
Net NPA (%) 1.1 1.5 1.7 1.5 1.3
ROE (%) 26.4 17.0 14.7 16.8 16.9
ROA (%) 1.3 0.9 0.8 0.9 0.9
Source: Company, Karvy Institutional Research

27
January 16, 2013
Canara Bank
Exhibit 1: Income Statement
Y/E Mar (Rs. mn) FY11 FY12 FY13E FY14E FY15E
Interest Income 230,640 308,506 337,663 361,605 413,674
Interest expense 152,407 231,613 258,734 263,733 293,818
Net interest income 78,233 76,893 78,929 97,872 119,857
Fees 7,558 7,969 8,350 9,345 11,111
Other Income 19,472 21,307 20,995 25,464 29,069
Net Revenue 105,263 106,169 108,274 132,681 160,037
Operating Expense 44,193 46,737 51,726 60,547 71,125
‐Employee Exp 29,548 29,731 32,231 37,677 44,195
‐Other Exp 14,645 17,007 19,495 22,870 26,930
Operating Profit 58,707 56,195 52,549 67,284 83,122
Investment Profit 2,363 3,237 4,000 4,850 5,790
Pre‐Provision Profits 61,070 59,432 56,549 72,134 88,912
Provisions 10,811 18,605 16,240 19,669 26,453
‐Loan Loss Provisions 10,012 12,941 16,850 16,824 21,484
‐Investment Depreciation 426 1,539 (3,500) (800) 1,124
‐Other Provisions 373 4,125 2,890 3,645 3,845
PBT 50,259 40,827 40,309 52,465 62,459
Taxes 10,000 8,000 8,000 10,500 13,500
PAT 40,259 32,827 32,309 41,965 48,959
Source: Company, Karvy Institutional Research
Exhibit 2: Balance Sheet
Y/E Mar (Rs. mn) FY11 FY12 FY13E FY14E FY15E
Equity Capital 4,430 4,430 4,430 4,430 4,430
Reserves & Surplus 195,968 222,470 248,548 283,763 324,934
Shareholderʹs Funds 200,398 226,900 252,978 288,193 329,364
Deposits 2,934,366 3,270,537 3,675,414 4,317,970 5,171,970
Current deposits 245,000 148,185 170,455 203,011 267,315
Saving deposits 586,171 647,922 752,534 922,534 1,122,534
Term deposit 2,108,555 2,474,430 2,752,426 3,192,426 3,782,122
Borrowings 142,616 155,254 179,445 206,172 247,172
‐Sub ordinate debt 43,540 41,040 45,444 47,554 49,554
Other liabilities 82,068 88,911 131,739 198,570 266,907
Total liabilities 3,359,449 3,741,602 4,239,576 5,010,905 6,015,413
Cash/Equivalent 307,081 281,794 352,290 429,509 515,019
Advances 2,112,683 2,324,898 2,559,188 3,010,189 3,609,188
Investments 836,360 1,020,574 1,204,910 1,434,910 1,734,910
Fixed Assets 28,444 28,575 30,454 34,545 38,545
Other assets 74,880 85,760 92,734 101,752 117,752
Total assets 3,359,449 3,741,602 4,239,576 5,010,905 6,015,413
Source: Company, Karvy Institutional Research

28
January 16, 2013
Canara Bank
Exhibit 3: Ratios
FY11 FY12 FY13E FY14E FY15E
Growth (%)
NII growth 37.7 (1.7) 2.6 24.0 22.5
Pre‐provision profit growth 20.7 (2.7) (4.9) 27.6 23.3
PAT growth 33.2 (18.5) (1.6) 29.9 16.7
Business (%)
Deposit growth 25.1 11.5 12.4 17.5 19.8
Advance growth 24.8 10.0 10.1 17.6 19.9
Business growth 24.9 10.9 11.4 17.5 19.8
CD 72.0 71.1 69.6 69.7 69.8
CASA 28.1 24.3 25.1 26.1 26.9
Operating efficiency (%)
Cost‐to‐income 42.0 44.0 47.8 45.6 44.4
Cost‐to‐assets 1.5 1.3 1.3 1.3 1.3
Productivity (Rs mn)
Business per branch 1,549.6 1,554.3 1,578.4 1,698.3 1,874.3
Business per employee 122.8 132.4 131.5 141.5 156.2
Profit per branch 12.4 9.1 8.2 9.7 10.5
Profit per employee 1.0 0.8 0.7 0.8 0.9
Spreads (%)
Yield on advances 9.0 10.6 10.3 9.4 8.9
Yield on investments 7.6 7.6 7.5 7.3 7.2
Cost of deposits 5.4 7.1 7.1 6.2 5.9
Yield on assets 7.9 9.0 8.7 8.0 7.7
Cost of funds 5.5 7.0 7.0 6.2 5.8
NIMs 2.7 2.2 2.0 2.2 2.2
Capital adequacy (%)
Tier I 10.9 10.4 9.8 9.5 9.1
Tier II 4.5 3.4 3.2 3.1 2.8
Total CAR 15.4 13.8 13.0 12.7 12.0
Asset Quality (%)
Gross NPA 1.5 1.7 2.2 2.0 2.0
Net NPA 1.1 1.5 1.7 1.5 1.3
Provision coverage 25.2 16.0 20.1 21.5 32.6
Provision coverage (incl w/off) 73.0 68.6 70.3 69.5 71.3
Slippage 1.8 2.1 2.3 1.7 1.7
Credit‐cost 0.5 0.6 0.7 0.6 0.6
Return (%)
ROE 26.4 17.0 14.7 16.8 16.9
ROA 1.3 0.9 0.8 0.9 0.9
Per share (Rs)
EPS 97.8 74.1 72.9 94.7 110.5
BV 405.0 465.6 525.1 605.3 700.5
ABV 369.7 414.6 458.1 535.3 627.5
Valuation (x)
P/E 5.3 7.1 7.2 5.5 4.7
P/BV 1.3 1.1 1.0 0.9 0.7
P/ABV 1.4 1.3 1.1 1.0 0.8
Source: Company, Karvy Institutional Research

Banking January 16, 2013
City Union Bank
Bloomberg: CUBK INReuters: CTBK.BO HOLD
Institutional Equities
India Research
COMPANY UPDATE
Recommendation
CMP: Rs61
Target Price: Rs65
Upside (%) 7%
Stock Information Market Cap. (Rs bn / US$ mn) 31/568
52‐week High/Low (Rs) 61/35
3m ADV (Rs mn /US$ mn) 57/1.1
Beta 0.8
Sensex/ Nifty 19,987/6,057
Share outstanding (mn) 512
Stock Performance (%) 1M 3M 12M YTD
Absolute 7.5 20.1 63.3 8.4
Rel. to Sensex 3.9 12.5 32.0 5.4
Performance
Source: Bloomberg
1 Year Forward P/ABV
Source: Karvy Institutional Research
Analysts Contact
Paresh Jain
022 6184 4324
Hatim Broachwala, CFA
022‐6184 4329
30
40
50
60
70
15,500
17,500
19,500
21,500
Jan‐12
Feb‐12
Apr‐12
May‐12
Jun‐12
Aug‐12
Sep‐12
Oct‐12
Dec‐12
Jan‐13
Sensex (LHS) City Union Bank (RHS)
0.0 0.5 1.0 1.5 2.0 2.5 3.0
Apr‐07
Aug‐07
Dec‐07
Apr‐08
Aug‐08
Dec‐08
Apr‐09
Aug‐09
Dec‐09
Apr‐10
Aug‐10
Dec‐10
Apr‐11
Aug‐11
Dec‐11
Apr‐12
Aug‐12
Dec‐12
1yr fwd P/Adj BV Mean + Std Dev
Mean ‐ Std Dev Mean
(x)
Positives Priced‐in; Maintain HOLD
City Union Bank (CUB) is currently trading at 35% premium to its five year
average valuation, while the stock has outperformed the Bankex by 19% over
last one year reflecting better than the industry growth, healthy NIM and
strong asset quality. The Bank has one of the best return ratios amongst its
peers.
Business Growth – Outperformance to Continue: City Union Bank’s
business growth has surpassed the industry by a significant margin, while
we expect such outperformance to continue, going ahead. The Bank does
majority of its lending to MSMEs, wholesale and retail traders, which is its
niche segment. The Bank’s overall lending book mainly constitutes of high‐
yielding working capital loans (60%) and rest of term loans (40%).
NIMs – Continue to Remain Healthy: City Union Bank has been able to
maintain its NIMs in excess of 3.2% in H1FY13. Though the Bank expects
marginal reduction in yield on advance, it would get offset by reduction in
cost of deposits. We expect the Bank to continue to maintain its NIM ~ 3.2%
in H2FY13.
Asset Quality – to Remain under Control: City Union Bank’s asset quality
continued to show resilience in a deteriorating economic environment.
However, we believe that it would be difficult for the Bank to report further
improvement in its asset quality. Thus, considering marginally higher
slippage ratio, we expect the Bank’s NPA ratio would increase marginally in
FY13. Meanwhile, the Bank has maintained its restructured loan book at 3.2%
which is lesser than peers.
Outlook & Valuation
At CMP, the stock trades at 7.4x & 5.9x FY14E & FY15E earnings, and at 1.6x
& 1.3x P/ABV FY14E & FY15E, respectively. Based on 20% premium to its
mean valuation implying 1.45x P/ABV FY15E, we reiterate our “HOLD”
recommendation on City Union Bank with unrevised target price of Rs. 65
per share.
Key Financials
Y/E Mar (Rs. mn) FY11 FY12 FY13E FY14E FY15E
Net Interest Income 4,200 4,998 6,141 7,724 9,899
Operating profit 3,544 4,193 4,959 6,232 7,737
PAT 2,151 2,803 3,509 4,421 5,489
EPS (Rs) 5.4 6.9 6.5 8.2 10.2
ABV (Rs) 24.0 29.5 31.7 37.7 45.5
P/E (x) 11.3 8.8 9.3 7.4 5.9
P/ABV (x) 2.5 2.1 1.9 1.6 1.3
Gross NPA (%) 1.2 1.0 1.3 1.7 1.7
Net NPA (%) 0.5 0.4 0.6 0.7 0.6
ROE (%) 23.5 24.9 23.2 22.6 23.4
ROA (%) 1.6 1.7 1.7 1.7 1.7
Source: Company, Karvy Institutional Research

30
January 16, 2013
City Union Bank
Exhibit 1: Income Statement
Y/E Mar (Rs. mn) FY11 FY12 FY13E FY14E FY15E
Interest Income 12,184 16,968 21,773 25,701 32,131
Interest expense 7,984 11,970 15,632 17,977 22,232
Net interest income 4,200 4,998 6,141 7,724 9,899
Fees 303 345 470 589 722
Other Income 1,271 1,726 2,140 2,657 2,997
Net Revenue 5,774 7,069 8,751 10,970 13,618
Operating Expense 2,164 2,798 3,497 4,336 5,369
‐Employee Exp 1,016 1,223 1,431 1,746 2,130
‐Other Exp 1,148 1,575 2,066 2,590 3,239
Operating Profit 3,544 4,193 4,959 6,232 7,737
Investment Profit 66 78 295 402 512
Pre‐Provision Profits 3,610 4,271 5,254 6,634 8,249
Provisions 790 838 841 1,108 1,388
‐Loan Loss Provisions 673 570 662 960 1,097
‐Investment Depreciation 76 74 (16) (100) 84
‐Other Provisions 41 194 195 248 207
PBT 2,821 3,433 4,413 5,526 6,861
Taxes 670 630 905 1,105 1,372
PAT 2,151 2,803 3,509 4,421 5,489
Source: Company, Karvy Institutional Research
Exhibit 2: Balance Sheet
Y/E Mar (Rs mn) FY11 FY12 FY13E FY14E FY15E
Equity Capital 405 408 539 539 539
Reserves & Surplus 9,661 12,023 17,225 20,764 25,117
Shareholderʹs Funds 10,066 12,431 17,764 21,303 25,656
Deposits 129,143 163,408 203,808 258,130 326,012
‐Current deposits 10,876 12,031 14,678 18,935 24,047
‐Saving deposits 14,407 17,685 22,283 28,967 37,078
‐Term deposit 103,859 133,692 166,847 210,227 264,886
Borrowings 1,862 3,487 5,030 6,400 7,600
‐Sub ordinate debt 400 400 850 1,100 1,100
Other liabilities 4,845 4,181 5,507 6,306 7,619
Total liabilities 145,915 183,507 232,109 292,138 366,887
Cash/Equivalent 12,863 11,361 13,125 15,578 18,378
Advances 92,555 121,375 155,578 200,696 256,890
Investments 36,162 45,862 57,250 69,253 84,224
Fixed Assets 685 977 1,045 1,245 1,545
Other assets 3,650 3,932 5,111 5,367 5,850
Total assets 145,915 183,507 232,109 292,138 366,887
Source: Company, Karvy Institutional Research

31
January 16, 2013
City Union Bank
Exhibit 3: Ratios
FY11 FY12 FY13E FY14E FY15E
Growth (%)
NII growth 51.0 19.0 22.9 25.8 28.2
Pre‐provision profit growth 41.1 18.3 23.0 26.3 24.3
PAT growth 40.7 30.3 25.2 26.0 24.2
Business (%)
Deposit growth 25.6 26.5 24.7 26.7 26.3
Advance growth 35.4 31.1 28.2 29.0 28.0
Business growth 29.5 28.5 26.2 27.7 27.0
CD 71.7 74.3 76.3 77.7 78.8
CASA 19.6 18.2 18.1 18.6 18.7
Operating efficiency (%)
Cost‐to‐income 37.5 39.6 40.0 39.5 39.4
Cost‐to‐assets 1.7 1.7 1.7 1.7 1.6
Productivity (Rs mn)
Business per branch 901.2 949.3 1012.4 1092.4 1214.4
Business per employee 0.8 0.8 0.9 0.9 1.0
Profit per branch 8.7 9.3 9.9 10.5 11.4
Profit per employee 8.7 9.3 9.9 10.5 11.4
Spreads (%)
Yield on advances 12.0 13.0 12.9 11.9 11.7
Yield on investments 7.2 7.4 7.5 7.0 7.0
Cost of deposits 6.7 8.0 8.3 7.6 7.4
Yield on assets 1.6 1.7 1.7 1.7 1.7
Cost of funds 6.8 8.0 8.3 7.6 7.4
NIMs 3.3 3.1 3.0 3.0 3.1
Capital adequacy (%)
Tier I 12.8 11.7 10.8 10.2 9.7
Tier II 0.9 0.9 0.9 1.0 0.8
Total CAR 13.7 12.6 11.8 11.1 10.5
Asset Quality (%)
Gross NPA 1.2 1.0 1.3 1.5 1.5
Net NPA 0.5 0.4 0.6 0.7 0.6
Provision coverage 57.0 56.2 50.0 54.5 59.8
Provision coverage (incl w/off) 76.7 77.0 74.0 76.6 77.6
Slippage 1.5 1.3 1.6 1.4 1.1
Credit‐cost 0.8 0.5 0.5 0.5 0.5
Return (%)
ROE 23.5 24.9 23.2 22.6 23.4
ROA 1.6 1.7 1.7 1.7 1.7
Per share (Rs.)
EPS 5.4 6.9 6.5 8.2 10.2
BV 24.9 30.5 33.0 39.5 47.6
ABV 24.0 29.5 31.7 37.7 45.5
Valuation(x)
P/E 11.3 8.8 9.3 7.4 5.9
P/BV 2.4 2.0 1.8 1.5 1.3
P/ABV 2.5 2.1 1.9 1.6 1.3
Source: Company, Karvy Institutional Research
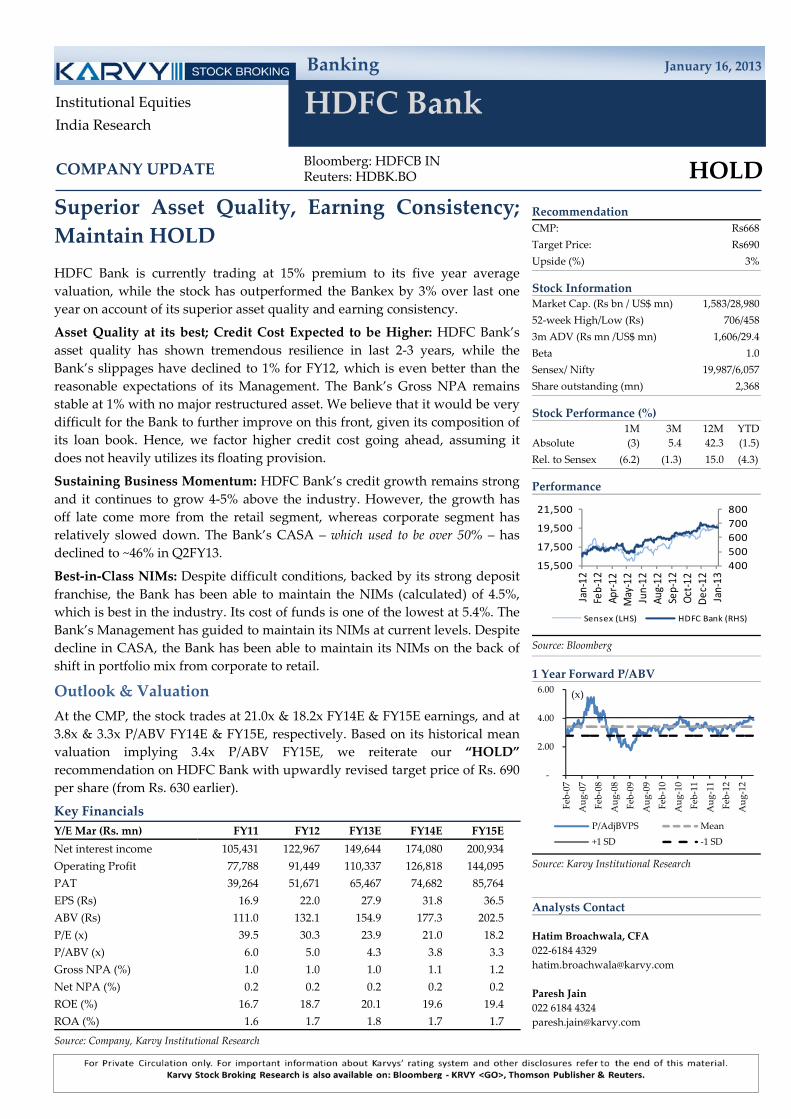
Banking January 16, 2013
HDFC Bank
Bloomberg: HDFCB INReuters: HDBK.BO HOLD
Institutional Equities
India Research
COMPANY UPDATE
Recommendation
CMP: Rs668
Target Price: Rs690
Upside (%) 3%
Stock Information Market Cap. (Rs bn / US$ mn) 1,583/28,980
52‐week High/Low (Rs) 706/458
3m ADV (Rs mn /US$ mn) 1,606/29.4
Beta 1.0
Sensex/ Nifty 19,987/6,057
Share outstanding (mn) 2,368
Stock Performance (%) 1M 3M 12M YTD
Absolute (3) 5.4 42.3 (1.5)
Rel. to Sensex (6.2) (1.3) 15.0 (4.3)
Performance
Source: Bloomberg
1 Year Forward P/ABV
Source: Karvy Institutional Research
Analysts Contact
Hatim Broachwala, CFA
022‐6184 4329
Paresh Jain
022 6184 4324
400
500
600
700
800
15,500
17,500
19,500
21,500
Jan‐12
Feb‐12
Apr‐12
May‐12
Jun‐12
Aug‐12
Sep‐12
Oct‐12
Dec‐12
Jan‐13
Sensex (LHS) HDFC Bank (RHS)
‐
2.00
4.00
6.00
Feb‐07
Aug‐07
Feb‐08
Aug‐08
Feb‐09
Aug‐09
Feb‐10
Aug‐10
Feb‐11
Aug‐11
Feb‐12
Aug‐12
P/AdjBVPS Mean
+1 SD ‐1 SD
(x)
Superior Asset Quality, Earning Consistency;
Maintain HOLD
HDFC Bank is currently trading at 15% premium to its five year average
valuation, while the stock has outperformed the Bankex by 3% over last one
year on account of its superior asset quality and earning consistency.
Asset Quality at its best; Credit Cost Expected to be Higher: HDFC Bank’s
asset quality has shown tremendous resilience in last 2‐3 years, while the
Bank’s slippages have declined to 1% for FY12, which is even better than the
reasonable expectations of its Management. The Bank’s Gross NPA remains
stable at 1% with no major restructured asset. We believe that it would be very
difficult for the Bank to further improve on this front, given its composition of
its loan book. Hence, we factor higher credit cost going ahead, assuming it
does not heavily utilizes its floating provision.
Sustaining Business Momentum: HDFC Bank’s credit growth remains strong
and it continues to grow 4‐5% above the industry. However, the growth has
off late come more from the retail segment, whereas corporate segment has
relatively slowed down. The Bank’s CASA – which used to be over 50% – has
declined to ~46% in Q2FY13.
Best‐in‐Class NIMs: Despite difficult conditions, backed by its strong deposit
franchise, the Bank has been able to maintain the NIMs (calculated) of 4.5%,
which is best in the industry. Its cost of funds is one of the lowest at 5.4%. The
Bank’s Management has guided to maintain its NIMs at current levels. Despite
decline in CASA, the Bank has been able to maintain its NIMs on the back of
shift in portfolio mix from corporate to retail.
Outlook & Valuation
At the CMP, the stock trades at 21.0x & 18.2x FY14E & FY15E earnings, and at
3.8x & 3.3x P/ABV FY14E & FY15E, respectively. Based on its historical mean
valuation implying 3.4x P/ABV FY15E, we reiterate our “HOLD”
recommendation on HDFC Bank with upwardly revised target price of Rs. 690
per share (from Rs. 630 earlier).
Key Financials
Y/E Mar (Rs. mn) FY11 FY12 FY13E FY14E FY15E
Net interest income 105,431 122,967 149,644 174,080 200,934
Operating Profit 77,788 91,449 110,337 126,818 144,095
PAT 39,264 51,671 65,467 74,682 85,764
EPS (Rs) 16.9 22.0 27.9 31.8 36.5
ABV (Rs) 111.0 132.1 154.9 177.3 202.5
P/E (x) 39.5 30.3 23.9 21.0 18.2
P/ABV (x) 6.0 5.0 4.3 3.8 3.3
Gross NPA (%) 1.0 1.0 1.0 1.1 1.2
Net NPA (%) 0.2 0.2 0.2 0.2 0.2
ROE (%) 16.7 18.7 20.1 19.6 19.4
ROA (%) 1.6 1.7 1.8 1.7 1.7
Source: Company, Karvy Institutional Research

33
January 16, 2013
HDFC Bank
Exhibit 1: Income Statement
Y/E Mar (Rs. mn) FY11 FY12 FY13E FY14E FY15E
Interest Income 199,282 272,863 330,893 378,755 432,043
Interest expense 93,851 149,896 181,248 204,674 231,109
Net interest income 105,431 122,967 149,644 174,080 200,934
Fees 35,967 42,755 50,451 59,532 70,248
Other Income 7,919 11,626 13,431 16,165 19,451
Net Revenue 149,317 177,348 213,527 249,777 290,633
Operating Expense 71,529 85,899 103,190 122,960 146,538
‐Employee Exp 28,360 33,999 40,391 48,857 59,097
‐Other Exp 43,169 51,900 62,799 74,103 87,441
Operating Profit 77,788 91,449 110,337 126,818 144,095
Investment Profit ‐534 ‐1,944 1,024 1,148 1,310
Pre‐provision Profit 77,254 89,505 111,361 127,965 145,405
Provisions 19,067 14,373 15,086 18,139 19,281
‐Loan Loss Provisions 7,630 8,021 9,682 20,686 21,748
‐Provisions for investment 0 934 398 447 528
‐Other Provisions 11,437 5,418 5,006 ‐2,994 ‐2,994
PBT 58,187 75,132 96,275 109,826 126,124
Taxes 18,923 23,461 30,808 35,144 40,360
PAT 39,264 51,671 65,467 74,682 85,764
Source: Company, Karvy Institutional Research
Exhibit 2: Balance Sheet
Y/E Mar (Rs. mn) FY11 FY12 FY13E FY14E FY15E
Equity Capital 4,652 4,693 4,693 4,693 4,693
Reserves & Surplus 249,111 294,550 346,291 404,501 471,048
Shareholderʹs Funds 253,763 299,243 350,984 409,194 475,741
Deposits 2,085,864 2,467,064 2,960,477 3,552,572 4,263,087
‐Current deposits 464,605 454,078 503,419 621,838 763,941
‐Saving deposits 634,478 739,980 912,674 1,149,513 1,433,718
‐Term deposit 986,781 1,273,006 1,544,383 1,781,221 2,065,427
Borrowings 143,941 238,466 245,374 283,268 328,741
‐Sub ordinate debt 73,931 105,969 109,423 128,370 151,106
Other liabilities 289,958 374,322 398,224 438,943 488,788
Total liabilities 2,773,526 3,379,095 3,955,058 4,683,977 5,556,356
Cash/Equivalent 296,689 209,377 257,095 324,594 405,592
Advances 1,599,827 1,954,200 2,348,930 2,822,607 3,391,018
Investments 709,294 974,829 1,073,512 1,221,535 1,399,164
Fixed Assets 21,706 23,472 25,722 27,972 30,222
Other assets 146,010 217,217 249,800 287,269 330,360
Total assets 2,773,526 3,379,095 3,955,058 4,683,977 5,556,356
Source: Company, Karvy Institutional Research

34
January 16, 2013
HDFC Bank
Exhibit 3: Ratios
FY11 FY12 FY13E FY14E FY15E
Growth (%)
NII growth 25.7 16.6 21.7 16.3 15.4
Pre‐provision profit growth 20.2 15.9 24.4 14.9 13.6
PAT growth 33.2 31.6 26.7 14.1 14.8
Business (%)
Deposit growth 24.6 18.3 20.0 20.0 20.0
Advance growth 27.1 22.2 20.2 20.2 20.1
Business growth 25.7 20.0 20.1 20.1 20.1
CD 76.7 79.2 79.3 79.5 79.5
CASA 52.7 48.4 47.8 49.9 51.6
Operating efficiency (%)
Cost‐to‐income 47.9 48.4 48.3 49.2 50.4
Cost‐to‐assets 3.3 3.2 3.1 3.2 3.2
Productivity (Rs mn)
Business per branch 1855.8 1737.9 1917.4 2129.3 2377.8
Business per employee 66.1 66.9 74.4 82.7 92.0
Profit per branch 19.8 20.3 23.6 24.9 26.6
Profit per employee 0.7 0.8 0.9 1.0 1.0
Spreads (%)
Yield on advances 10.6 11.6 11.7 11.2 10.7
Yield on investments 7.2 7.7 7.5 7.5 7.3
Cost of deposits 4.3 5.6 5.8 5.6 5.2
Yield on assets 9.1 10.1 10.1 9.8 9.4
Cost of funds 4.1 5.4 5.4 5.2 4.9
NIMs 4.8 4.5 4.5 4.5 4.4
Capital adequacy (%)
Tier I 12.2 11.6 11.2 11.0 10.8
Tier II 4.0 4.9 4.3 4.3 4.3
Total CAR 16.2 16.5 15.5 15.3 15.0
Asset Quality (%)
Gross NPA 1.0 1.0 1.0 1.1 1.2
Net NPA 0.2 0.2 0.2 0.2 0.2
Provision coverage 82.5 82.4 78.8 82.2 80.6
Slippage 1.0 0.9 0.8 1.1 1.0
Credit‐cost 0.5 0.4 0.4 0.7 0.6
Return (%)
ROE 16.7 18.7 20.1 19.6 19.4
ROA 1.6 1.7 1.8 1.7 1.7
Per share (Rs)
EPS 16.9 22.0 27.9 31.8 36.5
BV 109.1 127.5 149.6 174.4 202.7
ABV 111.0 132.1 154.9 177.3 202.5
Valuation (x)
P/E 39.5 30.3 23.9 21.0 18.2
P/BV 6.1 5.2 4.5 3.8 3.3
P/ABV 6.0 5.0 4.3 3.8 3.3
Source: Company, Karvy Institutional Research

Banking January 16, 2013
ICICI Bank
Bloomberg: ICICIBC INReuters: ICBK.BO BUY
Institutional Equities
India Research
COMPANY UPDATE
Recommendation
CMP: Rs1,204
Target Price: Rs1,520
Upside (%) 26%
Stock Information Market Cap. (Rs bn / US$ mn) 1,385/25,358
52‐week High/Low (Rs) 1,211/762
3m ADV (Rs mn /US$ mn) 3,039/55.7
Beta 1.3
Sensex/ Nifty 19,987/6,057
Share outstanding (mn) 1,150
Stock Performance (%) 1M 3M 12M YTD
Absolute 6.0 14.3 52.6 5.8
Rel. to Sensex 2.5 7.0 23.3 2.8
Performance
Source: Bloomberg
1 Year Forward P/ABV
Source: Karvy Institutional Research
Analysts Contact
Hatim Broachwala, CFA
022‐6184 4329
Paresh Jain
022 6184 4324
500
700
900
1,100
1,300
15,500
17,500
19,500
21,500
Jan‐12
Feb‐12
Apr‐12
May‐12
Jun‐12
Aug‐12
Sep‐12
Oct‐12
Dec‐12
Jan‐13
Sensex (LHS) ICICI Bank (RHS)
‐
1.00
2.00
3.00
4.00
Feb‐07
Aug‐07
Feb‐08
Aug‐08
Feb‐09
Aug‐09
Feb‐10
Aug‐10
Feb‐11
Aug‐11
Feb‐12
Aug‐12
P/AdjBVPS Mean
+1 SD ‐1 SD
(x)
Improved Asset Quality, NIMs to Sustain at
Current Levels; Maintain BUY
ICICI Bank is currently trading at 10% premium to its five year average,
whereas it is at 20% discount to the stock’s +1SD valuation. Meanwhile, the
stock has also outperformed the Bankex by 8% over last one year on account of
its improving fundamentals. HDFC Bank is trading at 130% premium to ICICI
Bank as against historical average of 100%.
Substantial Improvement in Asset Quality: There has been substantial
improvement in the asset quality of the Bank with Gross NPA improving over
160 bps in last nine quarters vis‐à‐vis industry trend of further deterioration. Its
restructured book at just 1.5% of loan book seems to be at comfortable zone. As
per the Bank’s Management, the credit cost – including restructuring related
provisioning – would remain within 0.75% of loan book in FY13E.
Revival in Balance‐sheet Growth: Picking up the pace, the Bank’s balance‐
sheet growth has started growing marginally above the industry compared to
flattish numbers reported last year. Though the Bank’s retail credit has shown
the initial signs of revival, it has shifted significantly away from the unsecured
retail credit. It has now built a strong CASA base of 40.7% in Q2FY13 from
28.7% in FY09.
Improved NIMs – To Sustain at Current Levels: NIMs for the bank has
improved by 40bps over last three years to 3%, with push from domestic as
well as international segment. Management has guided stable NIMs ahead. We
believe with CASA at comfortable levels, it should not be very difficult for the
Bank to maintain the NIMs at current levels.
Outlook & Valuation
At the CMP, the stock – after adjusting for subsidiaries – trades at 13.6x & 11.2x
FY14E & FY15E earnings, and at 1.7x & 1.5x P/ABV FY14E & FY15E,
respectively. Based on 15% premium to historical mean valuation gap to HDFC
Bank implying 2x P/ABV FY15E for parent & Rs. 200 for its stake in
subsidiaries, we reiterate our “BUY” recommendation on ICICI Bank with
upwardly revised target price of Rs. 1,520 per share (from Rs. 1,155 earlier).
Key Financials
Y/E Mar (Rs. mn) FY11 FY12 FY13E FY14E FY15E
Net interest income 90,169 107,342 138,859 155,306 177,870
Operating Profit 92,498 104,622 125,725 137,176 161,182
PAT 51,514 64,653 77,909 85,748 103,659
EPS (Rs) 44.7 56.1 67.6 74.4 89.9
ABV (Rs) 457.4 498.5 550.8 602.1 660.0
P/E (x) 22.5 18.0 14.9 13.6 11.2
P/ABV (x) 2.2 2.0 1.8 1.7 1.5
Gross NPA (%) 4.5 3.6 3.4 2.8 2.6
Net NPA (%) 1.1 0.7 0.7 0.6 0.6
ROE (%) 9.7 11.3 12.5 12.5 13.8
ROA (%) 1.3 1.5 1.5 1.5 1.6
Source: Company, Karvy Institutional Research, Valuation after adjusting for subsidiaries

36
January 16, 2013
ICICI Bank
Exhibit 1: Income Statement
Y/E Mar (Rs. mn) FY11 FY12 FY13E FY14E FY15E
Interest Income 259,741 335,427 393,852 432,507 477,990
Interest expense 169,572 228,085 254,993 277,201 300,120
Net interest income 90,169 107,342 138,859 155,306 177,870
Fees 55,146 54,351 57,069 65,629 75,473
Other Income 13,355 21,433 20,643 21,750 22,967
Net Revenue 158,670 183,126 216,570 242,684 276,310
Operating Expense 66,172 78,504 90,846 105,508 115,128
‐Employee Exp 28,169 35,153 38,007 43,100 48,876
‐Other Exp 38,003 43,351 52,838 62,408 66,252
Operating Profit 92,498 104,622 125,725 137,176 161,182
Investment Profit ‐2,022 ‐756 2,470 3,544 5,805
Pre‐provision Profit 90,476 103,866 128,195 140,719 166,986
Provisions 22,899 15,892 22,912 26,388 28,775
‐Loan Loss Provisions 19,769 9,932 21,933 23,665 25,890
‐Provisions for investment 2,038 4,132 ‐850 895 1,056
‐Other Provisions 1,092 1,828 1,828 1,828 1,828
PBT 67,577 87,974 105,283 114,331 138,212
Taxes 16,063 23,321 27,374 28,583 34,553
PAT 51,514 64,653 77,909 85,748 103,659
Source: Company, Karvy Institutional Research
Exhibit 2: Balance Sheet
Y/E Mar (Rs. mn) FY11 FY12 FY13E FY14E FY15E
Equity Capital 11,518 11,528 11,528 11,528 11,528
Reserves & Surplus 539,388 581,788 644,785 702,210 773,499
Shareholderʹs Funds 550,906 593,316 656,313 713,738 785,027
Deposits 2,256,021 2,555,000 2,963,800 3,556,560 4,267,872
‐Current deposits 347,775 349,731 390,611 479,525 586,222
‐Saving deposits 668,690 760,463 883,103 1,060,931 1,274,325
‐Term deposit 1,239,556 1,444,806 1,690,086 2,016,104 2,407,326
Borrowings 1,095,543 1,401,649 1,552,200 1,681,586 1,836,848
‐Sub ordinate debt 363,913 376,147 421,312 460,128 506,707
Other liabilities 159,867 175,794 156,382 136,221 107,245
Total liabilities 4,062,337 4,725,759 5,328,695 6,088,105 6,996,993
Cash/Equivalent 340,901 362,293 410,644 480,754 564,885
Advances 2,163,659 2,537,277 2,946,077 3,449,923 4,054,538
Investments 1,346,860 1,595,600 1,697,800 1,845,990 2,023,818
Fixed Assets 47,442 46,147 49,747 53,347 56,947
Other assets 163,475 195,154 224,427 258,091 296,805
Total assets 4,062,337 4,736,471 5,328,695 6,088,105 6,996,993
Source: Company, Karvy Institutional Research
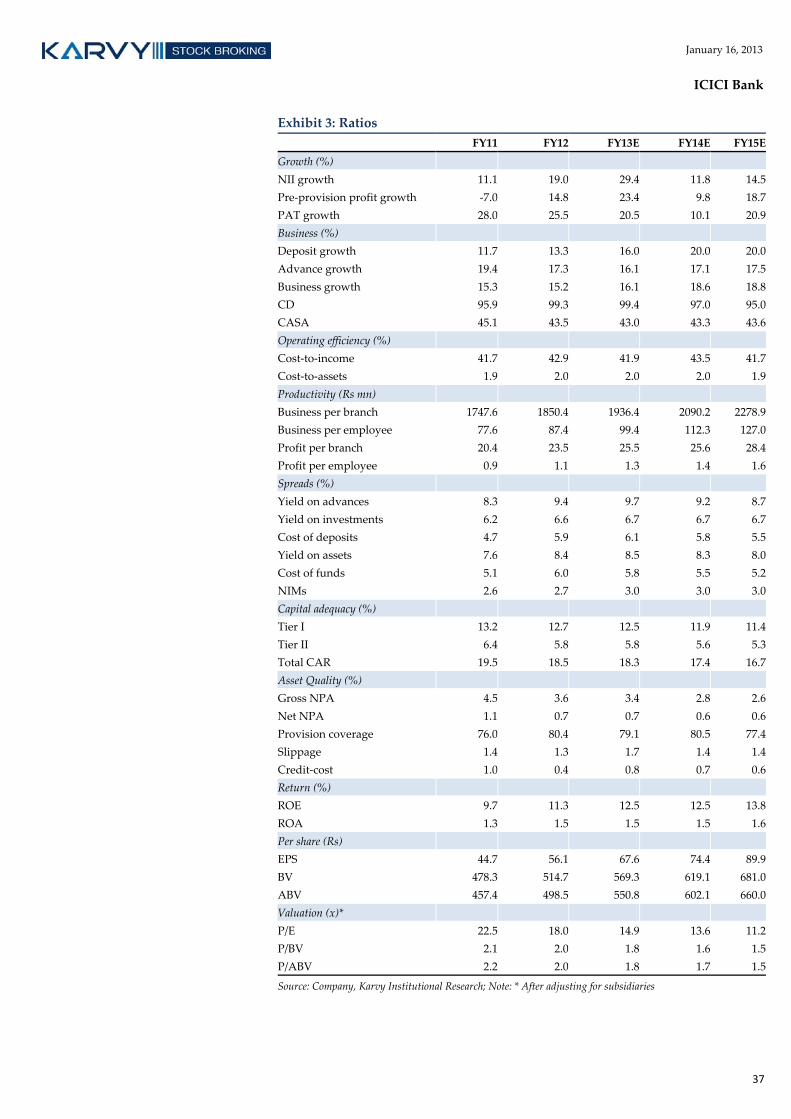
37
January 16, 2013
ICICI Bank
Exhibit 3: Ratios
FY11 FY12 FY13E FY14E FY15E
Growth (%)
NII growth 11.1 19.0 29.4 11.8 14.5
Pre‐provision profit growth ‐7.0 14.8 23.4 9.8 18.7
PAT growth 28.0 25.5 20.5 10.1 20.9
Business (%)
Deposit growth 11.7 13.3 16.0 20.0 20.0
Advance growth 19.4 17.3 16.1 17.1 17.5
Business growth 15.3 15.2 16.1 18.6 18.8
CD 95.9 99.3 99.4 97.0 95.0
CASA 45.1 43.5 43.0 43.3 43.6
Operating efficiency (%)
Cost‐to‐income 41.7 42.9 41.9 43.5 41.7
Cost‐to‐assets 1.9 2.0 2.0 2.0 1.9
Productivity (Rs mn)
Business per branch 1747.6 1850.4 1936.4 2090.2 2278.9
Business per employee 77.6 87.4 99.4 112.3 127.0
Profit per branch 20.4 23.5 25.5 25.6 28.4
Profit per employee 0.9 1.1 1.3 1.4 1.6
Spreads (%)
Yield on advances 8.3 9.4 9.7 9.2 8.7
Yield on investments 6.2 6.6 6.7 6.7 6.7
Cost of deposits 4.7 5.9 6.1 5.8 5.5
Yield on assets 7.6 8.4 8.5 8.3 8.0
Cost of funds 5.1 6.0 5.8 5.5 5.2
NIMs 2.6 2.7 3.0 3.0 3.0
Capital adequacy (%)
Tier I 13.2 12.7 12.5 11.9 11.4
Tier II 6.4 5.8 5.8 5.6 5.3
Total CAR 19.5 18.5 18.3 17.4 16.7
Asset Quality (%)
Gross NPA 4.5 3.6 3.4 2.8 2.6
Net NPA 1.1 0.7 0.7 0.6 0.6
Provision coverage 76.0 80.4 79.1 80.5 77.4
Slippage 1.4 1.3 1.7 1.4 1.4
Credit‐cost 1.0 0.4 0.8 0.7 0.6
Return (%)
ROE 9.7 11.3 12.5 12.5 13.8
ROA 1.3 1.5 1.5 1.5 1.6
Per share (Rs)
EPS 44.7 56.1 67.6 74.4 89.9
BV 478.3 514.7 569.3 619.1 681.0
ABV 457.4 498.5 550.8 602.1 660.0
Valuation (x)*
P/E 22.5 18.0 14.9 13.6 11.2
P/BV 2.1 2.0 1.8 1.6 1.5
P/ABV 2.2 2.0 1.8 1.7 1.5
Source: Company, Karvy Institutional Research; Note: * After adjusting for subsidiaries

Banking January 16, 2013
Indian Overseas Bank
Bloomberg: IOB INReuters: IOBK.BO SELL
Institutional Equities
India Research
COMPANY UPDATE
Recommendation
CMP: Rs92
Target Price: Rs96
Upside (%) 4%
Stock Information Market Cap. (Rs bn / US$ mn) 73/1,337
52‐week High/Low (Rs) 119/66
3m ADV (Rs mn /US$ mn) 122/2.2
Beta 1.0
Sensex/ Nifty 19,987/6,057
Share outstanding (mn) 797
Stock Performance (%) 1M 3M 12M YTD
Absolute 8.1 15.2 9.0 6.9
Rel. to Sensex 4.5 7.9 (11.9) 3.9
Performance
Source: Bloomberg
1 Year Forward P/ABV
Source: Karvy Institutional Research
Analysts Contact
Paresh Jain
022 6184 4324
Hatim Broachwala, CFA
022‐6184 4329
60708090100110120
15,500
17,500
19,500
21,500
Jan‐12
Feb‐12
Apr‐12
May‐12
Jun‐12
Aug‐12
Sep‐12
Oct‐12
Dec‐12
Jan‐13
Sensex (LHS)
Indian Overseas Bank (RHS)
0.0
1.0
2.0
Apr‐07
Aug‐07
Dec‐07
Apr‐08
Aug‐08
Dec‐08
Apr‐09
Aug‐09
Dec‐09
Apr‐10
Aug‐10
Dec‐10
Apr‐11
Aug‐11
Dec‐11
Apr‐12
Aug‐12
Dec‐12
1yr fwd P/Adj BV Mean + Std Dev
Mean ‐ Std Dev Mean
(x)
Worst not yet over; Stock to Continue to Trade
at Discount to Peers; Maintain SELL
Indian Overseas Bank (IOB) is currently trading at 30% discount to its five
year average valuation, while the stock has underperformed the Bankex by
35% over last one year reflecting poor margins and continued pressure on
asset quality. As we do not expect asset quality to turn around soon, we
expect the stock to continue to trade at a discount to peers
Increased Slippage Ratio; No Significant Improvement in Asset Quality
Expected soon: The slippage ratio of Indian Overseas Bank has increased
significantly in H1FY13, while we expect similar pressure to continue further
even in H2FY13 too. The Bank’s Gross NPA & Net NPA ratios are currently
at two years high, with provision coverage ratio declining to 58.5%. We do
not expect any significant asset quality improvement before H2FY14. At the
same time, the Bank’s restructured loan book continues to remain elevated at
10%, providing further downside risks to asset quality.
Marginal Improvement in Margins: Indian Overseas Bank’s NIM continues
to remain depressed owing to rise in cost of deposits and decline in yield on
advances. We expect the Bank’s NIM to witness marginal improvement in
H2FY13E (on lower base) on the back of reduction in cost of funds.
Lower RoE to Suppress Valuation: We expect the Bank’s RoE to remain
below 12% throughout FY14 compared to the average of 18% in FY08‐12
period, owing to poor NIM and higher credit costs. Thus we believe that
lower RoE would keep the Bank’s valuations below its historical average.
Outlook & Valuation
At the CMP, the stock trades at 5.4x & 4.4x FY14E & FY15E earnings, and at
0.7x & 0.65x P/ABV FY14E & FY15E, respectively. Based on 30% discount to
its historical mean valuation implying 0.7x P/ABV FY15E, we reiterate our
“SELL” recommendation on Indian Overseas Bank with upwardly revised
target price of Rs. 96 per share (from Rs. 70 earlier).
Key Financials
Y/E Mar (Rs. mn) FY11 FY12 FY13E FY14E FY15E
Net Interest Income 42,080 50,162 52,195 63,489 73,399
Operating profit 27,521 33,628 33,402 40,880 46,105
PAT 10,725 10,501 10,464 13,606 16,551
EPS (Rs) 19.6 13.2 13.1 17.1 20.8
ABV (Rs) 117.5 116.0 110.4 126.9 138.1
P/E (x) 4.7 7.0 7.0 5.4 4.4
P/ABV (x) 0.8 0.8 0.8 0.7 0.7
Gross NPA (%) 2.7 2.7 3.9 3.8 3.6
Net NPA (%) 1.2 1.4 1.9 1.6 1.5
ROE (%) 14.8 11.1 9.4 11.4 12.8
ROA (%) 0.7 0.5 0.4 0.5 0.5
Source: Company, Karvy Institutional Research

39
January 16, 2013
Indian Overseas Bank
Exhibit 1: Income Statement
Y/E Mar (Rs. mn) FY11 FY12 FY13E FY14E FY15E
Interest Income 121,015 178,971 207,812 234,339 269,931
Interest expense 78,934 128,809 155,617 170,850 196,531
Net interest income 42,080 50,162 52,195 63,489 73,399
Fees 6,892 8,999 11,064 12,664 14,864
Other Income 5,359 7,812 8,769 10,450 11,905
Net Revenue 54,331 66,972 72,028 86,603 100,168
Operating Expense 25,725 31,631 36,396 43,004 50,843
‐Employee Exp 17,411 20,830 24,126 27,984 33,023
‐Other Exp 8,314 10,801 12,270 15,020 17,820
Operating Profit 27,521 33,628 33,402 40,880 46,105
Investment Profit 1,086 1,714 2,230 2,720 3,220
Pre‐Provision Profits 28,606 35,341 35,632 43,600 49,325
Provisions 12,684 22,364 22,552 24,961 26,653
‐Loan Loss Provisions 10,336 14,702 17,250 19,355 20,234
‐Investment Depreciation 12 1,716 950 1,054 1,313
‐Other Provisions 2,336 5,947 4,352 4,552 5,106
PBT 15,922 12,977 13,080 18,639 22,672
Taxes 5,197 2,476 2,616 5,032 6,122
PAT 10,725 10,501 10,464 13,606 16,551
Source: Company, Karvy Institutional Research
Exhibit 2: Balance Sheet
Y/E Mar (Rs mn) FY11 FY12 FY13E FY14E FY15E
Equity Capital 6,187 7,970 7,970 7,970 7,970
Reserves & Surplus 87,062 111,307 118,507 128,383 140,272
Shareholderʹs Funds 93,249 119,277 126,477 136,353 148,242
Deposits 1,452,288 1,784,342 2,062,255 2,435,458 2,857,454
Current deposits 118,056 122,873 126,192 146,192 168,196
Saving deposits 320,556 348,620 388,552 487,552 587,542
Term deposit 1,013,675 1,312,849 1,547,511 1,801,714 2,101,716
Borrowings 193,554 236,138 283,856 320,928 395,928
‐Sub ordinate debt 34,260 33,900 38,900 39,900 42,900
Other liabilities 48,752 56,725 87,034 124,392 185,708
Total liabilities 1,787,843 2,196,482 2,559,622 3,017,131 3,587,332
Cash/Equivalent 120,187 162,611 168,109 205,269 242,469
Advances 1,118,330 1,407,244 1,672,910 1,993,251 2,363,251
Investments 486,105 555,659 644,145 736,145 886,145
Fixed Assets 16,811 17,440 18,542 21,542 24,542
Other assets 46,411 53,527 55,915 60,924 70,924
Total assets 1,787,843 2,196,482 2,559,622 3,017,131 3,587,332
Source: Company, Karvy Institutional Research

40
January 16, 2013
Indian Overseas Bank
Exhibit 3: Ratios
FY11 FY12 FY13E FY14E FY15E
Growth (%)
NII growth 32.8 19.2 4.1 21.6 15.6
Pre‐provision profit growth 55.1 23.5 0.8 22.4 13.1
PAT growth 51.7 (2.1) (0.4) 30.0 21.6
Business (%)
Deposit growth 31.1 22.9 15.6 18.1 17.3
Advance growth 41.6 25.8 18.9 19.1 18.6
Business growth 35.4 24.2 17.0 18.6 17.9
CD 77.0 78.9 81.1 81.8 82.7
CASA 30.2 26.4 25.0 26.0 26.4
Operating efficiency (%)
Cost‐to‐income 47.3 47.2 50.5 49.7 50.8
Cost‐to‐assets 1.1 1.0 1.0 1.0 1.0
Productivity (Rs mn)
Business per branch 1,173.8 1,214.0 1,249.6 1,310.7 1,377.9
Business per employee 99.7 116.6 111.1 116.5 122.5
Profit per branch 4.9 4.0 3.5 4.0 4.4
Profit per employee 0.4 0.4 0.3 0.4 0.4
Spreads (%)
Yield on advances 9.3 10.8 10.4 9.8 9.5
Yield on investments 6.9 7.6 7.3 7.3 7.2
Cost of deposits 5.3 6.9 7.3 6.8 6.6
Yield on funds 8.1 9.3 9.0 8.6 8.4
Cost of funds 5.4 6.9 7.0 6.6 6.5
NIMs 2.8 2.6 2.3 2.3 2.3
Capital adequacy (%)
Tier I 8.2 7.6 7.1 6.5 6.0
Tier II 6.4 4.5 4.9 4.7 4.1
Total CAR 14.5 12.2 12.0 11.1 10.1
Asset Quality (%)
Gross NPA 2.7 2.7 3.9 3.8 3.6
Net NPA 1.2 1.4 1.9 1.6 1.5
Provision coverage 57.0 51.3 50.7 59.9 59.8
Provision coverage (incl w/off) 70.5 67.7 63.4 74.4 76.0
Slippage 2.2 2.5 2.9 2.1 2.2
Credit cost 1.1 1.1 1.1 1.0 0.9
Return (%)
ROE 14.8 11.1 9.4 11.4 12.8
ROA 0.7 0.5 0.4 0.5 0.5
Per share (Rs)
EPS 19.6 13.2 13.1 17.1 20.8
BV 132.0 135.3 143.0 155.4 170.3
ABV 117.5 116.0 110.4 126.9 138.1
Valuation(x)
P/E 4.7 7.0 7.0 5.4 4.4
P/BV 0.7 0.7 0.6 0.6 0.5
P/ABV 0.8 0.8 0.8 0.7 0.7
Source: Company, Karvy Institutional Research

Banking January 16, 2013
ING Vysya Bank
Bloomberg: VYSB INReuters: VYSB.BO HOLD
Institutional Equities
India Research
COMPANY UPDATE
Recommendation
CMP: Rs581
Target Price: Rs625
Upside (%) 8%
Stock Information Market Cap. (Rs bn / US$ mn) 89/1,631
52‐week High/Low (Rs) 594/300
3m ADV (Rs mn /US$ mn) 77/1.4
Beta 1.0
Sensex/ Nifty 19,987/6,057
Share outstanding (mn) 153
Stock Performance (%) 1M 3M 12M YTD
Absolute 16.3 33.1 85.5 9.8
Rel. to Sensex 12.4 24.6 50.0 6.7
Performance
Source: Bloomberg
1 Year Forward P/ABV
Source: Karvy Institutional Research
Analysts Contact
Hatim Broachwala, CFA
022‐6184 4329
Paresh Jain
022 6184 4324
250
350
450
550
650
15,500
17,500
19,500
21,500
Jan‐12
Feb‐12
Apr‐12
May‐12
Jun‐12
Aug‐12
Sep‐12
Oct‐12
Dec‐12
Jan‐13
Sensex (LHS) ING Vysya Bank (RHS)
‐
2.00
4.00
Feb‐07
Aug‐07
Feb‐08
Aug‐08
Feb‐09
Aug‐09
Feb‐10
Aug‐10
Feb‐11
Aug‐11
Feb‐12
P/AdjBVPS Mean
+1 SD ‐1 SD
Steady Performer, but Positives Priced‐in;
Downgrade to HOLD
ING Vysya Bank is currently trading at 25% premium to its five year average
valuation, while the stock has outperformed the Bankex by 40% over last one
year on account of its superior asset quality, earning consistency and
improving efficiency.
Strong Credit Growth with Diversified Loan Book Improving sharply from
moderate growth, ING Vysya Bank’ credit growth has outpaced the industry
by 3‐5% in FY11 & FY12 especially after the appointment of new
management. Meanwhile, the Bank has also guided that such
outperformance to continue, going ahead.
Improving Asset Quality with Lowest Slippage, No Exposure to
Vulnerable Sector: The Bank’s asset quality has shown sharp improving
trends over the past two years compared to sharp deterioration reported by
its peers. The Bank has negligible exposure in any of the ailing sectors like
aviation, SEBs, realty and oil companies, etc. The Bank mainly focuses on the
working capital requirements of corporates, where it has a better control on
its cash‐flow. Its gross NPA of only ~0.3% in SME segment is remarkable.
Operational Leverage to Boost RoA: The Bank has so far been able to
successfully manage its cost by bringing down cost‐to‐income ratio to 59.5%
in FY12 from 83.4% in FY06. The proportion of unionized staff has declined
from 4/5th to 1/3rd of total employee base. As a long‐term strategy, the Bank
plans to bring down cost‐to‐income ratio close to 50% in next three years.
Outlook & Valuation
At the CMP, the stock trades at 12.3x & 10.2x FY14E & FY15E earnings, and
at 1.8x & 1.5x P/ABV FY14E & FY15E, respectively. Based on 20% premium to
its historical mean valuation implying 1.65x P/ABV FY15E, we downgrade
our recommendation on ING Vysya Bank to “HOLD” from “BUY” on the
back of the recent run up in the stock price, with upwardly revised target
price of Rs. 625 per share (from Rs. 495 earlier).
Key Financials
Y/E Mar (Rs. mn) FY11 FY12 FY13E FY14E FY15E
Net interest income 10,066 12,083 14,764 17,140 19,910
Operating Profit 5,385 7,548 9,496 11,965 14,635
PAT 3,187 4,563 5,733 7,097 8,540
EPS (Rs) 26.3 30.4 38.2 47.3 56.9
ABV (Rs) 209.1 261.5 291.6 330.4 378.0
P/E (x) 22.1 19.1 15.2 12.3 10.2
P/ABV (x) 2.8 2.2 2.0 1.8 1.5
Gross NPA (%) 2.3 1.9 1.8 1.9 2.0
Net NPA (%) 0.4 0.2 0.2 0.3 0.3
ROE (%) 12.9 13.8 13.6 14.9 15.7
ROA (%) 0.9 1.1 1.1 1.2 1.2
Source: Company, Karvy Institutional Research

42
January 16, 2013
ING Vysya Bank
Exhibit 1: Income Statement
Y/E Mar (Rs. mn) FY11 FY12 FY13E FY14E FY15E
Interest Income 26,941 38,568 45,881 51,849 58,369
Interest expense 16,875 26,485 31,117 34,709 38,459
Net interest income 10,066 12,083 14,764 17,140 19,910
Fees 4,189 4,689 5,158 6,086 7,182
Other Income 1,390 1,878 2,075 2,650 2,988
Net Revenue 15,645 18,650 21,997 25,876 30,080
Operating Expense 10,260 11,102 12,500 13,911 15,445
‐Employee Exp 6,057 6,510 7,357 8,254 9,222
‐Other Exp 4,203 4,592 5,143 5,657 6,223
Operating Profit 5,385 7,548 9,496 11,965 14,635
Investment Profit 970 131 268 745 837
Pre‐provision Profit 6,355 7,679 9,764 12,710 15,472
Provisions 1,518 1,140 1,333 2,274 2,912
‐Loan Loss Provisions 1,718 1,096 1,333 2,274 2,912
‐Provisions for investment 54 (4) ‐ ‐ ‐
‐Other Provisions (254) 48 ‐ ‐ ‐
PBT 4,837 6,539 8,431 10,436 12,559
Taxes 1,650 1,976 2,698 3,340 4,019
PAT 3,187 4,563 5,733 7,097 8,540
Source: Company, Karvy Institutional Research
Exhibit 2: Balance Sheet
Y/E Mar (Rs. mn) FY11 FY12 FY13E FY14E FY15E
Equity Capital 1,210 1,501 1,501 1,501 1,501
Reserves & Surplus 25,014 38,281 43,136 49,179 56,490
Shareholderʹs Funds 26,224 39,782 44,637 50,680 57,991
Deposits 301,942 351,954 418,825 502,590 603,108
‐Current deposits 51,071 64,044 70,731 83,296 98,374
‐Saving deposits 53,515 56,429 69,803 90,745 115,874
‐Term deposit 197,356 231,481 278,291 328,550 388,861
Borrowings 41,469 56,965 65,859 64,435 62,726
‐Sub ordinate debt 10,522 11,206 15,653 14,941 14,087
Other liabilities 20,504 21,304 25,360 29,277 33,737
Total liabilities 390,139 470,005 554,681 646,982 757,562
Cash/Equivalent 25,214 32,306 40,573 50,038 61,397
Advances 236,021 287,367 347,551 410,375 485,763
Investments 110,207 127,155 140,529 157,282 177,386
Fixed Assets 5,028 5,008 5,133 5,258 5,383
Other assets 13,669 18,169 20,894 24,029 27,633
Total assets 390,139 470,005 554,681 646,982 757,562
Source: Company, Karvy Institutional Research

43
January 16, 2013
ING Vysya Bank
Exhibit 3: Ratios
FY11 FY12 FY13E FY14E FY15E
Growth (%)
NII growth 21.3 20.0 22.2 16.1 16.2
Pre‐provision profit growth ‐1.0 20.8 27.2 30.2 21.7
PAT growth 31.6 43.2 25.6 23.8 20.3
Business (%)
Deposit growth 16.7 16.6 19.0 20.0 20.0
Advance growth 27.5 21.8 20.9 18.1 18.4
Business growth 21.2 18.8 19.9 19.1 19.3
CD 78.2 81.6 83.0 81.7 80.5
CASA 34.6 34.2 33.6 34.6 35.5
Operating efficiency (%)
Cost‐to‐income 65.6 59.5 56.8 53.8 51.3
Cost‐to‐assets 3.1 2.8 2.7 2.5 2.4
Productivity (Rs mn)
Business per branch 1052.8 1204.0 1378.4 1571.4 1796.8
Business per employee 76.4 63.9 73.0 81.1 90.7
Profit per branch 6.2 8.6 10.3 12.2 14.1
Profit per employee 0.5 0.5 0.5 0.6 0.7
Spreads (%)
Yield on advances 9.7 11.0 11.0 10.5 10.0
Yield on investments 6.0 8.3 8.1 8.0 8.0
Cost of deposits 4.8 6.6 6.7 6.4 6.0
Yield on assets 8.2 9.8 9.8 9.4 9.0
Cost of funds 5.0 6.7 6.6 6.3 5.9
NIMs 3.1 3.1 3.1 3.1 3.1
Capital adequacy (%)
Tier I 9.4 11.2 9.9 9.7 9.4
Tier II 3.6 2.8 3.3 2.7 2.2
Total CAR 12.9 14.0 13.2 12.3 11.6
Asset Quality (%)
Gross NPA 2.3 1.9 1.8 1.9 2.0
Net NPA 0.4 0.2 0.2 0.3 0.3
Provision coverage 83.4 90.7 86.6 86.0 87.0
Slippage 1.1 0.7 1.1 1.0 1.0
Credit‐cost 0.7 0.3 0.4 0.5 0.6
Return (%)
ROE 12.9 13.8 13.6 14.9 15.7
ROA 0.9 1.1 1.1 1.2 1.2
Per share (Rs)
EPS 26.3 30.4 38.2 47.3 56.9
BV 216.7 265.0 297.4 337.6 386.3
ABV 209.1 261.5 291.6 330.4 378.0
Valuation (x)
P/E 22.1 19.1 15.2 12.3 10.2
P/BV 2.7 2.2 2.0 1.7 1.5
P/ABV 2.8 2.2 2.0 1.8 1.5
Source: Company, Karvy Institutional Research

Banking January 16, 2013
Jammu & Kashmir Bank
Bloomberg: JKBK INReuters: JKBK.BO BUY
Institutional Equities
India Research
COMPANY UPDATE
Recommendation
CMP: Rs1,358
Target Price: Rs1,560
Upside (%) 15%
Stock Information Market Cap. (Rs bn / US$ mn) 66/1,206
52‐week High/Low (Rs) 1,575/710
3m ADV (Rs mn /US$ mn) 138/2.5
Beta 0.8
Sensex/ Nifty 19,987/6,057
Share outstanding (mn) 48
Stock Performance (%) 1M 3M 12M YTD
Absolute (0.2) 17.2 88.6 4.9
Rel. to Sensex (3.6) 9.7 52.5 2.0
Performance
Source: Bloomberg
1 Year Forward P/ABV
Source: Karvy Institutional Research
Analysts Contact Hatim Broachwala, CFA
022‐6184 4329
Paresh Jain
022 6184 4324
6408401,0401,2401,4401,640
15,500
17,500
19,500
21,500
Jan‐12
Feb‐12
Apr‐12
May‐12
Jun‐12
Aug‐12
Sep‐12
Oct‐12
Dec‐12
Jan‐13
Sensex (LHS) Jammu & Kashmir Bank
‐
0.50
1.00
1.50
Apr‐09
Aug‐09
Dec‐09
Apr‐10
Aug‐10
Dec‐10
Apr‐11
Aug‐11
Dec‐11
Apr‐12
Aug‐12
Dec‐12
P/AdjBVPS Mean
+1 SD ‐1 SD
(x)
Improving Fundamentals – Case for Rerating;
Maintain BUY
Jammu & Kashmir Bank (J&K Bank) is currently trading at 10% premium to
+1SD, while the stock has outperformed the Bankex by 40% over last one year
on account of improvement in business growth, improving margins and
superior asset quality.
Monopolistic Provincial Dominance: With 65% & 70% market share of
state’s total deposits and advances, respectively, J&K Bank continues to be a
dominant player in Jammu & Kashmir. Along with its monopolistic
positioning coupled with upward trajectory trend in GDP growth of the
state, the Bank is well‐placed to take the fullest advantage of the growth.
Business Momentum Keeps Growing: In the aftermath of new management
taking charge, the Bank’s business momentum has picked up considerably,
which is getting reflected in its credit growth and branch expansion. Its NIMs
is one of the highest amongst its peers, which is expected to rise further.
Best‐in‐Class Asset Quality: The Bank’s asset quality has shown sharp
improvement contrary to sharp deterioration reported by its peers owing to
its superior domain expertise along with improving economic environment
within the region.
Superior Return Ratios: J&K Bank enjoys one of the best RoE & RoA profile
compared to its peers, which has consistently improved over past few years
on the back of higher NIMs, operational efficiency and lower slippages
resulting in lower credit cost.
Outlook & Valuation
At the CMP, the stock trades at 6.2x & 5.3x FY14E & FY15E earnings, and at
1.2x & 1.0x P/ABV FY14E & FY15E, respectively. Based on 20% premium to
its historical mean valuation implying 1.1x P/ABV FY15E and 84 for its stake
in MetLife (based on revised deal), we reiterate our “BUY” recommendation
on J&K Bank with upwardly revised target price of Rs. 1,560 per share (from
Rs. 1,500 earlier).
Key Financials
Y/E Mar (Rs. mn) FY11 FY12 FY13E FY14E FY15E
Net interest income 15,436 18,384 22,331 26,004 30,971
Operating Profit 10,571 13,344 16,383 18,811 22,297
PAT 6,152 8,033 9,883 10,532 12,360
EPS (Rs) 126.8 165.6 203.8 217.2 254.8
ABV (Rs) 706.3 833.8 982.6 1148.3 1338.8
P/E (x) 10.7 8.2 6.6 6.2 5.3
P/ABV (x) 1.9 1.6 1.4 1.2 1.0
Gross NPA (%) 2.0 1.5 1.7 1.8 1.9
Net NPA (%) 0.2 0.1 0.3 0.2 0.2
ROE (%) 19.0 21.2 22.1 20.0 20.1
ROA (%) 1.3 1.5 1.5 1.4 1.4
Source: Company, Karvy Institutional Research

45
January 16, 2013
Jammu & Kashmir Bank
Exhibit 1: Income Statement
Y/E Mar (Rs. mn) FY11 FY12 FY13E FY14E FY15E
Interest Income 37,131 48,356 58,260 66,324 76,314
Interest expense 21,695 29,972 35,929 40,321 45,344
Net interest income 15,436 18,384 22,331 26,004 30,971
Fees 1,272 1,291 1,446 1,706 2,013
Other Income 1,452 1,691 1,831 1,984 2,153
Net Revenue 18,160 21,366 25,607 29,694 35,137
Operating Expense 7,589 8,022 9,225 10,883 12,840
‐Employee Exp 5,236 5,214 5,855 6,840 7,988
‐Other Exp 2,353 2,808 3,370 4,044 4,852
Operating Profit 10,571 13,344 16,383 18,811 22,297
Investment Profit 924 359 668 712 767
Pre‐provision Profit 11,495 13,703 17,051 19,523 23,064
Provisions 2,151 1,692 2,189 3,685 4,477
‐Loan Loss Provisions 1,300 1,200 1,835 3,290 4,043
‐Investment Depreciation 410 123 ‐15 ‐11 ‐13
‐Other Provisions 441 369 369 406 446
PBT 9,344 12,011 14,862 15,838 18,587
Taxes 3,192 3,978 4,979 5,306 6,227
PAT 6,152 8,033 9,883 10,532 12,360
Source: Company, Karvy Institutional Research
Exhibit 2: Balance Sheet
Y/E Mar (Rs. mn) FY11 FY12 FY13E FY14E FY15E
Equity Capital 485 485 485 485 485
Reserves & Surplus 34,302 40,447 48,202 56,181 65,562
Shareholderʹs Funds 34,787 40,932 48,687 56,666 66,047
Deposits 446,759 533,469 618,824 730,212 861,651
‐Current deposits 53,599 57,344 63,319 71,116 80,317
‐Saving deposits 127,268 159,807 181,146 220,132 266,135
‐Term deposit 265,892 316,318 374,359 438,965 515,199
Borrowings 11,047 12,409 15,738 20,082 25,208
‐Sub ordinate debt 6,000 6,000 6,999 8,302 9,840
Other liabilities 12,489 15,882 12,755 10,188 6,996
Total liabilities 505,082 602,692 696,004 817,148 959,902
Cash/Equivalent 35,488 44,539 51,053 59,296 69,022
Advances 261,936 330,774 403,326 498,006 609,728
Investments 196,958 216,243 229,046 245,755 265,470
Fixed Assets 3,938 4,203 4,953 5,703 6,453
Other assets 6,762 6,933 7,626 8,389 9,228
Total assets 505,082 602,692 696,004 817,148 959,902
Source: Company, Karvy Institutional Research

46
January 16, 2013
Jammu & Kashmir Bank
Exhibit 3: Ratios
FY11 FY12 FY13E FY14E FY15E
Growth
NII growth 37.9 19.1 21.5 16.4 19.1
Pre‐provision profit growth 20.0 19.2 24.4 14.5 18.1
PAT growth 20.1 30.6 23.0 6.6 17.4
Business (%)
Deposit growth 20.0 19.4 16.0 18.0 18.0
Advance growth 13.6 26.3 21.9 23.5 22.4
Business growth 17.5 21.9 18.3 20.2 19.8
CD 58.6 62.0 65.2 68.2 70.8
CASA 40.5 40.7 39.5 39.9 40.2
Operating efficiency (%)
Cost‐to‐income 41.8 37.5 36.0 36.7 36.5
Cost‐to‐assets 1.8 1.6 1.5 1.5 1.5
Productivity (Rs mn)
Business per branch 1293.2 1433.2 1614.8 1852.5 2123.2
Business per employee 89.3 93.3 107.4 127.0 149.9
Profit per branch 11.2 13.3 15.6 15.9 17.8
Profit per employee 0.8 0.9 1.0 1.1 1.3
Spreads (%)
Yield on advances 10.7 11.5 11.7 11.2 10.7
Yield on investments 6.3 6.8 6.8 6.6 6.6
Cost of deposits 5.1 5.9 6.0 5.8 5.5
Yield on assets 8.7 9.4 9.6 9.3 9.1
Cost of funds 5.0 5.8 5.9 5.7 5.5
NIMs 3.6 3.6 3.7 3.7 3.7
Capital adequacy (%)
Tier I 11.3 11.1 10.7 10.6 10.6
Tier II 2.4 2.2 0.8 0.8 0.8
Total CAR 13.7 13.4 11.5 11.5 11.4
Asset Quality (%)
Gross NPA 2.0 1.5 1.7 1.8 1.9
Net NPA 0.2 0.1 0.3 0.2 0.2
Provision coverage 89.7 90.5 85.0 89.1 90.5
Provision coverage (incl w/off) 92.7 93.8 89.6 92.2 92.9
Slippage 1.2 1.1 1.1 1.2 1.2
Credit‐cost 0.5 0.3 0.5 0.7 0.7
Return (%)
ROE 19.0 21.2 22.1 20.0 20.1
ROA 1.3 1.5 1.5 1.4 1.4
Per share (Rs)
EPS 126.8 165.6 203.8 217.2 254.8
BV 717.3 844.0 1003.9 1168.4 1361.8
ABV 706.3 833.8 982.6 1148.3 1338.8
Valuation (x)
P/E 10.7 8.2 6.6 6.2 5.3
P/BV 1.8 1.6 1.3 1.1 1.0
P/ABV 1.9 1.6 1.4 1.2 1.0
Source: Company, Karvy Institutional Research

Banking January 16, 2013
Karur Vysya Bank
Bloomberg: KVB INReuters: KARU.BO HOLD
Institutional Equities
India Research
COMPANY UPDATE
Recommendation
CMP: Rs556
Target Price: Rs610
Upside (%) 10%
Stock Information Market Cap. (Rs bn / US$ mn) 60/1,091
52‐week High/Low (Rs) 576/352
3m ADV (Rs mn /US$ mn) 95/1.7
Beta 0.7
Sensex/ Nifty 19,987/6,057
Share outstanding (mn) 107
Stock Performance (%) 1M 3M 12M YTD
Absolute 10.4 27.0 52.4 (1)
Rel. to Sensex 6.7 19.0 23.2 (3.8)
Performance
Source: Bloomberg
1 Year Forward P/ABV
Source: Karvy Institutional Research
Analysts Contact Paresh Jain
022 6184 4324
Hatim Broachwala, CFA
022‐6184 4329
300350400450500550600
15,500
17,500
19,500
21,500
Jan‐12
Feb‐12
Apr‐12
May‐12
Jun‐12
Aug‐12
Sep‐12
Oct‐12
Dec‐12
Jan‐13
Sensex (LHS) Karur Vysya Bank (RHS)
0.0
0.5
1.0
1.5
2.0
Apr‐07
Aug‐07
Dec‐07
Apr‐08
Aug‐08
Dec‐08
Apr‐09
Aug‐09
Dec‐09
Apr‐10
Aug‐10
Dec‐10
Apr‐11
Aug‐11
Dec‐11
Apr‐12
Aug‐12
Dec‐12
1yr fwd P/Adj BV
Mean + Std Dev
(x)
Best in Class, but Positives Priced‐in;
Downgrade to HOLD
Karur Vysya Bank (KVB) is currently trading at 30% premium to its five year
average valuation, while the stock has outperformed the Bankex by 6% over
last one year reflecting strong growth prospects, better margin and superior
asset quality.
Healthy Growth in Business: The business growth of Karur Vysya Bank
continues to remain above industry growth rate. The Bank’s loan book grew
34% in FY12, while the overall banking industry grew by 18%. We expect the
Bank to continue its high growth momentum in FY12‐15E as well. The key
segments likely to contribute the credit growth of Karur Vysya Bank are:
SME, Agricultural & Personal loans.
NIMs – Expected to Remain Stable: We believe that Karur Vysya Bank’s
NIMs to remain stable in FY13E. Meanwhile, the decline in yield on advances
in H2FY13E is expected to get offset by decline in cost of funds.
Impeccable Asset Quality: Karur Vysya Bank’s asset quality continues to
show improvement with it Gross NPA declining to its lowest level in last
three years. We believe that the Bank’s slippages would marginally increase,
going forward, as it will be difficult for the Bank to improve the asset quality
further. The Bank is currently having a healthy provision coverage ratio of
75% with restructured asset at one of the lowest level amongst its peers at
2.8%.
Outlook & Valuation
At CMP, the stock trades at 7.7x & 6.3x FY14E & FY15E earnings, and at 1.6x
& 1.4x P/ABV FY14E & FY15E, respectively. Based on 20% premium to its
mean valuation implying 1.5x P/ABV FY15E, We downgrade our
recommendation on Karur Vysya Bank to “HOLD” from “BUY” given the
recent run‐up in the stock price, with upwardly revised target price of Rs. 610
per share (from Rs. 535 earlier),.
Key Financials
Y/ E Mar (Rs. mn) FY11 FY12 FY13E FY14E FY15E
Net Interest Income 7,669 9,171 11,684 15,031 18,316
Operating profit 5,628 6,995 8,499 11,272 13,748
PAT 4,156 5,017 6,034 7,697 9,465
EPS (Rs) 44.9 46.8 56.3 71.8 88.3
ABV (Rs) 222.7 246.8 287.4 341.2 408.3
P/E (x) 12.4 11.9 9.9 7.7 6.3
P/ABV (x) 2.5 2.3 1.9 1.6 1.4
Gross NPA (%) 1.3 1.3 1.3 1.4 1.6
Net NPA (%) 0.1 0.3 0.3 0.3 0.4
ROE (%) 22.3 20.8 20.6 22.5 23.1
ROA (%) 1.7 1.5 1.5 1.5 1.5
Source: Company, Karvy Institutional Research
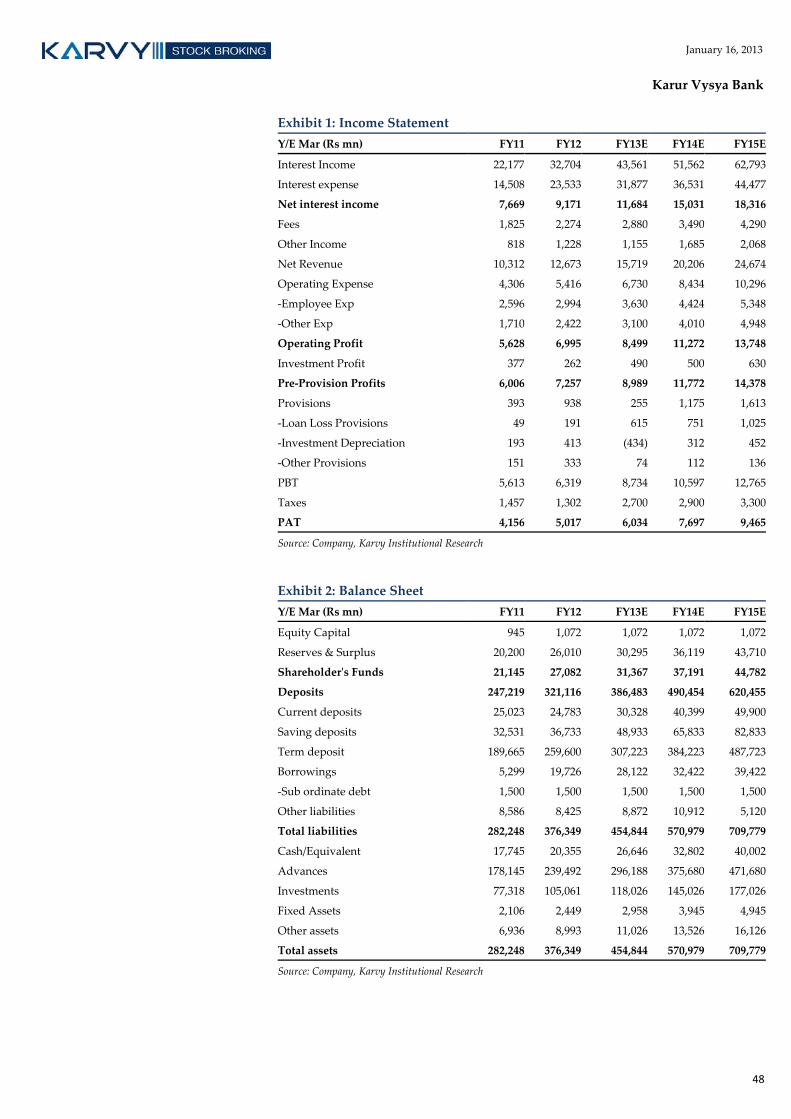
48
January 16, 2013
Karur Vysya Bank
Exhibit 1: Income Statement
Y/E Mar (Rs mn) FY11 FY12 FY13E FY14E FY15E
Interest Income 22,177 32,704 43,561 51,562 62,793
Interest expense 14,508 23,533 31,877 36,531 44,477
Net interest income 7,669 9,171 11,684 15,031 18,316
Fees 1,825 2,274 2,880 3,490 4,290
Other Income 818 1,228 1,155 1,685 2,068
Net Revenue 10,312 12,673 15,719 20,206 24,674
Operating Expense 4,306 5,416 6,730 8,434 10,296
‐Employee Exp 2,596 2,994 3,630 4,424 5,348
‐Other Exp 1,710 2,422 3,100 4,010 4,948
Operating Profit 5,628 6,995 8,499 11,272 13,748
Investment Profit 377 262 490 500 630
Pre‐Provision Profits 6,006 7,257 8,989 11,772 14,378
Provisions 393 938 255 1,175 1,613
‐Loan Loss Provisions 49 191 615 751 1,025
‐Investment Depreciation 193 413 (434) 312 452
‐Other Provisions 151 333 74 112 136
PBT 5,613 6,319 8,734 10,597 12,765
Taxes 1,457 1,302 2,700 2,900 3,300
PAT 4,156 5,017 6,034 7,697 9,465
Source: Company, Karvy Institutional Research
Exhibit 2: Balance Sheet
Y/E Mar (Rs mn) FY11 FY12 FY13E FY14E FY15E
Equity Capital 945 1,072 1,072 1,072 1,072
Reserves & Surplus 20,200 26,010 30,295 36,119 43,710
Shareholderʹs Funds 21,145 27,082 31,367 37,191 44,782
Deposits 247,219 321,116 386,483 490,454 620,455
Current deposits 25,023 24,783 30,328 40,399 49,900
Saving deposits 32,531 36,733 48,933 65,833 82,833
Term deposit 189,665 259,600 307,223 384,223 487,723
Borrowings 5,299 19,726 28,122 32,422 39,422
‐Sub ordinate debt 1,500 1,500 1,500 1,500 1,500
Other liabilities 8,586 8,425 8,872 10,912 5,120
Total liabilities 282,248 376,349 454,844 570,979 709,779
Cash/Equivalent 17,745 20,355 26,646 32,802 40,002
Advances 178,145 239,492 296,188 375,680 471,680
Investments 77,318 105,061 118,026 145,026 177,026
Fixed Assets 2,106 2,449 2,958 3,945 4,945
Other assets 6,936 8,993 11,026 13,526 16,126
Total assets 282,248 376,349 454,844 570,979 709,779
Source: Company, Karvy Institutional Research

49
January 16, 2013
Karur Vysya Bank
Exhibit 3: Ratios
FY11 FY12 FY13E FY14E FY15E
Growth (%)
NII growth 35.8 19.6 27.4 28.7 21.9
Pre‐provision profit growth 29.7 20.8 23.9 31.0 22.1
PAT growth 23.7 20.7 20.3 27.6 23.0
Business (%)
Deposit growth 28.3 29.9 20.4 26.9 26.5
Advance growth 32.5 34.4 23.7 26.8 25.6
Business growth 30.0 31.8 21.8 26.9 26.1
CD 72.1 74.6 76.6 76.6 76.0
CASA 23.3 19.2 20.5 21.7 21.4
Productivity (Rs mn)
Business per branch 1,152.7 1,243.0 1,362.6 1,571.9 1,817.2
Business per employee 93.0 98.8 109.0 125.8 145.4
Profit per branch 11.3 11.1 12.0 14.0 15.7
Profit per employee 0.9 0.9 1.0 1.1 1.3
Operating efficiency (%)
Cost‐to‐income 41.8 42.7 42.8 41.7 41.7
Cost‐to‐assets 1.7 1.6 1.6 1.6 1.6
Spreads (%)
Yield on advances 10.8 12.2 12.8 12.3 11.9
Yield on investments 7.3 7.9 8.2 7.7 7.5
Cost of deposits 6.4 7.8 8.1 7.6 7.3
Yield on assets 9.1 10.3 10.8 10.4 10.1
Cost of funds 6.4 7.9 8.4 7.8 7.5
NIMs 3.2 2.9 2.9 3.0 2.9
Capital adequacy (%)
Tier I 13.1 13.1 10.8 10.2 9.8
Tier II 1.3 1.2 0.9 0.8 0.7
Total CAR 14.4 14.3 11.7 11.0 10.5
Asset Quality (%)
Gross NPA 1.3 1.3 1.3 1.4 1.6
Net NPA 0.1 0.3 0.3 0.3 0.4
Provision coverage 93.9 75.5 73.9 78.8 77.1
Slippage 0.3 0.8 1.1 1.2 1.3
Credit costs 0.0 0.1 0.2 0.2 0.2
Return (%)
ROE 22.3 20.8 20.6 22.5 23.1
ROA 1.7 1.5 1.5 1.5 1.5
Per share (Rs.)
EPS 44.9 46.8 56.3 71.8 88.3
BV 223.8 252.7 292.7 347.0 417.8
ABV 222.7 246.8 287.4 341.2 408.3
Valuation(x)
P/E 12.4 11.9 9.9 7.7 6.3
P/BV 2.5 2.2 1.9 1.6 1.3
P/ABV 2.5 2.3 1.9 1.6 1.4
Source: Company, Karvy Institutional Research

Banking January 16, 2013
Oriental Bank of Commerce
Bloomberg: OBC INReuters: ORBC.BO HOLD
Institutional Equities
India Research
COMPANY UPDATE
Recommendation
CMP: Rs347
Target Price: Rs365
Upside (%) 5%
Stock Information Market Cap. (Rs bn / US$ mn) 101/1,851
52‐week High/Low (Rs) 368/200
3m ADV (Rs mn /US$ mn) 274/5.0
Beta 1.1
Sensex/ Nifty 19,987/6,057
Share outstanding (mn) 292
Stock Performance (%) 1M 3M 12M YTD
Absolute (1.5) 16.0 53.7 (1)
Rel. to Sensex (4.8) 8.6 24.2 (3.8)
Performance
Source: Bloomberg
1 Year Forward P/ABV
Source: Karvy Institutional Research
Analysts Contact
Paresh Jain
022 6184 4324
Hatim Broachwala, CFA
022‐6184 4329
200
250
300
350
400
15,500
17,500
19,500
21,500
Jan‐12
Feb‐12
Apr‐12
May‐12
Jun‐12
Aug‐12
Sep‐12
Oct‐12
Dec‐12
Jan‐13
Sensex (LHS) OBC (RHS)
0.0
0.5
1.0
1.5
2.0
Apr‐07
Aug‐07
Dec‐07
Apr‐08
Aug‐08
Dec‐08
Apr‐09
Aug‐09
Dec‐09
Apr‐10
Aug‐10
Dec‐10
Apr‐11
Aug‐11
Dec‐11
Apr‐12
Aug‐12
Dec‐12
1yr fwd P/Adj BV Mean + Std Dev
Mean ‐ Std Dev Mean
(x)
Moderate Business Growth amid Contraction
in NIMs; Maintain HOLD
Oriental Bank of Commerce (OBC) is currently trading at five year average
valuation, while the stock has outperformed the Bankex by 15% over last one
year reflecting improving trend in asset quality in last two quarters.
Moderate Business Growth: The loan growth of Oriental Bank of Commerce
has been marginally lower than the industry in FY10‐12 period. However, we
believe that the Bank’s credit growth to remain weak in FY13 on account of
dismal off‐take in corporate loans.
NIMs Likely to Bounce Back amid Decline in Cost of Funds: Though
Oriental Bank of Commerce’s NIMs contracted marginally to 2.8% in
H1FY13, the Bank’s Management expects the NIMs to bounce back to 2.9%
on account of decline in cost of funds.
Asset Quality witnesses Encouraging Trends: Oriental Bank of Commerce
has been able to contain fresh slippage in H1FY13 enabling it in bringing
down its gross NPA by 25 bps over last two quarters. We expect this trend to
continue even in H2FY13. However, the Bank is expected to restructure loans
worth Rs. 25 bn in H2FY13, which would be a partially downside risk to its
asset quality. The Bank’s restructured loan book is currently at 9.7% of the
advances.
Outlook & Valuation
At the CMP, the stock trades at 5.8x & 5.0x FY14E & FY15E earnings, and at
0.9x & 0.8x P/ABV FY14E & FY15E, respectively. Based on its historical mean
valuation implying 0.8x P/ABV FY15E, we reiterate our “HOLD”
recommendation on Oriental Bank of Commerce with upwardly revised
target price of Rs. 365 per share (from Rs. 320 earlier).
Key Financials
Y/E Mar (Rs. mn) FY11 FY12 FY13E FY14E FY15E
Net Interest Income 41,776 42,158 49,360 60,100 71,913
Operating profit 31,698 29,703 35,592 42,571 50,822
PAT 15,029 11,416 14,332 17,300 20,387
EPS (Rs) 59.9 39.1 49.1 59.3 69.9
ABV (Rs) 326.3 312.5 358.4 398.6 452.9
P/E (x) 5.8 8.9 7.1 5.8 5.0
P/ABV (x) 1.0 1.1 1.0 0.9 0.8
Gross NPA (%) 2.0 3.2 2.8 2.6 2.4
Net NPA (%) 1.0 2.2 1.8 1.8 1.7
ROE (%) 17.1 10.7 12.3 13.4 14.1
ROA (%) 1.0 0.7 0.7 0.8 0.8
Source: Company, Karvy Institutional Research

51
January 16, 2013
Oriental Bank of Commerce
Exhibit 1: Income Statement
Y/E Mar (Rs. mn) FY11 FY12 FY13E FY14E FY15E
Interest Income 120,878 158,149 181,358 204,191 236,718
Interest expense 79,103 115,991 131,998 144,090 164,804
Net interest income 41,776 42,158 49,360 60,100 71,913
Fees 6,349 7,258 8,390 9,990 11,723
Other Income 3,252 5,144 7,382 7,785 8,738
Net Revenue 51,376 54,560 65,132 77,875 92,374
Operating Expense 18,925 23,155 27,290 32,454 38,417
‐Employee Exp 10,485 13,568 16,251 19,201 22,801
‐Other Exp 8,440 9,586 11,039 13,253 15,616
Operating Profit 31,698 29,703 35,592 42,571 50,822
Investment Profit 754 1,703 2,250 2,850 3,135
Pre‐Provision Profits 32,451 31,406 37,842 45,421 53,957
Provisions 12,065 17,148 18,733 21,393 25,243
‐Loan Loss Provisions 9,344 10,787 14,900 17,020 20,420
‐Investment Depreciation 963 2,854 870 1,010 1,210
‐Other Provisions 1,409 1,928 1,738 1,838 1,988
PBT 20,386 14,258 19,109 24,028 28,714
Taxes 5,357 2,842 4,777 6,728 8,327
PAT 15,029 11,416 14,332 17,300 20,387
Source: Company, Karvy Institutional Research
Exhibit 2: Balance Sheet
Y/E Mar (Rs. mn) FY11 FY12 FY13E FY14E FY15E
Equity Capital 2,918 2,918 2,918 2,918 2,918
Reserves & Surplus 108,054 116,507 127,767 141,654 158,627
Shareholderʹs Funds 110,971 119,425 130,685 144,571 161,545
Deposits 1,390,543 1,559,649 1,803,403 2,114,665 2,502,164
Current deposits 93,976 93,752 112,503 136,128 163,354
Saving deposits 247,504 282,532 341,864 413,656 492,250
Term deposit 1,049,063 1,183,364 1,349,035 1,564,881 1,846,560
Borrowings 56,392 52,590 95,583 111,225 126,113
‐Sub ordinate debt 10,000 10,000 11,000 12,000 12,500
Other liabilities 55,528 49,637 70,860 101,106 120,548
Total liabilities 1,613,434 1,781,302 2,100,530 2,471,568 2,910,370
Cash/Equivalent 116,181 87,270 125,952 147,634 174,396
Advances 959,082 1,119,777 1,298,941 1,526,256 1,794,877
Investments 495,454 521,013 614,796 731,607 863,296
Fixed Assets 13,978 14,207 15,500 15,230 16,960
Other assets 28,739 39,035 45,341 50,841 60,841
Total assets 1,613,434 1,781,302 2,100,530 2,471,568 2,910,370
Source: Company, Karvy Institutional Research

52
January 16, 2013
Oriental Bank of Commerce
Exhibit 3: Ratios
FY11 FY12 FY13E FY14E FY15E
Growth (%)
NII growth 43.7 0.9 17.1 21.8 19.7
Pre‐provision profit growth 34.0 (3.2) 20.5 20.0 18.8
PAT growth 32.4 (24.0) 25.5 20.7 17.8
Business (%)
Deposit growth 15.6 12.2 15.6 17.3 18.3
Advance growth 14.9 16.8 16.0 17.5 17.6
Business growth 15.3 14.0 15.8 17.4 18.0
CD 69.0 71.8 72.0 72.2 71.7
CASA 24.6 24.1 25.2 26.0 26.2
Operating efficiency (%)
Cost‐to‐income 36.8 42.4 41.9 41.7 41.6
Cost‐to‐assets 1.3 1.4 1.4 1.4 1.4
Productivity (Rs mn)
Business per branch 1,450.4 1,512.1 1,601.6 1,715.8 1,854.6
Business per employee 141.4 146.3 160.2 171.6 185.5
Profit per branch 0.9 0.6 0.7 0.8 0.9
Profit per employee 0.9 0.6 0.7 0.8 0.9
Spreads (%)
Yield on advances 10.0 11.6 11.6 10.9 10.7
Yield on investments 7.3 7.2 7.1 7.3 7.2
Cost of deposits 5.8 7.6 7.6 7.1 6.9
Yield on assets 1.0 0.7 0.7 0.8 0.8
Cost of funds 5.7 7.4 7.5 7.0 6.8
NIMs 2.9 2.6 2.6 2.7 2.7
Capital adequacy (%)
Tier I 11.2 10.1 9.0 8.5 8.1
Tier II 3.0 2.6 2.3 2.0 1.7
Total CAR 14.2 12.7 11.3 10.5 9.8
Asset Quality (%)
Gross NPA 2.0 3.2 2.8 2.6 2.4
Net NPA 1.0 2.2 1.8 1.8 1.7
Provision coverage 51.2 31.3 34.9 29.8 30.9
Provision coverage (incl w/off) 61.5 66.8 72.6 73.1
Slippage 1.7 3.7 2.4 1.6 1.5
Credit‐cost 1.0 1.0 1.2 1.2 1.2
Return (%)
ROE 17.1 10.7 12.3 13.4 14.1
ROA 1.0 0.7 0.7 0.8 0.8
Per share (Rs.)
EPS 59.9 39.1 49.1 59.3 69.9
BV 350.0 379.9 420.0 467.6 525.7
ABV 326.3 312.5 358.4 398.6 452.9
Valuation(x)
P/E 5.8 8.9 7.1 5.8 5.0
P/BV 1.0 0.9 0.8 0.7 0.7
P/ABV 1.1 1.1 1.0 0.9 0.8
Source: Company, Karvy Institutional Research
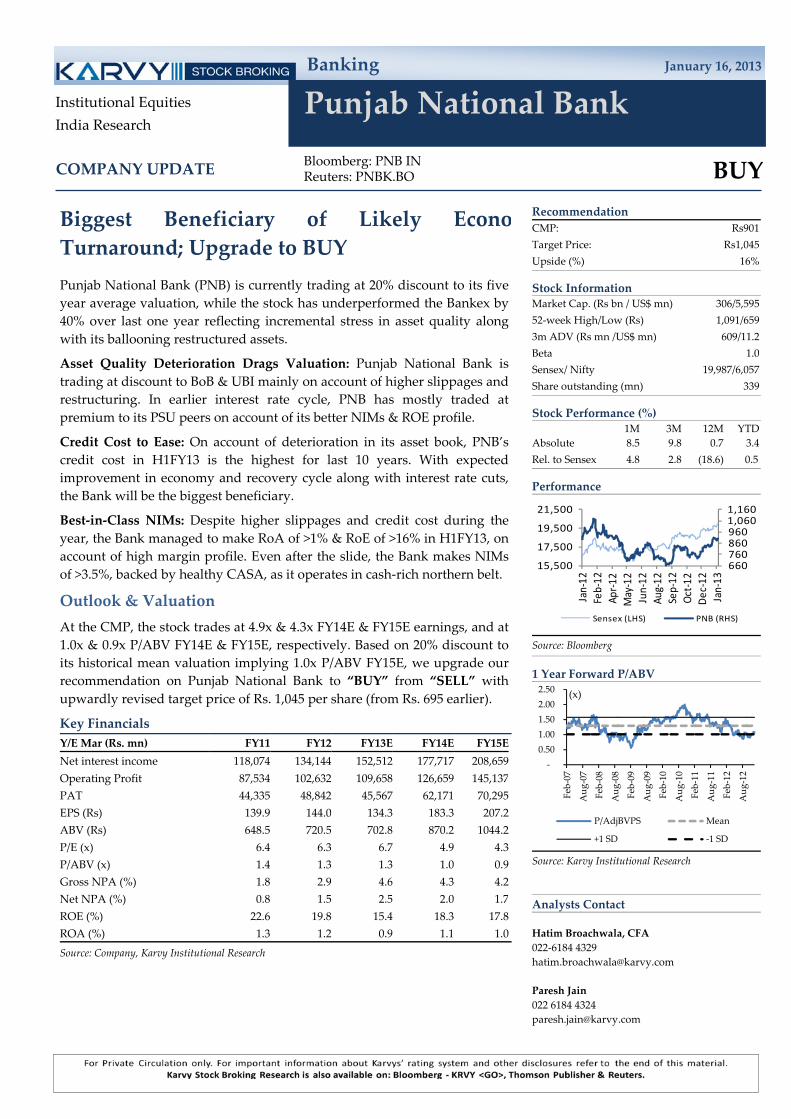
Banking January 16, 2013
Punjab National Bank
Bloomberg: PNB INReuters: PNBK.BO BUY
Institutional Equities
India Research
COMPANY UPDATE
Recommendation
CMP: Rs901
Target Price: Rs1,045
Upside (%) 16%
Stock Information Market Cap. (Rs bn / US$ mn) 306/5,595
52‐week High/Low (Rs) 1,091/659
3m ADV (Rs mn /US$ mn) 609/11.2
Beta 1.0
Sensex/ Nifty 19,987/6,057
Share outstanding (mn) 339
Stock Performance (%) 1M 3M 12M YTD
Absolute 8.5 9.8 0.7 3.4
Rel. to Sensex 4.8 2.8 (18.6) 0.5
Performance
Source: Bloomberg
1 Year Forward P/ABV
Source: Karvy Institutional Research
Analysts Contact
Hatim Broachwala, CFA
022‐6184 4329
Paresh Jain
022 6184 4324
6607608609601,0601,160
15,500
17,500
19,500
21,500
Jan‐12
Feb‐12
Apr‐12
May‐12
Jun‐12
Aug‐12
Sep‐12
Oct‐12
Dec‐12
Jan‐13
Sensex (LHS) PNB (RHS)
‐
0.50
1.00
1.50
2.00
2.50
Feb‐07
Aug‐07
Feb‐08
Aug‐08
Feb‐09
Aug‐09
Feb‐10
Aug‐10
Feb‐11
Aug‐11
Feb‐12
Aug‐12
P/AdjBVPS Mean
+1 SD ‐1 SD
(x)
Biggest Beneficiary of Likely Econo
Turnaround; Upgrade to BUY
Punjab National Bank (PNB) is currently trading at 20% discount to its five
year average valuation, while the stock has underperformed the Bankex by
40% over last one year reflecting incremental stress in asset quality along
with its ballooning restructured assets.
Asset Quality Deterioration Drags Valuation: Punjab National Bank is
trading at discount to BoB & UBI mainly on account of higher slippages and
restructuring. In earlier interest rate cycle, PNB has mostly traded at
premium to its PSU peers on account of its better NIMs & ROE profile.
Credit Cost to Ease: On account of deterioration in its asset book, PNB’s
credit cost in H1FY13 is the highest for last 10 years. With expected
improvement in economy and recovery cycle along with interest rate cuts,
the Bank will be the biggest beneficiary.
Best‐in‐Class NIMs: Despite higher slippages and credit cost during the
year, the Bank managed to make RoA of >1% & RoE of >16% in H1FY13, on
account of high margin profile. Even after the slide, the Bank makes NIMs
of >3.5%, backed by healthy CASA, as it operates in cash‐rich northern belt.
Outlook & Valuation
At the CMP, the stock trades at 4.9x & 4.3x FY14E & FY15E earnings, and at
1.0x & 0.9x P/ABV FY14E & FY15E, respectively. Based on 20% discount to
its historical mean valuation implying 1.0x P/ABV FY15E, we upgrade our
recommendation on Punjab National Bank to “BUY” from “SELL” with
upwardly revised target price of Rs. 1,045 per share (from Rs. 695 earlier).
Key Financials
Y/E Mar (Rs. mn) FY11 FY12 FY13E FY14E FY15E
Net interest income 118,074 134,144 152,512 177,717 208,659
Operating Profit 87,534 102,632 109,658 126,659 145,137
PAT 44,335 48,842 45,567 62,171 70,295
EPS (Rs) 139.9 144.0 134.3 183.3 207.2
ABV (Rs) 648.5 720.5 702.8 870.2 1044.2
P/E (x) 6.4 6.3 6.7 4.9 4.3
P/ABV (x) 1.4 1.3 1.3 1.0 0.9
Gross NPA (%) 1.8 2.9 4.6 4.3 4.2
Net NPA (%) 0.8 1.5 2.5 2.0 1.7
ROE (%) 22.6 19.8 15.4 18.3 17.8
ROA (%) 1.3 1.2 0.9 1.1 1.0
Source: Company, Karvy Institutional Research

54
January 16, 2013
Punjab National Bank
Exhibit 1: Income Statement
Y/E Mar (Rs. mn) FY11 FY12 FY13E FY14E FY15E
Interest Income 269,865 364,280 434,572 490,366 552,593
Interest expense 151,791 230,136 282,059 312,649 343,934
Net interest income 118,074 134,144 152,512 177,717 208,659
Fees 20,452 23,748 25,648 29,495 33,919
Other Income 12,650 14,767 14,386 17,967 19,916
Net Revenue 151,176 172,659 192,546 225,179 262,495
Operating Expense 63,642 70,027 82,888 98,520 117,357
‐Employee Exp 44,611 47,235 57,817 68,434 81,255
‐Other Exp 19,031 22,792 25,071 30,085 36,103
Operating Profit 87,534 102,632 109,658 126,659 145,137
Investment Profit 3,023 3,511 2,589 4,331 4,858
Pre‐provision Profit 90,557 106,143 112,248 130,990 149,995
Provisions 24,920 35,773 48,069 43,426 50,988
‐Loan Loss Provisions 20,037 24,031 44,955 38,069 45,099
‐Investment Depreciation 1,475 2,351 ‐1,370 ‐772 ‐1,001
‐Other Provisions 3,408 9,391 4,484 6,129 6,890
PBT 65,637 70,370 64,179 87,564 99,007
Taxes 21,302 21,528 18,612 25,394 28,712
PAT 44,335 48,842 45,567 62,171 70,295
Source: Company, Karvy Institutional Research
Exhibit 2: Balance Sheet
Y/E Mar (Rs. mn) FY11 FY12 FY13E FY14E FY15E
Equity Capital 3,168 3,392 3,392 3,392 3,392
Reserves & Surplus 211,917 274,778 310,820 362,673 421,856
Shareholderʹs Funds 215,085 278,170 314,212 366,065 425,248
Deposits 3,128,987 3,795,885 4,479,144 5,285,390 6,236,761
‐Current deposits 268,376 284,723 353,049 433,674 528,811
‐Saving deposits 934,874 1,056,570 1,193,222 1,435,096 1,720,507
‐Term deposit 1,925,737 2,454,592 2,932,874 3,416,621 3,987,443
Borrowings 315,897 372,643 421,419 478,975 546,891
‐Sub ordinate debt 111,903 111,903 136,291 165,069 199,027
Other liabilities 123,283 135,242 165,032 190,307 221,660
Total liabilities 3,783,252 4,581,940 5,379,808 6,320,737 7,430,559
Cash/Equivalent 296,912 288,280 378,052 483,982 608,980
Advances 2,421,067 2,937,748 3,484,355 4,129,352 4,890,448
Investments 951,623 1,226,295 1,362,947 1,524,196 1,714,470
Fixed Assets 31,056 31,689 36,939 42,189 47,439
Other assets 82,594 97,929 117,515 141,018 169,221
Total assets 3,783,252 4,581,941 5,379,808 6,320,737 7,430,559
Source: Company, Karvy Institutional Research
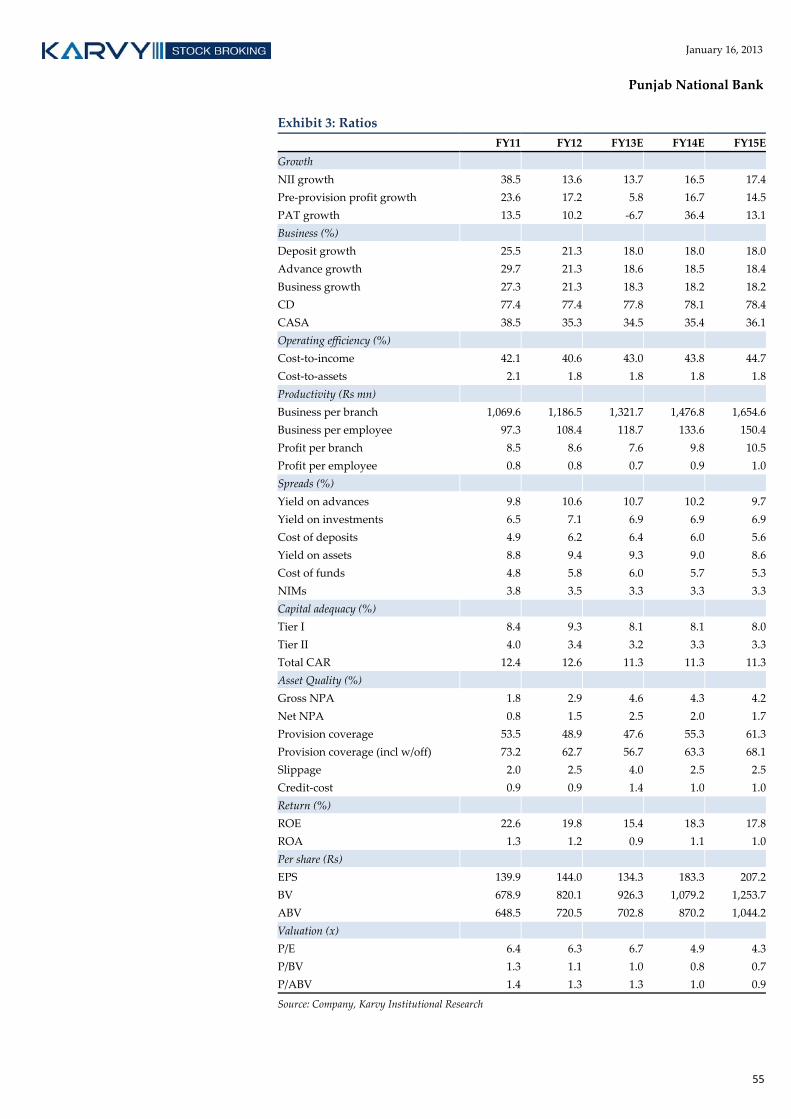
55
January 16, 2013
Punjab National Bank
Exhibit 3: Ratios
FY11 FY12 FY13E FY14E FY15E
Growth
NII growth 38.5 13.6 13.7 16.5 17.4
Pre‐provision profit growth 23.6 17.2 5.8 16.7 14.5
PAT growth 13.5 10.2 ‐6.7 36.4 13.1
Business (%)
Deposit growth 25.5 21.3 18.0 18.0 18.0
Advance growth 29.7 21.3 18.6 18.5 18.4
Business growth 27.3 21.3 18.3 18.2 18.2
CD 77.4 77.4 77.8 78.1 78.4
CASA 38.5 35.3 34.5 35.4 36.1
Operating efficiency (%)
Cost‐to‐income 42.1 40.6 43.0 43.8 44.7
Cost‐to‐assets 2.1 1.8 1.8 1.8 1.8
Productivity (Rs mn)
Business per branch 1,069.6 1,186.5 1,321.7 1,476.8 1,654.6
Business per employee 97.3 108.4 118.7 133.6 150.4
Profit per branch 8.5 8.6 7.6 9.8 10.5
Profit per employee 0.8 0.8 0.7 0.9 1.0
Spreads (%)
Yield on advances 9.8 10.6 10.7 10.2 9.7
Yield on investments 6.5 7.1 6.9 6.9 6.9
Cost of deposits 4.9 6.2 6.4 6.0 5.6
Yield on assets 8.8 9.4 9.3 9.0 8.6
Cost of funds 4.8 5.8 6.0 5.7 5.3
NIMs 3.8 3.5 3.3 3.3 3.3
Capital adequacy (%)
Tier I 8.4 9.3 8.1 8.1 8.0
Tier II 4.0 3.4 3.2 3.3 3.3
Total CAR 12.4 12.6 11.3 11.3 11.3
Asset Quality (%)
Gross NPA 1.8 2.9 4.6 4.3 4.2
Net NPA 0.8 1.5 2.5 2.0 1.7
Provision coverage 53.5 48.9 47.6 55.3 61.3
Provision coverage (incl w/off) 73.2 62.7 56.7 63.3 68.1
Slippage 2.0 2.5 4.0 2.5 2.5
Credit‐cost 0.9 0.9 1.4 1.0 1.0
Return (%)
ROE 22.6 19.8 15.4 18.3 17.8
ROA 1.3 1.2 0.9 1.1 1.0
Per share (Rs)
EPS 139.9 144.0 134.3 183.3 207.2
BV 678.9 820.1 926.3 1,079.2 1,253.7
ABV 648.5 720.5 702.8 870.2 1,044.2
Valuation (x)
P/E 6.4 6.3 6.7 4.9 4.3
P/BV 1.3 1.1 1.0 0.8 0.7
P/ABV 1.4 1.3 1.3 1.0 0.9
Source: Company, Karvy Institutional Research

Banking January 16, 2013
State Bank of India
Bloomberg: SBIN INReuters: SBI.BO BUY
Institutional Equities
India Research
COMPANY UPDATE
Recommendation
CMP: Rs2,490
Target Price: Rs2,885
Upside (%) 16%
Stock Information Market Cap. (Rs bn / US$ mn) 1,671/30,595
52‐week High/Low (Rs) 2,552/1,748
3m ADV (Rs mn /US$ mn) 5,390/98.7
Beta 1.1
Sensex/ Nifty 19,987/6,057
Share outstanding (mn) 671
Stock Performance (%) 1M 3M 12M YTD
Absolute 7.3 10.0 40.2 4.4
Rel. to Sensex 3.7 2.9 13.3 1.4
Performance
Source: Bloomberg
1 Year Forward P/ABV
Source: Karvy Institutional Research
Analysts Contact
Hatim Broachwala, CFA
022‐6184 4329
Paresh Jain
022 6184 4324
1,6001,8002,0002,2002,4002,600
15,500
17,500
19,500
21,500
Jan‐12
Feb‐12
Apr‐12
May‐12
Jun‐12
Aug‐12
Sep‐12
Oct‐12
Dec
‐12
Jan‐13
Sensex (LHS) SBI (RHS)
‐
1.00
2.00
3.00
4.00
Feb‐07
Aug‐07
Feb‐08
Aug‐08
Feb‐09
Aug‐09
Feb‐10
Aug‐10
Feb‐11
Aug‐11
Feb‐12
Aug‐12
P/AdjBVPS Mean
+1 SD ‐1 SD
(x)
Incremental Slippages & Credit Cost to Move
Southwards; Upgrade to BUY
State Bank of India (SBI) is currently trading at 5% discount its five year
average valuation, while the stock has underperformed the Bankex by 5% over
last one year, mainly on account of weak asset quality. Currently, the stock
trades at premium to its peers in line with historical trend.
Credit Cost to Move Southwards: SBI has witnessed huge pressure on its asset
quality with its Gross NPA increasing by 180 bps over last two years.
Resultantly, the Bank has accounted for higher credit cost, while keeping
provision coverage stable. With expectations of gradual recovery in the
economy, we expect incremental slippages and credit cost to start trending
downwards.
Pressure on NIMs is Likely to Continue: SBI’s NIMs (domestic) underwent a
significant compression of ~70 bps over last four quarters. Pressure on its NIMs
is expected to continue, going forward on account of slowdown witnessed in
high‐yielding SME segment and discounts offered in the retail segment.
Overall Growth to Remain Moderate: Overall slowdown in SBI’s corporate
credit is a cause of concern. The Bank has significantly tightened its lending
standards for mid‐corporate and SME segment, which has seen higher
slippages. SBI’s Management has hinted at marginal improvement in new
project proposals. We believe that majority of incremental growth will be
driven by retail and large corporate segments.
Outlook & Valuation
At the CMP, the stock – after adjusting for subsidiaries – trades at 6.9x & 5.9x
FY14E & FY15E earnings, and at 1.5x & 1.2x P/ABV FY14E & FY15E,
respectively. Based on 10% discount to its historical mean valuation implying
1.5x P/ABV FY15E for parent & Rs. 560 for its stake in subsidiaries, we upgrade
our recommendation on State Bank of India to “BUY” from “SELL” with
upwardly revised target price of Rs. 2,885 per share (from Rs. 1,980 earlier).
Key Financials
Y/E Mar (Rs. mn) FY11 FY12 FY13E FY14E FY15E
Net interest income 325,264 432,910 455,877 517,641 588,345
Operating Profit 244,331 325,374 337,327 380,076 430,763
PAT 82,645 117,073 157,786 185,940 217,646
EPS (Rs) 130.1 174.5 235.2 277.1 324.4
ABV (Rs) 829.0 1015.4 1042.8 1273.5 1550.2
P/E (x) 14.8 11.0 8.2 6.9 5.9
P/ABV (x) 2.3 1.9 1.8 1.5 1.2
Gross NPA (%) 3.3 4.5 5.5 5.3 5.0
Net NPA (%) 1.6 1.8 2.6 2.2 1.9
ROE (%) 12.6 15.7 17.5 17.9 18.1
ROA (%) 0.7 0.9 1.1 1.1 1.1
Source: Company, Karvy Institutional Research, Valuation after adjusting for subsidiaries

57
January 16, 2013
State Bank of India
Exhibit 1: Income Statement
Y/E Mar (Rs. mn) FY11 FY12 FY13E FY14E FY15E
Interest Income 813,944 1,065,214 1,216,925 1,353,323 1,497,748
Interest expense 488,680 632,304 761,048 835,682 909,404
Net interest income 325,264 432,910 455,877 517,641 588,345
Fees 115,633 120,909 133,000 156,940 185,189
Other Income 33,588 32,245 34,445 37,708 41,467
Net Revenue 474,485 586,064 623,322 712,290 815,001
Operating Expense 230,154 260,690 285,995 332,214 384,239
‐Employee Exp 144,802 169,740 178,674 203,428 229,696
‐Other Exp 85,352 90,950 107,321 128,785 154,542
Operating Profit 244,331 325,374 337,327 380,076 430,763
Investment Profit 9,025 ‐9,639 8,359 19,125 21,940
Pre‐provision Profit 253,356 315,735 345,686 399,201 452,703
Provisions 103,814 130,902 106,617 113,139 117,863
‐Loan Loss Provisions 84,154 114,941 103,240 108,736 113,065
‐Investment Depreciation 6,468 6,637 ‐5,968 ‐4,106 ‐4,804
‐Other Provisions 13,192 9,324 9,344 8,509 9,602
PBT 149,542 184,833 239,069 286,062 334,840
Taxes 66,897 67,760 81,284 100,122 117,194
PAT 82,645 117,073 157,786 185,940 217,646
Source: Company, Karvy Institutional Research
Exhibit 2: Balance Sheet
Y/E Mar (Rs. mn) FY11 FY12 FY13E FY14E FY15E
Equity Capital 6,350 6,710 6,710 6,710 6,710
Reserves & Surplus 643,510 832,802 959,186 1,109,800 1,288,194
Shareholderʹs Funds 649,860 839,512 965,896 1,116,510 1,294,904
Deposits 9,339,328 10,436,474 12,210,675 14,286,489 16,715,192
‐Current deposits 1,311,953 984,503 1,161,923 1,473,295 1,837,601
‐Saving deposits 3,303,261 3,691,563 4,135,113 4,757,858 5,486,469
‐Term deposit 4,724,114 5,760,408 6,913,638 8,055,336 9,391,123
Borrowings 1,195,689 1,270,056 1,537,461 1,746,534 1,991,150
‐Sub ordinate debt 396,238 400,162 533,864 638,401 760,709
Other liabilities 1,052,485 809,150 800,919 786,442 764,985
Total liabilities 12,237,362 13,355,192 15,514,951 17,935,975 20,766,231
Cash/Equivalent 1,228,741 971,631 1,185,810 1,436,399 1,729,589
Advances 7,567,194 8,675,789 10,095,149 11,652,010 13,473,538
Investments 2,956,006 3,121,976 3,565,526 4,084,480 4,691,656
Fixed Assets 47,642 54,666 57,666 60,666 63,666
Other assets 437,779 531,130 610,800 702,419 807,782
Total assets 12,237,362 13,355,192 15,514,951 17,935,975 20,766,231
Source: Company, Karvy Institutional Research

58
January 16, 2013
State Bank of India
Exhibit 3: Ratios
FY11 FY12 FY13E FY14E FY15E
Growth (%)
NII growth 37.4 33.1 5.3 13.5 13.7
Pre‐provision profit growth 38.3 24.6 9.5 15.5 13.4
PAT growth ‐9.8 41.7 34.8 17.8 17.1
Business (%)
Deposit growth 16.1 11.7 17.0 17.0 17.0
Advance growth 19.8 14.7 16.4 15.4 15.6
Business growth 17.7 13.0 16.7 16.3 16.4
CD 81.0 83.1 82.7 81.6 80.6
CASA 48.7 44.1 42.7 43.0 43.2
Operating efficiency (%)
Cost‐to‐income 48.5 44.5 45.9 46.6 47.1
Cost‐to‐assets 2.2 2.2 2.1 2.2 2.2
Productivity (Rs mn)
Business per branch 1248.5 1355.8 1528.1 1718.1 1935.5
Business per employee 75.8 88.7 101.5 113.5 127.0
Profit per branch 6.1 8.3 10.8 12.3 14.0
Profit per employee 0.4 0.5 0.7 0.8 0.9
Spreads (%)
Yield on advances 8.6 10.0 10.0 9.5 9.0
Yield on investments 6.8 7.9 7.9 7.9 7.9
Cost of deposits 5.0 5.6 6.0 5.7 5.2
Yield on assets 7.9 9.2 9.1 8.8 8.4
Cost of funds 4.6 5.2 5.6 5.3 5.0
NIMs 3.2 3.7 3.4 3.4 3.3
Capital adequacy (%)
Tier I 7.8 9.8 9.6 9.6 9.6
Tier II 4.2 4.1 5.3 5.5 5.6
Total CAR 12.0 13.9 14.9 15.1 15.2
Asset Quality (%)
Gross NPA 3.3 4.5 5.5 5.3 5.0
Net NPA 1.6 1.8 2.6 2.2 1.9
Provision coverage 51.2 60.1 53.2 58.9 63.7
Provision coverage (incl w/off) 62.2 66.8 59.7 64.5 68.7
Slippage 2.6 3.0 3.9 2.5 2.5
Credit‐cost 1.2 1.4 1.1 1.0 0.9
Return (%)
ROE 12.6 15.7 17.5 17.9 18.1
ROA 0.7 0.9 1.1 1.1 1.1
Per share (Rs)
EPS 130.1 174.5 235.2 277.1 324.4
BV 1023.4 1251.1 1439.5 1663.9 1929.8
ABV 829.0 1015.4 1042.8 1273.5 1550.2
Valuation (x)*
P/E 14.8 11.0 8.2 6.9 5.9
P/BV 1.9 1.5 1.3 1.2 1.0
P/ABV 2.3 1.9 1.8 1.5 1.2
Source: Company, Karvy Institutional Research, * Valuation after adjusting for subsidiaries

Banking January 16, 2013
Syndicate Bank
Bloomberg: SNDB INReuters: SBNK.BO BUY
Institutional Equities
India Research
COMPANY UPDATE
Recommendation
CMP: Rs144
Target Price: Rs175
Upside (%) 21%
Stock Information Market Cap. (Rs bn / US$ mn) 87/1,588
52‐week High/Low (Rs) 145/79
3m ADV (Rs mn /US$ mn) 158/2.9
Beta 1.2
Sensex/ Nifty 19,987/6,057
Share outstanding (mn) 602
Stock Performance (%) 1M 3M 12M YTD
Absolute 9.8 19.8 71.9 12.4
Rel. to Sensex 6.1 12.2 38.9 9.2
Performance
Source: Bloomberg
1 Year Forward P/ABV
Source: Karvy Institutional Research
Analysts Contact
Paresh Jain
022 6184 4324
Hatim Broachwala, CFA
022‐6184 4329
80
100
120
140
160
15,500
17,500
19,500
21,500
Jan‐12
Feb‐12
Apr‐12
May‐12
Jun‐12
Aug‐12
Sep‐12
Oct‐12
Dec‐12
Jan‐13
Sensex (LHS) Syndicate Bank (RHS)
0.0
0.5
1.0
1.5
2.0
Apr‐07
Aug‐07
Dec‐07
Apr‐08
Aug‐08
Dec‐08
Apr‐09
Aug‐09
Dec‐09
Apr‐10
Aug‐10
Dec‐10
Apr‐11
Aug‐11
Dec‐11
Apr‐12
Aug‐12
Dec‐12
1yr fwd P/Adj BV Mean + Std Dev
Mean ‐ Std Dev Mean
(x)
Stable Earning, Better Asset Quality; Maintain
BUY
Syndicate Bank is currently trading at five year average valuation, while the
stock has outperformed the Bankex by 30% over last one year reflecting stable
earning and better asset quality.
Moderate Growth in Business: We believe that Syndicate Bank would
continue its strategy of growing its loan book marginally below the industry.
Growth in large corporate is expected to remain weak for Syndicate Bank,
whereas segments like Retail, MSME and Agriculture would drive the growth.
We expect Syndicate Bank’s deposit growth to match growth in credit, while
CASA ratio to remain stable at ~30%, going forward.
NIMs to Remain Healthy: Despite difficult conditions, Syndicate Bank has
been able to maintain its NIMs of >3.2% in H1FY13. Though the Bank expects
cost of deposits to decline marginally, this is likely to get offset by decline in
yield on advances.
Stable Asset Quality: Syndicate Bank’s asset quality continues to remain
better than most of the PSU banks. The Bank’s asset quality has seen relatively
lesser deterioration as compared to its peers. Large part of the containment in
slippages is on account of cautious lending approach over past three years,
which has protected the Bank from asset quality worries and declining
margin. Its restructured loan book stood at 7.3% of advances. The Bank’s asset
quality is likely to remain stable in FY13, with healthy provision coverage ratio
of 82%.
Outlook & Valuation
At the CMP, the stock trades at 4.4x & 4.1x FY14E & FY15E earnings, and at
0.9x & 0.7x P/ABV FY14E & FY15E, respectively. Based on its historical mean
valuation implying 0.9x P/ABV FY14E, we reiterate our “BUY”
recommendation on Syndicate Bank with upwardly revised target price of Rs.
175 per share (from Rs. 150 earlier).
Key Financials
Y/E Mar (Rs. mn) FY11 FY12 FY13E FY14E FY15E
Net Interest Income 43,828 50,850 57,438 69,605 83,463
Operating profit 27,145 32,580 36,732 47,671 56,508
PAT 10,479 13,134 16,344 19,684 21,190
EPS (Rs) 20.0 22.9 27.2 32.7 35.2
ABV (Rs) 101.5 119.7 142.9 168.4 194.5
P/E (x) 7.2 6.3 5.3 4.4 4.1
P/ABV (x) 1.4 1.2 1.0 0.9 0.7
Gross NPA (%) 2.4 2.5 2.4 2.6 2.6
Net NPA (%) 1.0 1.0 1.0 1.0 1.0
ROE (%) 17.6 17.9 18.5 18.8 17.4
ROA (%) 0.7 0.8 0.8 0.8 0.8
Source: Company, Karvy Institutional Research

60
January 16, 2013
Syndicate Bank
Exhibit 1: Income Statement
Y/E Mar (Rs. mn) FY11 FY12 FY13E FY14E FY15E
Interest Income 114,509 152,684 176,918 198,312 227,787
Interest expense 70,681 101,833 119,481 128,707 144,324
Net interest income 43,828 50,850 57,438 69,605 83,463
Fees 4,422 5,519 6,395 8,475 10,234
Other Income 4,729 5,240 5,805 7,591 8,711
Net Revenue 52,979 61,609 69,638 85,671 102,408
Operating Expense 25,481 28,141 31,891 36,520 44,020
‐Employee Exp 17,733 18,915 21,120 23,781 28,781
‐Other Exp 7,748 9,226 10,771 12,739 15,239
Operating Profit 27,145 32,580 36,732 47,671 56,508
Investment Profit 352 888 1,015 1,480 1,880
Pre‐Provision Profits 27,498 33,468 37,747 49,151 58,388
Provisions 14,644 19,195 23,603 28,647 32,547
‐Loan Loss Provisions 9,290 13,997 16,784 20,395 22,395
‐Investment Depreciation 387 385 644 988 1,288
‐Other Provisions 4,720 2,184 2,620 3,010 3,610
PBT 12,854 14,273 14,144 20,504 25,841
Taxes 2,375 1,139 (2,200) 820 4,651
PAT 10,479 13,134 16,344 19,684 21,190
Source: Company, Karvy Institutional Research
Exhibit 2: Balance Sheet
Y/E Mar (Rs. mn) FY11 FY12 FY13E FY14E FY15E
Equity Capital 5,733 6,020 6,020 6,020 6,020
Reserves & Surplus 64,776 84,392 97,916 114,428 132,446
Shareholderʹs Funds 70,508 90,412 103,936 120,447 138,465
Deposits 1,355,961 1,579,411 1,841,660 2,211,504 2,647,504
‐Current deposits 107,388 122,214 148,676 195,027 251,027
‐Saving deposits 312,066 342,959 399,938 488,931 598,931
‐Term deposit 936,507 1,114,238 1,293,046 1,527,546 1,797,546
Borrowings 95,276 105,899 122,880 134,140 171,390
‐Sub ordinate debt 19,250 19,250 19,250 18,250 22,500
Other liabilities 43,642 48,960 52,248 45,978 51,612
Total liabilities 1,565,388 1,824,681 2,120,723 2,512,069 3,008,971
Cash/Equivalent 119,657 138,843 161,439 185,869 219,764
Advances 1,067,819 1,236,202 1,430,735 1,708,131 2,068,131
Investments 350,676 408,151 470,145 547,178 637,178
Fixed Assets 6,927 13,516 19,154 15,544 18,544
Other assets 20,309 27,970 39,250 55,347 65,354
Total assets 1,565,388 1,824,681 2,120,723 2,512,069 3,008,971
Source: Company, Karvy Institutional Research

61
January 16, 2013
Syndicate Bank
Exhibit 3: Ratios
FY11 FY12 FY13E FY14E FY15E
Growth (%)
NII growth 60.0 16.0 13.0 21.2 19.9
Pre‐provision profit growth 46.8 21.7 12.8 30.2 18.8
PAT growth 28.8 25.3 24.4 20.4 7.7
Business (%)
Deposit growth 15.9 16.5 16.6 20.1 19.7
Advance growth 18.1 15.8 15.7 19.4 21.1
Business growth 16.8 16.2 16.2 19.8 20.3
CD 78.8 78.3 77.7 77.2 78.1
CASA 30.9 29.5 29.8 30.9 32.1
Operating efficiency (%)
Cost‐to‐income 48.1 45.7 45.8 42.6 43.0
Cost‐to‐assets 1.7 1.7 1.6 1.6 1.6
Productivity (Rs mn)
Business per branch 971.8 1,039.4 1,115.3 1,231.0 1,369.2
Business per employee 97.6 107.1 111.5 123.1 136.9
Profit per branch 4.2 4.8 5.6 6.2 6.2
Profit per employee 0.4 0.5 0.6 0.6 0.6
Spreads (%)
Yield on advances 9.3 10.7 10.7 10.3 9.8
Yield on investments 6.5 7.2 7.4 6.9 6.8
Cost of deposits 4.9 6.4 6.5 5.9 5.5
Yield on assets 7.9 9.2 9.2 8.8 8.5
Cost of funds 5.1 6.4 6.5 5.9 5.5
NIMs 3.0 3.1 3.0 3.1 3.1
Capital adequacy (%)
Tier I 9.3 8.9 8.3 8.1 7.8
Tier II 3.7 3.3 2.6 2.5 2.1
Total CAR 13.0 12.2 10.9 10.6 9.9
Asset Quality (%)
Gross NPA 2.4 2.5 2.4 2.6 2.6
Net NPA 1.0 1.0 1.0 1.0 1.0
Provision coverage 60.3 62.8 59.8 62.7 63.5
Provision coverage (incl w/off) 77.2 80.1 78.1 81.2 83.1
Slippage 1.6 2.7 2.9 2.6 2.2
Credit‐cost 0.9 1.2 1.2 1.3 1.2
Return (%)
ROE 17.6 17.9 18.5 18.8 17.4
ROA 0.7 0.8 0.8 0.8 0.8
Per share (Rs)
EPS 20.0 22.9 27.2 32.7 35.2
BV 116.1 133.5 159.4 187.6 217.7
ABV 101.5 119.7 142.9 168.4 194.5
Valuation (x)
P/E 7.2 6.3 5.3 4.4 4.1
P/BV 1.2 1.1 0.9 0.7 0.6
P/ABV 1.4 1.2 1.0 0.9 0.7
Source: Company, Karvy Institutional Research

Banking January 16, 2013
Union Bank of India
Bloomberg: UNBK INReuters: UNBK.BO BUY
Institutional Equities
India Research
COMPANY UPDATE
Recommendation
CMP: Rs269
Target Price: Rs315
Upside (%) 17%
Stock Information Market Cap. (Rs bn / US$ mn) 148/2,715
52‐week High/Low (Rs) 288/150
3m ADV (Rs mn /US$ mn) 494/9.1
Beta 1.0
Sensex/ Nifty 19,987/6,057
Share outstanding (mn) 551
Stock Performance (%) 1M 3M 12M YTD
Absolute 1.4 31.9 41.6 (1.8)
Rel. to Sensex (2) 23.5 14.4 (4.6)
Performance
Source: Bloomberg
1 Year Forward P/ABV
Source: Karvy Institutional Research
Analysts Contact Hatim Broachwala, CFA
022‐6184 4329
Paresh Jain
022 6184 4324
100
150
200
250
300
15,500
17,500
19,500
21,500
Jan‐12
Feb‐12
Apr‐12
May‐12
Jun‐12
Aug‐12
Sep‐12
Oct‐12
Dec‐12
Jan‐13
Sensex (LHS)
Union Bank of India (RHS)
‐
0.50
1.00
1.50
2.00
2.50
Feb‐07
Aug‐07
Feb‐08
Aug‐08
Feb‐09
Aug‐09
Feb‐10
Aug‐10
Feb‐11
Aug‐11
Feb‐12
Aug‐12
P/AdjBVPS Mean
+1 SD ‐1 SD
(x)
Asset Quality Pressure to ease, Rally to
Continue; Upgrade to BUY
After the recent rally in stock price, Union Bank of India (UBI) trades very
close to its average valuation, while the stock has outperformed the Bankex by
4% over last one year. We believe it to continue to rally, as it further
improvemes its asset quality.
Pressure on Asset Quality to Ease: After reporting a dismal Q1FY13, UBI was
able to contain its slippages in Q2FY13. The Bank’s Management has guided
that the Bank’s slippages to move towards the Q2FY13 levels, going ahead. The
Bank has offered an OTS scheme pertaining to NPAs prior to FY09 for
outstanding up to Rs. 1 mn in cases where it does not have adequate collateral.
Meanwhile, similar scheme offered for outstanding up to Rs. 0.5 mn received
healthy response in Q2FY13.
Selective Growth in Credit: While UBI’s overall credit in corporate segment is
slowing down, its Management expects a moderate growth in credit of ~17% in
FY13 driven by Retail, Agriculture & SME segment. The Bank is focusing more
in Tier‐II & Tier‐III cities for expanding retail credit. The Bank’s delinquency
experience in the SME segment with Gross NPA of 4.3% is better than its peers.
NIMs – Expected to Remain Stable: UBI’s NIMs declined by 20 bps to 3% over
last year. The UBI’s Management expects that the Bank’s NIMs to stabilize at
current levels, going forward. The pressure on NIMs owing to discounts on
retail segment would be offset by moderate growth in SME segment and by
bringing down the proportion of high cost deposits by ~500 bps over last year.
Outlook & Valuation
At the CMP, the stock trades at 4.7x & 4.0x FY14E & FY15E earnings, and at
1.0x & 0.9x P/ABV FY14E & FY15E, respectively. Based on 10% discount to its
historical mean valuation implying 1.0x P/ABV FY15E, we upgrade our
recommendation on Union Bank of India to “BUY” from “HOLD” with
upwardly revised target price of Rs. 315 per share (from Rs. 260 earlier).
Key Financials
Y/E Mar (Rs. mn) FY11 FY12 FY13E FY14E FY15E
Net interest income 62,162 69,089 76,252 89,277 105,618
Operating Profit 38,409 48,137 51,041 62,329 73,566
PAT 20,819 17,872 22,665 31,755 37,538
EPS (Rs) 39.6 32.4 41.1 57.6 68.1
ABV (Rs) 206.6 208.5 226.2 268.7 316.0
P/E (x) 6.8 8.3 6.6 4.7 4.0
P/ABV (x) 1.3 1.3 1.2 1.0 0.9
Gross NPA (%) 2.4 3.0 3.2 2.9 2.8
Net NPA (%) 1.2 1.7 1.8 1.5 1.4
ROE (%) 18.0 13.2 14.8 18.3 18.7
ROA (%) 1.0 0.7 0.8 1.0 1.0
Source: Company, Karvy Institutional Research

63
January 16, 2013
Union Bank of India
Exhibit 1: Income Statement
Y/E Mar (Rs. mn) FY11 FY12 FY13E FY14E FY15E
Interest Income 164,526 211,443 245,727 274,997 311,625
Interest expense 102,364 142,354 169,476 185,720 206,007
Net interest income 62,162 69,089 76,252 89,277 105,618
Fees 3,649 3,651 4,199 5,038 6,046
Other Income 12,098 15,272 15,962 20,100 22,906
Net Revenue 77,909 88,012 96,413 114,416 134,570
Operating Expense 39,500 39,875 45,372 52,086 61,003
‐Employee Exp 25,997 24,793 27,575 30,730 34,308
‐Other Exp 13,503 15,082 17,797 21,356 26,695
Operating Profit 38,409 48,137 51,041 62,329 73,566
Investment Profit 4,640 4,401 3,308 5,261 6,064
Pre‐provision Profit 43,049 52,538 54,348 67,590 79,631
Provisions 13,496 25,410 21,969 22,226 26,005
‐Loan Loss Provisions 12,902 17,405 18,414 20,693 24,604
‐Investment Depreciation 267 550 55 ‐467 ‐599
‐Other Provisions 327 7,455 3,500 2,000 2,000
PBT 29,553 27,128 32,379 45,364 53,626
Taxes 8,734 9,256 9,714 13,609 16,088
PAT 20,819 17,872 22,665 31,755 37,538
Source: Company, Karvy Institutional Research
Exhibit 2: Balance Sheet
Y/E Mar (Rs. mn) FY11 FY12 FY13E FY14E FY15E
Equity Capital 5,253 5,515 5,515 5,515 5,515
Reserves & Surplus 121,280 139,714 155,847 180,478 210,301
Shareholderʹs Funds 126,533 145,229 161,362 185,993 215,816
Deposits 2,024,613 2,228,690 2,607,567 3,129,081 3,754,897
‐Current deposits 196,180 192,762 230,650 282,801 345,383
‐Saving deposits 446,892 504,289 561,121 691,499 847,953
‐Term deposit 1,381,541 1,531,639 1,815,797 2,154,781 2,561,561
Borrowings 133,160 179,095 199,105 200,573 202,335
‐Sub ordinate debt 61,900 61,900 69,904 70,491 71,196
Other liabilities 75,528 69,100 76,866 83,660 90,914
Total liabilities 2,359,834 2,622,114 3,044,900 3,599,308 4,263,961
Cash/Equivalent 200,985 156,751 195,705 249,324 313,667
Advances 1,509,861 1,778,821 2,081,923 2,473,058 2,942,420
Investments 583,991 623,636 699,411 803,714 928,877
Fixed Assets 22,928 23,358 24,358 25,358 26,358
Other assets 42,080 39,548 43,503 47,853 52,638
Total assets 2,359,845 2,622,114 3,044,900 3,599,308 4,263,961
Source: Company, Karvy Institutional Research

64
January 16, 2013
Union Bank of India
Exhibit 3: Ratios
FY11 FY12 FY13E FY14E FY15E
Growth (%)
NII growth 48.3 11.1 10.4 17.1 18.3
Pre‐provision profit growth 17.6 22.0 3.4 24.4 17.8
PAT growth 0.3 ‐14.2 26.8 40.1 18.2
Business (%)
Deposit growth 19.1 10.1 17.0 20.0 20.0
Advance growth 26.5 17.8 17.0 18.8 19.0
Business growth 22.2 13.4 17.0 19.5 19.5
CD 74.6 79.8 79.8 79.0 78.4
CASA 31.8 31.3 30.4 31.1 31.8
Operating efficiency (%)
Cost‐to‐income 50.7 45.3 47.1 45.5 45.3
Cost‐to‐assets 2.0 1.7 1.7 1.7 1.7
Productivity (Rs mn)
Business per branch 1171.9 1252.0 1378.9 1555.7 1762.0
Business per employee 127.4 130.0 144.8 164.8 187.6
Profit per branch 6.9 5.6 6.7 8.8 9.9
Profit per employee 0.8 0.6 0.7 0.9 1.1
Spreads (%)
Yield on advances 8.9 9.7 9.7 9.2 8.7
Yield on investments 7.1 7.6 8.0 7.8 7.8
Cost of deposits 5.1 6.3 6.4 6.0 5.6
Yield on assets 8.4 9.2 9.3 8.8 8.5
Cost of funds 5.0 6.0 6.3 5.9 5.5
NIMs 3.2 3.0 2.9 2.9 2.9
Capital adequacy (%)
Tier I 8.7 8.4 8.6 8.3 8.2
Tier II 4.3 3.5 3.6 3.1 2.6
Total CAR 13.0 11.9 12.2 11.4 10.8
Asset Quality (%)
Gross NPA 2.4 3.0 3.2 2.9 2.8
Net NPA 1.2 1.7 1.8 1.5 1.4
Provision coverage 62.5 44.5 45.4 47.4 49.7
Provision coverage (incl w/off) 73.3 62.2 62.5 65.4 67.3
Slippage 2.2 2.3 2.3 1.7 1.7
Credit‐cost 0.8 0.9 0.9 0.8 0.8
Return (%)
ROE 18.0 13.2 14.8 18.3 18.7
ROA 1.0 0.7 0.8 1.0 1.0
Per share (Rs)
EPS 39.6 32.4 41.1 57.6 68.1
BV 240.9 263.3 292.6 337.2 391.3
ABV 206.6 208.5 226.2 268.7 316.0
Valuation (x)
P/E 6.8 8.3 6.6 4.7 4.0
P/BV 1.1 1.0 0.9 0.8 0.7
P/ABV 1.3 1.3 1.2 1.0 0.9
Source: Company, Karvy Institutional Research

Institutional Equities Team Rangachari Muralikrishnan
Head – Institutional Equities /
Research / Strategy +91‐22 61844301 [email protected]
K. Anant Rao Head ‐ Sales‐Trading & Derivatives +91‐22 61844303 [email protected]
Uday Raval Karvy Inc. USA +1 212 2674334 [email protected]
INSTITUTIONAL RESEARCH
Analysts Industry / Sector Desk Phone Email ID
Amey Chalke Pharmaceuticals +91 ‐22 61844325 [email protected]
Dwaipayan Poddar Chief Technical Strategist +91‐22 61844372 [email protected]
Hatim Broachwala, CFA Banking +91‐22 61844329 [email protected]
Kruti Shah Economist +91‐22 61844320 [email protected]
Manoj Kumar Manish Derivatives and Quant Analyst +91‐22 61844327 [email protected]
Maruti Kadam Automobiles / Metals & Mining +91‐22 61844326 [email protected]
Mitul Shah Automobiles +91‐22 61844312 [email protected]
Naveen Trivedi FMCG +91‐22‐61844316 [email protected]
Pallav Agarwal Metals & Mining +91‐22 61844317 [email protected]
Paresh Jain BFSI +91‐22 61844324 [email protected]
Parikshit Kandpal Infra / Real Estate / Strategy +91‐22 61844311 [email protected]
Rahul Sharma Pharmaceuticals +91‐22 61844310 [email protected]
Rahul Singh MidCap +91‐40‐44857911 [email protected]
Rajesh Kumar Ravi Cement & Logistics +91‐22 61844313 [email protected]
Rupesh Sankhe Power/Capital Goods +91‐22 61844315 [email protected]
Vinay Nair Oil & Gas +91‐22 61844319 [email protected]
INSTITUTIONAL SALES
Dinesh Bajaj Sales +91‐22 61844341 [email protected]
R. Sriram Sales +91‐22 61844340 [email protected]
Shabbir Dahodwala Sales (USA) +1‐212‐2674334 [email protected]
Tejash Gandhi Sales +91‐22 61844345 [email protected]
INSTITUTIONAL SALES TRADING & DEALING
Bhavesh Gandhi Institutional Dealer +91‐22 61844368 /69 [email protected]
Prashant Oza Institutional Dealer +91‐22 61844370 /71 [email protected]
Parag Shah Sales Trader +91‐22 61844364 /65 [email protected]
Sriram Jagdish Sales Trader +91‐22 61844366 /67 [email protected]
Gurdarshan Singh Kharbanda Sales Trader +91‐22‐61844368 / 69 [email protected]
PRODUCTION
Asim Kumar Mohapatra Editor +91‐22 61844318 [email protected]
Vijayalaxmi L. Moolya Production +91‐22 61844328 [email protected]

For further enquiries please contact:
Tel: +91‐22‐6184 4300
Disclosures Appendix
Analyst certification
The following analyst(s), who is (are) primarily responsible for this report, certify (ies) that the views expressed herein
accurately reflect his (their) personal view(s) about the subject security (ies) and issuer(s) and that no part of his (their)
compensation was, is or will be directly or indirectly related to the specific recommendation(s) or views contained in this
research report.
Disclaimer
The information and views presented in this report are prepared by Karvy Stock Broking Limited. The information
contained herein is based on our analysis and upon sources that we consider reliable. We, however, do not vouch for the
accuracy or the completeness thereof. This material is for personal information and we are not responsible for any loss
incurred based upon it. The investments discussed or recommended in this report may not be suitable for all investors.
Investors must make their own investment decisions based on their specific investment objectives and financial position and
using such independent advice, as they believe necessary. While acting upon any information or analysis mentioned in this
report, investors may please note that neither Karvy nor Karvy Stock Broking nor any person connected with any associate
companies of Karvy accepts any liability arising from the use of this information and views mentioned in this document.
The author, directors and other employees of Karvy and its affiliates may hold long or short positions in the above
mentioned companies from time to time. Every employee of Karvy and its associate companies are required to disclose their
individual stock holdings and details of trades, if any, that they undertake. The team rendering corporate analysis and
investment recommendations are restricted in purchasing/selling of shares or other securities till such a time this
recommendation has either been displayed or has been forwarded to clients of Karvy. All employees are further restricted to
place orders only through Karvy Stock Broking Ltd. This report is intended for a restricted audience and we are not
soliciting any action based on it. Neither the information nor any opinion expressed herein constitutes an offer or an
invitation to make an offer, to buy or sell any securities, or any options, futures nor other derivatives related to such
securities.
Karvy Stock Broking Limited Institutional Equities
Office No. 702, 7th Floor, Hallmark Business Plaza, Opp.‐Gurunanak Hospital, Mumbai 400 051
Regd Off : 46, Road No 4, Street No 1, Banjara Hills, Hyderabad – 500 034.
Karvy Stock Broking Research is also available on: Bloomberg ‐ KRVY <GO>, Thomson Publisher & Reuters.
Stock Ratings Absolute ReturnsBuy : > 15%Hold : 5‐15%Sell : < 5%


![RULE THE MARKET - Karvy Onlinecontent.karvyonline.com/contents/kstreetissue011.pdfDisclaimer: Karvy Stock Broking Limited [KSBL] is registered as a research analyst with SEBI (Registration](https://img.pdfslide.net/doc/110x75/5e404854af860e4d7b4ee7ef/rule-the-market-karvy-disclaimer-karvy-stock-broking-limited-ksbl-is-registered.jpg)