Embed Size (px)
Citation preview

November 30, 2016 To: All Holders of the Manual of Field Test Procedures Section: Test Procedure AASHTO T 2 The Oregon Department of Transportation has specified method(s) for this Test Procedure. Please observe the following for our projects: For all produced aggregates the definition of “Nominal Maximum Size” shall be as follows: “One sieve larger than the first sieve that retains more than 10% of the material using an agency specified set of sieves based on cumulative percent retained. Where large gaps in specification sieves exist, intermediate sieve(s) may be inserted to determine nominal maximum size.”
Kate Brown, Governor
Department of Transportation Construction Section 800 Airport Road SE
Salem, OR 97301-4792 Phone: (503) 986-3000
Fax: (503) 986-3096
AGGREGATE WAQTC FOP AASHTO T 2 (16)
T2_short_16.docx Aggregate 9-1 Pub. October 2017
SAMPLING OF AGGREGATES FOP FOR AASHTO T 2 Scope
This procedure covers sampling of coarse, fine, or a combination of coarse and fine aggregates (CA and FA) in accordance with AASHTO T 2-91. Sampling from conveyor belts, transport units, roadways, and stockpiles is covered. Apparatus
• Shovels or scoops, or both • Sampling tubes of acceptable dimensions • Mechanical sampling systems: normally a permanently attached device that allows a
sample container to pass perpendicularly through the entire stream of material or diverts the entire stream of material into the container by manual, hydraulic, or pneumatic operation
• Belt template • Sampling containers
Procedure – General
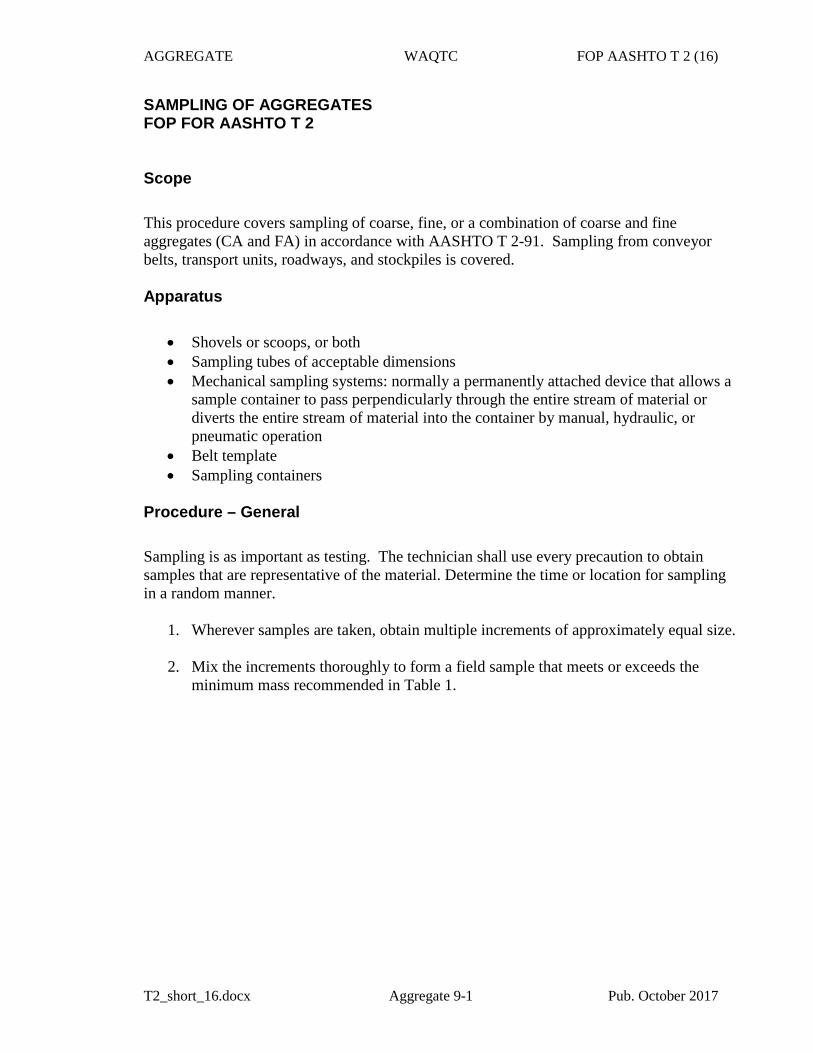
Sampling is as important as testing. The technician shall use every precaution to obtain samples that are representative of the material. Determine the time or location for sampling in a random manner.
1. Wherever samples are taken, obtain multiple increments of approximately equal size. 2. Mix the increments thoroughly to form a field sample that meets or exceeds the
minimum mass recommended in Table 1.
AGGREGATE WAQTC FOP AASHTO T 2 (16)
T2_short_16.docx Aggregate 9-2 Pub. October 2017
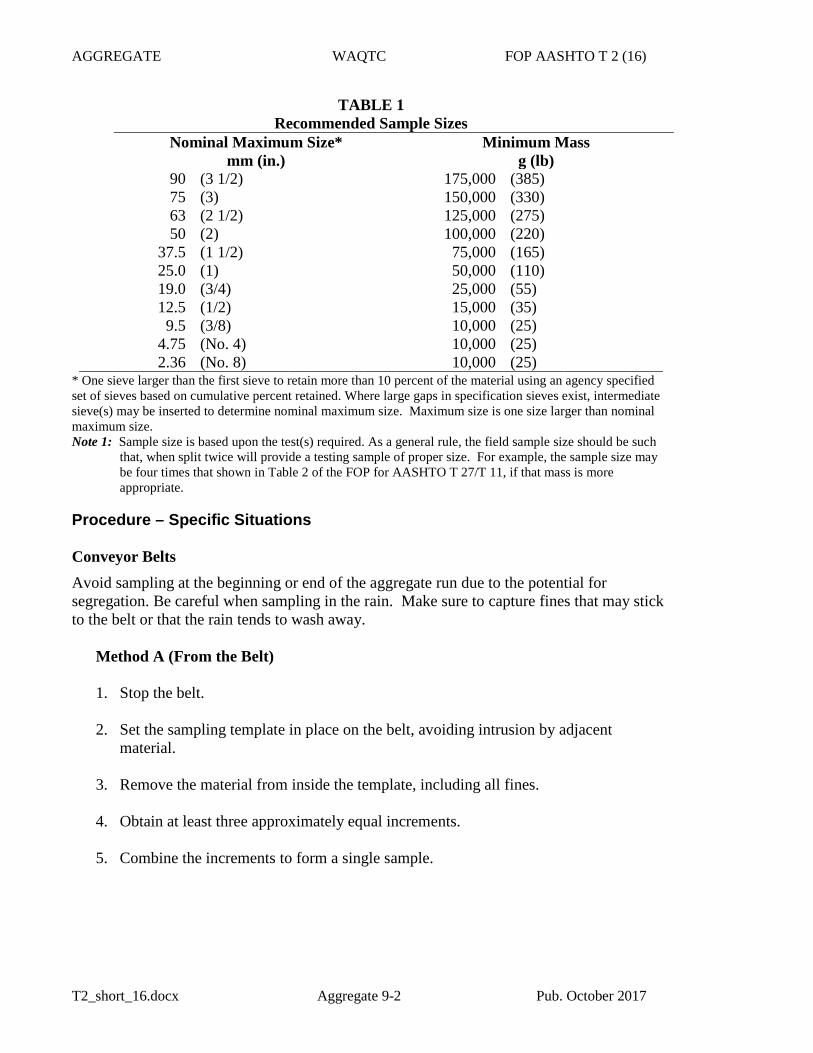
TABLE 1 Recommended Sample Sizes
Nominal Maximum Size* mm (in.)
Minimum Mass g (lb)
90 (3 1/2) 175,000 (385) 75 (3) 150,000 (330) 63 (2 1/2) 125,000 (275) 50 (2) 100,000 (220)
37.5 (1 1/2) 75,000 (165) 25.0 (1) 50,000 (110) 19.0 (3/4) 25,000 (55) 12.5 (1/2) 15,000 (35) 9.5 (3/8) 10,000 (25)
4.75 (No. 4) 10,000 (25) 2.36 (No. 8) 10,000 (25)
* One sieve larger than the first sieve to retain more than 10 percent of the material using an agency specified set of sieves based on cumulative percent retained. Where large gaps in specification sieves exist, intermediate sieve(s) may be inserted to determine nominal maximum size. Maximum size is one size larger than nominal maximum size. Note 1: Sample size is based upon the test(s) required. As a general rule, the field sample size should be such
that, when split twice will provide a testing sample of proper size. For example, the sample size may be four times that shown in Table 2 of the FOP for AASHTO T 27/T 11, if that mass is more appropriate.
Procedure – Specific Situations Conveyor Belts Avoid sampling at the beginning or end of the aggregate run due to the potential for segregation. Be careful when sampling in the rain. Make sure to capture fines that may stick to the belt or that the rain tends to wash away.
Method A (From the Belt) 1. Stop the belt. 2. Set the sampling template in place on the belt, avoiding intrusion by adjacent
material. 3. Remove the material from inside the template, including all fines. 4. Obtain at least three approximately equal increments. 5. Combine the increments to form a single sample.
AGGREGATE WAQTC FOP AASHTO T 2 (16)
T2_short_16.docx Aggregate 9-3 Pub. October 2017
Method B (From the Belt Discharge) 1. Pass a sampling device through the full stream of the material as it runs off the end of
the conveyor belt. The sampling device may be manually, semi-automatic or automatically powered.
2. The sampling device shall pass through the stream at least twice, once in each
direction, without overfilling while maintaining a constant speed during the sampling process.
3. When emptying the sampling device into the container, include all fines. 4. Combine the increments to form a single sample.
Transport Units 1. Visually divide the unit into four quadrants. 2. Identify one sampling location in each quadrant. 3. Dig down and remove approximately 0.3 m (1 ft.) of material to avoid surface
segregation. Obtain each increment from below this level. 4. Combine the increments to form a single sample. Roadways
Method A (Berm or Windrow) 1. Obtain sample before spreading. 2. Take the increments from at least three random locations along the fully-formed
windrow or berm. Do not take the increments from the beginning or the end of the windrow or berm.
3. Obtain full cross-section samples of approximately equal size at each location. Take
care to exclude the underlying material. 4. Combine the increments to form a single sample. Note 2: Obtaining samples from berms or windrows may yield extra-large samples and may not be the
preferred sampling location.
AGGREGATE WAQTC FOP AASHTO T 2 (16)
T2_short_16.docx Aggregate 9-4 Pub. October 2017
Method B (In-Place) 1. Obtain sample after spreading and before compaction. 2. Take the increments from at least three random locations. 3. Obtain full-depth increments of approximately equal size from each location. Take
care to exclude the underlying material. 4. Combine the increments to form a single sample.
Stockpiles
Method A– Loader sampling 1. Direct the loader operator to enter the stockpile with the bucket at least150 mm
(6 in.) above ground level without contaminating the stockpile. 2. Discard the first bucketful. 3. Have the loader re-enter the stockpile and obtain a full loader bucket of the material,
tilt the bucket back and up. 4. Form a small sampling pile at the base of the stockpile by gently rolling the material
out of the bucket with the bucket just high enough to permit free-flow of the material. (Repeat as necessary.)
5. Create a flat surface by having the loader back drag the small pile. 6. Visually divide the flat surface into four quadrants. 7. Collect an increment from each quadrant by fully inserting the shovel into the flat pile
as vertically as possible, take care to exclude the underlying material, roll back the shovel and lift the material slowly out of the pile to avoid material rolling off the shovel.
Method B – Stockpile Face Sampling 1. Create horizontal surfaces with vertical faces in the top, middle, and bottom third of
the stockpile with a shovel or loader.
2. Prevent continued sloughing by shoving a flat board against the vertical face. Sloughed material will be discarded to create the horizontal surface.
3. Obtain sample from the horizontal surface as close to the intersection as possible of
the horizontal and vertical faces.
AGGREGATE WAQTC FOP AASHTO T 2 (16)
T2_short_16.docx Aggregate 9-5 Pub. October 2017
4. Obtain at least one increment of equal size from each of the top, middle, and bottom
thirds of the pile. 5. Combine the increments to form a single sample. Method C – Alternate Tube Method (Fine Aggregate) 1. Remove the outer layer that may have become segregated. 2. Using a sampling tube, obtain one increment of equal size from a minimum of five
random locations on the pile. 3. Combine the increments to form a single sample. Note 3: Obtaining samples at stockpiles should be avoided whenever possible due to problems involved in
obtaining a representative gradation of material. Report
• On forms approved by the agency
• Date
• Time
• Sample ID
• Location
• Quantity represented


Bulk Density (“Unit Weight”) and Voids in Aggregate
AASHTO Designation: T 19/T 19-14 ASTM Designation: C29/C 29M-07
AASHTO TEST METHODS CANNOT BE INCLUDED ON ODOT’S WEBSITE DUE TO COPYRIGHT INFRINGEMENT.
TO GET COPIES OF THE TEST METHODS, YOU CAN ORDER A HARD COPY OF ODOT’S MANUAL OF FIELD TEST PROCEDURES OR YOU CAN ORDER THE LATEST STANDARD SPECIFICATIONS FOR TRANSPORTATION MATERIALS AND METHODS OF SAMPLING AND TESTING FROM AASHTO. ORDERING INSTRUCTIONS ARE GIVEN BELOW:
To order ODOT’s Manual of Field Test Procedures, use the following web address: http://www.oregon.gov/ODOT/Construction/Pages/Manual-of-Field-Test-Procedures.aspx.
To order AASHTO’s Standard Specifications for Transportation Materials and Methods of Sampling and Testing, use the following web address: https://bookstore.transportation.org/


November 30, 2017
To: All Holders of the Manual of Field Test Procedures
Section: Test Procedure AASHTO T 22
The Oregon Department of Transportation has specified method(s) for this Test Procedure. Please observe the following for our projects:
• The use of unbonded caps as defined by ASTM C1231/C1231M-15, forcompressive strength determination, is an allowable option.
Kate Brown, Governor
Department of Transportation Construction Section 800 Airport Road SE
Salem, OR 97301-4792 Phone: (503) 986-3000
Fax: (503) 986-3096
Compressive Strength of Cylindrical Concrete Specimens
AASHTO Designation: T 22-17 ASTM Designation: C39/C 39M-05
AASHTO TEST METHODS CANNOT BE INCLUDED ON ODOT’S WEBSITE DUE TO COPYRIGHT INFRINGEMENT.
TO GET COPIES OF THE TEST METHODS, YOU CAN ORDER A HARD COPY OF ODOT’S MANUAL OF FIELD TEST PROCEDURES OR YOU CAN ORDER THE LATEST STANDARD SPECIFICATIONS FOR TRANSPORTATION MATERIALS AND METHODS OF SAMPLING AND TESTING FROM AASHTO. ORDERING INSTRUCTIONS ARE GIVEN BELOW:
To order ODOT’s Manual of Field Test Procedures, use the following web address: http://www.oregon.gov/ODOT/Construction/Pages/Manual-of-Field-Test-Procedures.aspx
To order AASHTO’s Standard Specifications for Transportation Materials and Methods of Sampling and Testing, use the following web address: https://bookstore.transportation.org/


October 31, 2010
To: All Holders of the Manual of Field Test Procedures
Section: Test Procedure AASHTO T 23
The Oregon Department of Transportation has specified method(s) for this Test Procedure. Please observe the following for our projects:
Under Procedure - Initial Curing, Use Method 1, cure in a cooler with controlled watertemperature. See test procedure for temperature requirements.
Use a high/low temperature-recording device to monitor temperature during curingprocess. Record the high/low temperature range during the cure process on agencyapproved form.
Under Procedure - Transporting Specimens, Delete Bullet 4 and replace with thefollowing:
For concrete cylinders that are not able to be placed in final cure at the sitewhere the compression testing will be performed, within 48 hours, a“temporary final cure” environment will be provided and maintained. Cylindersplaced into this “temporary final cure” environment will then be transported tothe final cure location within 12 days of casting. Temporary final cure isdefined as;
Temporary final cure –An environment that meets the temperature andmoisture requirements of bullet 2 under “Final Curing” of AASHTO T23.Curing may be accomplished in a moist room or water tank conforming toAASHTO M201. Molds do not have to be removed for Cylinders in Temporaryfinal cure
Under Procedure for Making Cylinders—Rodding step 3, the use of a mallet meetingthe requirements under apparatus may be used for single-use plastic moldsconforming to AASHTO M-205.
Oregon Department of TransportationConstruction Section
800 Airport Road SE Salem, OR 97301-4798
Telephone (503) 986-3000 FAX (503) 986-3096
CONCRETE WAQTC FOP AASHTO T 23 (17)
T23_short_17.docx Concrete 14-1 Pub. October 2017
METHOD OF MAKING AND CURING CONCRETE TEST SPECIMENS IN THE FIELD FOP FOR AASHTO T 23
Scope This procedure covers the method for making, initially curing, and transporting concrete test specimens in the field in accordance with AASHTO T 23-17.
Warning—Fresh Hydraulic cementitious mixtures are caustic and may cause chemical burns to skin and tissue upon prolonged exposure.
Apparatus and Test Specimens • Concrete cylinder molds: Conforming to AASHTO M 205 with a length equal to twice
the diameter. Standard specimens shall be 150 mm (6 in.) by 300 mm (12 in.) cylinders.Mold diameter must be at least three times the maximum aggregate size unless wetsieving is conducted according to the FOP for WAQTC TM 2. Agency specificationsmay allow cylinder molds of 100 mm (4 in.) by 200 mm (8 in.) when the nominalmaximum aggregate size does not exceed 25 mm (1 in.).
• Beam molds: Rectangular in shape with ends and sides at right angles to each other.Must be sufficiently rigid to resist warpage. Surfaces must be smooth. Molds shallproduce length no more than 1.6 mm (1/16 in.) shorter than that required (greater lengthis allowed). Maximum variation from nominal cross section shall not exceed 3.2 mm(1/8 in.). Ratio of width to depth may not exceed 1:5; the smaller dimension must be atleast 3 times the maximum aggregate size. Standard beam molds shall result in specimenshaving width and depth of not less than 150 mm (6 in.). Agency specifications may allowbeam molds of 100 mm (4 in.) by 100 mm (4 in.) when the nominal maximum aggregatesize does not exceed 38 mm (1.5 in.). Specimens shall be cast and hardened with the longaxes horizontal.
• Standard tamping rod: 16 mm (5/8 in.) in diameter and 400 mm (16 in.) to 600 mm(24 in.) long, having a hemispherical tip of the same diameter as the rod for preparing150 mm (6 in.) x 300 mm (12 in.) cylinders.
• Small tamping rod: 10 mm (3/8 in.) diameter and 305 mm (12 in.) to 600 mm (24 in.)long, having a hemispherical tip of the same diameter as the rod for preparing 100 mm(4 in.) x 200 mm (8 in.) cylinders.
• Vibrator: At least 9000 vibrations per minute, with a diameter no more than ¼ thediameter or width of the mold and at least 75 mm (3 in.) longer than the section beingvibrated for use with low slump concrete.
• Scoop: a receptacle of appropriate size so that each representative increment of theconcrete sample can be placed in the container without spillage.
• Trowel or float
• Mallet: With a rubber or rawhide head having a mass of 0.57 ±0.23 kg (1.25 ±0.5 lb.).
CONCRETE WAQTC FOP AASHTO T 23 (17)
T23_short_17.docx Concrete 14-2 Pub. October 2017
• Rigid base plates and cover plates: may be metal, glass, or plywood.
• Initial curing facilities: Temperature-controlled curing box or enclosure capable ofmaintaining the required range of 16 to 27°C (60 to 80°F) during the entire initial curingperiod (for concrete with compressive strength of 40 Mpa (6000 psi) or more, thetemperature shall be 20 to 26°C (68 to 78°F). As an alternative, sand or earth for initialcylinder protection may be used provided that the required temperature range ismaintained and the specimens are not damaged.
• Thermometer: Capable of registering both maximum and minimum temperatures duringthe initial cure.
Procedure – Making Specimens – General 1. Obtain the sample according to the FOP for WAQTC TM 2.
2. Wet Sieving per the FOP for WAQTC TM 2 is required for 150 mm (6 in.) diameterspecimens containing aggregate with a nominal maximum size greater than 50 mm(2 in.); screen the sample over the 50 mm (2 in.) sieve.
3. Remix the sample after transporting to testing location.
4. Begin making specimens within 15 minutes of obtaining the sample.
5. Set molds upright on a level, rigid base in a location free from vibration and relativelyclose to where they will be stored.
6. Fill molds in the required number of layers, attempting to slightly overfill the mold on thefinal layer. Add or remove concrete prior to completion of consolidation to avoid adeficiency or excess of concrete.
7. There are two methods of consolidating the concrete – rodding and internal vibration. Ifthe slump is greater than 25 mm (1 in.), consolidation may be by rodding or vibration.When the slump is 25 mm (1 in.) or less, consolidate the sample by internal vibration.Agency specifications may dictate when rodding or vibration will be used.
Procedure – Making Cylinders –Self Consolidating Concrete
1. Use the scoop to slightly overfill the mold. Evenly distribute the concrete in a circularmotion around the inner perimeter of the mold.
2. Strike off the surface of the molds with tamping rod, straightedge, float, or trowel.
3. Immediately begin initial curing.
Procedure – Making Cylinders – Rodding 1. For the standard 150 mm (6 in.) by 300 mm (12 in.) specimen, fill each mold in three
approximately equal layers, moving the scoop or trowel around the perimeter of the mold
CONCRETE WAQTC FOP AASHTO T 23 (17)
T23_short_17.docx Concrete 14-3 Pub. October 2017
to evenly distribute the concrete. For the 100 mm (4 in.) by 200 mm (8 in.) specimen, fill the mold in two layers. When filling the final layer, slightly overfill the mold.
2. Consolidate each layer with 25 strokes of the appropriate tamping rod, using the rounded end. Distribute strokes evenly over the cross section of the concrete. Rod the first layer throughout its depth without forcibly hitting the bottom. For subsequent layers, rod the layer throughout its depth penetrating approximately 25 mm (1 in.) into the underlying layer.
3. After rodding each layer, tap the sides of each mold 10 to 15 times with the mallet (reusable steel molds) or lightly with the open hand (single-use light-gauge molds).
4. Strike off the surface of the molds with tamping rod, straightedge, float, or trowel.
5. Immediately begin initial curing.
Procedure – Making Cylinders – Internal Vibration 1. Fill the mold in two layers.
2. Insert the vibrator at the required number of different points for each layer (two points for 150 mm (6 in.) diameter cylinders; one point for 100 mm (4 in.) diameter cylinders). When vibrating the bottom layer, do not let the vibrator touch the bottom or sides of the mold. When vibrating the top layer, the vibrator shall penetrate into the underlying layer approximately 25 mm (1 in.)
3. Remove the vibrator slowly, so that no large air pockets are left in the material. Note 1: Continue vibration only long enough to achieve proper consolidation of the concrete. Over
vibration may cause segregation and loss of appreciable quantities of intentionally entrained air.
4. After vibrating each layer, tap the sides of each mold 10 to 15 times with the mallet (reusable steel molds) or lightly with the open hand (single-use light-gauge molds).
5. Strike off the surface of the molds with tamping rod, straightedge, float, or trowel.
6. Immediately begin initial curing.
Procedure – Making Flexural Beams – Rodding 1. Fill the mold in two approximately equal layers with the second layer slightly overfilling
the mold.
2. Consolidate each layer with the tamping rod once for every 1300 mm2 (2 in2) using the rounded end. Rod each layer throughout its depth, taking care to not forcibly strike the bottom of the mold when compacting the first layer. Rod the second layer throughout its depth, penetrating approximately 25 mm (1 in.) into the lower layer.
3. After rodding each layer, strike the mold 10 to 15 times with the mallet and spade along the sides and end using a trowel.
4. Strike off the surface of the molds with tamping rod, straightedge, float, or trowel. 5. Immediately begin initial curing.
CONCRETE WAQTC FOP AASHTO T 23 (17)
T23_short_17.docx Concrete 14-4 Pub. October 2017
Procedure – Making Flexural Beams – Vibration 1. Fill the mold to overflowing in one layer.
2. Consolidate the concrete by inserting the vibrator vertically along the centerline atintervals not exceeding 150 mm (6 in.). Take care to not over-vibrate, and withdraw thevibrator slowly to avoid large voids. Do not contact the bottom or sides of the mold withthe vibrator.
3. After vibrating, strike the mold 10 to 15 times with the mallet.
4. Strike off the surface of the molds with tamping rod, straightedge, float, or trowel.
5. Immediately begin initial curing.
Procedure – Initial Curing • When moving cylinder specimens made with single use molds support the bottom of the
mold with trowel, hand, or other device.
• For initial curing of cylinders, there are two methods, use of which depends on theagency. In both methods, the curing place must be firm, within ¼ in. of a level surface,and free from vibrations or other disturbances.
• Maintain initial curing temperature of 16 to 27°C (60 to 80°F) or 20 to 26°C (68 to 78°F)for concrete with strength of 40 Mpa (6000 psi) or more.
• Prevent loss of moisture.
Method 1 – Initial cure in a temperature controlled chest-type curing box 1. Finish the cylinder using the tamping rod, straightedge, float, or trowel. The finished
surface shall be flat with no projections or depressions greater than 3.2 mm (1/8 in.).
2. Place the mold in the curing box. When lifting light-gauge molds be careful to avoiddistortion (support the bottom, avoid squeezing the sides).
3. Place the lid on the mold to prevent moisture loss.
4. Mark the necessary identification data on the cylinder mold and lid.
Method 2 – Initial cure by burying in earth or by using a curing box over the cylinder Note 2: This procedure may not be the preferred method of initial curing due to problems in maintaining
the required range of temperature.
1. Move the cylinder with excess concrete to the initial curing location.
2. Mark the necessary identification data on the cylinder mold and lid.
3. Place the cylinder on level sand or earth, or on a board, and pile sand or earth aroundthe cylinder to within 50 mm (2 in.) of the top.
CONCRETE WAQTC FOP AASHTO T 23 (17)
T23_short_17.docx Concrete 14-5 Pub. October 2017
4. Finish the cylinder using the tamping rod, straightedge, float, or trowel. Use a sawing motion across the top of the mold. The finished surface shall be flat with no projections or depressions greater than 3.2 mm (1/8 in.).
5. If required by the agency, place a cover plate on top of the cylinder and leave it in place for the duration of the curing period, or place the lid on the mold to prevent moisture loss.
Procedure – Transporting Specimens • Initially cure the specimens for 24 to 48 hours. Transport specimens to the laboratory for
final cure. Specimen identity will be noted along with the date and time the specimen was made and the maximum and minimum temperatures registered during the initial cure.
• Protect specimens from jarring, extreme changes in temperature, freezing, or moisture loss during transport.
• Secure cylinders so that the axis is vertical.
• Do not exceed 4 hours transportation time.
Final Curing • Upon receiving cylinders at the laboratory, remove the cylinder from the mold and apply
the appropriate identification.
• For all specimens (cylinders or beams), final curing must be started within 30 minutes of mold removal. Temperature shall be maintained at 23° ±2°C (73 ±3°F). Free moisture must be present on the surfaces of the specimens during the entire curing period. Curing may be accomplished in a moist room or water tank conforming to AASHTO M 201.
• For cylinders, during the final 3 hours prior to testing the temperature requirement may be waived, but free moisture must be maintained on specimen surfaces at all times until tested.
• Final curing of beams must include immersion in lime-saturated water for at least 20 hours before testing.

CONCRETE WAQTC FOP AASHTO T 23 (17)
T23_short_17.docx Concrete 14-6 Pub. October 2017
Report • On forms approved by the agency
• Pertinent placement information for identification of project, element(s) represented, etc.
• Sample ID
• Date and time molded.
• Test ages.
• Slump, air content, and density.
• Temperature (concrete, initial cure max. and min., and ambient).
• Method of initial curing.
• Other information as required by agency, such as: concrete supplier, truck number,invoice number, water added, etc.

Oregon Department of TransportationConstruction Section
800 Airport Road SE Salem, OR 97301-4798
Telephone (503) 986-3000 FAX (503) 986-3096
DATE: October 31, 2007
TO: All Holders of the Manual of Field Test Procedures File Code:
SECTION: Test Procedure AASHTO T 27/11
The Oregon Department of Transportation has specified method(s) for this Test Procedure. Please observe the following for our projects:
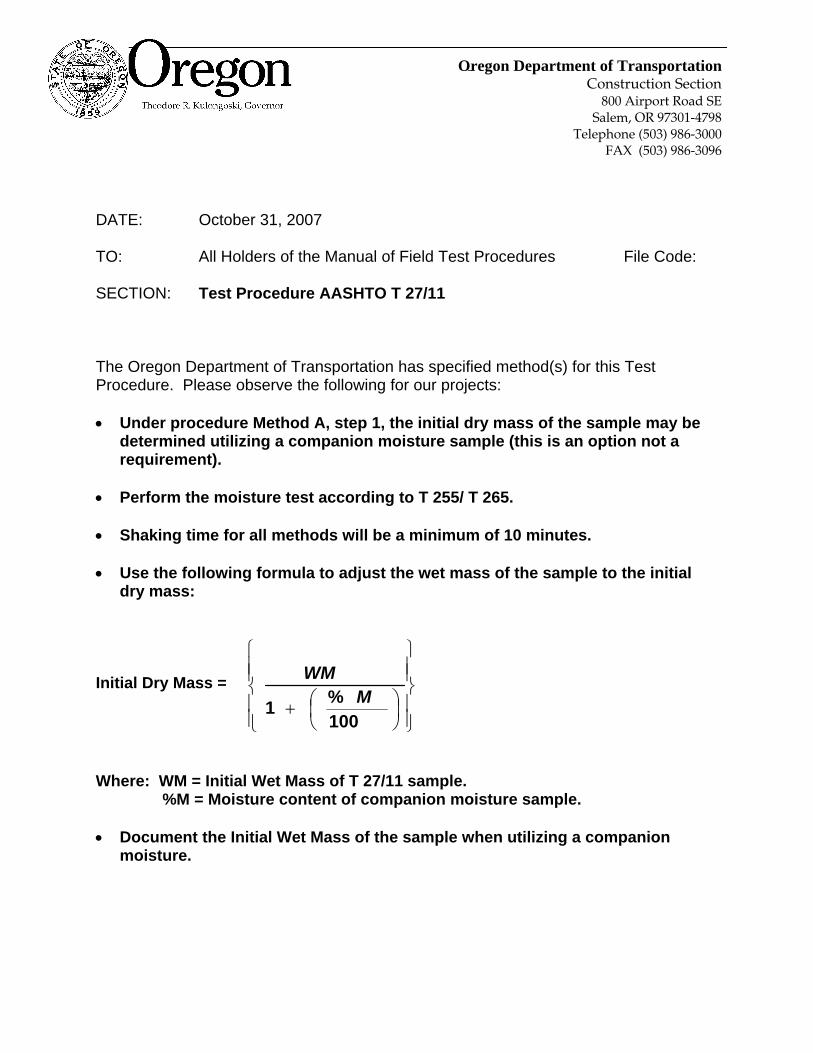
Under procedure Method A, step 1, the initial dry mass of the sample may bedetermined utilizing a companion moisture sample (this is an option not arequirement).
Perform the moisture test according to T 255/ T 265.
Shaking time for all methods will be a minimum of 10 minutes.
Use the following formula to adjust the wet mass of the sample to the initialdry mass:
Initial Dry Mass =
100%1 M
WM
Where: WM = Initial Wet Mass of T 27/11 sample. %M = Moisture content of companion moisture sample.
Document the Initial Wet Mass of the sample when utilizing a companionmoisture.
AGGREGATE WAQTC FOP AASTHO T 27 / T 11 (17)
T27_T11_short_17.docx Aggregate 12-1 Pub. October 2017
SIEVE ANALYSIS OF FINE AND COARSE AGGREGATES FOP FOR AASHTO T 27 MATERIALS FINER THAN 75 µm (No. 200) SIEVE IN MINERAL AGGREGATE BY WASHING FOP FOR AASHTO T 11 Scope A sieve analysis, or ‘gradation,’ measures distribution of aggregate particle sizes within a given sample. Accurate determination of the amount of material smaller than 75 µm (No. 200) cannot be made using just AASHTO T 27. If quantifying this material is required, use AASHTO T 11 in conjunction with AASHTO T 27. This FOP covers sieve analysis in accordance with AASHTO T 27-14 and materials finer than 75 µm (No. 200) in accordance with AASHTO T 11-05 performed in conjunction with AASHTO T 27. The procedure includes three methods: A, B, and C. Apparatus
• Balance or scale: Capacity sufficient for the masses shown in Table 1, accurate to 0.1 percent of the sample mass or readable to 0.1 g, and meeting the requirements of AASHTO M 231
• Sieves: Meeting the requirements of ASTM E11 • Mechanical sieve shaker: Meeting the requirements of AASHTO T 27 • Suitable drying equipment (refer to FOP for AASHTO T 255) • Containers and utensils: A pan or vessel of sufficient size to contain the test sample
covered with water and permit vigorous agitation without loss of test material or water
• Optional: mechanical washing device
Sample Sieving
• In all procedures, the test sample is shaken in nested sieves. Sieves are selected to furnish information required by specification. Intermediate sieves are added for additional information or to avoid overloading sieves, or both.
• The sieves are nested in order of increasing size from the bottom to the top, and the
test sample, or a portion of the test sample, is placed on the top sieve.
AGGREGATE WAQTC FOP AASTHO T 27 / T 11 (17)
T27_T11_short_17.docx Aggregate 12-2 Pub. October 2017
• The loaded sieves are shaken in a mechanical shaker for approximately 10 minutes,refer to Annex A; Time Evaluation.
• Care must be taken so that sieves are not overloaded, refer to Annex B; OverloadDetermination. The test sample may be sieved in increments and the mass retainedfor each sieve added together from each test sample increment to avoid overloadingsieves.
Sample Preparation
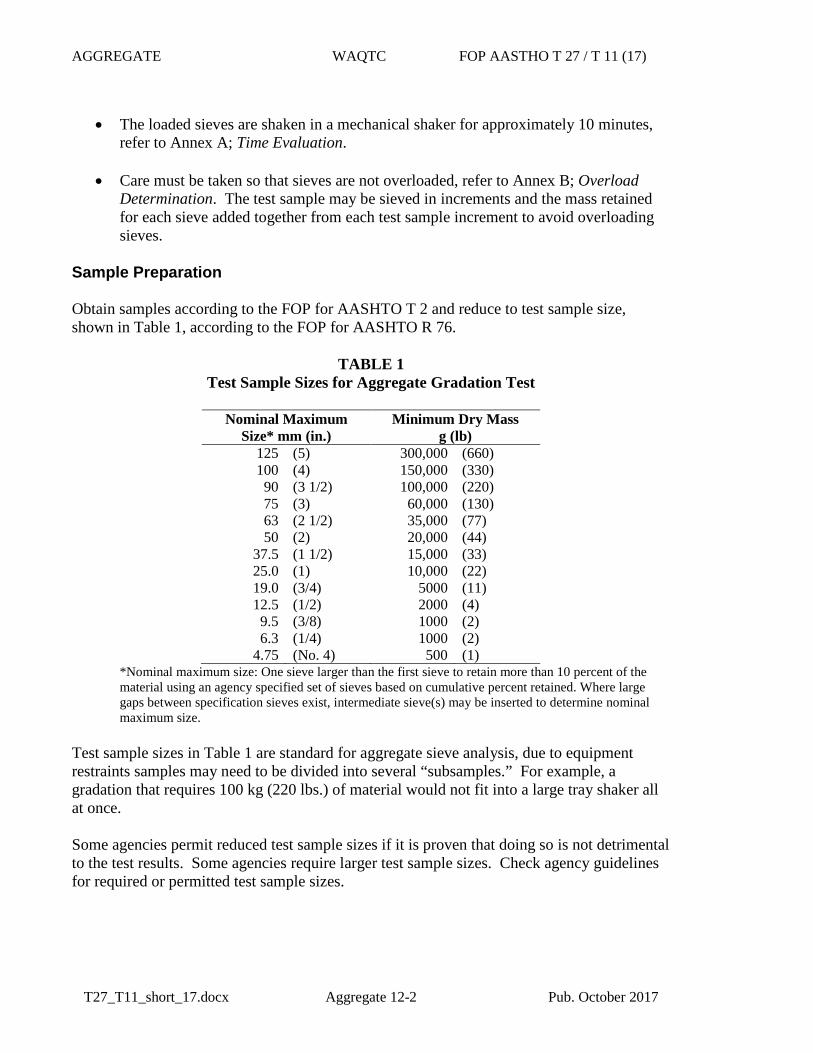
Obtain samples according to the FOP for AASHTO T 2 and reduce to test sample size, shown in Table 1, according to the FOP for AASHTO R 76.
TABLE 1 Test Sample Sizes for Aggregate Gradation Test
Nominal Maximum Size* mm (in.)
Minimum Dry Mass g (lb)
125 (5) 300,000 (660)100 (4) 150,000 (330)
90 (3 1/2) 100,000 (220)75 (3) 60,000 (130)63 (2 1/2) 35,000 (77)50 (2) 20,000 (44)
37.5 (1 1/2) 15,000 (33)25.0 (1) 10,000 (22)19.0 (3/4) 5000 (11)12.5 (1/2) 2000 (4)9.5 (3/8) 1000 (2)6.3 (1/4) 1000 (2)
4.75 (No. 4) 500 (1)*Nominal maximum size: One sieve larger than the first sieve to retain more than 10 percent of thematerial using an agency specified set of sieves based on cumulative percent retained. Where largegaps between specification sieves exist, intermediate sieve(s) may be inserted to determine nominalmaximum size.
Test sample sizes in Table 1 are standard for aggregate sieve analysis, due to equipment restraints samples may need to be divided into several “subsamples.” For example, a gradation that requires 100 kg (220 lbs.) of material would not fit into a large tray shaker all at once.
Some agencies permit reduced test sample sizes if it is proven that doing so is not detrimental to the test results. Some agencies require larger test sample sizes. Check agency guidelines for required or permitted test sample sizes.
AGGREGATE WAQTC FOP AASTHO T 27 / T 11 (17)
T27_T11_short_17.docx Aggregate 12-3 Pub. October 2017
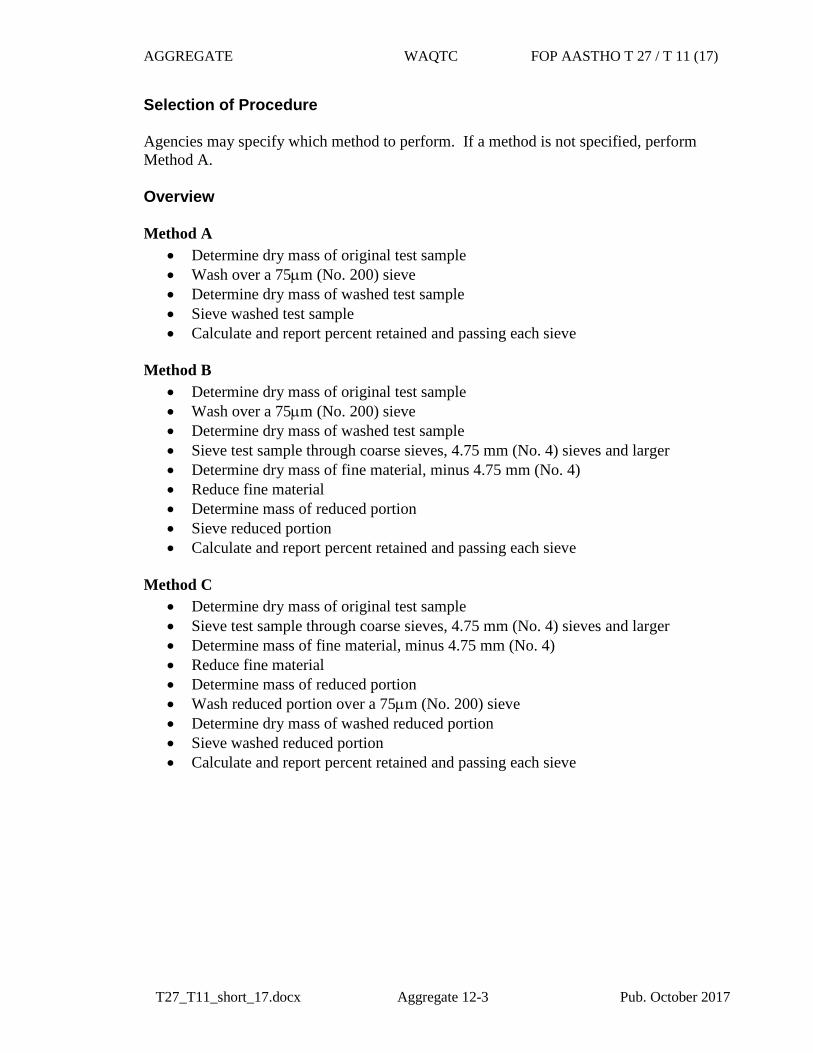
Selection of Procedure Agencies may specify which method to perform. If a method is not specified, perform Method A. Overview Method A
• Determine dry mass of original test sample • Wash over a 75µm (No. 200) sieve • Determine dry mass of washed test sample • Sieve washed test sample • Calculate and report percent retained and passing each sieve
Method B
• Determine dry mass of original test sample • Wash over a 75µm (No. 200) sieve • Determine dry mass of washed test sample • Sieve test sample through coarse sieves, 4.75 mm (No. 4) sieves and larger • Determine dry mass of fine material, minus 4.75 mm (No. 4) • Reduce fine material • Determine mass of reduced portion • Sieve reduced portion • Calculate and report percent retained and passing each sieve
Method C
• Determine dry mass of original test sample • Sieve test sample through coarse sieves, 4.75 mm (No. 4) sieves and larger • Determine mass of fine material, minus 4.75 mm (No. 4) • Reduce fine material • Determine mass of reduced portion • Wash reduced portion over a 75µm (No. 200) sieve • Determine dry mass of washed reduced portion • Sieve washed reduced portion • Calculate and report percent retained and passing each sieve
AGGREGATE WAQTC FOP AASTHO T 27 / T 11 (17)
T27_T11_short_17.docx Aggregate 12-4 Pub. October 2017
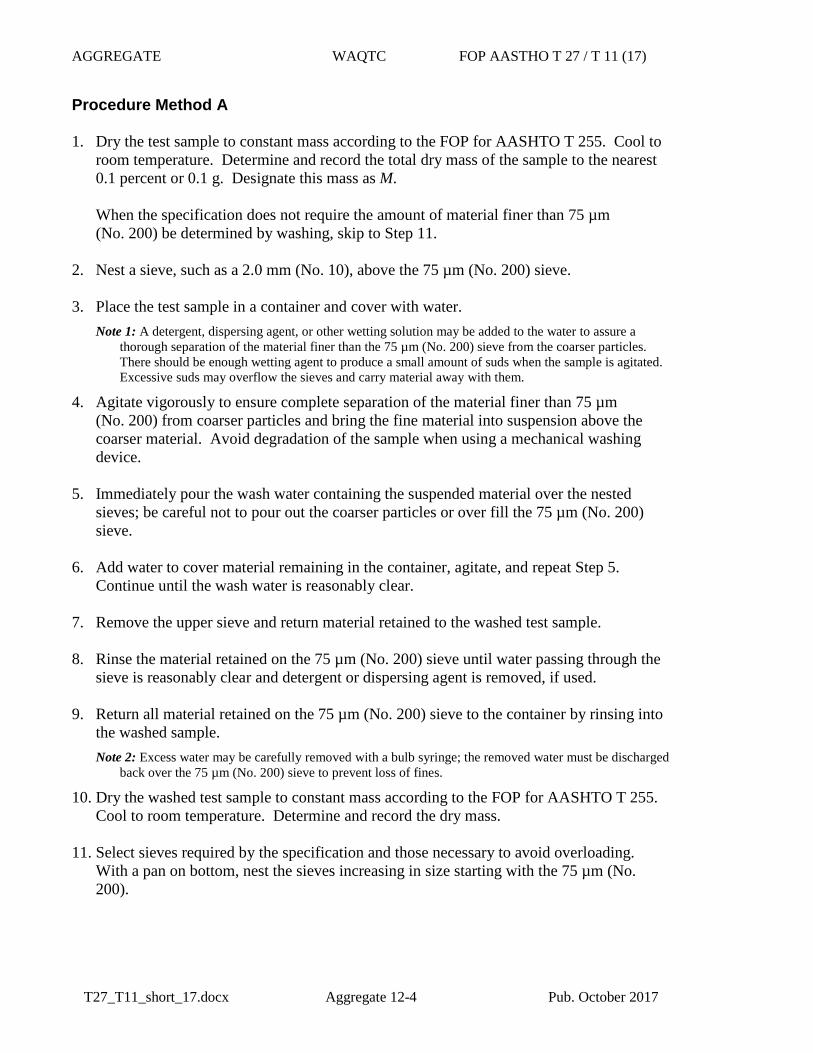
Procedure Method A
1. Dry the test sample to constant mass according to the FOP for AASHTO T 255. Cool toroom temperature. Determine and record the total dry mass of the sample to the nearest0.1 percent or 0.1 g. Designate this mass as M.
When the specification does not require the amount of material finer than 75 µm(No. 200) be determined by washing, skip to Step 11.
2. Nest a sieve, such as a 2.0 mm (No. 10), above the 75 µm (No. 200) sieve.
3. Place the test sample in a container and cover with water.Note 1: A detergent, dispersing agent, or other wetting solution may be added to the water to assure a
thorough separation of the material finer than the 75 µm (No. 200) sieve from the coarser particles. There should be enough wetting agent to produce a small amount of suds when the sample is agitated. Excessive suds may overflow the sieves and carry material away with them.
4. Agitate vigorously to ensure complete separation of the material finer than 75 µm(No. 200) from coarser particles and bring the fine material into suspension above thecoarser material. Avoid degradation of the sample when using a mechanical washingdevice.
5. Immediately pour the wash water containing the suspended material over the nestedsieves; be careful not to pour out the coarser particles or over fill the 75 µm (No. 200)sieve.
6. Add water to cover material remaining in the container, agitate, and repeat Step 5.Continue until the wash water is reasonably clear.
7. Remove the upper sieve and return material retained to the washed test sample.
8. Rinse the material retained on the 75 µm (No. 200) sieve until water passing through thesieve is reasonably clear and detergent or dispersing agent is removed, if used.
9. Return all material retained on the 75 µm (No. 200) sieve to the container by rinsing intothe washed sample.Note 2: Excess water may be carefully removed with a bulb syringe; the removed water must be discharged
back over the 75 µm (No. 200) sieve to prevent loss of fines.
10. Dry the washed test sample to constant mass according to the FOP for AASHTO T 255.Cool to room temperature. Determine and record the dry mass.
11. Select sieves required by the specification and those necessary to avoid overloading.With a pan on bottom, nest the sieves increasing in size starting with the 75 µm (No.200).
AGGREGATE WAQTC FOP AASTHO T 27 / T 11 (17)
T27_T11_short_17.docx Aggregate 12-5 Pub. October 2017
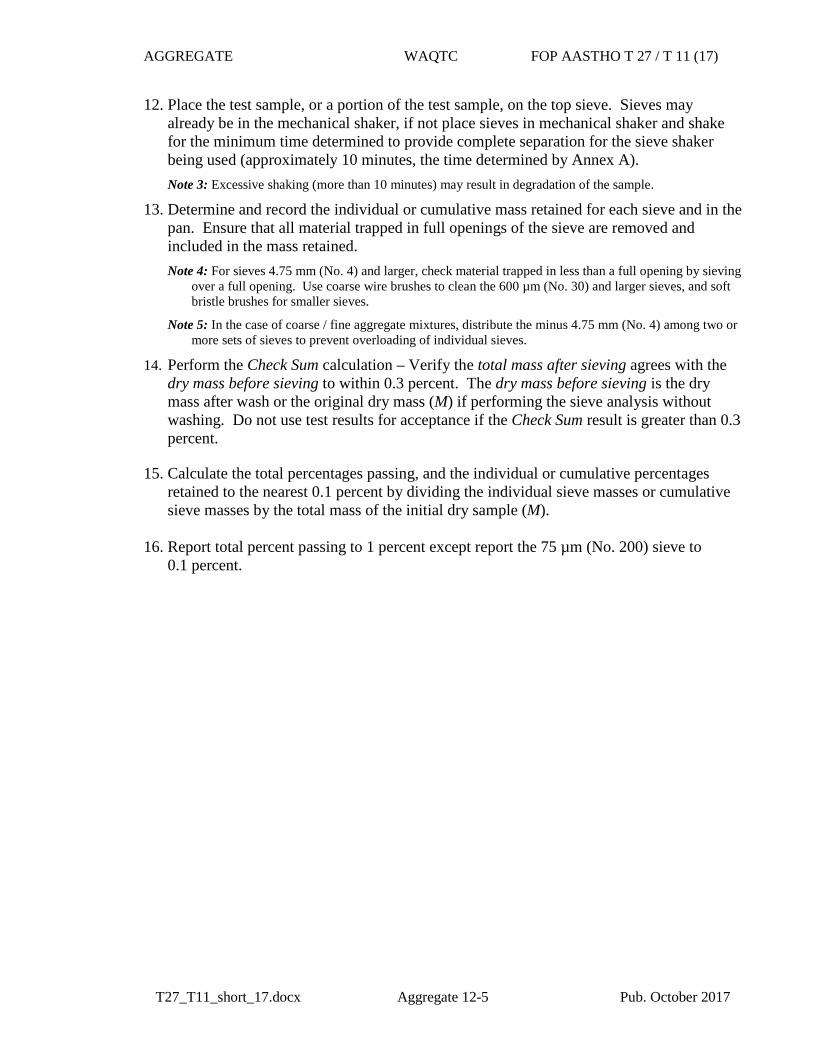
12. Place the test sample, or a portion of the test sample, on the top sieve. Sieves mayalready be in the mechanical shaker, if not place sieves in mechanical shaker and shakefor the minimum time determined to provide complete separation for the sieve shakerbeing used (approximately 10 minutes, the time determined by Annex A).Note 3: Excessive shaking (more than 10 minutes) may result in degradation of the sample.
13. Determine and record the individual or cumulative mass retained for each sieve and in thepan. Ensure that all material trapped in full openings of the sieve are removed andincluded in the mass retained.Note 4: For sieves 4.75 mm (No. 4) and larger, check material trapped in less than a full opening by sieving
over a full opening. Use coarse wire brushes to clean the 600 µm (No. 30) and larger sieves, and soft bristle brushes for smaller sieves.
Note 5: In the case of coarse / fine aggregate mixtures, distribute the minus 4.75 mm (No. 4) among two or more sets of sieves to prevent overloading of individual sieves.
14. Perform the Check Sum calculation – Verify the total mass after sieving agrees with thedry mass before sieving to within 0.3 percent. The dry mass before sieving is the drymass after wash or the original dry mass (M) if performing the sieve analysis withoutwashing. Do not use test results for acceptance if the Check Sum result is greater than 0.3percent.
15. Calculate the total percentages passing, and the individual or cumulative percentagesretained to the nearest 0.1 percent by dividing the individual sieve masses or cumulativesieve masses by the total mass of the initial dry sample (M).
16. Report total percent passing to 1 percent except report the 75 µm (No. 200) sieve to0.1 percent.
AGGREGATE WAQTC FOP AASTHO T 27 / T 11 (17)
T27_T11_short_17.docx Aggregate 12-6 Pub. October 2017
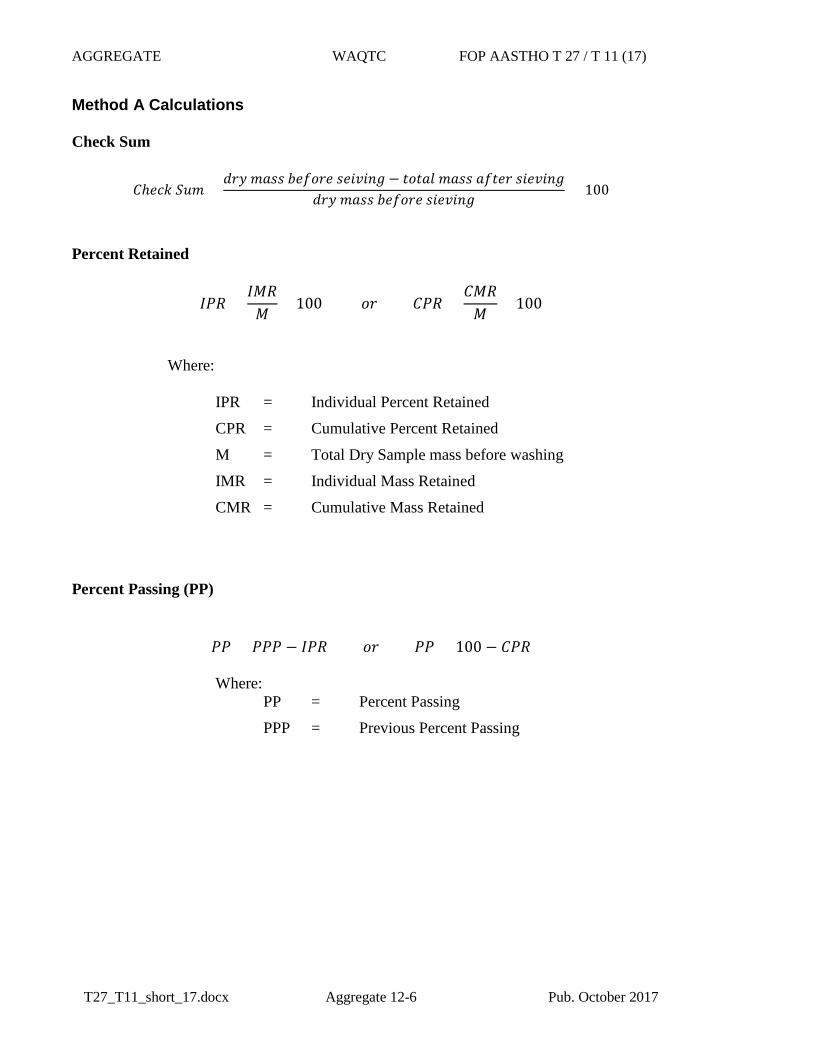
Method A Calculations
Check Sum
𝐶𝐶ℎ𝑒𝑒𝑒𝑒𝑒𝑒 𝑆𝑆𝑆𝑆𝑆𝑆 =𝑑𝑑𝑑𝑑𝑑𝑑 𝑆𝑆𝑚𝑚𝑚𝑚𝑚𝑚 𝑏𝑏𝑒𝑒𝑏𝑏𝑏𝑏𝑑𝑑𝑒𝑒 𝑚𝑚𝑒𝑒𝑠𝑠𝑠𝑠𝑠𝑠𝑠𝑠𝑠𝑠 − 𝑡𝑡𝑏𝑏𝑡𝑡𝑚𝑚𝑡𝑡 𝑆𝑆𝑚𝑚𝑚𝑚𝑚𝑚 𝑚𝑚𝑏𝑏𝑡𝑡𝑒𝑒𝑑𝑑 𝑚𝑚𝑠𝑠𝑒𝑒𝑠𝑠𝑠𝑠𝑠𝑠𝑠𝑠
𝑑𝑑𝑑𝑑𝑑𝑑 𝑆𝑆𝑚𝑚𝑚𝑚𝑚𝑚 𝑏𝑏𝑒𝑒𝑏𝑏𝑏𝑏𝑑𝑑𝑒𝑒 𝑚𝑚𝑠𝑠𝑒𝑒𝑠𝑠𝑠𝑠𝑠𝑠𝑠𝑠 × 100
Percent Retained
𝐼𝐼𝐼𝐼𝐼𝐼 =𝐼𝐼𝐼𝐼𝐼𝐼𝐼𝐼
× 100 𝑏𝑏𝑑𝑑 𝐶𝐶𝐼𝐼𝐼𝐼 =𝐶𝐶𝐼𝐼𝐼𝐼𝐼𝐼
× 100
Where:
IPR = Individual Percent Retained
CPR = Cumulative Percent Retained
M = Total Dry Sample mass before washing
IMR = Individual Mass Retained
CMR = Cumulative Mass Retained
Percent Passing (PP)
𝐼𝐼𝐼𝐼 = 𝐼𝐼𝐼𝐼𝐼𝐼 − 𝐼𝐼𝐼𝐼𝐼𝐼 𝑏𝑏𝑑𝑑 𝐼𝐼𝐼𝐼 = 100 − 𝐶𝐶𝐼𝐼𝐼𝐼
Where: PP = Percent Passing
PPP = Previous Percent Passing
AGGREGATE WAQTC FOP AASTHO T 27 / T 11 (17)
T27_T11_short_17.docx Aggregate 12-7 Pub. October 2017
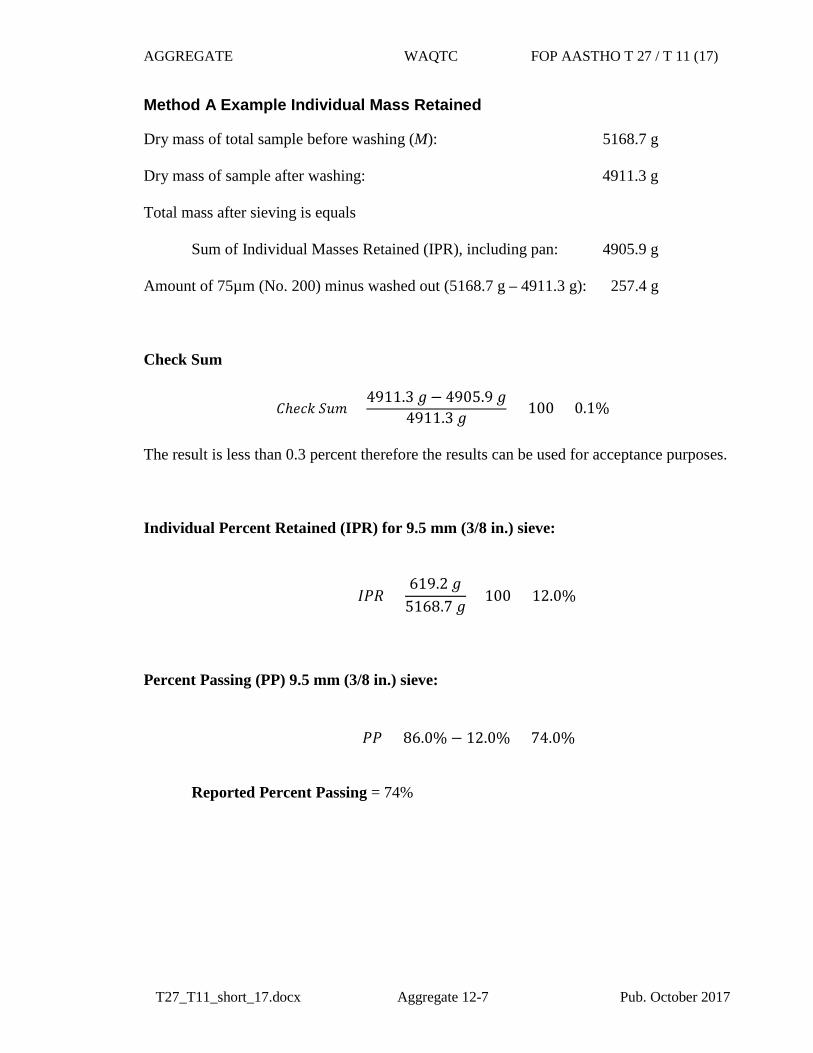
Method A Example Individual Mass Retained
Dry mass of total sample before washing (M): 5168.7 g
Dry mass of sample after washing: 4911.3 g
Total mass after sieving is equals
Sum of Individual Masses Retained (IPR), including pan: 4905.9 g
Amount of 75µm (No. 200) minus washed out (5168.7 g – 4911.3 g): 257.4 g
Check Sum
𝐶𝐶ℎ𝑒𝑒𝑒𝑒𝑒𝑒 𝑆𝑆𝑆𝑆𝑆𝑆 =4911.3 𝑠𝑠− 4905.9 𝑠𝑠
4911.3 𝑠𝑠 × 100 = 0.1%
The result is less than 0.3 percent therefore the results can be used for acceptance purposes.
Individual Percent Retained (IPR) for 9.5 mm (3/8 in.) sieve:
𝐼𝐼𝐼𝐼𝐼𝐼 =619.2 𝑠𝑠
5168.7 𝑠𝑠× 100 = 12.0%
Percent Passing (PP) 9.5 mm (3/8 in.) sieve:
𝐼𝐼𝐼𝐼 = 86.0% − 12.0% = 74.0%
Reported Percent Passing = 74%
AGGREGATE WAQTC FOP AASTHO T 27 / T 11 (17)
T27_T11_short_17.docx Aggregate 12-8 Pub. October 2017
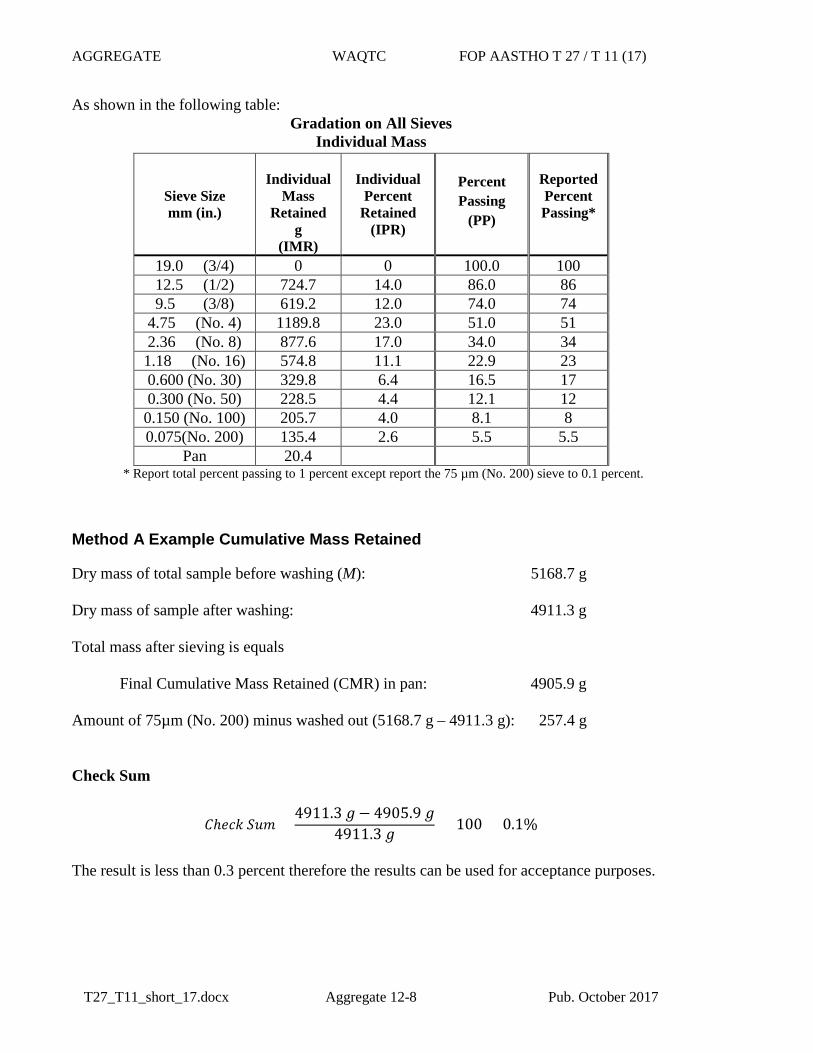
As shown in the following table: Gradation on All Sieves
Individual Mass
Sieve Size mm (in.)
Individual Mass
Retained g
(IMR)
Individual Percent
Retained (IPR)
Percent Passing
(PP)
Reported Percent Passing*
19.0 (3/4) 0 0 100.0 100 12.5 (1/2) 724.7 14.0 86.0 86 9.5 (3/8) 619.2 12.0 74.0 74
4.75 (No. 4) 1189.8 23.0 51.0 51 2.36 (No. 8) 877.6 17.0 34.0 34 1.18 (No. 16) 574.8 11.1 22.9 23 0.600 (No. 30) 329.8 6.4 16.5 17 0.300 (No. 50) 228.5 4.4 12.1 12 0.150 (No. 100) 205.7 4.0 8.1 8 0.075(No. 200) 135.4 2.6 5.5 5.5
Pan 20.4 * Report total percent passing to 1 percent except report the 75 µm (No. 200) sieve to 0.1 percent.
Method A Example Cumulative Mass Retained
Dry mass of total sample before washing (M): 5168.7 g
Dry mass of sample after washing: 4911.3 g
Total mass after sieving is equals
Final Cumulative Mass Retained (CMR) in pan: 4905.9 g
Amount of 75µm (No. 200) minus washed out (5168.7 g – 4911.3 g): 257.4 g
Check Sum
𝐶𝐶ℎ𝑒𝑒𝑒𝑒𝑒𝑒 𝑆𝑆𝑆𝑆𝑆𝑆 =4911.3 𝑠𝑠− 4905.9 𝑠𝑠
4911.3 𝑠𝑠 × 100 = 0.1%
The result is less than 0.3 percent therefore the results can be used for acceptance purposes.
AGGREGATE WAQTC FOP AASTHO T 27 / T 11 (17)
T27_T11_short_17.docx Aggregate 12-9 Pub. October 2017
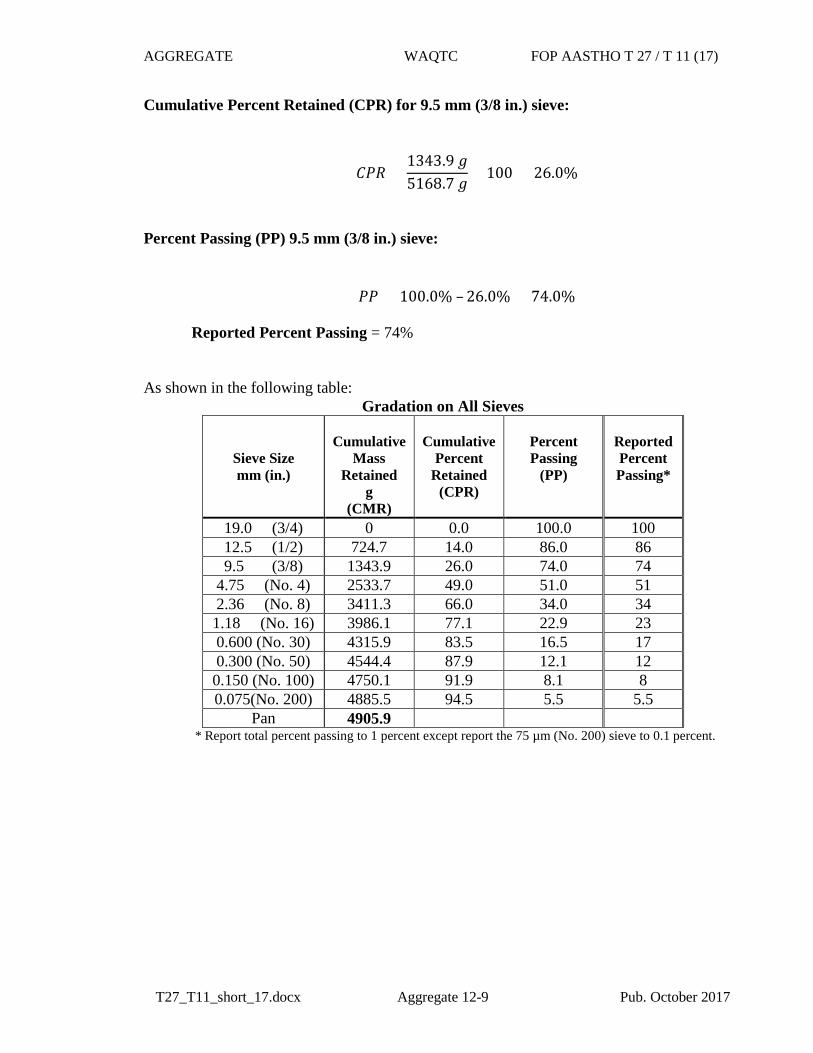
Cumulative Percent Retained (CPR) for 9.5 mm (3/8 in.) sieve:
𝐶𝐶𝐼𝐼𝐼𝐼 =1343.9 𝑠𝑠5168.7 𝑠𝑠
× 100 = 26.0%
Percent Passing (PP) 9.5 mm (3/8 in.) sieve:
𝐼𝐼𝐼𝐼 = 100.0% – 26.0% = 74.0%
Reported Percent Passing = 74%
As shown in the following table: Gradation on All Sieves
Sieve Size mm (in.)
Cumulative Mass
Retained g
(CMR)
Cumulative Percent
Retained (CPR)
Percent Passing
(PP)
Reported Percent Passing*
19.0 (3/4) 0 0.0 100.0 100 12.5 (1/2) 724.7 14.0 86.0 86 9.5 (3/8) 1343.9 26.0 74.0 74
4.75 (No. 4) 2533.7 49.0 51.0 51 2.36 (No. 8) 3411.3 66.0 34.0 34 1.18 (No. 16) 3986.1 77.1 22.9 23 0.600 (No. 30) 4315.9 83.5 16.5 17 0.300 (No. 50) 4544.4 87.9 12.1 12 0.150 (No. 100) 4750.1 91.9 8.1 8 0.075(No. 200) 4885.5 94.5 5.5 5.5
Pan 4905.9 * Report total percent passing to 1 percent except report the 75 µm (No. 200) sieve to 0.1 percent.
AGGREGATE WAQTC FOP AASTHO T 27 / T 11 (17)
T27_T11_short_17.docx Aggregate 12-10 Pub. October 2017
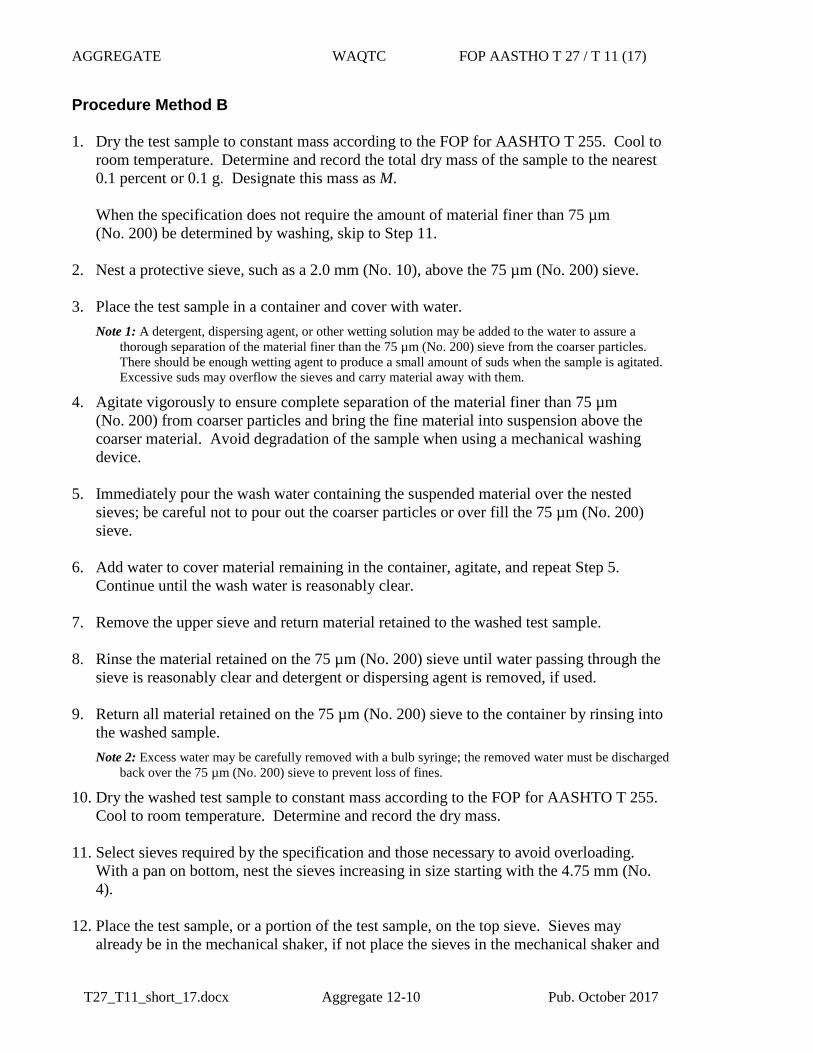
Procedure Method B
1. Dry the test sample to constant mass according to the FOP for AASHTO T 255. Cool toroom temperature. Determine and record the total dry mass of the sample to the nearest0.1 percent or 0.1 g. Designate this mass as M.
When the specification does not require the amount of material finer than 75 µm(No. 200) be determined by washing, skip to Step 11.
2. Nest a protective sieve, such as a 2.0 mm (No. 10), above the 75 µm (No. 200) sieve.
3. Place the test sample in a container and cover with water.Note 1: A detergent, dispersing agent, or other wetting solution may be added to the water to assure a
thorough separation of the material finer than the 75 µm (No. 200) sieve from the coarser particles. There should be enough wetting agent to produce a small amount of suds when the sample is agitated. Excessive suds may overflow the sieves and carry material away with them.
4. Agitate vigorously to ensure complete separation of the material finer than 75 µm(No. 200) from coarser particles and bring the fine material into suspension above thecoarser material. Avoid degradation of the sample when using a mechanical washingdevice.
5. Immediately pour the wash water containing the suspended material over the nestedsieves; be careful not to pour out the coarser particles or over fill the 75 µm (No. 200)sieve.
6. Add water to cover material remaining in the container, agitate, and repeat Step 5.Continue until the wash water is reasonably clear.
7. Remove the upper sieve and return material retained to the washed test sample.
8. Rinse the material retained on the 75 µm (No. 200) sieve until water passing through thesieve is reasonably clear and detergent or dispersing agent is removed, if used.
9. Return all material retained on the 75 µm (No. 200) sieve to the container by rinsing intothe washed sample.Note 2: Excess water may be carefully removed with a bulb syringe; the removed water must be discharged
back over the 75 µm (No. 200) sieve to prevent loss of fines.
10. Dry the washed test sample to constant mass according to the FOP for AASHTO T 255.Cool to room temperature. Determine and record the dry mass.
11. Select sieves required by the specification and those necessary to avoid overloading.With a pan on bottom, nest the sieves increasing in size starting with the 4.75 mm (No.4).
12. Place the test sample, or a portion of the test sample, on the top sieve. Sieves mayalready be in the mechanical shaker, if not place the sieves in the mechanical shaker and
AGGREGATE WAQTC FOP AASTHO T 27 / T 11 (17)
T27_T11_short_17.docx Aggregate 12-11 Pub. October 2017
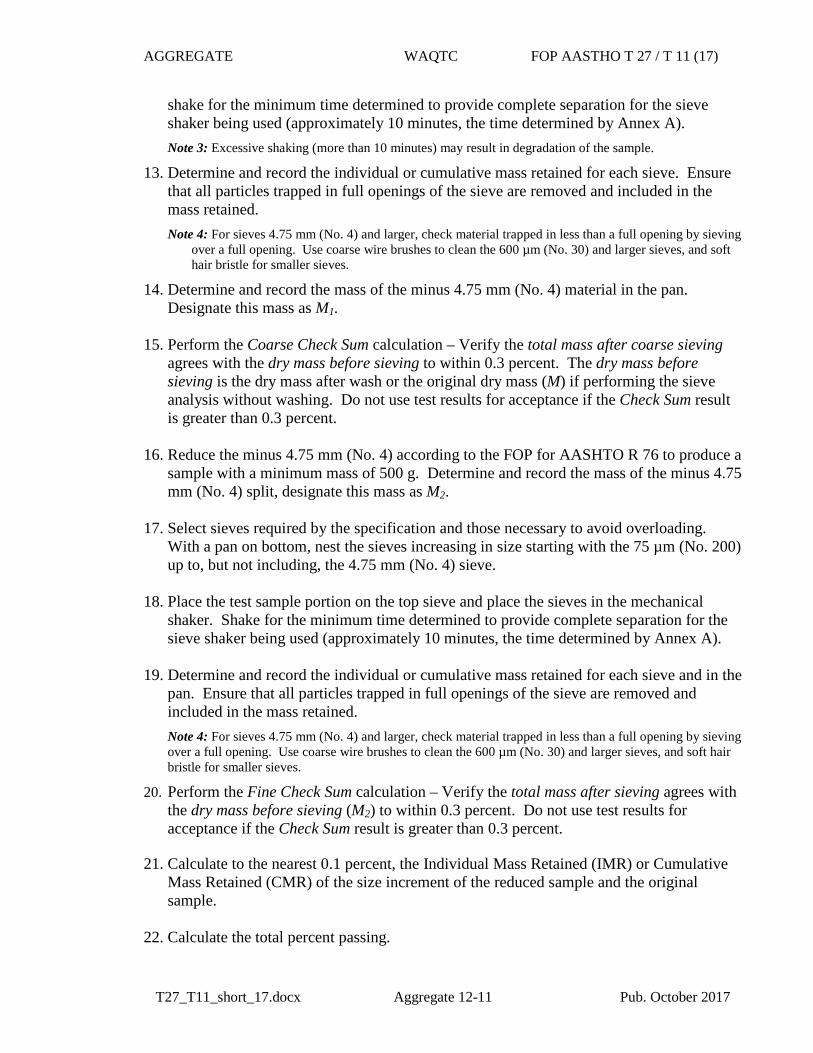
shake for the minimum time determined to provide complete separation for the sieve shaker being used (approximately 10 minutes, the time determined by Annex A). Note 3: Excessive shaking (more than 10 minutes) may result in degradation of the sample.
13. Determine and record the individual or cumulative mass retained for each sieve. Ensurethat all particles trapped in full openings of the sieve are removed and included in themass retained.Note 4: For sieves 4.75 mm (No. 4) and larger, check material trapped in less than a full opening by sieving
over a full opening. Use coarse wire brushes to clean the 600 µm (No. 30) and larger sieves, and soft hair bristle for smaller sieves.
14. Determine and record the mass of the minus 4.75 mm (No. 4) material in the pan.Designate this mass as M1.
15. Perform the Coarse Check Sum calculation – Verify the total mass after coarse sievingagrees with the dry mass before sieving to within 0.3 percent. The dry mass beforesieving is the dry mass after wash or the original dry mass (M) if performing the sieveanalysis without washing. Do not use test results for acceptance if the Check Sum resultis greater than 0.3 percent.
16. Reduce the minus 4.75 mm (No. 4) according to the FOP for AASHTO R 76 to produce asample with a minimum mass of 500 g. Determine and record the mass of the minus 4.75mm (No. 4) split, designate this mass as M2.
17. Select sieves required by the specification and those necessary to avoid overloading.With a pan on bottom, nest the sieves increasing in size starting with the 75 µm (No. 200)up to, but not including, the 4.75 mm (No. 4) sieve.
18. Place the test sample portion on the top sieve and place the sieves in the mechanicalshaker. Shake for the minimum time determined to provide complete separation for thesieve shaker being used (approximately 10 minutes, the time determined by Annex A).
19. Determine and record the individual or cumulative mass retained for each sieve and in thepan. Ensure that all particles trapped in full openings of the sieve are removed andincluded in the mass retained.Note 4: For sieves 4.75 mm (No. 4) and larger, check material trapped in less than a full opening by sievingover a full opening. Use coarse wire brushes to clean the 600 µm (No. 30) and larger sieves, and soft hairbristle for smaller sieves.
20. Perform the Fine Check Sum calculation – Verify the total mass after sieving agrees withthe dry mass before sieving (M2) to within 0.3 percent. Do not use test results foracceptance if the Check Sum result is greater than 0.3 percent.
21. Calculate to the nearest 0.1 percent, the Individual Mass Retained (IMR) or CumulativeMass Retained (CMR) of the size increment of the reduced sample and the originalsample.
22. Calculate the total percent passing.
AGGREGATE WAQTC FOP AASTHO T 27 / T 11 (17)
T27_T11_short_17.docx Aggregate 12-12 Pub. October 2017
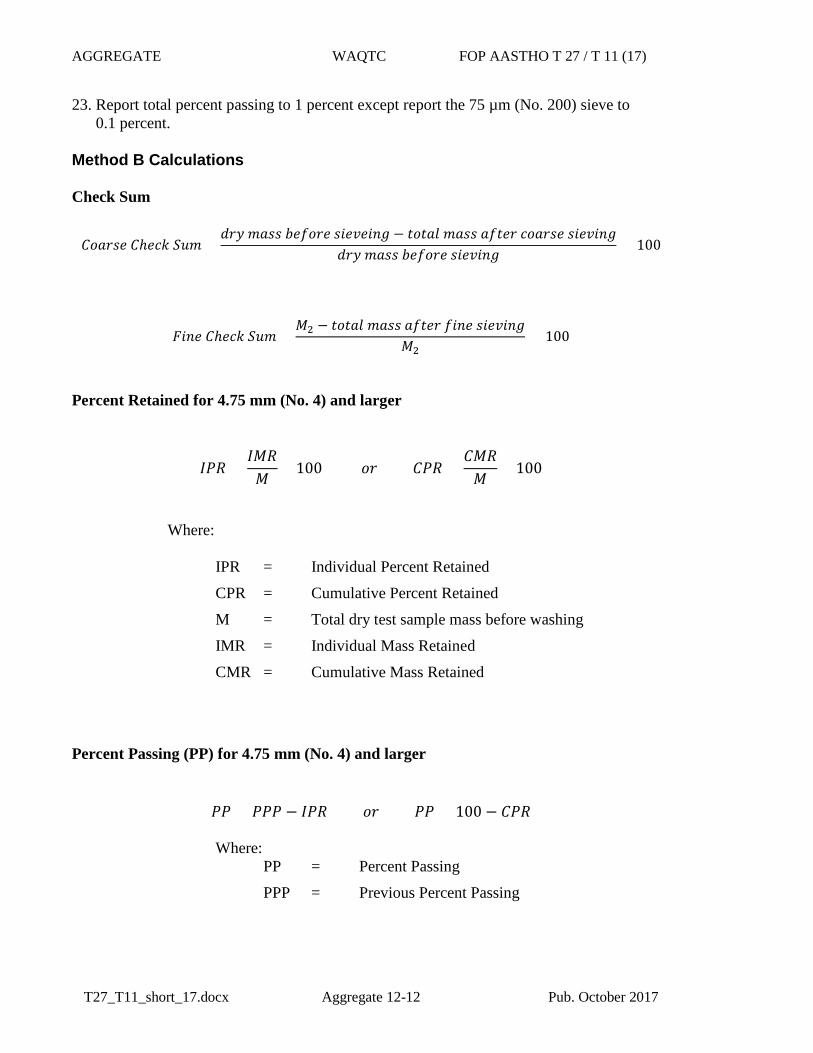
23. Report total percent passing to 1 percent except report the 75 µm (No. 200) sieve to0.1 percent.
Method B Calculations
Check Sum
𝐶𝐶𝑏𝑏𝑚𝑚𝑑𝑑𝑚𝑚𝑒𝑒 𝐶𝐶ℎ𝑒𝑒𝑒𝑒𝑒𝑒 𝑆𝑆𝑆𝑆𝑆𝑆 =𝑑𝑑𝑑𝑑𝑑𝑑 𝑆𝑆𝑚𝑚𝑚𝑚𝑚𝑚 𝑏𝑏𝑒𝑒𝑏𝑏𝑏𝑏𝑑𝑑𝑒𝑒 𝑚𝑚𝑠𝑠𝑒𝑒𝑠𝑠𝑒𝑒𝑠𝑠𝑠𝑠𝑠𝑠 − 𝑡𝑡𝑏𝑏𝑡𝑡𝑚𝑚𝑡𝑡 𝑆𝑆𝑚𝑚𝑚𝑚𝑚𝑚 𝑚𝑚𝑏𝑏𝑡𝑡𝑒𝑒𝑑𝑑 𝑒𝑒𝑏𝑏𝑚𝑚𝑑𝑑𝑚𝑚𝑒𝑒 𝑚𝑚𝑠𝑠𝑒𝑒𝑠𝑠𝑠𝑠𝑠𝑠𝑠𝑠
𝑑𝑑𝑑𝑑𝑑𝑑 𝑆𝑆𝑚𝑚𝑚𝑚𝑚𝑚 𝑏𝑏𝑒𝑒𝑏𝑏𝑏𝑏𝑑𝑑𝑒𝑒 𝑚𝑚𝑠𝑠𝑒𝑒𝑠𝑠𝑠𝑠𝑠𝑠𝑠𝑠 × 100
𝐹𝐹𝑠𝑠𝑠𝑠𝑒𝑒 𝐶𝐶ℎ𝑒𝑒𝑒𝑒𝑒𝑒 𝑆𝑆𝑆𝑆𝑆𝑆 =𝐼𝐼2 − 𝑡𝑡𝑏𝑏𝑡𝑡𝑚𝑚𝑡𝑡 𝑆𝑆𝑚𝑚𝑚𝑚𝑚𝑚 𝑚𝑚𝑏𝑏𝑡𝑡𝑒𝑒𝑑𝑑 𝑏𝑏𝑠𝑠𝑠𝑠𝑒𝑒 𝑚𝑚𝑠𝑠𝑒𝑒𝑠𝑠𝑠𝑠𝑠𝑠𝑠𝑠
𝐼𝐼2 × 100
Percent Retained for 4.75 mm (No. 4) and larger
𝐼𝐼𝐼𝐼𝐼𝐼 =𝐼𝐼𝐼𝐼𝐼𝐼𝐼𝐼
× 100 𝑏𝑏𝑑𝑑 𝐶𝐶𝐼𝐼𝐼𝐼 =𝐶𝐶𝐼𝐼𝐼𝐼𝐼𝐼
× 100
Where:
IPR = Individual Percent Retained
CPR = Cumulative Percent Retained
M = Total dry test sample mass before washing
IMR = Individual Mass Retained
CMR = Cumulative Mass Retained
Percent Passing (PP) for 4.75 mm (No. 4) and larger
𝐼𝐼𝐼𝐼 = 𝐼𝐼𝐼𝐼𝐼𝐼 − 𝐼𝐼𝐼𝐼𝐼𝐼 𝑏𝑏𝑑𝑑 𝐼𝐼𝐼𝐼 = 100 − 𝐶𝐶𝐼𝐼𝐼𝐼
Where: PP = Percent Passing
PPP = Previous Percent Passing
AGGREGATE WAQTC FOP AASTHO T 27 / T 11 (17)
T27_T11_short_17.docx Aggregate 12-13 Pub. October 2017
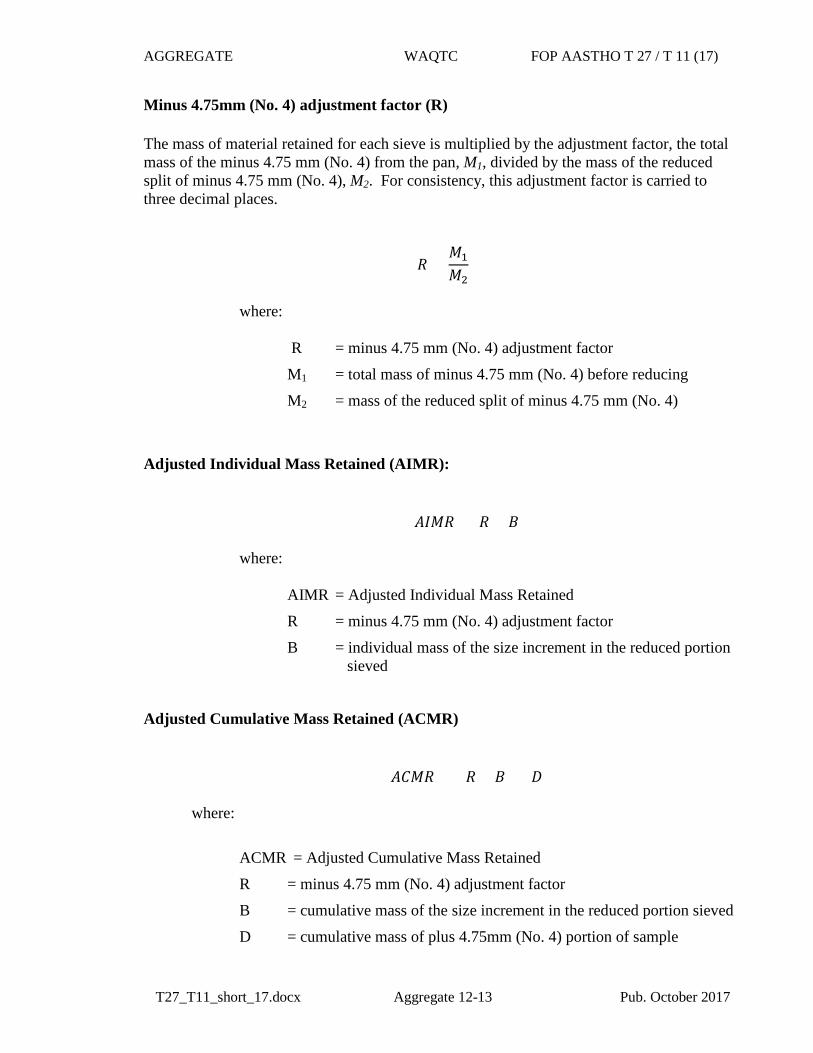
Minus 4.75mm (No. 4) adjustment factor (R)
The mass of material retained for each sieve is multiplied by the adjustment factor, the total mass of the minus 4.75 mm (No. 4) from the pan, M1, divided by the mass of the reduced split of minus 4.75 mm (No. 4), M2. For consistency, this adjustment factor is carried to three decimal places.
𝐼𝐼 =𝐼𝐼1
𝐼𝐼2
where:
R = minus 4.75 mm (No. 4) adjustment factor
M1 = total mass of minus 4.75 mm (No. 4) before reducing
M2 = mass of the reduced split of minus 4.75 mm (No. 4)
Adjusted Individual Mass Retained (AIMR):
𝐴𝐴𝐼𝐼𝐼𝐼𝐼𝐼 = 𝐼𝐼 × 𝐵𝐵
where:
AIMR = Adjusted Individual Mass Retained
R = minus 4.75 mm (No. 4) adjustment factor
B = individual mass of the size increment in the reduced portion sieved
Adjusted Cumulative Mass Retained (ACMR)
𝐴𝐴𝐶𝐶𝐼𝐼𝐼𝐼 = (𝐼𝐼 × 𝐵𝐵) + 𝐷𝐷
where:
ACMR = Adjusted Cumulative Mass Retained
R = minus 4.75 mm (No. 4) adjustment factor
B = cumulative mass of the size increment in the reduced portion sieved
D = cumulative mass of plus 4.75mm (No. 4) portion of sample
AGGREGATE WAQTC FOP AASTHO T 27 / T 11 (17)
T27_T11_short_17.docx Aggregate 12-14 Pub. October 2017
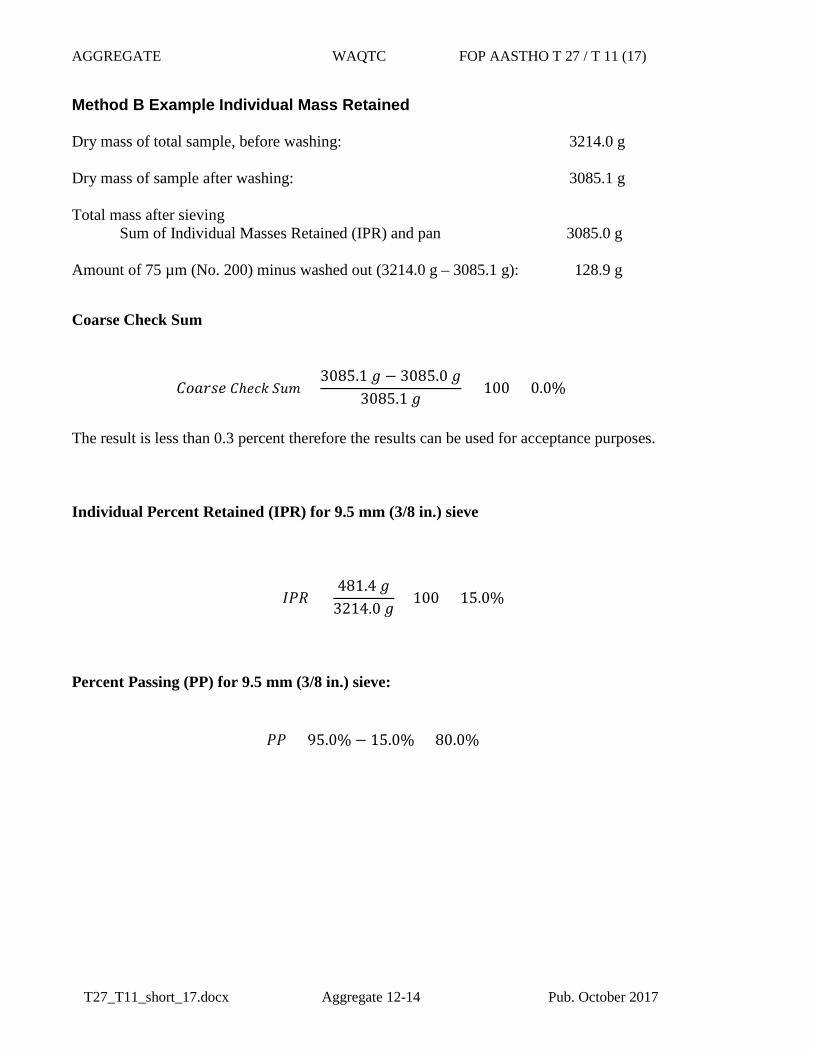
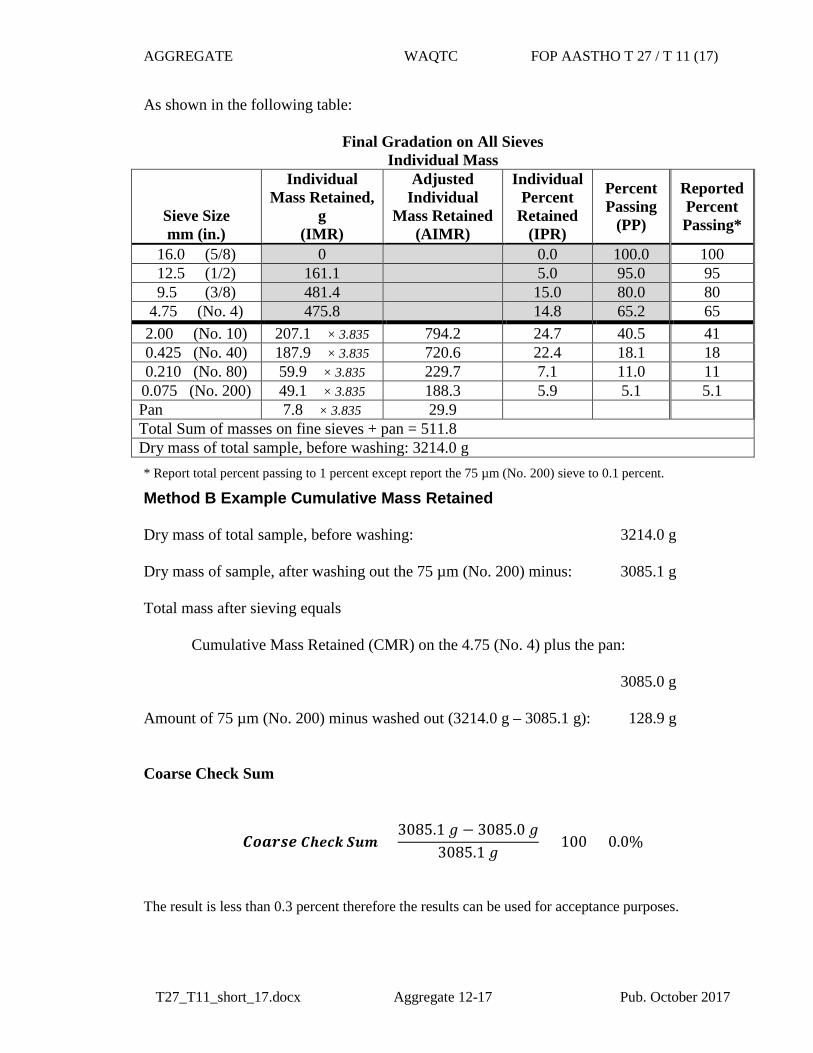
Method B Example Individual Mass Retained
Dry mass of total sample, before washing: 3214.0 g
Dry mass of sample after washing: 3085.1 g
Total mass after sieving Sum of Individual Masses Retained (IPR) and pan 3085.0 g
Amount of 75 µm (No. 200) minus washed out (3214.0 g – 3085.1 g): 128.9 g
Coarse Check Sum
𝐶𝐶𝑏𝑏𝑚𝑚𝑑𝑑𝑚𝑚𝑒𝑒 𝐶𝐶ℎ𝑒𝑒𝑒𝑒𝑒𝑒 𝑆𝑆𝑆𝑆𝑆𝑆 =3085.1 𝑠𝑠 − 3085.0 𝑠𝑠
3085.1 𝑠𝑠 × 100 = 0.0%
The result is less than 0.3 percent therefore the results can be used for acceptance purposes.
Individual Percent Retained (IPR) for 9.5 mm (3/8 in.) sieve
𝐼𝐼𝐼𝐼𝐼𝐼 =481.4 𝑠𝑠
3214.0 𝑠𝑠× 100 = 15.0%
Percent Passing (PP) for 9.5 mm (3/8 in.) sieve:
𝐼𝐼𝐼𝐼 = 95.0% − 15.0% = 80.0%
AGGREGATE WAQTC FOP AASTHO T 27 / T 11 (17)
T27_T11_short_17.docx Aggregate 12-15 Pub. October 2017
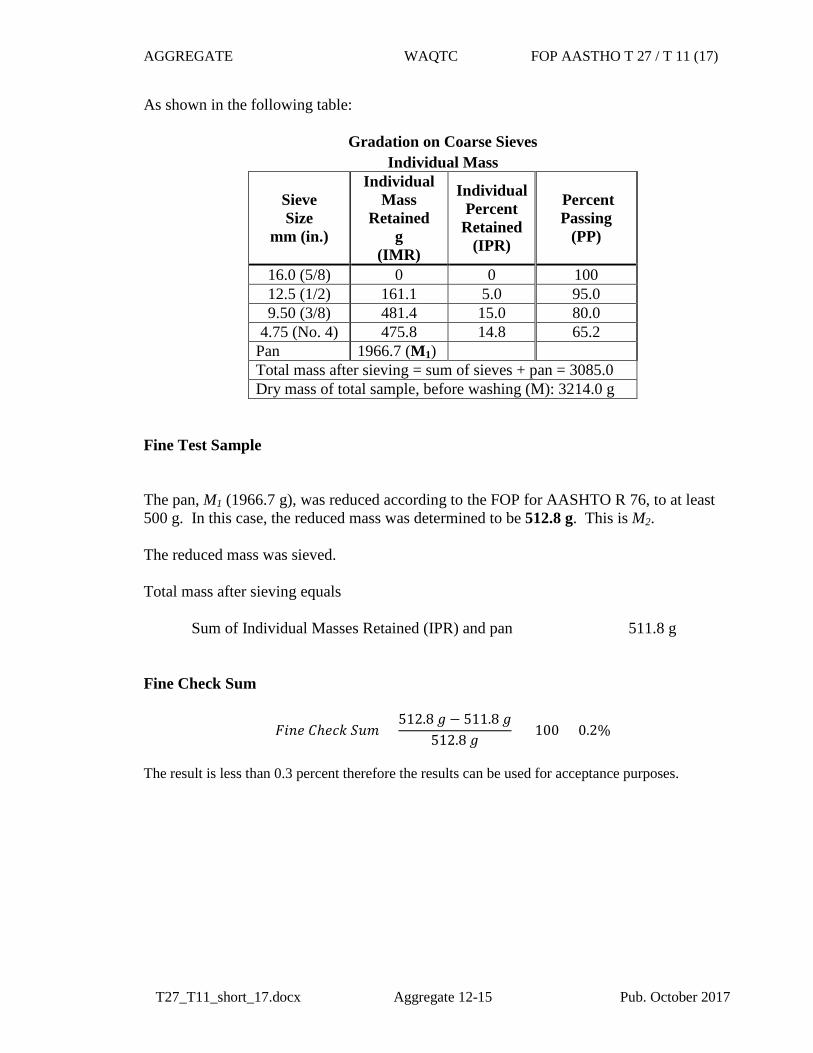
As shown in the following table:
Gradation on Coarse Sieves Individual Mass
Sieve Size
mm (in.)
Individual Mass
Retained g
(IMR)
Individual Percent
Retained (IPR)
Percent Passing
(PP)
16.0 (5/8) 0 0 100 12.5 (1/2) 161.1 5.0 95.0 9.50 (3/8) 481.4 15.0 80.0
4.75 (No. 4) 475.8 14.8 65.2 Pan 1966.7 (M1) Total mass after sieving = sum of sieves + pan = 3085.0 Dry mass of total sample, before washing (M): 3214.0 g
Fine Test Sample
The pan, M1 (1966.7 g), was reduced according to the FOP for AASHTO R 76, to at least 500 g. In this case, the reduced mass was determined to be 512.8 g. This is M2. The reduced mass was sieved. Total mass after sieving equals
Sum of Individual Masses Retained (IPR) and pan 511.8 g Fine Check Sum
𝐹𝐹𝑠𝑠𝑠𝑠𝑒𝑒 𝐶𝐶ℎ𝑒𝑒𝑒𝑒𝑒𝑒 𝑆𝑆𝑆𝑆𝑆𝑆 =512.8 𝑠𝑠 − 511.8 𝑠𝑠
512.8 𝑠𝑠 × 100 = 0.2%
The result is less than 0.3 percent therefore the results can be used for acceptance purposes.
AGGREGATE WAQTC FOP AASTHO T 27 / T 11 (17)
T27_T11_short_17.docx Aggregate 12-16 Pub. October 2017
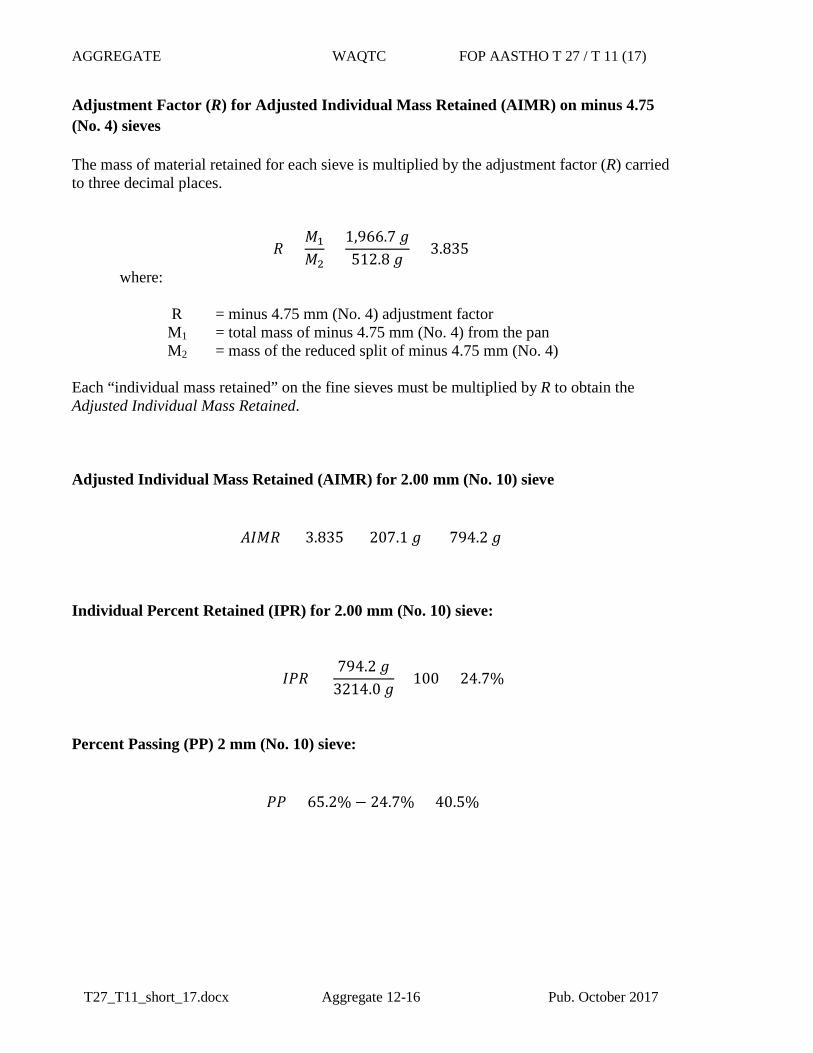
Adjustment Factor (R) for Adjusted Individual Mass Retained (AIMR) on minus 4.75 (No. 4) sieves
The mass of material retained for each sieve is multiplied by the adjustment factor (R) carried to three decimal places.
𝐼𝐼 =𝐼𝐼1
𝐼𝐼2=
1,966.7 𝑠𝑠512.8 𝑠𝑠
= 3.835
where:
R = minus 4.75 mm (No. 4) adjustment factor M1 = total mass of minus 4.75 mm (No. 4) from the pan M2 = mass of the reduced split of minus 4.75 mm (No. 4)
Each “individual mass retained” on the fine sieves must be multiplied by R to obtain the Adjusted Individual Mass Retained.
Adjusted Individual Mass Retained (AIMR) for 2.00 mm (No. 10) sieve
𝐴𝐴𝐼𝐼𝐼𝐼𝐼𝐼 = 3.835 × 207.1 𝑠𝑠 = 794.2 𝑠𝑠
Individual Percent Retained (IPR) for 2.00 mm (No. 10) sieve:
𝐼𝐼𝐼𝐼𝐼𝐼 =794.2 𝑠𝑠
3214.0 𝑠𝑠× 100 = 24.7%
Percent Passing (PP) 2 mm (No. 10) sieve:
𝐼𝐼𝐼𝐼 = 65.2% − 24.7% = 40.5%
AGGREGATE WAQTC FOP AASTHO T 27 / T 11 (17)
T27_T11_short_17.docx Aggregate 12-17 Pub. October 2017
As shown in the following table:
Final Gradation on All Sieves Individual Mass
Sieve Size mm (in.)
Individual Mass Retained,
g (IMR)
Adjusted Individual
Mass Retained (AIMR)
Individual Percent
Retained (IPR)
Percent Passing
(PP)
Reported Percent Passing*
16.0 (5/8) 0 0.0 100.0 100 12.5 (1/2) 161.1 5.0 95.0 95 9.5 (3/8) 481.4 15.0 80.0 80
4.75 (No. 4) 475.8 14.8 65.2 65 2.00 (No. 10) 207.1 × 3.835 794.2 24.7 40.5 41 0.425 (No. 40) 187.9 × 3.835 720.6 22.4 18.1 18 0.210 (No. 80) 59.9 × 3.835 229.7 7.1 11.0 11 0.075 (No. 200) 49.1 × 3.835 188.3 5.9 5.1 5.1 Pan 7.8 × 3.835 29.9 Total Sum of masses on fine sieves + pan = 511.8 Dry mass of total sample, before washing: 3214.0 g * Report total percent passing to 1 percent except report the 75 µm (No. 200) sieve to 0.1 percent.
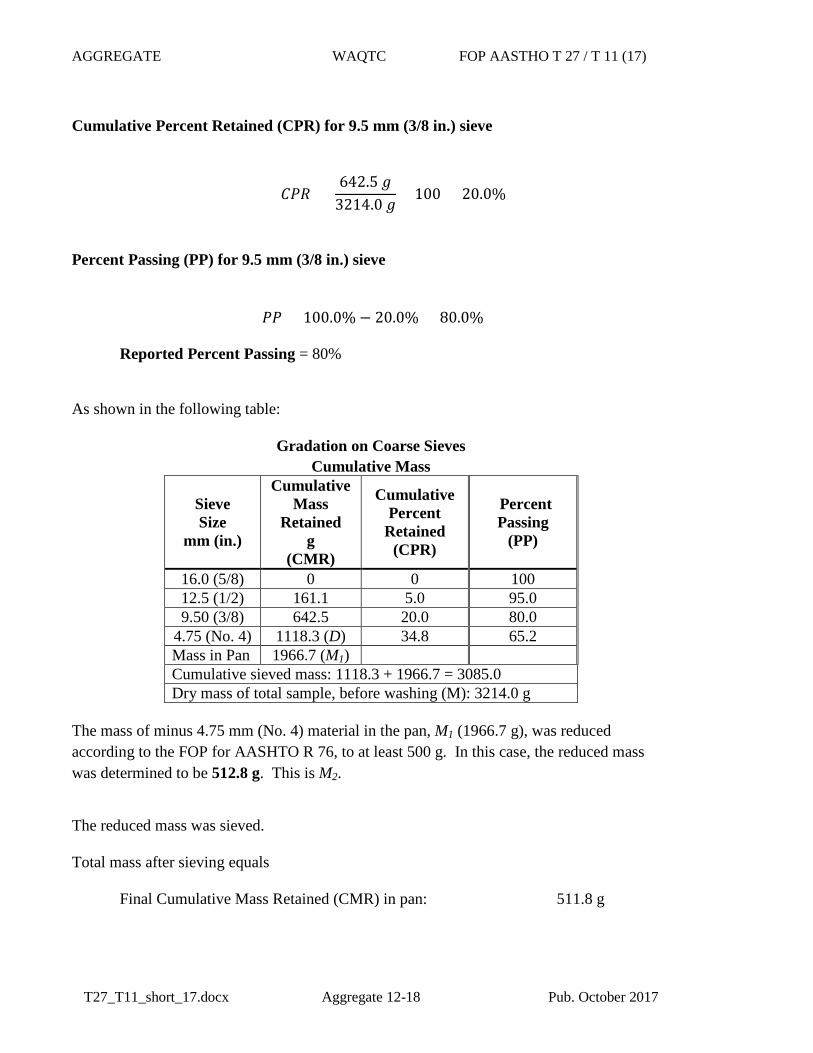
Method B Example Cumulative Mass Retained Dry mass of total sample, before washing: 3214.0 g Dry mass of sample, after washing out the 75 µm (No. 200) minus: 3085.1 g Total mass after sieving equals
Cumulative Mass Retained (CMR) on the 4.75 (No. 4) plus the pan: 3085.0 g
Amount of 75 µm (No. 200) minus washed out (3214.0 g – 3085.1 g): 128.9 g Coarse Check Sum
𝑪𝑪𝑪𝑪𝑪𝑪𝑪𝑪𝑪𝑪𝑪𝑪 𝑪𝑪𝑪𝑪𝑪𝑪𝑪𝑪𝑪𝑪 𝑺𝑺𝑺𝑺𝑺𝑺 =3085.1 𝑠𝑠 − 3085.0 𝑠𝑠
3085.1 𝑠𝑠 × 100 = 0.0%
The result is less than 0.3 percent therefore the results can be used for acceptance purposes.
AGGREGATE WAQTC FOP AASTHO T 27 / T 11 (17)
T27_T11_short_17.docx Aggregate 12-18 Pub. October 2017
Cumulative Percent Retained (CPR) for 9.5 mm (3/8 in.) sieve
𝐶𝐶𝐼𝐼𝐼𝐼 =642.5 𝑠𝑠
3214.0 𝑠𝑠× 100 = 20.0%
Percent Passing (PP) for 9.5 mm (3/8 in.) sieve
𝐼𝐼𝐼𝐼 = 100.0% − 20.0% = 80.0%
Reported Percent Passing = 80%
As shown in the following table:
Gradation on Coarse Sieves Cumulative Mass
Sieve Size
mm (in.)
Cumulative Mass
Retained g
(CMR)
Cumulative Percent
Retained (CPR)
Percent Passing
(PP)
16.0 (5/8) 0 0 100 12.5 (1/2) 161.1 5.0 95.0 9.50 (3/8) 642.5 20.0 80.0
4.75 (No. 4) 1118.3 (D) 34.8 65.2 Mass in Pan 1966.7 (M1) Cumulative sieved mass: 1118.3 + 1966.7 = 3085.0 Dry mass of total sample, before washing (M): 3214.0 g
The mass of minus 4.75 mm (No. 4) material in the pan, M1 (1966.7 g), was reduced according to the FOP for AASHTO R 76, to at least 500 g. In this case, the reduced mass was determined to be 512.8 g. This is M2.
The reduced mass was sieved.
Total mass after sieving equals
Final Cumulative Mass Retained (CMR) in pan: 511.8 g
AGGREGATE WAQTC FOP AASTHO T 27 / T 11 (17)
T27_T11_short_17.docx Aggregate 12-19 Pub. October 2017
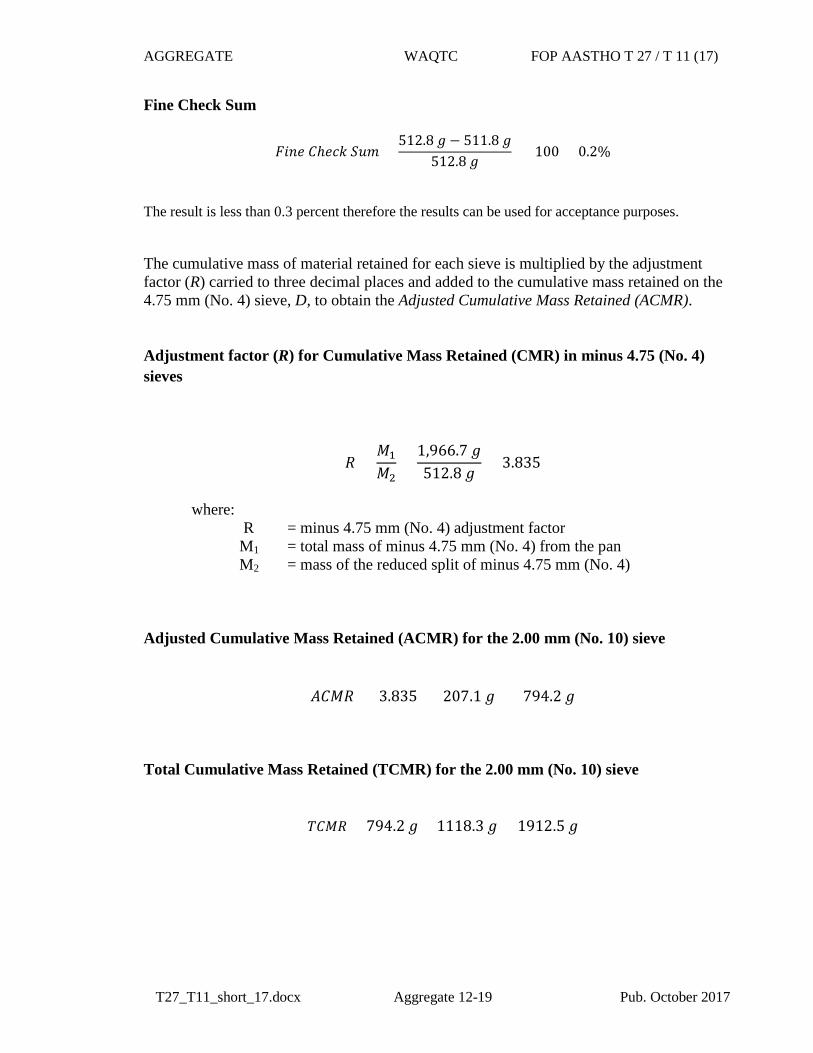
Fine Check Sum
𝐹𝐹𝑠𝑠𝑠𝑠𝑒𝑒 𝐶𝐶ℎ𝑒𝑒𝑒𝑒𝑒𝑒 𝑆𝑆𝑆𝑆𝑆𝑆 =512.8 𝑠𝑠 − 511.8 𝑠𝑠
512.8 𝑠𝑠 × 100 = 0.2%
The result is less than 0.3 percent therefore the results can be used for acceptance purposes.
The cumulative mass of material retained for each sieve is multiplied by the adjustment factor (R) carried to three decimal places and added to the cumulative mass retained on the 4.75 mm (No. 4) sieve, D, to obtain the Adjusted Cumulative Mass Retained (ACMR). Adjustment factor (R) for Cumulative Mass Retained (CMR) in minus 4.75 (No. 4) sieves
𝐼𝐼 =𝐼𝐼1
𝐼𝐼2=
1,966.7 𝑠𝑠512.8 𝑠𝑠
= 3.835
where:
R = minus 4.75 mm (No. 4) adjustment factor M1 = total mass of minus 4.75 mm (No. 4) from the pan M2 = mass of the reduced split of minus 4.75 mm (No. 4)
Adjusted Cumulative Mass Retained (ACMR) for the 2.00 mm (No. 10) sieve
𝐴𝐴𝐶𝐶𝐼𝐼𝐼𝐼 = 3.835 × 207.1 𝑠𝑠 = 794.2 𝑠𝑠 Total Cumulative Mass Retained (TCMR) for the 2.00 mm (No. 10) sieve
𝑇𝑇𝐶𝐶𝐼𝐼𝐼𝐼 = 794.2 𝑠𝑠+ 1118.3 𝑠𝑠 = 1912.5 𝑠𝑠
AGGREGATE WAQTC FOP AASTHO T 27 / T 11 (17)
T27_T11_short_17.docx Aggregate 12-20 Pub. October 2017
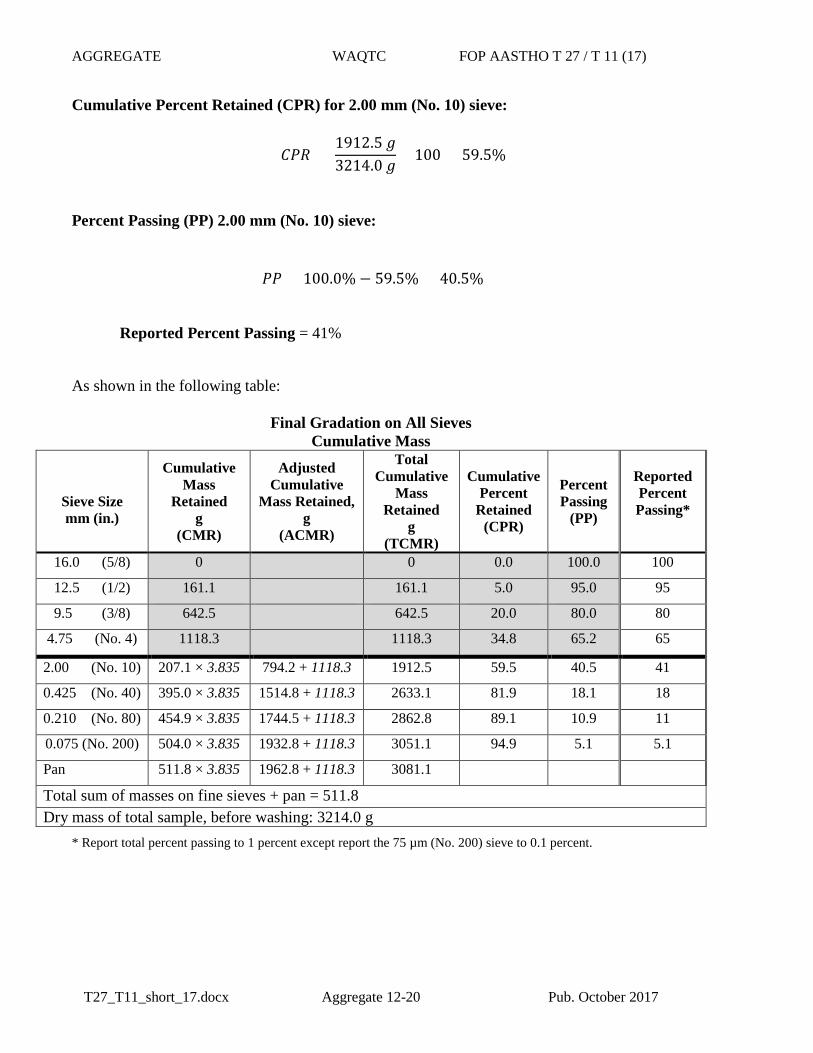
Cumulative Percent Retained (CPR) for 2.00 mm (No. 10) sieve:
𝐶𝐶𝐼𝐼𝐼𝐼 =1912.5 𝑠𝑠3214.0 𝑠𝑠
× 100 = 59.5%
Percent Passing (PP) 2.00 mm (No. 10) sieve:
𝐼𝐼𝐼𝐼 = 100.0% − 59.5% = 40.5%
Reported Percent Passing = 41%
As shown in the following table:
Final Gradation on All Sieves Cumulative Mass
Sieve Size mm (in.)
Cumulative Mass
Retained g
(CMR)
Adjusted Cumulative
Mass Retained, g
(ACMR)
Total Cumulative
Mass Retained
g (TCMR)
Cumulative Percent
Retained (CPR)
Percent Passing
(PP)
Reported Percent Passing*
16.0 (5/8) 0 0 0.0 100.0 100
12.5 (1/2) 161.1 161.1 5.0 95.0 95
9.5 (3/8) 642.5 642.5 20.0 80.0 80
4.75 (No. 4) 1118.3 1118.3 34.8 65.2 65
2.00 (No. 10) 207.1 × 3.835 794.2 + 1118.3 1912.5 59.5 40.5 41
0.425 (No. 40) 395.0 × 3.835 1514.8 + 1118.3 2633.1 81.9 18.1 18
0.210 (No. 80) 454.9 × 3.835 1744.5 + 1118.3 2862.8 89.1 10.9 11
0.075 (No. 200) 504.0 × 3.835 1932.8 + 1118.3 3051.1 94.9 5.1 5.1
Pan 511.8 × 3.835 1962.8 + 1118.3 3081.1
Total sum of masses on fine sieves + pan = 511.8 Dry mass of total sample, before washing: 3214.0 g
* Report total percent passing to 1 percent except report the 75 µm (No. 200) sieve to 0.1 percent.
AGGREGATE WAQTC FOP AASTHO T 27 / T 11 (17)
T27_T11_short_17.docx Aggregate 12-21 Pub. October 2017
Procedure Method C 1. Dry the test sample to constant mass according to the FOP for AASHTO T 255. Cool to
room temperature. Determine and record the total dry mass of the sample to the nearest 0.1 percent or 0.1 g. Designate this mass as M.
2. Break up any aggregations or lumps of clay, silt or adhering fines to pass the 4.75 mm
(No. 4) sieve. 3. Select sieves required by the specification and those necessary to avoid overloading.
With a pan on bottom, nest the sieves increasing in size starting with the 4.75 mm (No. 4) sieve.
4. Place the sample, or a portion of the sample, on the top sieve. Sieves may already be in
the mechanical shaker, if not place the sieves in the mechanical shaker and shake for the minimum time determined to provide complete separation for the sieve shaker being used (approximately 10 minutes, the time determined by Annex A). Note 3: Excessive shaking (more than 10 minutes) may result in degradation of the sample.
5. Determine and record the cumulative mass retained for each sieve. Ensure that all material trapped in full openings of the sieve are removed and included in the mass retained. Note 4: For sieves 4.75 mm (No. 4) and larger, check material trapped in less than a full opening sieving
over a full opening. Use coarse wire brushes to clean the 600 µm (No. 30) and larger sieves, and soft bristle brush for smaller sieves.
6. Determine and record the mass of the minus 4.75 mm (No. 4) material in the pan. Designate this mass as M1.
7. Perform the Coarse Check Sum calculation –Verify the total mass after coarse sieving agrees with the dry mass before sieving (M) within 0.3 percent.
8. Reduce the minus 4.75 mm (No. 4) according to the FOP for AASHTO R 76, to produce a sample with a minimum mass of 500 g.
9. Determine and record the mass of the minus 4.75 mm (No. 4) split, designate this mass as
M3. 10. Nest a protective sieve, such as a 2.0 mm (No. 10), above the 75 µm (No. 200) sieve.
11. Place the test sample in a container and cover with water.
Note 1: A detergent, dispersing agent, or other wetting solution may be added to the water to assure a thorough separation of the material finer than the 75 µm (No. 200) sieve from the coarser particles. There should be enough wetting agent to produce a small amount of suds when the sample is agitated. Excessive suds may overflow the sieves and carry material away with them.
12. Agitate vigorously to ensure complete separation of the material finer than 75 µm (No. 200) from coarser particles and bring the fine material into suspension above the
AGGREGATE WAQTC FOP AASTHO T 27 / T 11 (17)
T27_T11_short_17.docx Aggregate 12-22 Pub. October 2017
coarser material. Avoid degradation of the sample when using a mechanical washing device.
13. Immediately pour the wash water containing the suspended material over the nestedsieves; be careful not to pour out the coarser particles or over fill the 75 µm (No. 200)sieve.
14. Add water to cover material remaining in the container, agitate, and repeat Step 12.Repeat until the wash water is reasonably clear.
15. Remove the upper sieve and return material retained to the washed test sample.
16. Rinse the material retained on the 75 µm (No. 200) sieve until water passing through thesieve is reasonably clear and detergent or dispersing agent is removed, if used.
17. Return all material retained on the 75 µm (No. 200) sieve to the container by flushinginto the washed sample.Note 2: Excess water may be carefully removed with a bulb syringe; the removed water must be discharged
back over the 75 µm (No. 200) sieve to prevent loss of fines.
18. Dry the washed test sample to constant mass according to the FOP for AASHTO T 255.Cool to room temperature. Determine and record the dry mass, designate this mass asdry mass before sieving.
19. Select sieves required by the specification and those necessary to avoid overloading.With a pan on bottom, nest the sieves increasing in size starting with the 75 µm (No. 200)sieve up to, but not including, the 4.75 mm (No. 4) sieve.
20. Place the sample on the top sieve. Place the sieves in the mechanical shaker and shakefor the minimum time determined to provide complete separation for the sieve shakerbeing used (approximately 10 minutes, the time determined by Annex A).Note 3: Excessive shaking (more than 10 minutes) may result in degradation of the sample.
21. Determine and record the cumulative mass retained for each sieve. Ensure that allmaterial trapped in full openings of the sieve are removed and included in the massretained.Note 4: For sieves 4.75 mm (No. 4) and larger, check material trapped in less than a full opening by sieving
over a full opening. Use coarse wire brushes to clean the 600 µm (No. 30) and larger sieves, and soft bristle brushes for smaller sieves.
22. Perform the Fine Check Sum calculation – Verify the total mass after fine sieving agreeswith the dry mass before sieving within 0.3 percent. Do not use test results foracceptance if the Check Sum is greater than 0.3 percent.
23. Calculate the Cumulative Percent Retained (CPR) and Percent Passing (PP) for the 4.75mm (No. 4) and larger.
AGGREGATE WAQTC FOP AASTHO T 27 / T 11 (17)
T27_T11_short_17.docx Aggregate 12-23 Pub. October 2017
24. Calculate the Cumulative Percent Retained (CPR-#4) and the Percent Passing (PP-#4) forminus 4.75 mm (No. 4) split and Percent Passing (PP) for the minus 4.75 mm (No. 4).
25. Report total percent passing to 1 percent except report the 75 µm (No. 200) sieve to0.1 percent.
Method C Calculations
Check Sum
𝐶𝐶𝑏𝑏𝑚𝑚𝑑𝑑𝑚𝑚𝑒𝑒 𝑒𝑒ℎ𝑒𝑒𝑒𝑒𝑒𝑒 𝑚𝑚𝑆𝑆𝑆𝑆 =𝐼𝐼− 𝑡𝑡𝑏𝑏𝑡𝑡𝑚𝑚𝑡𝑡 𝑆𝑆𝑚𝑚𝑚𝑚𝑚𝑚 𝑚𝑚𝑏𝑏𝑡𝑡𝑒𝑒𝑑𝑑 𝑒𝑒𝑏𝑏𝑚𝑚𝑑𝑑𝑚𝑚𝑒𝑒 𝑚𝑚𝑠𝑠𝑒𝑒𝑠𝑠𝑠𝑠𝑠𝑠𝑠𝑠
𝐼𝐼 × 100
𝐹𝐹𝑠𝑠𝑠𝑠𝑒𝑒 𝑒𝑒ℎ𝑒𝑒𝑒𝑒𝑒𝑒 𝑚𝑚𝑆𝑆𝑆𝑆 =𝑑𝑑𝑑𝑑𝑑𝑑 𝑆𝑆𝑚𝑚𝑚𝑚𝑚𝑚 𝑏𝑏𝑒𝑒𝑏𝑏𝑏𝑏𝑑𝑑𝑒𝑒 𝑚𝑚𝑠𝑠𝑒𝑒𝑠𝑠𝑠𝑠𝑠𝑠𝑠𝑠 − 𝑡𝑡𝑏𝑏𝑡𝑡𝑚𝑚𝑡𝑡 𝑆𝑆𝑚𝑚𝑚𝑚𝑚𝑚 𝑚𝑚𝑏𝑏𝑡𝑡𝑒𝑒𝑑𝑑 𝑏𝑏𝑠𝑠𝑠𝑠𝑒𝑒 𝑚𝑚𝑠𝑠𝑒𝑒𝑠𝑠𝑠𝑠𝑠𝑠𝑠𝑠
𝑑𝑑𝑑𝑑𝑑𝑑 𝑆𝑆𝑚𝑚𝑚𝑚𝑚𝑚 𝑏𝑏𝑒𝑒𝑏𝑏𝑏𝑏𝑑𝑑𝑒𝑒 𝑚𝑚𝑠𝑠𝑒𝑒𝑠𝑠𝑠𝑠𝑠𝑠𝑠𝑠 × 100
where:
M = Total dry sample mass before washing
Cumulative Percent Retained (CPR) for 4.75 mm (No. 4) sieve and larger
𝐶𝐶𝐼𝐼𝐼𝐼 =𝐶𝐶𝐼𝐼𝐼𝐼𝐼𝐼
× 100
where:
CPR = Cumulative Percent Retained of the size increment for the total sample
CMR = Cumulative Mass Retained of the size increment for the total sample
M = Total dry sample mass before washing
Percent Passing (PP) 4.75 mm (No. 4) sieve and larger
𝐼𝐼𝐼𝐼 = 100 − 𝐶𝐶𝐼𝐼𝐼𝐼
where:
PP = Percent Passing of the size increment for the total sample
CPR = Cumulative Percent Retained of the size increment for the total sample
AGGREGATE WAQTC FOP AASTHO T 27 / T 11 (17)
T27_T11_short_17.docx Aggregate 12-24 Pub. October 2017
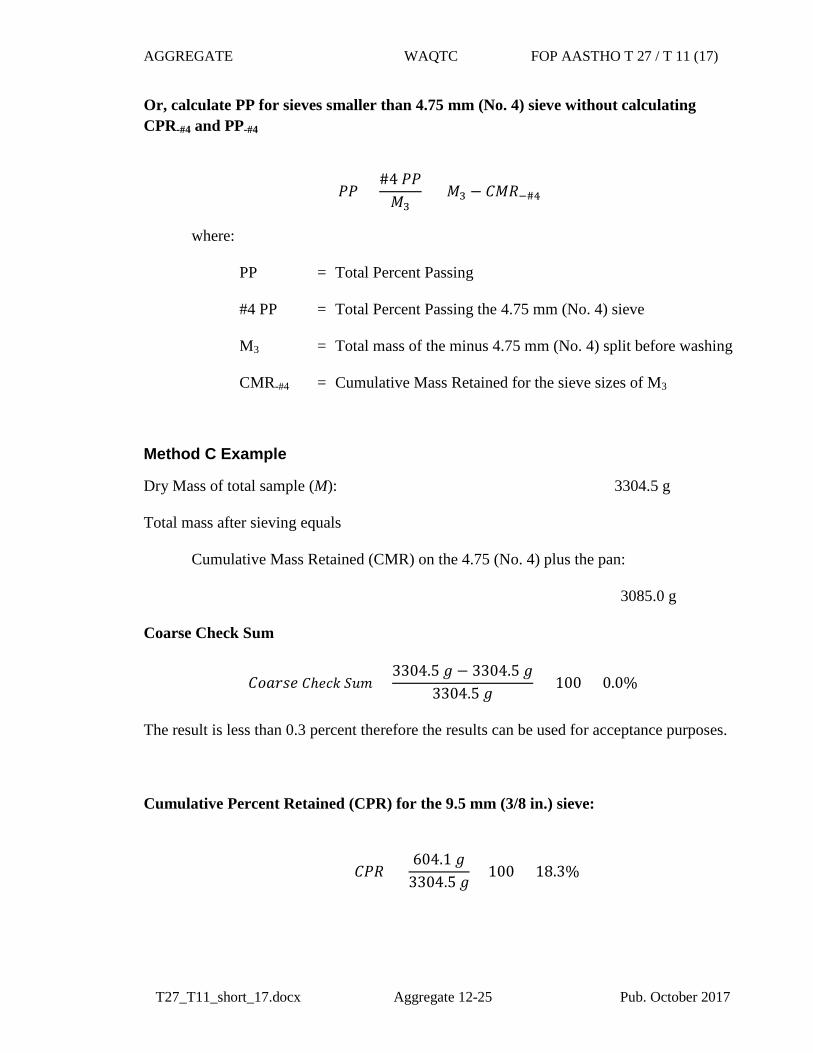
Or, calculate PP for sieves larger than 4.75 mm (No. 4) sieve without calculating CPR
𝐼𝐼 − 𝐶𝐶𝐼𝐼𝐼𝐼𝐼𝐼
× 100
Cumulative Percent Retained (CPR-#4) for minus 4.75 mm (No. 4) split
𝐶𝐶𝐼𝐼𝐼𝐼−#4 = 𝐶𝐶𝐼𝐼𝐼𝐼−#4
𝐼𝐼3 × 100
where:
CPR-#4 = Cumulative Percent Retained for the sieve sizes of M3 CMR-#4 = Cumulative Mass Retained for the sieve sizes of M3 M3 = Total mass of the minus 4.75 mm (No. 4) split before washing
Percent Passing (PP-#4) for minus 4.75 mm (No. 4) split
𝐼𝐼𝐼𝐼−#4 = 100 − 𝐶𝐶𝐼𝐼𝐼𝐼−#4
where:
PP-#4 = Percent Passing for the sieve sizes of M3 CPR-#4 = Cumulative Percent Retained for the sieve sizes of M3
Percent Passing (PP) for sieves smaller than 4.75 mm (No. 4) sieve
𝐼𝐼𝐼𝐼 =(𝐼𝐼𝐼𝐼−#4 × #4 𝐼𝐼𝐼𝐼)
100
where:
PP = Total Percent Passing PP-#4 = Percent Passing for the sieve sizes of M3 #4 PP = Total Percent Passing the 4.75 mm (No. 4) sieve
AGGREGATE WAQTC FOP AASTHO T 27 / T 11 (17)
T27_T11_short_17.docx Aggregate 12-25 Pub. October 2017
Or, calculate PP for sieves smaller than 4.75 mm (No. 4) sieve without calculating CPR-#4 and PP-#4
𝐼𝐼𝐼𝐼 =#4 𝐼𝐼𝐼𝐼𝐼𝐼3
× (𝐼𝐼3 − 𝐶𝐶𝐼𝐼𝐼𝐼−#4)
where:
PP = Total Percent Passing
#4 PP = Total Percent Passing the 4.75 mm (No. 4) sieve
M3 = Total mass of the minus 4.75 mm (No. 4) split before washing
CMR-#4 = Cumulative Mass Retained for the sieve sizes of M3
Method C Example
Dry Mass of total sample (M): 3304.5 g
Total mass after sieving equals
Cumulative Mass Retained (CMR) on the 4.75 (No. 4) plus the pan:
3085.0 g
Coarse Check Sum
𝐶𝐶𝑏𝑏𝑚𝑚𝑑𝑑𝑚𝑚𝑒𝑒 𝐶𝐶ℎ𝑒𝑒𝑒𝑒𝑒𝑒 𝑆𝑆𝑆𝑆𝑆𝑆 =3304.5 𝑠𝑠 − 3304.5 𝑠𝑠
3304.5 𝑠𝑠 × 100 = 0.0%
The result is less than 0.3 percent therefore the results can be used for acceptance purposes.
Cumulative Percent Retained (CPR) for the 9.5 mm (3/8 in.) sieve:
𝐶𝐶𝐼𝐼𝐼𝐼 = 604.1 𝑠𝑠
3304.5 𝑠𝑠× 100 = 18.3%
AGGREGATE WAQTC FOP AASTHO T 27 / T 11 (17)
T27_T11_short_17.docx Aggregate 12-26 Pub. October 2017
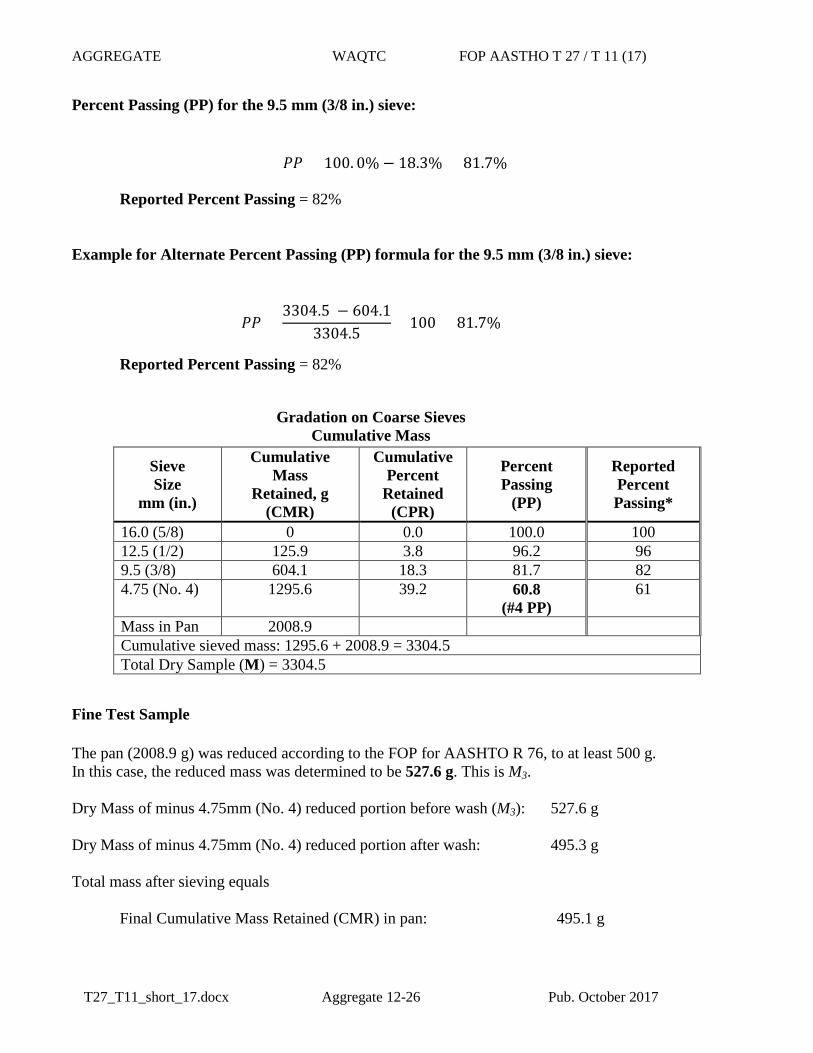
Percent Passing (PP) for the 9.5 mm (3/8 in.) sieve:
𝐼𝐼𝐼𝐼 = 100. 0% − 18.3% = 81.7%
Reported Percent Passing = 82%
Example for Alternate Percent Passing (PP) formula for the 9.5 mm (3/8 in.) sieve:
𝐼𝐼𝐼𝐼 =3304.5 − 604.1
3304.5× 100 = 81.7%
Reported Percent Passing = 82%
Gradation on Coarse Sieves
Cumulative Mass
Sieve Size
mm (in.)
Cumulative Mass
Retained, g (CMR)
Cumulative Percent
Retained (CPR)
Percent Passing
(PP)
Reported Percent Passing*
16.0 (5/8) 0 0.0 100.0 100 12.5 (1/2) 125.9 3.8 96.2 96 9.5 (3/8) 604.1 18.3 81.7 82 4.75 (No. 4) 1295.6 39.2 60.8
(#4 PP) 61
Mass in Pan 2008.9 Cumulative sieved mass: 1295.6 + 2008.9 = 3304.5 Total Dry Sample (M) = 3304.5
Fine Test Sample The pan (2008.9 g) was reduced according to the FOP for AASHTO R 76, to at least 500 g. In this case, the reduced mass was determined to be 527.6 g. This is M3. Dry Mass of minus 4.75mm (No. 4) reduced portion before wash (M3): 527.6 g Dry Mass of minus 4.75mm (No. 4) reduced portion after wash: 495.3 g Total mass after sieving equals
Final Cumulative Mass Retained (CMR) in pan: 495.1 g
AGGREGATE WAQTC FOP AASTHO T 27 / T 11 (17)
T27_T11_short_17.docx Aggregate 12-27 Pub. October 2017
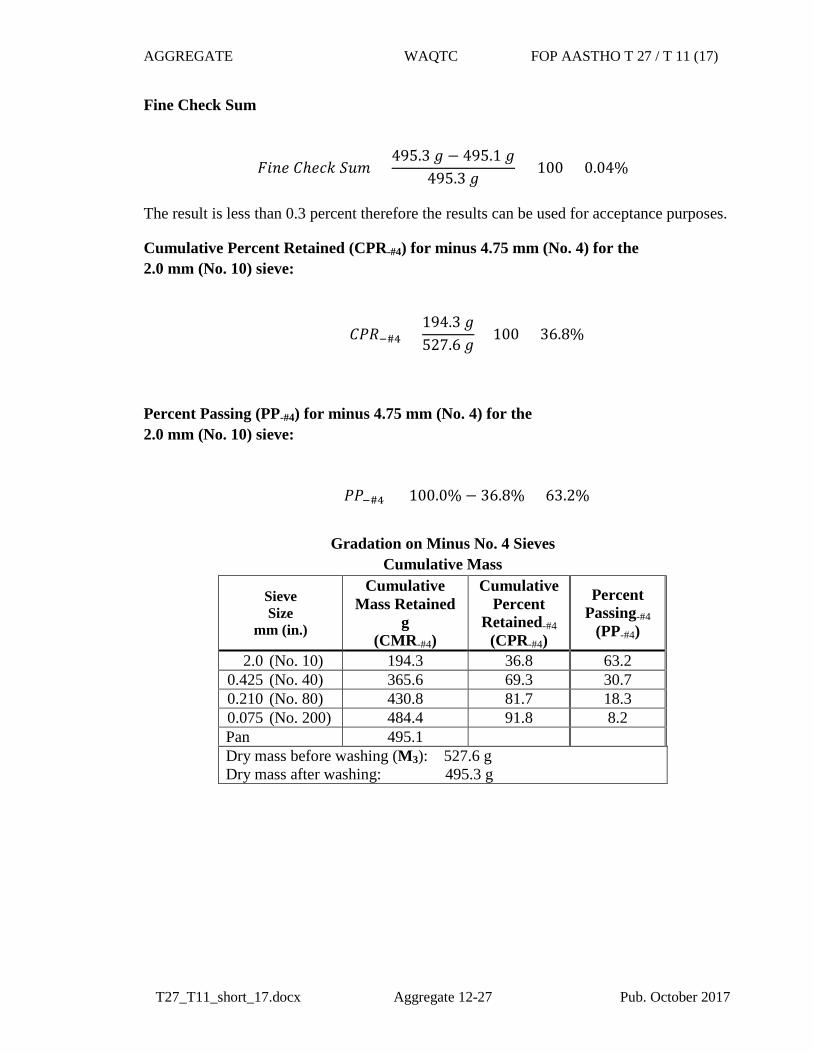
Fine Check Sum
𝐹𝐹𝑠𝑠𝑠𝑠𝑒𝑒 𝐶𝐶ℎ𝑒𝑒𝑒𝑒𝑒𝑒 𝑆𝑆𝑆𝑆𝑆𝑆 =495.3 𝑠𝑠 − 495.1 𝑠𝑠
495.3 𝑠𝑠 × 100 = 0.04%
The result is less than 0.3 percent therefore the results can be used for acceptance purposes.
Cumulative Percent Retained (CPR-#4) for minus 4.75 mm (No. 4) for the 2.0 mm (No. 10) sieve:
𝐶𝐶𝐼𝐼𝐼𝐼−#4 =194.3 𝑠𝑠527.6 𝑠𝑠
× 100 = 36.8%
Percent Passing (PP-#4) for minus 4.75 mm (No. 4) for the 2.0 mm (No. 10) sieve:
𝐼𝐼𝐼𝐼−#4 = 100.0% − 36.8% = 63.2%
Gradation on Minus No. 4 Sieves Cumulative Mass
Sieve Size
mm (in.)
Cumulative Mass Retained
g (CMR-#4)
Cumulative Percent
Retained-#4 (CPR-#4)
Percent Passing-#4
(PP-#4)
2.0 (No. 10) 194.3 36.8 63.2 0.425 (No. 40) 365.6 69.3 30.7 0.210 (No. 80) 430.8 81.7 18.3 0.075 (No. 200) 484.4 91.8 8.2 Pan 495.1 Dry mass before washing (M3): 527.6 g Dry mass after washing: 495.3 g
AGGREGATE WAQTC FOP AASTHO T 27 / T 11 (17)
T27_T11_short_17.docx Aggregate 12-28 Pub. October 2017
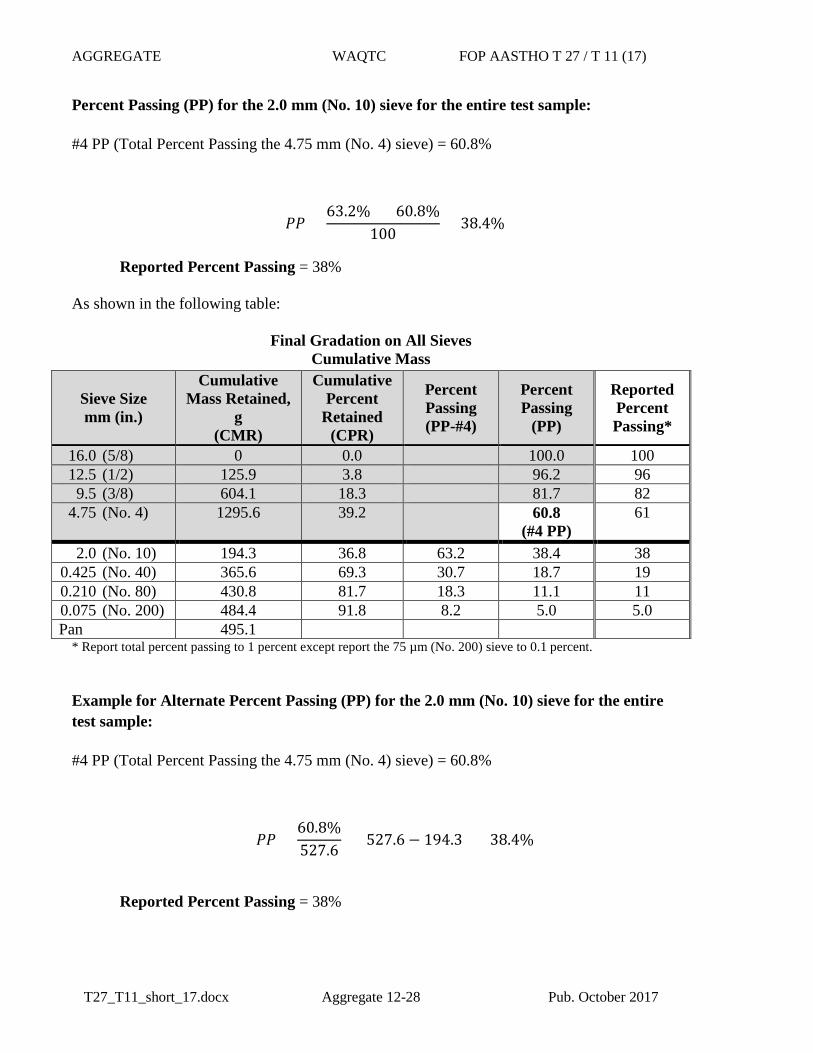
Percent Passing (PP) for the 2.0 mm (No. 10) sieve for the entire test sample:
#4 PP (Total Percent Passing the 4.75 mm (No. 4) sieve) = 60.8%
𝐼𝐼𝐼𝐼 =63.2% × 60.8%
100= 38.4%
Reported Percent Passing = 38%
As shown in the following table:
Final Gradation on All Sieves Cumulative Mass
Sieve Size mm (in.)
Cumulative Mass Retained,
g (CMR)
Cumulative Percent
Retained (CPR)
Percent Passing (PP-#4)
Percent Passing
(PP)
Reported Percent Passing*
16.0 (5/8) 0 0.0 100.0 100 12.5 (1/2) 125.9 3.8 96.2 96 9.5 (3/8) 604.1 18.3 81.7 82
4.75 (No. 4) 1295.6 39.2 60.8 (#4 PP)
61
2.0 (No. 10) 194.3 36.8 63.2 38.4 38 0.425 (No. 40) 365.6 69.3 30.7 18.7 19 0.210 (No. 80) 430.8 81.7 18.3 11.1 11 0.075 (No. 200) 484.4 91.8 8.2 5.0 5.0 Pan 495.1
* Report total percent passing to 1 percent except report the 75 µm (No. 200) sieve to 0.1 percent.
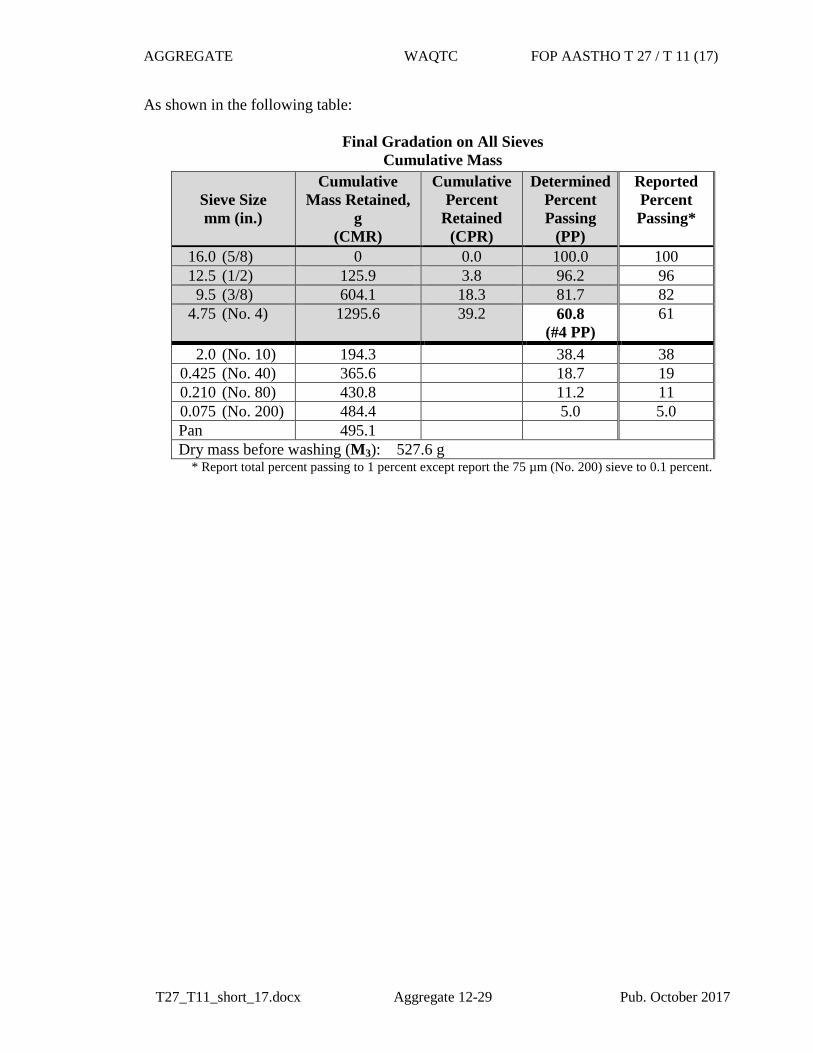
Example for Alternate Percent Passing (PP) for the 2.0 mm (No. 10) sieve for the entire test sample:
#4 PP (Total Percent Passing the 4.75 mm (No. 4) sieve) = 60.8%
𝐼𝐼𝐼𝐼 =60.8%527.6
× (527.6 − 194.3) = 38.4%
Reported Percent Passing = 38%
AGGREGATE WAQTC FOP AASTHO T 27 / T 11 (17)
T27_T11_short_17.docx Aggregate 12-29 Pub. October 2017
As shown in the following table:
Final Gradation on All Sieves Cumulative Mass
Sieve Size mm (in.)
Cumulative Mass Retained,
g (CMR)
Cumulative Percent
Retained (CPR)
Determined Percent Passing
(PP)
Reported Percent Passing*
16.0 (5/8) 0 0.0 100.0 100 12.5 (1/2) 125.9 3.8 96.2 96 9.5 (3/8) 604.1 18.3 81.7 82
4.75 (No. 4) 1295.6 39.2 60.8 (#4 PP)
61
2.0 (No. 10) 194.3 38.4 38 0.425 (No. 40) 365.6 18.7 19 0.210 (No. 80) 430.8 11.2 11 0.075 (No. 200) 484.4 5.0 5.0 Pan 495.1 Dry mass before washing (M3): 527.6 g
* Report total percent passing to 1 percent except report the 75 µm (No. 200) sieve to 0.1 percent.
AGGREGATE WAQTC FOP AASTHO T 27 / T 11 (17)
T27_T11_short_17.docx Aggregate 12-30 Pub. October 2017
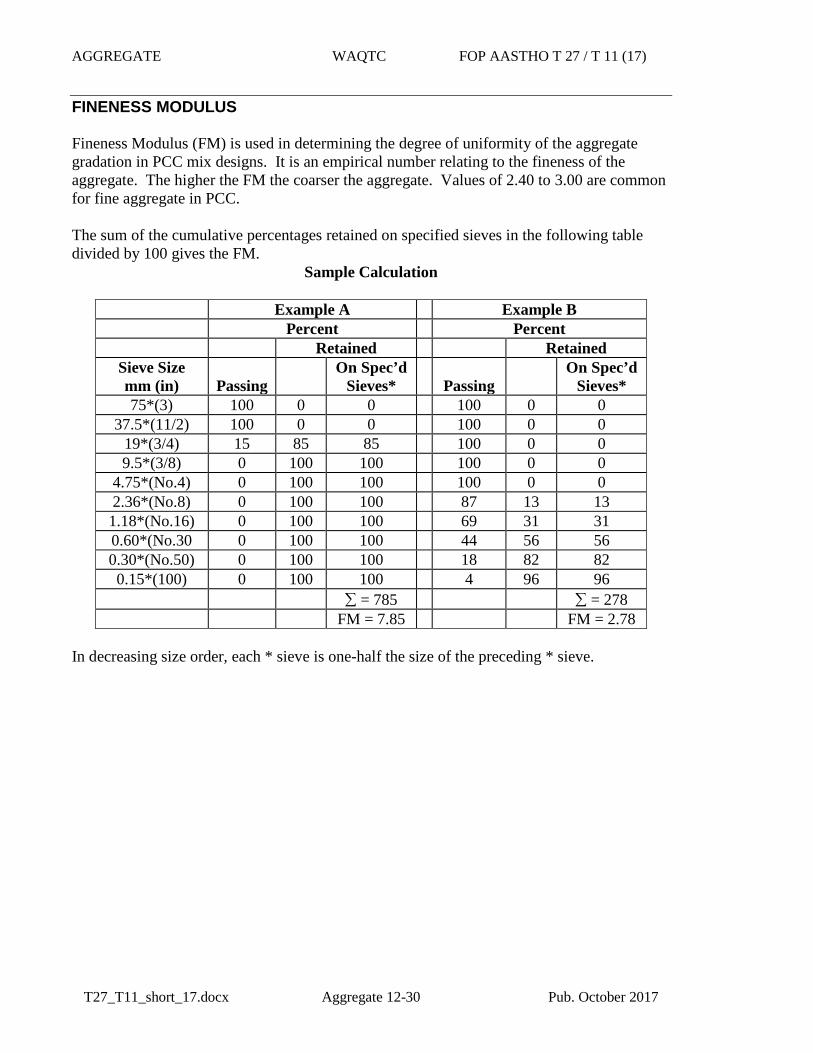
FINENESS MODULUS Fineness Modulus (FM) is used in determining the degree of uniformity of the aggregate gradation in PCC mix designs. It is an empirical number relating to the fineness of the aggregate. The higher the FM the coarser the aggregate. Values of 2.40 to 3.00 are common for fine aggregate in PCC. The sum of the cumulative percentages retained on specified sieves in the following table divided by 100 gives the FM.
Sample Calculation
Example A Example B Percent Percent Retained Retained
Sieve Size mm (in)
Passing
On Spec’d Sieves*
Passing
On Spec’d Sieves*
75*(3) 100 0 0 100 0 0 37.5*(11/2) 100 0 0 100 0 0
19*(3/4) 15 85 85 100 0 0 9.5*(3/8) 0 100 100 100 0 0
4.75*(No.4) 0 100 100 100 0 0 2.36*(No.8) 0 100 100 87 13 13 1.18*(No.16) 0 100 100 69 31 31 0.60*(No.30 0 100 100 44 56 56 0.30*(No.50) 0 100 100 18 82 82 0.15*(100) 0 100 100 4 96 96
∑ = 785 ∑ = 278 FM = 7.85 FM = 2.78
In decreasing size order, each * sieve is one-half the size of the preceding * sieve.
AGGREGATE WAQTC FOP AASTHO T 27 / T 11 (17)
T27_T11_short_17.docx Aggregate 12-31 Pub. October 2017
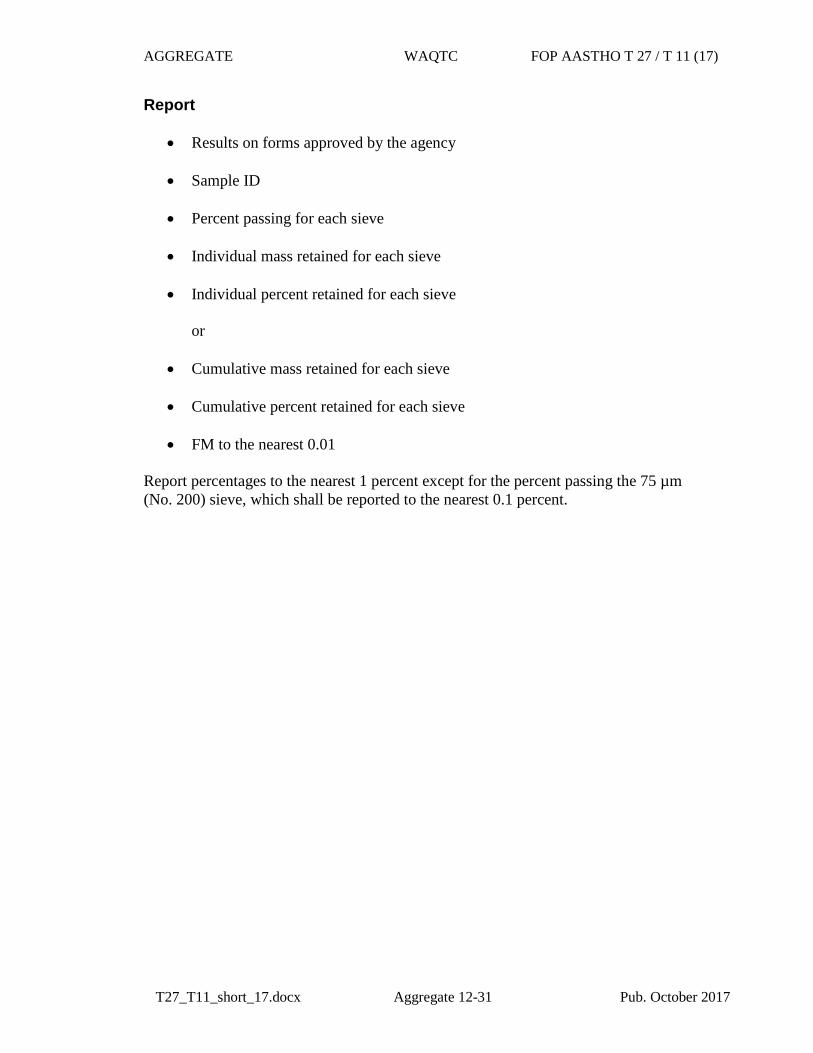
Report
• Results on forms approved by the agency
• Sample ID
• Percent passing for each sieve
• Individual mass retained for each sieve
• Individual percent retained for each sieve
or
• Cumulative mass retained for each sieve
• Cumulative percent retained for each sieve
• FM to the nearest 0.01
Report percentages to the nearest 1 percent except for the percent passing the 75 µm (No. 200) sieve, which shall be reported to the nearest 0.1 percent.
AGGREGATE WAQTC FOP AASTHO T 27 / T 11 (17)
T27_T11_short_17.docx Aggregate 12-32 Pub. October 2017
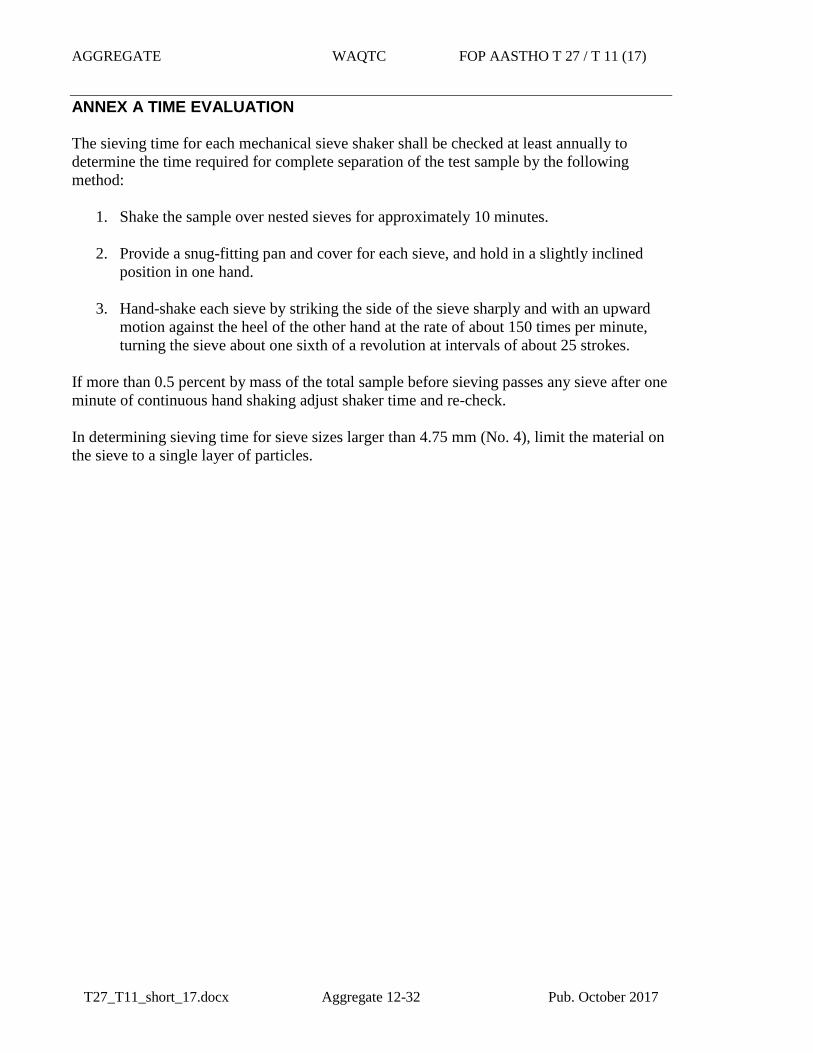
ANNEX A TIME EVALUATION
The sieving time for each mechanical sieve shaker shall be checked at least annually to determine the time required for complete separation of the test sample by the following method:
1. Shake the sample over nested sieves for approximately 10 minutes.
2. Provide a snug-fitting pan and cover for each sieve, and hold in a slightly inclinedposition in one hand.
3. Hand-shake each sieve by striking the side of the sieve sharply and with an upwardmotion against the heel of the other hand at the rate of about 150 times per minute,turning the sieve about one sixth of a revolution at intervals of about 25 strokes.
If more than 0.5 percent by mass of the total sample before sieving passes any sieve after one minute of continuous hand shaking adjust shaker time and re-check.
In determining sieving time for sieve sizes larger than 4.75 mm (No. 4), limit the material on the sieve to a single layer of particles.
AGGREGATE WAQTC FOP AASTHO T 27 / T 11 (17)
T27_T11_short_17.docx Aggregate 12-33 Pub. October 2017
ANNEX B OVERLOAD DETERMINATION
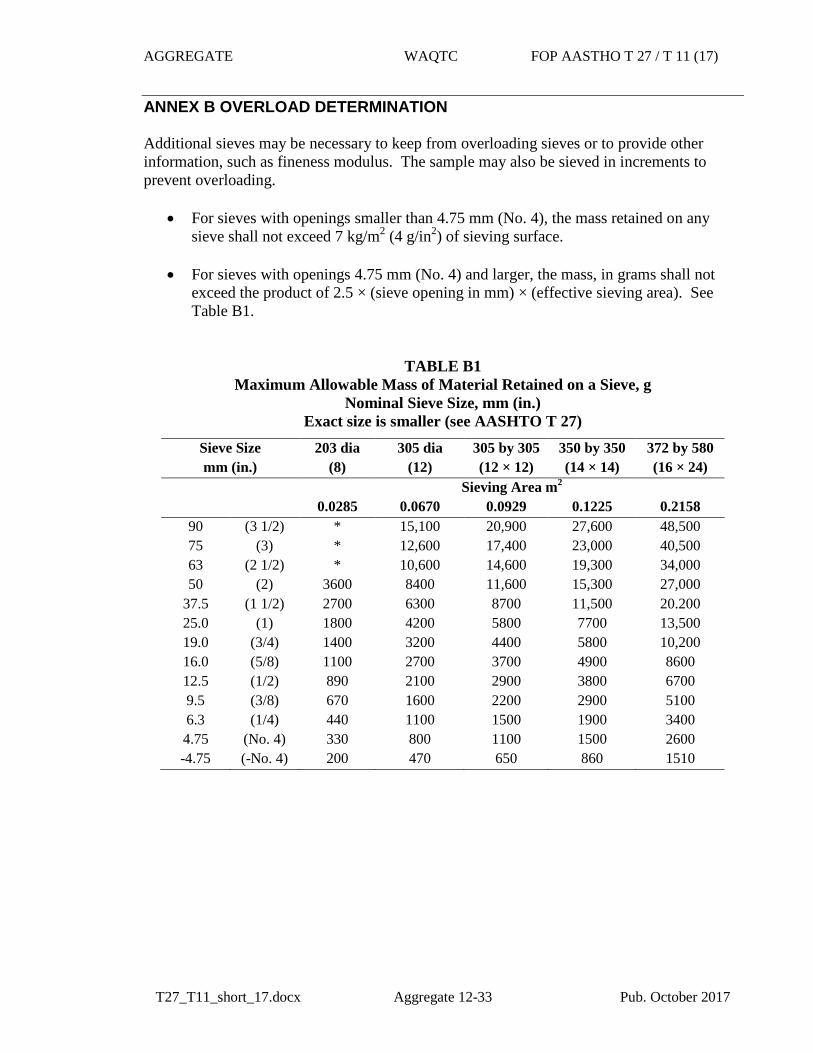
Additional sieves may be necessary to keep from overloading sieves or to provide other information, such as fineness modulus. The sample may also be sieved in increments to prevent overloading.
• For sieves with openings smaller than 4.75 mm (No. 4), the mass retained on anysieve shall not exceed 7 kg/m2 (4 g/in2) of sieving surface.
• For sieves with openings 4.75 mm (No. 4) and larger, the mass, in grams shall notexceed the product of 2.5 × (sieve opening in mm) × (effective sieving area). SeeTable B1.
TABLE B1 Maximum Allowable Mass of Material Retained on a Sieve, g
Nominal Sieve Size, mm (in.) Exact size is smaller (see AASHTO T 27)
Sieve Size mm (in.)
203 dia (8)
305 dia (12)
305 by 305 (12 × 12)
350 by 350 (14 × 14)
372 by 580 (16 × 24)
Sieving Area m2 0.0285 0.0670 0.0929 0.1225 0.2158
90 (3 1/2) * 15,100 20,900 27,600 48,500 75 (3) * 12,600 17,400 23,000 40,500 63 (2 1/2) * 10,600 14,600 19,300 34,000 50 (2) 3600 8400 11,600 15,300 27,000
37.5 (1 1/2) 2700 6300 8700 11,500 20.200 25.0 (1) 1800 4200 5800 7700 13,500 19.0 (3/4) 1400 3200 4400 5800 10,200 16.0 (5/8) 1100 2700 3700 4900 8600 12.5 (1/2) 890 2100 2900 3800 6700 9.5 (3/8) 670 1600 2200 2900 5100 6.3 (1/4) 440 1100 1500 1900 3400 4.75 (No. 4) 330 800 1100 1500 2600 -4.75 (-No. 4) 200 470 650 860 1510


October 31, 2017
To: All Holders of the Manual of Field Test Procedures
Section: Test Procedure AASHTO T 30
The Oregon Department of Transportation has specified method(s) for this Test Procedure. Please observe the following for our projects:
• Under Mass Verification step 1 – Delete the second and third sentence.
• Under Procedure step 2 – Dispersing agents or wetting solutions areoptional
• Under Procedure step 7 – delete this step
• Under Procedure step 11 - Shaking time will be a minimum of 10minutes.
• Under Procedure step 15 – Aggregate Correction Factors are at theoption of the Engineer.
• Under Reporting section, 3rd bullet - Aggregate Correction Factors areat the option of the Engineer.
Kate Brown, Governor
Department of Transportation Construction Section 800 Airport Road SE
Salem, OR 97301-4792 Phone: (503) 986-3000
Fax: (503) 986-3096
ASPHALT I WAQTC FOP AASHTO T 30 (17)
T30_short_17.docx Asphalt 18-1 Pub. October 2017
MECHANICAL ANALYSIS OF EXTRACTED AGGREGATE FOP FOR AASHTO T 30 Scope This procedure covers mechanical analysis of aggregate recovered from asphalt mix samples in accordance with AASHTO T 30-15. This FOP utilizes the aggregate recovered from the ignition oven used in AASHTO T 308. AASHTO T 30 was developed for analysis of extracted aggregate and thus includes references to extracted bitumen and filter element, which do not apply in this FOP. Sieve analyses determine the gradation or distribution of aggregate particles within a given sample in order to determine compliance with design and production standards. Apparatus • Balance or scale: Capacity sufficient for the sample mass, accurate to 0.1 percent of the
sample mass or readable to 0.1 g • Sieves, meeting the requirements of FOP for AASHTO T 27/T 11. • Mechanical sieve shaker, meeting the requirements of FOP for AASHTO T 27/T 11. • Mechanical Washing Apparatus (optional)
• Suitable drying equipment, meeting the requirements of the FOP for AASHTO T 255. • Containers and utensils: A pan or vessel of a size sufficient to contain the sample covered
with water and to permit vigorous agitation without loss of any part of the sample or water
Sample Sieving • In this procedure, it is required to shake the sample over nested sieves. Sieves are
selected to furnish information required by specification. Intermediate sieves are added for additional information or to avoid overloading sieves, or both.
• The sieves are nested in order of increasing size from the bottom to the top, and the test
sample, or a portion of the test sample, is placed on the top sieve. • The loaded sieves are shaken in a mechanical shaker for approximately 10 minutes, refer
to Annex A; Time Evaluation.
ASPHALT I WAQTC FOP AASHTO T 30 (17)
T30_short_17.docx Asphalt 18-2 Pub. October 2017
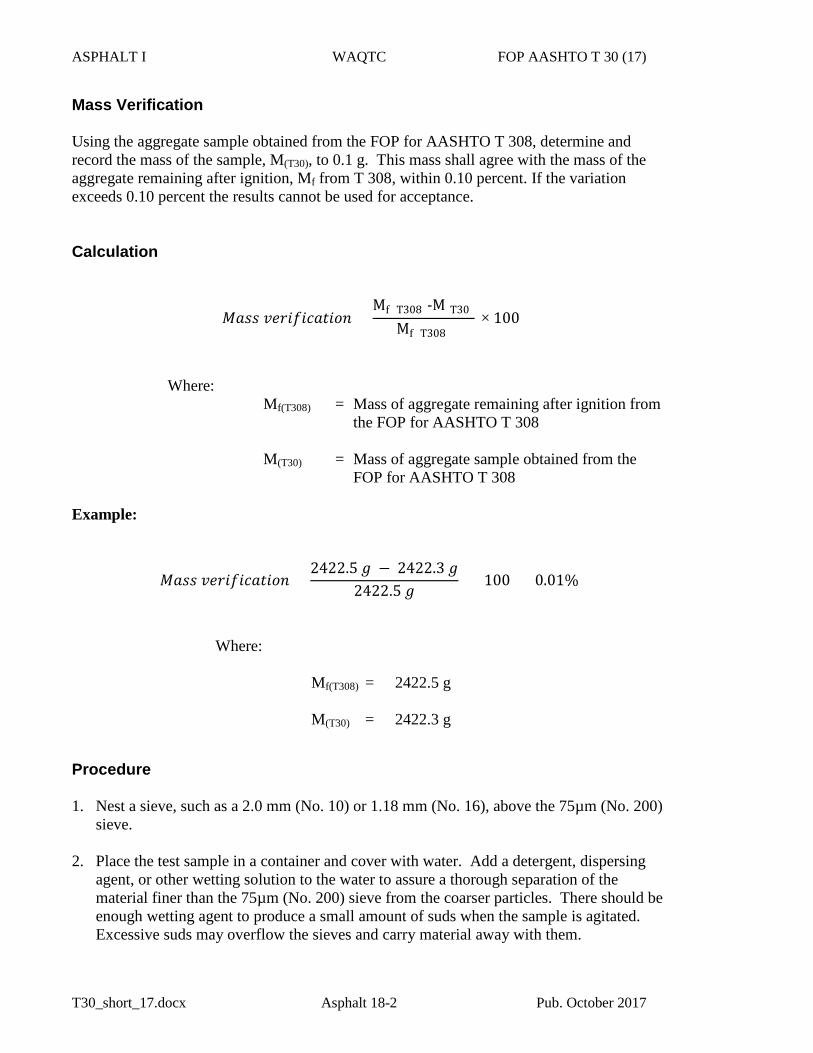
Mass Verification
Using the aggregate sample obtained from the FOP for AASHTO T 308, determine and record the mass of the sample, M(T30), to 0.1 g. This mass shall agree with the mass of the aggregate remaining after ignition, Mf from T 308, within 0.10 percent. If the variation exceeds 0.10 percent the results cannot be used for acceptance.
Calculation
𝑀𝑀𝑀𝑀𝑀𝑀𝑀𝑀 𝑣𝑣𝑣𝑣𝑣𝑣𝑣𝑣𝑣𝑣𝑣𝑣𝑣𝑣𝑀𝑀𝑣𝑣𝑣𝑣𝑣𝑣𝑣𝑣 =Mf (T308)-M(T30)
Mf (T308) × 100
Where: Mf(T308) = Mass of aggregate remaining after ignition from
the FOP for AASHTO T 308
M(T30) = Mass of aggregate sample obtained from the FOP for AASHTO T 308
Example:
𝑀𝑀𝑀𝑀𝑀𝑀𝑀𝑀 𝑣𝑣𝑣𝑣𝑣𝑣𝑣𝑣𝑣𝑣𝑣𝑣𝑣𝑣𝑀𝑀𝑣𝑣𝑣𝑣𝑣𝑣𝑣𝑣 =2422.5 𝑔𝑔 − 2422.3 𝑔𝑔
2422.5 𝑔𝑔 × 100 = 0.01%
Where:
Mf(T308) = 2422.5 g
M(T30) = 2422.3 g
Procedure
1. Nest a sieve, such as a 2.0 mm (No. 10) or 1.18 mm (No. 16), above the 75µm (No. 200)sieve.
2. Place the test sample in a container and cover with water. Add a detergent, dispersingagent, or other wetting solution to the water to assure a thorough separation of thematerial finer than the 75µm (No. 200) sieve from the coarser particles. There should beenough wetting agent to produce a small amount of suds when the sample is agitated.Excessive suds may overflow the sieves and carry material away with them.
ASPHALT I WAQTC FOP AASHTO T 30 (17)
T30_short_17.docx Asphalt 18-3 Pub. October 2017
3. Agitate vigorously to ensure complete separation of the material finer than 75µm
(No. 200) from coarser particles and bring the fine material into suspension above the coarser material. Avoid degradation of the sample when using a mechanical washing device. Maximum agitation is 10 min. Note 1: When mechanical washing equipment is used, the introduction of water, agitating, and decanting
may be a continuous operation. Use care not to overflow or overload the 75µm (No. 200) sieve.
4. Immediately pour the wash water containing the suspended material over the nested sieves; be careful not to pour out the coarser particles or over fill the 75 µm (No. 200) sieve.
5. Add water to cover material remaining in the container, agitate, and repeat Step 4.
Continue until the wash water is reasonably clear. 6. Remove the upper sieve, return material retained to the washed sample. 7. Rinse the material retained on the 75 µm (No. 200) sieve until water passing through the
sieve is reasonably clear and detergent or dispersing agent is removed. 8. Return all material retained on the 75 µm (No. 200) sieve to the washed sample by
rinsing into the washed sample. 9. Dry the washed test sample to constant mass according to the FOP for AASHTO
T 255. Cool to room temperature. Determine and record the “dry mass after washing.” 10. Select sieves required by the specification and those necessary to avoid overloading.
With a pan on bottom, nest the sieves increasing in size starting with the 75 µm (No. 200).
11. Place the test sample, or a portion of the test sample, on the top sieve. Place sieves in
mechanical shaker and shake for the minimum time determined to provide complete separation for the sieve shaker being used (approximately 10 minutes, the time determined by Annex A). Note 2: Excessive shaking (more than 10 minutes) may result in degradation of the sample.
12. Determine and record the individual or cumulative mass retained for each sieve including the pan. Ensure that all material trapped in full openings of the sieves are removed and included in the mass retained. Note 3: For sieves 4.75 mm (No. 4) and larger, check material trapped in less than a full opening by
sieving over a full opening. Use coarse wire brushes to clean the 600 µm (No. 30) and larger sieves, and soft bristle brushes for smaller sieves.
13. Perform the Check Sum calculation – Verify the total mass after sieving of material agrees with the dry mass after washing within 0.2 percent. Do not use test results for acceptance if the Check Sum result is greater than 0.2 percent.
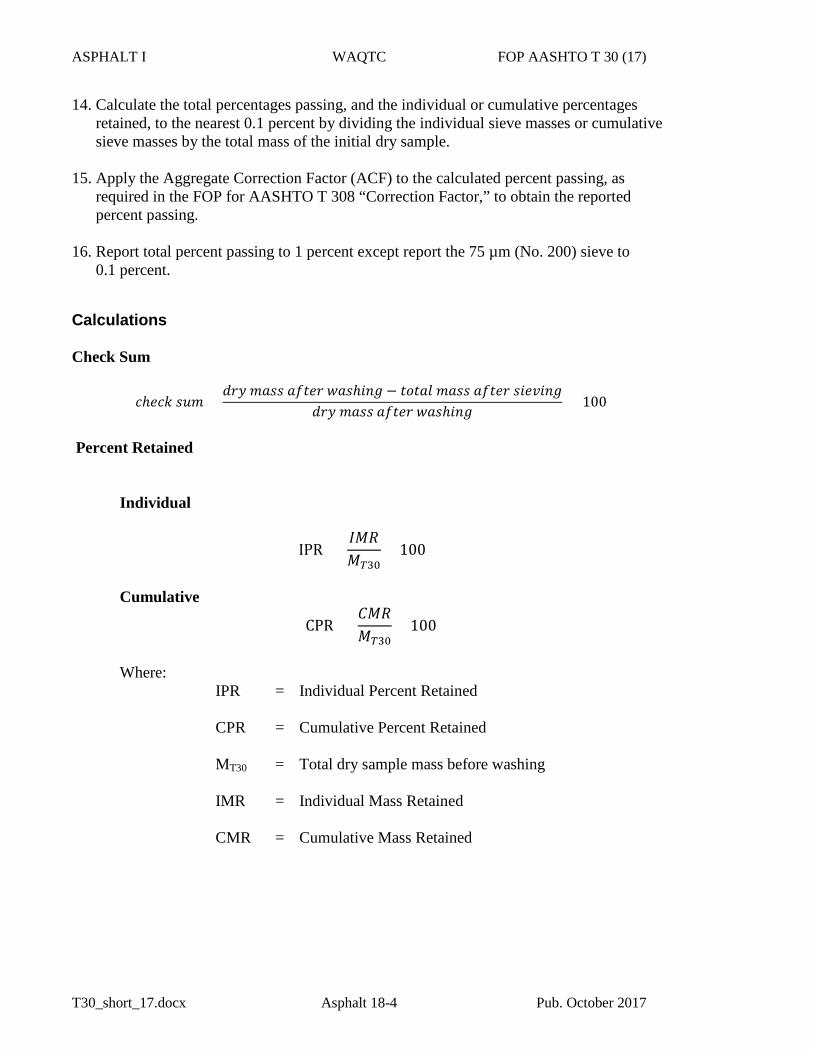
ASPHALT I WAQTC FOP AASHTO T 30 (17)
T30_short_17.docx Asphalt 18-4 Pub. October 2017
14. Calculate the total percentages passing, and the individual or cumulative percentagesretained, to the nearest 0.1 percent by dividing the individual sieve masses or cumulativesieve masses by the total mass of the initial dry sample.
15. Apply the Aggregate Correction Factor (ACF) to the calculated percent passing, asrequired in the FOP for AASHTO T 308 “Correction Factor,” to obtain the reportedpercent passing.
16. Report total percent passing to 1 percent except report the 75 µm (No. 200) sieve to0.1 percent.
Calculations
Check Sum
𝑣𝑣ℎ𝑣𝑣𝑣𝑣𝑒𝑒 𝑀𝑀𝑠𝑠𝑠𝑠 =𝑑𝑑𝑣𝑣𝑑𝑑 𝑠𝑠𝑀𝑀𝑀𝑀𝑀𝑀 𝑀𝑀𝑣𝑣𝑣𝑣𝑣𝑣𝑣𝑣 𝑤𝑤𝑀𝑀𝑀𝑀ℎ𝑣𝑣𝑣𝑣𝑔𝑔 − 𝑣𝑣𝑣𝑣𝑣𝑣𝑀𝑀𝑡𝑡 𝑠𝑠𝑀𝑀𝑀𝑀𝑀𝑀 𝑀𝑀𝑣𝑣𝑣𝑣𝑣𝑣𝑣𝑣 𝑀𝑀𝑣𝑣𝑣𝑣𝑣𝑣𝑣𝑣𝑣𝑣𝑔𝑔
𝑑𝑑𝑣𝑣𝑑𝑑 𝑠𝑠𝑀𝑀𝑀𝑀𝑀𝑀 𝑀𝑀𝑣𝑣𝑣𝑣𝑣𝑣𝑣𝑣 𝑤𝑤𝑀𝑀𝑀𝑀ℎ𝑣𝑣𝑣𝑣𝑔𝑔 × 100
Percent Retained
Individual
IPR = 𝐼𝐼𝑀𝑀𝐼𝐼𝑀𝑀𝑇𝑇30
× 100
Cumulative
CPR = 𝐶𝐶𝑀𝑀𝐼𝐼𝑀𝑀𝑇𝑇30
× 100
Where: IPR = Individual Percent Retained
CPR = Cumulative Percent Retained
MT30 = Total dry sample mass before washing
IMR = Individual Mass Retained
CMR = Cumulative Mass Retained
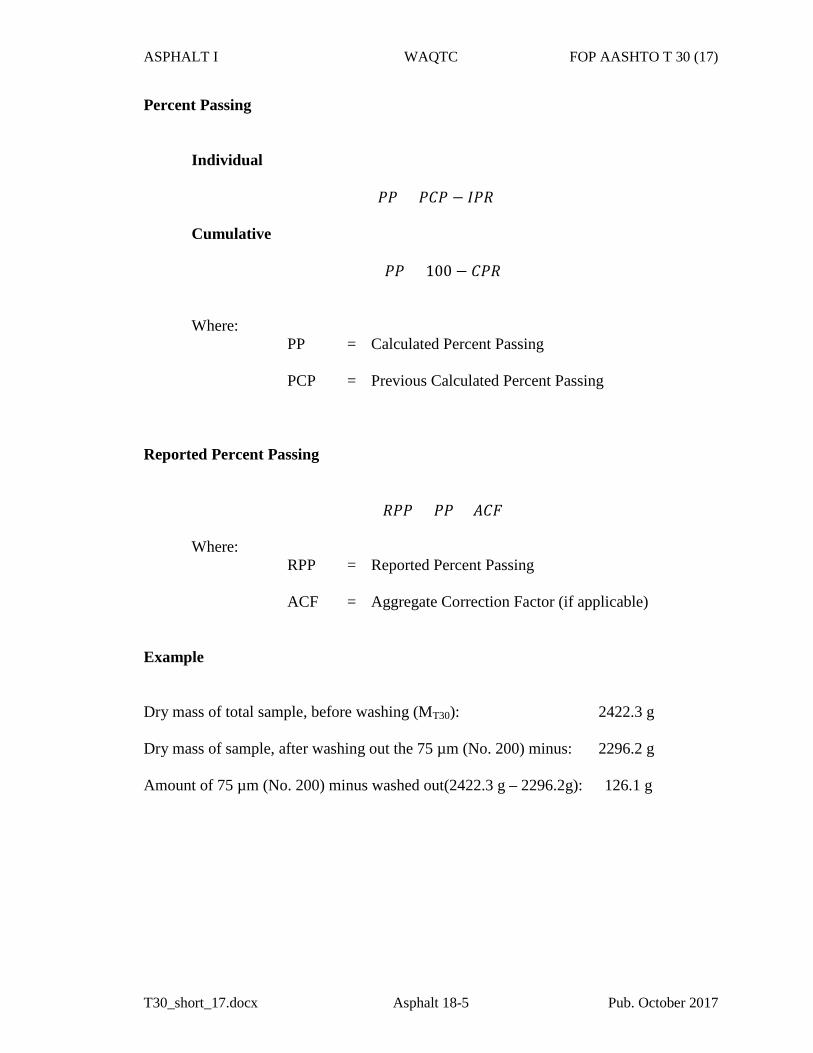
ASPHALT I WAQTC FOP AASHTO T 30 (17)
T30_short_17.docx Asphalt 18-5 Pub. October 2017
Percent Passing
Individual
𝑃𝑃𝑃𝑃 = 𝑃𝑃𝐶𝐶𝑃𝑃 − 𝐼𝐼𝑃𝑃𝐼𝐼
Cumulative
𝑃𝑃𝑃𝑃 = 100 − 𝐶𝐶𝑃𝑃𝐼𝐼 Where:
PP = Calculated Percent Passing PCP = Previous Calculated Percent Passing
Reported Percent Passing
𝐼𝐼𝑃𝑃𝑃𝑃 = 𝑃𝑃𝑃𝑃 + 𝐴𝐴𝐶𝐶𝐴𝐴
Where:
RPP = Reported Percent Passing ACF = Aggregate Correction Factor (if applicable)
Example Dry mass of total sample, before washing (MT30): 2422.3 g Dry mass of sample, after washing out the 75 µm (No. 200) minus: 2296.2 g Amount of 75 µm (No. 200) minus washed out(2422.3 g – 2296.2g): 126.1 g
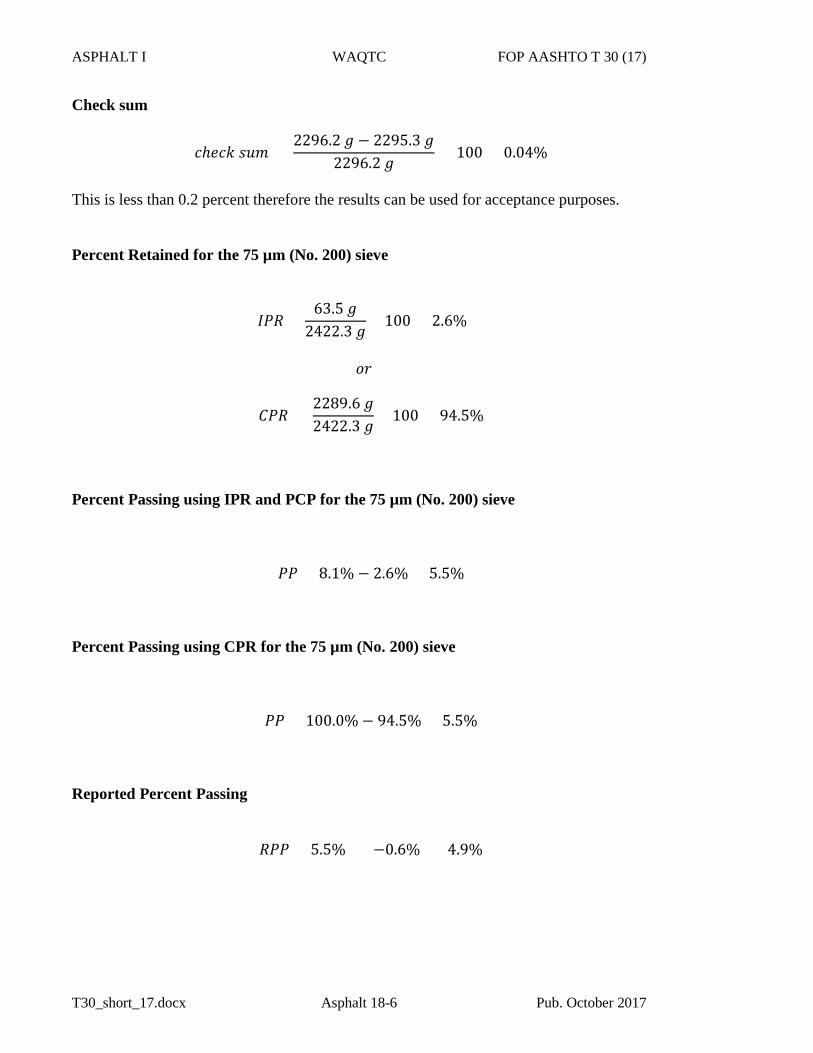
ASPHALT I WAQTC FOP AASHTO T 30 (17)
T30_short_17.docx Asphalt 18-6 Pub. October 2017
Check sum
𝑣𝑣ℎ𝑣𝑣𝑣𝑣𝑒𝑒 𝑀𝑀𝑠𝑠𝑠𝑠 = 2296.2 𝑔𝑔 − 2295.3 𝑔𝑔
2296.2 𝑔𝑔 × 100 = 0.04%
This is less than 0.2 percent therefore the results can be used for acceptance purposes.
Percent Retained for the 75 µm (No. 200) sieve
𝐼𝐼𝑃𝑃𝐼𝐼 =63.5 𝑔𝑔
2422.3 𝑔𝑔× 100 = 2.6%
𝑣𝑣𝑣𝑣
𝐶𝐶𝑃𝑃𝐼𝐼 = 2289.6 𝑔𝑔2422.3 𝑔𝑔
× 100 = 94.5%
Percent Passing using IPR and PCP for the 75 µm (No. 200) sieve
𝑃𝑃𝑃𝑃 = 8.1% − 2.6% = 5.5%
Percent Passing using CPR for the 75 µm (No. 200) sieve
𝑃𝑃𝑃𝑃 = 100.0% − 94.5% = 5.5%
Reported Percent Passing
𝐼𝐼𝑃𝑃𝑃𝑃 = 5.5% = (−0.6%) = 4.9%
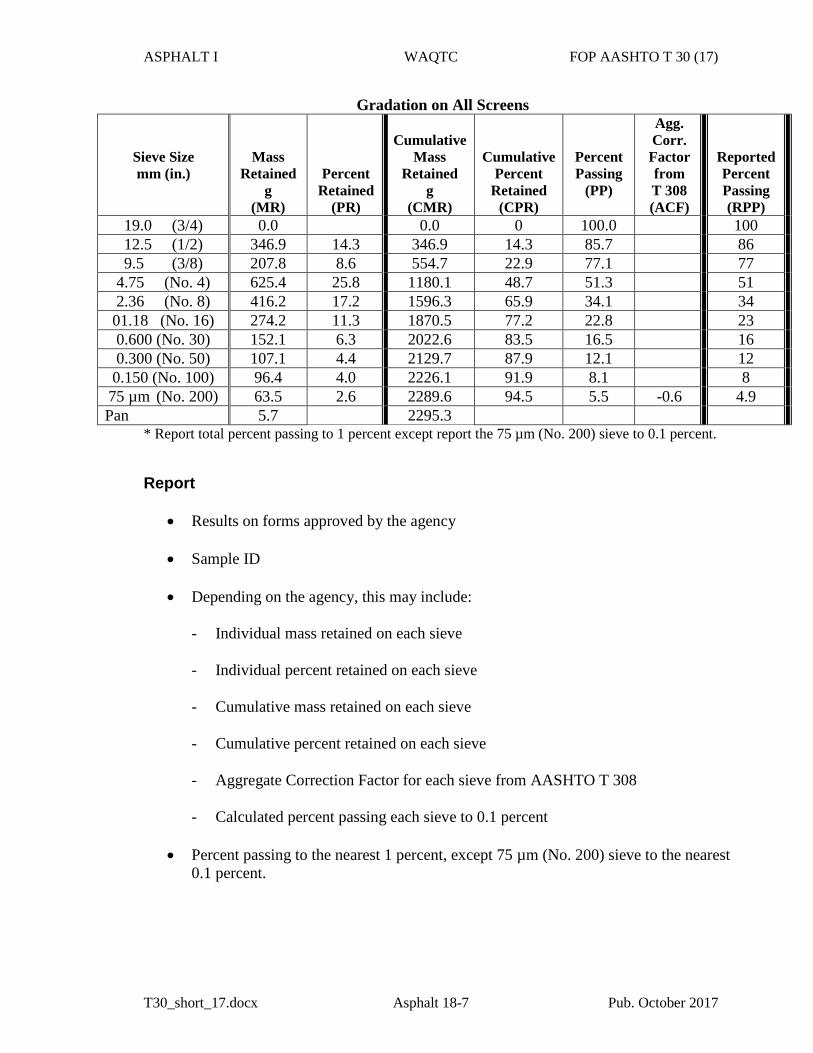
ASPHALT I WAQTC FOP AASHTO T 30 (17)
T30_short_17.docx Asphalt 18-7 Pub. October 2017
Gradation on All Screens
Sieve Size mm (in.)
Mass Retained
g (MR)
Percent Retained
(PR)
Cumulative
Mass Retained
g (CMR)
Cumulative Percent
Retained (CPR)
Percent Passing
(PP)
Agg. Corr. Factor from T 308 (ACF)
Reported Percent Passing (RPP)
19.0 (3/4) 0.0 0.0 0 100.0 100 12.5 (1/2) 346.9 14.3 346.9 14.3 85.7 86 9.5 (3/8) 207.8 8.6 554.7 22.9 77.1 77
4.75 (No. 4) 625.4 25.8 1180.1 48.7 51.3 51 2.36 (No. 8) 416.2 17.2 1596.3 65.9 34.1 34 01.18 (No. 16) 274.2 11.3 1870.5 77.2 22.8 23 0.600 (No. 30) 152.1 6.3 2022.6 83.5 16.5 16 0.300 (No. 50) 107.1 4.4 2129.7 87.9 12.1 12 0.150 (No. 100) 96.4 4.0 2226.1 91.9 8.1 8 75 µm (No. 200) 63.5 2.6 2289.6 94.5 5.5 -0.6 4.9 Pan 5.7 2295.3
* Report total percent passing to 1 percent except report the 75 µm (No. 200) sieve to 0.1 percent.
Report
• Results on forms approved by the agency • Sample ID • Depending on the agency, this may include:
- Individual mass retained on each sieve - Individual percent retained on each sieve - Cumulative mass retained on each sieve - Cumulative percent retained on each sieve
- Aggregate Correction Factor for each sieve from AASHTO T 308 - Calculated percent passing each sieve to 0.1 percent
• Percent passing to the nearest 1 percent, except 75 µm (No. 200) sieve to the nearest
0.1 percent.
ASPHALT I WAQTC FOP AASHTO T 30 (17)
T30_short_17.docx Asphalt 18-8 Pub. October 2017
ANNEX A TIME EVALUATION
The minimum time requirement should be evaluated for each shaker at least annually by the following method:
1. Shake the sample over nested sieves for approximately 10 minutes.
2. Provide a snug-fitting pan and cover for each sieve, and hold in a slightly inclinedposition in one hand.
3. Hand-shake each sieve by striking the side of the sieve sharply and with an upwardmotion against the heel of the other hand at the rate of about 150 times per minute,turning the sieve about one sixth of a revolution at intervals of about 25 strokes.
If more than 0.5 percent by mass of the total sample before sieving passes any sieve after one minute of continuous hand sieving adjust shaker time and re-check.
In determining sieving time for sieve sizes larger than 4.75 mm (No. 4), limit the material on the sieve to a single layer of particles.
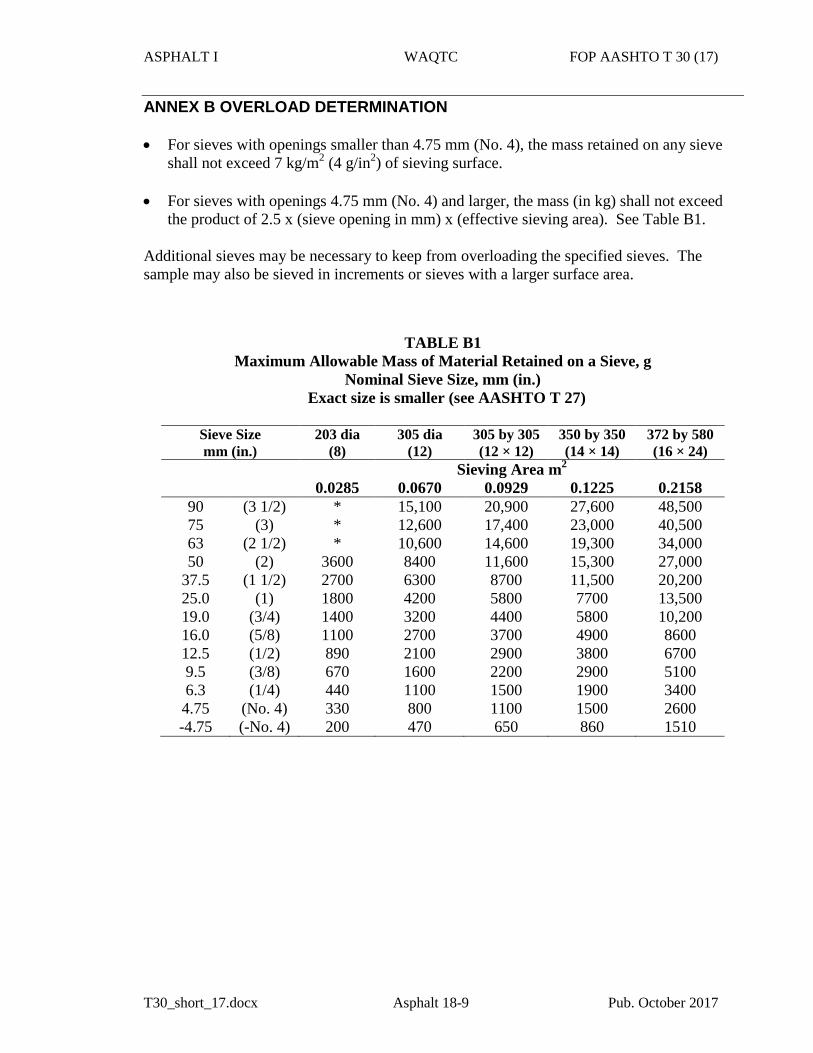
ASPHALT I WAQTC FOP AASHTO T 30 (17)
T30_short_17.docx Asphalt 18-9 Pub. October 2017
ANNEX B OVERLOAD DETERMINATION • For sieves with openings smaller than 4.75 mm (No. 4), the mass retained on any sieve
shall not exceed 7 kg/m2 (4 g/in2) of sieving surface. • For sieves with openings 4.75 mm (No. 4) and larger, the mass (in kg) shall not exceed
the product of 2.5 x (sieve opening in mm) x (effective sieving area). See Table B1. Additional sieves may be necessary to keep from overloading the specified sieves. The sample may also be sieved in increments or sieves with a larger surface area.
TABLE B1 Maximum Allowable Mass of Material Retained on a Sieve, g
Nominal Sieve Size, mm (in.) Exact size is smaller (see AASHTO T 27)
Sieve Size mm (in.)
203 dia (8)
305 dia (12)
305 by 305 (12 × 12)
350 by 350 (14 × 14)
372 by 580 (16 × 24)
Sieving Area m2 0.0285 0.0670 0.0929 0.1225 0.2158
90 (3 1/2) * 15,100 20,900 27,600 48,500 75 (3) * 12,600 17,400 23,000 40,500 63 (2 1/2) * 10,600 14,600 19,300 34,000 50 (2) 3600 8400 11,600 15,300 27,000
37.5 (1 1/2) 2700 6300 8700 11,500 20,200 25.0 (1) 1800 4200 5800 7700 13,500 19.0 (3/4) 1400 3200 4400 5800 10,200 16.0 (5/8) 1100 2700 3700 4900 8600 12.5 (1/2) 890 2100 2900 3800 6700 9.5 (3/8) 670 1600 2200 2900 5100 6.3 (1/4) 440 1100 1500 1900 3400 4.75 (No. 4) 330 800 1100 1500 2600 -4.75 (-No. 4) 200 470 650 860 1510


Specific Gravity and Absorption of Fine Aggregate
AASHTO Designation: T 84-13 ASTM Designation: C 128-12
AASHTO TEST METHODS CANNOT BE INCLUDED ON ODOT’S WEBSITE DUE TO COPYRIGHT INFRINGEMENT.
TO GET COPIES OF THE TEST METHODS, YOU CAN ORDER A HARD COPY OF ODOT’S MANUAL OF FIELD TEST PROCEDURES OR YOU CAN ORDER THE LATEST STANDARD SPECIFICATIONS FOR TRANSPORTATION MATERIALS AND METHODS OF SAMPLING AND TESTING FROM AASHTO. ORDERING INSTRUCTIONS ARE GIVEN BELOW:
To order ODOT’s Manual of Field Test Procedures, use the following web address: http://www.oregon.gov/ODOT/Construction/Pages/Manual-of-Field-Test-Procedures.aspx
To order AASHTO’s Standard Specifications for Transportation Materials and Methods of Sampling and Testing, use the following web address: https://bookstore.transportation.org/

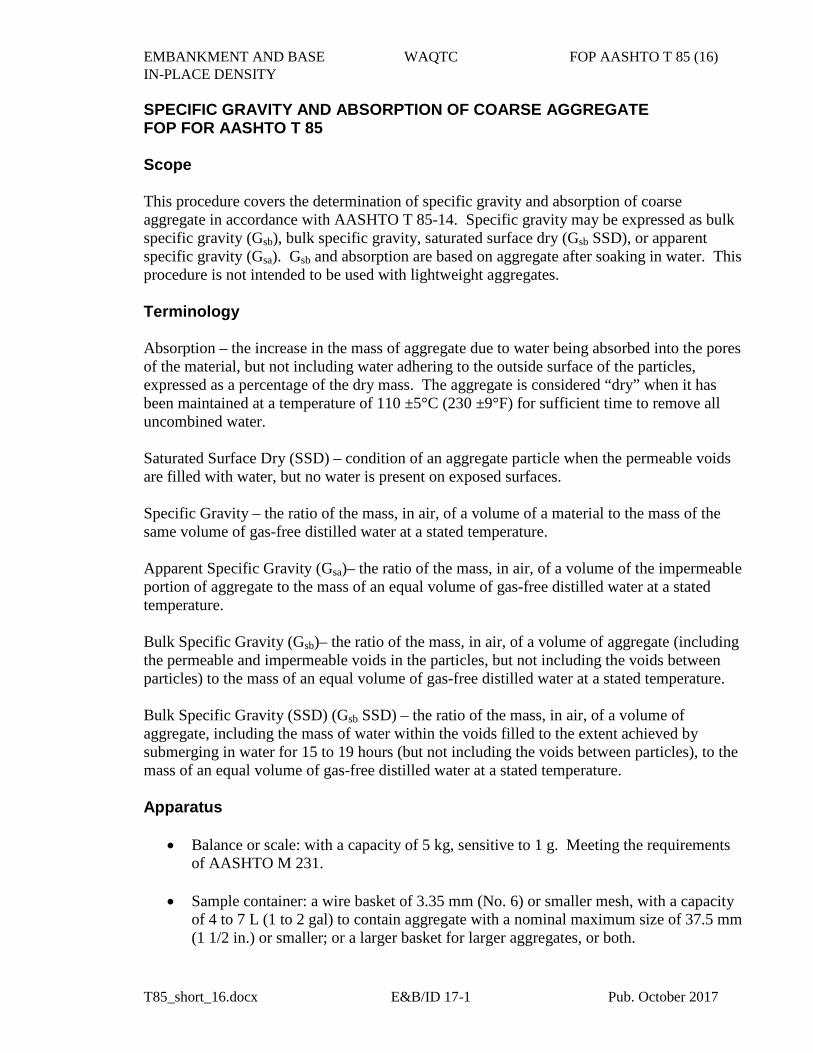
EMBANKMENT AND BASE WAQTC FOP AASHTO T 85 (16) IN-PLACE DENSITY
T85_short_16.docx E&B/ID 17-1 Pub. October 2017
SPECIFIC GRAVITY AND ABSORPTION OF COARSE AGGREGATE FOP FOR AASHTO T 85
Scope
This procedure covers the determination of specific gravity and absorption of coarse aggregate in accordance with AASHTO T 85-14. Specific gravity may be expressed as bulk specific gravity (Gsb), bulk specific gravity, saturated surface dry (Gsb SSD), or apparent specific gravity (Gsa). Gsb and absorption are based on aggregate after soaking in water. This procedure is not intended to be used with lightweight aggregates.
Terminology
Absorption – the increase in the mass of aggregate due to water being absorbed into the pores of the material, but not including water adhering to the outside surface of the particles, expressed as a percentage of the dry mass. The aggregate is considered “dry” when it has been maintained at a temperature of 110 ±5°C (230 ±9°F) for sufficient time to remove all uncombined water.
Saturated Surface Dry (SSD) – condition of an aggregate particle when the permeable voids are filled with water, but no water is present on exposed surfaces.
Specific Gravity – the ratio of the mass, in air, of a volume of a material to the mass of the same volume of gas-free distilled water at a stated temperature.
Apparent Specific Gravity (Gsa)– the ratio of the mass, in air, of a volume of the impermeable portion of aggregate to the mass of an equal volume of gas-free distilled water at a stated temperature.
Bulk Specific Gravity (Gsb)– the ratio of the mass, in air, of a volume of aggregate (including the permeable and impermeable voids in the particles, but not including the voids between particles) to the mass of an equal volume of gas-free distilled water at a stated temperature.
Bulk Specific Gravity (SSD) (Gsb SSD) – the ratio of the mass, in air, of a volume of aggregate, including the mass of water within the voids filled to the extent achieved by submerging in water for 15 to 19 hours (but not including the voids between particles), to the mass of an equal volume of gas-free distilled water at a stated temperature.
Apparatus
• Balance or scale: with a capacity of 5 kg, sensitive to 1 g. Meeting the requirementsof AASHTO M 231.
• Sample container: a wire basket of 3.35 mm (No. 6) or smaller mesh, with a capacityof 4 to 7 L (1 to 2 gal) to contain aggregate with a nominal maximum size of 37.5 mm(1 1/2 in.) or smaller; or a larger basket for larger aggregates, or both.
EMBANKMENT AND BASE WAQTC FOP AASHTO T 85 (16) IN-PLACE DENSITY
T85_short_16.docx E&B/ID 17-2 Pub. October 2017
• Water tank: watertight and large enough to completely immerse aggregate and basket,equipped with an overflow valve to keep water level constant.
• Suspension apparatus: wire used to suspend apparatus shall be of the smallestpractical diameter.
• Sieves 4.75 mm (No. 4) or other sizes as needed, meeting the requirements of FOPfor AASHTO T 27/T 11.
• Large absorbent towel
Sample Preparation
1. Obtain the sample in accordance with the FOP for AASHTO T 2 (see Note 1).
2. Mix the sample thoroughly and reduce it to the approximate sample size required byTable 1 in accordance with the FOP for AASHTO R 76.
3. Reject all material passing the appropriate sieve by dry sieving.
4. Thoroughly wash sample to remove dust or other coatings from the surface.
5. Dry the test sample to constant mass at a temperature of 110 ±5°C (230 ±9°F) and cool inair at room temperature for 1 to 3 hours.Note 1: Where the absorption and specific gravity values are to be used in proportioning concrete mixtures
in which the aggregates will be in their naturally moist condition, the requirement for initial drying to constant mass may be eliminated, and, if the surfaces of the particles in the sample have been kept continuously wet until test, the 15-to-19 hour soaking may also be eliminated.
6. Re-screen the sample over the appropriate sieve. Reject all material passing that sieve.
7. The sample shall meet or exceed the minimum mass given in Table 1.Note 2: If this procedure is used only to determine the Gsb of oversized material for the FOP for AASHTO
T 99 / T 180, the material can be rejected over the appropriate sieve. For T 99 / T 180 Methods A and B, use the 4.75 mm (No. 4) sieve; T 99 / T 180 Methods C and D use the 19 mm (3/4 in).
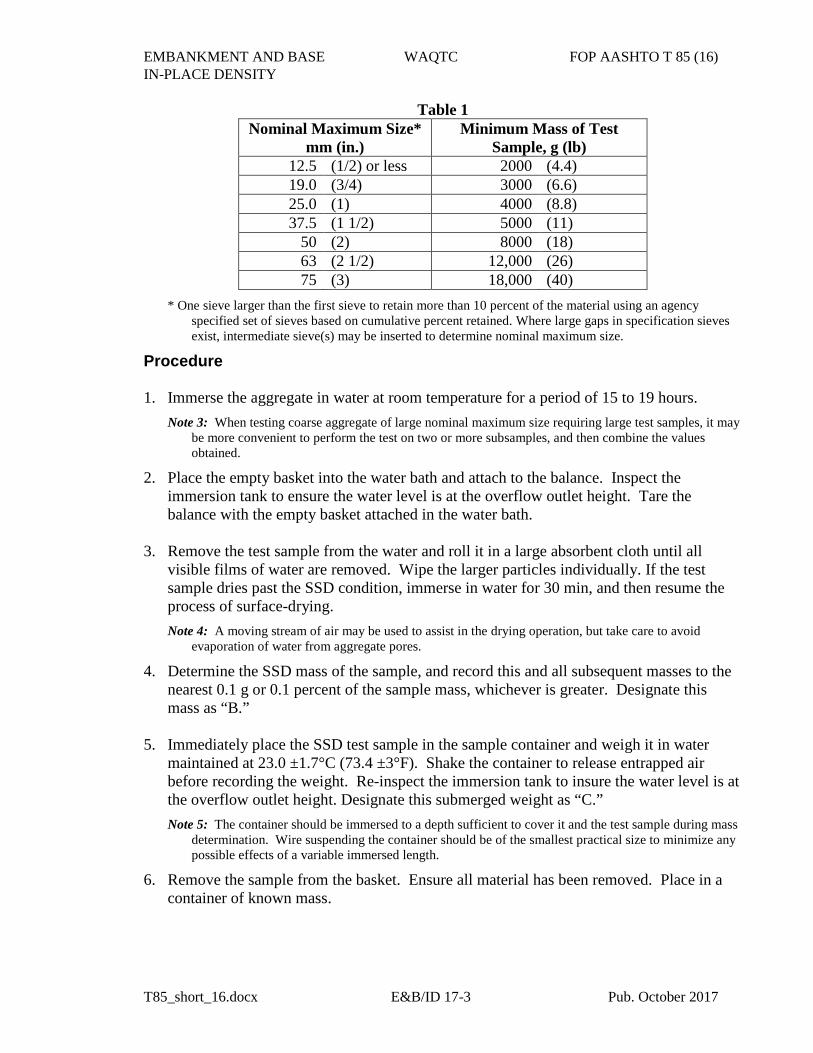
EMBANKMENT AND BASE WAQTC FOP AASHTO T 85 (16) IN-PLACE DENSITY
T85_short_16.docx E&B/ID 17-3 Pub. October 2017
Table 1 Nominal Maximum Size*
mm (in.) Minimum Mass of Test
Sample, g (lb) 12.5 (1/2) or less 2000 (4.4) 19.0 (3/4) 3000 (6.6) 25.0 (1) 4000 (8.8) 37.5 (1 1/2) 5000 (11)
50 (2) 8000 (18) 63 (2 1/2) 12,000 (26) 75 (3) 18,000 (40)
* One sieve larger than the first sieve to retain more than 10 percent of the material using an agency specified set of sieves based on cumulative percent retained. Where large gaps in specification sieves exist, intermediate sieve(s) may be inserted to determine nominal maximum size.
Procedure 1. Immerse the aggregate in water at room temperature for a period of 15 to 19 hours.
Note 3: When testing coarse aggregate of large nominal maximum size requiring large test samples, it may be more convenient to perform the test on two or more subsamples, and then combine the values obtained.
2. Place the empty basket into the water bath and attach to the balance. Inspect the immersion tank to ensure the water level is at the overflow outlet height. Tare the balance with the empty basket attached in the water bath.
3. Remove the test sample from the water and roll it in a large absorbent cloth until all
visible films of water are removed. Wipe the larger particles individually. If the test sample dries past the SSD condition, immerse in water for 30 min, and then resume the process of surface-drying. Note 4: A moving stream of air may be used to assist in the drying operation, but take care to avoid
evaporation of water from aggregate pores.
4. Determine the SSD mass of the sample, and record this and all subsequent masses to the nearest 0.1 g or 0.1 percent of the sample mass, whichever is greater. Designate this mass as “B.”
5. Immediately place the SSD test sample in the sample container and weigh it in water
maintained at 23.0 ±1.7°C (73.4 ±3°F). Shake the container to release entrapped air before recording the weight. Re-inspect the immersion tank to insure the water level is at the overflow outlet height. Designate this submerged weight as “C.” Note 5: The container should be immersed to a depth sufficient to cover it and the test sample during mass
determination. Wire suspending the container should be of the smallest practical size to minimize any possible effects of a variable immersed length.
6. Remove the sample from the basket. Ensure all material has been removed. Place in a container of known mass.
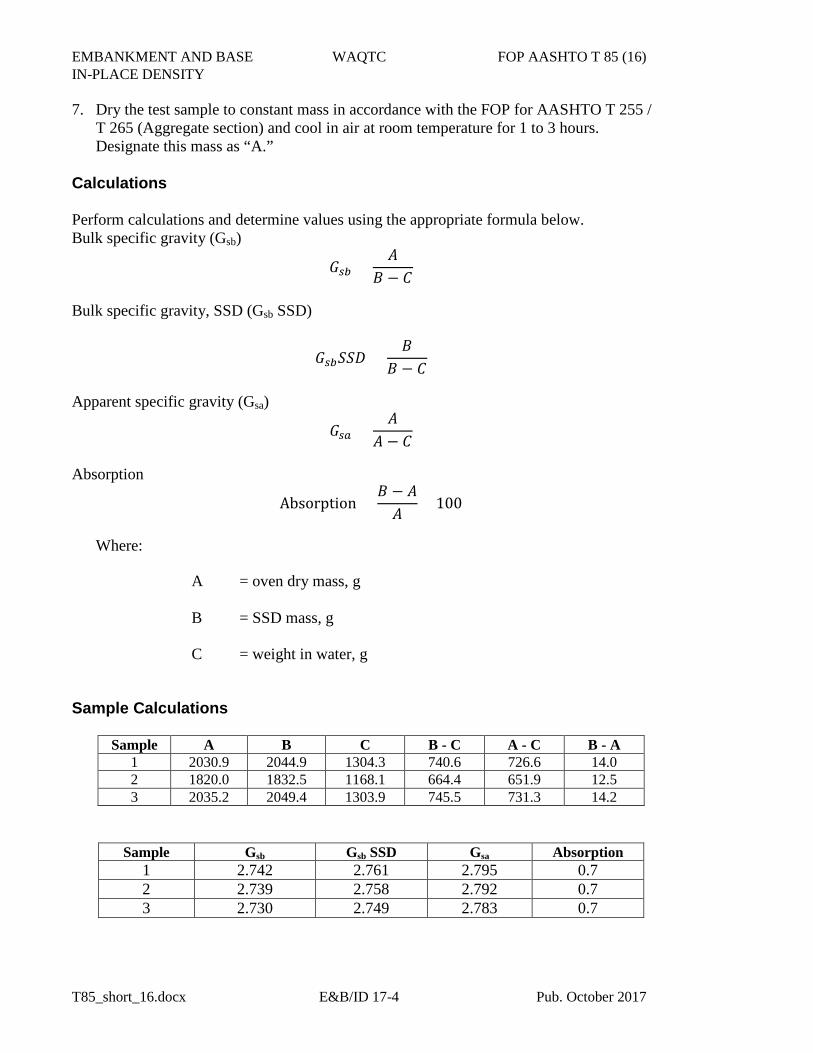
EMBANKMENT AND BASE WAQTC FOP AASHTO T 85 (16) IN-PLACE DENSITY
T85_short_16.docx E&B/ID 17-4 Pub. October 2017
7. Dry the test sample to constant mass in accordance with the FOP for AASHTO T 255 /T 265 (Aggregate section) and cool in air at room temperature for 1 to 3 hours.Designate this mass as “A.”
Calculations
Perform calculations and determine values using the appropriate formula below. Bulk specific gravity (Gsb)
𝐺𝐺𝑠𝑠𝑠𝑠 =𝐴𝐴
𝐵𝐵 − 𝐶𝐶
Bulk specific gravity, SSD (Gsb SSD)
𝐺𝐺𝑠𝑠𝑠𝑠𝑆𝑆𝑆𝑆𝑆𝑆 =𝐵𝐵
𝐵𝐵 − 𝐶𝐶
Apparent specific gravity (Gsa)
𝐺𝐺𝑠𝑠𝑠𝑠 =𝐴𝐴
𝐴𝐴 − 𝐶𝐶
Absorption
Absorption =𝐵𝐵 − 𝐴𝐴𝐴𝐴
× 100
Where:
A = oven dry mass, g
B = SSD mass, g
C = weight in water, g
Sample Calculations
Sample A B C B - C A - C B - A 1 2030.9 2044.9 1304.3 740.6 726.6 14.0 2 1820.0 1832.5 1168.1 664.4 651.9 12.5 3 2035.2 2049.4 1303.9 745.5 731.3 14.2
Sample Gsb Gsb SSD Gsa Absorption 1 2.742 2.761 2.795 0.7 2 2.739 2.758 2.792 0.7 3 2.730 2.749 2.783 0.7
EMBANKMENT AND BASE WAQTC FOP AASHTO T 85 (16) IN-PLACE DENSITY
T85_short_16.docx E&B/ID 17-5 Pub. October 2017
These calculations demonstrate the relationship between Gsb, Gsb SSD, and Gsa. Gsb is always lowest, since the volume includes voids permeable to water. Gsb SSD is always intermediate. Gsa is always highest, since the volume does not include voids permeable to water. When running this test, check to make sure the values calculated make sense in relation to one another. Report • Results on forms approved by the agency • Sample ID
• Specific gravity values to 3 decimal places • Absorption to 0.1 percent


Observe the following for Base Aggregate applications:
• Use T 99 Method A and perform the Coarse Particle Correction according toODOT TM 223. This Process shall be used for Dense Graded BaseAggregate Separated Stockpile sizes of 1″ – 0 and smaller. Dense GradedBase Aggregate with Separated Stockpile sizes larger than 1″ – 0 and Opengraded Base Aggregates are non-density testable and should be evaluatedaccording to the appropriate specifications contained in the project contractdocuments.
• Measures may be taken to reduce or eliminate seepage of moisture frombetween the mold and the base plate which do not affect the mold’s volume.
• Moisture content of individual points will be determined using the entiremolded sample.
Annex Section
Earthwork and other graded Aggregates, except Base Aggregate Applications:
• Less than 10% plus 4.75 mm (No. 4) (Method A), no coarse particlecorrection is required.
• 10%-- 40% plus 4.75 mm (No. 4) (Method A), a coarse particle correctionis required.
• Over 40% plus 4.75 mm (No. 4) (Method A), re-screen material andperform T 99 method D.
• Less than 10% plus 19.00 mm (3/4 in.) (Method D), no coarse particlecorrection is required.
• 10%-- 30% plus 19.00 mm (3/4 in.) (Method D), a coarse particlecorrection is required.
• Over 30% plus 19.00 mm (3/4 in.) (Method D), the material is non-densitytestable and should be evaluated according to the earthwork orappropriate aggregate specifications contained in the project contractdocuments.
• Percentage of coarse particles can be determined in the wet state.
Observe the following for other Graded Aggregates:
• If during crushing operations process control data is available for the4.75 mm (No. 4) and/or 19.00 mm (3/4 in.) screen use the average valuesto compute the coarse particle correction.

October 31, 2017
To: All Holders of the Manual of Field Test Procedures
Section: Test Procedure AASHTO T 99 and T 180
The Oregon Department of Transportation has specified method(s) for this Test Procedure. Please observe the following for our projects:
• Methods B & C are not allowed on ODOT contracts.
• Use T 99 Methods A or D for earthwork applications and other gradedmaterials, except Base Aggregate, based on the following criteria:
1. The soil or soil/aggregate mixture will first be analyzed according toMethod A. If the amount of material retained on the 4.75mm (No. 4)screen exceeds 40% then use Method D.
2. If the amount of material retained on the 19.00mm (3/4″) screenexceeds 30% then the material is non-density testable and should beevaluated according to the appropriate specifications contained inthe project contract documents.
• Under Section Apparatus, Mold, determination of the mold volume isnot required according to Annex B, if the wet density is computedusing the mold volume based on Table 2.
• Under Section Apparatus, Balances or Scales for the standard ormodified proctor, change the scale sensitivity to 5 g or better.
• Under procedure, step 13, delete the second and third sentence. Add thefollowing: (Note: For proper curve development a minimum of 3 pointsrepresenting the dry side and 2 points representing the wet side of the curveis considered best practice).
• Under the Calculations Section, wet density may be computed using themolds volume in Table 2 or a “Mold Factor” can be used as a multiplierbased on the following: Mass determination in lbs., 4” diameter mold (30)and in grams (0.06614) and 6” diameter mold in lbs. (13.33) and in grams(0.02939).
(See Next Page)
Kate Brown, Governor
Department of Transportation Construction Section 800 Airport Road SE
Salem, OR 97301-4792 Phone: (503) 986-3000
Fax: (503) 986-3096
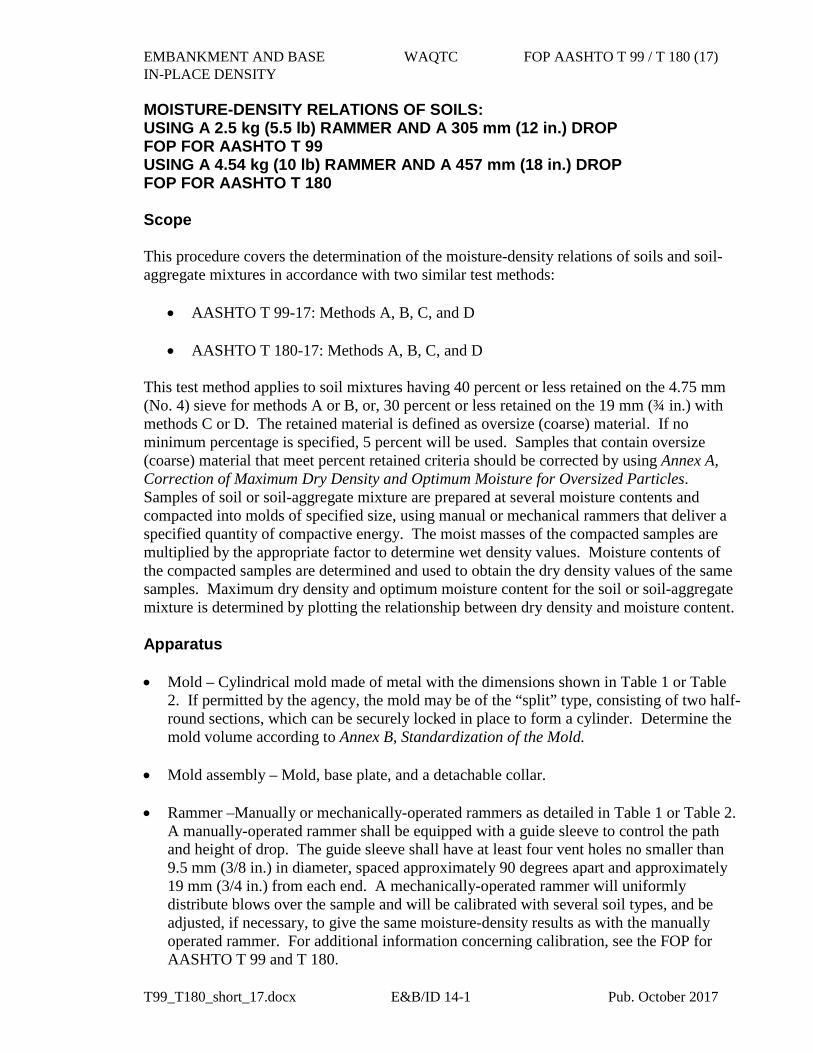
EMBANKMENT AND BASE WAQTC FOP AASHTO T 99 / T 180 (17) IN-PLACE DENSITY
T99_T180_short_17.docx E&B/ID 14-1 Pub. October 2017
MOISTURE-DENSITY RELATIONS OF SOILS: USING A 2.5 kg (5.5 lb) RAMMER AND A 305 mm (12 in.) DROP FOP FOR AASHTO T 99 USING A 4.54 kg (10 lb) RAMMER AND A 457 mm (18 in.) DROP FOP FOR AASHTO T 180
Scope
This procedure covers the determination of the moisture-density relations of soils and soil-aggregate mixtures in accordance with two similar test methods:
• AASHTO T 99-17: Methods A, B, C, and D
• AASHTO T 180-17: Methods A, B, C, and D
This test method applies to soil mixtures having 40 percent or less retained on the 4.75 mm (No. 4) sieve for methods A or B, or, 30 percent or less retained on the 19 mm (¾ in.) with methods C or D. The retained material is defined as oversize (coarse) material. If no minimum percentage is specified, 5 percent will be used. Samples that contain oversize (coarse) material that meet percent retained criteria should be corrected by using Annex A, Correction of Maximum Dry Density and Optimum Moisture for Oversized Particles. Samples of soil or soil-aggregate mixture are prepared at several moisture contents and compacted into molds of specified size, using manual or mechanical rammers that deliver a specified quantity of compactive energy. The moist masses of the compacted samples are multiplied by the appropriate factor to determine wet density values. Moisture contents of the compacted samples are determined and used to obtain the dry density values of the same samples. Maximum dry density and optimum moisture content for the soil or soil-aggregate mixture is determined by plotting the relationship between dry density and moisture content.
Apparatus
• Mold – Cylindrical mold made of metal with the dimensions shown in Table 1 or Table2. If permitted by the agency, the mold may be of the “split” type, consisting of two half-round sections, which can be securely locked in place to form a cylinder. Determine themold volume according to Annex B, Standardization of the Mold.
• Mold assembly – Mold, base plate, and a detachable collar.
• Rammer –Manually or mechanically-operated rammers as detailed in Table 1 or Table 2.A manually-operated rammer shall be equipped with a guide sleeve to control the pathand height of drop. The guide sleeve shall have at least four vent holes no smaller than9.5 mm (3/8 in.) in diameter, spaced approximately 90 degrees apart and approximately19 mm (3/4 in.) from each end. A mechanically-operated rammer will uniformlydistribute blows over the sample and will be calibrated with several soil types, and beadjusted, if necessary, to give the same moisture-density results as with the manuallyoperated rammer. For additional information concerning calibration, see the FOP forAASHTO T 99 and T 180.
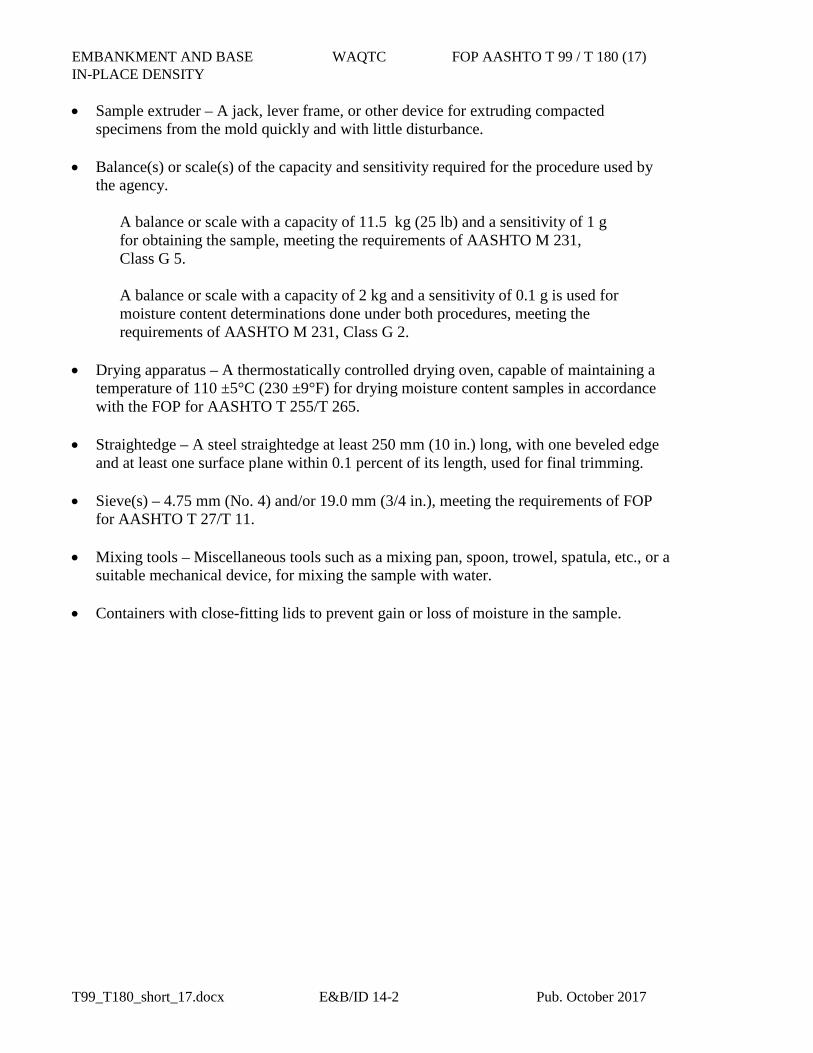
EMBANKMENT AND BASE WAQTC FOP AASHTO T 99 / T 180 (17) IN-PLACE DENSITY
T99_T180_short_17.docx E&B/ID 14-2 Pub. October 2017
• Sample extruder – A jack, lever frame, or other device for extruding compacted specimens from the mold quickly and with little disturbance.
• Balance(s) or scale(s) of the capacity and sensitivity required for the procedure used by
the agency.
A balance or scale with a capacity of 11.5 kg (25 lb) and a sensitivity of 1 g for obtaining the sample, meeting the requirements of AASHTO M 231, Class G 5. A balance or scale with a capacity of 2 kg and a sensitivity of 0.1 g is used for moisture content determinations done under both procedures, meeting the requirements of AASHTO M 231, Class G 2.
• Drying apparatus – A thermostatically controlled drying oven, capable of maintaining a
temperature of 110 ±5°C (230 ±9°F) for drying moisture content samples in accordance with the FOP for AASHTO T 255/T 265.
• Straightedge – A steel straightedge at least 250 mm (10 in.) long, with one beveled edge
and at least one surface plane within 0.1 percent of its length, used for final trimming. • Sieve(s) – 4.75 mm (No. 4) and/or 19.0 mm (3/4 in.), meeting the requirements of FOP
for AASHTO T 27/T 11. • Mixing tools – Miscellaneous tools such as a mixing pan, spoon, trowel, spatula, etc., or a
suitable mechanical device, for mixing the sample with water. • Containers with close-fitting lids to prevent gain or loss of moisture in the sample.
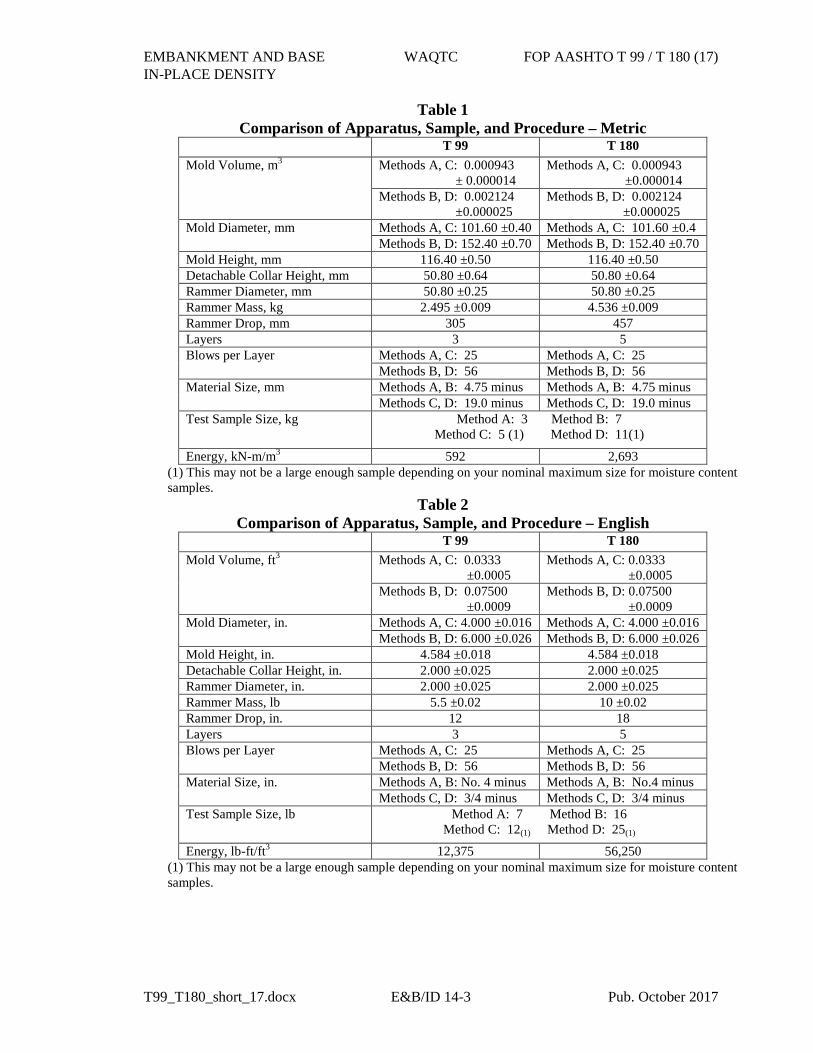
EMBANKMENT AND BASE WAQTC FOP AASHTO T 99 / T 180 (17) IN-PLACE DENSITY
T99_T180_short_17.docx E&B/ID 14-3 Pub. October 2017
Table 1 Comparison of Apparatus, Sample, and Procedure – Metric
T 99 T 180 Mold Volume, m3 Methods A, C: 0.000943
± 0.000014 Methods A, C: 0.000943
±0.000014 Methods B, D: 0.002124
±0.000025 Methods B, D: 0.002124
±0.000025 Mold Diameter, mm Methods A, C: 101.60 ±0.40 Methods A, C: 101.60 ±0.4
Methods B, D: 152.40 ±0.70 Methods B, D: 152.40 ±0.70 Mold Height, mm 116.40 ±0.50 116.40 ±0.50 Detachable Collar Height, mm 50.80 ±0.64 50.80 ±0.64 Rammer Diameter, mm 50.80 ±0.25 50.80 ±0.25 Rammer Mass, kg 2.495 ±0.009 4.536 ±0.009 Rammer Drop, mm 305 457 Layers 3 5 Blows per Layer Methods A, C: 25 Methods A, C: 25
Methods B, D: 56 Methods B, D: 56 Material Size, mm Methods A, B: 4.75 minus Methods A, B: 4.75 minus
Methods C, D: 19.0 minus Methods C, D: 19.0 minus Test Sample Size, kg Method A: 3 Method B: 7
Method C: 5 (1) Method D: 11(1)
Energy, kN-m/m3 592 2,693 (1) This may not be a large enough sample depending on your nominal maximum size for moisture contentsamples.
Table 2 Comparison of Apparatus, Sample, and Procedure – English
T 99 T 180 Mold Volume, ft3 Methods A, C: 0.0333
±0.0005 Methods A, C: 0.0333
±0.0005 Methods B, D: 0.07500
±0.0009 Methods B, D: 0.07500
±0.0009 Mold Diameter, in. Methods A, C: 4.000 ±0.016 Methods A, C: 4.000 ±0.016
Methods B, D: 6.000 ±0.026 Methods B, D: 6.000 ±0.026 Mold Height, in. 4.584 ±0.018 4.584 ±0.018 Detachable Collar Height, in. 2.000 ±0.025 2.000 ±0.025 Rammer Diameter, in. 2.000 ±0.025 2.000 ±0.025 Rammer Mass, lb 5.5 ±0.02 10 ±0.02 Rammer Drop, in. 12 18 Layers 3 5 Blows per Layer Methods A, C: 25 Methods A, C: 25
Methods B, D: 56 Methods B, D: 56 Material Size, in. Methods A, B: No. 4 minus Methods A, B: No.4 minus
Methods C, D: 3/4 minus Methods C, D: 3/4 minus Test Sample Size, lb Method A: 7 Method B: 16
Method C: 12(1) Method D: 25(1)
Energy, lb-ft/ft3 12,375 56,250 (1) This may not be a large enough sample depending on your nominal maximum size for moisture contentsamples.
EMBANKMENT AND BASE WAQTC FOP AASHTO T 99 / T 180 (17) IN-PLACE DENSITY
T99_T180_short_17.docx E&B/ID 14-4 Pub. October 2017
Sample
If the sample is damp, dry it until it becomes friable under a trowel. Drying may be in air or by use of a drying apparatus maintained at a temperature not exceeding 60°C (140°F). Thoroughly break up aggregations in a manner that avoids reducing the natural size of individual particles.
Obtain a representative test sample of the mass required by the agency by passing the material through the sieve required by the agency. See Table 1 or Table 2 for test sample mass and material size requirements.
In instances where the material is prone to degradation, i.e., granular material, a compaction sample with differing moisture contents should be prepared for each point. Note 1: Both T 99 and T 180 have four methods (A, B, C, D) that require different masses and employ
different sieves.
Note 2: If the sample is plastic (clay types), it should stand for a minimum of 12 hours after the addition of water to allow the moisture to be absorbed. In this case, several samples at different moisture contents should be prepared, put in sealed containers and tested the next day.
Procedure
During compaction, rest the mold firmly on a dense, uniform, rigid, and stable foundation or base. This base shall remain stationary during the compaction process.
1. Determine the mass of the clean, dry mold. Include the base plate, but exclude theextension collar. Record the mass to the nearest 1 g (0.005 lb).
2. Thoroughly mix the selected representative sample with sufficient water to dampen it toapproximately 4 to 8 percentage points below optimum moisture content. See Note 2.For many materials, this condition can be identified by forming a cast by hand.
3. Form a specimen by compacting the prepared soil in the mold assembly in approximatelyequal layers. For each layer:
a. Spread the loose material uniformly in the mold.Note 3: It is recommended to cover the remaining material with a non-absorbent sheet or damp cloth to
minimize loss of moisture.
b. Lightly tamp the loose material with the manual rammer or other similar device, thisestablishes a firm surface.
c. Compact each layer with uniformly distributed blows from the rammer. See Table 1for mold size, number of layers, number of blows, and rammer specification for thevarious test methods. Use the method specified by the agency.
d. Trim down material that has not been compacted and remains adjacent to the walls ofthe mold and extends above the compacted surface.
EMBANKMENT AND BASE WAQTC FOP AASHTO T 99 / T 180 (17) IN-PLACE DENSITY
T99_T180_short_17.docx E&B/ID 14-5 Pub. October 2017
4. Remove the extension collar. Avoid shearing off the sample below the top of the mold. The material compacted in the mold should not be over 6 mm (¼ in.) above the top of the mold once the collar has been removed.
5. Trim the compacted soil even with the top of the mold with the beveled side of the
straightedge. 6. Determine and record the mass of the mold, base plate, and wet soil to the nearest 1 g
(0.005 lb) or better. 7. Determine and record the wet mass (Mw) of the sample by subtracting the mass in Step 1
from the mass in Step 6. 8. Calculate the wet density, in kg/m3 (lb/ft3), by dividing the wet mass by the measured
volume (Vm). 9. Extrude the material from the mold. For soils and soil-aggregate mixtures, slice vertically
through the center and take a representative moisture content sample from one of the cut faces, ensuring that all layers are represented. For granular materials, a vertical face will not exist. Take a representative sample. This sample must meet the sample size requirements of the test method used to determine moisture content.
Note 4: When developing a curve for free-draining soils such as uniform sands and gravels, where seepage occurs at the bottom of the mold and base plate, taking a representative moisture content from the mixing bowl may be preferred in order to determine the amount of moisture available for compaction.
10. Determine and record the moisture content of the sample in accordance with the FOP for AASHTO T 255 / T 265.
11. Thoroughly break up the remaining portion of the molded specimen until it will again
pass through the sieve, as judged by eye, and add to the remaining portion of the sample being tested. See Note 2.
12. Add sufficient water to increase the moisture content of the remaining soil by 1 to 2 percentage points and repeat steps 3 through 11.
13. Continue determinations until there is either a decrease or no change in the wet mass.
There will be a minimum of three points on the dry side of the curve and two points on the wet side. For non-cohesive, drainable soils, one point on the wet side is sufficient.
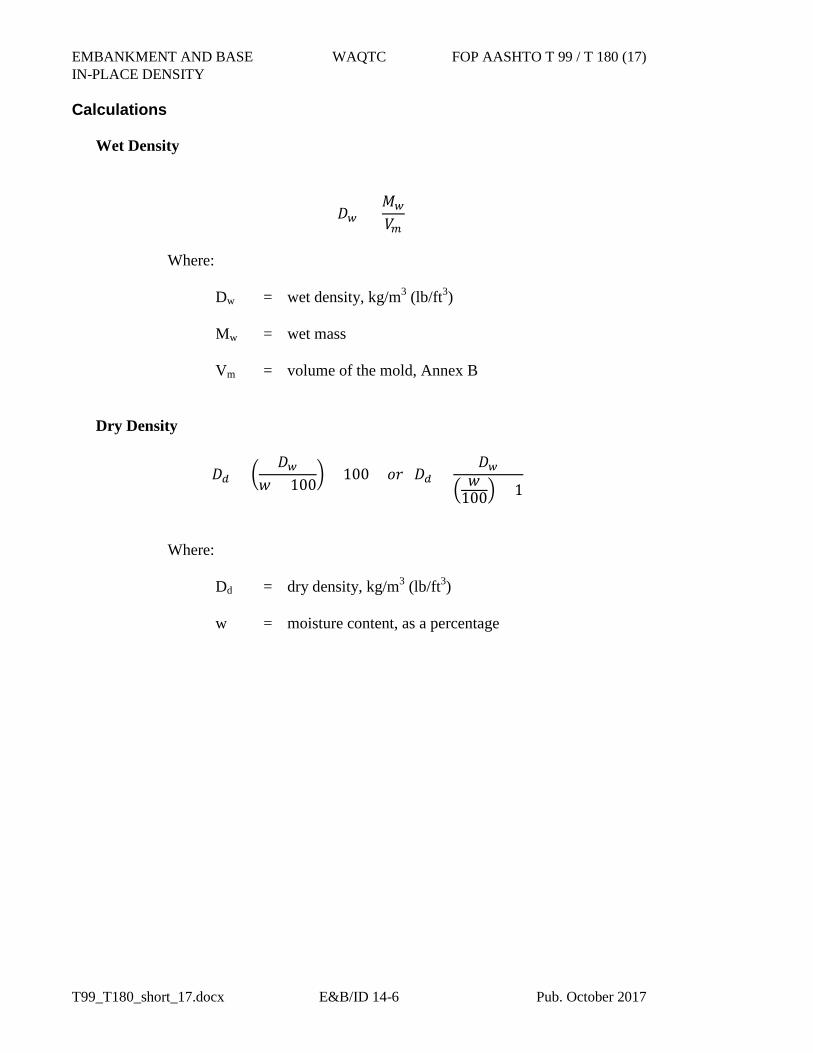
EMBANKMENT AND BASE WAQTC FOP AASHTO T 99 / T 180 (17) IN-PLACE DENSITY
T99_T180_short_17.docx E&B/ID 14-6 Pub. October 2017
Calculations
Wet Density
𝐷𝐷𝑤𝑤 = 𝑀𝑀𝑤𝑤
𝑉𝑉𝑚𝑚
Where:
Dw = wet density, kg/m3 (lb/ft3)
Mw = wet mass
Vm = volume of the mold, Annex B
Dry Density
𝐷𝐷𝑑𝑑 = �𝐷𝐷𝑤𝑤
𝑤𝑤 + 100� × 100 𝑜𝑜𝑜𝑜 𝐷𝐷𝑑𝑑 =
𝐷𝐷𝑤𝑤� 𝑤𝑤100� + 1
Where:
Dd = dry density, kg/m3 (lb/ft3)
w = moisture content, as a percentage
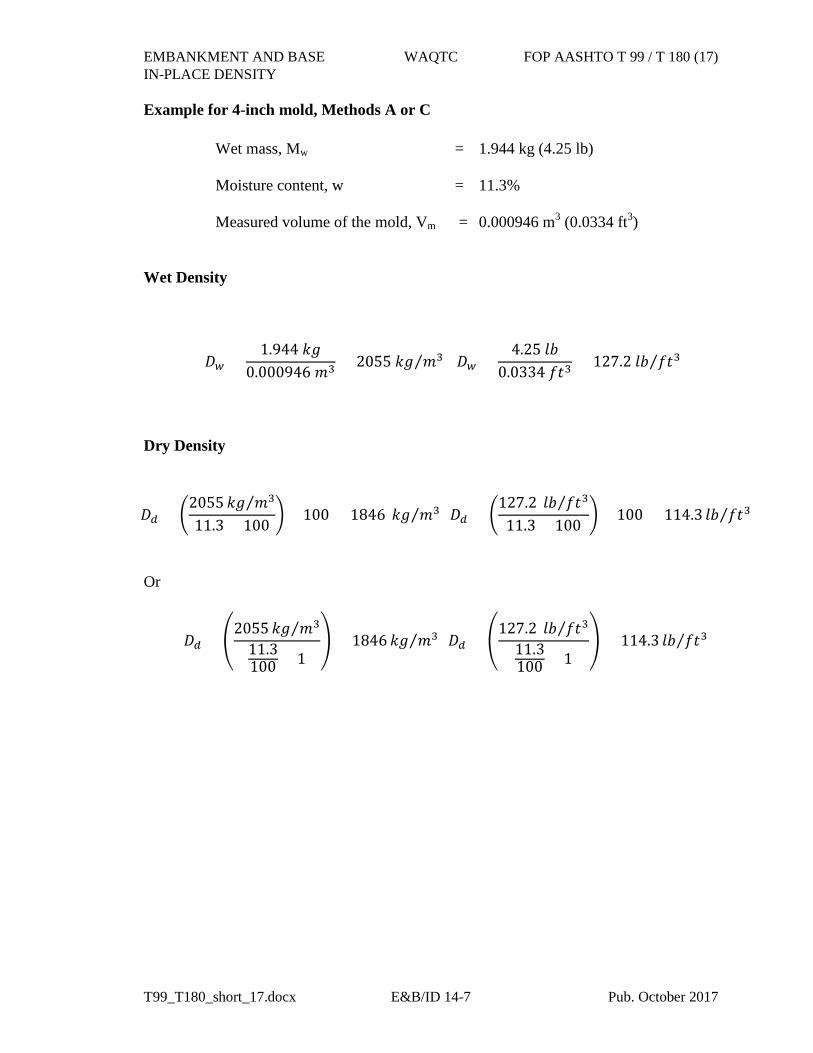
EMBANKMENT AND BASE WAQTC FOP AASHTO T 99 / T 180 (17) IN-PLACE DENSITY
T99_T180_short_17.docx E&B/ID 14-7 Pub. October 2017
Example for 4-inch mold, Methods A or C
Wet mass, Mw = 1.944 kg (4.25 lb) Moisture content, w = 11.3% Measured volume of the mold, Vm = 0.000946 m3 (0.0334 ft3)
Wet Density
𝐷𝐷𝑤𝑤 =1.944 𝑘𝑘𝑘𝑘
0.000946 𝑚𝑚3 = 2055 𝑘𝑘𝑘𝑘 𝑚𝑚3⁄ 𝐷𝐷𝑤𝑤 =4.25 𝑙𝑙𝑙𝑙
0.0334 𝑓𝑓𝑓𝑓3= 127.2 𝑙𝑙𝑙𝑙 𝑓𝑓𝑓𝑓3⁄
Dry Density
𝐷𝐷𝑑𝑑 = �2055 𝑘𝑘𝑘𝑘 𝑚𝑚3⁄11.3 + 100
� × 100 = 1846 𝑘𝑘𝑘𝑘 𝑚𝑚3⁄ 𝐷𝐷𝑑𝑑 = �127.2 𝑙𝑙𝑙𝑙 𝑓𝑓𝑓𝑓3⁄
11.3 + 100� × 100 = 114.3 𝑙𝑙𝑙𝑙 𝑓𝑓𝑓𝑓3⁄
Or
𝐷𝐷𝑑𝑑 = �2055 𝑘𝑘𝑘𝑘 𝑚𝑚3⁄
11.3100 + 1
� = 1846 𝑘𝑘𝑘𝑘 𝑚𝑚3⁄ 𝐷𝐷𝑑𝑑 = �127.2 𝑙𝑙𝑙𝑙 𝑓𝑓𝑓𝑓3⁄
11.3100 + 1
� = 114.3 𝑙𝑙𝑙𝑙 𝑓𝑓𝑓𝑓3⁄
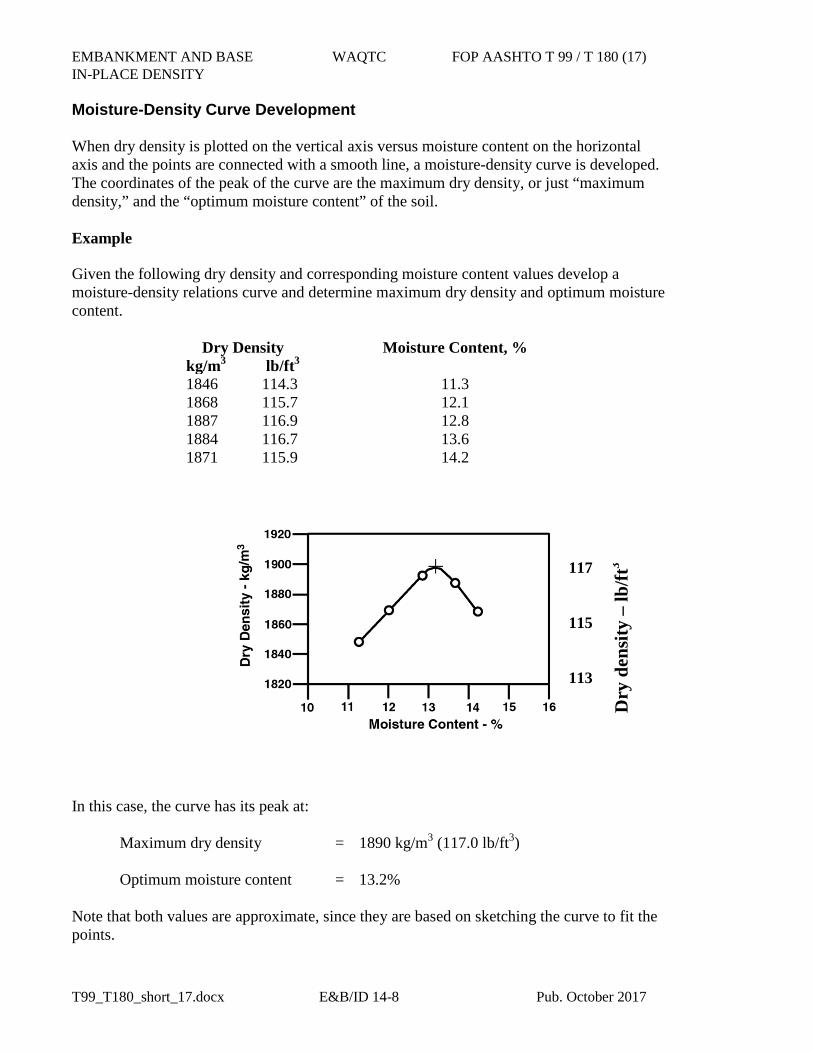
EMBANKMENT AND BASE WAQTC FOP AASHTO T 99 / T 180 (17) IN-PLACE DENSITY
T99_T180_short_17.docx E&B/ID 14-8 Pub. October 2017
Moisture-Density Curve Development
When dry density is plotted on the vertical axis versus moisture content on the horizontal axis and the points are connected with a smooth line, a moisture-density curve is developed. The coordinates of the peak of the curve are the maximum dry density, or just “maximum density,” and the “optimum moisture content” of the soil.
Example
Given the following dry density and corresponding moisture content values develop a moisture-density relations curve and determine maximum dry density and optimum moisture content.
Dry Density kg/m3 lb/ft3
Moisture Content, %
1846 114.3 11.3 1868 115.7 12.1 1887 116.9 12.8 1884 116.7 13.6 1871 115.9 14.2
117
115
113
In this case, the curve has its peak at:
Maximum dry density = 1890 kg/m3 (117.0 lb/ft3)
Optimum moisture content = 13.2%
Note that both values are approximate, since they are based on sketching the curve to fit the points.
Dry
den
sity
– lb
/ft3

EMBANKMENT AND BASE WAQTC FOP AASHTO T 99 / T 180 (17) IN-PLACE DENSITY
T99_T180_short_17.docx E&B/ID 14-9 Pub. October 2017
Report
• Results on forms approved by the agency • Sample ID • Maximum dry density to the closest 1 kg/m3 (0.1 lb/ft3) • Optimum moisture content to the closest 0.1 percent
EMBANKMENT AND BASE WAQTC FOP AASHTO T 99 / T 180 (17) IN-PLACE DENSITY
T99_T180_short_17.docx E&B/ID 14-10 Pub. October 2017
ANNEX A
CORRECTION OF MAXIMUM DRY DENSITY AND OPTIMUM MOISTURE FOR OVERSIZED PARTICLES
This section corrects the maximum dry density and moisture content of the material retained on the 4.75 mm (No. 4) sieve, Methods A and B; or the material retained on the 19 mm (¾ in.) sieve, Methods C and D. The maximum dry density, corrected for oversized particles and total moisture content, are compared with the field-dry density and field moisture content.
This correction can be applied to the sample on which the maximum dry density is performed. A correction may not be practical for soils with only a small percentage of oversize material. The agency shall specify a minimum percentage below which the method is not needed. If not specified, this method applies when more than 5 percent by weight of oversize particles is present.
Bulk specific gravity (Gsb) of the oversized particles is required to determine the corrected maximum dry density. Use the bulk specific gravity as determined using the FOP for AASHTO T 85 in the calculations. For construction activities, an agency established value or specific gravity of 2.600 may be used.
This correction can also be applied to the sample obtained from the field while performing in-place density.
1. Use the sample from this procedure or a sample obtained according to the FOP forAASHTO T 310.
2. Sieve the sample on the 4.75 mm (No. 4) sieve for Methods A and B or the 19 mm (¾ in.)sieve, Methods C and D.
3. Determine the dry mass of the oversized and fine fractions (MDC and MDF) by one of thefollowing:
a. Dry the fractions, fine and oversized, in air or by use of a drying apparatus that ismaintained at a temperature not exceeding 60ºC (140ºF).
b. Calculate the dry masses using the moisture samples.
To determine the dry mass of the fractions using moisture samples.
1. Determine the moist mass of both fractions, fine (MMf) and oversized (MMc):
2. Obtain moisture samples from the fine and oversized material.
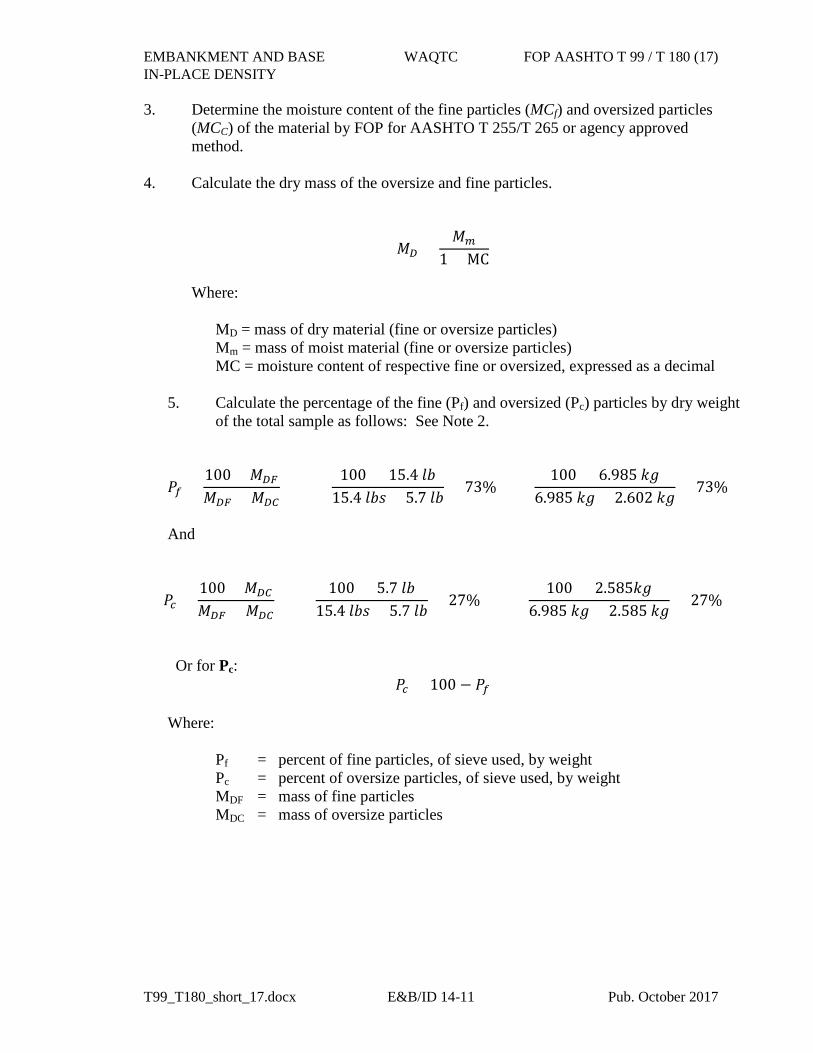
EMBANKMENT AND BASE WAQTC FOP AASHTO T 99 / T 180 (17) IN-PLACE DENSITY
T99_T180_short_17.docx E&B/ID 14-11 Pub. October 2017
3. Determine the moisture content of the fine particles (MCf) and oversized particles (MCC) of the material by FOP for AASHTO T 255/T 265 or agency approved method.
4. Calculate the dry mass of the oversize and fine particles.
𝑀𝑀𝐷𝐷 =𝑀𝑀𝑚𝑚
1 + MC
Where:
MD = mass of dry material (fine or oversize particles) Mm = mass of moist material (fine or oversize particles) MC = moisture content of respective fine or oversized, expressed as a decimal
5. Calculate the percentage of the fine (Pf) and oversized (Pc) particles by dry weight
of the total sample as follows: See Note 2.
𝑃𝑃𝑓𝑓 =100 × 𝑀𝑀𝐷𝐷𝐷𝐷
𝑀𝑀𝐷𝐷𝐷𝐷 + 𝑀𝑀𝐷𝐷𝐷𝐷
100 × 15.4 𝑙𝑙𝑙𝑙15.4 𝑙𝑙𝑙𝑙𝑙𝑙 + 5.7 𝑙𝑙𝑙𝑙
= 73% 100 × 6.985 𝑘𝑘𝑘𝑘
6.985 𝑘𝑘𝑘𝑘 + 2.602 𝑘𝑘𝑘𝑘= 73%
And
𝑃𝑃𝑐𝑐 =100 × 𝑀𝑀𝐷𝐷𝐷𝐷
𝑀𝑀𝐷𝐷𝐷𝐷 + 𝑀𝑀𝐷𝐷𝐷𝐷
100 × 5.7 𝑙𝑙𝑙𝑙15.4 𝑙𝑙𝑙𝑙𝑙𝑙 + 5.7 𝑙𝑙𝑙𝑙
= 27% 100 × 2.585𝑘𝑘𝑘𝑘
6.985 𝑘𝑘𝑘𝑘 + 2.585 𝑘𝑘𝑘𝑘= 27%
Or for Pc:
𝑃𝑃𝑐𝑐 = 100 − 𝑃𝑃𝑓𝑓 Where:
Pf = percent of fine particles, of sieve used, by weight Pc = percent of oversize particles, of sieve used, by weight MDF = mass of fine particles MDC = mass of oversize particles
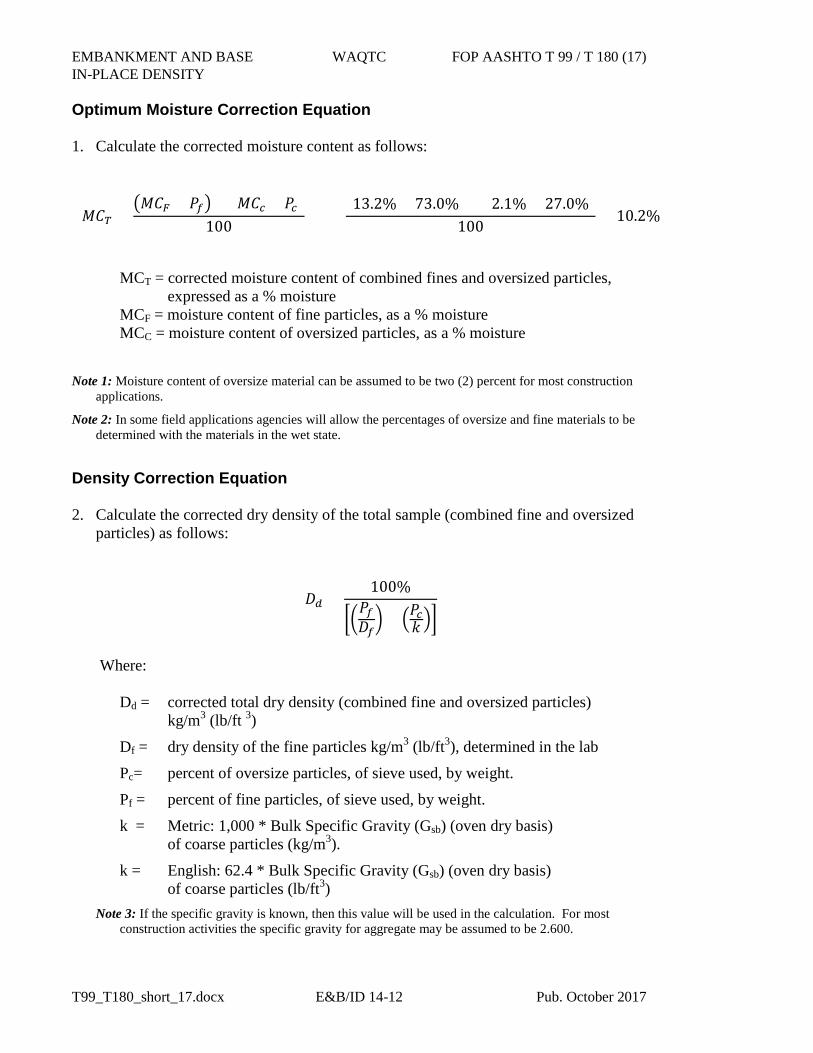
EMBANKMENT AND BASE WAQTC FOP AASHTO T 99 / T 180 (17) IN-PLACE DENSITY
T99_T180_short_17.docx E&B/ID 14-12 Pub. October 2017
Optimum Moisture Correction Equation
1. Calculate the corrected moisture content as follows:
𝑀𝑀𝑀𝑀𝑇𝑇 =�𝑀𝑀𝑀𝑀𝐷𝐷 × 𝑃𝑃𝑓𝑓� + (𝑀𝑀𝑀𝑀𝑐𝑐 × 𝑃𝑃𝑐𝑐)
100(13.2% × 73.0%) + (2.1% × 27.0%)
100= 10.2%
MCT = corrected moisture content of combined fines and oversized particles, expressed as a % moisture
MCF = moisture content of fine particles, as a % moisture MCC = moisture content of oversized particles, as a % moisture
Note 1: Moisture content of oversize material can be assumed to be two (2) percent for most construction applications.
Note 2: In some field applications agencies will allow the percentages of oversize and fine materials to be determined with the materials in the wet state.
Density Correction Equation
2. Calculate the corrected dry density of the total sample (combined fine and oversizedparticles) as follows:
𝐷𝐷𝑑𝑑 =100%
��𝑃𝑃𝑓𝑓𝐷𝐷𝑓𝑓� + �𝑃𝑃𝑐𝑐𝑘𝑘 ��
Where:
Dd = corrected total dry density (combined fine and oversized particles) kg/m3 (lb/ft 3)
Df = dry density of the fine particles kg/m3 (lb/ft3), determined in the lab
Pc= percent of oversize particles, of sieve used, by weight.
Pf = percent of fine particles, of sieve used, by weight.
k = Metric: 1,000 * Bulk Specific Gravity (Gsb) (oven dry basis) of coarse particles (kg/m3).
k = English: 62.4 * Bulk Specific Gravity (Gsb) (oven dry basis) of coarse particles (lb/ft3)
Note 3: If the specific gravity is known, then this value will be used in the calculation. For most construction activities the specific gravity for aggregate may be assumed to be 2.600.
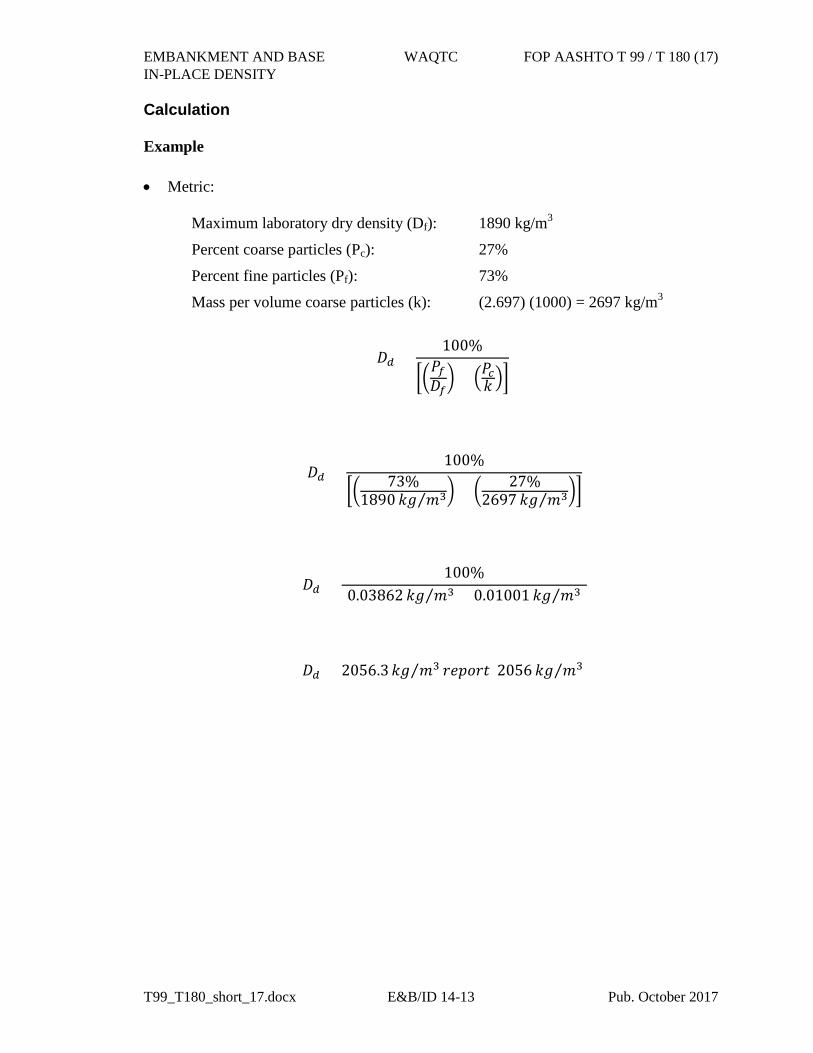
EMBANKMENT AND BASE WAQTC FOP AASHTO T 99 / T 180 (17) IN-PLACE DENSITY
T99_T180_short_17.docx E&B/ID 14-13 Pub. October 2017
Calculation
Example
• Metric:
Maximum laboratory dry density (Df): 1890 kg/m3
Percent coarse particles (Pc): 27%
Percent fine particles (Pf): 73%
Mass per volume coarse particles (k): (2.697) (1000) = 2697 kg/m3
𝐷𝐷𝑑𝑑 =100%
��𝑃𝑃𝑓𝑓𝐷𝐷𝑓𝑓� + �𝑃𝑃𝑐𝑐𝑘𝑘 ��
𝐷𝐷𝑑𝑑 =100%
�� 73%1890 𝑘𝑘𝑘𝑘 𝑚𝑚3⁄ � + � 27%
2697 𝑘𝑘𝑘𝑘 𝑚𝑚3⁄ ��
𝐷𝐷𝑑𝑑 =100%
[0.03862 𝑘𝑘𝑘𝑘 𝑚𝑚3⁄ + 0.01001 𝑘𝑘𝑘𝑘 𝑚𝑚3⁄ ]
𝐷𝐷𝑑𝑑 = 2056.3𝑘𝑘𝑘𝑘 𝑚𝑚3⁄ 𝑜𝑜𝑟𝑟𝑟𝑟𝑜𝑜𝑜𝑜𝑓𝑓 2056 𝑘𝑘𝑘𝑘 𝑚𝑚3⁄
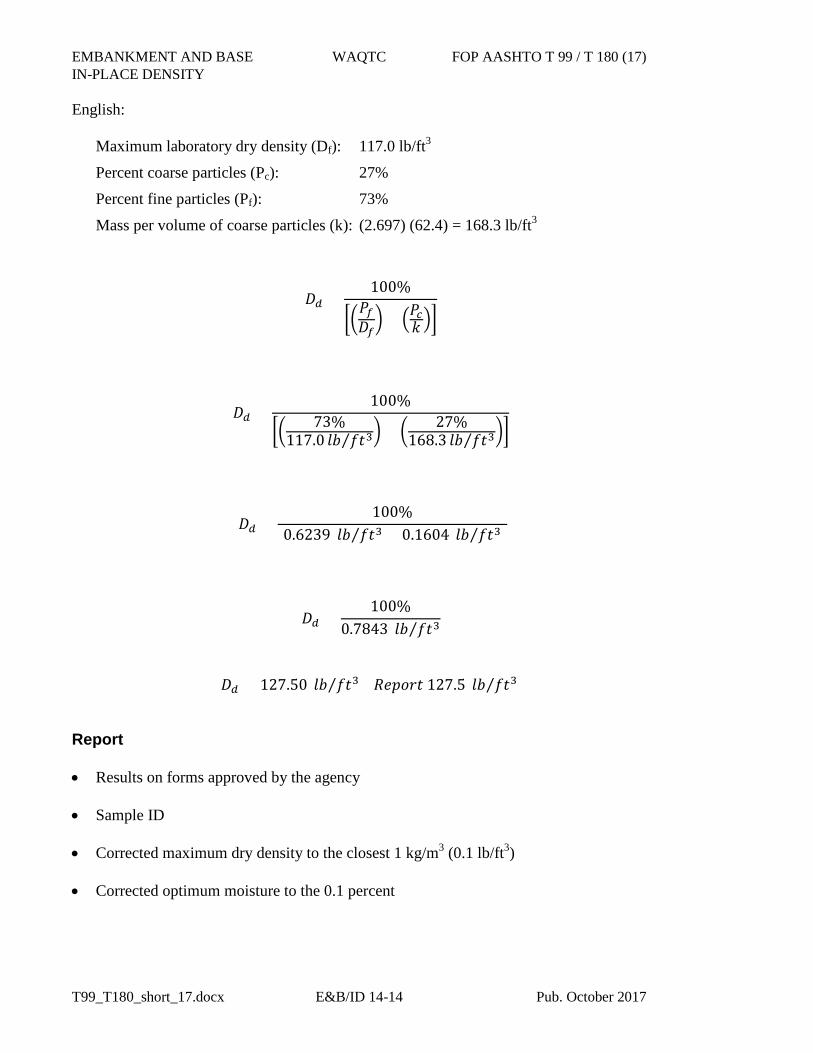
EMBANKMENT AND BASE WAQTC FOP AASHTO T 99 / T 180 (17) IN-PLACE DENSITY
T99_T180_short_17.docx E&B/ID 14-14 Pub. October 2017
English:
Maximum laboratory dry density (Df): 117.0 lb/ft3
Percent coarse particles (Pc): 27%
Percent fine particles (Pf): 73%
Mass per volume of coarse particles (k): (2.697) (62.4) = 168.3 lb/ft3
𝐷𝐷𝑑𝑑 =100%
��𝑃𝑃𝑓𝑓𝐷𝐷𝑓𝑓� + �𝑃𝑃𝑐𝑐𝑘𝑘 ��
𝐷𝐷𝑑𝑑 =100%
�� 73%117.0 𝑙𝑙𝑙𝑙 𝑓𝑓𝑓𝑓3⁄ � + � 27%
168.3 𝑙𝑙𝑙𝑙 𝑓𝑓𝑓𝑓3⁄ ��
𝐷𝐷𝑑𝑑 =100%
[0.6239 𝑙𝑙𝑙𝑙 𝑓𝑓𝑓𝑓3⁄ + 0.1604 𝑙𝑙𝑙𝑙 𝑓𝑓𝑓𝑓3⁄ ]
𝐷𝐷𝑑𝑑 =100%
0.7843 𝑙𝑙𝑙𝑙 𝑓𝑓𝑓𝑓3⁄
𝐷𝐷𝑑𝑑 = 127.50 𝑙𝑙𝑙𝑙 𝑓𝑓𝑓𝑓3 𝑅𝑅𝑟𝑟𝑟𝑟𝑜𝑜𝑜𝑜𝑓𝑓 127.5 𝑙𝑙𝑙𝑙 𝑓𝑓𝑓𝑓3⁄ ⁄
Report
• Results on forms approved by the agency
• Sample ID
• Corrected maximum dry density to the closest 1 kg/m3 (0.1 lb/ft3)
• Corrected optimum moisture to the 0.1 percent
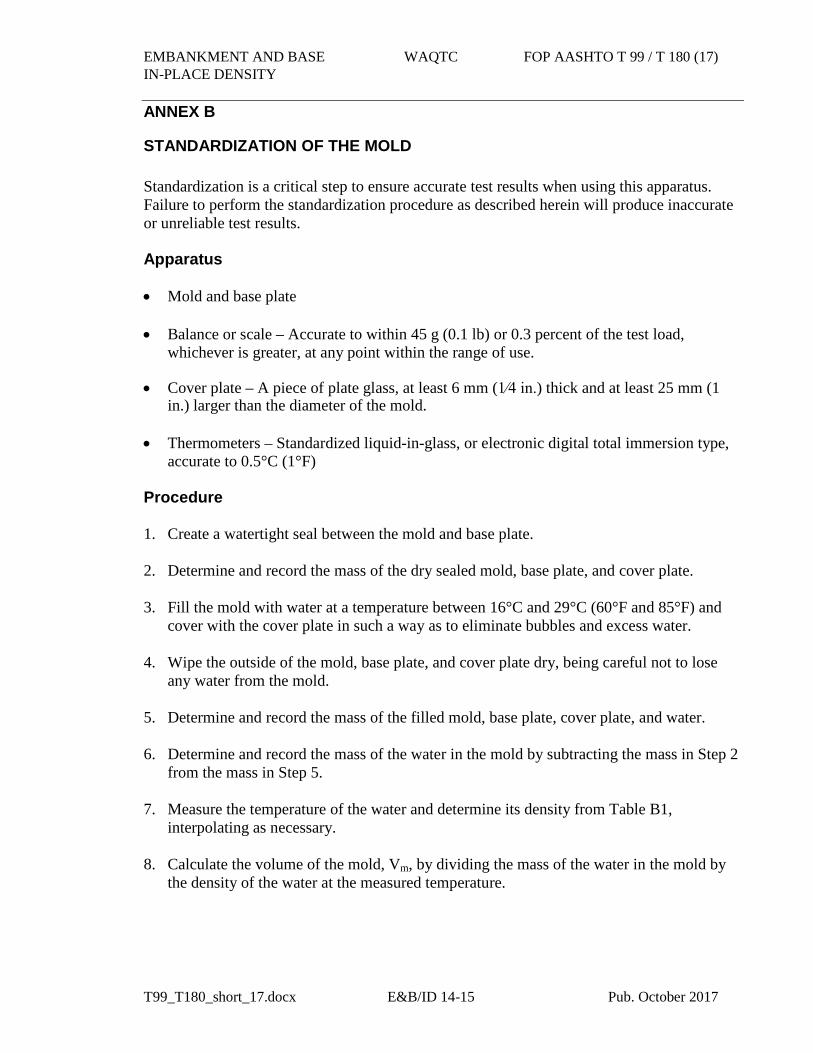
EMBANKMENT AND BASE WAQTC FOP AASHTO T 99 / T 180 (17) IN-PLACE DENSITY
T99_T180_short_17.docx E&B/ID 14-15 Pub. October 2017
ANNEX B
STANDARDIZATION OF THE MOLD
Standardization is a critical step to ensure accurate test results when using this apparatus. Failure to perform the standardization procedure as described herein will produce inaccurate or unreliable test results.
Apparatus
• Mold and base plate
• Balance or scale – Accurate to within 45 g (0.1 lb) or 0.3 percent of the test load,whichever is greater, at any point within the range of use.
• Cover plate – A piece of plate glass, at least 6 mm (1⁄4 in.) thick and at least 25 mm (1in.) larger than the diameter of the mold.
• Thermometers – Standardized liquid-in-glass, or electronic digital total immersion type,accurate to 0.5°C (1°F)
Procedure
1. Create a watertight seal between the mold and base plate.
2. Determine and record the mass of the dry sealed mold, base plate, and cover plate.
3. Fill the mold with water at a temperature between 16°C and 29°C (60°F and 85°F) andcover with the cover plate in such a way as to eliminate bubbles and excess water.
4. Wipe the outside of the mold, base plate, and cover plate dry, being careful not to loseany water from the mold.
5. Determine and record the mass of the filled mold, base plate, cover plate, and water.
6. Determine and record the mass of the water in the mold by subtracting the mass in Step 2from the mass in Step 5.
7. Measure the temperature of the water and determine its density from Table B1,interpolating as necessary.
8. Calculate the volume of the mold, Vm, by dividing the mass of the water in the mold bythe density of the water at the measured temperature.
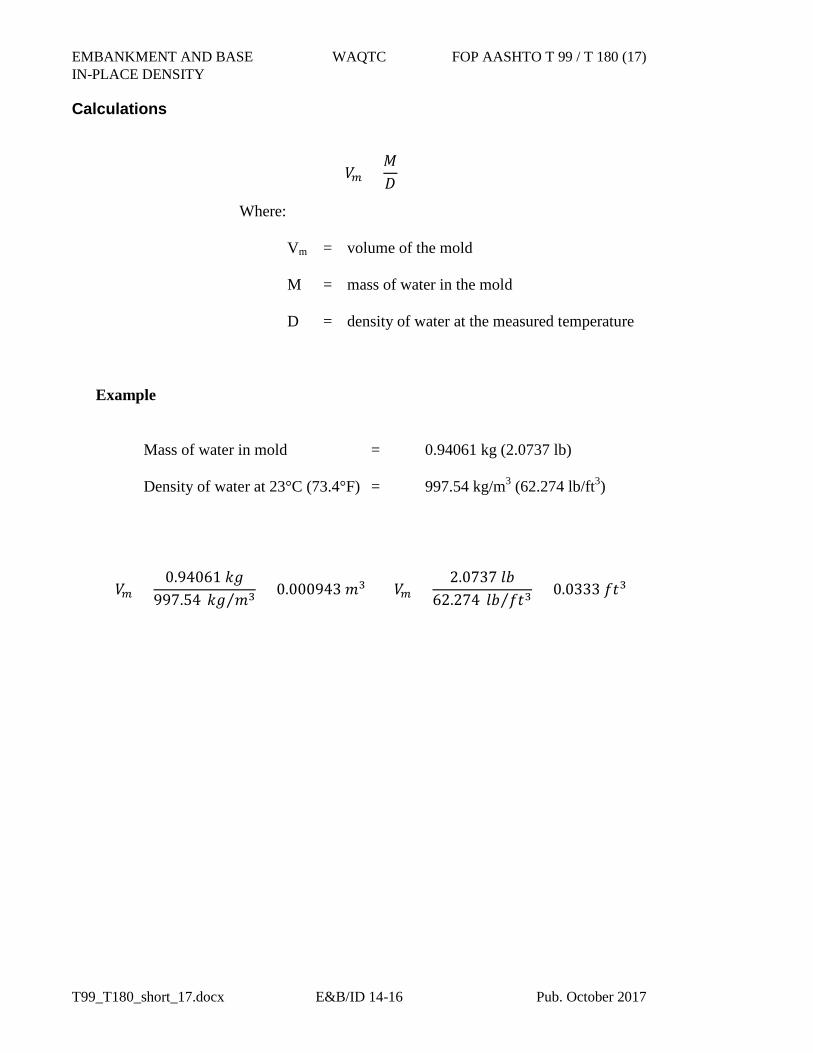
EMBANKMENT AND BASE WAQTC FOP AASHTO T 99 / T 180 (17) IN-PLACE DENSITY
T99_T180_short_17.docx E&B/ID 14-16 Pub. October 2017
Calculations
𝑉𝑉𝑚𝑚 =𝑀𝑀𝐷𝐷
Where:
Vm = volume of the mold M = mass of water in the mold D = density of water at the measured temperature
Example
Mass of water in mold = 0.94061 kg (2.0737 lb) Density of water at 23°C (73.4°F) = 997.54 kg/m3 (62.274 lb/ft3)
𝑉𝑉𝑚𝑚 =0.94061 𝑘𝑘𝑘𝑘
997.54 𝑘𝑘𝑘𝑘 𝑚𝑚3⁄ = 0.000943 𝑚𝑚3 𝑉𝑉𝑚𝑚 =2.0737 𝑙𝑙𝑙𝑙
62.274 𝑙𝑙𝑙𝑙 𝑓𝑓𝑓𝑓3⁄ = 0.0333 𝑓𝑓𝑓𝑓3
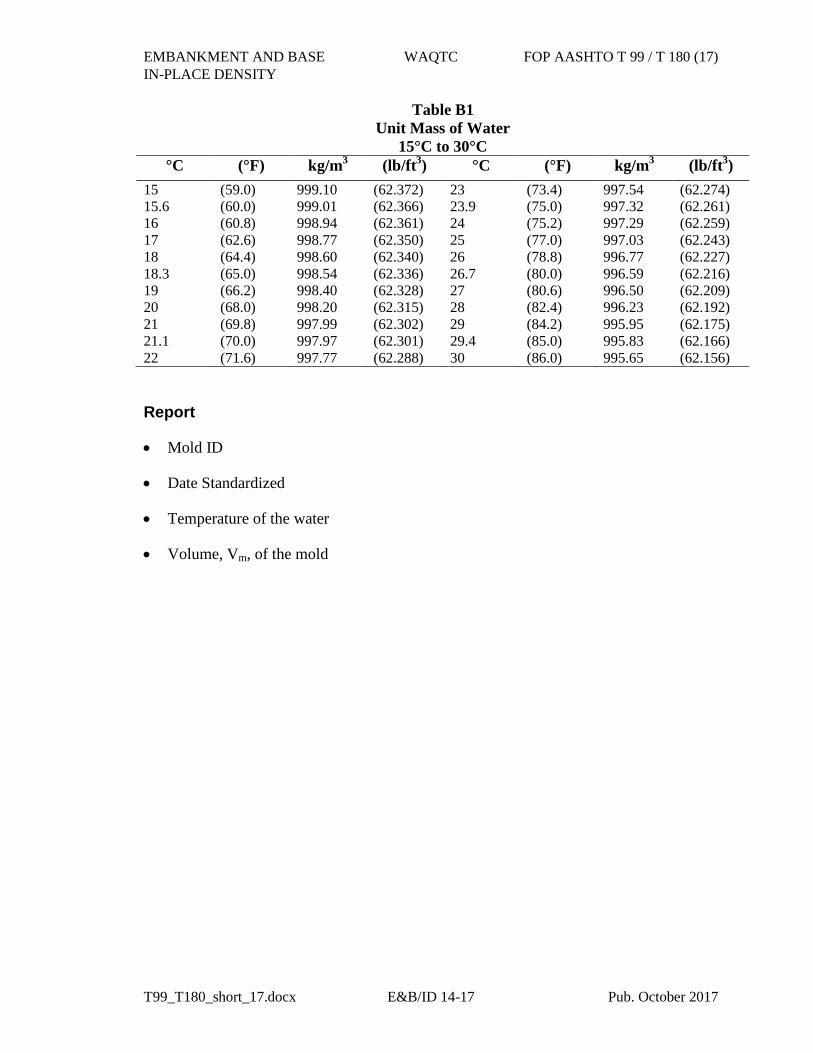
EMBANKMENT AND BASE WAQTC FOP AASHTO T 99 / T 180 (17) IN-PLACE DENSITY
T99_T180_short_17.docx E&B/ID 14-17 Pub. October 2017
Table B1 Unit Mass of Water
15°C to 30°C °C (°F) kg/m3 (lb/ft3) °C (°F) kg/m3 (lb/ft3)
15 (59.0) 999.10 (62.372) 23 (73.4) 997.54 (62.274) 15.6 (60.0) 999.01 (62.366) 23.9 (75.0) 997.32 (62.261) 16 (60.8) 998.94 (62.361) 24 (75.2) 997.29 (62.259) 17 (62.6) 998.77 (62.350) 25 (77.0) 997.03 (62.243) 18 (64.4) 998.60 (62.340) 26 (78.8) 996.77 (62.227) 18.3 (65.0) 998.54 (62.336) 26.7 (80.0) 996.59 (62.216) 19 (66.2) 998.40 (62.328) 27 (80.6) 996.50 (62.209) 20 (68.0) 998.20 (62.315) 28 (82.4) 996.23 (62.192) 21 (69.8) 997.99 (62.302) 29 (84.2) 995.95 (62.175) 21.1 (70.0) 997.97 (62.301) 29.4 (85.0) 995.83 (62.166) 22 (71.6) 997.77 (62.288) 30 (86.0) 995.65 (62.156)
Report
• Mold ID
• Date Standardized
• Temperature of the water
• Volume, Vm, of the mold

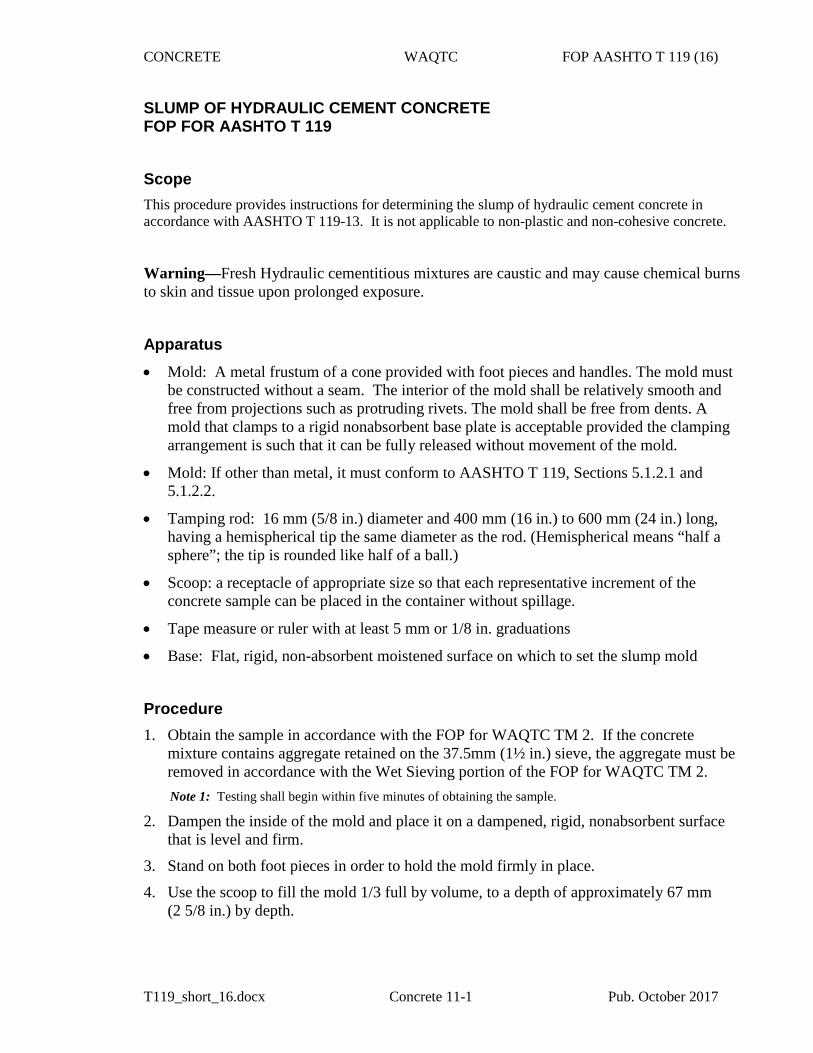
CONCRETE WAQTC FOP AASHTO T 119 (16)
T119_short_16.docx Concrete 11-1 Pub. October 2017
SLUMP OF HYDRAULIC CEMENT CONCRETE FOP FOR AASHTO T 119
Scope This procedure provides instructions for determining the slump of hydraulic cement concrete in accordance with AASHTO T 119-13. It is not applicable to non-plastic and non-cohesive concrete.
Warning—Fresh Hydraulic cementitious mixtures are caustic and may cause chemical burns to skin and tissue upon prolonged exposure.
Apparatus • Mold: A metal frustum of a cone provided with foot pieces and handles. The mold must
be constructed without a seam. The interior of the mold shall be relatively smooth andfree from projections such as protruding rivets. The mold shall be free from dents. Amold that clamps to a rigid nonabsorbent base plate is acceptable provided the clampingarrangement is such that it can be fully released without movement of the mold.
• Mold: If other than metal, it must conform to AASHTO T 119, Sections 5.1.2.1 and5.1.2.2.
• Tamping rod: 16 mm (5/8 in.) diameter and 400 mm (16 in.) to 600 mm (24 in.) long,having a hemispherical tip the same diameter as the rod. (Hemispherical means “half asphere”; the tip is rounded like half of a ball.)
• Scoop: a receptacle of appropriate size so that each representative increment of theconcrete sample can be placed in the container without spillage.
• Tape measure or ruler with at least 5 mm or 1/8 in. graduations
• Base: Flat, rigid, non-absorbent moistened surface on which to set the slump mold
Procedure 1. Obtain the sample in accordance with the FOP for WAQTC TM 2. If the concrete
mixture contains aggregate retained on the 37.5mm (1½ in.) sieve, the aggregate must beremoved in accordance with the Wet Sieving portion of the FOP for WAQTC TM 2.Note 1: Testing shall begin within five minutes of obtaining the sample.
2. Dampen the inside of the mold and place it on a dampened, rigid, nonabsorbent surfacethat is level and firm.
3. Stand on both foot pieces in order to hold the mold firmly in place.
4. Use the scoop to fill the mold 1/3 full by volume, to a depth of approximately 67 mm(2 5/8 in.) by depth.
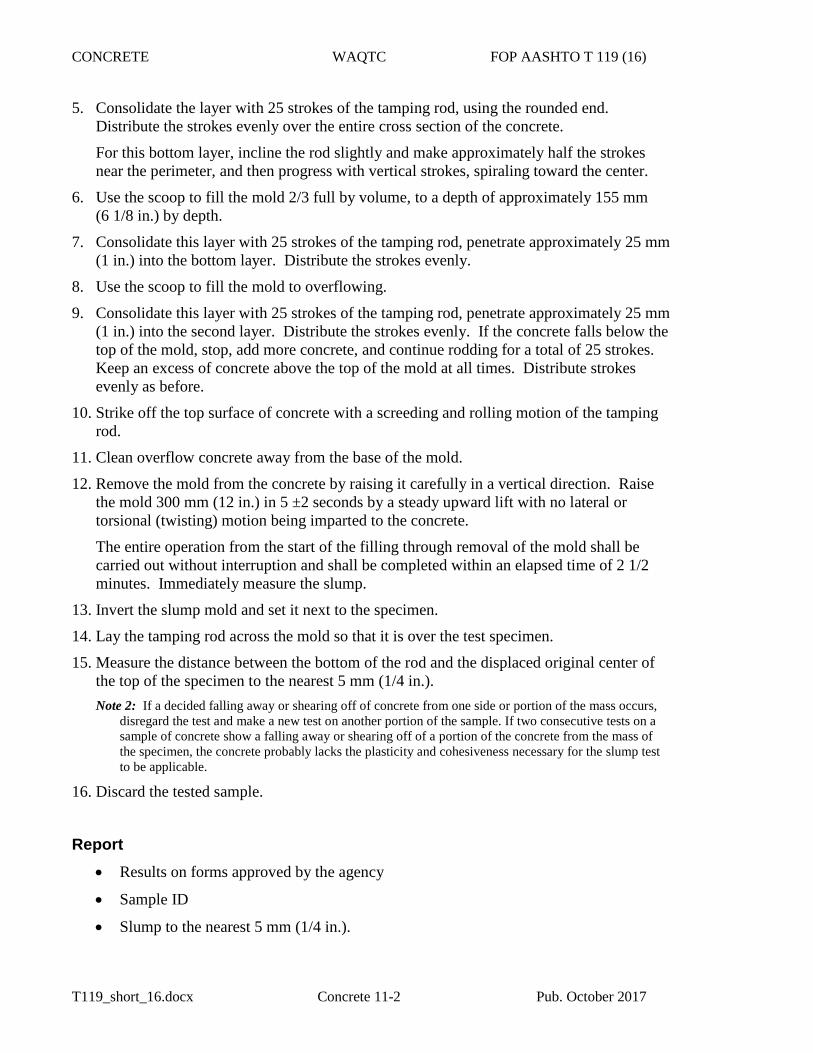
CONCRETE WAQTC FOP AASHTO T 119 (16)
T119_short_16.docx Concrete 11-2 Pub. October 2017
5. Consolidate the layer with 25 strokes of the tamping rod, using the rounded end.Distribute the strokes evenly over the entire cross section of the concrete.
For this bottom layer, incline the rod slightly and make approximately half the strokesnear the perimeter, and then progress with vertical strokes, spiraling toward the center.
6. Use the scoop to fill the mold 2/3 full by volume, to a depth of approximately 155 mm(6 1/8 in.) by depth.
7. Consolidate this layer with 25 strokes of the tamping rod, penetrate approximately 25 mm(1 in.) into the bottom layer. Distribute the strokes evenly.
8. Use the scoop to fill the mold to overflowing.
9. Consolidate this layer with 25 strokes of the tamping rod, penetrate approximately 25 mm(1 in.) into the second layer. Distribute the strokes evenly. If the concrete falls below thetop of the mold, stop, add more concrete, and continue rodding for a total of 25 strokes.Keep an excess of concrete above the top of the mold at all times. Distribute strokesevenly as before.
10. Strike off the top surface of concrete with a screeding and rolling motion of the tampingrod.
11. Clean overflow concrete away from the base of the mold.
12. Remove the mold from the concrete by raising it carefully in a vertical direction. Raisethe mold 300 mm (12 in.) in 5 ±2 seconds by a steady upward lift with no lateral ortorsional (twisting) motion being imparted to the concrete.
The entire operation from the start of the filling through removal of the mold shall becarried out without interruption and shall be completed within an elapsed time of 2 1/2minutes. Immediately measure the slump.
13. Invert the slump mold and set it next to the specimen.
14. Lay the tamping rod across the mold so that it is over the test specimen.
15. Measure the distance between the bottom of the rod and the displaced original center ofthe top of the specimen to the nearest 5 mm (1/4 in.).Note 2: If a decided falling away or shearing off of concrete from one side or portion of the mass occurs,
disregard the test and make a new test on another portion of the sample. If two consecutive tests on a sample of concrete show a falling away or shearing off of a portion of the concrete from the mass of the specimen, the concrete probably lacks the plasticity and cohesiveness necessary for the slump test to be applicable.
16. Discard the tested sample.
Report • Results on forms approved by the agency
• Sample ID
• Slump to the nearest 5 mm (1/4 in.).

October 1, 2011
To: All Holders of the Manual of Field Test Procedures
Section: Test Procedure AASHTO T 121
The Oregon Department of Transportation has specified method(s) for this Test Procedure. Please observe the following for our projects:
Under Calculations Section;
Cement Content – Actual cement content includes all Cemetitious Materials (cm), suchas but not limited to; Portland Cement, Fly Ash, Silica Fume, Ground Granulated BlastFurnace Slag and Metakaolin.
Water Content – ODOT requires liquid additives to be included.
Department of TransportationConstruction Section
800 Airport Road SE
Salem, OR 97301‐4792
Phone: (503) 986‐3000
Fax: (503) 986‐3096
CONCRETE WAQTC FOP AASHTO T 121 (17)
T121_short_17.docx Concrete 12-1 Pub. October 2017
DENSITY (UNIT WEIGHT), YIELD, AND AIR CONTENT (GRAVIMETRIC) OF CONCRETE FOP FOR AASHTO T 121
Scope
This procedure covers the determination of density, or unit weight, of freshly mixed concrete in accordance with AASHTO T 121-17. It also provides formulas for calculating the volume of concrete produced from a mixture of known quantities of component materials, and provides a method for calculating cement content and cementitious material content – the mass of cement or cementitious material per unit volume of concrete. A procedure for calculating water/cement ratio is also covered.
Warning—Fresh Hydraulic cementitious mixtures are caustic and may cause chemical burns to skin and tissue upon prolonged exposure.
Apparatus
• Measure: May be the bowl portion of the air meter used for determining air contentunder the FOP for AASHTO T 152. Otherwise, it shall be a metal cylindrical containermeeting the requirements of AASHTO T 121. The capacity and dimensions of themeasure shall conform to those specified in Table 1.
• Balance or scale: Accurate to within 45 g (0.1 lb) or 0.3 percent of the test load,whichever is greater, at any point within the range of use.
• Tamping rod: 16 mm (5/8 in.) diameter and 400 mm (16 in.) to 600 mm (24 in.) long,having a hemispherical tip the same diameter as the rod. (Hemispherical means “half asphere”; the tip is rounded like half of a ball.)
• Vibrator: 7000 vibrations per minute, 19 to 38 mm (3/4 to 1 1/2 in.) in diameter, and thelength of the shaft shall be at least 610 mm (24 in.).
• Scoop: a receptacle of appropriate size so that each representative increment of theconcrete sample can be placed in the container without spillage.
• Strike-off plate: A flat rectangular metal plate at least 6 mm (1/4 in.) thick or a glass oracrylic plate at least 12 mm (1/2 in.) thick, with a length and width at least 50 mm (2 in.)greater than the diameter of the measure with which it is to be used. The edges of theplate shall be straight and smooth within tolerance of 1.5 mm (1/16 in.).
• Mallet: With a rubber or rawhide head having a mass of 0.57 ±0.23 kg (1.25 ±0.5 lb) foruse with measures of 0.014 m3 (1/2 ft3) or less, or having a mass of 1.02 ±0.23 kg(2.25 ±0.5 lb) for use with measures of 0.028 m3 (1 ft3).
CONCRETE WAQTC FOP AASHTO T 121 (17)
T121_short_17.docx Concrete 12-2 Pub. October 2017
Table 1 Dimensions of Measures*
Capacity Inside
Diameter Inside Height
Minimum Thicknesses mm (in.)
Nominal Maximum Size of Coarse Aggregate***
m3 (ft3) mm (in.) mm (in.) Bottom Wall mm (in.) 0.0071 (1/4)**
203 ±2.54 (8.0 ±0.1)
213 ±2.54 (8.4 ±0.1)
5.1 (0.20)
3.0 (0.12)
25 (1)
0.0142 (1/2)
254 ±2.54 (10.0 ±0.1)
279 ±2.54 (11.0 ±0.1)
5.1 (0.20)
3.0 (0.12)
50 (2)
0.0283 (1)
356 ±2.54 (14.0 ±0.1)
284 ±2.54 (11.2 ±0.1)
5.1 (0.20)
3.0 (0.12)
76 (3)
* Note: The indicated size of measure shall be for aggregates of nominal maximum size equal to or smallerthan that listed.
** Measure may be the base of the air meter used in the FOP for AASHTO T 152.
*** Nominal maximum size: One sieve larger than the first sieve to retain more than 10 percent of the material using an agency specified set of sieves based on cumulative percent retained. Where large gaps in specification sieves exist, intermediate sieve(s) may be inserted to determine nominal maximum size.
Procedure Selection
There are two methods of consolidating the concrete – rodding and vibration. If the slump is greater than 75 mm (3 in.), consolidation is by rodding. When the slump is 25 to 75 mm (1 to 3 in.), internal vibration or rodding can be used to consolidate the sample, but the method used must be that required by the agency in order to obtain consistent, comparable results. For concrete with slump less than 25 mm (1 in.), consolidate the sample by internal vibration. Do not consolidate self-consolidating concrete (SCC).
When using measures greater than 0.0142 m3 (1/2 ft3) see AASHTO T 121.
Procedure – Rodding
1. Obtain the sample in accordance with the FOP for WAQTC TM 2. Testing may beperformed in conjunction with the FOP for AASHTO T 152. When doing so, this FOPshould be performed prior to the FOP for AASHTO T 152.Note 1: If the two tests are being performed using the same sample, this test shall begin within five
minutes of obtaining the sample.
2. Determine the mass of the dry empty measure.
3. Dampen the inside of the measure.
4. Use the scoop to fill the measure approximately 1/3 full with concrete. Evenly distributethe concrete in a circular motion around the inner perimeter of the measure.
CONCRETE WAQTC FOP AASHTO T 121 (17)
T121_short_17.docx Concrete 12-3 Pub. October 2017
5. Consolidate the layer with 25 strokes of the tamping rod, using the rounded end. Distribute the strokes evenly over the entire cross section of the concrete. Rod throughout its depth without hitting the bottom too hard.
6. Tap around the perimeter of the measure smartly 10 to 15 times with the mallet to close
voids and release trapped air. 7. Add the second layer, filling the measure about 2/3 full. Evenly distribute the concrete in
a circular motion around the inner perimeter of the measure. 8. Consolidate this layer with 25 strokes of the tamping rod, penetrating about 25 mm (1 in.)
into the bottom layer. 9. Tap around the perimeter of the measure smartly 10 to 15 times with the mallet. 10. Add the final layer, slightly overfilling the measure. Evenly distribute the concrete in a
circular motion around the inner perimeter of the measure. 11. Consolidate this layer with 25 strokes of the tamping rod, penetrating about 25 mm (1 in.)
into the second layer. 12. Tap around the perimeter of the measure smartly 10 to 15 times with the mallet.
Note 2: The measure should be slightly over full, about 3 mm (1/8 in.) above the rim. If there is a great excess of concrete, remove a portion with the scoop. If the measure is under full, add a small quantity. This adjustment may be done only after consolidating the final layer and before striking off the surface of the concrete.
13. Strike off by pressing the strike-off plate flat against the top surface, covering approximately 2/3 of the measure. Withdraw the strike-off plate with a sawing motion to finish the 2/3 originally covered. Cover the original 2/3 again with the plate; finishing the remaining 1/3 with a sawing motion (do not lift the plate; continue the sawing motion until the plate has cleared the surface of the measure). Final finishing may be accomplished with several strokes with the inclined edge of the strike-off plate. The surface should be smooth and free of voids.
14. Clean off all excess concrete from the exterior of the measure including the rim. 15. Determine and record the mass of the measure and the concrete. 16. If the air content of the concrete is to be determined, proceed to Rodding Procedure Step
13 of the FOP for AASHTO T 152.
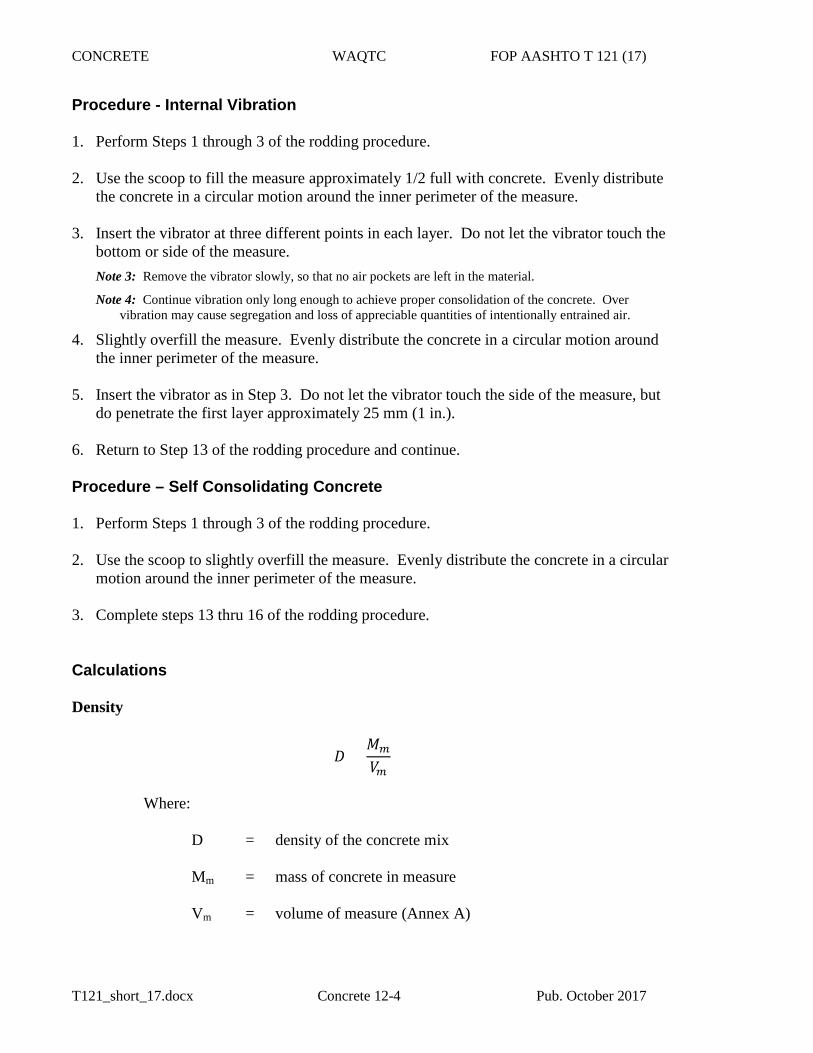
CONCRETE WAQTC FOP AASHTO T 121 (17)
T121_short_17.docx Concrete 12-4 Pub. October 2017
Procedure - Internal Vibration
1. Perform Steps 1 through 3 of the rodding procedure.
2. Use the scoop to fill the measure approximately 1/2 full with concrete. Evenly distributethe concrete in a circular motion around the inner perimeter of the measure.
3. Insert the vibrator at three different points in each layer. Do not let the vibrator touch thebottom or side of the measure.Note 3: Remove the vibrator slowly, so that no air pockets are left in the material.
Note 4: Continue vibration only long enough to achieve proper consolidation of the concrete. Overvibration may cause segregation and loss of appreciable quantities of intentionally entrained air.
4. Slightly overfill the measure. Evenly distribute the concrete in a circular motion aroundthe inner perimeter of the measure.
5. Insert the vibrator as in Step 3. Do not let the vibrator touch the side of the measure, butdo penetrate the first layer approximately 25 mm (1 in.).
6. Return to Step 13 of the rodding procedure and continue.
Procedure – Self Consolidating Concrete
1. Perform Steps 1 through 3 of the rodding procedure.
2. Use the scoop to slightly overfill the measure. Evenly distribute the concrete in a circularmotion around the inner perimeter of the measure.
3. Complete steps 13 thru 16 of the rodding procedure.
Calculations
Density
𝐷𝐷 =𝑀𝑀𝑚𝑚
𝑉𝑉𝑚𝑚
Where:
D = density of the concrete mix
Mm = mass of concrete in measure
Vm = volume of measure (Annex A)
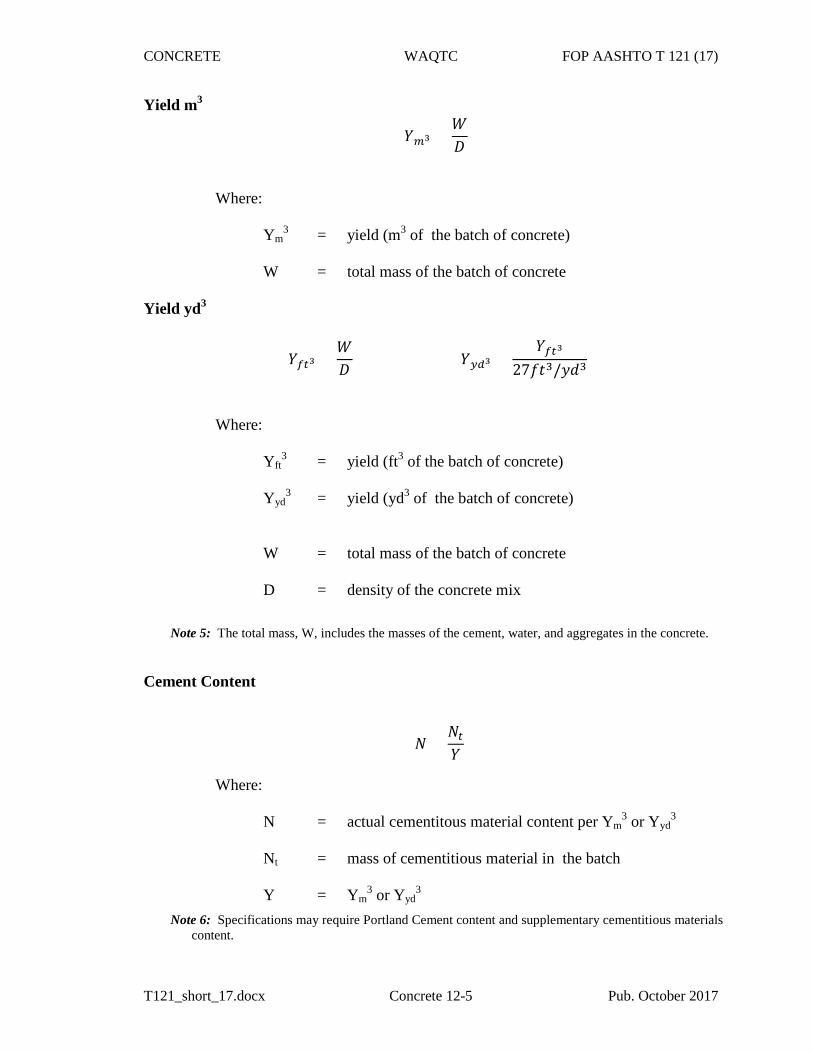
CONCRETE WAQTC FOP AASHTO T 121 (17)
T121_short_17.docx Concrete 12-5 Pub. October 2017
Yield m3
𝑌𝑌𝑚𝑚3 =𝑊𝑊𝐷𝐷
Where:
Ym3 = yield (m3 of the batch of concrete)
W = total mass of the batch of concrete
Yield yd3
𝑌𝑌𝑓𝑓𝑓𝑓3 =𝑊𝑊𝐷𝐷
𝑌𝑌𝑦𝑦𝑦𝑦3 =𝑌𝑌𝑓𝑓𝑓𝑓3
27𝑓𝑓𝑓𝑓3/𝑦𝑦𝑦𝑦3
Where:
Yft3 = yield (ft3 of the batch of concrete)
Yyd
3 = yield (yd3 of the batch of concrete) W = total mass of the batch of concrete D = density of the concrete mix
Note 5: The total mass, W, includes the masses of the cement, water, and aggregates in the concrete.
Cement Content
𝑁𝑁 =𝑁𝑁𝑓𝑓𝑌𝑌
Where:
N = actual cementitous material content per Ym3 or Yyd
3 Nt = mass of cementitious material in the batch Y = Ym
3 or Yyd3
Note 6: Specifications may require Portland Cement content and supplementary cementitious materials content.
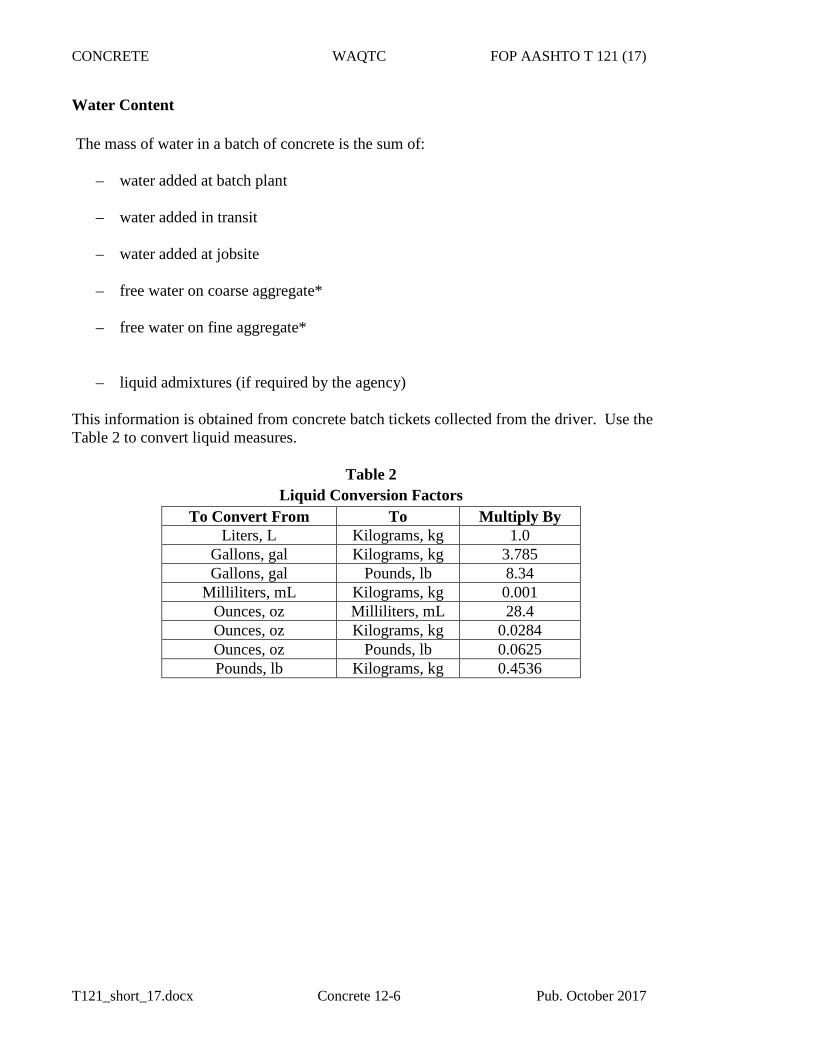
CONCRETE WAQTC FOP AASHTO T 121 (17)
T121_short_17.docx Concrete 12-6 Pub. October 2017
Water Content
The mass of water in a batch of concrete is the sum of:
– water added at batch plant
– water added in transit
– water added at jobsite
– free water on coarse aggregate*
– free water on fine aggregate*
– liquid admixtures (if required by the agency)
This information is obtained from concrete batch tickets collected from the driver. Use the Table 2 to convert liquid measures.
Table 2 Liquid Conversion Factors
To Convert From To Multiply By Liters, L Kilograms, kg 1.0
Gallons, gal Kilograms, kg 3.785 Gallons, gal Pounds, lb 8.34
Milliliters, mL Kilograms, kg 0.001 Ounces, oz Milliliters, mL 28.4 Ounces, oz Kilograms, kg 0.0284 Ounces, oz Pounds, lb 0.0625 Pounds, lb Kilograms, kg 0.4536
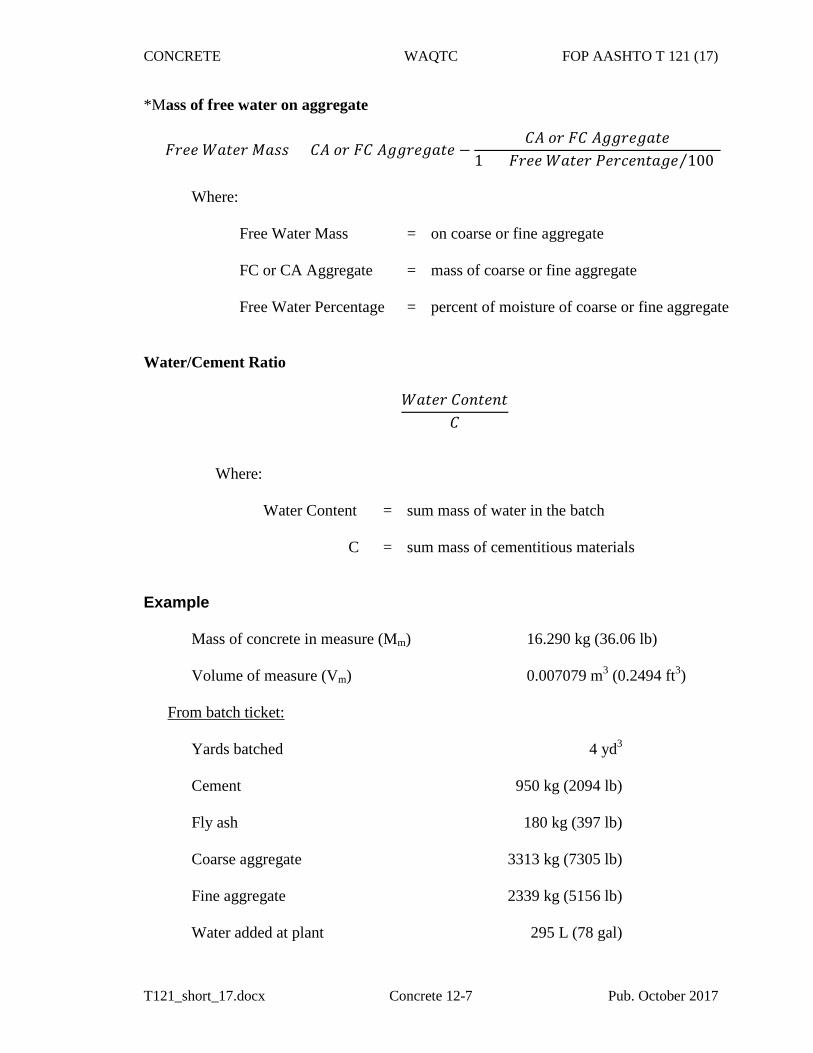
CONCRETE WAQTC FOP AASHTO T 121 (17)
T121_short_17.docx Concrete 12-7 Pub. October 2017
*Mass of free water on aggregate
𝐹𝐹𝐹𝐹𝐹𝐹𝐹𝐹 𝑊𝑊𝑊𝑊𝑓𝑓𝐹𝐹𝐹𝐹 𝑀𝑀𝑊𝑊𝑀𝑀𝑀𝑀 = 𝐶𝐶𝐶𝐶 𝑜𝑜𝐹𝐹 𝐹𝐹𝐶𝐶 𝐶𝐶𝐴𝐴𝐴𝐴𝐹𝐹𝐹𝐹𝐴𝐴𝑊𝑊𝑓𝑓𝐹𝐹 −𝐶𝐶𝐶𝐶 𝑜𝑜𝐹𝐹 𝐹𝐹𝐶𝐶 𝐶𝐶𝐴𝐴𝐴𝐴𝐹𝐹𝐹𝐹𝐴𝐴𝑊𝑊𝑓𝑓𝐹𝐹
1 + (𝐹𝐹𝐹𝐹𝐹𝐹𝐹𝐹 𝑊𝑊𝑊𝑊𝑓𝑓𝐹𝐹𝐹𝐹 𝑃𝑃𝐹𝐹𝐹𝐹𝑃𝑃𝐹𝐹𝑃𝑃𝑓𝑓𝑊𝑊𝐴𝐴𝐹𝐹 100⁄ )
Where:
Free Water Mass = on coarse or fine aggregate
FC or CA Aggregate = mass of coarse or fine aggregate
Free Water Percentage = percent of moisture of coarse or fine aggregate
Water/Cement Ratio
𝑊𝑊𝑊𝑊𝑓𝑓𝐹𝐹𝐹𝐹 𝐶𝐶𝑜𝑜𝑃𝑃𝑓𝑓𝐹𝐹𝑃𝑃𝑓𝑓𝐶𝐶
Where:
Water Content = sum mass of water in the batch
C = sum mass of cementitious materials
Example
Mass of concrete in measure (Mm) 16.290 kg (36.06 lb)
Volume of measure (Vm) 0.007079 m3 (0.2494 ft3)
From batch ticket:
Yards batched 4 yd3
Cement 950 kg (2094 lb)
Fly ash 180 kg (397 lb)
Coarse aggregate 3313 kg (7305 lb)
Fine aggregate 2339 kg (5156 lb)
Water added at plant 295 L (78 gal)
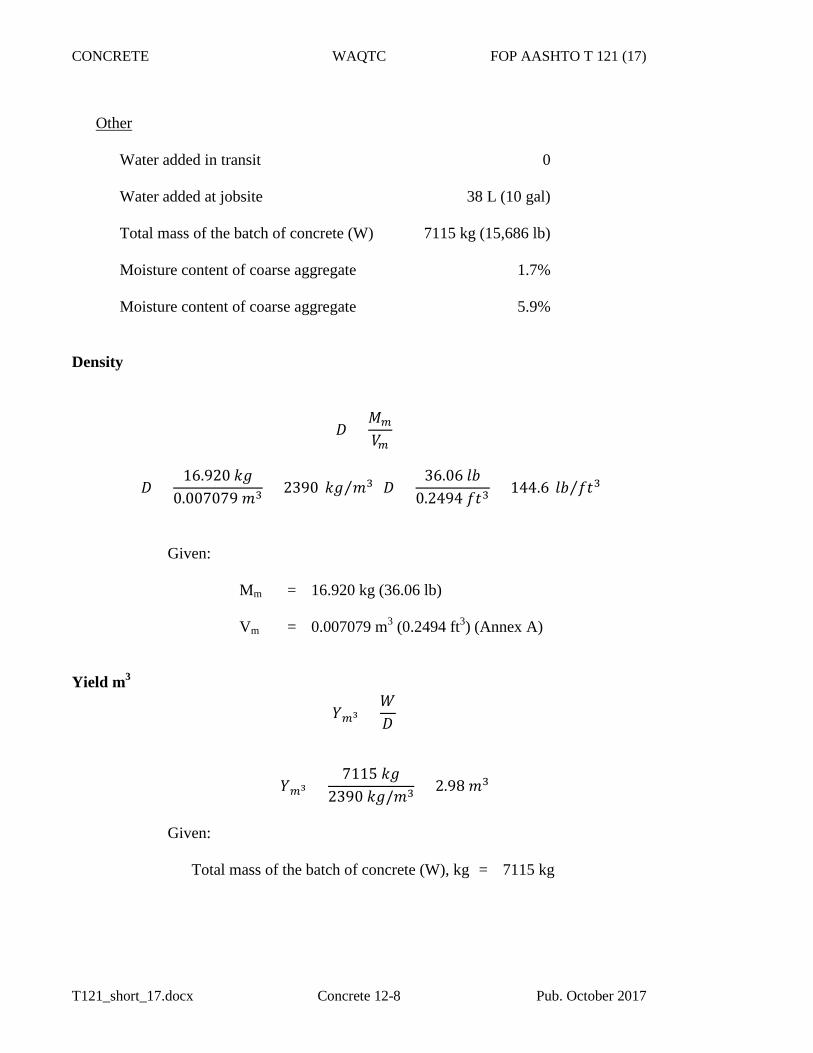
CONCRETE WAQTC FOP AASHTO T 121 (17)
T121_short_17.docx Concrete 12-8 Pub. October 2017
Other
Water added in transit 0
Water added at jobsite 38 L (10 gal)
Total mass of the batch of concrete (W) 7115 kg (15,686 lb)
Moisture content of coarse aggregate 1.7%
Moisture content of coarse aggregate 5.9%
Density
𝐷𝐷 =𝑀𝑀𝑚𝑚
𝑉𝑉𝑚𝑚
𝐷𝐷 =16.920 𝑘𝑘𝐴𝐴
0.007079 𝑚𝑚3 = 2390 𝑘𝑘𝐴𝐴 𝑚𝑚3 ⁄ 𝐷𝐷 =36.06 𝑙𝑙𝑙𝑙
0.2494 𝑓𝑓𝑓𝑓3= 144.6 𝑙𝑙𝑙𝑙 𝑓𝑓𝑓𝑓3⁄
Given:
Mm = 16.920 kg (36.06 lb)
Vm = 0.007079 m3 (0.2494 ft3) (Annex A)
Yield m3
𝑌𝑌𝑚𝑚3 =𝑊𝑊𝐷𝐷
𝑌𝑌𝑚𝑚3 =7115 𝑘𝑘𝐴𝐴
2390 𝑘𝑘𝐴𝐴/𝑚𝑚3 = 2.98 𝑚𝑚3
Given:
Total mass of the batch of concrete (W), kg = 7115 kg
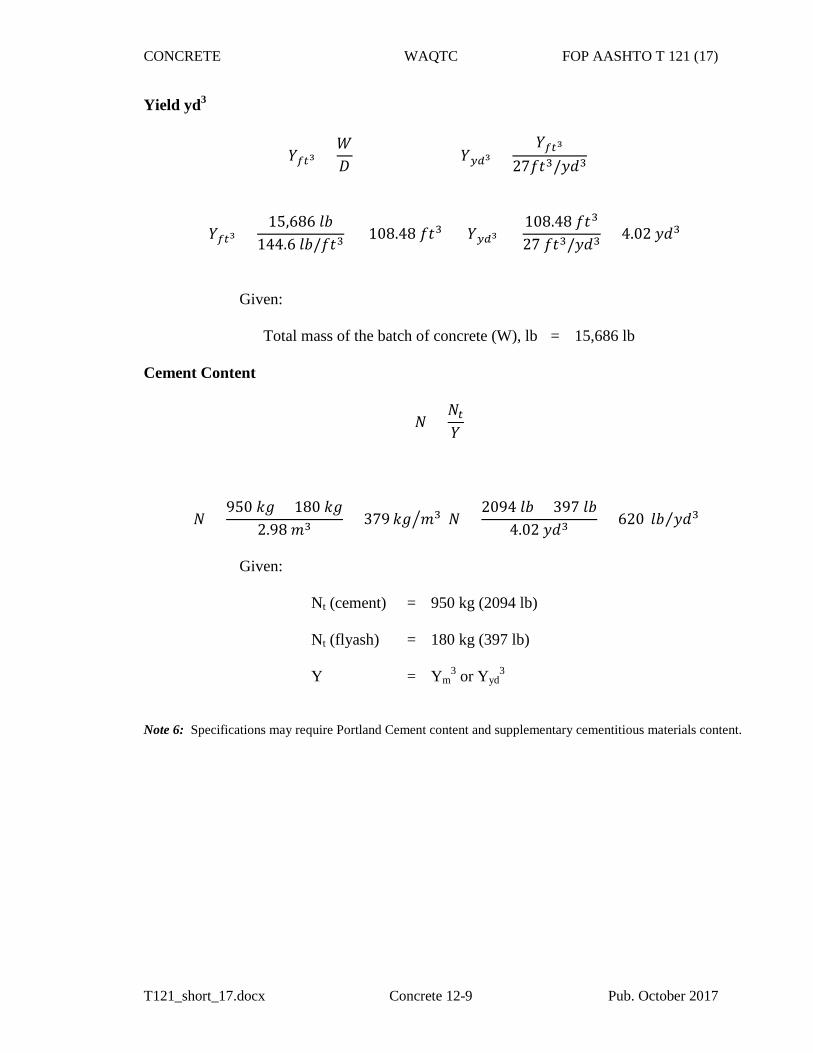
CONCRETE WAQTC FOP AASHTO T 121 (17)
T121_short_17.docx Concrete 12-9 Pub. October 2017
Yield yd3
𝑌𝑌𝑓𝑓𝑓𝑓3 =𝑊𝑊𝐷𝐷
𝑌𝑌𝑦𝑦𝑦𝑦3 =𝑌𝑌𝑓𝑓𝑓𝑓3
27𝑓𝑓𝑓𝑓3/𝑦𝑦𝑦𝑦3
𝑌𝑌𝑓𝑓𝑓𝑓3 =15,686 𝑙𝑙𝑙𝑙
144.6 𝑙𝑙𝑙𝑙/𝑓𝑓𝑓𝑓3= 108.48 𝑓𝑓𝑓𝑓3 𝑌𝑌𝑦𝑦𝑦𝑦3 =
108.48 𝑓𝑓𝑓𝑓3
27 𝑓𝑓𝑓𝑓3/𝑦𝑦𝑦𝑦3= 4.02 𝑦𝑦𝑦𝑦3
Given:
Total mass of the batch of concrete (W), lb = 15,686 lb Cement Content
𝑁𝑁 =𝑁𝑁𝑓𝑓𝑌𝑌
𝑁𝑁 =950 𝑘𝑘𝐴𝐴 + 180 𝑘𝑘𝐴𝐴
2.98 𝑚𝑚3 = 379 𝑘𝑘𝐴𝐴 𝑚𝑚3 𝑁𝑁 =2094 𝑙𝑙𝑙𝑙 + 397 𝑙𝑙𝑙𝑙
4.02 𝑦𝑦𝑦𝑦3= 620 𝑙𝑙𝑙𝑙 𝑦𝑦𝑦𝑦3⁄�
Given:
Nt (cement) = 950 kg (2094 lb) Nt (flyash) = 180 kg (397 lb) Y = Ym
3 or Yyd3
Note 6: Specifications may require Portland Cement content and supplementary cementitious materials content.
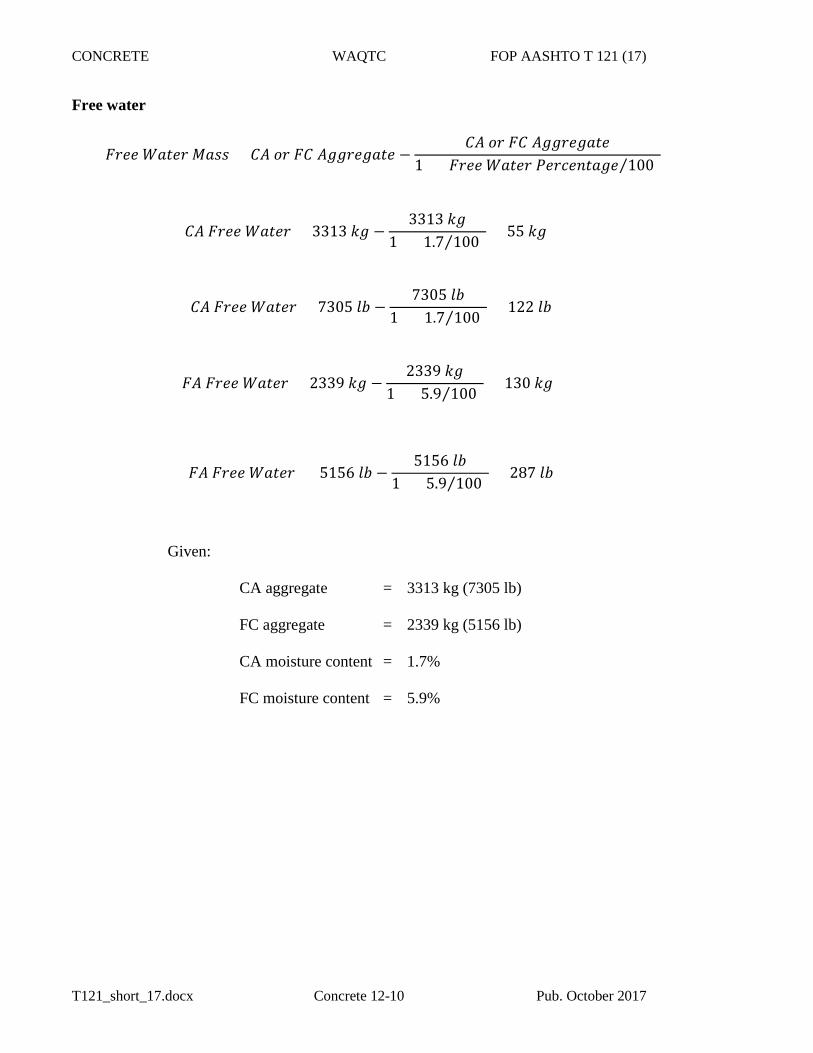
CONCRETE WAQTC FOP AASHTO T 121 (17)
T121_short_17.docx Concrete 12-10 Pub. October 2017
Free water
𝐹𝐹𝐹𝐹𝐹𝐹𝐹𝐹 𝑊𝑊𝑊𝑊𝑓𝑓𝐹𝐹𝐹𝐹 𝑀𝑀𝑊𝑊𝑀𝑀𝑀𝑀 = 𝐶𝐶𝐶𝐶 𝑜𝑜𝐹𝐹 𝐹𝐹𝐶𝐶 𝐶𝐶𝐴𝐴𝐴𝐴𝐹𝐹𝐹𝐹𝐴𝐴𝑊𝑊𝑓𝑓𝐹𝐹 −𝐶𝐶𝐶𝐶 𝑜𝑜𝐹𝐹 𝐹𝐹𝐶𝐶 𝐶𝐶𝐴𝐴𝐴𝐴𝐹𝐹𝐹𝐹𝐴𝐴𝑊𝑊𝑓𝑓𝐹𝐹
1 + (𝐹𝐹𝐹𝐹𝐹𝐹𝐹𝐹 𝑊𝑊𝑊𝑊𝑓𝑓𝐹𝐹𝐹𝐹 𝑃𝑃𝐹𝐹𝐹𝐹𝑃𝑃𝐹𝐹𝑃𝑃𝑓𝑓𝑊𝑊𝐴𝐴𝐹𝐹 100⁄ )
𝐶𝐶𝐶𝐶 𝐹𝐹𝐹𝐹𝐹𝐹𝐹𝐹 𝑊𝑊𝑊𝑊𝑓𝑓𝐹𝐹𝐹𝐹 = 3313 𝑘𝑘𝐴𝐴 −3313 𝑘𝑘𝐴𝐴
1 + (1.7 100⁄ ) = 55 𝑘𝑘𝐴𝐴
𝐶𝐶𝐶𝐶 𝐹𝐹𝐹𝐹𝐹𝐹𝐹𝐹 𝑊𝑊𝑊𝑊𝑓𝑓𝐹𝐹𝐹𝐹 = 7305 𝑙𝑙𝑙𝑙 −7305 𝑙𝑙𝑙𝑙
1 + (1.7 100⁄ ) = 122 𝑙𝑙𝑙𝑙
𝐹𝐹𝐶𝐶 𝐹𝐹𝐹𝐹𝐹𝐹𝐹𝐹 𝑊𝑊𝑊𝑊𝑓𝑓𝐹𝐹𝐹𝐹 = 2339 𝑘𝑘𝐴𝐴 −2339 𝑘𝑘𝐴𝐴
1 + (5.9 100⁄ ) = 130 𝑘𝑘𝐴𝐴
𝐹𝐹𝐶𝐶 𝐹𝐹𝐹𝐹𝐹𝐹𝐹𝐹 𝑊𝑊𝑊𝑊𝑓𝑓𝐹𝐹𝐹𝐹 = 5156 𝑙𝑙𝑙𝑙 −5156 𝑙𝑙𝑙𝑙
1 + (5.9 100⁄ ) = 287 𝑙𝑙𝑙𝑙
Given:
CA aggregate = 3313 kg (7305 lb)
FC aggregate = 2339 kg (5156 lb)
CA moisture content = 1.7%
FC moisture content = 5.9%
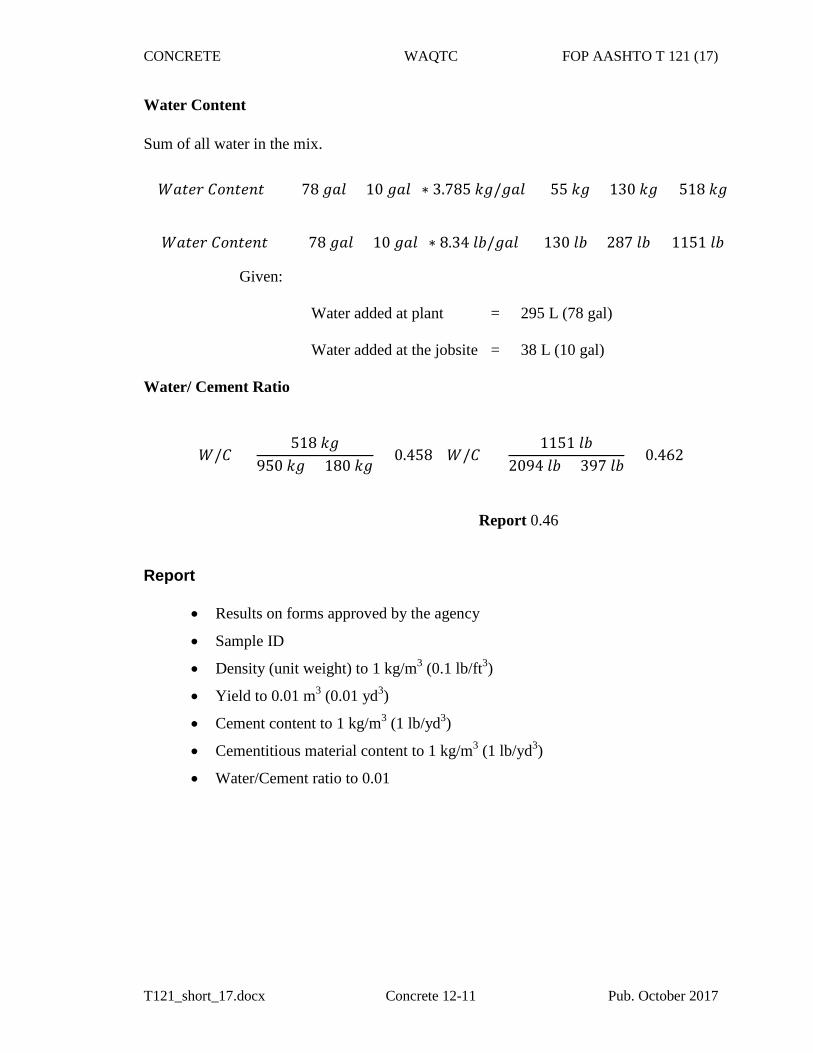
CONCRETE WAQTC FOP AASHTO T 121 (17)
T121_short_17.docx Concrete 12-11 Pub. October 2017
Water Content Sum of all water in the mix.
𝑊𝑊𝑊𝑊𝑓𝑓𝐹𝐹𝐹𝐹 𝐶𝐶𝑜𝑜𝑃𝑃𝑓𝑓𝐹𝐹𝑃𝑃𝑓𝑓 = [(78 𝐴𝐴𝑊𝑊𝑙𝑙 + 10 𝐴𝐴𝑊𝑊𝑙𝑙) ∗ 3.785 𝑘𝑘𝐴𝐴/𝐴𝐴𝑊𝑊𝑙𝑙] + 55 𝑘𝑘𝐴𝐴 + 130 𝑘𝑘𝐴𝐴 = 518 𝑘𝑘𝐴𝐴
𝑊𝑊𝑊𝑊𝑓𝑓𝐹𝐹𝐹𝐹 𝐶𝐶𝑜𝑜𝑃𝑃𝑓𝑓𝐹𝐹𝑃𝑃𝑓𝑓 = [(78 𝐴𝐴𝑊𝑊𝑙𝑙 + 10 𝐴𝐴𝑊𝑊𝑙𝑙) ∗ 8.34 𝑙𝑙𝑙𝑙/𝐴𝐴𝑊𝑊𝑙𝑙] + 130 𝑙𝑙𝑙𝑙 + 287 𝑙𝑙𝑙𝑙 = 1151 𝑙𝑙𝑙𝑙
Given:
Water added at plant = 295 L (78 gal) Water added at the jobsite = 38 L (10 gal)
Water/ Cement Ratio
𝑊𝑊/𝐶𝐶 = 518 𝑘𝑘𝐴𝐴
950 𝑘𝑘𝐴𝐴 + 180 𝑘𝑘𝐴𝐴= 0.458 𝑊𝑊/𝐶𝐶 =
1151 𝑙𝑙𝑙𝑙2094 𝑙𝑙𝑙𝑙 + 397 𝑙𝑙𝑙𝑙
= 0.462
Report 0.46
Report
• Results on forms approved by the agency
• Sample ID
• Density (unit weight) to 1 kg/m3 (0.1 lb/ft3)
• Yield to 0.01 m3 (0.01 yd3)
• Cement content to 1 kg/m3 (1 lb/yd3)
• Cementitious material content to 1 kg/m3 (1 lb/yd3)
• Water/Cement ratio to 0.01
CONCRETE WAQTC FOP AASHTO T 121 (17)
T121_short_17.docx Concrete 12-12 Pub. October 2017
ANNEX A
STANDARDIZATION OF MEASURE
Standardization is a critical step to ensure accurate test results when using this apparatus. Failure to perform the standardization procedures as described herein will produce inaccurate or unreliable test results.
Apparatus
• Listed in the FOP for AASHTO T 121
– Measure
– Balance or scale
– Strike-off plate
• Thermometer: Standardized liquid-in-glass, or electronic digital total immersion type,accurate to 0.5°C (1°F)
Procedure
1. Determine the mass of the dry measure and strike-off plate.
2. Fill the measure with water at a temperature between 16°C and 29°C (60°F and 85°F)and cover with the strike-off plate in such a way as to eliminate bubbles and excesswater.
3. Wipe the outside of the measure and cover plate dry, being careful not to lose any waterfrom the measure.
4. Determine the mass of the measure, strike-off plate, and water in the measure.
5. Determine the mass of the water in the measure by subtracting the mass in Step 1 fromthe mass in Step 4.
6. Measure the temperature of the water and determine its density from Table A1,interpolating as necessary.
7. Calculate the volume of the measure, Vm, by dividing the mass of the water in themeasure by the density of the water at the measured temperature.
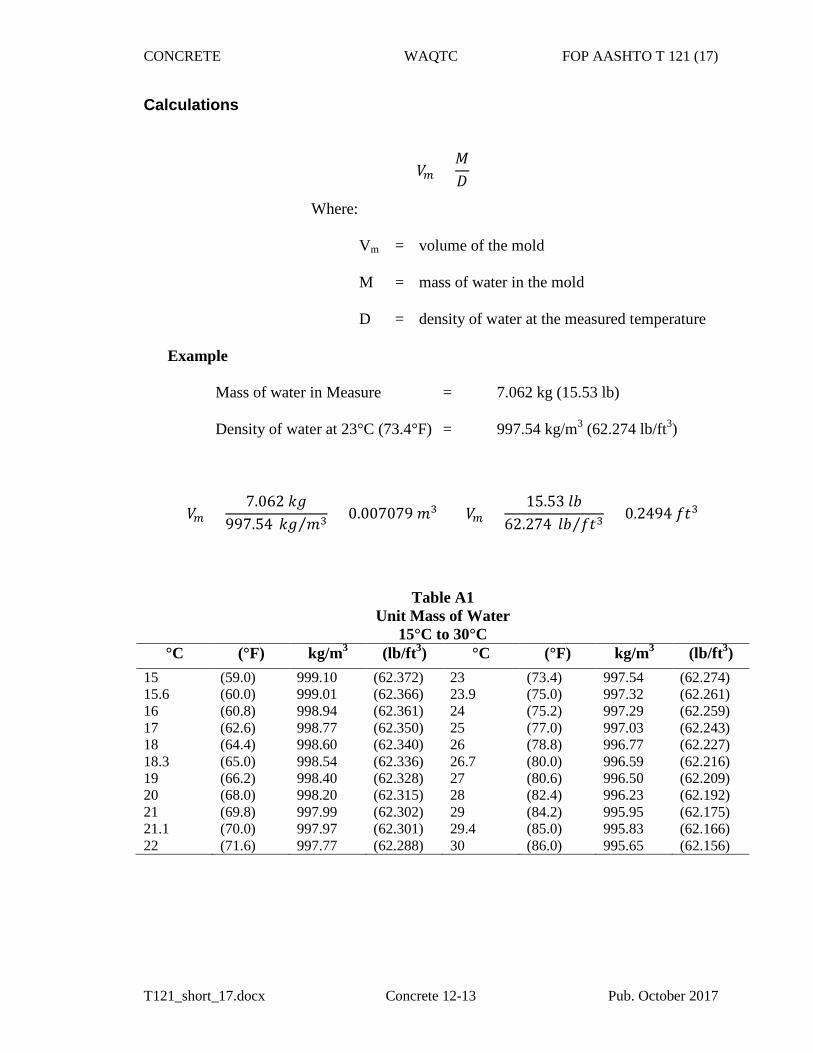
CONCRETE WAQTC FOP AASHTO T 121 (17)
T121_short_17.docx Concrete 12-13 Pub. October 2017
Calculations
𝑉𝑉𝑚𝑚 =𝑀𝑀𝐷𝐷
Where:
Vm = volume of the mold M = mass of water in the mold D = density of water at the measured temperature
Example
Mass of water in Measure = 7.062 kg (15.53 lb) Density of water at 23°C (73.4°F) = 997.54 kg/m3 (62.274 lb/ft3)
𝑉𝑉𝑚𝑚 =7.062 𝑘𝑘𝐴𝐴
997.54 𝑘𝑘𝐴𝐴 𝑚𝑚3⁄ = 0.007079 𝑚𝑚3 𝑉𝑉𝑚𝑚 =15.53 𝑙𝑙𝑙𝑙
62.274 𝑙𝑙𝑙𝑙 𝑓𝑓𝑓𝑓3⁄ = 0.2494 𝑓𝑓𝑓𝑓3
Table A1 Unit Mass of Water
15°C to 30°C °C (°F) kg/m3 (lb/ft3) °C (°F) kg/m3 (lb/ft3)
15 (59.0) 999.10 (62.372) 23 (73.4) 997.54 (62.274) 15.6 (60.0) 999.01 (62.366) 23.9 (75.0) 997.32 (62.261) 16 (60.8) 998.94 (62.361) 24 (75.2) 997.29 (62.259) 17 (62.6) 998.77 (62.350) 25 (77.0) 997.03 (62.243) 18 (64.4) 998.60 (62.340) 26 (78.8) 996.77 (62.227) 18.3 (65.0) 998.54 (62.336) 26.7 (80.0) 996.59 (62.216) 19 (66.2) 998.40 (62.328) 27 (80.6) 996.50 (62.209) 20 (68.0) 998.20 (62.315) 28 (82.4) 996.23 (62.192) 21 (69.8) 997.99 (62.302) 29 (84.2) 995.95 (62.175) 21.1 (70.0) 997.97 (62.301) 29.4 (85.0) 995.83 (62.166) 22 (71.6) 997.77 (62.288) 30 (86.0) 995.65 (62.156)

CONCRETE WAQTC FOP AASHTO T 121 (17)
T121_short_17.docx Concrete 12-14 Pub. October 2017
Report
• Measure ID
• Date Standardized
• Temperature of the water
• Volume, Vm, of the measure

November 30, 2017
To: All Holders of the Manual of Field Test Procedures
Section: Test Procedure AASHTO T 152
The Oregon Department of Transportation has specified method(s) for this Test Procedure. Please observe the following for our projects:
• Under Annex A “Standardization of Air Meter Gauge”, delete the secondparagraph and replace with the following: Standardization shall beperformed at a minimum of once every three months or whenever testresults are suspect. Record the date of the standardization, thestandardization results, and the name of the technician performing thestandardization in the log book kept with each air meter.
• Under Procedure – Rodding, step 1, second sentence, delete 1 ½” andreplace with 2”. Add the following sentence: If any aggregate is retainedon the 2” sieve, wet sieve a sufficient amount of sample over the 1 ½” sieveaccording to the Wet Sieving portion of the FOP for WAQTC TM 2.
• Under Procedure – Internal Vibration, step 1, second sentence, delete 1 ½”and replace with 2”. Add the following sentence: If any aggregate isretained on the 2” sieve, wet sieve a sufficient amount of sample over the 1½” sieve according to the Wet Sieving portion of the FOP for WAQTC TM 2.
• An Aggregate Correction Factor is not required for Air ContentDetermination.
Kate Brown, Governor
Department of Transportation Construction Section 800 Airport Road SE
Salem, OR 97301-4792 Phone: (503) 986-3000
Fax: (503) 986-3096
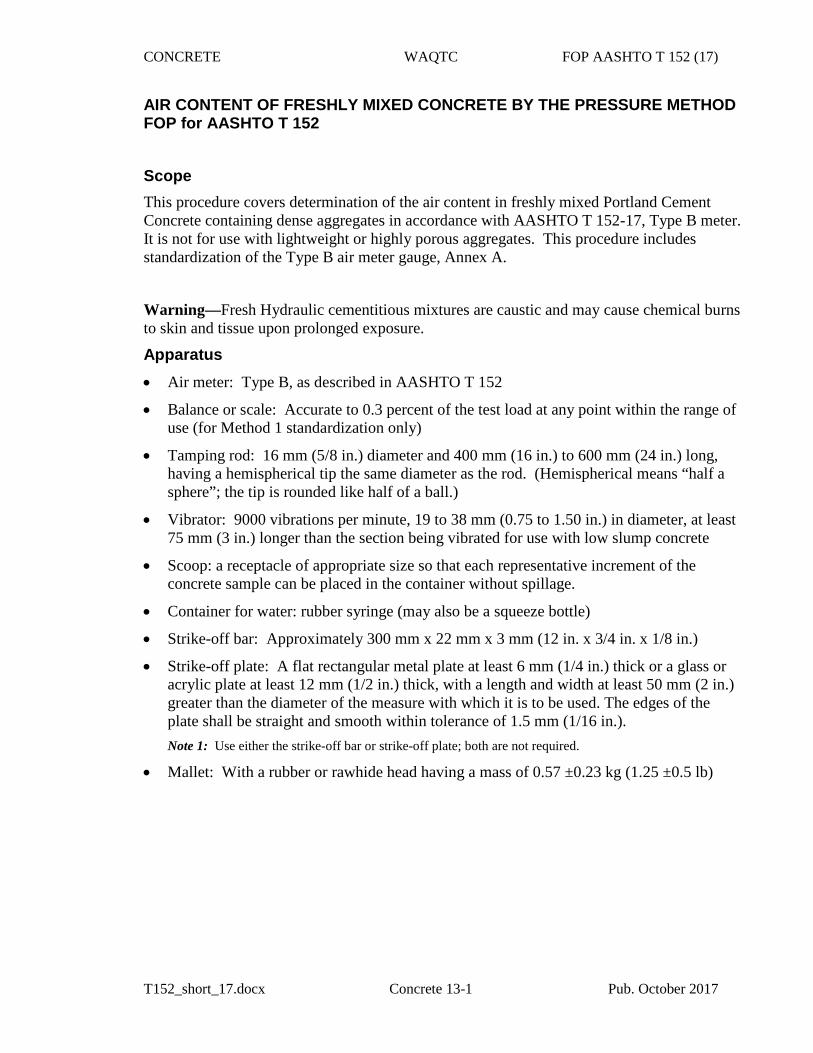
CONCRETE WAQTC FOP AASHTO T 152 (17)
T152_short_17.docx Concrete 13-1 Pub. October 2017
AIR CONTENT OF FRESHLY MIXED CONCRETE BY THE PRESSURE METHOD FOP for AASHTO T 152
Scope This procedure covers determination of the air content in freshly mixed Portland Cement Concrete containing dense aggregates in accordance with AASHTO T 152-17, Type B meter. It is not for use with lightweight or highly porous aggregates. This procedure includes standardization of the Type B air meter gauge, Annex A.
Warning—Fresh Hydraulic cementitious mixtures are caustic and may cause chemical burns to skin and tissue upon prolonged exposure.
Apparatus • Air meter: Type B, as described in AASHTO T 152
• Balance or scale: Accurate to 0.3 percent of the test load at any point within the range ofuse (for Method 1 standardization only)
• Tamping rod: 16 mm (5/8 in.) diameter and 400 mm (16 in.) to 600 mm (24 in.) long,having a hemispherical tip the same diameter as the rod. (Hemispherical means “half asphere”; the tip is rounded like half of a ball.)
• Vibrator: 9000 vibrations per minute, 19 to 38 mm (0.75 to 1.50 in.) in diameter, at least75 mm (3 in.) longer than the section being vibrated for use with low slump concrete
• Scoop: a receptacle of appropriate size so that each representative increment of theconcrete sample can be placed in the container without spillage.
• Container for water: rubber syringe (may also be a squeeze bottle)
• Strike-off bar: Approximately 300 mm x 22 mm x 3 mm (12 in. x 3/4 in. x 1/8 in.)
• Strike-off plate: A flat rectangular metal plate at least 6 mm (1/4 in.) thick or a glass oracrylic plate at least 12 mm (1/2 in.) thick, with a length and width at least 50 mm (2 in.)greater than the diameter of the measure with which it is to be used. The edges of theplate shall be straight and smooth within tolerance of 1.5 mm (1/16 in.).Note 1: Use either the strike-off bar or strike-off plate; both are not required.
• Mallet: With a rubber or rawhide head having a mass of 0.57 ±0.23 kg (1.25 ±0.5 lb)
CONCRETE WAQTC FOP AASHTO T 152 (17)
T152_short_17.docx Concrete 13-2 Pub. October 2017
Procedure Selection There are two methods of consolidating the concrete – rodding and vibration. If the slump is greater than 75 mm (3 in.), consolidation is by rodding. When the slump is 25 to 75 mm (1 to 3 in.), internal vibration or rodding can be used to consolidate the sample, but the method used must be that required by the agency in order to obtain consistent, comparable results. For concrete with slumps less than 25 mm (1 in.), consolidate the sample by internal vibration. Do not consolidate self-consolidating concrete (SCC).
Procedure – Rodding 1. Obtain the sample in accordance with the FOP for WAQTC TM 2. If the concrete
mixture contains aggregate retained on the 37.5mm (1½ in.) sieve, the aggregate must be removed in accordance with the Wet Sieving portion of the FOP for WAQTC TM 2. Note 2: Testing shall begin within five minutes of obtaining the sample.
2. Dampen the inside of the air meter measure and place on a firm level surface.
3. Use the scoop to fill the measure approximately 1/3 full with concrete. Evenly distribute the concrete in a circular motion around the inner perimeter of the measure.
4. Consolidate the layer with 25 strokes of the tamping rod, using the rounded end. Distribute the strokes evenly over the entire cross section of the concrete. Rod throughout its depth without hitting the bottom too hard.
5. Tap around the perimeter of the measure smartly 10 to 15 times with the mallet to close voids and release trapped air.
6. Add the second layer, filling the measure about 2/3 full. Evenly distribute the concrete in a circular motion around the inner perimeter of the measure.
7. Consolidate this layer with 25 strokes of the tamping rod, penetrating about 25 mm (1 in.) into the bottom layer.
8. Tap around the perimeter of the measure smartly 10 to 15 times with the mallet.
9. Add the final layer, slightly overfilling the measure. Evenly distribute the concrete in a circular motion around the inner perimeter of the measure.
10. Consolidate this layer with 25 strokes of the tamping rod, penetrating about 25 mm (1 in.) into the second layer.
11. Tap around the perimeter of the measure smartly 10 to 15 times with the mallet. Note 3: The measure should be slightly over full, about 3 mm (1/8 in.) above the rim. If there is a great excess
of concrete, remove a portion with the trowel or scoop. If the measure is under full, add a small quantity. This adjustment may be done only after consolidating the final layer and before striking off the surface of the concrete.
12. Strike off the surface of the concrete and finish it smoothly with a sawing action of the strike-off bar or plate, using great care to leave the measure just full. The surface should be smooth and free of voids.
13. Clean the top flange of the measure to ensure a proper seal.
CONCRETE WAQTC FOP AASHTO T 152 (17)
T152_short_17.docx Concrete 13-3 Pub. October 2017
14. Moisten the inside of the cover and check to see that both petcocks are open and the mainair valve is closed.
15. Clamp the cover on the measure.
16. Inject water through a petcock on the cover until water emerges from the petcock on theother side.
17. Incline slightly and gently rock the air meter until no air bubbles appear to be coming outof the second petcock. The petcock expelling water should be higher than the petcockwhere water is being injected. Return the air meter to a level position and verify thatwater is present in both petcocks.
18. Close the air bleeder valve and pump air into the air chamber until the needle goes pastthe initial pressure determined for the gauge. Allow a few seconds for the compressed airto cool.
19. Tap the gauge gently with one hand while slowly opening the air bleeder valve until theneedle rests on the initial pressure. Close the air bleeder valve.
20. Close both petcocks.
21. Open the main air valve.
22. Tap around the perimeter of the measure smartly with the mallet.
23. With the main air valve open, lightly tap the gauge to settle the needle, and then read theair content to the nearest 0.1 percent.
24. Release or close the main air valve.
25. Open both petcocks to release pressure, remove the concrete, and thoroughly clean thecover and measure with clean water.
26. Open the main air valve to relieve the pressure in the air chamber.
Procedure - Internal Vibration 1. Obtain the sample in accordance with the FOP for WAQTC TM 2. If any aggregate
37.5mm (1½ in.) or larger is present, aggregate must be removed in accordance with theWet Sieving portion of the FOP for WAQTC TM 2.
2. Dampen the inside of the air meter measure and place on a firm level surface.
3. Use the scoop to fill the measure approximately 1/2 full with concrete. Evenly distributethe concrete in a circular motion around the inner perimeter of the measure.
4. Insert the vibrator at three different points. Do not let the vibrator touch the bottom orside of the measure. Remove the vibrator slowly, so that no air pockets are left in thematerial. Continue vibration only long enough to achieve proper consolidation of theconcrete. Over vibration may cause segregation and loss of appreciable quantities ofintentionally entrained air.
5. Use the scoop to fill the measure a bit over full. Evenly distribute the concrete in acircular motion around the inner perimeter of the measure.
CONCRETE WAQTC FOP AASHTO T 152 (17)
T152_short_17.docx Concrete 13-4 Pub. October 2017
6. Insert the vibrator as in Step 4. Do not let the vibrator touch the side of the measure, and penetrate the first layer approximately 25 mm (1 in.). Remove the vibrator slowly, so that no air pockets are left in the material. Continue vibration only long enough to achieve proper consolidation of the concrete. Over vibration may cause segregation and loss of appreciable quantities of intentionally entrained air.
7. Return to Step 12 of the rodding procedure and continue.
Procedure – Self Consolidating Concrete 1. Obtain the sample in accordance with the FOP for WAQTC TM 2.
2. Dampen the inside of the air meter measure and place on a firm level surface.
3. Use the scoop to slightly overfill the measure. Evenly distribute the concrete in a circular motion around the inner perimeter of the measure.
4. Complete Steps 12 thru 26 of the rodding procedure.
Report • Results on forms approved by the agency
• Sample ID
• Percent of air to the nearest 0.1 percent.
• Some agencies require an aggregate correction factor in order to determine total percent of entrained air.
Total % entrained air = Gauge reading – aggregate correction factor from mix design
(See AASHTO T 152 for more information.)
CONCRETE WAQTC FOP AASHTO T 152 (17)
T152_short_17.docx Concrete 13-5 Pub. October 2017
ANNEX A—STANDARDIZATION OF AIR METER GAUGE
Standardization is a critical step to ensure accurate test results when using this apparatus. Failure to perform the standardization procedures as described below will produce inaccurate or unreliable test results. Standardization shall be performed at a minimum of once every three months. Record the date of the standardization, the standardization results, and the name of the technician performing the standardization in the log book kept with each air meter. There are two methods for standardizing the air meter, mass or volume, both are covered below. 1. Screw the short piece of straight tubing into the threaded petcock hole on the underside of
the cover.
2. Determine and record the mass of the dry, empty air meter measure and cover assembly(mass method only).
3. Fill the measure nearly full with water.
4. Clamp the cover on the measure with the tube extending down into the water. Mark thepetcock with the tube attached for future reference.
5. Add water through the petcock having the pipe extension below until all air is forced outthe other petcock. Rock the meter slightly until all air is expelled through the petcock.
6. Wipe off the air meter measure and cover assembly; determine and record the mass of thefilled unit (mass method only).
7. Pump up the air pressure to a little beyond the predetermined initial pressure indicated onthe gauge. Wait a few seconds for the compressed air to cool, and then stabilize the gaugehand at the proper initial pressure by pumping up or relieving pressure, as needed.
8. Close both petcocks and immediately open the main air valve exhausting air into themeasure. Wait a few seconds until the meter needle stabilizes. The gauge should nowread 0 percent. If two or more tests show a consistent variation from 0 percent in theresult, change the initial pressure line to compensate for the variation, and use the newlyestablished initial pressure line for subsequent tests.
9. Determine which petcock has the straight tube attached to it. Attach the curved tube toexternal portion of the same petcock.
10. Pump air into the air chamber. Open the petcock with the curved tube attached to it. Openthe main air valve for short periods of time until 5 percent of water by mass or volumehas been removed from the air meter. Remember to open both petcocks to release thepressure in the measure and drain the water in the curved tube back into the measure. Todetermine the mass of the water to be removed, subtract the mass found in Step 1 fromthe mass found in Step 5. Multiply this value by 0.05. This is the mass of the water thatmust be removed. To remove 5 percent by volume, remove water until the externalstandardization vessel is level full.
CONCRETE WAQTC FOP AASHTO T 152 (17)
T152_short_17.docx Concrete 13-6 Pub. October 2017
Note A1: Many air meters are supplied with a standardization vessel(s) of known volume that are used for this purpose. Standardization vessel must be protected from crushing or denting. If an external standardization vessel is used, confirm what percentage volume it represents for the air meter being used. Vessels commonly represent 5 percent volume, but they are for specific size meters. This should be confirmed by mass.
11. Remove the curved tube. Pump up the air pressure to a little beyond the predetermined initial pressure indicated on the gauge. Wait a few seconds for the compressed air to cool, and then stabilize the gauge hand at the proper initial pressure by pumping up or relieving pressure, as needed.
12. Close both petcocks and immediately open the main air valve exhausting air into the measure. Wait a few seconds until the meter needle is stabilized. The gauge should now read 5.0 ±0.1 percent. If the gauge is outside that range, the meter needs adjustment. The adjustment could involve adjusting the starting point so that the gauge reads 5.0 ±0.1 percent when this standardization is run, or could involve moving the gauge needle to read 5.0 percent. Any adjustment should comply with the manufacturer’s recommendations.
13. When the gauge hand reads correctly at 5.0 percent, additional water may be withdrawn in the same manner to check the results at other values such as 10 percent or 15 percent.
14. If an internal standardization vessel is used, follow steps 1 through 8 to set initial reading.
15. Release pressure from the measure and remove cover. Place the internal standardization vessel into the measure. This will displace 5 percent of the water in the measure. (See AASHTO T 152 for more information on internal standardization vessels.)
16. Place the cover back on the measure and add water through the petcock until all the air has been expelled.
17. Pump up the air pressure chamber to the initial pressure. Wait a few seconds for the compressed air to cool, and then stabilize the gauge hand at the proper initial pressure by pumping up or relieving pressure, as needed.
18. Close both petcocks and immediately open the main air valve exhausting air into the measure. Wait a few seconds until the meter needle stabilizes. The gauge should now read 5 percent.
19. Remove the extension tubing from threaded petcock hole in the underside of the cover before starting the test procedure.
Report
• Air Meter ID
• Date Standardized
• Initial Pressure (IP)

October 31, 2013 To: All Holders of the Manual of Field Test Procedures Section: Test Procedure AASHTO T 166 The Oregon Department of Transportation has specified method(s) for this Test Procedure. Please observe the following for our projects: Absorption Calculations are not required. When performing the Bulk Specific Gravity determination for the Core Correlation
process (ODOT TM-327), use Method A. Method C is required for dry mass determination.
When performing the Bulk Specific Gravity determination for Lab Fabricated Gyratory
Specimens, use Method A. The Method C option is not allowed. When performing the Bulk Specific Gravity determination for Cores removed for “density
acceptance” purposes, use Method A. The Method C option is not allowed.
Department of TransportationConstruction Section
800 Airport Road SE
Salem, OR 97301‐4792
Phone: (503) 986‐3000
Fax: (503) 986‐3096
ASPHALT I WAQTC AASHTO T 166 (16)
T166_short_16.docx Asphalt 16-1 Pub. October 2017
BULK SPECIFIC GRAVITY (Gmb) OF COMPACTED ASPHALT MIXTURES USING SATURATED SURFACE-DRY SPECIMENS FOP FOR AASHTO T 166
Scope
This procedure covers the determination of bulk specific gravity (Gmb) of compacted asphalt mixtures using three methods – A, B, and C – in accordance with AASHTO T 166-16. This FOP is for use on specimens not having open or interconnecting voids or absorbing more than 2.00 percent water by volume, or both. When specimens have open or interconnecting voids or absorbing more than 2.00 percent water by volume, or both, AASHTO T 275 or AASHTO T 331 should be performed.
Overview
• Method A: Suspension
• Method B: Volumeter
• Method C: Rapid test for A or B
Test Specimens
Test specimens may be either laboratory-molded or from asphalt mixture pavement. For specimens, it is recommended that the diameter be equal to four times the maximum size of the aggregate and the thickness be at least one and one half times the maximum size.
Test specimens from asphalt mixture pavement will be sampled according to AASHTO R 67.
Terminology
Constant Mass: The state at which a mass does not change more than a given percent, after additional drying for a defined time interval, at a required temperature.
Apparatus - Method A (Suspension)
Balance or scale: 5 kg capacity, readable to 0.1 g, and fitted with a suitable suspension apparatus and holder to permit weighing the specimen while suspended in water, conforming to AASHTO M 231.
• Suspension apparatus: Wire of the smallest practical size and constructed to permit thecontainer to be fully immersed.
• Water bath: For immersing the specimen in water while suspended under the balance orscale, and equipped with an overflow outlet for maintaining a constant water level.
ASPHALT I WAQTC AASHTO T 166 (16)
T166_short_16.docx Asphalt 16-2 Pub. October 2017
• Towel: Damp cloth towel used for surface drying specimens. • Oven: Capable of maintaining a temperature of 110 ±5°C (230 ±9°F) for drying the
specimens to a constant mass. • Pan: Pan or other suitable container of known mass, large enough to hold a sample for
drying in oven. • Thermometer: Having a range of 19 to 27°C (66 to 80°F), graduated in 0.1°C (0.2°F)
subdivisions. Procedure - Method A (Suspension) Recently molded laboratory samples that have not been exposed to moisture do not need drying. 1. Dry the specimen to constant mass, if required.
a. Initially dry overnight at 52 ±3°C (125 ±5°F).
b. Determine and record the mass of the specimen (Mp).
c. Return the specimen to the oven for at least 2 hours.
d. Determine and record the mass of the specimen (Mn).
e. Determine percent change by subtracting the new mass determination (Mn) from the previous mass determination (Mp) divide by the previous mass determination (Mp) multiply by 100.
f. Continue drying until there is less than 0.05 percent change in specimen mass
after 2-hour drying intervals (constant mass). g. Constant mass has been achieved, sample is defined as dry.
Note 1: To expedite the procedure, steps 1 and 2 may be performed last. To further expedite the process, see Method C.
2. Cool the specimen in air to 25 ±5°C (77 ±9°F), and determine and record the dry mass to the nearest 0.1 g. Designate this mass as “A.”
3. Fill the water bath to overflow level with water at 25 ±1°C (77 ±1.8°F) and allow the
water to stabilize. 4. Zero or tare the balance with the immersion apparatus attached, ensuring that the device
is not touching the sides or the bottom of the water bath.
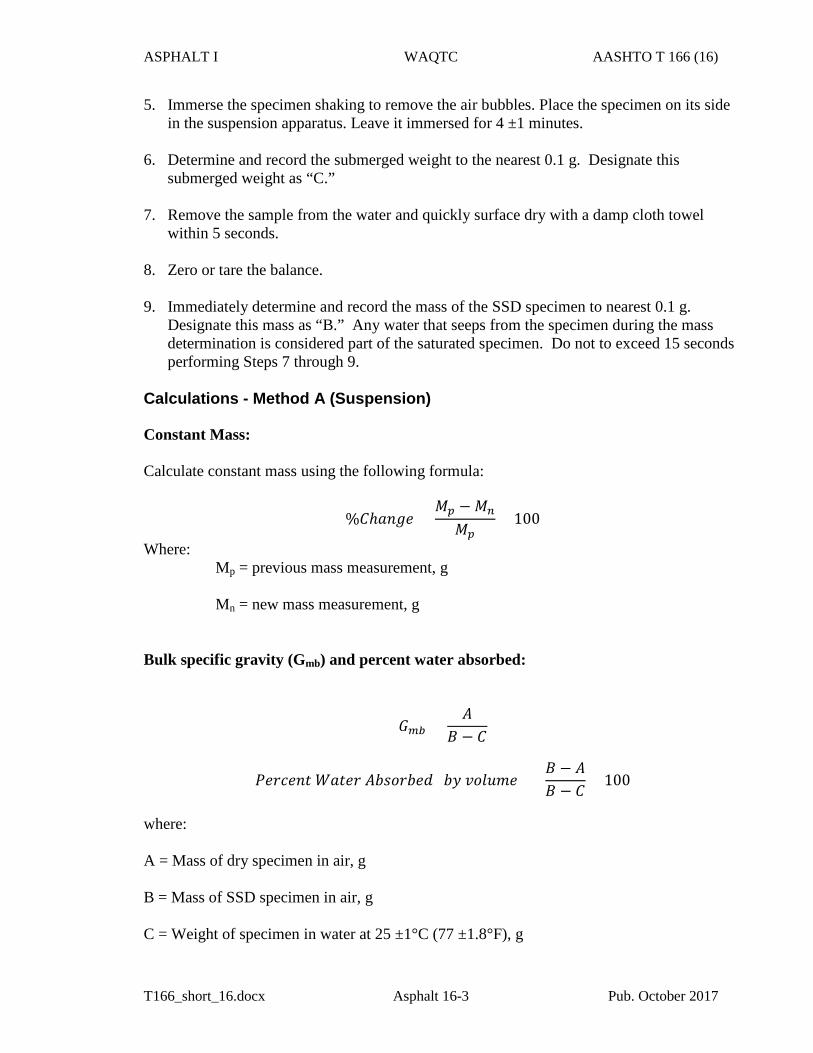
ASPHALT I WAQTC AASHTO T 166 (16)
T166_short_16.docx Asphalt 16-3 Pub. October 2017
5. Immerse the specimen shaking to remove the air bubbles. Place the specimen on its sidein the suspension apparatus. Leave it immersed for 4 ±1 minutes.
6. Determine and record the submerged weight to the nearest 0.1 g. Designate thissubmerged weight as “C.”
7. Remove the sample from the water and quickly surface dry with a damp cloth towelwithin 5 seconds.
8. Zero or tare the balance.
9. Immediately determine and record the mass of the SSD specimen to nearest 0.1 g.Designate this mass as “B.” Any water that seeps from the specimen during the massdetermination is considered part of the saturated specimen. Do not to exceed 15 secondsperforming Steps 7 through 9.
Calculations - Method A (Suspension)
Constant Mass:
Calculate constant mass using the following formula:
%𝐶𝐶ℎ𝑎𝑎𝑎𝑎𝑎𝑎𝑎𝑎 =𝑀𝑀𝑝𝑝 −𝑀𝑀𝑛𝑛
𝑀𝑀𝑝𝑝× 100
Where: Mp = previous mass measurement, g
Mn = new mass measurement, g
Bulk specific gravity (Gmb) and percent water absorbed:
𝐺𝐺𝑚𝑚𝑚𝑚 =𝐴𝐴
𝐵𝐵 − 𝐶𝐶
𝑃𝑃𝑎𝑎𝑃𝑃𝑃𝑃𝑎𝑎𝑎𝑎𝑃𝑃 𝑊𝑊𝑎𝑎𝑃𝑃𝑎𝑎𝑃𝑃 𝐴𝐴𝐴𝐴𝐴𝐴𝐴𝐴𝑃𝑃𝐴𝐴𝑎𝑎𝐴𝐴 (𝐴𝐴𝑏𝑏 𝑣𝑣𝐴𝐴𝑣𝑣𝑣𝑣𝑣𝑣𝑎𝑎) =𝐵𝐵 − 𝐴𝐴𝐵𝐵 − 𝐶𝐶
× 100
where:
A = Mass of dry specimen in air, g
B = Mass of SSD specimen in air, g
C = Weight of specimen in water at 25 ±1°C (77 ±1.8°F), g
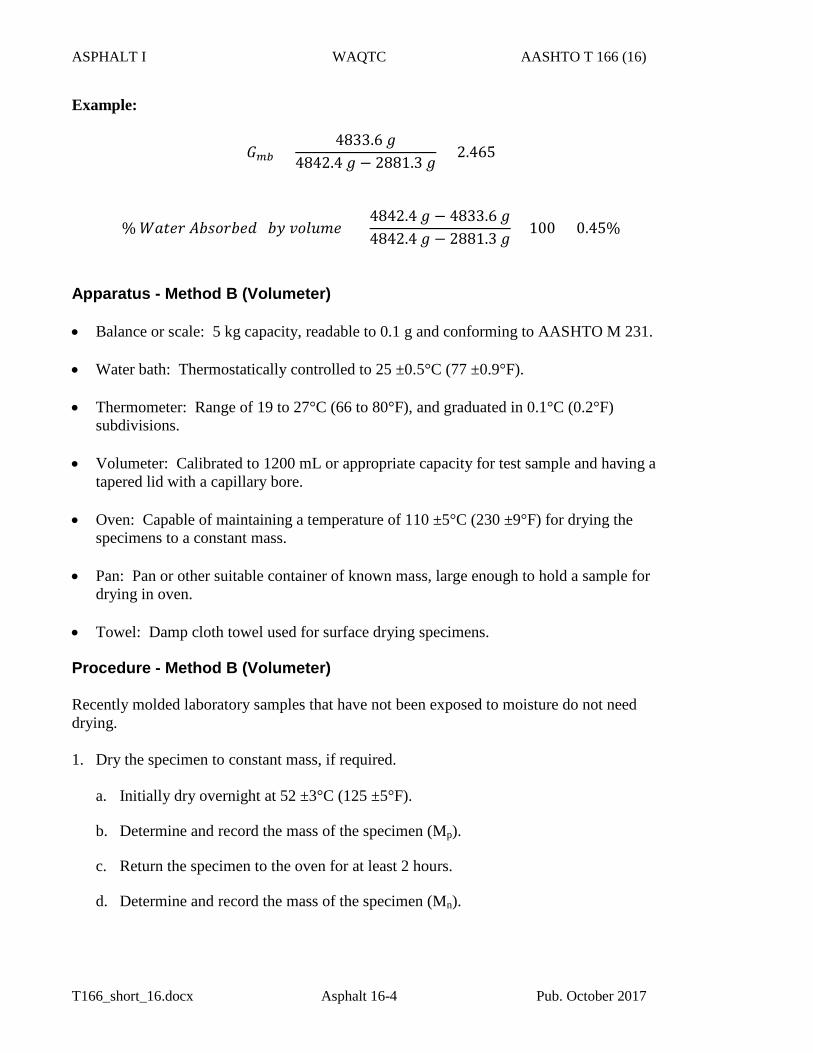
ASPHALT I WAQTC AASHTO T 166 (16)
T166_short_16.docx Asphalt 16-4 Pub. October 2017
Example:
𝐺𝐺𝑚𝑚𝑚𝑚 =4833.6 𝑎𝑎
4842.4 𝑎𝑎 − 2881.3 𝑎𝑎= 2.465
% 𝑊𝑊𝑎𝑎𝑃𝑃𝑎𝑎𝑃𝑃 𝐴𝐴𝐴𝐴𝐴𝐴𝐴𝐴𝑃𝑃𝐴𝐴𝑎𝑎𝐴𝐴 (𝐴𝐴𝑏𝑏 𝑣𝑣𝐴𝐴𝑣𝑣𝑣𝑣𝑣𝑣𝑎𝑎) =4842.4 𝑎𝑎 − 4833.6 𝑎𝑎4842.4 𝑎𝑎 − 2881.3 𝑎𝑎
× 100 = 0.45%
Apparatus - Method B (Volumeter)
• Balance or scale: 5 kg capacity, readable to 0.1 g and conforming to AASHTO M 231.
• Water bath: Thermostatically controlled to 25 ±0.5°C (77 ±0.9°F).
• Thermometer: Range of 19 to 27°C (66 to 80°F), and graduated in 0.1°C (0.2°F)subdivisions.
• Volumeter: Calibrated to 1200 mL or appropriate capacity for test sample and having atapered lid with a capillary bore.
• Oven: Capable of maintaining a temperature of 110 ±5°C (230 ±9°F) for drying thespecimens to a constant mass.
• Pan: Pan or other suitable container of known mass, large enough to hold a sample fordrying in oven.
• Towel: Damp cloth towel used for surface drying specimens.
Procedure - Method B (Volumeter)
Recently molded laboratory samples that have not been exposed to moisture do not need drying.
1. Dry the specimen to constant mass, if required.
a. Initially dry overnight at 52 ±3°C (125 ±5°F).
b. Determine and record the mass of the specimen (Mp).
c. Return the specimen to the oven for at least 2 hours.
d. Determine and record the mass of the specimen (Mn).
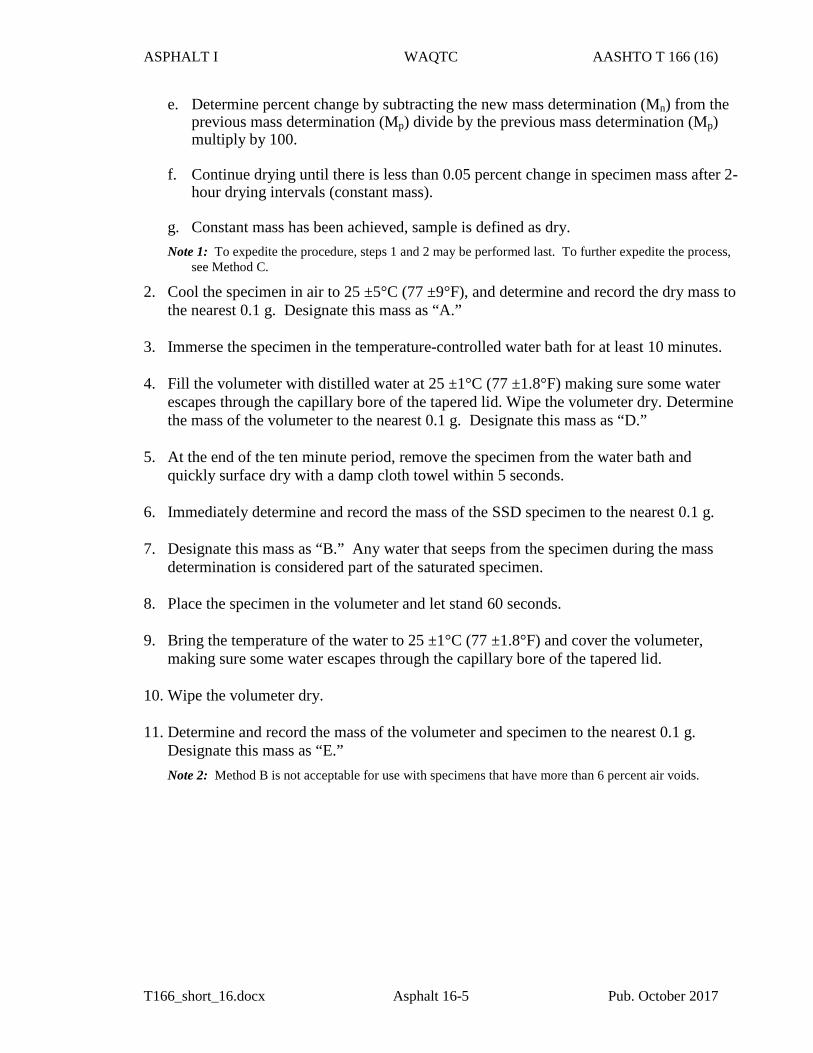
ASPHALT I WAQTC AASHTO T 166 (16)
T166_short_16.docx Asphalt 16-5 Pub. October 2017
e. Determine percent change by subtracting the new mass determination (Mn) from theprevious mass determination (Mp) divide by the previous mass determination (Mp)multiply by 100.
f. Continue drying until there is less than 0.05 percent change in specimen mass after 2-hour drying intervals (constant mass).
g. Constant mass has been achieved, sample is defined as dry.Note 1: To expedite the procedure, steps 1 and 2 may be performed last. To further expedite the process,
see Method C.
2. Cool the specimen in air to 25 ±5°C (77 ±9°F), and determine and record the dry mass tothe nearest 0.1 g. Designate this mass as “A.”
3. Immerse the specimen in the temperature-controlled water bath for at least 10 minutes.
4. Fill the volumeter with distilled water at 25 ±1°C (77 ±1.8°F) making sure some waterescapes through the capillary bore of the tapered lid. Wipe the volumeter dry. Determinethe mass of the volumeter to the nearest 0.1 g. Designate this mass as “D.”
5. At the end of the ten minute period, remove the specimen from the water bath andquickly surface dry with a damp cloth towel within 5 seconds.
6. Immediately determine and record the mass of the SSD specimen to the nearest 0.1 g.
7. Designate this mass as “B.” Any water that seeps from the specimen during the massdetermination is considered part of the saturated specimen.
8. Place the specimen in the volumeter and let stand 60 seconds.
9. Bring the temperature of the water to 25 ±1°C (77 ±1.8°F) and cover the volumeter,making sure some water escapes through the capillary bore of the tapered lid.
10. Wipe the volumeter dry.
11. Determine and record the mass of the volumeter and specimen to the nearest 0.1 g.Designate this mass as “E.”Note 2: Method B is not acceptable for use with specimens that have more than 6 percent air voids.
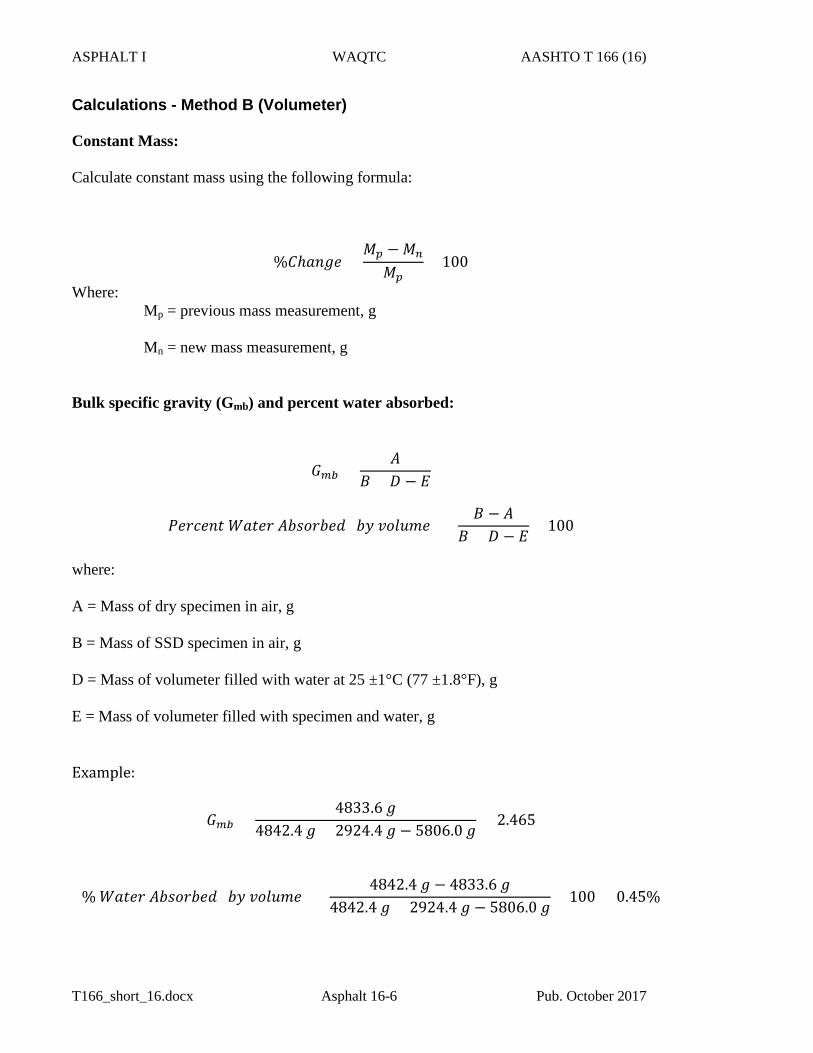
ASPHALT I WAQTC AASHTO T 166 (16)
T166_short_16.docx Asphalt 16-6 Pub. October 2017
Calculations - Method B (Volumeter)
Constant Mass:
Calculate constant mass using the following formula:
%𝐶𝐶ℎ𝑎𝑎𝑎𝑎𝑎𝑎𝑎𝑎 =𝑀𝑀𝑝𝑝 −𝑀𝑀𝑛𝑛
𝑀𝑀𝑝𝑝× 100
Where: Mp = previous mass measurement, g
Mn = new mass measurement, g
Bulk specific gravity (Gmb) and percent water absorbed:
𝐺𝐺𝑚𝑚𝑚𝑚 =𝐴𝐴
𝐵𝐵 + 𝐷𝐷 − 𝐸𝐸
𝑃𝑃𝑎𝑎𝑃𝑃𝑃𝑃𝑎𝑎𝑎𝑎𝑃𝑃 𝑊𝑊𝑎𝑎𝑃𝑃𝑎𝑎𝑃𝑃 𝐴𝐴𝐴𝐴𝐴𝐴𝐴𝐴𝑃𝑃𝐴𝐴𝑎𝑎𝐴𝐴 (𝐴𝐴𝑏𝑏 𝑣𝑣𝐴𝐴𝑣𝑣𝑣𝑣𝑣𝑣𝑎𝑎) =𝐵𝐵 − 𝐴𝐴
𝐵𝐵 + 𝐷𝐷 − 𝐸𝐸× 100
where:
A = Mass of dry specimen in air, g
B = Mass of SSD specimen in air, g
D = Mass of volumeter filled with water at 25 ±1°C (77 ±1.8°F), g
E = Mass of volumeter filled with specimen and water, g
Example:
𝐺𝐺𝑚𝑚𝑚𝑚 =4833.6 𝑎𝑎
4842.4 𝑎𝑎 + 2924.4 𝑎𝑎 − 5806.0 𝑎𝑎= 2.465
% 𝑊𝑊𝑎𝑎𝑃𝑃𝑎𝑎𝑃𝑃 𝐴𝐴𝐴𝐴𝐴𝐴𝐴𝐴𝑃𝑃𝐴𝐴𝑎𝑎𝐴𝐴 (𝐴𝐴𝑏𝑏 𝑣𝑣𝐴𝐴𝑣𝑣𝑣𝑣𝑣𝑣𝑎𝑎) =4842.4 𝑎𝑎 − 4833.6 𝑎𝑎
4842.4 𝑎𝑎 + 2924.4 𝑎𝑎 − 5806.0 𝑎𝑎× 100 = 0.45%
ASPHALT I WAQTC AASHTO T 166 (16)
T166_short_16.docx Asphalt 16-7 Pub. October 2017
Apparatus - Method C (Rapid Test for Method A or B) See Methods A or B. Note 3: This procedure can be used for specimens that are not required to be saved and contain substantial
amounts of moisture. Cores can be tested the same day as obtained by this method.
Procedure - Method C (Rapid Test for Method A or B) 1. Start on Step 3 of Method A or B, and complete that procedure, then determine dry mass,
“A,” as follows. 2. Determine and record mass of a large, flat-bottom container. 3. Place the specimen in the container. 4. Place in an oven at a minimum of 105°C (221°F). Do not exceed the Job Mix Formula
mixing temperature. 5. Dry until the specimen can be easily separated into fine aggregate particles that are not
larger than 6.3 mm (¼ in.). 6. Determine and record the mass of the specimen (Mp). 7. Return the specimen to the oven for at least 2 hours. 8. Determine and record the mass of the specimen (Mn). 9. Determine percent change by subtracting the new mass determination (Mn) from the
previous mass determination (Mp) divide by the previous mass determination (Mp) multiply by 100.
10. Continue drying until there is less than 0.05 percent change in specimen mass after 2-
hour drying intervals (constant mass). 11. Constant mass has been achieved, sample is defined as dry. 12. Cool in air to 25 ±5°C (77 ±9°F). 13. Determine and record the mass of the container and dry specimen to the nearest 0.1 g. 14. Determine and record the mass of the dry specimen to the nearest 0.1 g by subtracting the
mass of the container from the mass determined in Step 13. Designate this mass as “A.”
ASPHALT I WAQTC AASHTO T 166 (16)
T166_short_16.docx Asphalt 16-8 Pub. October 2017
Calculations - Method C (Rapid Test for Method A or B)
Complete the calculations as outlined in Methods A or B, as appropriate.
Report
• Results on forms approved by the agency
• Sample ID
• Gmb to 0.001
• Absorption to 0.01 percent
• Method performed

Oregon Department of TransportationConstruction Section
800 Airport Road SE Salem, OR 97301-4798
Telephone (503) 986-3000 FAX (503) 986-3096
October 31, 2009
To: All Holders of the Manual of Field Test Procedures
Section: Test Procedure AASHTO T 168
The Oregon Department of Transportation has specified method(s) for this Test Procedure. Please observe the following for our projects:
Sampling of mixture will conform to the following:
Drum Plants or Batch Plants – attached mechanical sampling device or fromhaul units at the production facility.
ASPHALT WAQTC FOP AASHTO T 168 (10)
T168_short_10.docx Asphalt 11-1 Pub. October 2015
SAMPLING OF BITUMINOUS PAVING MIXTURES FOP FOR AASHTO T 168
Scope
This procedure covers the sampling of bituminous paving mixtures from HMA plants, haul units, and roadways in accordance with AASHTO T 168-03. Sampling is as important as testing, and every precaution must be taken to obtain a truly representative sample.
Apparatus
• Shovel
• Sample containers: such as cardboard boxes, metal cans, stainless steel bowls, or otheragency-approved containers
• Scoops, trowels, or other equipment to obtain mix
• Sampling plate: Thick metal plate, minimum 8 gauge, sized to accommodate samplerequirements, with a wire attached to one corner long enough to reach from the center ofthe paver to the outside of the farthest auger extension. Holes ¼ in. in diameter should beprovided in each corner.
• Cookie cutter sampling device: Formed steel angle with two 100 mm by 150 mm by 9mm (4 in. by 6 in. by 3/8 in.) handles, sized to accommodate sample requirements.Minimum 2 in. smaller than the sampling plate when used together.
Example: Sampling plate 380 mm (15 in.) square and a cookie cutter sampling device330 mm (13 in.) square.
• Mechanical sampling device
Sample Size
Sample size depends on the test methods specified by the agency for acceptance. Check agency requirement for the size required.
Sampling
General
• The material shall be tested to determine variations. The supplier/contractor shallprovide equipment for safe and appropriate sampling, including sampling devices onplants when required.
ASPHALT WAQTC FOP AASHTO T 168 (10)
T168_short_10.docx Asphalt 11-2 Pub. October 2015
• For dense graded mixture samples use cardboard boxes, stainless steel bowls or otheragency-approved containers.
• For hot open graded mixture samples use stainless steel bowls. Do not put open gradedmixture samples in boxes until they have cooled to the point that bituminous material willnot migrate from the aggregate.
Attached Sampling Devices
Some agencies require mechanical sampling devices for hot mix asphalt (HMA) and cold feed aggregate on some projects. These are normally permanently attached devices that allow a sample container to pass perpendicularly through the entire stream of material or divert the entire stream of material into the container. Operation may be hydraulic, pneumatic, or manual and allows the sample container to pass through the stream twice, once in each direction, without overfilling. Special caution is necessary with manually operated systems since a consistent speed is difficult to maintain and non-representative samples may result. Check agency requirements for the specifics of required sampling systems.
1. Lightly coat the container attached to the sampling device with an agency-approvedrelease agent or preheat it, or both, to approximately the same discharge temperature ofthe mix.
2. Pass the container twice through the material perpendicularly without overfilling thecontainer.
3. Repeat until proper sample size has been obtained.
4. Transfer the HMA to an agency-approved container without loss of material.
Sampling from Haul Units
1. Visually divide the haul unit into approximately four equal quadrants.
2. Identify one sampling location in each quadrant.
3. Dig down and remove approximately 0.3 m (1 ft.) of material to avoid surfacesegregation. Obtain each increment from below this level.
4. Combine the increments to form a sample of the required size.
Sampling from Roadway Prior to Compaction (Plate Method)
Plate method using the “cookie cutter” sampling device.
There are two conditions that will be encountered when sampling hot mix asphalt (HMA) from the roadway prior to compaction. The two conditions are:
ASPHALT WAQTC FOP AASHTO T 168 (10)
T168_short_10.docx Asphalt 11-3 Pub. October 2015
• Laying HMA on grade or untreated base material requires Method 1. • Laying HMA on existing asphalt or laying a second lift of HMA requires
Method 2. SAFETY: Sampling is performed behind the paving machine and in front of the breakdown roller. For safety, the roller must remain at least 3 m (10 ft.) behind the sampling operation until the sample has been taken and the hole filled with loose HMA. Method 1 requires a plate to be placed in the roadway in front of the paving operation and therefore there is always concern with moving, operating equipment. It is safest to stop the paving train while a plate is installed in front of the paver. When this is not possible the following safety rules must be followed. 1. The plate placing operation must be at least 3 m (10 ft.) in front of the paver or pickup
device. The technician placing the plate must have eye contact and communication with the paving machine operator. If eye contact cannot be maintained at all time, a third person must be present to provide communication between the operator and the technician.
2. No technician is to be between the asphalt supply trucks and the paving machine. The
exception to this rule is if the supply truck is moving forward creating a windrow, in which case the technician must be at least 3 m (10 ft.) behind the truck.
If at any time the Engineer feels that the sampling technique is creating an unsafe condition, the operation is to be halted until it is made safe or the paving operation will be stopped while the plate is being placed. Method 1 - Obtaining a Sample on Untreated Base: 1. Following the safety rules detailed above, the technician is to:
a. Smooth out a location in front of the paver at least 0.5 m (2 ft.) inside the edge of the mat.
b. Lay the plate down diagonally with the direction of travel, keeping it flat and tight to
the base with the lead corner facing the paving machine. 2. Secure the plate in place by driving a nail through the hole in the lead corner of the plate. 3. Pull the wire, attached to the outside corner of the plate, taut past the edge of the HMA
mat and secure with a nail.
ASPHALT WAQTC FOP AASHTO T 168 (10)
T168_short_10.docx Asphalt 11-4 Pub. October 2015
4. Let the paving operation proceed over the plate and wire. Immediately proceed with thesampling.
5. Using the exposed end of the wire, pull the wire up through the fresh HMA to locate thecorner of the plate. Place the “cookie cutter” sample device, just inside the end of thewire; align the cutter over the plate. Press “cookie cutter” device down through the HMAto the plate.
6. Using a small square tipped shovel or scoop, or both, carefully remove all the HMA frominside of the cutter and place in a sample container. Care shall be taken to preventcontamination of bituminous mixes by dust or other foreign matter, and to avoidsegregation of aggregate and bituminous materials.
7. Remove the sample cutter and the plate from the roadway. The hole made from thesampling must be filled by the contractor with loose HMA.
Method 2 - Obtaining a Sample on Asphalt Surface:
1. After the paving machine has passed the sampling point, immediately place the “cookiecutter” sampling device on the location to be sampled. Push the cutter down through theHMA until it is flat against the underlying asphalt mat.
2. Using a small square tipped shovel or scoop, or both, carefully remove all the HMA frominside of the cutter and place in a sample container. The hole made from the samplingmust be filled by the contractor with loose HMA.
Identification and Shipping
1. Identify sample containers as required by the agency.
2. Ship samples in containers that will prevent loss, contamination, or damage.
Report
• On forms approved by the agency
• Sample ID
• Date
• Time
• Location
• Quantity represented

October 31, 2008
To: All Holders of the Manual of Field Test Procedures
Section: Test Procedure AASHTO T 176
The Oregon Department of Transportation has specified method(s) for this Test Procedure. Please observe the following for our projects:
Under Procedure, Delete Step 8e.
Run a minimum of Two Sand Equivalent samples. If these results do not meetthe requirements of “Procedure, Step 8d.” run an additional three samplesdiscarding the high and low results and average the remaining three samples.
AGGREGATE WAQTC FOP AASHTO T 176 (17)
T176_short_17.docx Aggregate 14-1 Pub. October 2017
PLASTIC FINES IN GRADED AGGREGATES AND SOILS BY THE USE OF THE SAND EQUIVALENT TEST FOP FOR AASHTO T 176 Scope This procedure covers the determination of plastic fines in accordance with AASHTO T 176-08. It serves as a rapid test to show the relative proportion of fine dust or clay-like materials in fine aggregates (FA) and soils. Apparatus See AASHTO T 176 for a detailed listing of sand equivalent apparatus. Note that the siphon tube and blow tube may be glass or stainless steel as well as copper. • Graduated plastic cylinder. • Rubber stopper.
• Irrigator tube.
• Weighted foot assembly: Having a mass of 1000 ±5g. There are two models of the
weighted foot assembly. The older model has a guide cap that fits over the upper end of the graduated cylinder and centers the rod in the cylinder. It is read using a slot in the centering screws. The newer model has a sand-reading indicator 254 mm (10 in.) above this point and is preferred for testing clay-like materials.
• Bottle: clean, glass or plastic, of sufficient size to hold working solution • Siphon assembly: The siphon assembly will be fitted to a 4 L (1 gal.) bottle of working
calcium chloride solution placed on a shelf 915 ±25 mm (36 ±1 in.) above the work surface.
• Measuring can: With a capacity of 85 ±5 mL (3 oz.). • Funnel: With a wide-mouth for transferring sample into the graduated cylinder. • Quartering cloth: 600 mm (2 ft.) square nonabsorbent cloth, such as plastic or oilcloth. • Mechanical splitter: See the FOP for AASHTO R 76. • Strike-off bar: A straightedge or spatula. • Clock or watch reading in minutes and seconds.
AGGREGATE WAQTC FOP AASHTO T 176 (17)
T176_short_17.docx Aggregate 14-2 Pub. October 2017
• Manually-operated sand equivalent shaker: Capable of producing an oscillating motion ata rate of 100 complete cycles in 45 ±5 seconds, with a hand assisted half stroke length of127 ±5 mm (5 ±0.2 in.). It may be held stable by hand during the shaking operation. It isrecommended that this shaker be fastened securely to a firm and level mount, by bolts orclamps, if a large number of determinations are to be made.
• Mechanical shaker: See AASHTO T 176 for equipment and procedure.
• Oven: Capable of maintaining a temperature of 110 ±5°C (230 ±9°F).
• Thermometer: Calibrated liquid-in-glass or electronic digital type designed for totalimmersion and accurate to 0.1°C (0.2°F).
Materials
• Stock calcium chloride solution: Obtain commercially prepared calcium chloride stocksolution meeting AASHTO requirements.
• Working calcium chloride solution: Dilute one 3 oz. measuring can (85 ±5 mL) of stockcalcium chloride solution with 3.8 L (1 gal) distilled or demineralized water. Thoroughlymix the solution by filling the bottle with 2 L (1/2 gal) of water. Add the stock solutionand agitate vigorously for 1 to 2 minutes. Add the remainder of the water, approximately2 L (1/2 gal.). Repeat the agitation process. The shelf life of the working solution isapproximately 30 days. Label working solution with the date mixed. Discard workingsolutions more than 30 days old.Note 1: The graduated cylinder filled to 4.4 in. contains 88 mL and may be used to measure the stock
solution.
Note 2: Tap water may be used if it is proven to be non-detrimental to the test and if it is allowed by theagency.
Control
The temperature of the working solution should be maintained at 22 ±3°C (72 ±5°F) during the performance of the test. If field conditions preclude the maintenance of the temperature range, reference samples should be submitted to the Central/Regional Laboratory, as required by the agency, where proper temperature control is possible. Samples that meet the minimum sand equivalent requirement at a working solution temperature outside of the temperature range need not be subject to reference testing.
Sample Preparation
1. Obtain the sample in accordance with the FOP for AASHTO T 2 and reduce inaccordance with the FOP for AASHTO R 76.
AGGREGATE WAQTC FOP AASHTO T 176 (17)
T176_short_17.docx Aggregate 14-3 Pub. October 2017
2. Prepare sand equivalent test samples from the material passing the 4.75 mm (No. 4)sieve. If the material is in clods, break it up and re-screen it over a 4.75 mm (No. 4)sieve. All fines shall be cleaned from particles retained on the 4.75 mm (No. 4) sieve andincluded with the material passing that sieve.
3. Split or quarter 1000 to 1500 g of material from the portion passing the 4.75 mm (No. 4)sieve. Use extreme care to obtain a truly representative portion of the original sample.Note 3: Experiments show that, as the amount of material being reduced by splitting or quartering is
decreased, the accuracy of providing representative portions is reduced. It is imperative that the sample be split or quartered carefully. When it appears necessary, dampen the material before splitting or quartering to avoid segregation or loss of fines.
Note 4: All tests, including reference tests, will be performed utilizing Alternative Method No. 2 as described in AASHTO T 176, unless otherwise specified.
4. The sample must have the proper moisture content to achieve reliable results. Thiscondition is determined by tightly squeezing a small portion of the thoroughly mixedsample in the palm of the hand. If the cast that is formed permits careful handling withoutbreaking, the correct moisture content has been obtained.Note 5: Clean sands having little 75 µm (No. 200), such as sand for Portland Cement Concrete (PCC), may
not form a cast.
If the material is too dry, the cast will crumble and it will be necessary to add water andremix and retest until the material forms a cast. When the moisture content is altered toprovide the required cast, the altered sample should be placed in a pan, covered with a lidor with a damp cloth that does not touch the material, and allowed to stand for aminimum of 15 minutes. Samples that have been sieved without being air-dried and stillretain enough natural moisture are exempted from this requirement.
If the material shows any free water, it is too wet to test and must be drained and airdried. Mix frequently to ensure uniformity. This drying process should continue untilsqueezing provides the required cast.
5. Place the sample on the quartering cloth and mix by alternately lifting each corner of thecloth and pulling it over the sample toward the diagonally opposite corner, being carefulto keep the top of the cloth parallel to the bottom, thus causing the material to be rolled.When the material appears homogeneous, finish the mixing with the sample in a pile nearthe center of the cloth.
6. Fill the measuring can by pushing it through the base of the pile while exerting pressurewith the hand against the pile on the side opposite the measuring can. As the can ismoved through the pile, hold enough pressure with the hand to cause the material to fillthe tin to overflowing. Press firmly with the palm of the hand, compacting the materialand placing the maximum amount in the can. Strike off the can level full with thestraightedge or spatula.
7. When required, repeat steps 5 and 6 to obtain additional samples.
AGGREGATE WAQTC FOP AASHTO T 176 (17)
T176_short_17.docx Aggregate 14-4 Pub. October 2017
Procedure 1. Start the siphon by forcing air into the top of the solution bottle through the tube while
the pinch clamp is open. Siphon 101.6 ±2.5 mm (4 ±0.1 in.) of working calcium chloride solution into the plastic cylinder.
2. Pour the prepared test sample from the measuring can into the plastic cylinder, using the
funnel to avoid spilling.
3. Tap the bottom of the cylinder sharply on the heel of the hand several times to release air bubbles and to promote thorough wetting of the sample.
4. Allow the wetted sample to stand undisturbed for 10 ±1 minutes.
5. At the end of the 10-minute period, stopper the cylinder and loosen the material from the bottom by simultaneously partially inverting and shaking the cylinder.
6. After loosening the material from the bottom of the cylinder, shake the cylinder and
contents by any one of the following methods:
a. Mechanical Method – Place the stoppered cylinder in the mechanical shaker, set the timer, and allow the machine to shake the cylinder and contents for 45 ±1 seconds.
Caution: Agencies may require additional operator qualifications for the next two methods.
b. Manually-operated Shaker Method – Secure the stoppered cylinder in the three spring clamps on the carriage of the manually-operated sand equivalent shaker and set the stroke counter to zero. Stand directly in front of the shaker and force the pointer to the stroke limit marker painted on the backboard by applying an abrupt horizontal thrust to the upper portion of the right hand spring strap. Remove the hand from the strap and allow the spring action of the straps to move the carriage and cylinder in the opposite direction without assistance or hindrance. Apply enough force to the right-hand spring steel strap during the thrust portion of each stroke to move the pointer to the stroke limit marker by pushing against the strap with the ends of the fingers to maintain a smooth oscillating motion. The center of the stroke limit marker is positioned to provide the proper stroke length and its width provides the maximum allowable limits of variation. Proper shaking action is accomplished when the tip of the pointer reverses direction within the marker limits. Proper shaking action can best be maintained by using only the forearm and wrist action to propel the shaker. Continue shaking for 100 strokes.
c. Hand Method – Hold the cylinder in a horizontal position and shake it vigorously in a horizontal linear motion from end to end. Shake the cylinder 90 cycles in approximately 30 seconds using a throw of 229 mm ±25 mm (9 ±1 in.). A cycle is defined as a complete back and forth motion. To properly shake the cylinder at this
AGGREGATE WAQTC FOP AASHTO T 176 (17)
T176_short_17.docx Aggregate 14-5 Pub. October 2017
speed, it will be necessary for the operator to shake with the forearms only, relaxing the body and shoulders.
7. Set the cylinder upright on the work table and remove the stopper.
8. Insert the irrigator tube in the cylinder and rinse material from the cylinder walls as theirrigator is lowered. Force the irrigator through the material to the bottom of the cylinderby applying a gentle stabbing and twisting action while the working solution flows fromthe irrigator tip. Work the irrigator tube to the bottom of the cylinder as quickly aspossible, since it becomes more difficult to do this as the washing proceeds. This flushesthe fine material into suspension above the coarser sand particles.
Continue to apply a stabbing and twisting action while flushing the fines upward until thecylinder is filled to the 381 mm (15 in.) mark. Then raise the irrigator slowly withoutshutting off the flow so that the liquid level is maintained at about 381 mm (15 in.) whilethe irrigator is being withdrawn. Regulate the flow just before the irrigator is entirelywithdrawn and adjust the final level to 381 mm (15 in.).Note 6: Occasionally the holes in the tip of the irrigator tube may become clogged by a particle of sand. If
the obstruction cannot be freed by any other method, use a pin or other sharp object to force it out, using extreme care not to enlarge the size of the opening. Also, keep the tip sharp as an aid to penetrating the sample.
9. Allow the cylinder and contents to stand undisturbed for 20 minutes ±15 seconds. Starttiming immediately after withdrawing the irrigator tube.Note 7: Any vibration or movement of the cylinder during this time will interfere with the normal settling
rate of the suspended clay and will cause an erroneous result.
10. Clay and sand readings:
a. At the end of the 20-minute sedimentation period, read and record the level of the topof the clay suspension. This is referred to as the clay reading.
Note 8: If no clear line of demarcation has formed at the end of the 20-minute sedimentation period, allow the sample to stand undisturbed until a clay reading can be obtained, then immediately read and record the level of the top of the clay suspension and the total sedimentation time. If the total sedimentation time exceeds 30 minutes, rerun the test using three individual samples of the same material. Read and record the clay column height of the sample requiring the shortest sedimentation period only. Once a sedimentation time has been established, subsequent tests will be run using that time. The time will be recorded along with the test results on all reports.
b. After the clay reading has been taken, place the weighted foot assembly over thecylinder and gently lower the assembly until it comes to rest on the sand. Do notallow the indicator to hit the mouth of the cylinder as the assembly is being lowered.Subtract 254 mm (10 in.) from the level indicated by the extreme top edge of theindicator and record this value as the sand reading.
c. If clay or sand readings fall between 2.5 mm (0.1 in.) graduations, record the level ofthe higher graduation as the reading. For example, a clay reading that appears to be7.95 would be recorded as 8.0; a sand reading that appears to be 3.22 would berecorded as 3.3.
AGGREGATE WAQTC FOP AASHTO T 176 (17)
T176_short_17.docx Aggregate 14-6 Pub. October 2017
d. If two Sand Equivalent (SE) samples are run on the same material and the second
varies by more than ±4, based on the first cylinder result, additional tests shall be run.
e. If three or more Sand Equivalent (SE) samples are run on the same material, average the results. If an individual result varies by more than ±4, based on the average result, additional tests shall be run.
Calculations Calculate the SE to the nearest 0.1 using the following formula:
𝑆𝑆𝑆𝑆 =𝑆𝑆𝑆𝑆𝑆𝑆𝑆𝑆 𝑅𝑅𝑅𝑅𝑆𝑆𝑆𝑆𝑅𝑅𝑆𝑆𝑅𝑅𝐶𝐶𝐶𝐶𝑆𝑆𝐶𝐶 𝑅𝑅𝑅𝑅𝑆𝑆𝑆𝑆𝑅𝑅𝑆𝑆𝑅𝑅
× 100
Example:
Sand Reading = 3.3 Clay Reading = 8.0
𝑆𝑆𝑆𝑆 =3.38.0
× 100 = 41.25 𝑜𝑜𝑜𝑜 41.3 Report 42
Note 9: This example reflects the use of equipment made with English units. At this time, equipment made with metric units is not available.
Report the SE as the next higher whole number. In the example above, the 41.3 would be reported as 42. An SE of 41.0 would be reported as 41. When averaging two or more samples, raise each calculated SE value to the next higher whole number (reported value) before averaging.
Example:
calculated value 1 = 41.3 calculated value 2 = 42.8 These values are reported as 42 and 43, respectively.
AGGREGATE WAQTC FOP AASHTO T 176 (17)
T176_short_17.docx Aggregate 14-7 Pub. October 2017
Average the two reported values:
𝐴𝐴𝐴𝐴𝑅𝑅𝑜𝑜𝑆𝑆𝑅𝑅𝑅𝑅 𝑆𝑆𝑆𝑆 =42 + 43
2= 42.5 Report 43
If the average value is not a whole number, raise it to the next higher whole number.
Report
• Results on forms approved by the agency
• Sample ID
• Results to the whole number
• Sedimentation time if over 20 minutes


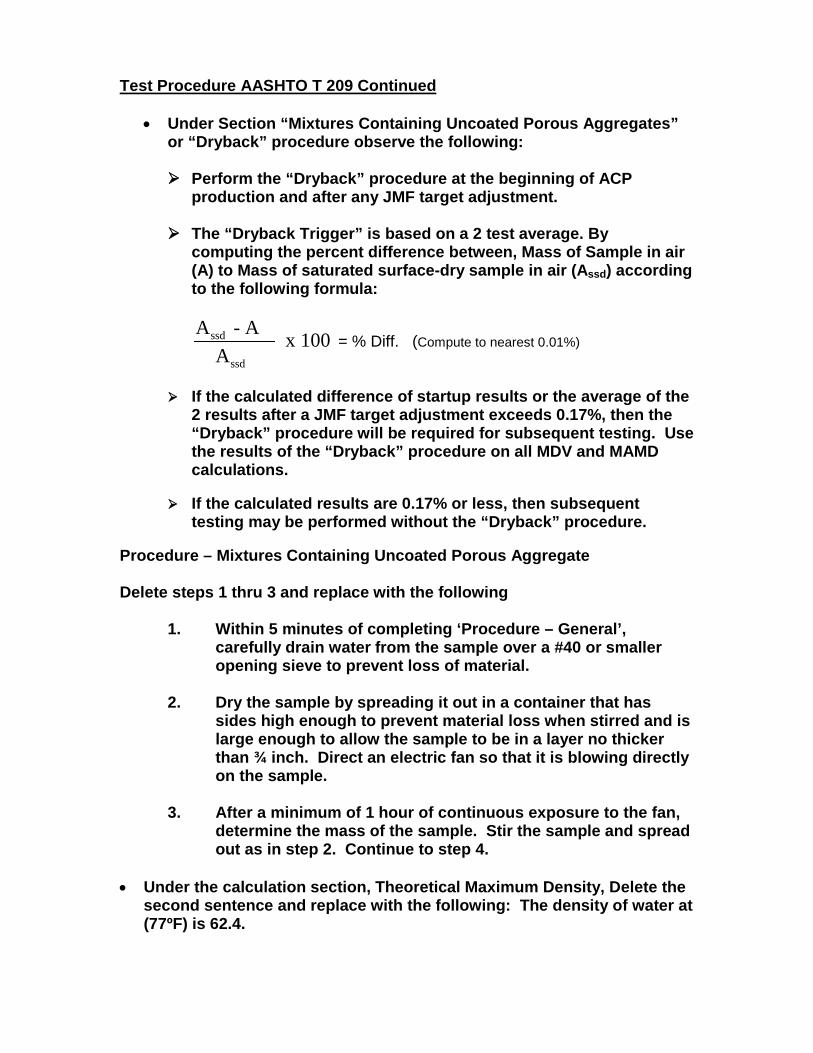
Test Procedure AASHTO T 209 Continued
• Under Section “Mixtures Containing Uncoated Porous Aggregates”or “Dryback” procedure observe the following:
Perform the “Dryback” procedure at the beginning of ACPproduction and after any JMF target adjustment.
The “Dryback Trigger” is based on a 2 test average. Bycomputing the percent difference between, Mass of Sample in air(A) to Mass of saturated surface-dry sample in air (Assd) accordingto the following formula:
ssd
ssd
A - A x 100A
= % Diff. (Compute to nearest 0.01%)
If the calculated difference of startup results or the average of the2 results after a JMF target adjustment exceeds 0.17%, then the“Dryback” procedure will be required for subsequent testing. Usethe results of the “Dryback” procedure on all MDV and MAMDcalculations.
If the calculated results are 0.17% or less, then subsequenttesting may be performed without the “Dryback” procedure.
Procedure – Mixtures Containing Uncoated Porous Aggregate
Delete steps 1 thru 3 and replace with the following
1. Within 5 minutes of completing ‘Procedure – General’,carefully drain water from the sample over a #40 or smalleropening sieve to prevent loss of material.
2. Dry the sample by spreading it out in a container that hassides high enough to prevent material loss when stirred and islarge enough to allow the sample to be in a layer no thickerthan ¾ inch. Direct an electric fan so that it is blowing directlyon the sample.
3. After a minimum of 1 hour of continuous exposure to the fan,determine the mass of the sample. Stir the sample and spreadout as in step 2. Continue to step 4.
• Under the calculation section, Theoretical Maximum Density, Delete thesecond sentence and replace with the following: The density of water at(77ºF) is 62.4.

November 30, 2017
To: All Holders of the Manual of Field Test Procedures
Section: Test Procedure AASHTO T 209
The Oregon Department of Transportation has specified method(s) for this Test Procedure. Please observe the following for our projects:
• Under apparatus delete Bleeder valve and replace with, inline bleedervalve capable of regulating the vacuum between 25 & 30mm ofmercury.
• Under Standardization of Pycnometer or Volumetric Flask section,delete the last sentence and replace with the following: Thevolumetric flask shall be standardized annually and when thecalibration value is in question. The standardization will be based onthe average of two separate weightings. The two weights must bewithin 0.3 grams for a validate average.
• Use the flask method.
• Under Test Sample Preparation Section add the following: The testsample will be cured for a minimum of 1 hr. and a maximum of 3 hrs.according to the placement temperature range shown on the MixDesign. If the total time of storage and haul is less than 1 hour asdetermined by the Region QAC, Contractor CAT II and ProjectManager then the test sample shall not be cured.
• Under the Procedure- (Pycnometer or Volumetric Flask) Delete step12B, 13B and Note 2 and replace with the following: Fill the flaskwith (77.0oF +- 2oF) water and allow to stand for 10 ±1 minutes.
• Under Procedure – (Pycnometer or Volumetric Flask) Delete step 14Band replace with the following: The water temperature upon finishingfilling the flask shall be at (77.0oF +- 2oF). Place the cover or a glassplate on the flask, and eliminate all air from the flask. The use of thetemperature correction tables will not be allowed (The R Value underCalculation = 1.000).
(See Next Page)
Kate Brown, Governor
Department of Transportation Construction Section 800 Airport Road SE
Salem, OR 97301-4792 Phone: (503) 986-3000
Fax: (503) 986-3096
ASPHALT I WAQTC FOP AASHTO T 209 (16)
T209_short_16.docx Asphalt 15-1 Pub. October 2016
THEORETICAL MAXIMUM SPECIFIC GRAVITY (Gmm) AND DENSITY OF HOT MIX ASPHALT (HMA) PAVING MIXTURES FOP FOR AASHTO T 209 Scope This procedure covers the determination of the maximum specific gravity (Gmm) of uncompacted hot mix asphalt (HMA) paving mixtures in accordance with AASHTO T 209-12. Two methods using different containers – bowl and pycnometer / volumetric flask– are covered. Specimens prepared in the laboratory shall be cured according to agency standards. Apparatus • Balance or scale: 10,000 g capacity, readable to 0.1 g • Container: A glass, metal, or plastic bowl, pycnometer or volumetric flask between 2000
and 10,000 mL as required by the minimum sample size requirements in Table 1 sample and capable of withstanding a partial vacuum
• Pycnometer / volumetric flask cover: A glass plate or a metal or plastic cover with a
vented opening • Vacuum lid: A transparent lid with a suitable vacuum connection, with a vacuum
opening to be covered with a fine wire mesh • Vacuum pump or water aspirator: Capable of evacuating air from the container to a
residual pressure of 4.0 kPa (30 mm Hg) • Residual pressure manometer or vacuum gauge: Traceable to NIST and capable of
measuring residual pressure down to 4.0 kPa (30 mm Hg) or less • Manometer or vacuum gauge: Capable of measuring the vacuum being applied at the
source of the vacuum • Water bath: A constant-temperature water bath (optional) • Thermometers: Standardized liquid-in-glass, or electronic digital total immersion type,
accurate to 0.5°C (1°F) • Bleeder valve to adjust vacuum
• Timer
ASPHALT I WAQTC FOP AASHTO T 209 (16)
T209_short_16.docx Asphalt 15-2 Pub. October 2016
Standardization of Pycnometer or Volumetric Flask
Use a pycnometer / volumetric flask that is standardized to accurately determine the mass of water, at 25 ±0.5°C (77 ±1°F), in the pycnometer / volumetric flask. The pycnometer / volumetric flask shall be standardized periodically in conformance with procedures established by the agency.
Test Sample Preparation
1. Obtain samples in accordance with the FOP for AASHTO T 168 and reduce according tothe FOP for AASHTO R 47.
2. Test sample size shall conform to the requirements of Table 1. Samples larger than thecapacity of the container may be tested in two or more increments. Results will becombined and averaged. If the increments have a specific gravity difference greater than0.014 the test must be re-run.
Table 1 Test Sample Size for Gmm
Nominal Maximum* Aggregate Size
mm (in.) Minimum Mass
g 37.5 or greater (1 ½) 4000
19 to 25 (3/4 to1) 2500 12.5 or smaller (1/2) 1500
*Nominal maximum size: One sieve larger than the first sieve to retain more than 10 percentof the material using an agency specified set of sieves based on cumulative percent retained.
Procedure – General
Two procedures – bowl and pycnometer / volumetric flask – are covered. The first 11 steps are the same for both.
1. Separate the particles of the sample, taking care not to fracture the mineral particles,so that the particles of the fine aggregate portion are not larger than 6.3 mm (1/4 in.).If the mixture is not sufficiently soft to be separated manually, place it in a large flatpan and warm in an oven only until it is pliable enough for separation.
2. Cool the sample to room temperature.
3. Determine and record the mass of the dry container to the nearest 0.1 g.
4. Place the sample in the container.
5. Determine and record the mass of the dry container and sample to the nearest 0.1 g.
6. Determine and record the mass of the sample by subtracting the mass determined inStep 3 from the mass determined in Step 5. Designate this mass as “A.”
ASPHALT I WAQTC FOP AASHTO T 209 (16)
T209_short_16.docx Asphalt 15-3 Pub. October 2016
7. Add sufficient water at approximately 25° C (77° F) to cover the sample by about25 mm (1 in.).
Note 1: The release of entrapped air may be facilitated by the addition of a wetting agent. Check with the agency to see if this is permitted and, if it is, for a recommended agent.
8. Place the lid on the container and attach the vacuum line. To ensure a proper sealbetween the container and the lid, wet the O-ring or use a petroleum gel.
9. Remove entrapped air by subjecting the contents to a partial vacuum of 3.7 ±0.3 kPa(27.5 ±2.5 mm Hg) residual pressure for 15 ±2 minutes.
10. Agitate the container and contents, either continuously by mechanical device ormanually by vigorous shaking, at 2 minute intervals. This agitation facilitates theremoval of air.
11. Release the vacuum, increasing the pressure to atmospheric pressure in 10 to 15seconds, turn off the vacuum pump, and remove the lid. When performing thepycnometer / volumetric flask method, complete steps 12B through 16B within 10±1minutes.
Procedure – Bowl
12A. Fill the water bath to overflow level with water at 25 ±1°C (77 ±2°F) and allow the water to stabilize.
13A. Zero or tare the balance with the immersion apparatus attached, ensuring that the device is not touching the sides or the bottom of the water bath.
14A. Suspend and immerse the bowl and contents in water at 25 ±1°C (77 ±2°F) for 10 ±1 minutes. The holder shall be immersed sufficiently to cover both it and the bowl.
15A. Determine and record the submerged weight of the bowl and contents to the nearest 0.1 g.
16A. Refill the water bath to overflow level.
17A. Empty and re-submerge the bowl following Step 12A to determine the submerged weight of the bowl to the nearest 0.1 g.
18A. Determine and record the submerged weight of the sample to the nearest 0.1 g by subtracting the submerged weight of the bowl from the submerged weight determined in Step 15A. Designate this submerged weight as “C.”
ASPHALT I WAQTC FOP AASHTO T 209 (16)
T209_short_16.docx Asphalt 15-4 Pub. October 2016
Procedure – Pycnometer or Volumetric Flask 12B. Immediately fill the pycnometer / volumetric flask with water without reintroducing
air. 13B. Stabilize the temperature of the pycnometer / volumetric flask and contents so that the
final temperature is within 25 ±1°C (77 ±2°F). 14B. Finish filling the pycnometer / volumetric flask with water that is 25 ±1°C (77 ±2°F),
place the cover or a glass plate on the pycnometer / volumetric flask, and eliminate all air.
Note 2: When using a metal pycnometer and cover, place the cover on the pycnometer and push down slowly, forcing excess water out of the hole in the center of the cover. Use care when filling the pycnometer to avoid reintroducing air into the water.
15B. Towel dry the outside of the pycnometer / volumetric flask and cover. 16B. Determine and record the mass of the pycnometer / volumetric flask, cover, de-aired
water, and sample to the nearest 0.1 g. within 10 ±1 minutes of completion of Step 11. Designate this mass as “E.”
Procedure – Mixtures Containing Uncoated Porous Aggregate If the pores of the aggregates are not thoroughly sealed by a bituminous film, they may become saturated with water during the vacuuming procedure, resulting in an error in maximum density. To determine if this has occurred, complete the general procedure and then: 1. Carefully drain water from sample through a towel held over the top of the container
to prevent loss of material. 2. Spread sample in a flat shallow pan and place before an electric fan to remove surface
moisture. 3. Determine the mass of the sample when the surface moisture appears to be gone. 4. Continue drying and determine the mass of the sample at 15-minute intervals until
less than a 0.5 g loss is found between determinations. 5. Record the mass as the saturated surface dry mass to the nearest 0.1 g. Designate this
mass as “ASSD.” 6. Calculate, as indicated below, Gmm using “A” and “ASSD,” and compare the two
values.
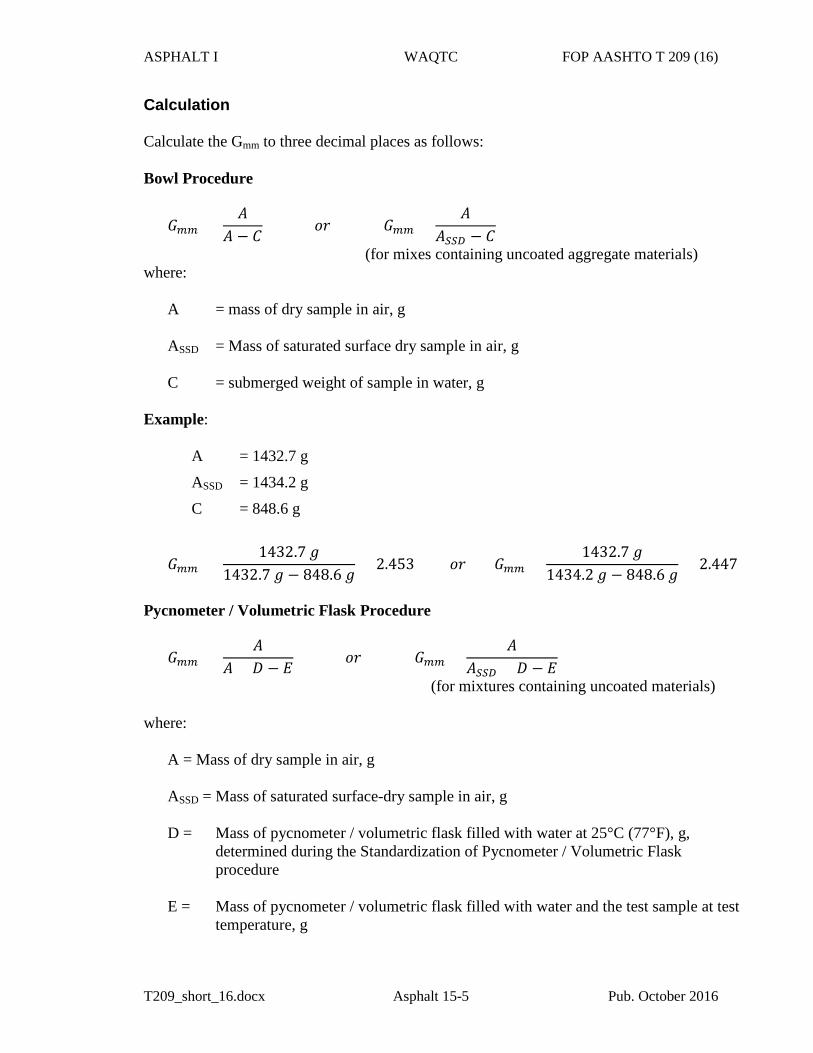
ASPHALT I WAQTC FOP AASHTO T 209 (16)
T209_short_16.docx Asphalt 15-5 Pub. October 2016
Calculation
Calculate the Gmm to three decimal places as follows:
Bowl Procedure
𝐺𝐺𝑚𝑚𝑚𝑚 = 𝐴𝐴
𝐴𝐴 − 𝐶𝐶 𝑜𝑜𝑜𝑜 𝐺𝐺𝑚𝑚𝑚𝑚 =
𝐴𝐴𝐴𝐴𝑆𝑆𝑆𝑆𝑆𝑆 − 𝐶𝐶
(for mixes containing uncoated aggregate materials) where:
A = mass of dry sample in air, g
ASSD = Mass of saturated surface dry sample in air, g
C = submerged weight of sample in water, g
Example:
A = 1432.7 g
ASSD = 1434.2 g
C = 848.6 g
𝐺𝐺𝑚𝑚𝑚𝑚 = 1432.7 𝑔𝑔
1432.7 𝑔𝑔 − 848.6 𝑔𝑔= 2.453 𝑜𝑜𝑜𝑜 𝐺𝐺𝑚𝑚𝑚𝑚 =
1432.7 𝑔𝑔1434.2 𝑔𝑔 − 848.6 𝑔𝑔
= 2.447
Pycnometer / Volumetric Flask Procedure
𝐺𝐺𝑚𝑚𝑚𝑚 = 𝐴𝐴
𝐴𝐴 + 𝐷𝐷 − 𝐸𝐸 𝑜𝑜𝑜𝑜 𝐺𝐺𝑚𝑚𝑚𝑚 =
𝐴𝐴𝐴𝐴𝑆𝑆𝑆𝑆𝑆𝑆 + 𝐷𝐷 − 𝐸𝐸
(for mixtures containing uncoated materials)
where:
A = Mass of dry sample in air, g
ASSD = Mass of saturated surface-dry sample in air, g
D = Mass of pycnometer / volumetric flask filled with water at 25°C (77°F), g, determined during the Standardization of Pycnometer / Volumetric Flask procedure
E = Mass of pycnometer / volumetric flask filled with water and the test sample at test temperature, g
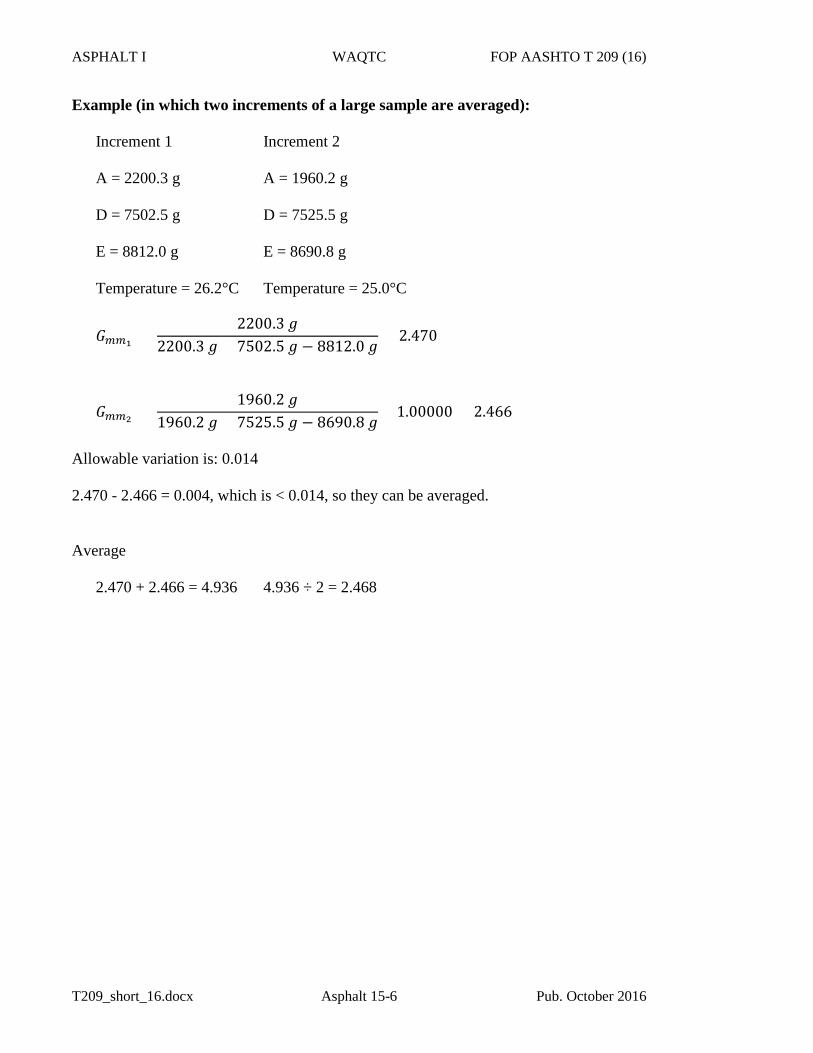
ASPHALT I WAQTC FOP AASHTO T 209 (16)
T209_short_16.docx Asphalt 15-6 Pub. October 2016
Example (in which two increments of a large sample are averaged):
Increment 1 Increment 2 A = 2200.3 g A = 1960.2 g D = 7502.5 g D = 7525.5 g E = 8812.0 g E = 8690.8 g Temperature = 26.2°C Temperature = 25.0°C
𝐺𝐺𝑚𝑚𝑚𝑚1 = 2200.3 𝑔𝑔
2200.3 𝑔𝑔 + 7502.5 𝑔𝑔 − 8812.0 𝑔𝑔= 2.470
𝐺𝐺𝑚𝑚𝑚𝑚2 = 1960.2 𝑔𝑔
1960.2 𝑔𝑔 + 7525.5 𝑔𝑔 − 8690.8 𝑔𝑔× 1.00000 = 2.466
Allowable variation is: 0.014 2.470 - 2.466 = 0.004, which is < 0.014, so they can be averaged. Average 2.470 + 2.466 = 4.936 4.936 ÷ 2 = 2.468
ASPHALT I WAQTC FOP AASHTO T 209 (16)
T209_short_16.docx Asphalt 15-7 Pub. October 2016
Theoretical Maximum Density
To calculate the theoretical maximum density at 25°C (77°F) use one of the following formulas. The density of water at 25°C (77°F) is 997.1 in Metric units or 62.245 in English units.
Theoretical maximum density kg/m3 = Gmm × 997.1 kg/ m3
2.468 × 997.1 kg/ m3 = 2461 kg/ m3
or
Theoretical maximum density lb/ft3 = Gmm × 62.245 lb/ft3
2.468 × 62.245 lb/ft3 = 153.6 lb/ft3
Report
• Results on forms approved by the agency
• Sample ID
• Gmm to three decimal places
• Theoretical maximum density to1 kg/m3 (0.1 lb/ft3)


Oregon Department of TransportationConstruction Section
800 Airport Road SE Salem, OR 97301-4798
Telephone (503) 986-3000 FAX (503) 986-3096
DATE: October 1, 2001
TO: All Holders of the Manual of Field Test Procedures File Code:
SECTION: Test Procedure AASHTO T 217
The Oregon Department of Transportation has specified method(s) for this Test Procedure. Please observe the following for our projects:
Procedure- Addendum to step 5, Rotate the vessel for 30 seconds, rest for 30seconds and repeat until gauge dial reflects no further increase. A minimumof 3 rotations (3 minutes) is required.
Procedure- Addendum to step 9, Use the following equation in lieu of theconversion curve to calculate the moisture content based on the dry weight ofmaterial. See form 3468.
% Moisture based on Dry = 100 X Reading Gauge Moisture % - 100
Reading Gauge Moisture %
Reporting- Report moisture to the nearest 0.1%.
EMBANKMENT AND BASE WAQTC AASHTO T 217 IN-PLACE DENSITY
DETERMINATION OF MOISTURE IN SOILS BY MEANS OF CALCIUM CARBIDE GAS PRESSURE MOISTURE TESTER FOP FOR AASHTO T 217
Scope
This procedure uses a calcium carbide gas pressure moisture tester to determine the moisture content of soils in accordance with AASHTO T 217. This FOP does not apply to the Super 200 D tester (see AASHTO 217).
CAUTION: This procedure involves a potentially dangerous chemical reaction. When calcium carbide reacts with water, acetylene gas is produced. Breathing the acetylene gas and running the test where potential for sparks or other ignition might cause a fire must be avoided.
Apparatus
• Calcium carbide gas pressure moisture tester.• Balance or scale, conforming to the requirements for AASHTO M 231 and having a
capacity of 2 kg and sensitive to 0.1 g. Most testers include a balance built into thetransportation container.
• Cleaning brush and cloth.• Scoop (or cap built into unit) for putting the soil sample into the pressure chamber.
Some testers include a cap built into the unit.• Steel balls, 31.75 mm (1.25”)
Material
• Calcium carbide reagent meeting the requirements of AASHTO T 217.
Note 1: Check the manufacturer’s recommendations for maximum storage life and replacement, and storage requirements.
Procedure
1. With the moisture tester in a horizontal position place three scoops, approximately 24 g,of calcium carbide, into the body.
2. Place two steel balls into the body of the tester with the calcium carbide.3. Obtain a sample of soil of the wet mass specified by the manufacturer, using the balance
built into the unit, and place the soil into the cap of the tester.Note 2: This method shall not be used on granular material having particles large enough to affect the accuracy of the test. In general, no + 4.75 mm (No.4) material.
T217_short E&B/ID 17-1 October 2007
EMBANKMENT AND BASE WAQTC AASHTO T 217 IN-PLACE DENSITY
Note 3: If the anticipated moisture content exceeds the capacity of the instrument being used, then one-half of the specified soil mass should be placed into the unit, and the resulting gauge reading multiplied by two.
4. With the instrument in a horizontal position, so that calcium carbide does not come into contact with the soil, seat the cap on the body and tighten down on the clamp, thereby sealing the tester.
5. Carefully turn the unit to vertical and gently tap to allow the soil to fall from the cap into the pressure vessel. Do not allow the steel balls to strike the bottom of the pressure vessel.
6. Return vessel to horizontal position. Create a circular motion that causes the steel balls to roll around the interior perimeter of the vessel. Do not allow the steel balls to hit the cap or the bottom of the pressure vessel. Continue this motion vigorously for 60 seconds then rest for 30 seconds. Repeat motion and resting cycles a minimum of three times or until no further reaction occurs.
7. Allow time for the dissipation of the heat generated by the chemical reaction. 8. When the gauge needle stops moving, take a reading while holding the unit in a
horizontal position at eye level. 9. Record the sample mass and the gauge reading. 10. Position the unit so that the cap is away from the user and slowly loosen the clamp to
release the gas from the pressure chamber. Inspect the sample inside the pressure chamber. If it is not completely pulverized, a new sample must be obtained and tested after the instrument has been thoroughly cleaned.
Moisture Determination 1. The tester determines moisture content based on the wet mass of the soil. Moisture
content based on the dry mass of soil is obtained from a conversion chart or curve supplied with each tester. See Figure 1 for curve from AASHTO T 217.
Note 4: Check the accuracy of the gauge and the conversion chart or curve periodically, in accordance with agency requirements, by testing samples of a known moisture content. Develop correction factors, if necessary.
Example: Gauge reading: 18.5 Conversion from chart: 22.1 Recorded % moisture: 22%
T217_short E&B/ID 17-2 October 2007
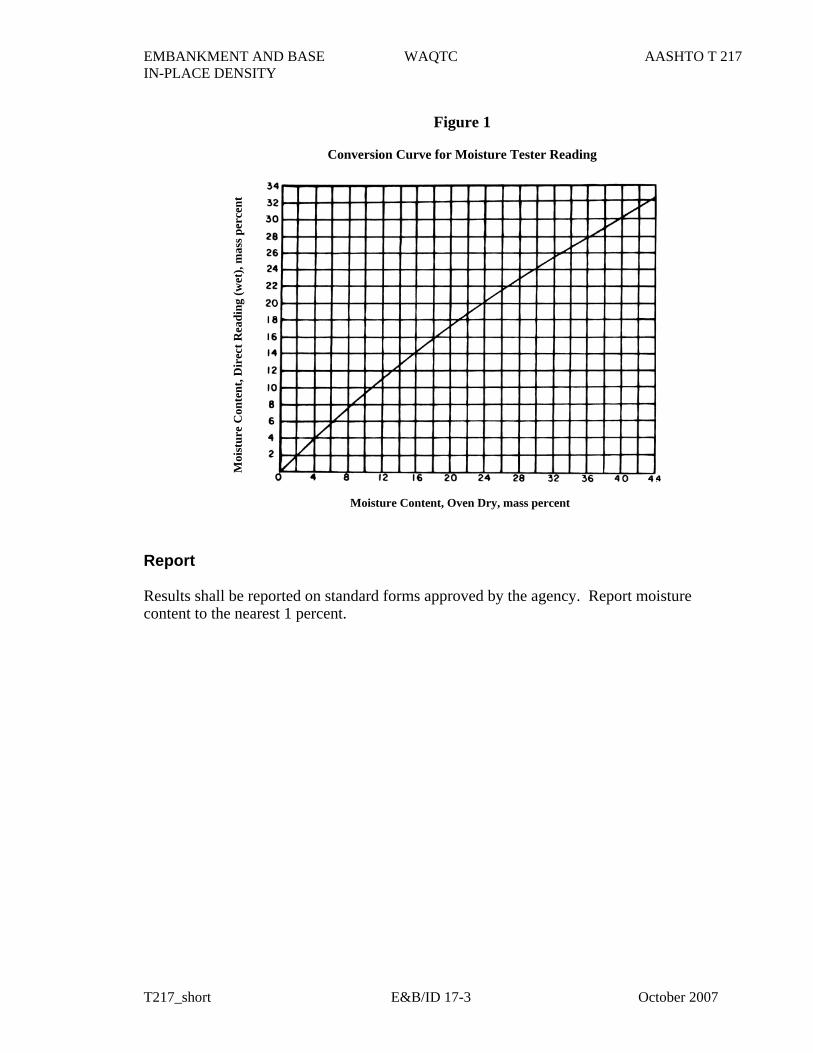
EMBANKMENT AND BASE WAQTC AASHTO T 217 IN-PLACE DENSITY
Figure 1
Conversion Curve for Moisture Tester Reading
Moi
stur
e C
onte
nt, D
irec
t Rea
ding
(wet
), m
ass p
erce
nt
Moisture Content, Oven Dry, mass percent
Report
Results shall be reported on standard forms approved by the agency. Report moisture content to the nearest 1 percent.
T217_short E&B/ID 17-3 October 2007

EMBANKMENT AND BASE WAQTC AASHTO T 217 IN-PLACE DENSITY
T217_short E&B/ID 17-4 October 2007

Capping Cylindrical Concrete Specimens
AASHTO Designation: T 231-17 ASTM Designation: C 617-98 (2003)
AASHTO TEST METHODS CANNOT BE INCLUDED ON ODOT’S WEBSITE DUE TO COPYRIGHT INFRINGEMENT.
TO GET COPIES OF THE TEST METHODS, YOU CAN ORDER A HARD COPY OF ODOT’S MANUAL OF FIELD TEST PROCEDURES OR YOU CAN ORDER THE LATEST STANDARD SPECIFICATIONS FOR TRANSPORTATION MATERIALS AND METHODS OF SAMPLING AND TESTING FROM AASHTO. ORDERING INSTRUCTIONS ARE GIVEN BELOW:
To order ODOT’s Manual of Field Test Procedures, use the following web address: http://www.oregon.gov/ODOT/Construction/Pages/Manual-of-Field-Test-Procedures.aspx
To order AASHTO’s Standard Specifications for Transportation Materials and Methods of Sampling and Testing, use the following web address: https://bookstore.transportation.org/

EMBANKMENT AND BASE WAQTC FOP AASHTO T 255 / T 265 (16) IN-PLACE DENSITY
T255_T265_short_16.docx E&B/ID 13-1 Pub. October 2016
TOTAL EVAPORABLE MOISTURE CONTENT OF AGGREGATE BY DRYING FOP FOR AASHTO T 255 LABORATORY DETERMINATION OF MOISTURE CONTENT OF SOILS FOP FOR AASHTO T 265
Scope
This procedure covers the determination of moisture content of aggregate and soil in accordance with AASHTO T 255-00 and AASHTO T 265-15. It may also be used for other construction materials.
Overview
Moisture content is determined by comparing the wet mass of a sample and the mass of the sample after drying to constant mass. The term constant mass is used to define when a sample is dry.
Constant mass – the state at which a mass does not change more than a given percent, after additional drying for a defined time interval, at a required temperature.
Apparatus
• Balance or scale: capacity sufficient for the principle sample mass, accurate to0.1 percent of sample mass or readable to 0.1 g, and meeting the requirements ofAASHTO M 231
• Containers, clean, dry and capable of being sealed
• Suitable drying containers
• Microwave safe container with ventilated lid
• Heat source, controlled:
− Forced draft oven
− Ventilated oven
− Convection oven
• Heat source, uncontrolled:
− Infrared heater/heat lamp, hot plate, fry pan, or any other device/method that will drythe sample without altering the material being dried
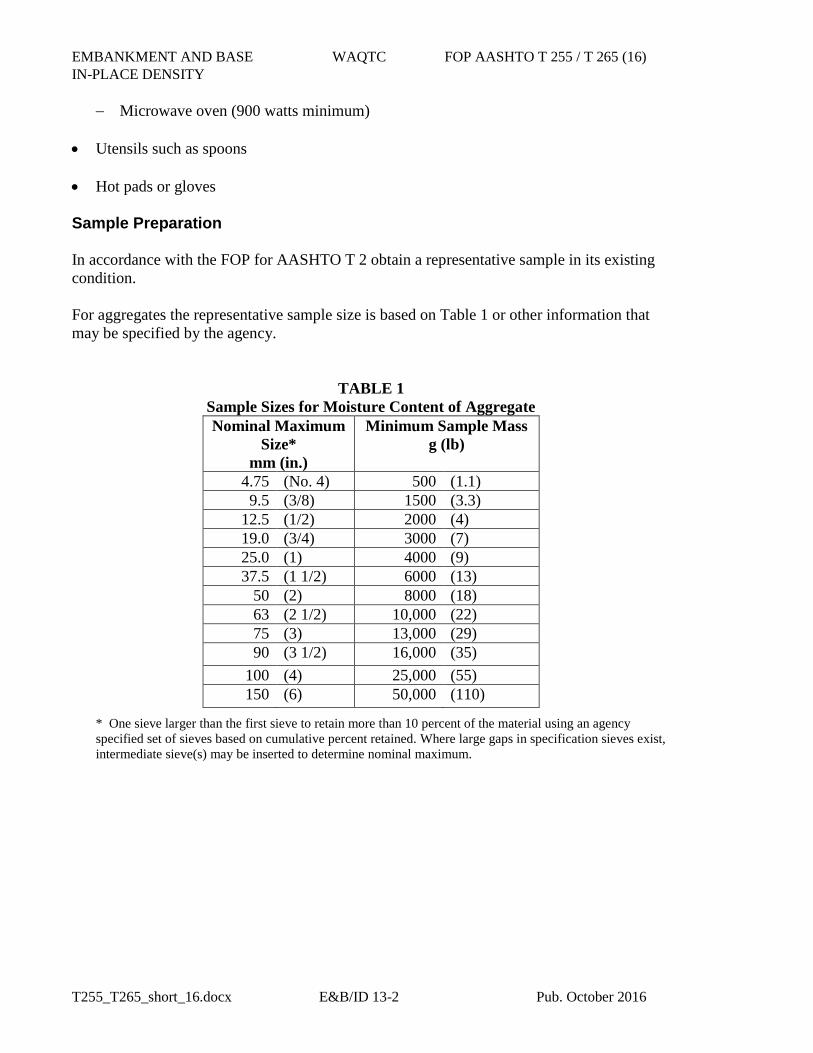
EMBANKMENT AND BASE WAQTC FOP AASHTO T 255 / T 265 (16) IN-PLACE DENSITY
T255_T265_short_16.docx E&B/ID 13-2 Pub. October 2016
− Microwave oven (900 watts minimum) • Utensils such as spoons • Hot pads or gloves Sample Preparation In accordance with the FOP for AASHTO T 2 obtain a representative sample in its existing condition. For aggregates the representative sample size is based on Table 1 or other information that may be specified by the agency.
TABLE 1 Sample Sizes for Moisture Content of Aggregate Nominal Maximum
Size* mm (in.)
Minimum Sample Mass g (lb)
4.75 (No. 4) 500 (1.1) 9.5 (3/8) 1500 (3.3)
12.5 (1/2) 2000 (4) 19.0 (3/4) 3000 (7) 25.0 (1) 4000 (9) 37.5 (1 1/2) 6000 (13)
50 (2) 8000 (18) 63 (2 1/2) 10,000 (22) 75 (3) 13,000 (29) 90 (3 1/2) 16,000 (35)
100 (4) 25,000 (55) 150 (6) 50,000 (110)
* One sieve larger than the first sieve to retain more than 10 percent of the material using an agency specified set of sieves based on cumulative percent retained. Where large gaps in specification sieves exist, intermediate sieve(s) may be inserted to determine nominal maximum.
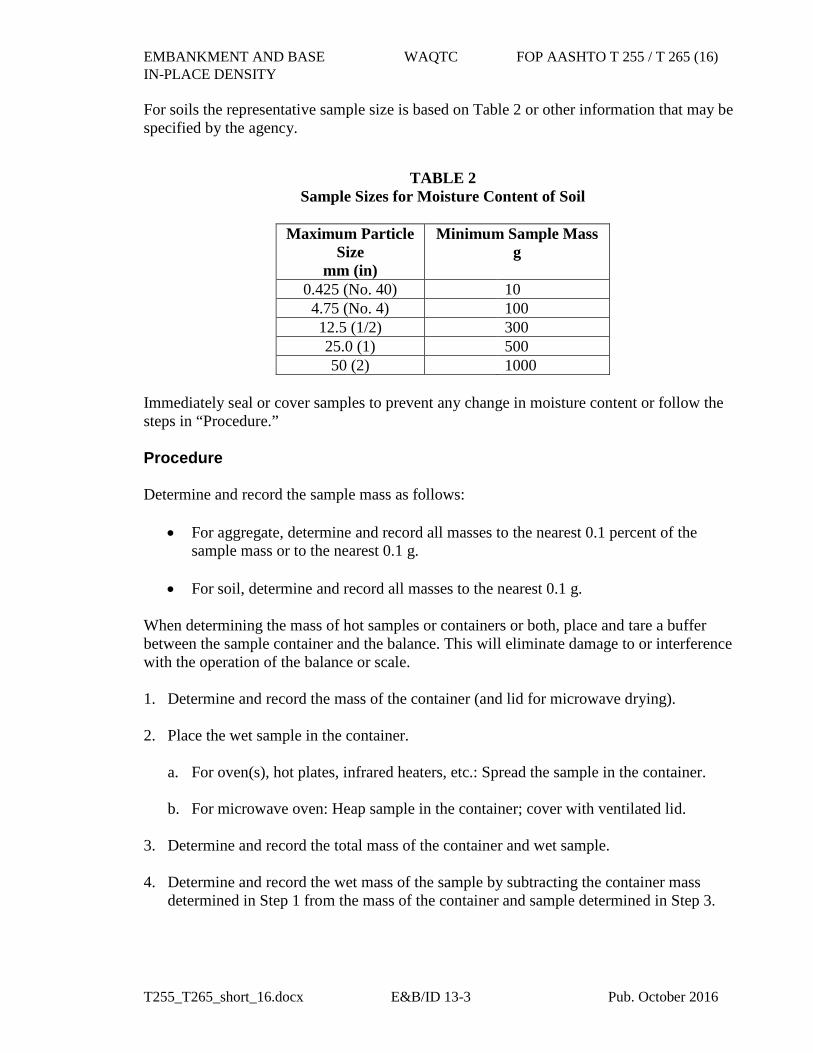
EMBANKMENT AND BASE WAQTC FOP AASHTO T 255 / T 265 (16) IN-PLACE DENSITY
T255_T265_short_16.docx E&B/ID 13-3 Pub. October 2016
For soils the representative sample size is based on Table 2 or other information that may be specified by the agency.
TABLE 2 Sample Sizes for Moisture Content of Soil
Maximum Particle Size
mm (in)
Minimum Sample Mass g
0.425 (No. 40) 10 4.75 (No. 4) 100 12.5 (1/2) 300 25.0 (1) 500 50 (2) 1000
Immediately seal or cover samples to prevent any change in moisture content or follow the steps in “Procedure.”
Procedure
Determine and record the sample mass as follows:
• For aggregate, determine and record all masses to the nearest 0.1 percent of thesample mass or to the nearest 0.1 g.
• For soil, determine and record all masses to the nearest 0.1 g.
When determining the mass of hot samples or containers or both, place and tare a buffer between the sample container and the balance. This will eliminate damage to or interference with the operation of the balance or scale.
1. Determine and record the mass of the container (and lid for microwave drying).
2. Place the wet sample in the container.
a. For oven(s), hot plates, infrared heaters, etc.: Spread the sample in the container.
b. For microwave oven: Heap sample in the container; cover with ventilated lid.
3. Determine and record the total mass of the container and wet sample.
4. Determine and record the wet mass of the sample by subtracting the container massdetermined in Step 1 from the mass of the container and sample determined in Step 3.
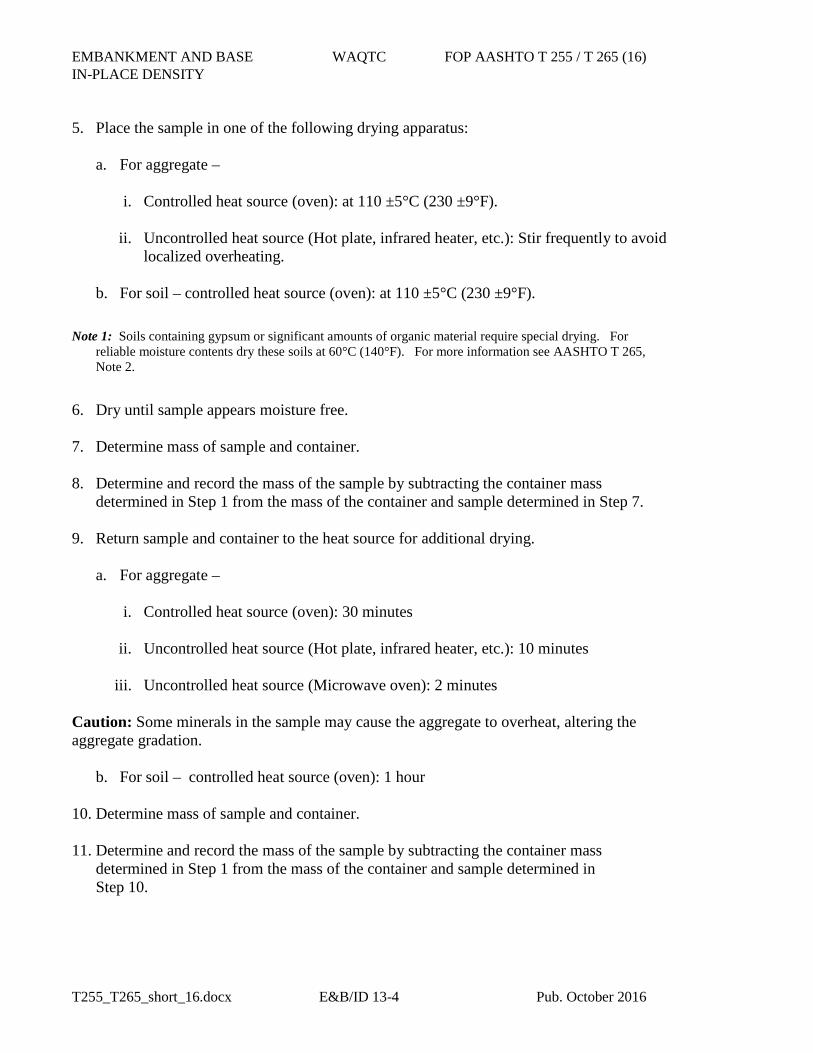
EMBANKMENT AND BASE WAQTC FOP AASHTO T 255 / T 265 (16) IN-PLACE DENSITY
T255_T265_short_16.docx E&B/ID 13-4 Pub. October 2016
5. Place the sample in one of the following drying apparatus:
a. For aggregate –
i. Controlled heat source (oven): at 110 ±5°C (230 ±9°F).
ii. Uncontrolled heat source (Hot plate, infrared heater, etc.): Stir frequently to avoidlocalized overheating.
b. For soil – controlled heat source (oven): at 110 ±5°C (230 ±9°F).
Note 1: Soils containing gypsum or significant amounts of organic material require special drying. For reliable moisture contents dry these soils at 60°C (140°F). For more information see AASHTO T 265, Note 2.
6. Dry until sample appears moisture free.
7. Determine mass of sample and container.
8. Determine and record the mass of the sample by subtracting the container massdetermined in Step 1 from the mass of the container and sample determined in Step 7.
9. Return sample and container to the heat source for additional drying.
a. For aggregate –
i. Controlled heat source (oven): 30 minutes
ii. Uncontrolled heat source (Hot plate, infrared heater, etc.): 10 minutes
iii. Uncontrolled heat source (Microwave oven): 2 minutes
Caution: Some minerals in the sample may cause the aggregate to overheat, altering the aggregate gradation.
b. For soil – controlled heat source (oven): 1 hour
10. Determine mass of sample and container.
11. Determine and record the mass of the sample by subtracting the container massdetermined in Step 1 from the mass of the container and sample determined inStep 10.
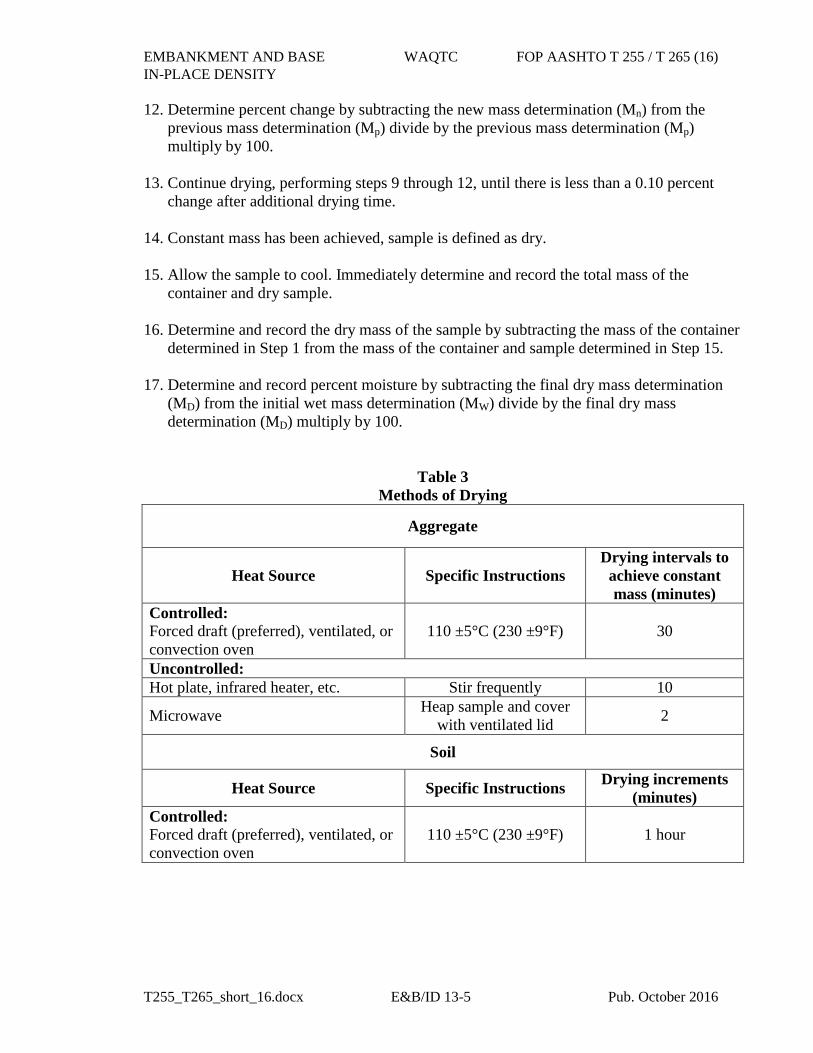
EMBANKMENT AND BASE WAQTC FOP AASHTO T 255 / T 265 (16) IN-PLACE DENSITY
T255_T265_short_16.docx E&B/ID 13-5 Pub. October 2016
12. Determine percent change by subtracting the new mass determination (Mn) from theprevious mass determination (Mp) divide by the previous mass determination (Mp)multiply by 100.
13. Continue drying, performing steps 9 through 12, until there is less than a 0.10 percentchange after additional drying time.
14. Constant mass has been achieved, sample is defined as dry.
15. Allow the sample to cool. Immediately determine and record the total mass of thecontainer and dry sample.
16. Determine and record the dry mass of the sample by subtracting the mass of the containerdetermined in Step 1 from the mass of the container and sample determined in Step 15.
17. Determine and record percent moisture by subtracting the final dry mass determination(MD) from the initial wet mass determination (MW) divide by the final dry massdetermination (MD) multiply by 100.
Table 3 Methods of Drying
Aggregate
Heat Source Specific Instructions Drying intervals to
achieve constant mass (minutes)
Controlled: Forced draft (preferred), ventilated, or convection oven
110 ±5°C (230 ±9°F) 30
Uncontrolled: Hot plate, infrared heater, etc. Stir frequently 10
Microwave Heap sample and cover with ventilated lid 2
Soil
Heat Source Specific Instructions Drying increments (minutes)
Controlled: Forced draft (preferred), ventilated, or convection oven
110 ±5°C (230 ±9°F) 1 hour
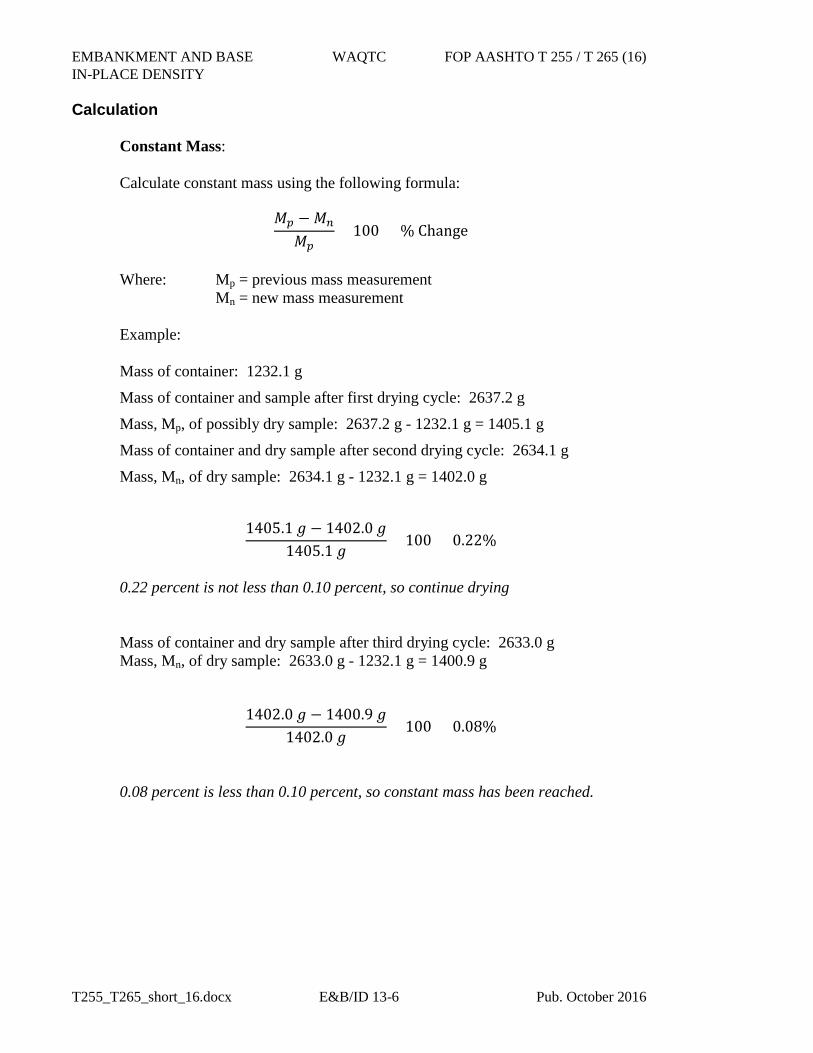
EMBANKMENT AND BASE WAQTC FOP AASHTO T 255 / T 265 (16) IN-PLACE DENSITY
T255_T265_short_16.docx E&B/ID 13-6 Pub. October 2016
Calculation
Constant Mass:
Calculate constant mass using the following formula:
𝑀𝑀𝑝𝑝 −𝑀𝑀𝑛𝑛
𝑀𝑀𝑝𝑝× 100 = % Change
Where: Mp = previous mass measurement Mn = new mass measurement
Example:
Mass of container: 1232.1 g
Mass of container and sample after first drying cycle: 2637.2 g
Mass, Mp, of possibly dry sample: 2637.2 g - 1232.1 g = 1405.1 g
Mass of container and dry sample after second drying cycle: 2634.1 g
Mass, Mn, of dry sample: 2634.1 g - 1232.1 g = 1402.0 g
1405.1 𝑔𝑔 − 1402.0 𝑔𝑔1405.1 𝑔𝑔
× 100 = 0.22%
0.22 percent is not less than 0.10 percent, so continue drying
Mass of container and dry sample after third drying cycle: 2633.0 g Mass, Mn, of dry sample: 2633.0 g - 1232.1 g = 1400.9 g
1402.0 𝑔𝑔 − 1400.9 𝑔𝑔1402.0 𝑔𝑔
× 100 = 0.08%
0.08 percent is less than 0.10 percent, so constant mass has been reached.
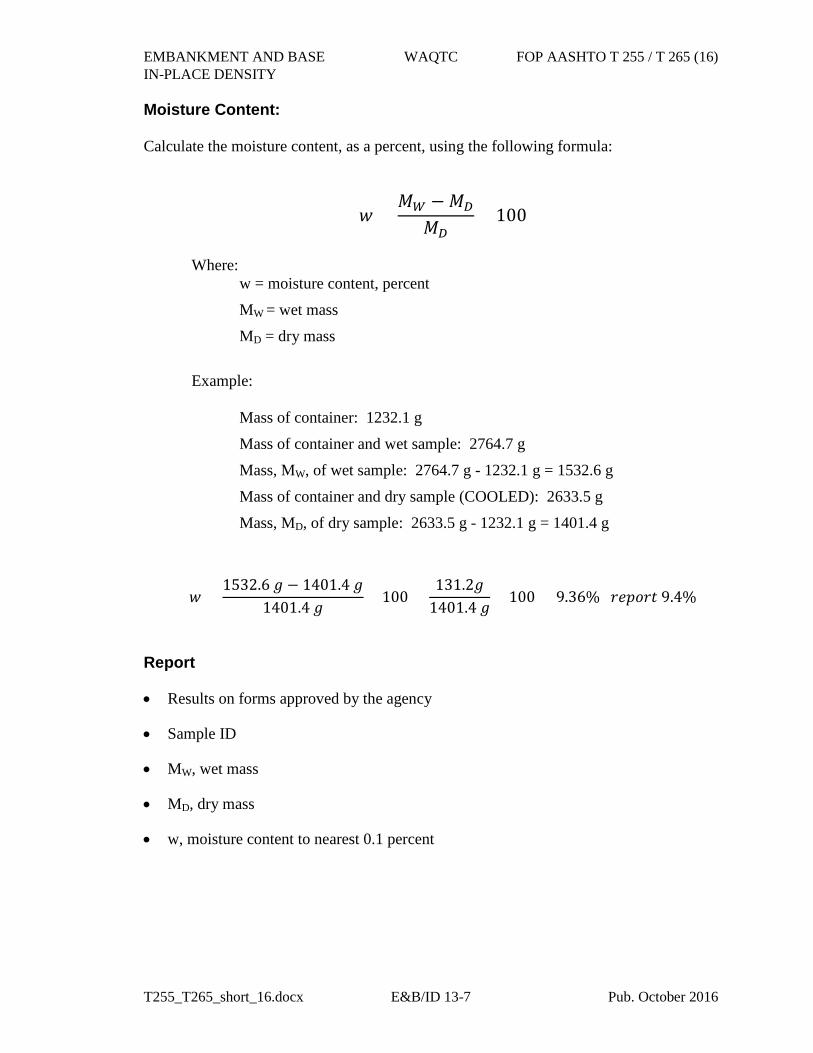
EMBANKMENT AND BASE WAQTC FOP AASHTO T 255 / T 265 (16) IN-PLACE DENSITY
T255_T265_short_16.docx E&B/ID 13-7 Pub. October 2016
Moisture Content: Calculate the moisture content, as a percent, using the following formula:
𝑤𝑤 =𝑀𝑀𝑊𝑊 −𝑀𝑀𝐷𝐷
𝑀𝑀𝐷𝐷× 100
Where:
w = moisture content, percent
MW = wet mass
MD = dry mass
Example:
Mass of container: 1232.1 g
Mass of container and wet sample: 2764.7 g
Mass, MW, of wet sample: 2764.7 g - 1232.1 g = 1532.6 g
Mass of container and dry sample (COOLED): 2633.5 g
Mass, MD, of dry sample: 2633.5 g - 1232.1 g = 1401.4 g
𝑤𝑤 =1532.6 𝑔𝑔 − 1401.4 𝑔𝑔
1401.4 𝑔𝑔× 100 =
131.2𝑔𝑔1401.4 𝑔𝑔
× 100 = 9.36% 𝑟𝑟𝑟𝑟𝑟𝑟𝑟𝑟𝑟𝑟𝑟𝑟 9.4%
Report • Results on forms approved by the agency • Sample ID
• MW, wet mass • MD, dry mass • w, moisture content to nearest 0.1 percent


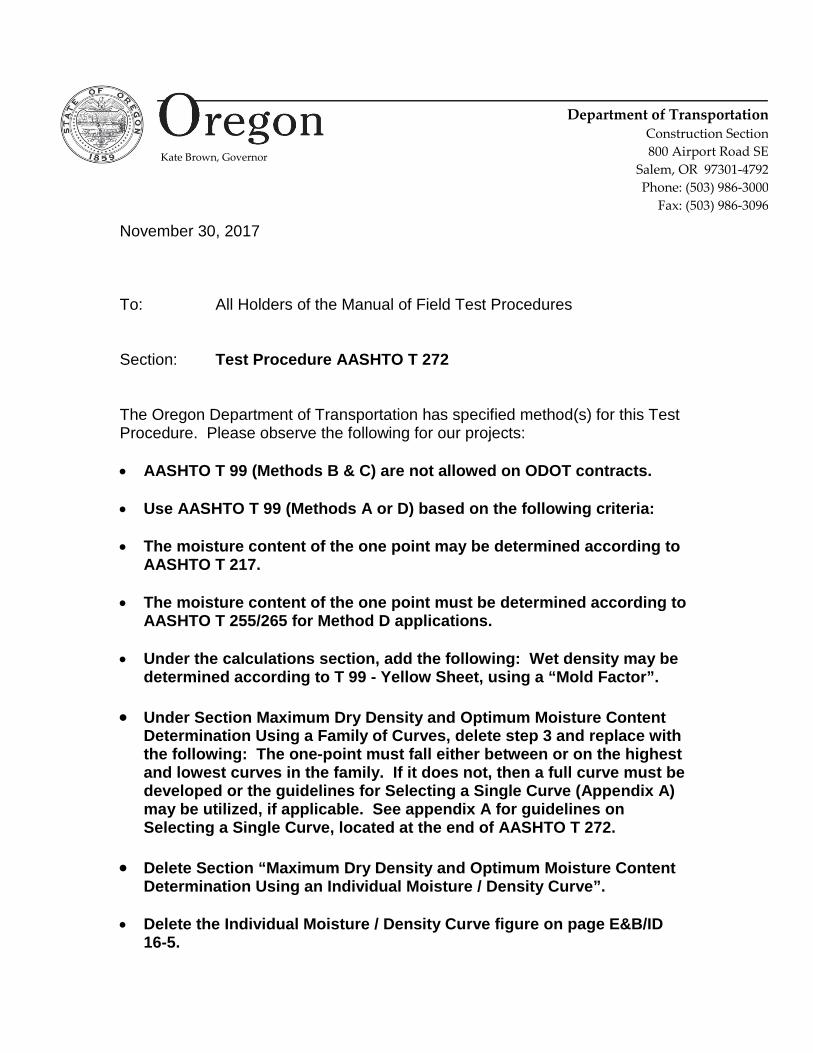
November 30, 2017
To: All Holders of the Manual of Field Test Procedures
Section: Test Procedure AASHTO T 272
The Oregon Department of Transportation has specified method(s) for this Test Procedure. Please observe the following for our projects:
• AASHTO T 99 (Methods B & C) are not allowed on ODOT contracts.
• Use AASHTO T 99 (Methods A or D) based on the following criteria:
• The moisture content of the one point may be determined according toAASHTO T 217.
• The moisture content of the one point must be determined according toAASHTO T 255/265 for Method D applications.
• Under the calculations section, add the following: Wet density may bedetermined according to T 99 - Yellow Sheet, using a “Mold Factor”.
• Under Section Maximum Dry Density and Optimum Moisture ContentDetermination Using a Family of Curves, delete step 3 and replace withthe following: The one-point must fall either between or on the highestand lowest curves in the family. If it does not, then a full curve must bedeveloped or the guidelines for Selecting a Single Curve (Appendix A)may be utilized, if applicable. See appendix A for guidelines onSelecting a Single Curve, located at the end of AASHTO T 272.
• Delete Section “Maximum Dry Density and Optimum Moisture ContentDetermination Using an Individual Moisture / Density Curve”.
• Delete the Individual Moisture / Density Curve figure on page E&B/ID16-5.
Kate Brown, Governor
Department of Transportation Construction Section 800 Airport Road SE
Salem, OR 97301-4792 Phone: (503) 986-3000
Fax: (503) 986-3096
EMBANKMENT AND BASE WAQTC FOP AASHTO T 272 (16) IN-PLACE DENSITY
T272_short_16.docx E&B/ID 16-1 Pub. October 2016
ONE-POINT METHOD FOR DETERMINING MAXIMUM DRY DENSITY AND OPTIMUM MOISTURE FOP FOR AASHTO T 272
Scope
This procedure provides for a rapid determination of the maximum dry density and optimum moisture content of a soil sample, using a one-point determination in accordance with AASHTO T 272-16. This procedure is related to the FOPs for AASHTO T 99/T 180 and R 75.
One-point determinations are made by compacting the soil in a mold of a given size with a specified rammer dropped from a specified height and then compared to an individual moisture/density curve (FOP for AASHTO T 99 or T 180) or a family of curves (FOP for AASHTO R 75). Four alternate methods – A, B, C, and D – are used and correspond to the methods described in the FOP for AASHTO T 99/T 180. The method used in AASHTO T 272 must match the method used for the reference curve or to establish the family of curves. For example, when moisture-density relationships as determined by T 99 - Method C are used to form the family of curves or an individual moisture density curve, then T 99 - Method C must be used to for the one-point determination.
Apparatus
See the FOP for AASHTO T 99/T 180. Use the method matching the individual curve or Family of Curves. Refer to Table 1 of the FOP for AASHTO T 99 / T 180 for corresponding mold size, number of layers, number of blows, and rammer specification for the various test methods.
Sample
Sample size determined according to the FOP for AASHTO T 310. In cases where the existing individual curve or family cannot be used a completely new curve will need to be developed and the sample size will be determined by the FOP for AASHTO T 99/T 180.
If the sample is damp, dry it until it becomes friable under a trowel. Drying may be in air or by use of a drying apparatus maintained at a temperature not exceeding 60°C (140°F). Thoroughly break up aggregations in a manner that avoids reducing the natural size of individual particles.
Procedure 1. Determine the mass of the clean, dry mold. Include the base plate, but exclude the
extension collar. Record the mass to the nearest 1 g (0.005 lb).
2. Thoroughly mix the sample with sufficient water to adjust moisture content to 80 to 100percent of the anticipated optimum moisture.
EMBANKMENT AND BASE WAQTC FOP AASHTO T 272 (16) IN-PLACE DENSITY
T272_short_16.docx E&B/ID 16-2 Pub. October 2016
3. Form a specimen by compacting the prepared soil in the mold (with collar attached) in approximately equal layers. For each layer:
a. Spread the loose material uniformly in the mold.
Note 1: It is recommended to cover the remaining material with a non-absorbent sheet or damp cloth to minimize loss of moisture.
b. Lightly tamp the loose material with the manual rammer or other similar device, this establishes a firm surface.
c. Compact each layer with uniformly distributed blows from the rammer. d. Trim down material that has not been compacted and remains adjacent to the walls of
the mold and extends above the compacted surface.
4. Remove the extension collar. Avoid shearing off the sample below the top of the mold. The material compacted in the mold should not be over 6 mm (¼ in.) above the top of the mold once the collar has been removed.
5. Trim the compacted soil even with the top of the mold with the beveled side of the
straightedge. 6. Determine the mass of the mold and wet soil to the nearest 1 g (0.005 lb) or better. 7. Determine the wet mass of the sample by subtracting the mass in Step 1 from the mass in
Step 6. 8. Calculate the wet density as indicated below under “Calculations.” 9. Extrude the material from the mold. For soils and soil-aggregate mixtures, slice vertically
through the center and take a representative moisture content sample from one of the cut faces, ensuring that all layers are represented. For granular materials, a vertical face will not exist. Take a representative sample. This sample must meet the sample size requirements of the test method used to determine moisture content.
10. Determine the moisture content of the sample in accordance with the FOP for AASHTO
T 255 / T 265.
EMBANKMENT AND BASE WAQTC FOP AASHTO T 272 (16) IN-PLACE DENSITY
T272_short_16.docx E&B/ID 16-3 Pub. October 2016
Calculations
1. Calculate the wet density, in kg/m3 (lb/ft3), by dividing the wet mass by the measuredvolume of the mold (T 19).
Example – Methods A or C mold:
Wet mass = 2.0055 kg (4.42 lb)
Measured volume of the mold = 0.0009469 m3 (0.03344 ft3)
𝑊𝑊𝑊𝑊𝑊𝑊 𝐷𝐷𝑊𝑊𝐷𝐷𝐷𝐷𝐷𝐷𝑊𝑊𝐷𝐷 =2.0055 𝑘𝑘𝑘𝑘
0.0009469 𝑚𝑚3 = 2118 𝑘𝑘𝑘𝑘 𝑚𝑚3⁄
𝑊𝑊𝑊𝑊𝑊𝑊 𝐷𝐷𝑊𝑊𝐷𝐷𝐷𝐷𝐷𝐷𝑊𝑊𝐷𝐷 =4.42 𝑙𝑙𝑙𝑙
0.03344 𝑓𝑓𝑊𝑊3= 132.2 𝑙𝑙𝑙𝑙 𝑓𝑓𝑊𝑊3⁄
2. Calculate the dry density as follows.
𝜌𝜌𝑑𝑑 = �𝜌𝜌𝑤𝑤
𝑤𝑤 + 100� × 100 𝑜𝑜𝑜𝑜 𝜌𝜌𝑑𝑑 =
𝜌𝜌𝑤𝑤� 𝑤𝑤
100� + 1
Where:
ρd = Dry density, kg/m3 (lb/ft3) ρw = Wet density, kg/m3 (lb/ft3) w = Moisture content, as a percentage
Example:
ρw = 2118 kg/m3 (132.2 lb/ft3) w = 13.5%
𝜌𝜌𝑑𝑑 = �2118 𝑘𝑘𝑘𝑘 𝑚𝑚3⁄13.5 + 100
� × 100 = 1866 𝑘𝑘𝑘𝑘 𝑚𝑚3⁄ 𝜌𝜌𝑑𝑑 = �132.2 𝑙𝑙𝑙𝑙 𝑓𝑓𝑊𝑊3⁄13.5 + 100
� × 100 = 116.5 𝑙𝑙𝑙𝑙 𝑓𝑓𝑊𝑊3⁄
or
𝜌𝜌𝑑𝑑 = �2118 𝑘𝑘𝑘𝑘 𝑚𝑚3⁄
13.5100 + 1
� = 1866 𝑘𝑘𝑘𝑘 𝑚𝑚3⁄ 𝜌𝜌𝑑𝑑 = �132.2 𝑙𝑙𝑙𝑙 𝑓𝑓𝑊𝑊3⁄
13.5100 + 1
� = 116.5 𝑙𝑙𝑙𝑙 𝑓𝑓𝑊𝑊3⁄
EMBANKMENT AND BASE WAQTC FOP AASHTO T 272 (16) IN-PLACE DENSITY
T272_short_16.docx E&B/ID 16-4 Pub. October 2016
Maximum Dry Density and Optimum Moisture Content Determination Using an Individual Moisture / Density Curve
1. The moisture content must be within 80 to 100 percent of optimum moisture of thereference curve. Compact another specimen, using the same material, at an adjustedmoisture content if the one-point does not fall in the 80 to 100 percent of optimummoisture range.
2. If the moisture content of the one-point determination is not within 80 to 100 percent ofthe optimum moisture content, compact another specimen, using the same material, atadjusted moisture content.
3. Plot the one-point, dry density on the vertical axis and moisture content on the horizontalaxis, on the reference curve graph.
4. If the one-point falls on the reference curve or within ±2.0 lbs/ft3, then the maximum drydensity and optimum moisture content determined by the curve can be used.
5. Perform a full moisture-density relationship if the one-point does not fall on or within±2.0 lbs/ft3 of the reference curve at 80 to 100 percent optimum moisture.
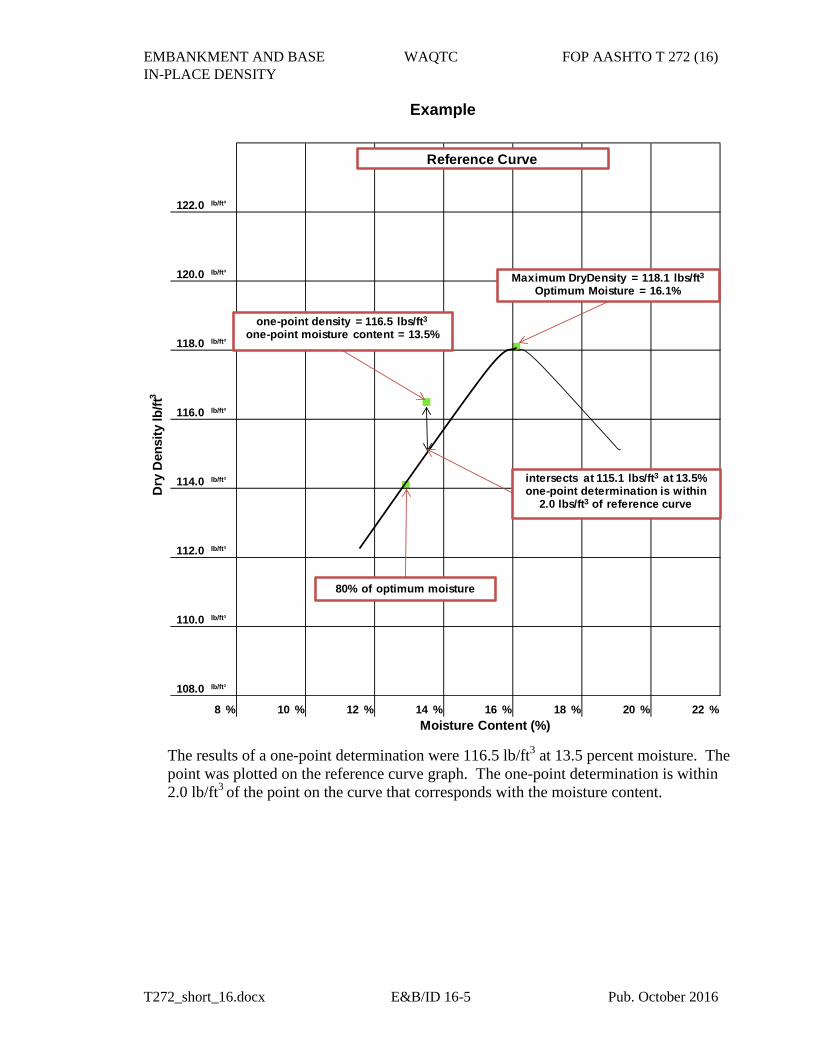
EMBANKMENT AND BASE WAQTC FOP AASHTO T 272 (16) IN-PLACE DENSITY
T272_short_16.docx E&B/ID 16-5 Pub. October 2016
Example
The results of a one-point determination were 116.5 lb/ft3 at 13.5 percent moisture. The point was plotted on the reference curve graph. The one-point determination is within 2.0 lb/ft3 of the point on the curve that corresponds with the moisture content.
x
x
x
x
x
x
122.0
116.0
118.0
120.0
lb/ft³
lb/ft³
lb/ft³
%
lb/ft³
lb/ft³
108
108.0
110.0
16 22%20
Dry
Den
sity
lb/ft
3
Moisture Content (%)% %%% 18
lb/ft³
lb/ft³
lb/ft³
112.0
114.0
1412% %
Reference Curve
Maximum DryDensity = 118.1 lbs/ft3Optimum Moisture = 16.1%
intersects at 115.1 lbs/ft3 at 13.5%one-point determination is within
2.0 lbs/ft3 of reference curve
one-point density = 116.5 lbs/ft3one-point moisture content = 13.5%
80% of optimum moisture

EMBANKMENT AND BASE WAQTC FOP AASHTO T 272 (16) IN-PLACE DENSITY
T272_short_16.docx E&B/ID 16-6 Pub. October 2016
Maximum Dry Density and Optimum Moisture Content Determination Using a Family of Curves
1. If the moisture-density one-point falls on one of the curves in the family of curves, themaximum dry density and optimum moisture content defined by that curve is used.
2. If the moisture-density one-point falls within the family of curves but not on an existingcurve, draw a new curve through the plotted single point, parallel and in character withthe nearest existing curve in the family of curves. Use the maximum dry density andoptimum moisture content as defined by the new curve.
3. The one-point must fall either between or on the highest or lowest curves in the family. Ifit does not, then a full curve must be developed.
4. If the one-point plotted within or on the family of curves does not fall in the 80 to 100percent of optimum moisture content, compact another specimen, using the samematerial, at an adjusted moisture content that will place the one point within this range.
5. If the new curve through a one-point is not well defined or is in any way questionable,perform a full moisture-density relationship to correctly define the new curve and verifythe applicability of the family of curves.Note 2: New curves drawn through plotted single point determinations shall not become a permanent part
of the family of curves until verified by a full moisture-density procedure following the FOP for AASHTO T 99/T 180.
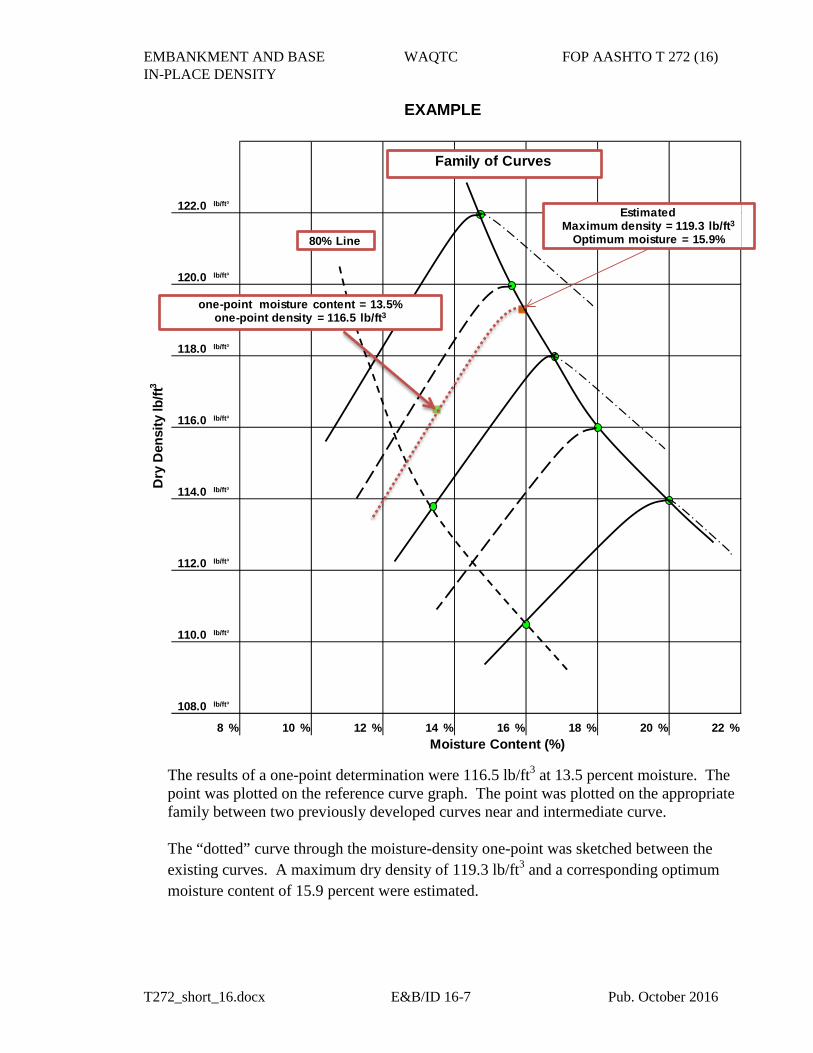
EMBANKMENT AND BASE WAQTC FOP AASHTO T 272 (16) IN-PLACE DENSITY
T272_short_16.docx E&B/ID 16-7 Pub. October 2016
EXAMPLE
The results of a one-point determination were 116.5 lb/ft3 at 13.5 percent moisture. The point was plotted on the reference curve graph. The point was plotted on the appropriate family between two previously developed curves near and intermediate curve.
The “dotted” curve through the moisture-density one-point was sketched between the existing curves. A maximum dry density of 119.3 lb/ft3 and a corresponding optimum moisture content of 15.9 percent were estimated.
x
x
x
x
x
x
Dry
Den
sity
lb/ft
3
Moisture Content (%)% %%% 18
lb/ft³
lb/ft³
lb/ft³
112.0
114.0
1412% % %
lb/ft³
lb/ft³
108
108.0
110.0
16 22%20
122.0
116.0
118.0
120.0
lb/ft³
lb/ft³
lb/ft³
Family of Curves
80% Line
EstimatedMaximum density = 119.3 lb/ft3
Optimum moisture = 15.9%
one-point moisture content = 13.5%one-point density = 116.5 lb/ft3

EMBANKMENT AND BASE WAQTC FOP AASHTO T 272 (16) IN-PLACE DENSITY
T272_short_16.docx E&B/ID 16-8 Pub. October 2016
Report
• Results on forms approved by the agency
• Sample ID
• Maximum dry density to the closest 1 kg/m3 (0.1 lb/ft3)
• Optimum moisture content to the closest 0.1 percent
• Reference curve or Family of Curves used
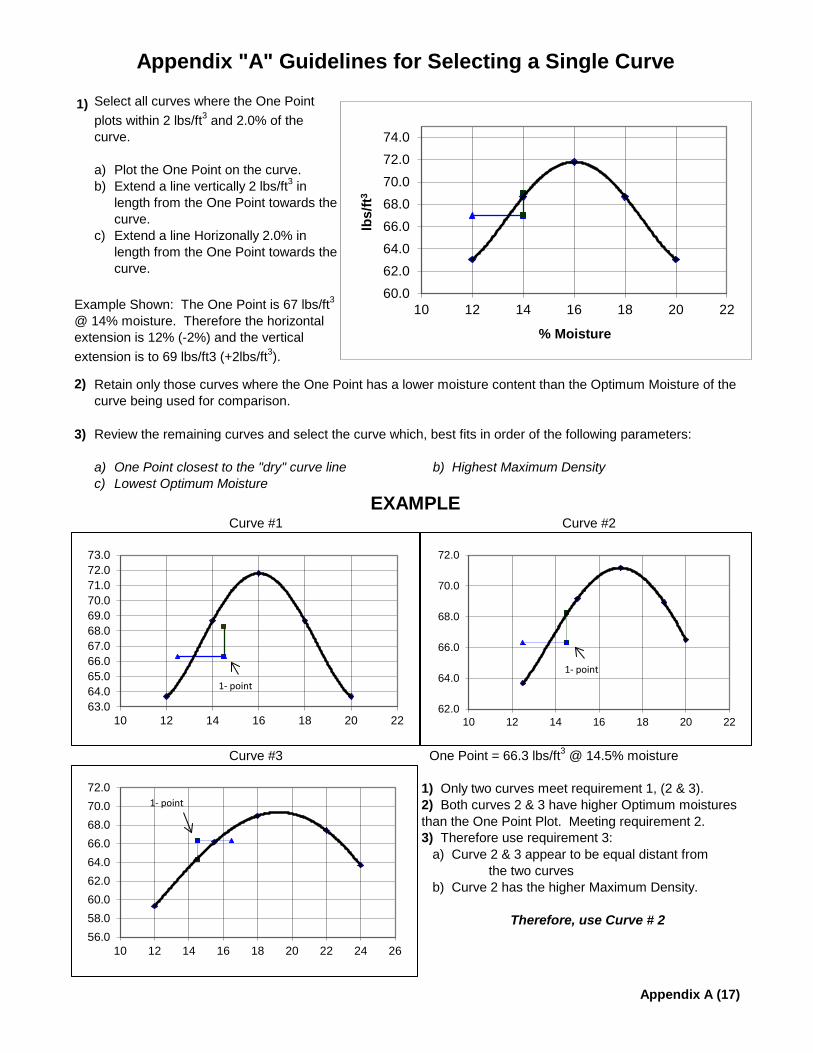
Appendix "A" Guidelines for Selecting a Single Curve
Appendix A (17)
1)
a)b)
c)
2)
3)
a) One Point closest to the "dry" curve linec)
1) Only two curves meet requirement 1, (2 & 3).
3) Therefore use requirement 3:a) Curve 2 & 3 appear to be equal distant from
the two curvesb) Curve 2 has the higher Maximum Density.
Therefore, use Curve # 2
Select all curves where the One Point plots within 2 lbs/ft3 and 2.0% of the curve.
Plot the One Point on the curve.
2) Both curves 2 & 3 have higher Optimum moisturesthan the One Point Plot. Meeting requirement 2.
Extend a line vertically 2 lbs/ft3 in length from the One Point towards the curve.Extend a line Horizonally 2.0% in length from the One Point towards the curve.
Example Shown: The One Point is 67 lbs/ft3
@ 14% moisture. Therefore the horizontal extension is 12% (-2%) and the vertical extension is to 69 lbs/ft3 (+2lbs/ft3).
One Point = 66.3 lbs/ft3 @ 14.5% moisture
Curve #1 Curve #2
Curve #3
Lowest Optimum MoistureEXAMPLE
Retain only those curves where the One Point has a lower moisture content than the Optimum Moisture of the curve being used for comparison.
b) Highest Maximum Density
Review the remaining curves and select the curve which, best fits in order of the following parameters:
60.062.064.066.068.070.072.074.0
10 12 14 16 18 20 22
lbs/
ft3
% Moisture
63.064.065.066.067.068.069.070.071.072.073.0
10 12 14 16 18 20 2262.0
64.0
66.0
68.0
70.0
72.0
10 12 14 16 18 20 22
56.058.060.062.064.066.068.070.072.0
10 12 14 16 18 20 22 24 26
1- point 1- point
1- point


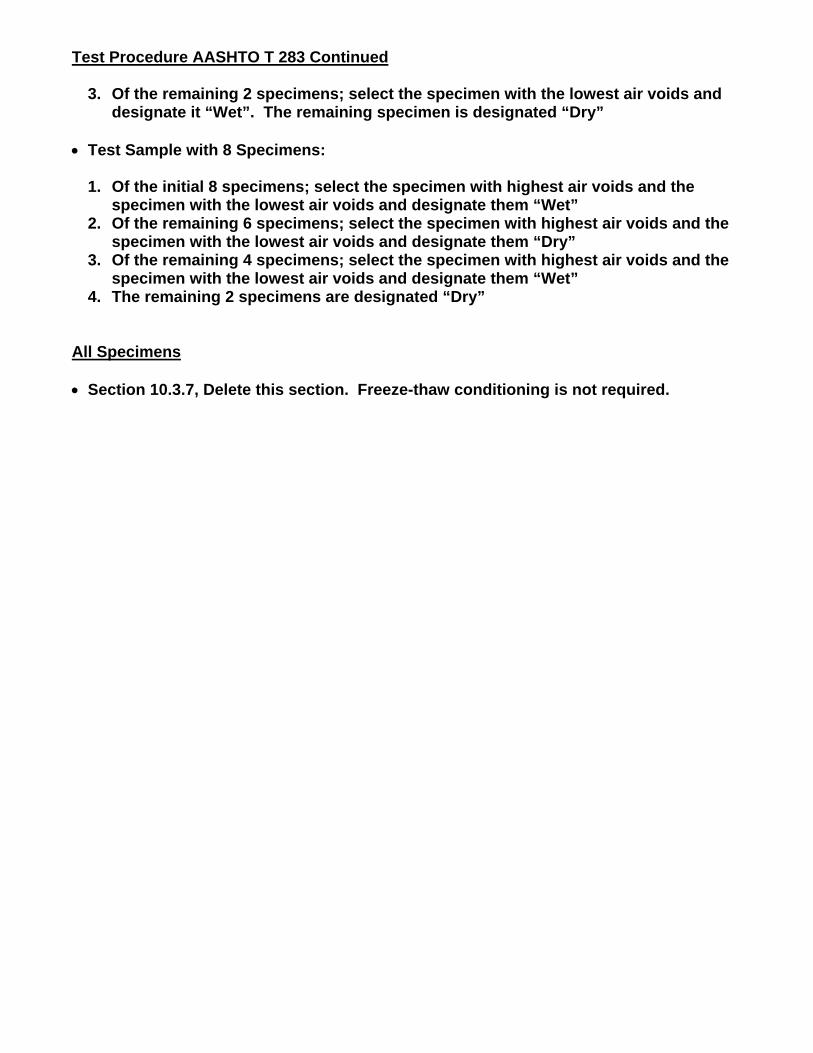
Test Procedure AASHTO T 283 Continued
3. Of the remaining 2 specimens; select the specimen with the lowest air voids anddesignate it “Wet”. The remaining specimen is designated “Dry”
Test Sample with 8 Specimens:
1. Of the initial 8 specimens; select the specimen with highest air voids and thespecimen with the lowest air voids and designate them “Wet”
2. Of the remaining 6 specimens; select the specimen with highest air voids and thespecimen with the lowest air voids and designate them “Dry”
3. Of the remaining 4 specimens; select the specimen with highest air voids and thespecimen with the lowest air voids and designate them “Wet”
4. The remaining 2 specimens are designated “Dry”
All Specimens
Section 10.3.7, Delete this section. Freeze-thaw conditioning is not required.

October 31, 2013
To: All Holders of the Manual of Field Test Procedures
Section: Test Procedure AASHTO T 283
The Oregon Department of Transportation has specified method(s) for this Test Procedure. Please observe the following for our projects:
Preparation of Lab-Mixed, Lab Compacted Specimens
Section 6.2, only 6” specimens are allowed for this step.
Section 6.4, Do not perform the 2-hr cooling and 16-hr loose mix curing required by thissection. After mixing place mixture in the specified pans and follow the steps in Section6.5.
Section 6.5, Compact each specimen to the required air void range.
Section 6.6, Delete requirement for storage of 24 +/- 3 hours at room temperature.Instead, allow the compacted specimens to completely cool to room temperature (nolonger than 24 hours). Then proceed to Section 9.
Preparation of Field-Mixed, Lab compacted Specimens
Section 7.2, only 6” specimens are allowed for this step.
Section 7.5, Delete requirement for storing specimens at 24 +/- 3 hours at roomtemperature. Instead allow compacted specimens too completely cool to roomtemperature (no longer than 24 hours). Then proceed to Section 9.
Grouping of test Specimens for Conditioning
Test Sample with 6 Specimens:
1. Of the initial 6 specimens; select the specimen with highest air voids and thespecimen with the lowest air voids and designate them “Wet”
2. Of the remaining 4 specimens; select the specimen with highest air voids and thespecimen with the lowest air voids and designate them “Dry”
(See Next Page)
Department of TransportationConstruction Section
800 Airport Road SE
Salem, OR 97301‐4792
Phone: (503) 986‐3000
Fax: (503) 986‐3096
Resistance of Compacted Asphalt Mixtures to Moisture-Induced Damage
AASHTO Designation: T 283-07
AASHTO TEST METHODS CANNOT BE INCLUDED ON ODOT’S WEBSITE DUE TO COPYRIGHT INFRINGEMENT.
TO GET COPIES OF THE TEST METHODS, YOU CAN ORDER A HARD COPY OF ODOT’S MANUAL OF FIELD TEST PROCEDURES OR YOU CAN ORDER THE LATEST STANDARD SPECIFICATIONS FOR TRANSPORTATION MATERIALS AND METHODS OF SAMPLING AND TESTING FROM AASHTO. ORDERING INSTRUCTIONS ARE GIVEN BELOW:
To order ODOT’s Manual of Field Test Procedures, use the following web address: http://www.oregon.gov/ODOT/Construction/Pages/Manual-of-Field-Test-Procedures.aspx
To order AASHTO’s Standard Specifications for Transportation Materials and Methods of Sampling and Testing, use the following web address: https://bookstore.transportation.org/


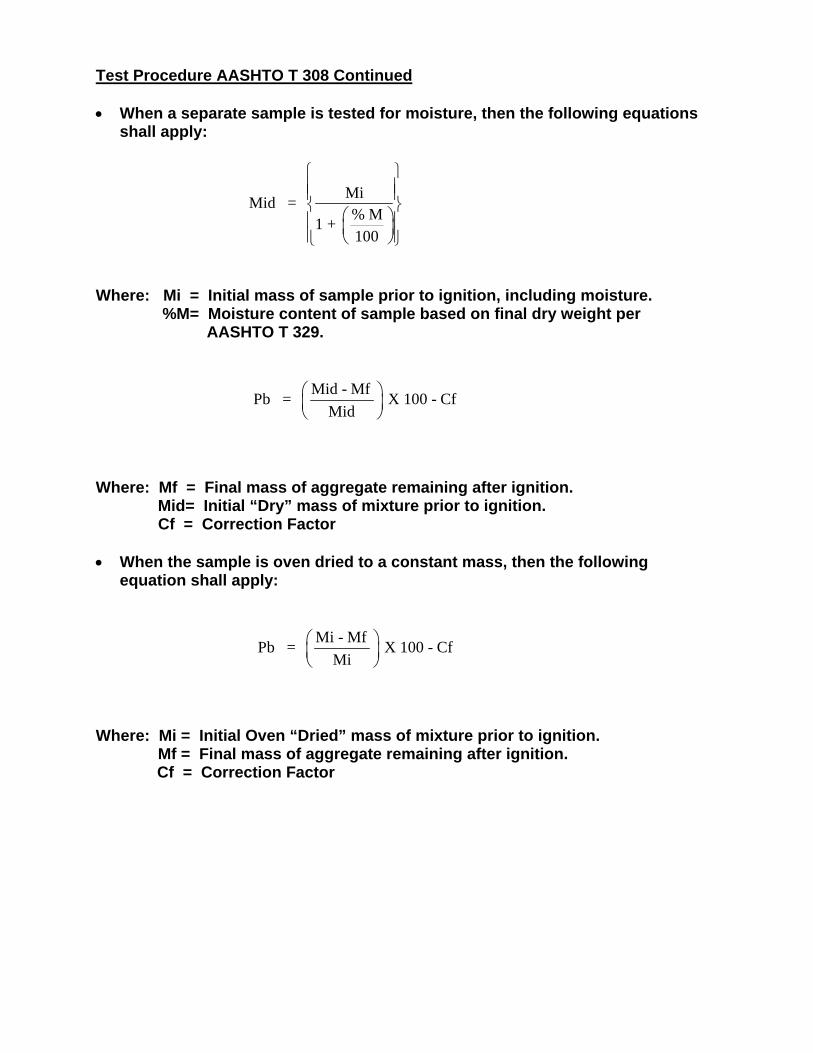
Test Procedure AASHTO T 308 Continued
When a separate sample is tested for moisture, then the following equationsshall apply:
MiMid = % M1 + 100
Where: Mi = Initial mass of sample prior to ignition, including moisture. %M= Moisture content of sample based on final dry weight per AASHTO T 329.
Mid - MfPb = X 100 - CfMid
Where: Mf = Final mass of aggregate remaining after ignition. Mid= Initial “Dry” mass of mixture prior to ignition. Cf = Correction Factor
When the sample is oven dried to a constant mass, then the followingequation shall apply:
Mi - MfPb = X 100 - CfMi
Where: Mi = Initial Oven “Dried” mass of mixture prior to ignition. Mf = Final mass of aggregate remaining after ignition.
Cf = Correction Factor

October 31, 2008
To: All Holders of the Manual of Field Test Procedures
Section: Test Procedure AASHTO T 308
The Oregon Department of Transportation has specified method(s) for this Test Procedure. Please observe the following for our projects:
Under Apparatus, Method A and Method B – An ignition furnace using Infra-Red elements is allowed. An Infra-Red furnace is not required to maintain a578°C temperature.
When using the Infra-Red furnace, for Methods A and B for step 1 the 538°Cdoes not apply.
Under Test Procedures, Method A and Method B steps 1, when a furnaceusing Infra-Red elements is used, turn on and warm up the furnace for aminimum of 30 minutes before performing a test.
All other requirements of the test procedure apply to the Infra-Red furnace. For Test Procedure Method A and Method B, external scale measurements
taken at approximately the same temperature (+- 10C (25F)) are required forthe initial and final mass determinations. Loss from the printed tickets shallnot be used.
Delete Correction Factors Section. Perform calibration of Ignition Furnaceaccording to ODOT TM 323.
For Test Procedure Method B, replace step 7, 45 min burn time with 60 minuteburn time. Delete steps 10 thru 14.
Compute the percent binder based on the following calculations andconditions: (See Next Page)
ASPHALT I WAQTC FOP AASHTO T 308 (17)
T308_short_17.docx Asphalt 14-1 Pub. October 2017
DETERMINING THE ASPHALT BINDER CONTENT OF HOT MIX ASPHALT (HMA) BY THE IGNITION METHOD FOP FOR AASHTO T 308
Scope
This procedure covers the determination of asphalt binder content of hot mix asphalt (HMA) by ignition of the binder in accordance with AASHTO T 308-16.
Overview
The sample is heated in a furnace at 538°C (1000°F) or less; samples may be heated by convection or direct infrared irradiation (IR). The aggregate remaining after burning can be used for sieve analysis using the FOP for AASHTO T 30.
Some agencies allow the use of recycled HMA. When using recycled HMA, check with the agency for specific correction procedures.
Asphalt binder in the HMA is ignited in a furnace. Asphalt binder content is calculated as the percentage difference between the initial mass of the HMA and the mass of the residual aggregate, with the asphalt binder correction factor, and moisture content subtracted. The asphalt binder content is expressed as percent of moisture-free mix mass.
Two methods, A and B, are presented.
Apparatus Note 1: The apparatus must be calibrated for the specific mix design. See “Correction Factors” at the end of
this FOP.
There are two methods – A and B. The apparatus for the two methods are the same except that the furnace for Method A has an internal balance.
• Ignition Furnace: A forced-air ignition furnace that heats the specimens by either theconvection or direct IR irradiation method. The convection-type furnace must be capableof maintaining the temperature at 538 ± 5°C (1000 ± 9°F).
For Method A, the furnace will be equipped with an internal scale thermally isolatedfrom the furnace chamber and accurate to 0.1 g. The scale shall be capable ofdetermining the mass of a 3500 g sample in addition to the sample baskets. A datacollection system will be included so that mass can be automatically determined anddisplayed during the test. The furnace shall have a built-in computer program tocalculate the change in mass of the sample baskets and provide for the input of acorrection factor for aggregate loss. The furnace shall provide a printed ticket with theinitial specimen mass, specimen mass loss, temperature compensation, correction factor,corrected asphalt binder content, test time, and test temperature. The furnace shallprovide an audible alarm and indicator light when the sample mass loss does not exceed
ASPHALT I WAQTC FOP AASHTO T 308 (17)
T308_short_17.docx Asphalt 14-2 Pub. October 2017
0.01 percent of the total sample mass for three consecutive minutes. Perform lift test according to manufacturer’s instructions weekly during use. Note 2: The furnace shall be designed to permit the operator to change the ending mass loss percentage
from 0.01 percent to 0.02 percent.
For both Method A and Method B, the furnace chamber dimensions shall be adequate to accommodate a 3500 g sample. The furnace door shall be equipped so that it cannot be opened during the ignition test. A method for reducing furnace emissions shall be provided and the furnace shall be vented so that no emissions escape into the laboratory. The furnace shall have a fan to pull air through the furnace to expedite the test and to eliminate the escape of smoke into the laboratory.
• Sample Basket Assembly: consisting of sample basket(s), catch pan, and basket guards.
Sample basket(s) will be of appropriate size allowing samples to be thinly spread and allowing air to flow through and around the sample particles. Sets of two or more baskets shall be nested. A catch pan: of sufficient size to hold the sample basket(s) so that aggregate particles and melting asphalt binder falling through the screen mesh are caught. Basket guards will completely enclose the basket and be made of screen mesh, perforated stainless steel plate, or other suitable material.
• Thermometer, or other temperature measuring device, with a temperature range of 10 -
260°C (50-500°F). • Oven capable of maintaining 110 ±5°C (230 ±9°F). • Balance or scale: Capacity sufficient for the sample mass and conforming to the
requirements of M 231, Class G2. • Safety equipment: Safety glasses or face shield, high temperature gloves, long sleeved
jacket, a heat resistant surface capable of withstanding 650°C (1202°F), a protective cage capable of surrounding the sample baskets during the cooling period, and a particle mask for use during removal of the sample from the basket assembly.
• Miscellaneous equipment: A pan larger than the sample basket(s) for transferring sample
after ignition, spatulas, bowls, and wire brushes. Sampling 1. Obtain samples of HMA in accordance with the FOP for AASHTO T 168. 2. Reduce HMA samples in accordance with the FOP for AASHTO R 47. 3. If the mixture is not sufficiently soft to separate with a spatula or trowel, place it in a
large flat pan in an oven at 110 ±5°C (230 ±9°F) until soft enough.
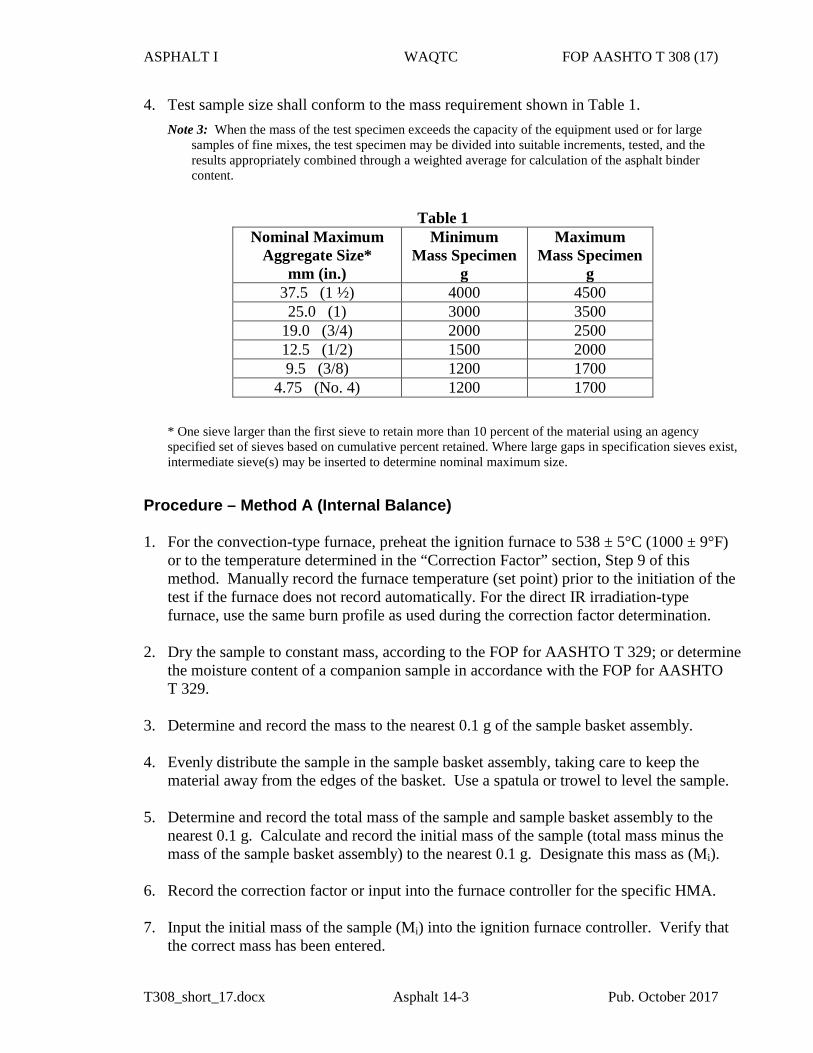
ASPHALT I WAQTC FOP AASHTO T 308 (17)
T308_short_17.docx Asphalt 14-3 Pub. October 2017
4. Test sample size shall conform to the mass requirement shown in Table 1.Note 3: When the mass of the test specimen exceeds the capacity of the equipment used or for large
samples of fine mixes, the test specimen may be divided into suitable increments, tested, and the results appropriately combined through a weighted average for calculation of the asphalt binder content.
Table 1 Nominal Maximum
Aggregate Size* mm (in.)
Minimum Mass Specimen
g
Maximum Mass Specimen
g 37.5 (1 ½) 4000 4500 25.0 (1) 3000 3500
19.0 (3/4) 2000 2500 12.5 (1/2) 1500 2000 9.5 (3/8) 1200 1700
4.75 (No. 4) 1200 1700
* One sieve larger than the first sieve to retain more than 10 percent of the material using an agencyspecified set of sieves based on cumulative percent retained. Where large gaps in specification sieves exist,intermediate sieve(s) may be inserted to determine nominal maximum size.
Procedure – Method A (Internal Balance)
1. For the convection-type furnace, preheat the ignition furnace to 538 ± 5°C (1000 ± 9°F)or to the temperature determined in the “Correction Factor” section, Step 9 of thismethod. Manually record the furnace temperature (set point) prior to the initiation of thetest if the furnace does not record automatically. For the direct IR irradiation-typefurnace, use the same burn profile as used during the correction factor determination.
2. Dry the sample to constant mass, according to the FOP for AASHTO T 329; or determinethe moisture content of a companion sample in accordance with the FOP for AASHTOT 329.
3. Determine and record the mass to the nearest 0.1 g of the sample basket assembly.
4. Evenly distribute the sample in the sample basket assembly, taking care to keep thematerial away from the edges of the basket. Use a spatula or trowel to level the sample.
5. Determine and record the total mass of the sample and sample basket assembly to thenearest 0.1 g. Calculate and record the initial mass of the sample (total mass minus themass of the sample basket assembly) to the nearest 0.1 g. Designate this mass as (Mi).
6. Record the correction factor or input into the furnace controller for the specific HMA.
7. Input the initial mass of the sample (Mi) into the ignition furnace controller. Verify thatthe correct mass has been entered.
ASPHALT I WAQTC FOP AASHTO T 308 (17)
T308_short_17.docx Asphalt 14-4 Pub. October 2017
CAUTION: Operator should wear safety equipment – high temperature gloves, face shield, fire-retardant shop coat – when opening the door to load or unload the sample.
8. Open the chamber door and gently set the sample basket assembly in the furnace. Carefully position the sample basket assembly so it is not in contact with the furnace wall. Close the chamber door and verify that the sample mass displayed on the furnace scale equals the total mass of the sample and sample basket assembly recorded in Step 5 within ±5 g. Note 4: Furnace temperature will drop below the set point when the door is opened, but will recover when
the door is closed and ignition begins. Sample ignition typically increases the temperature well above the set point – relative to sample size and asphalt binder content.
9. Initiate the test by pressing the start button. This will lock the sample chamber and start the combustion blower. Safety note: Do not attempt to open the furnace door until the asphalt binder has been completely burned off.
10. Allow the test to continue until the stable light and audible stable indicator indicate that the change in mass does not exceed 0.01 percent for three consecutive minutes. Press the stop button. This will unlock the sample chamber and cause the printer to print out the test results. Note 5: An ending mass loss percentage of 0.02 may be used, if allowed by the agency, when aggregate
that exhibits an excessive amount of loss during ignition testing is used. 11. Open the chamber door, remove the sample basket assembly, and place on the cooling
plate or block. Place the protective cage over the sample basket assembly and allow it to cool to room temperature (approximately 30 minutes).
12. Determine and record the total after ignition mass to the nearest 0.1 g. Calculate and
record the mass of the sample, after ignition (total after ignition mass minus the mass of the sample basket assembly) to the nearest 0.1 g. Designate this mass as Mf.
13. Use the asphalt binder content percentage from the printed ticket. Subtract the moisture
content from the printed ticket asphalt binder content and report the difference as the corrected asphalt binder content.
Asphalt binder content percentage can also be calculated using the formula from “Method B” Step 16.
ASPHALT I WAQTC FOP AASHTO T 308 (17)
T308_short_17.docx Asphalt 14-5 Pub. October 2017
Calculation
Corrected asphalt binder content:
𝑃𝑃𝑏𝑏 = 𝐵𝐵𝐵𝐵 −𝑀𝑀𝐵𝐵 − 𝐵𝐵𝑓𝑓 (if not input in the furnace controller)
where: Pb = the corrected asphalt binder content as a percent by mass of the HMA
BC = asphalt binder content shown on printed ticket
MC = moisture content of the companion HMA sample, percent, as determined by the FOP for AASHTO T 329 (if the specimen was oven-dried prior to initiating the procedure, MC=0)
Cf = correction factor as a percent by mass of the HMA sample
Procedure – Method B (External Balance)
1. Preheat the ignition furnace to 538 ± 5°C (1000 ± 9°F) or to the temperature determinedin the “Correction Factor” section, Step 9 of this method. Manually record the furnacetemperature (set point) prior to the initiation of the test if the furnace does not recordautomatically.
2. Dry the sample to constant mass, according to the FOP for AASHTO T 329; or determinethe moisture content of a companion sample in accordance with the FOP for AASHTOT 329.
3. Determine and record the mass of the sample basket assembly to the nearest 0.1 g.
4. Place the sample basket(s) in the catch pan. Evenly distribute the sample in the samplebasket(s), taking care to keep the material away from the edges of the basket. Use aspatula or trowel to level the sample.
5. Determine and record the total mass of the sample and sample basket assembly to thenearest 0.1 g. Calculate and record the initial mass of the sample (total mass minus themass of the sample basket assembly) to the nearest 0.1 g. Designate this mass as (Mi).
6. Record the correction factor for the specific HMA.
7. Open the chamber door and gently set the sample basket assembly in the furnace.Carefully position the sample basket assembly so it is not in contact with the furnacewall. Burn the HMA sample in the furnace for 45 minutes or the length of timedetermined in the “Correction Factors” section.
ASPHALT I WAQTC FOP AASHTO T 308 (17)
T308_short_17.docx Asphalt 14-6 Pub. October 2017
8. Open the chamber door, remove the sample basket assembly, and place on the cooling plate or block. Place the protective cage over the sample and allow it to cool to room temperature (approximately 30 min).
9. Determine and record the total after ignition mass to the nearest 0.1 g. Calculate and record the mass of the sample, after ignition (total after ignition mass minus the mass of the sample basket assembly) to the nearest 0.1 g.
10. Place the sample basket assembly back into the furnace.
11. Burn the sample for at least 15 minutes after the furnace reaches the set temperature.
12. Open the chamber door, remove the sample basket assembly, and place on the cooling plate or block. Place the protective cage over the sample basket assembly and allow it to cool to room temperature (approximately 30 min.).
13. Determine and record the total after ignition mass to the nearest 0.1 g. Calculate and record the mass of the sample, after ignition (total after ignition mass minus the mass of the sample basket assembly) to the nearest 0.1 g.
14. Repeat Steps 10 through 13 until the change in measured mass of the sample after ignition does not exceed 0.01 percent of the previous sample mass after ignition. Note 6: An ending mass loss percentage of 0.02 may be used, if allowed by the agency, when aggregate
that exhibits an excessive amount of loss during ignition testing is used. 15. Determine and record the total after ignition mass to the nearest 0.1 g. Calculate and
record the mass of the sample, after ignition (total after ignition mass minus the mass of the sample basket assembly) to the nearest 0.1 g. Designate this mass as Mf.
16. Calculate the asphalt binder content of the sample.
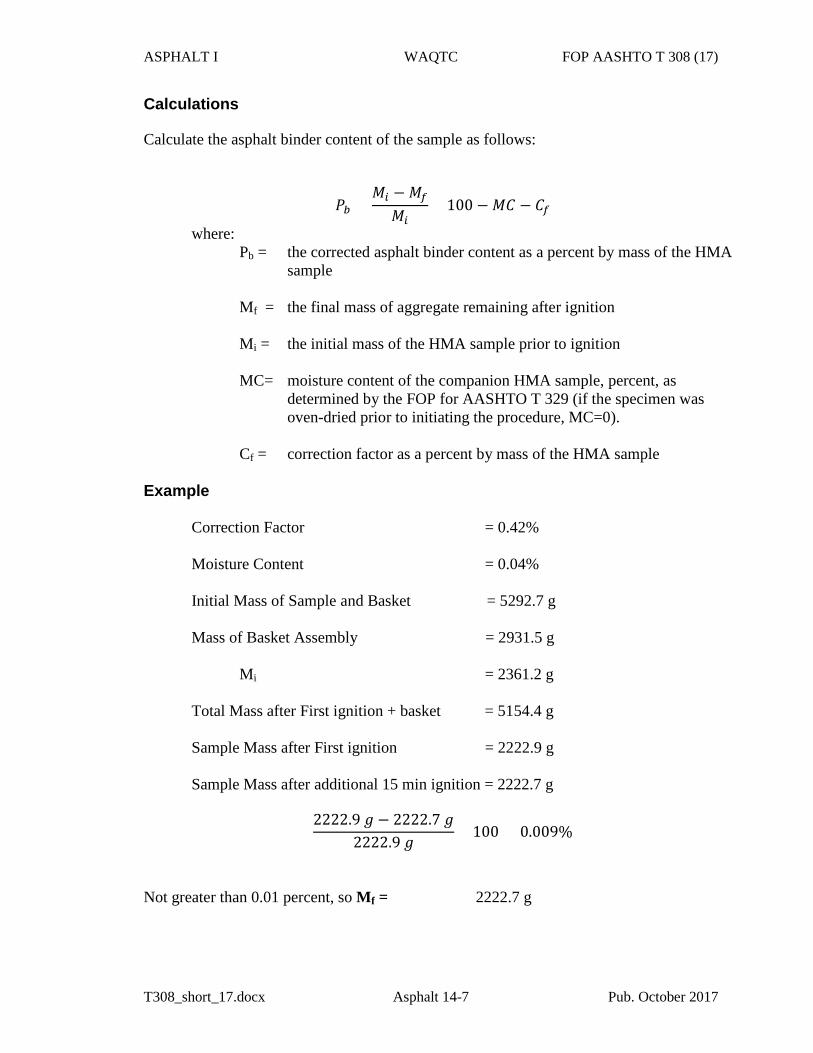
ASPHALT I WAQTC FOP AASHTO T 308 (17)
T308_short_17.docx Asphalt 14-7 Pub. October 2017
Calculations
Calculate the asphalt binder content of the sample as follows:
𝑃𝑃𝑏𝑏 =𝑀𝑀𝑖𝑖 −𝑀𝑀𝑓𝑓
𝑀𝑀𝑖𝑖× 100 −𝑀𝑀𝐵𝐵 − 𝐵𝐵𝑓𝑓
where: Pb = the corrected asphalt binder content as a percent by mass of the HMA
sample
Mf = the final mass of aggregate remaining after ignition
Mi = the initial mass of the HMA sample prior to ignition
MC= moisture content of the companion HMA sample, percent, as determined by the FOP for AASHTO T 329 (if the specimen was oven-dried prior to initiating the procedure, MC=0).
Cf = correction factor as a percent by mass of the HMA sample
Example
Correction Factor = 0.42%
Moisture Content = 0.04%
Initial Mass of Sample and Basket = 5292.7 g
Mass of Basket Assembly = 2931.5 g
Mi = 2361.2 g
Total Mass after First ignition + basket = 5154.4 g
Sample Mass after First ignition = 2222.9 g
Sample Mass after additional 15 min ignition = 2222.7 g
2222.9 𝑔𝑔 − 2222.7 𝑔𝑔2222.9 𝑔𝑔
× 100 = 0.009%
Not greater than 0.01 percent, so Mf = 2222.7 g
ASPHALT I WAQTC FOP AASHTO T 308 (17)
T308_short_17.docx Asphalt 14-8 Pub. October 2017
𝑃𝑃𝑏𝑏 =2361.2 𝑔𝑔 − 2222.7 𝑔𝑔
2361.2 𝑔𝑔× 100 − 0.42% − 0.04% = 5.41%
Pb= 5.41%
Gradation 1. Empty contents of the basket(s) into a flat pan, being careful to capture all material. Use
a small wire brush to ensure all residual fines are removed from the baskets. Note 7: Particle masks are a recommended safety precaution.
2. Perform the gradation analysis in accordance with the FOP for AASHTO T 30. Report
• Results on forms approved by the agency • Sample ID • Method of test (A or B)
• Corrected asphalt binder content, Pb, per agency standard
• Correction factor, Cf , to 0.01 percent
• Temperature compensation factor (if applicable)
• Total percent loss
• Sample mass
• Moisture content to 0.01%
• Test temperature
Attach the original printed ticket with all intermediate values (continuous tape) to the report for furnaces with internal balances.
ASPHALT I WAQTC FOP AASHTO T 308 (17)
T308_short_17.docx Asphalt 14-9 Pub. October 2017
Annex – Correction Factors
(Mandatory Information)
Asphalt Binder and Aggregate
Asphalt binder content results may be affected by the type of aggregate in the mixture and by the ignition furnace. Asphalt binder and aggregate correction factors must, therefore, be established by testing a set of correction specimens for each Job Mix Formula (JMF) mix design. Each ignition furnace will have its own unique correction factor determined in the location where testing will be performed.
This procedure must be performed before any acceptance testing is completed, and repeated each time there is a change in the mix ingredients or design. Any changes greater than 5 percent in stockpiled aggregate proportions should require a new correction factor.
Historical data or scientific studies may be used to determine the correction factor(s) in lieu of using this testing procedure if the testing agency provides reference to the studies/data. All correction samples will be prepared by a central / regional laboratory unless otherwise directed.
Asphalt binder correction factor: A correction factor must be established by testing a set of correction specimens for each Job Mix Formula (JMF). Certain aggregate types may result in unusually high correction factors (> 1.00 percent). Such mixes should be corrected and tested at a lower temperature as described below.
Aggregate correction factor: Due to potential aggregate breakdown during the ignition process, a correction factor will need to be determined for the following conditions:
a. Aggregates that have a proven history of excessive breakdown
b. Aggregate from an unknown source.
This correction factor will be used to adjust the acceptance gradation test results obtained according to the FOP for AASHTO T 30.
Procedure
1. Obtain samples of aggregate in accordance with the FOP for AASHTO T 2.
2. Obtain samples of asphalt binder in accordance with the FOP for AASHTO R 66.Note 8: Include other additives that may be required by the JMF.
3. Prepare an initial, or “butter,” mix at the design asphalt binder content. Mix and discardthe butter mix prior to mixing any of the correction specimens to ensure accurate asphaltcontent.
ASPHALT I WAQTC FOP AASHTO T 308 (17)
T308_short_17.docx Asphalt 14-10 Pub. October 2017
4. Prepare two correction specimens at the JMF design asphalt binder content. Aggregate used for correction specimens shall be sampled from material designated for use on the project. An agency approved method will be used to combine aggregate. An additional “blank” specimen shall be batched and tested for aggregate gradation in accordance with the FOP for AASHTO T 30. The gradation from the “blank” shall fall within the agency specified mix design tolerances.
5. Place the freshly mixed specimens directly into the sample basket assembly. If mixed
specimens are allowed to cool prior to placement in the sample basket assembly, the specimens must be dried to constant mass according to the FOP for AASHTO T 329. Do not preheat the sample basket assembly.
6. Test the specimens in accordance with Method A or Method B of the procedure. 7. Once both of the correction specimens have been burned, determine the asphalt binder
content for each specimen by calculation or from the printed oven tickets, if available. 8. If the difference between the asphalt binder contents of the two specimens exceeds
0.15 percent, repeat with two more specimens and, from the four results, discard the high and low result. Determine the correction factor from the two original or remaining results, as appropriate. Calculate the difference between the actual and measured asphalt binder contents for each specimen to 0.01 percent. The asphalt binder correction factor, Cf, is the average of the differences expressed as a percent by mass of HMA.
9. If the asphalt binder correction factor exceeds 1.00 percent, the test temperature must be
lowered to 482 ± 5°C (900 ± 9°F) and new samples must be burned. The temperature for determining the asphalt binder content of HMA samples by this procedure shall be the same temperature determined for the correction samples.
10. For the direct IR irradiation-type burn furnaces, the default burn profile should be used
for most materials. The operator may select burn-profile Option 1 or Option 2 to optimize the burn cycle. The burn profile for testing HMA samples shall be the same burn profile selected for correction samples.
Option 1 is designed for aggregate that requires a large asphalt binder correction factor (greater than 1.00 percent) – typically very soft aggregate (such as dolomite). Option 2 is designed for samples that may not burn completely using the default burn profile.
11. Perform a gradation analysis on the residual aggregate in accordance with the FOP for
AASHTO T 30, if required. The results will be utilized in developing an “Aggregate Correction Factor” and should be calculated and reported to 0.1 percent.
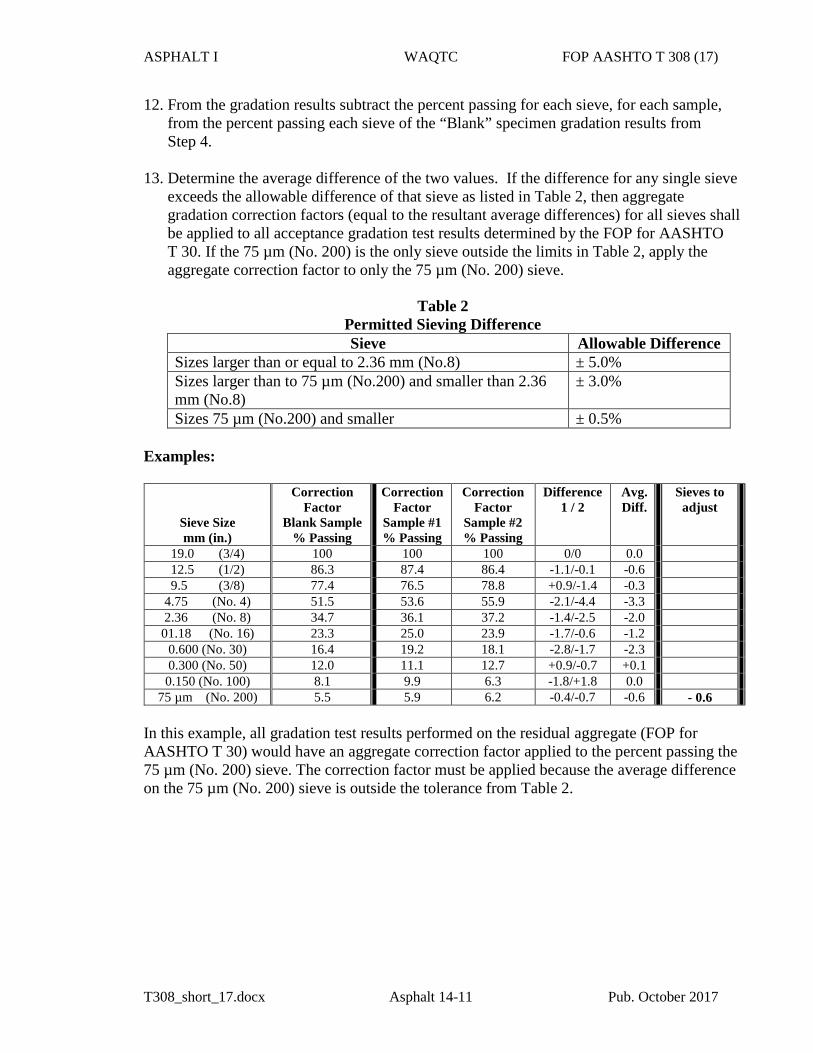
ASPHALT I WAQTC FOP AASHTO T 308 (17)
T308_short_17.docx Asphalt 14-11 Pub. October 2017
12. From the gradation results subtract the percent passing for each sieve, for each sample,from the percent passing each sieve of the “Blank” specimen gradation results fromStep 4.
13. Determine the average difference of the two values. If the difference for any single sieveexceeds the allowable difference of that sieve as listed in Table 2, then aggregategradation correction factors (equal to the resultant average differences) for all sieves shallbe applied to all acceptance gradation test results determined by the FOP for AASHTOT 30. If the 75 µm (No. 200) is the only sieve outside the limits in Table 2, apply theaggregate correction factor to only the 75 µm (No. 200) sieve.
Table 2 Permitted Sieving Difference Sieve Allowable Difference
Sizes larger than or equal to 2.36 mm (No.8) ± 5.0% Sizes larger than to 75 µm (No.200) and smaller than 2.36 mm (No.8)
± 3.0%
Sizes 75 µm (No.200) and smaller ± 0.5%
Examples:
Sieve Size mm (in.)
Correction Factor
Blank Sample % Passing
Correction Factor
Sample #1 % Passing
Correction Factor
Sample #2 % Passing
Difference 1 / 2
Avg. Diff.
Sieves to adjust
19.0 (3/4) 100 100 100 0/0 0.0 12.5 (1/2) 86.3 87.4 86.4 -1.1/-0.1 -0.69.5 (3/8) 77.4 76.5 78.8 +0.9/-1.4 -0.3
4.75 (No. 4) 51.5 53.6 55.9 -2.1/-4.4 -3.32.36 (No. 8) 34.7 36.1 37.2 -1.4/-2.5 -2.001.18 (No. 16) 23.3 25.0 23.9 -1.7/-0.6 -1.2
0.600 (No. 30) 16.4 19.2 18.1 -2.8/-1.7 -2.30.300 (No. 50) 12.0 11.1 12.7 +0.9/-0.7 +0.10.150 (No. 100) 8.1 9.9 6.3 -1.8/+1.8 0.0
75 µm (No. 200) 5.5 5.9 6.2 -0.4/-0.7 -0.6 - 0.6
In this example, all gradation test results performed on the residual aggregate (FOP for AASHTO T 30) would have an aggregate correction factor applied to the percent passing the 75 µm (No. 200) sieve. The correction factor must be applied because the average difference on the 75 µm (No. 200) sieve is outside the tolerance from Table 2.

ASPHALT I WAQTC FOP AASHTO T 308 (17)
T308_short_17.docx Asphalt 14-12 Pub. October 2017
In the following example, aggregate correction factors would be applied to each sieve because the average difference on the 4.75 mm (No. 4) is outside the tolerance from Table 2.
Sieve Size mm (in.)
Correction Factor
Blank Sample % Passing
Correction Factor
Sample #1 % Passing
Correction Factor
Sample #2 % Passing
Difference 1 / 2
Avg. Diff.
Sieves to adjust
19.0 (3/4) 100 100 100 0/0 0.0 0.0 12.5 (1/2) 86.3 87.4 86.4 -1.1/-0.1 -0.6 -0.6 9.5 (3/8) 77.4 76.5 78.8 +0.9/-1.4 -0.3 -0.3
4.75 (No. 4) 51.5 55.6 57.9 -4.1/-6.4 -5.3 -5.3 2.36 (No. 8) 34.7 36.1 37.2 -1.4/-2.5 -2.0 -2.0 01.18 (No. 16) 23.3 25.0 23.9 -1.7/-0.6 -1.2 -1.2
0.600 (No. 30) 16.4 19.2 18.1 -2.8/-1.7 -2.3 -2.3 0.300 (No. 50) 12.0 11.1 12.7 +0.9/-0.7 +0.1 +0.1 0.150 (No. 100) 8.1 9.9 6.3 -1.8/+1.8 0.0 0.0
75 µm (No. 200) 5.5 5.9 6.2 -0.4/-0.7 -0.6 -0.6

Oregon Department of TransportationConstruction Section
800 Airport Road SE Salem, OR 97301-4798
Telephone (503) 986-3000 FAX (503) 986-3096
DATE: October 15, 2004
TO: All Holders of the Manual of Field Test Procedures File Code:
SECTION: Test Procedure AASHTO T 309
The Oregon Department of Transportation has specified method(s) for this Test Procedure. Please observe the following for our projects:
Under Apparatus, Temperature Measuring Device, Metal Immersion Types ofThermometers, meeting the apparatus requirements are acceptable.
CONCRETE WAQTC FOP AASHTO T 309 (10)
T309_short_10.docx Concrete 10-1 Pub. October 2012
TEMPERATURE OF FRESHLY MIXED PORTLAND CEMENT CONCRETE FOP FOR AASHTO T 309
Scope
This procedure covers the determination of the temperature of freshly mixed Portland
Cement Concrete in accordance with AASHTO T 309-11.
Warning—Fresh Hydraulic cementitious mixtures are caustic and may cause chemical burns
to skin and tissue upon prolonged exposure.
Apparatus
Container — The container shall be made of non-absorptive material and large enough to
provide at least 75 mm (3 in.) of concrete in all directions around the sensor; concrete
cover must also be a least three times the nominal maximum size of the coarse aggregate.
Temperature measuring device — The temperature measuring device shall be calibrated
and capable of measuring the temperature of the freshly mixed concrete to ±0.5°C (±1°F)
throughout the temperature range likely to be encountered. Partial immersion liquid-in-
glass thermometers (and possibly other types) shall have a permanent mark to which the
device must be immersed without applying a correction factor.
Reference temperature measuring device — The reference temperature measuring device
shall be a thermometric device readable to 0.2°C (0.5°F) that has been verified and
calibrated. The calibration certificate or report indicating conformance to the
requirements of ASTM E 77 shall be available for inspection.
Calibration of Temperature Measuring Device
Each temperature measuring device shall be verified for accuracy annually and whenever
there is a question of accuracy. Calibration shall be performed by comparing readings on the
temperature measuring device with another calibrated instrument at two temperatures at least
15°C or 27°F apart.
Sample Locations and Times
The temperature of freshly mixed concrete may be measured in the transporting equipment,
in forms, or in sample containers, provided the sensor of the temperature measuring device
has at least 75 mm (3 in.) of concrete cover in all direction around it.
Complete the temperature measurement of the freshly mixed concrete within 5 minutes of
obtaining the sample.
Concrete containing aggregate of a nominal maximum size greater than 75 mm (3 in.) may
require up to 20 minutes for the transfer of heat from the aggregate to the mortar after
batching.
CONCRETE WAQTC FOP AASHTO T 309 (10)
T309_short_10.docx Concrete 10-2 Pub. October 2012
Procedure
1. Dampen the sample container.
2. Obtain the sample in accordance with the FOP for WAQTC TM 2.
3. Place sensor of the temperature measuring device in the freshly mixed concrete so that it
has at least 75 mm (3 in.) of concrete cover in all directions around it.
4. Gently press the concrete in around the sensor of the temperature measuring device at the
surface of the concrete so that air cannot reach the sensor.
5. Leave the sensor of the temperature measuring device in the freshly mixed concrete for a
minimum of two minutes, or until the temperature reading stabilizes.
6. Complete the temperature measurement of the freshly mixed concrete within 5 minutes of
obtaining the sample.
7. Read and record the temperature to the nearest 0.5°C (1°F).
Report
Results on forms approved by the agency
Measured temperature of the freshly mixed concrete to the nearest 0.5°C (1°F)
.

October 31, 2013
To: All Holders of the Manual of Field Test Procedures
Section: Test Procedure AASHTO T 310
The Oregon Department of Transportation has specified method(s) for this Test Procedure. Please observe the following for our projects:
ODOT TM-158 shall be satisfied prior to performing AASHTO T 310.
Document results of ODOT TM 158.
Under Calibration add; Comply with ODOT TM 304.
Under Procedure, use Method A.
The backscatter/air-gap ratio method is not allowed on ODOT contracts.
Earthwork:
Steps 11, 12, and 13 are required
Step 12, moisture content other method allowed is AASHTO T 217
Crushed Processed Aggregate:
AASHTO T 272 is not required
Steps 11, 12 & 13 are not required.
Department of TransportationConstruction Section
800 Airport Road SE
Salem, OR 97301‐4792
Phone: (503) 986‐3000
Fax: (503) 986‐3096
IN-PLACE DENSITY WAQTC FOP AASHTO T 310 (15)
T310_short_15.docx E&B/ID 19-1 Pub. October 2017
IN-PLACE DENSITY AND MOISTURE CONTENT OF SOIL AND SOIL-AGGREGATE BY NUCLEAR METHODS (SHALLOW DEPTH) FOP FOR AASHTO T 310
Scope
This procedure covers the determination of density, moisture content, and relative compaction of soil, aggregate, and soil-aggregate mixes in accordance with AASHTO T 310-13. This field operating procedure is derived from AASHTO T 310. The nuclear moisture-density gauge is used in the direct transmission mode.
Apparatus
• Nuclear density gauge with the factory matched standard reference block.
• Drive pin, guide/scraper plate, and hammer for testing in direct transmission mode.
• Transport case for properly shipping and housing the gauge and tools.
• Instruction manual for the specific make and model of gauge.
• Radioactive materials information and calibration packet containing:
− Daily Standard Count Log.
− Factory and Laboratory Calibration Data Sheet.
− Leak Test Certificate.
− Shippers Declaration for Dangerous Goods.
− Procedure Memo for Storing, Transporting and Handling Nuclear TestingEquipment.
− Other radioactive materials documentation as required by local regulatoryrequirements.
• Sealable containers and utensils for moisture content determinations.
Radiation Safety
This method does not purport to address all of the safety problems associated with its use. This test method involves potentially hazardous materials. The gauge utilizes radioactive materials that may be hazardous to the health of the user unless proper precautions are taken. Users of this gauge must become familiar with the applicable safety procedures and governmental regulations. All operators will be trained in radiation safety prior to operating
IN-PLACE DENSITY WAQTC FOP AASHTO T 310 (15)
T310_short_15.docx E&B/ID 19-2 Pub. October 2017
nuclear density gauges. Some agencies require the use of personal monitoring devices such as a thermoluminescent dosimeter or film badge. Effective instructions together with routine safety procedures such as source leak tests, recording and evaluation of personal monitoring device data, etc., are a recommended part of the operation and storage of this gauge.
Calibration
Calibrate the nuclear gauge as required by the agency. This calibration may be performed by the agency using manufacturer’s recommended procedures or by other facilities approved by the agency. Verify or re-establish calibration curves, tables, or equivalent coefficients every 12 months.
Standardization
1. Turn the gauge on and allow it to stabilize (approximately 10 to 20 minutes) prior tostandardization. Leave the power on during the day’s testing.
2. Standardize the nuclear gauge at the construction site at the start of each day’s workand as often as deemed necessary by the operator or agency. Daily variations instandard count shall not exceed the daily variations established by the manufacturerof the gauge. If the daily variations are exceeded after repeating the standardizationprocedure, the gauge should be repaired and/or recalibrated.
3. Record the standard count for both density and moisture in the Daily Standard CountLog. The exact procedure for standard count is listed in the manufacturer’sOperator’s Manual.
Note 1: New standard counts may be necessary more than once a day. See agency requirements.
Overview
There are two methods for determining in-place density of soil / soil aggregate mixtures. See agency requirements for method selection.
• Method A Single Direction
• Method B Two Direction
Procedure
1. Select a test location(s) randomly and in accordance with agency requirements. Testsites should be relatively smooth and flat and meet the following conditions:
a. At least 10 m (30 ft) away from other sources of radioactivity
b. At least 3 m (10 ft) away from large objects
IN-PLACE DENSITY WAQTC FOP AASHTO T 310 (15)
T310_short_15.docx E&B/ID 19-3 Pub. October 2017
c. The test site should be at least 150 mm (6 in.) away from any vertical projection, unless the gauge is corrected for trench wall effect.
2. Remove all loose and disturbed material, and remove additional material as necessary
to expose the top of the material to be tested.
3. Prepare a flat area sufficient in size to accommodate the gauge. Plane the area to a smooth condition so as to obtain maximum contact between the gauge and the material being tested. For Method B, the flat area must be sufficient to permit rotating the gauge 90 or 180 degrees about the source rod.
4. Fill in surface voids beneath the gauge with fines of the material being tested passing
the 4.75 mm (No. 4) sieve or finer. Smooth the surface with the guide plate or other suitable tool. The depth of the filler should not exceed approximately 3 mm (1/8 in.).
5. Make a hole perpendicular to the prepared surface using the guide plate and drive pin.
The hole shall be at least 50 mm (2 in.) deeper than the desired probe depth, and shall be aligned such that insertion of the probe will not cause the gauge to tilt from the plane of the prepared area. Remove the drive pin by pulling straight up and twisting the extraction tool.
6. Place the gauge on the prepared surface so the source rod can enter the hole without
disturbing loose material.
7. Insert the probe in the hole and lower the source rod to the desired test depth using the handle and trigger mechanism.
8. Seat the gauge firmly by partially rotating it back and forth about the source rod.
Ensure the gauge is seated flush against the surface by pressing down on the gauge corners, and making sure that the gauge does not rock.
9. Pull gently on the gauge to bring the side of the source rod nearest to the
scaler / detector firmly against the side of the hole.
10. Perform one of the following methods, per agency requirements:
a. Method A Single Direction: Take a test consisting of the average of two, one-minute readings, and record both density and moisture data. The two wet density readings should be within 32 kg/m3 (2.0 lb/ft3) of each other. The average of the two wet densities and moisture contents will be used to compute dry density.
b. Method B Two Direction: Take a one-minute reading and record both density
and moisture data. Rotate the gauge 90 or 180 degrees, pivoting it around the source rod. Reseat the gauge by pulling gently on the gauge to bring the side of the source rod nearest to the scaler/detector firmly against the side of the
IN-PLACE DENSITY WAQTC FOP AASHTO T 310 (15)
T310_short_15.docx E&B/ID 19-4 Pub. October 2017
hole and take a one-minute reading. (In trench locations, rotate the gauge 180 degrees for the second test.) Some agencies require multiple one-minute readings in both directions. Analyze the density and moisture data. A valid test consists of wet density readings in both gauge positions that are within 50 kg/m3 (3.0 lb/ft3). If the tests do not agree within this limit, move to a new location. The average of the wet density and moisture contents will be used to compute dry density.
11. If required by the agency, obtain a representative sample of the material, 4 kg (9 lb)minimum, from directly beneath the gauge full depth of material tested. This samplewill be used to verify moisture content and / or identify the correct density standard.Immediately seal the material to prevent loss of moisture.
The material tested by direct transmission can be approximated by a cylinder of soilapproximately 300 mm (12 in.) in diameter directly beneath the centerline of theradioactive source and detector. The height of the cylinder will be approximately thedepth of measurement. When organic material or large aggregate is removed duringthis operation, disregard the test information and move to a new test site.
12. To verify the moisture content from the nuclear gauge, determine the moisturecontent with a representative portion of the material using the FOP for AASHTOT 255/T 265 or other agency approved methods. If the moisture content from thenuclear gauge is within ±1 percent, the nuclear gauge readings can be accepted.Moisture content verification is gauge and material specific. Retain the remainder ofthe sample at its original moisture content for a one-point compaction test under theFOP for AASHTO T 272, or for gradation, if required.
Note 2: Example: A gauge reading of 16.8 percent moisture and an oven dry of 17.7 percent are within the ±1 percent requirements. Moisture correlation curves will be developed according to agency guidelines. These curves should be reviewed and possibly redeveloped every 90 days.
13. Determine the dry density by one of the following.
a. From nuclear gauge readings, compute by subtracting the mass (weight) of thewater (kg/m3 or lb/ft3) from the wet density (kg/m3 or lb/ft3) or compute usingthe percent moisture by dividing wet density from the nuclear gauge by1 + moisture content expressed as a decimal.
b. When verification is required and the nuclear gauge readings cannot beaccepted, the moisture content is determined by the FOP for AASHTOT 255/T 265 or other agency approved methods. Compute dry density bydividing wet density from the nuclear gauge by 1 + moisture contentexpressed as a decimal.
Percent Compaction
• Percent compaction is determined by comparing the in-place dry density as determinedby this procedure to the appropriate agency density standard. For soil or soil-aggregate
IN-PLACE DENSITY WAQTC FOP AASHTO T 310 (15)
T310_short_15.docx E&B/ID 19-5 Pub. October 2017
mixes, these are moisture-density curves developed using the FOP for AASHTO T 99/T 180. When using maximum dry densities from the FOP for AASHTO T 99/T 180 or FOP for AASHTO T 272, it may be necessary to use the Annex in the FOP for T 99/T 180 to determine corrected maximum dry density and optimum moisture content.
For coarse granular materials, the density standard may be density-gradation curves developed using a vibratory method such as AKDOT&PF’s ATM 212, ITD’s T 74, WSDOT’s TM 606, or WFLHD’s Humphres.
See appropriate agency policies for use of density standards. Calculation
Wet density readings from gauge: 1963 kg/m3 (121.6 lb/ft3) 1993 kg/m3 (123.4 lb/ft3)
Avg: 1978 kg/m3 (122.5 lb/ft3)
Moisture readings from gauge: 14.2% and 15.4% = Avg 14.8%
Moisture content from the FOP’s for AASHTO T 255/ T 265: 15.9% Moisture content is greater than 1 percent different so the gauge moisture cannot be used. Calculate the dry density as follows:
𝜌𝜌𝑑𝑑 = �𝜌𝜌𝑤𝑤
𝑤𝑤 + 100� × 100 𝑜𝑜𝑜𝑜 𝜌𝜌𝑑𝑑 = �
𝜌𝜌𝑤𝑤𝑤𝑤
100 + 1�
Where:
ρd = Dry density, kg/m3 (lb/ft3) ρw = Wet density, kg/m3 (lb/ft3) w = Moisture content from the FOP’s for AASHTO T 255 / T 265, as a percentage
𝜌𝜌𝑑𝑑 = �1978 𝑘𝑘𝑘𝑘 𝑚𝑚3 𝑜𝑜𝑜𝑜 122.5 𝑙𝑙𝑙𝑙 𝑓𝑓𝑓𝑓3⁄⁄
15.9 + 100� × 100 𝜌𝜌𝑑𝑑 = �
1978 𝑘𝑘𝑘𝑘 𝑚𝑚3 𝑜𝑜𝑜𝑜 ⁄ 122.5 𝑙𝑙𝑙𝑙 𝑓𝑓𝑓𝑓3⁄15.9100 + 1
�
Corrected for moisture Dry Density: 1707 kg/m3 (105.7 lb/ft3)
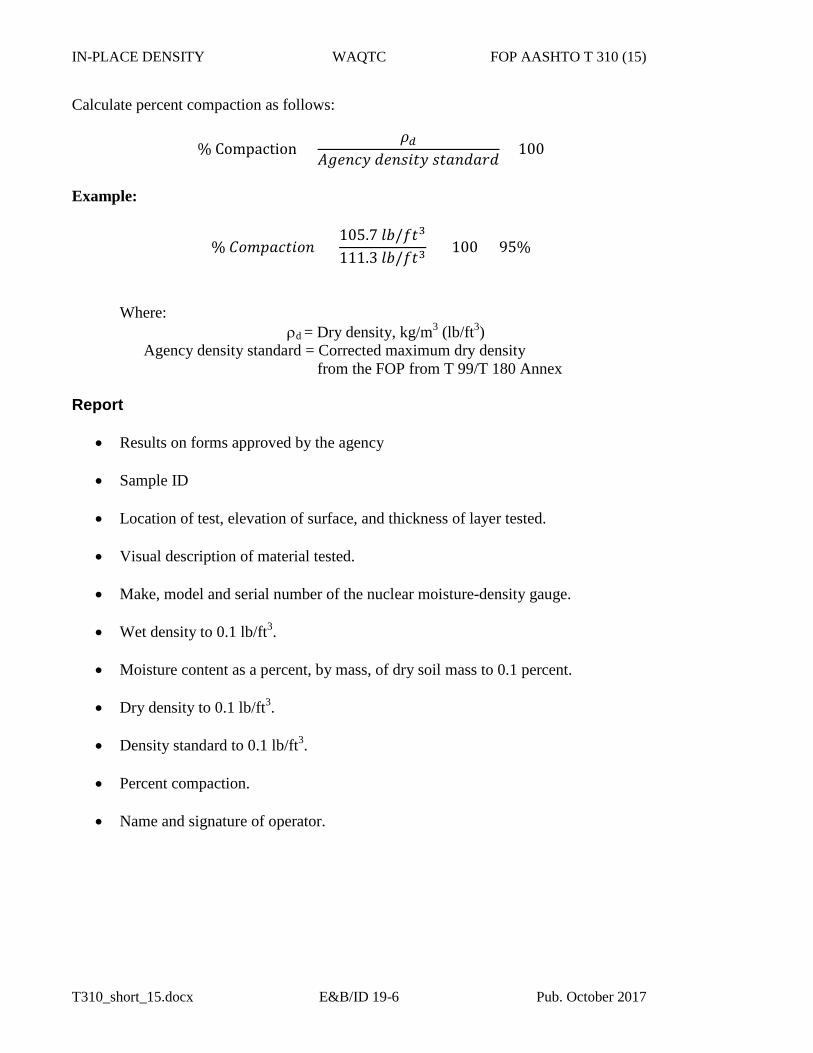
IN-PLACE DENSITY WAQTC FOP AASHTO T 310 (15)
T310_short_15.docx E&B/ID 19-6 Pub. October 2017
Calculate percent compaction as follows:
% Compaction =𝜌𝜌𝑑𝑑
𝐴𝐴𝑘𝑘𝐴𝐴𝐴𝐴𝐴𝐴𝐴𝐴 𝑑𝑑𝐴𝐴𝐴𝐴𝑑𝑑𝑑𝑑𝑓𝑓𝐴𝐴 𝑑𝑑𝑓𝑓𝑠𝑠𝐴𝐴𝑑𝑑𝑠𝑠𝑜𝑜𝑑𝑑× 100
Example:
% 𝐶𝐶𝑜𝑜𝑚𝑚𝐶𝐶𝑠𝑠𝐴𝐴𝑓𝑓𝑑𝑑𝑜𝑜𝐴𝐴 = 105.7 𝑙𝑙𝑙𝑙/𝑓𝑓𝑓𝑓3
111.3 𝑙𝑙𝑙𝑙/𝑓𝑓𝑓𝑓3 × 100 = 95%
Where: ρd = Dry density, kg/m3 (lb/ft3)
Agency density standard = Corrected maximum dry density from the FOP from T 99/T 180 Annex
Report
• Results on forms approved by the agency
• Sample ID
• Location of test, elevation of surface, and thickness of layer tested.
• Visual description of material tested.
• Make, model and serial number of the nuclear moisture-density gauge.
• Wet density to 0.1 lb/ft3.
• Moisture content as a percent, by mass, of dry soil mass to 0.1 percent.
• Dry density to 0.1 lb/ft3.
• Density standard to 0.1 lb/ft3.
• Percent compaction.
• Name and signature of operator.

November 30, 2012
To: All Holders of the Manual of Field Test Procedures
Section: Test Procedure AASHTO T 329
The Oregon Department of Transportation has specified method(s) for this Test Procedure. Please observe the following for our projects:
Under test procedure, step 8, delete the ±9ºC (15ºF) reference and replace with ±10ºC(25ºF).
RAP and RAS moisture content shall be determined by this test method.
Report RAP and RAS moisture content to the nearest 0.1%.
Department of TransportationConstruction Section
800 Airport Road SE
Salem, OR 97301‐4792
Phone: (503) 986‐3000
Fax: (503) 986‐3096
ASPHALT I WAQTC FOP AASHTO T 329 (16)
T329_short_16.docx Asphalt 13-1 Pub. October 2016
MOISTURE CONTENT OF ASPHALT MIXTURES BY OVEN METHOD FOP FOR AASHTO T 329 Scope This procedure covers the determination of moisture content of asphalt mixtures in accordance with AASHTO T 329-15. Overview Moisture content is determined by comparing the wet mass of a sample and the mass of the sample after drying to constant mass. The term constant mass is used to define when a sample is dry. Constant mass – the state at which a mass does not change more than a given percent, after additional drying for a defined time interval, at a required temperature. Apparatus • Balance or scale: 2 kg capacity, readable to 0.1 g and conforming to AASHTO M 231. • Forced draft, ventilated, or convection oven: Capable of maintaining the temperature
surrounding the sample at 163 ±14°C (325 ±25°F). • Sample Container: Clean, dry, not affected by heat and of sufficient size to contain a test
sample without danger of spilling. • Thermometer or other suitable device with a temperature range of 10-260°C (50-500°F). Sample The test sample shall be obtained in accordance with the FOP for AASHTO T 168, and reduced in accordance with the FOP for AASHTO R 47. The size of the test sample shall be a minimum of 1000 g. Procedure 1. Preheat the oven to the Job Mix Formula (JMF) mixing temperature range. If the mixing
temperature is not supplied, a temperature of 163 ±14ºC (325 ±25ºF) is to be used. Note 1: For repeatability between laboratories, the preferred practice is to dry the sample at no less than 9°
C (15° F) below the JMF mixing temperature.
2. Determine and record the mass of the sample container, including release media, to the nearest 0.1 g. Note 2: When using paper or other absorptive material to line the sample container ensure it is dry before
determining initial mass of sample container.
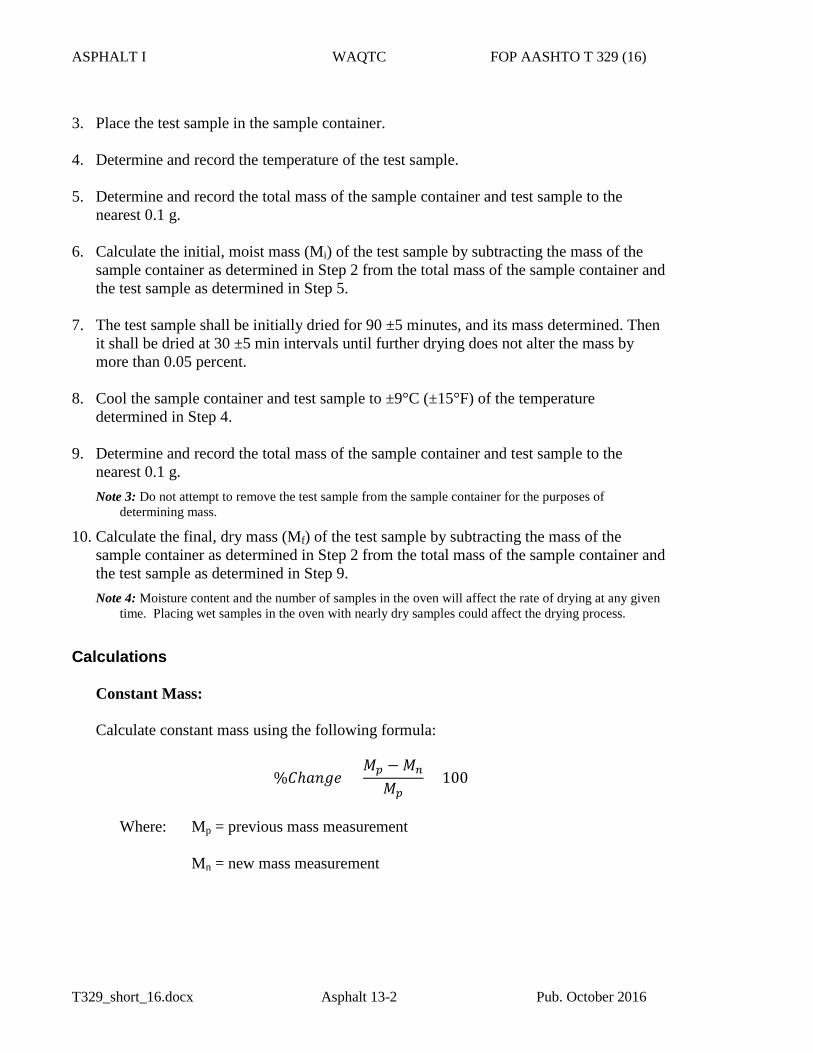
ASPHALT I WAQTC FOP AASHTO T 329 (16)
T329_short_16.docx Asphalt 13-2 Pub. October 2016
3. Place the test sample in the sample container.
4. Determine and record the temperature of the test sample.
5. Determine and record the total mass of the sample container and test sample to thenearest 0.1 g.
6. Calculate the initial, moist mass (Mi) of the test sample by subtracting the mass of thesample container as determined in Step 2 from the total mass of the sample container andthe test sample as determined in Step 5.
7. The test sample shall be initially dried for 90 ±5 minutes, and its mass determined. Thenit shall be dried at 30 ±5 min intervals until further drying does not alter the mass bymore than 0.05 percent.
8. Cool the sample container and test sample to ±9°C (±15°F) of the temperaturedetermined in Step 4.
9. Determine and record the total mass of the sample container and test sample to thenearest 0.1 g.Note 3: Do not attempt to remove the test sample from the sample container for the purposes of
determining mass.
10. Calculate the final, dry mass (Mf) of the test sample by subtracting the mass of thesample container as determined in Step 2 from the total mass of the sample container andthe test sample as determined in Step 9.Note 4: Moisture content and the number of samples in the oven will affect the rate of drying at any given
time. Placing wet samples in the oven with nearly dry samples could affect the drying process.
Calculations
Constant Mass:
Calculate constant mass using the following formula:
%𝐶𝐶ℎ𝑎𝑎𝑎𝑎𝑎𝑎𝑎𝑎 =𝑀𝑀𝑝𝑝 −𝑀𝑀𝑛𝑛
𝑀𝑀𝑝𝑝× 100
Where: Mp = previous mass measurement
Mn = new mass measurement
ASPHALT I WAQTC FOP AASHTO T 329 (16)
T329_short_16.docx Asphalt 13-3 Pub. October 2016
Example:
Mass of container: 232.6 g Mass of container and sample after first drying cycle: 1361.8 g
Mass, Mp, of possibly dry sample: 1361.8 g – 232.6 g = 1129.2 g Mass of container and possibly dry sample after second drying cycle: 1360.4 g Mass, Mn, of possibly dry sample: 1360.4 g – 232.6 g = 1127.8 g
1129.2 𝑎𝑎 − 1127.8 𝑎𝑎
1129.2 𝑎𝑎× 100 = 0.12%
0.12 percent is not less than 0.05 percent, so continue drying the sample.
Mass of container and possibly dry sample after third drying cycle: 1359.9 g Mass, Mn, of dry sample: 1359.9 g – 232.6 g = 1127.3 g
1127.8 𝑎𝑎 − 1127.3 𝑎𝑎1127.8 𝑎𝑎
× 100 = 0.04%
0.04 percent is less than 0.05 percent, so constant mass has been reached.
Moisture Content: Calculate the moisture content, as a percent, using the following formula.
𝑀𝑀𝑀𝑀𝑀𝑀𝑀𝑀𝑀𝑀𝑀𝑀𝑀𝑀𝑎𝑎 𝐶𝐶𝑀𝑀𝑎𝑎𝑀𝑀𝑎𝑎𝑎𝑎𝑀𝑀 =𝑀𝑀𝑖𝑖 −𝑀𝑀𝑓𝑓
𝑀𝑀𝑓𝑓× 100
Where: Mi = initial, moist mass
Mf = final, dry mass
ASPHALT I WAQTC FOP AASHTO T 329 (16)
T329_short_16.docx Asphalt 13-4 Pub. October 2016
Example:
Mi = 1134.9 g
Mf = 1127.3 g
𝑀𝑀𝑀𝑀𝑀𝑀𝑀𝑀𝑀𝑀𝑀𝑀𝑀𝑀𝑎𝑎 𝐶𝐶𝑀𝑀𝑎𝑎𝑀𝑀𝑎𝑎𝑎𝑎𝑀𝑀 =1134.9 𝑎𝑎 − 1127.3 𝑎𝑎
1127.3 𝑎𝑎× 100 = 0.674, say 0.67%
Report
• Results on forms approved by the agency
• Sample ID
• Moisture content to 0.01 percent
AGGREGATE WAQTC FOP AASHTO T 335 (17)
T335_short_17.docx Aggregate 13-1 Pub. October 2017
DETERMINING THE PERCENTAGE OF FRACTURE IN COARSE AGGREGATE FOP FOR AASHTO T 335
Scope
This procedure covers the determination of the percentage, by mass, of a coarse aggregate (CA) sample that consists of fractured particles meeting specified requirements in accordance with AASHTO T 335-09.
In this FOP, a sample of aggregate is screened on the sieve separating CA and fine aggregate (FA). This sieve will be identified in the agency’s specifications, but might be the 4.75 mm (No. 4) sieve. CA particles are visually evaluated to determine conformance to the specified fracture. The percentage of conforming particles, by mass, is calculated for comparison to the specifications.
Apparatus
• Balance or scale: Capacity sufficient for the principle sample mass, accurate to0.1 percent of the sample mass or readable to 0.1 g, and meeting the requirements ofAASHTO M 231.
• Sieves: Meeting requirements of the FOP for AASHTO T 27/T 11.
• Splitter: Meeting the requirements of FOP for AASHTO R 76.
Terminology
1. Fractured Face: An angular, rough, or broken surface of an aggregate particle created bycrushing or by other means. A face is considered a “fractured face” whenever one-half ormore of the projected area, when viewed normal to that face, is fractured with sharp andwell defined edges. This excludes small nicks.
2. Fractured particle: A particle of aggregate having at least the minimum number offractured faces specified. (This is usually one or two.)
Sampling and Sample Preparation
1. Sample and reduce the aggregate in accordance with the FOPs for AASHTO T 2 andR 76.
2. When the specifications list only a total fracture percentage, the sample shall be preparedin accordance with Method 1. When the specifications require that the fracture becounted and reported on each sieve, the sample shall be prepared in accordance withMethod 2.
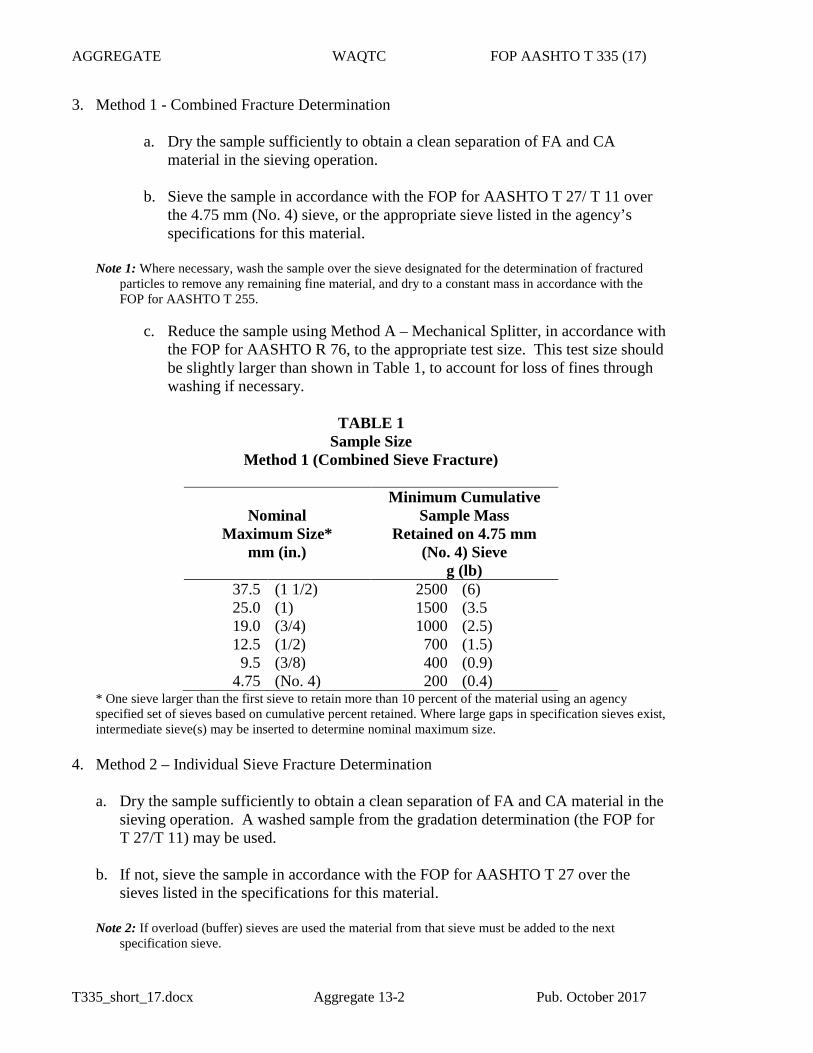
AGGREGATE WAQTC FOP AASHTO T 335 (17)
T335_short_17.docx Aggregate 13-2 Pub. October 2017
3. Method 1 - Combined Fracture Determination
a. Dry the sample sufficiently to obtain a clean separation of FA and CAmaterial in the sieving operation.
b. Sieve the sample in accordance with the FOP for AASHTO T 27/ T 11 overthe 4.75 mm (No. 4) sieve, or the appropriate sieve listed in the agency’sspecifications for this material.
Note 1: Where necessary, wash the sample over the sieve designated for the determination of fractured particles to remove any remaining fine material, and dry to a constant mass in accordance with the FOP for AASHTO T 255.
c. Reduce the sample using Method A – Mechanical Splitter, in accordance withthe FOP for AASHTO R 76, to the appropriate test size. This test size shouldbe slightly larger than shown in Table 1, to account for loss of fines throughwashing if necessary.
TABLE 1 Sample Size
Method 1 (Combined Sieve Fracture)
Nominal Maximum Size*
mm (in.)
Minimum Cumulative Sample Mass
Retained on 4.75 mm (No. 4) Sieve
g (lb) 37.5 (1 1/2) 2500 (6)25.0 (1) 1500 (3.5 19.0 (3/4) 1000 (2.5) 12.5 (1/2) 700 (1.5) 9.5 (3/8) 400 (0.9)
4.75 (No. 4) 200 (0.4) * One sieve larger than the first sieve to retain more than 10 percent of the material using an agencyspecified set of sieves based on cumulative percent retained. Where large gaps in specification sieves exist,intermediate sieve(s) may be inserted to determine nominal maximum size.
4. Method 2 – Individual Sieve Fracture Determination
a. Dry the sample sufficiently to obtain a clean separation of FA and CA material in thesieving operation. A washed sample from the gradation determination (the FOP forT 27/T 11) may be used.
b. If not, sieve the sample in accordance with the FOP for AASHTO T 27 over thesieves listed in the specifications for this material.
Note 2: If overload (buffer) sieves are used the material from that sieve must be added to the next specification sieve.
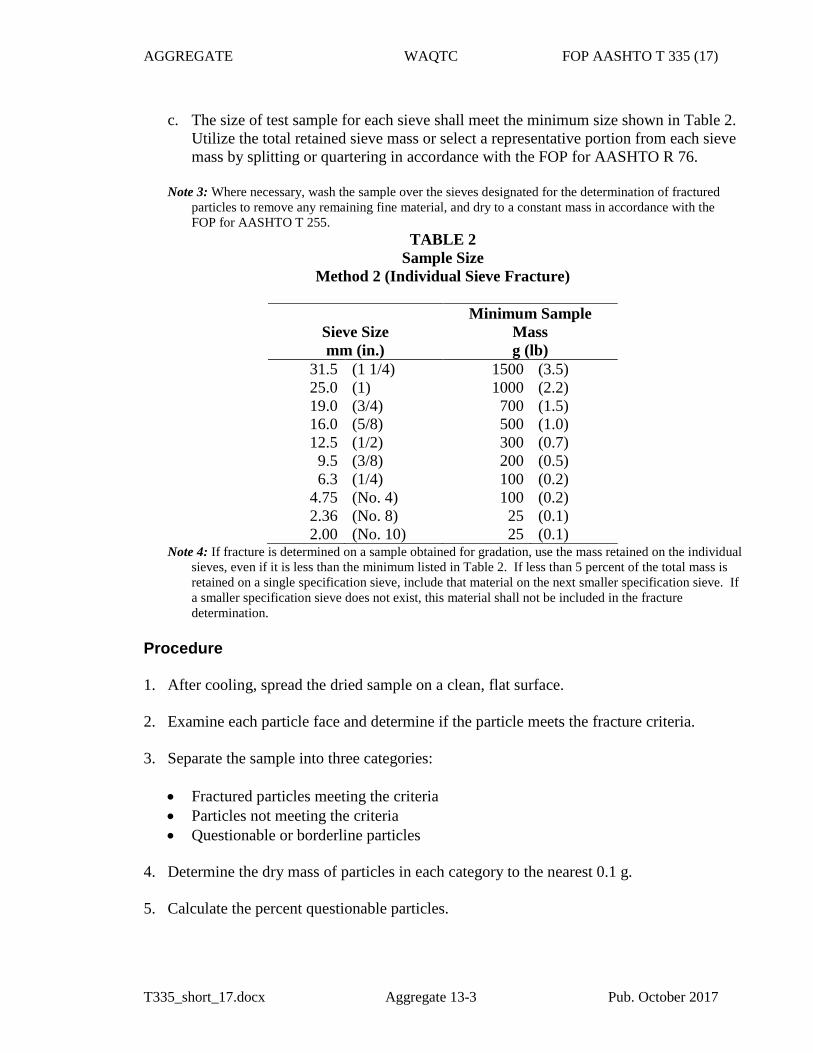
AGGREGATE WAQTC FOP AASHTO T 335 (17)
T335_short_17.docx Aggregate 13-3 Pub. October 2017
c. The size of test sample for each sieve shall meet the minimum size shown in Table 2.
Utilize the total retained sieve mass or select a representative portion from each sieve mass by splitting or quartering in accordance with the FOP for AASHTO R 76.
Note 3: Where necessary, wash the sample over the sieves designated for the determination of fractured
particles to remove any remaining fine material, and dry to a constant mass in accordance with the FOP for AASHTO T 255.
TABLE 2 Sample Size
Method 2 (Individual Sieve Fracture)
Sieve Size mm (in.)
Minimum Sample Mass g (lb)
31.5 (1 1/4) 1500 (3.5) 25.0 (1) 1000 (2.2) 19.0 (3/4) 700 (1.5) 16.0 (5/8) 500 (1.0) 12.5 (1/2) 300 (0.7) 9.5 (3/8) 200 (0.5) 6.3 (1/4) 100 (0.2)
4.75 (No. 4) 100 (0.2) 2.36 (No. 8) 25 (0.1) 2.00 (No. 10) 25 (0.1)
Note 4: If fracture is determined on a sample obtained for gradation, use the mass retained on the individual sieves, even if it is less than the minimum listed in Table 2. If less than 5 percent of the total mass is retained on a single specification sieve, include that material on the next smaller specification sieve. If a smaller specification sieve does not exist, this material shall not be included in the fracture determination.
Procedure 1. After cooling, spread the dried sample on a clean, flat surface.
2. Examine each particle face and determine if the particle meets the fracture criteria.
3. Separate the sample into three categories:
• Fractured particles meeting the criteria • Particles not meeting the criteria • Questionable or borderline particles
4. Determine the dry mass of particles in each category to the nearest 0.1 g. 5. Calculate the percent questionable particles.
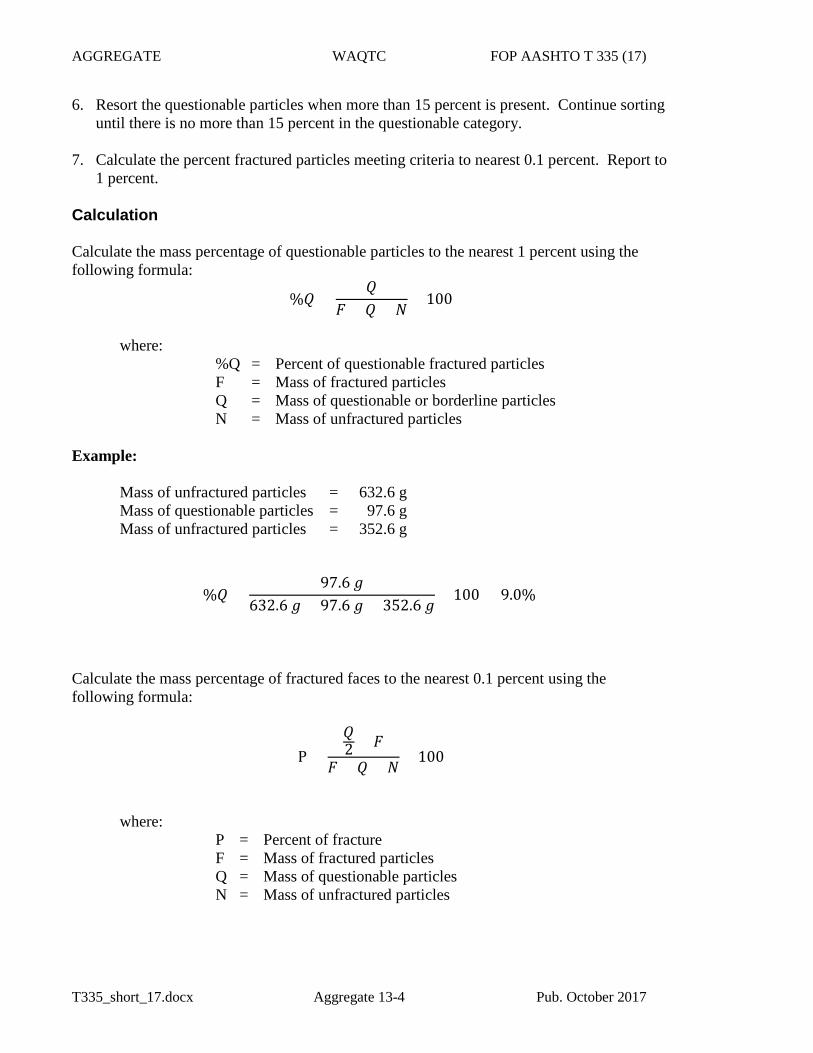
AGGREGATE WAQTC FOP AASHTO T 335 (17)
T335_short_17.docx Aggregate 13-4 Pub. October 2017
6. Resort the questionable particles when more than 15 percent is present. Continue sortinguntil there is no more than 15 percent in the questionable category.
7. Calculate the percent fractured particles meeting criteria to nearest 0.1 percent. Report to1 percent.
Calculation
Calculate the mass percentage of questionable particles to the nearest 1 percent using the following formula:
%𝑄𝑄 =𝑄𝑄
𝐹𝐹 + 𝑄𝑄 + 𝑁𝑁× 100
where: %Q = Percent of questionable fractured particles F = Mass of fractured particles Q = Mass of questionable or borderline particles N = Mass of unfractured particles
Example:
Mass of unfractured particles = 632.6 g Mass of questionable particles = 97.6 g Mass of unfractured particles = 352.6 g
%𝑄𝑄 =97.6 𝑔𝑔
632.6 𝑔𝑔 + 97.6 𝑔𝑔 + 352.6 𝑔𝑔× 100 = 9.0%
Calculate the mass percentage of fractured faces to the nearest 0.1 percent using the following formula:
P =𝑄𝑄2 + 𝐹𝐹
𝐹𝐹 + 𝑄𝑄 + 𝑁𝑁× 100
where: P = Percent of fracture F = Mass of fractured particles Q = Mass of questionable particles N = Mass of unfractured particles
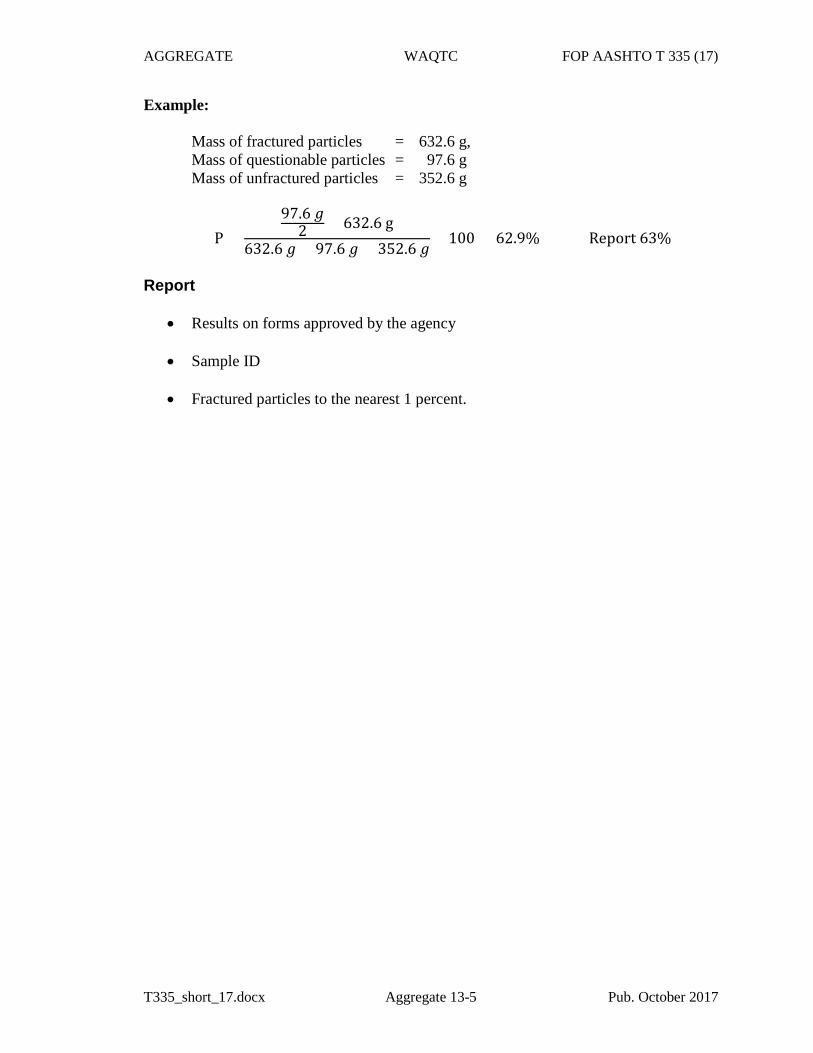
AGGREGATE WAQTC FOP AASHTO T 335 (17)
T335_short_17.docx Aggregate 13-5 Pub. October 2017
Example:
Mass of fractured particles = 632.6 g, Mass of questionable particles = 97.6 g Mass of unfractured particles = 352.6 g
P =97.6 𝑔𝑔
2 + 632.6 g632.6 𝑔𝑔 + 97.6 𝑔𝑔 + 352.6 𝑔𝑔
× 100 = 62.9% Report 63%
Report
• Results on forms approved by the agency
• Sample ID
• Fractured particles to the nearest 1 percent.


November 30, 2015
To: All Holders of the Manual of Field Test Procedures
Section: Test Procedure AASHTO T 355
The Oregon Department of Transportation has specified method(s) for this Test Procedure. Please observe the following for our projects:
• Under Calibration: ODOT requires calibration verified according to TM304.
• Under Procedure, Step 1, a filler material is defined as material passingthe No. 8 or finer sieve and be from the aggregate source used toproduce the Job Mix Formula.
• Delete Appendix – Correlation with Cores
• For Core Correlation use ODOT TM-327 and utilize form 734-2327 forreporting.
Density testing of ACP shall conform to the following:
• Select 5 longitudinal test locations in a stratified random pattern inaccordance with ODOT TM 400.
Kate Brown, Governor
Department of Transportation Construction Section 800 Airport Road SE
Salem, OR 97301-4792 Phone: (503) 986-3000
Fax: (503) 986-3096
IN-PLACE DENSITY WAQTC FOP AASHTO T 355 (16)
T355_short_16.docx E&B/ID 22-1 Pub. October 2017
IN-PLACE DENSITY OF ASPHALT MIXTURES BY NUCLEAR METHOD FOP FOR AASHTO T 355 Scope This test method describes a procedure for determining the density of asphalt mixtures by means of a nuclear gauge using the backscatter method in accordance with AASHTO T 355-16. Correlation with densities determined under the FOP for AASHTO T 166 is required by some agencies. Apparatus
• Nuclear density gauge with the factory-matched standard reference block.
• Transport case for properly shipping and housing the gauge and tools.
• Instruction manual for the specific make and model of gauge.
• Radioactive materials information and calibration packet containing:
− Daily standard count log
− Factory and laboratory calibration data sheet
− Leak test certificate
− Shippers’ declaration for dangerous goods
− Procedure memo for storing, transporting and handling nuclear testing equipment
− Other radioactive materials documentation as required by local regulatory requirements
Material • Filler material: Fine-graded sand from the source used to produce the asphalt pavement
or other agency approved materials. Radiation Safety This method does not purport to address all of the safety problems associated with its use. This test method involves potentially hazardous materials. The gauge utilizes radioactive materials that may be hazardous to the health of the user unless proper precautions are taken. Users of this gauge must become familiar with the applicable safety procedures and governmental regulations. All operators will be trained in radiation safety prior to operating nuclear density gauges. Some agencies require the use of personal monitoring devices such
IN-PLACE DENSITY WAQTC FOP AASHTO T 355 (16)
T355_short_16.docx E&B/ID 22-2 Pub. October 2017
as a thermoluminescent dosimeter or film badge. Effective instructions, together with routine safety procedures such as source leak tests, recording and evaluation of personal monitoring device data, etc., are a recommended part of the operation and storage of this gauge.
Calibration
Calibrate the nuclear gauge as required by the agency. This calibration may be performed by the agency using the manufacturer’s recommended procedures or by other facilities approved by the agency. Verify or re-establish calibration curves, tables, or equivalent coefficients every 12 months.
Standardization
1. Turn the gauge on and allow it to stabilize (approximately 10 to 20 minutes) prior tostandardization. Leave the power on during the day’s testing.
2. Standardize the nuclear gauge at the construction site at the start of each day’s workand as often as deemed necessary by the operator or agency. Daily variations instandard count shall not exceed the daily variations established by the manufacturerof the gauge. If the daily variations are exceeded after repeating the standardizationprocedure, the gauge should be repaired, recalibrated, or both.
3. Record the standard count for both density and moisture in the daily standard countlog. The exact procedure for standard count is listed in the manufacturer’s Operator’sManual.
Note 1: New standard counts may be necessary more than once a day. See agency requirements.
Test Site Location
1. Select a test location(s) randomly and in accordance with agency requirements. Testsites should be relatively smooth and flat and meet the following conditions:
a. At least 10 m (30 ft.) away from other sources of radioactivity.
b. At least 3 m (10 ft.) away from large objects.
c. If the gauge will be closer than 600 mm (24 in.) to any vertical mass, or lessthan 300 mm (12 in.) from a vertical pavement edge, use the gaugemanufacturer’s correction procedure.
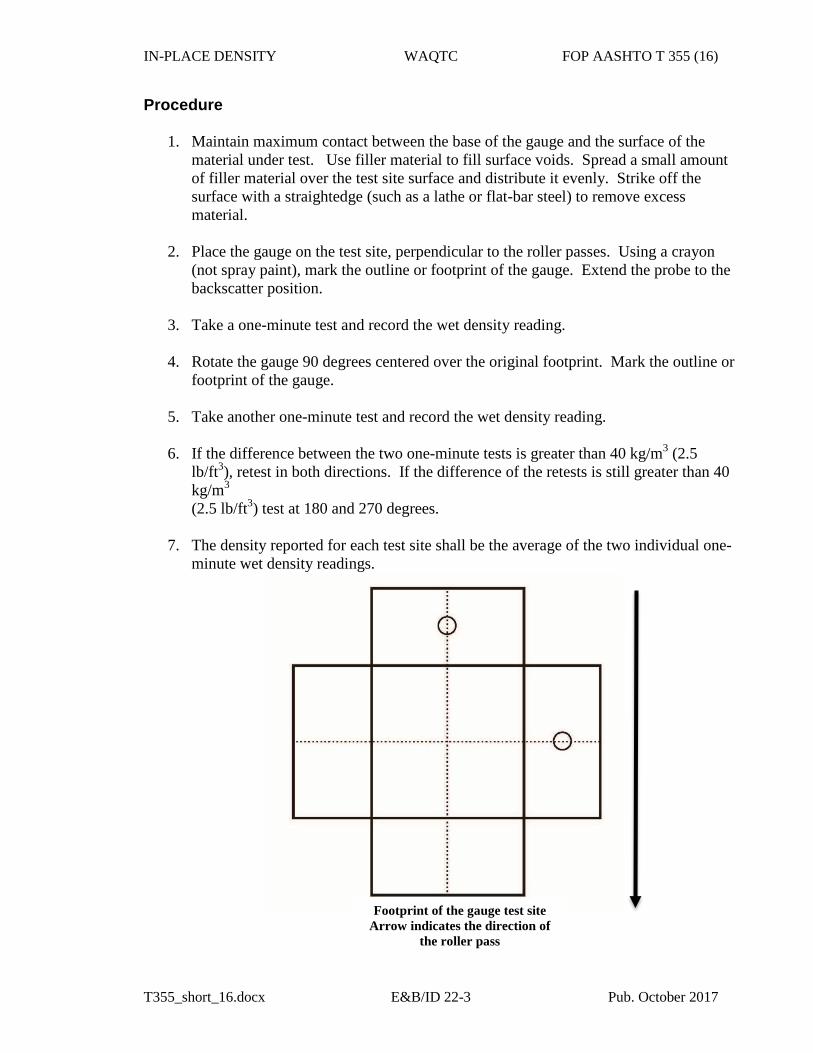
IN-PLACE DENSITY WAQTC FOP AASHTO T 355 (16)
T355_short_16.docx E&B/ID 22-3 Pub. October 2017
Procedure
1. Maintain maximum contact between the base of the gauge and the surface of the material under test. Use filler material to fill surface voids. Spread a small amount of filler material over the test site surface and distribute it evenly. Strike off the surface with a straightedge (such as a lathe or flat-bar steel) to remove excess material.
2. Place the gauge on the test site, perpendicular to the roller passes. Using a crayon
(not spray paint), mark the outline or footprint of the gauge. Extend the probe to the backscatter position.
3. Take a one-minute test and record the wet density reading.
4. Rotate the gauge 90 degrees centered over the original footprint. Mark the outline or
footprint of the gauge.
5. Take another one-minute test and record the wet density reading.
6. If the difference between the two one-minute tests is greater than 40 kg/m3 (2.5 lb/ft3), retest in both directions. If the difference of the retests is still greater than 40 kg/m3 (2.5 lb/ft3) test at 180 and 270 degrees.
7. The density reported for each test site shall be the average of the two individual one-
minute wet density readings.
Footprint of the gauge test site Arrow indicates the direction of
the roller pass
IN-PLACE DENSITY WAQTC FOP AASHTO T 355 (16)
T355_short_16.docx E&B/ID 22-4 Pub. October 2017
Calculation of Results
Percent compaction is determined by comparing the in-place wet density as determined by this method to the appropriate agency density standard. See appropriate agency policy for use of density standards.
Example:
Reading #1: 141.5 lb/ft3
Reading #2: 140.1 lb/ft3 Are the two readings within the tolerance? (YES)
Reading average: 140.8 lb/ft3
Core correction : +2.1 lb/ft3
Corrected reading: 142.9 lb/ft3
From the FOP for AASHTO T 209:
Gmm = 2.466
𝑴𝑴𝑴𝑴𝑴𝑴𝑴𝑴𝑴𝑴𝑴𝑴𝑴𝑴 𝑳𝑳𝑴𝑴𝑳𝑳𝑳𝑳𝑳𝑳𝑴𝑴𝑳𝑳𝑳𝑳𝑳𝑳𝑳𝑳 𝑫𝑫𝑳𝑳𝑳𝑳 𝑫𝑫𝑫𝑫𝑫𝑫𝑫𝑫𝑴𝑴𝑳𝑳𝑳𝑳 = 2.466 × 62.245𝑙𝑙𝑙𝑙/𝑓𝑓𝑓𝑓3 = 153.5𝑙𝑙𝑙𝑙/𝑓𝑓𝑓𝑓3
𝑷𝑷𝑫𝑫𝑳𝑳𝑷𝑷𝑫𝑫𝑫𝑫𝑳𝑳 𝑷𝑷𝑳𝑳𝑴𝑴𝒄𝒄𝑴𝑴𝑷𝑷𝑳𝑳𝑴𝑴𝑳𝑳𝑫𝑫 = 142.9 𝑙𝑙𝑙𝑙 𝑓𝑓𝑓𝑓3⁄153.5 𝑙𝑙𝑙𝑙 𝑓𝑓𝑓𝑓3⁄ × 100 = 93.1%
Report
• Results on forms approved by the agency• Test ID• Location of test and thickness of layer tested• Mixture type• Make, model and serial number of the nuclear moisture-density gauge• Calculated wet density of each measurement and any adjustment data• Density standard• Compaction 0.1 percent• Name and signature of operator
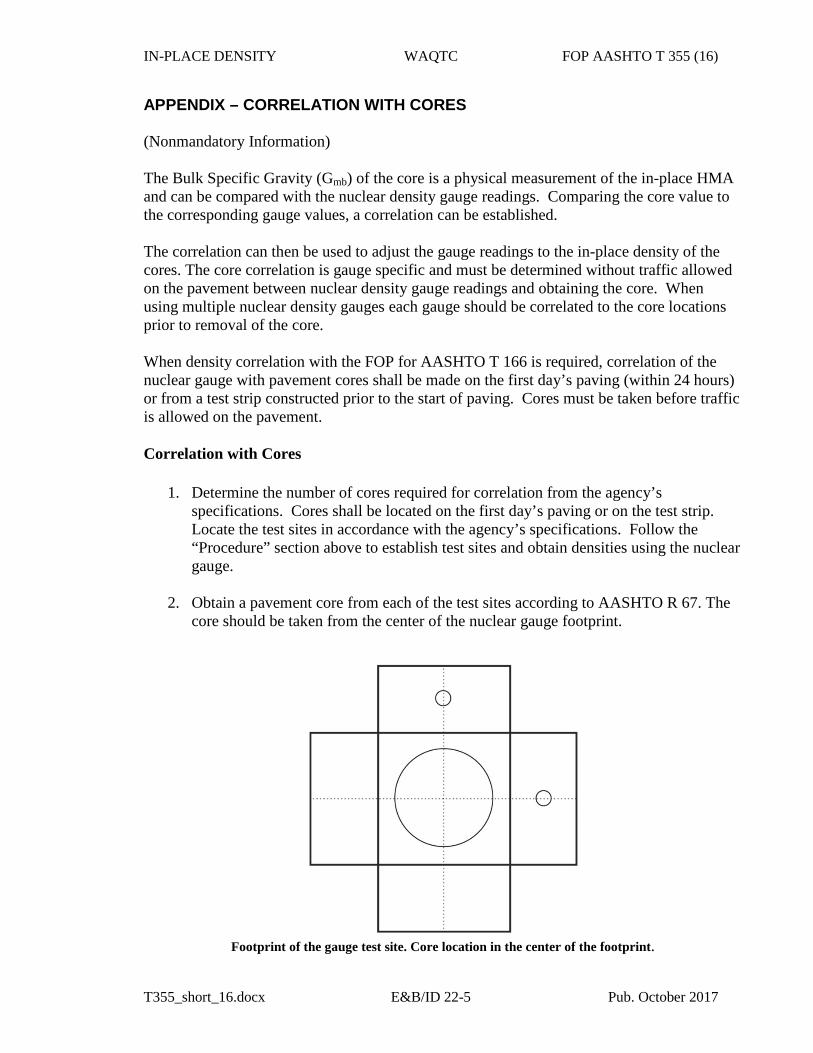
IN-PLACE DENSITY WAQTC FOP AASHTO T 355 (16)
T355_short_16.docx E&B/ID 22-5 Pub. October 2017
APPENDIX – CORRELATION WITH CORES
(Nonmandatory Information)
The Bulk Specific Gravity (Gmb) of the core is a physical measurement of the in-place HMA and can be compared with the nuclear density gauge readings. Comparing the core value to the corresponding gauge values, a correlation can be established.
The correlation can then be used to adjust the gauge readings to the in-place density of the cores. The core correlation is gauge specific and must be determined without traffic allowed on the pavement between nuclear density gauge readings and obtaining the core. When using multiple nuclear density gauges each gauge should be correlated to the core locations prior to removal of the core.
When density correlation with the FOP for AASHTO T 166 is required, correlation of the nuclear gauge with pavement cores shall be made on the first day’s paving (within 24 hours) or from a test strip constructed prior to the start of paving. Cores must be taken before traffic is allowed on the pavement.
Correlation with Cores
1. Determine the number of cores required for correlation from the agency’sspecifications. Cores shall be located on the first day’s paving or on the test strip.Locate the test sites in accordance with the agency’s specifications. Follow the“Procedure” section above to establish test sites and obtain densities using the nucleargauge.
2. Obtain a pavement core from each of the test sites according to AASHTO R 67. Thecore should be taken from the center of the nuclear gauge footprint.
Footprint of the gauge test site. Core location in the center of the footprint.
IN-PLACE DENSITY WAQTC FOP AASHTO T 355 (16)
T355_short_16.docx E&B/ID 22-6 Pub. October 2017
3. Determine the density of the cores by the FOP for AASHTO T 166, Bulk SpecificGravity of Compacted Asphalt Mixtures Using Saturated Surface Dry Specimens.
4. Calculate a correlation factor for the nuclear gauge reading as follows:
a. Calculate the difference between the core density and the average nucleargauge density at each test site to the nearest 1 kg/m3 (0.1 lb/ft3). Calculate theaverage difference and standard deviation of the differences for the entire dataset to the nearest 1 kg/m3 (0.1 lb/ft3).
b. If the standard deviation of the differences is equal to or less than 40 kg/m3
(2.5 lb/ft3), the correlation factor applied to the average nuclear gauge densityshall be the average difference calculated above in 4.a.
c. If the standard deviation of the differences is greater than 40 kg/m3 (2.5 lb/ft3),the test site with the greatest variation from the average difference shall beeliminated from the data set and the data set properties and correlation factorrecalculated following 4.a and 4.b.
d. If the standard deviation of the modified data set still exceeds the maximumspecified in 4.b, additional test sites will be eliminated from the data set andthe data set properties and correlation factor recalculated following 4.a and4.b. If the data set consists of less than five test sites, additional test sites shallbe established.
Note A1: The exact method used in calculating the nuclear gauge correlation factor shall be defined by agency policy.
Note A2: The above correlation procedure must be repeated if there is a new job mix formula. Adjustments to the job mix formula beyond tolerances established in the contract documents will constitute a new job mix formula. A correlation factor established using this procedure is only valid for the particular gauge and at the probe depth used in the correlation procedure. If another gauge is brought onto the project, it shall be correlated using the same procedure. Multiple gauges may be correlated from the same series of cores if done at the same time.
Note A3: For the purpose of this procedure, a job mix formula is defined as the percent and grade of paving asphalt used with a specified gradation of aggregate from a designated aggregate source. A new job mix formula may be required whenever compaction of the wearing surface exceeds the agency’s specified maximum density or minimum air voids.
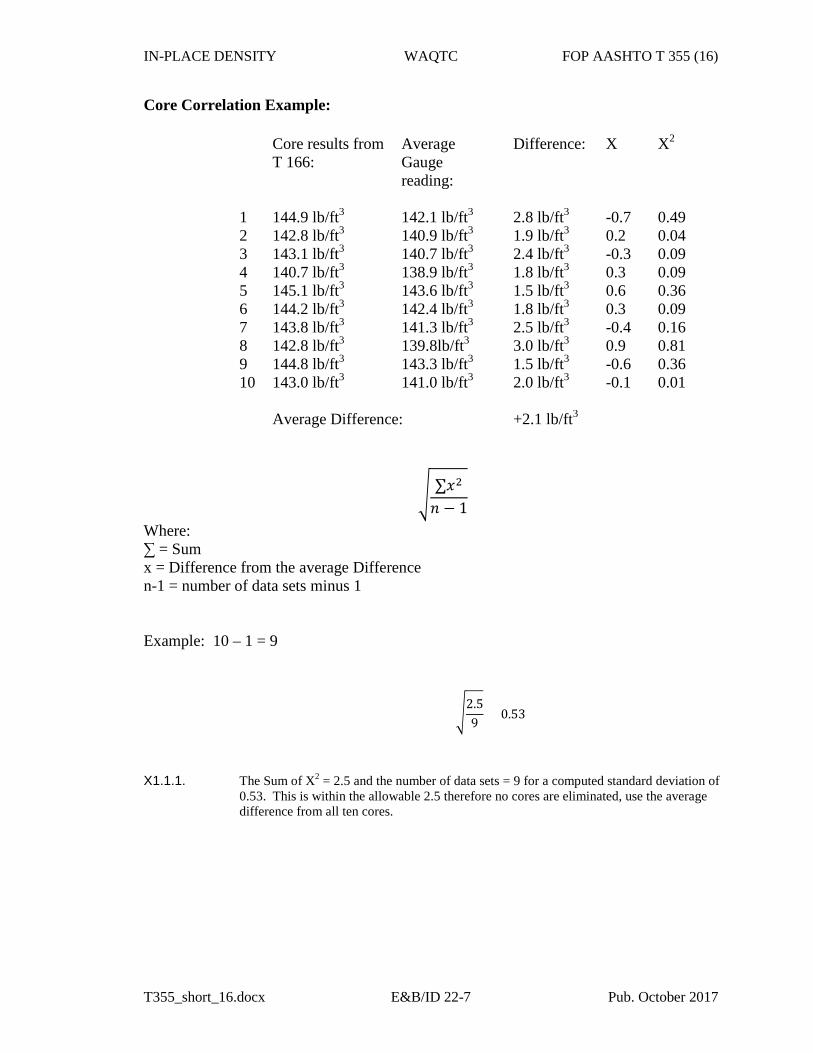
IN-PLACE DENSITY WAQTC FOP AASHTO T 355 (16)
T355_short_16.docx E&B/ID 22-7 Pub. October 2017
Core Correlation Example:
Core results from T 166:
Average Gauge reading:
Difference: X X2
1 144.9 lb/ft3 142.1 lb/ft3 2.8 lb/ft3 -0.7 0.49 2 142.8 lb/ft3 140.9 lb/ft3 1.9 lb/ft3 0.2 0.04 3 143.1 lb/ft3 140.7 lb/ft3 2.4 lb/ft3 -0.3 0.09 4 140.7 lb/ft3 138.9 lb/ft3 1.8 lb/ft3 0.3 0.09 5 145.1 lb/ft3 143.6 lb/ft3 1.5 lb/ft3 0.6 0.36 6 144.2 lb/ft3 142.4 lb/ft3 1.8 lb/ft3 0.3 0.09 7 143.8 lb/ft3 141.3 lb/ft3 2.5 lb/ft3 -0.4 0.16 8 142.8 lb/ft3 139.8lb/ft3 3.0 lb/ft3 0.9 0.81 9 144.8 lb/ft3 143.3 lb/ft3 1.5 lb/ft3 -0.6 0.36 10 143.0 lb/ft3 141.0 lb/ft3 2.0 lb/ft3 -0.1 0.01 Average Difference:
+2.1 lb/ft3
� ∑𝑥𝑥2
𝑛𝑛 − 1
Where: ∑ = Sum x = Difference from the average Difference n-1 = number of data sets minus 1 Example: 10 – 1 = 9
�2.59
= 0.53
X1.1.1. The Sum of X2 = 2.5 and the number of data sets = 9 for a computed standard deviation of 0.53. This is within the allowable 2.5 therefore no cores are eliminated, use the average difference from all ten cores.


November 30, 2015
To: All Holders of the Manual of Field Test Procedures
Section: Test Procedure AASHTO R 47
The Oregon Department of Transportation has specified method(s) for this Test Procedure. Please observe the following for our projects:
• Under Procedure, Mechanical Splitter Type A (Quartermaster) and TypeB (Riffle) are not allowed.
• Under Procedure, Incremental Method, is not allowed, use theQuartering Method or a combination of the Full Quarter and the ApexMethod may be utilized.
Kate Brown, Governor
Department of Transportation Construction Section 800 Airport Road SE
Salem, OR 97301-4792 Phone: (503) 986-3000
Fax: (503) 986-3096
ASPHALT I WAQTC FOP AASHTO R 47 (12)
R47_short_12.docx Asphalt 12-1 Pub. October 2017
REDUCING SAMPLES OF HOT MIX ASPHALT (HMA) TO TESTING SIZE FOP FOR AASHTO R 47 Scope This procedure covers sample reduction of Hot Mix Asphalt (HMA) to testing size in accordance with AASHTO R 47-14. The reduced portion is to be representative of the original sample. Apparatus • Thermostatically controlled oven capable of maintaining a temperature of at least 110°C
(230°F) or high enough to heat the material to a pliable condition for splitting. • Non-contact temperature measuring device. • Metal spatulas, trowels, metal straightedges, or drywall taping knives, or a combination
thereof; for removing HMA samples from the quartering device, cleaning surfaces used for splitting, etc.
• Square-tipped, flat-bottom scoop, shovel or trowel for mixing HMA prior to quartering. • Miscellaneous equipment including hot plate, non-asbestos heat-resistant gloves or
mittens, pans, buckets, and cans. • Sheeting: Non-stick heavy paper, heat-resistant plastic, or other material as approved by
the agency. • Agency-approved release agent, free of solvent or petroleum-based material that could
affect asphalt binder. • Mechanical Splitter Type A (Quartermaster): having four equal-width chutes discharging
into four appropriately sized sample receptacles. Splitter is to be equipped with a receiving hopper that will hold the sample until the release lever is activated with four sample receptacles of sufficient capacity to accommodate the reduced portion of the HMA sample from the mechanical splitter. Refer to AASHTO R 47, Figures 1 through 3, for configuration and required dimensions of the mechanical splitter.
• Mechanical Splitter Type B (Riffle): having a minimum of eight equal-width chutes
discharging alternately to each side with a minimum chute width of at least 50% larger than the largest particle size. A hopper or straight-edged pan with a width equal to or slightly smaller than the assembly of chutes in the riffle splitter to permit uniform discharge of the HMA through the chutes without segregation or loss of material. Sample receptacles of sufficient width and capacity to receive the reduced portions of HMA from the riffle splitter without loss of material.
ASPHALT I WAQTC FOP AASHTO R 47 (12)
R47_short_12.docx Asphalt 12-2 Pub. October 2017
• Quartering Template: formed in the shape of a cross with equal length sides at rightangles to each other. Template shall be manufactured of metal that will withstand heatand use without deforming. The sides of the quartering template should be sized so thatthe length exceeds the diameter of the flattened cone of HMA by an amount allowingcomplete separation of the quartered sample. Height of the sides must exceed thethickness of the flattened cone of HMA.
• Non-stick mixing surface that is hard, heat-resistant, clean, level, and large enough topermit HMA samples to be mixed without contamination or loss of material.
Sampling
Obtain samples according to the FOP for AASHTO T 168.
Sample Preparation
The sample must be warm enough to separate. If not, warm in an oven until it is sufficiently soft to mix and separate easily. Do not exceed either the temperature or time limits specified in the test method(s) to be performed.
Selection of Procedure (Method)
Refer to agency requirements when determining the appropriate method(s) of sample reduction. In general, the selection of a particular method to reduce a sample depends on the initial size of the sample vs. the size of the sample needed for the specific test to be performed. It is recommended that, for large amounts of material, the initial reduction be performed using a mechanical splitter. This decreases the time needed for reduction and minimizes temperature loss. Further reduction of the remaining HMA may be performed by a combination of the following methods, as approved by the agency. The methods for reduction are:
• Mechanical Splitter Method
− Type A (Quartermaster)
− Type B (Riffle Splitter)
• Quartering Method
− Full Quartering
− By Apex
• Incremental Method
ASPHALT I WAQTC FOP AASHTO R 47 (12)
R47_short_12.docx Asphalt 12-3 Pub. October 2017
Procedure
Mechanical Splitter Type A (Quartermaster)
1. Clean the splitter and apply a light coating of approved release agent to the surfaces thatwill contact HMA.
2. Close and secure hopper gates.
3. Place the four sample receptacles in the splitter so that there is no loss of material.
4. Remove the sample from the agency-approved container(s) and place in the mechanicalsplitter hopper. Avoid segregation, loss of HMA or the accidental addition of foreignmaterial.
5. Release the handle, allowing the HMA to drop through the divider chutes and dischargeinto the four receptacles.
6. Any HMA that is retained on the surface of the splitter shall be removed and placed intothe appropriate receptacle.
7. Close and secure the hopper gates.
8. Reduce the remaining HMA as needed by this method or a combination of the followingmethods as approved by the agency.
9. Combine the material contained in the receptacles from opposite corners and repeat thesplitting process until an appropriate sample size is obtained.
10. Retain and properly identify the remaining unused portion of the HMA sample for furthertesting if required by the agency.
Mechanical Splitter Type B (Riffle)
1. When heating of the testing equipment is desired, it shall be heated to a temperature notto exceed 110ºC (230ºF).
2. Clean the splitter and apply a light coating of approved release agent to the surfaces thatwill come in contact with HMA (hopper or straight-edged pan, chutes, receptacles).
3. Place two empty receptacles under the splitter.
4. Carefully empty the HMA from the agency-approved container(s) into the hopper orstraight-edged pan without loss of material. Uniformly distribute from side to side of thehopper or pan.
ASPHALT I WAQTC FOP AASHTO R 47 (12)
R47_short_12.docx Asphalt 12-4 Pub. October 2017
5. Discharge the HMA at a uniform rate, allowing it to flow freely through the chutes.
6. Any HMA that is retained on the surface of the splitter shall be removed and placed intothe appropriate receptacle.
7. Reduce the remaining HMA as needed by this method or a combination of the followingmethods as approved by the agency.
8. Using one of the two receptacles containing HMA, repeat the reduction process until theHMA contained in one of the two receptacles is the appropriate size for the required test.
9. After each split, remember to clean the splitter hopper and chute surfaces if needed.
10. Retain and properly identify the remaining unused HMA sample for further testing ifrequired by the agency.
Quartering Method
1. When heating of the testing equipment is desired, it shall be heated to a temperature notto exceed the maximum mixing temperature.
2. If needed, apply a light coating of release agent to quartering template.
3. Dump the sample from the agency approved container(s) into a conical pile on a hard,“non-stick,” clean, level surface where there will be neither a loss of material nor theaccidental addition of foreign material. The surface can be made non-stick by theapplication of an approved asphalt release agent, or sheeting.
4. Mix the material thoroughly by turning the entire sample over a minimum of four timeswith a flat-bottom scoop; or by alternately lifting each corner of the sheeting and pullingit over the sample diagonally toward the opposite corner, causing the material to berolled. Create a conical pile by either depositing each scoop or shovelful of the lastturning on top of the preceding one, or lifting both opposite corners.
5. Flatten the conical pile to a uniform diameter and thickness where the diameter is four toeight times the thickness. Make a visual observation to ensure that the material ishomogeneous.
6. Divide the flattened cone into four equal quarters using the quartering template. Press thetemplate down until it is in complete contact with the surface on which the sample hasbeen placed, assuring complete separation.Note 1: Straightedges may be used in lieu of the quartering device to completely separate the material in
approximately equal quarters.
7. Reduce the sample by quartering the sample completely or by removing the sample fromthe apex.
ASPHALT I WAQTC FOP AASHTO R 47 (12)
R47_short_12.docx Asphalt 12-5 Pub. October 2017
8. Full Quartering
8a. Remove two diagonally opposite quarters, including all of the fine material. 8b. Remove the quartering template and combine the remaining quarters, again forming
a conical pile.
8c. Repeat steps 4, 5, 6, 8a, and 8b until a sample of the required size has been obtained. The final sample must consist of the two remaining diagonally opposite quarters.
8d. Retain and properly identify the remaining unused portion of the HMA sample for
further testing if required by the agency.
9. By Apex
9a. Using a straightedge, slice through a quarter of the HMA from the center point to the outer edge of the quarter.
9b. Pull or drag the material from the quarter with two straight edges or hold one edge
of the straightedge in contact with quartering device. 9c. Remove an equal portion from the opposite quarter and combine these increments
to create the required sample size. 9d. Continue using the apex method with the unused portion of the HMA until samples
have been obtained for all required tests. 9e. Retain and properly identify the remaining unused portion of the HMA sample for
further testing if required by the agency. Incremental Method 1. Cover a hard, clean, level surface with sheeting. This surface shall be large enough that
there will be neither a loss of material nor the accidental addition of foreign material. 2. Place the sample from the agency approved container(s) into a conical pile on that
surface. 3. Mix the material thoroughly by turning the entire sample over a minimum of four times
with a flat-bottom scoop; or by alternately lifting each corner of the sheeting and pulling it over the sample diagonally toward the opposite corner, causing the material to be rolled. Create a conical pile by either depositing each scoop or shovelful of the last turning on top of the preceding one, or lifting both opposite corners.
ASPHALT I WAQTC FOP AASHTO R 47 (12)
R47_short_12.docx Asphalt 12-6 Pub. October 2017
4. Grasp the sheeting and roll the conical pile into a cylinder (loaf), then flatten the top.Make a visual observation to determine that the material is homogenous.
5. Pull the sheeting so at least ¼ of the length of the loaf is off the edge of the counter.Allow this material to drop into a container to be saved. As an alternate, using astraightedge, slice off approximately ¼ of the length of the loaf and place in a containerto be saved.
6. Pull material off the edge of the counter and drop into an appropriate size sample pan orcontainer for the test to be performed. Continue removing material from the loaf until theproper size sample has been acquired. As an alternate, using a straightedge, slice off anappropriate size sample from the length of the loaf and place in a sample pan orcontainer.
7. Repeat step 6 until all the samples for testing have been obtained.Note2: When reducing the sample to test size it is advisable to take several small increments, determining
the mass each time until the proper minimum size is achieved. Unless the sample size is grossly in excess of the minimum or exceeds the maximum test size, use the sample as reduced for the test.
8. Retain and properly identify the remaining unused portion of the HMA sample for furthertesting if required by the agency.

November 30, 2015
To: All Holders of the Manual of Field Test Procedures
Section: Test Procedure AASHTO R 66
The Oregon Department of Transportation has specified method(s) for this Test Procedure. Please observe the following for our projects:
• Under Procedure, step 3 first bullet, delete the following from thesentence: “or from the delivery truck”. Sampling from the oil deliverytruck is not allowed.
• Sample asphalt binder at the plant using an in-line sampling device orsamples may be obtained from the storage tank, according to AASHTOR 66-15 procedure, section 7.1.1 and 7.2, when mechanical or othercircumstances temporarily prohibit the use of the in-line device.Sampling from the storage tank is only permitted to complete theproduction shift.
Kate Brown, Governor
Department of Transportation Construction Section 800 Airport Road SE
Salem, OR 97301-4792 Phone: (503) 986-3000
Fax: (503) 986-3096
ASPHALT I WAQTC FOP AASHTO R 66 (16)
R66_short_16.docx Asphalt 17-1 Pub. October 2017
SAMPLING ASPHALT MATERIALS FOP FOR AASHTO R 66
Scope
This procedure covers obtaining samples of liquid asphalt materials in accordance with AASHTO R 66-16. Sampling of solid and semi-solid asphalt materials – included in AASHTO R 66 – is not covered here.
Agencies may be more specific on exactly who samples, where to sample, and what type of sampling device to use.
Warning: Always use appropriate safety equipment and precautions for hot liquids.
Terminology
• Asphalt binder: Asphalt cement or modified asphalt cement that binds the aggregateparticles into a dense mass.
• Asphalt emulsion: A mixture of asphalt binder and water.
• Cutback asphalt: Asphalt binder that has been modified by blending with a chemicalsolvent.
Procedure
1. Coordinate sampling with contractor or supplier.
2. Allow a minimum of 4 L (1 gal) to flow before obtaining a sample(s).
3. Obtain samples of:
• Asphalt binder from the line between the storage tank and the mixing plant while theplant is in operation, or from the delivery truck.
• Cutback and emulsified asphalt from distributor spray bar or application device;or from the delivery truck before it is pumped into the distributor. Sample emulsifiedasphalt at delivery or prior to dilution.
Containers
Sample containers must be new and the inside may not be washed or rinsed. The outside may be wiped with a clean, dry cloth.
All samples shall be put in 1 L (1 qt) containers and properly identified on the outside of the container with contract number, date sampled, data sheet number, brand and grade of material, and sample number. Include lot and sublot numbers when appropriate.
ASPHALT I WAQTC FOP AASHTO R 66 (16)
R66_short_16.docx Asphalt 17-2 Pub. October 2017
• Emulsified asphalt: Use wide-mouth plastic jars with screw caps. Protect the samples from freezing since water is a part of the emulsion. The sample container should be completely filled to minimize a skin formation on the sample.
• Asphalt binder and cutbacks: Use metal cans. Note: The sample container shall not be submerged in solvent, nor shall it be wiped with a solvent saturated
cloth. If cleaning is necessary, use a clean dry cloth.
Report
• On forms approved by the agency
• Sample ID
• Date
• Time
• Location
• Quantity represented


Test Procedure AASHTO R 67 Continued
Under the Layer Separation Section 6, delete 6.1 and replace with the following:
Separate the layer of HMAC to be tested from the remainder of each core with a saw. If a clean separation of the desired layer thickness occurs during core removal, sawing of specimen is not necessary. During separation the layer to be tested may be damaged, so use caution during this process.

November 30, 2015
To: All Holders of the Manual of Field Test Procedures
Section: Test Procedure AASHTO R 67
The Oregon Department of Transportation has specified method(s) for this Test Procedure. Please observe the following for our projects:
Under the Apparatus Section 3, change or modify as follows:
• Section 3.2, Core Drill Bit, the core barrel shall have an insidediameter of (6 ± 0.25 in.).
• Section 3.3, Separation Equipment, delete and replace with thefollowing:
Cores lift shall be separated with a saw that provides a clean smoothplane representing the layer to be measured.
• Section 3.4, Retrieval Device – Removal with a screw driver(s) orsimilar device shall not be allowed.
Under the Filling Core Holes Section 4.8, delete and replace with the following:
The Hole made from the coring operation shall be filled with fast setting non-shrink grout from the QPL (Qualified Products List). Set time shall be less than 20 minutes. Ensure that the final surface is level with the surrounding surface.
(See Next Page)
Kate Brown, Governor
Department of Transportation Construction Section 800 Airport Road SE
Salem, OR 97301-4792 Phone: (503) 986-3000
Fax: (503) 986-3096

Sampling Asphalt Mixtures after Compaction(Obtaining Cores)
AASHTO Designation: R 67-16
AASHTO TEST METHODS CANNOT BE INCLUDED ON ODOT’S WEBSITE DUE TO COPYRIGHT INFRINGEMENT.
TO GET COPIES OF THE TEST METHODS, YOU CAN ORDER A HARD COPY OF ODOT’S MANUAL OF FIELD TEST PROCEDURES OR YOU CAN ORDER THE LATEST STANDARD SPECIFICATIONS FOR TRANSPORTATION MATERIALS AND METHODS OF SAMPLING AND TESTING FROM AASHTO. ORDERING INSTRUCTIONS ARE GIVEN BELOW:
To order ODOT’s Manual of Field Test Procedures, use the following web address: http://www.oregon.gov/ODOT/Construction/Pages/Manual-of-Field-Test-Procedures.aspx
To order AASHTO’s Standard Specifications for Transportation Materials and Methods of Sampling and Testing, use the following web address: https://bookstore.transportation.org/


November 30, 2016 To: All Holders of the Manual of Field Test Procedures Section: Test Procedure AASHTO R 75 The Oregon Department of Transportation has specified method(s) for this Test Procedure. Please observe the following for our projects: • Supplemental information for Family of Curves Development, Appendix A, is
located at the end of R 75.
Kate Brown, Governor
Department of Transportation Construction Section 800 Airport Road SE
Salem, OR 97301-4792 Phone: (503) 986-3000
Fax: (503) 986-3096
EMBANKMENT AND BASE WAQTC FOP AASHTO R 75 (16) IN-PLACE DENSITY
R75_short_16.docx E&B/ID 15-1 Pub. October 2016
DEVELOPING A FAMILY OF CURVES FOP FOR AASHTO R 75 Scope
This procedure provides a method to develop a family of curves in accordance with AASHTO R 75-16 using multiple moisture density relationships developed using the same method, A, B, C, or D, from the FOP for AASHTO T 99/T 180. All curves used in a family must be developed using a single Method: A, B, C, or D of a procedure for AASHTO T 99 or T 180. See the FOP for AASHTO T 99/T 180. Terminology
family of curves — a group of soil moisture-density relationships (curves) determined using AASHTO T 99 or T 180, which reveal certain similarities and trends characteristic of the soil type and source. spine — smooth line extending through the point of maximum density/optimum moisture content of a family of moisture-density curves. Procedure
1. Sort the curves by Method (A, B, C, or D of the FOP for T 99/T 180). At least three curves are required per family.
2. Select the highest and lowest maximum dry densities from those selected to assist in
determining the desired scale of the subsequent graph. 3. Plot the maximum density and optimum moisture points of the selected curves on the
graph. 4. Draw a smooth, “best fit,” curved line through the points creating the spine of the family
of curves. 5. Remove maximum density and optimum moisture points that were not used to establish
the spine. 6. Add the moisture/density curves associated with the points that were used to establish the
spine. It is not necessary to include the portion of the curves over optimum moisture. Note 1—Intermediate template curves using slopes similar to those of the original moisture-density curves may
be included when maximum density points are more than 2.0 lb/ft3 apart. Template curves are indicated by a dashed line.
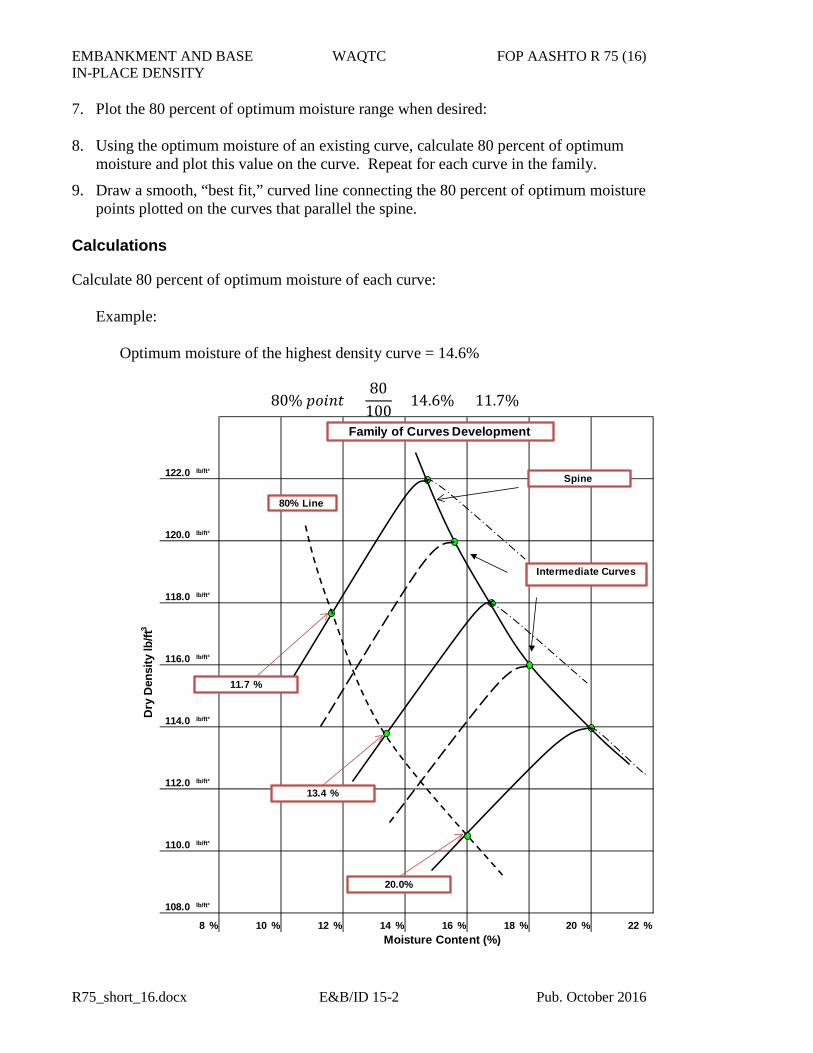
EMBANKMENT AND BASE WAQTC FOP AASHTO R 75 (16) IN-PLACE DENSITY
R75_short_16.docx E&B/ID 15-2 Pub. October 2016
7. Plot the 80 percent of optimum moisture range when desired: 8. Using the optimum moisture of an existing curve, calculate 80 percent of optimum
moisture and plot this value on the curve. Repeat for each curve in the family.
9. Draw a smooth, “best fit,” curved line connecting the 80 percent of optimum moisture points plotted on the curves that parallel the spine.
Calculations
Calculate 80 percent of optimum moisture of each curve:
Example: Optimum moisture of the highest density curve = 14.6%
80% 𝑝𝑝𝑝𝑝𝑝𝑝𝑝𝑝𝑝𝑝 =80
100× 14.6% = 11.7%
x
x
x
x
x
Dry
Den
sity
lb/ft
3
Moisture Content (%)% %%% 18
lb/ft³
lb/ft³
lb/ft³
112.0
114.0
1412% % %
lb/ft³
lb/ft³
108
108.0
110.0
16 22%20
122.0
116.0
118.0
120.0
lb/ft³
lb/ft³
lb/ft³
80% Line
Family of Curves Development
Intermediate Curves
Spine
11.7 %
13.4 %
20.0%
EMBANKMENT AND BASE ODOT APPENDIX “A” R 75 IN-PLACE DENSITY
Appendix R 75 1 November 2016
FAMILY OF CURVES – DEVELOPMENT APPENDIX “A” FOP FOR AASHTO R 75 Significance The purpose of the family of curves is to represent the average moisture-density characteristics of soils with similar geologic makeup. The family should be based on moisture-density relationships which represent the widest possible range of soils which may be encountered on a project. If the soil types have moisture-density relationships that differ considerably and can not be represented on one general family of curves; then multiple families may be developed. Also, moisture-density relationships for material of widely varying geologic origins should be carefully examined to determine if separate families are required. Soils sampled from one source will have many different moisture-density relationships. If a group of these curves are plotted together, it reveals similarities of the material in relation to the soil type and source. Developing a family of curves has the potential advantage of spanning a large number of different soil types with a minimal amount of laboratory work. Scope This procedure provides a process for developing a family of curves using multiple individual curves as the source of data. The individual curves are sorted according to type and plotted on a single sheet of paper. The individual curves are connected by a common line drawn through their maximum density/optimum moisture points forming a family of curves. A series of individual curves or a combination of curves are utilized as appropriate to create one or more families. This procedure is related to AASHTO T 99, and AASHTO T 180. The family of curves must match the method utilized during the single curve development. A minimum of 3 individual curves is required to form a single family. Apparatus See the FOP for AASHTO T 99 and T 180. Sample See the FOP for AASHTO T 99 and T 180. Procedure See the FOP for AASHTO T 99 and T 180. Calculations See the FOP for AASHTO T 99 and T 180.
EMBANKMENT AND BASE ODOT APPENDIX “A” R 75 IN-PLACE DENSITY
Appendix R 75 2 November 2016
Overview
• Sort the individual curves into groups based on method of development. • Plot the point representing the maximum density and optimum moisture for each
individual curve on a single sheet of graph paper. At least 3 curves are required to develop a family.
• Draw a “best fit” smooth curve which closely connects all points. • At 2.0 lbs/ft3 increments draw complete moisture-density relationships using
slopes closely matching those of the original moisture-density relationships. • When a large number of similar single curves exists, the average values maybe
used, if the difference between curves is less than 2.0 lbs/ft3. Developing a Family of Curves Relationship 1. Initially sort candidate curves by test method and use only those developed using
the same procedure.
2. Review the curves and select the highest and lowest maximum dry densities. Select a vertical density scale that places the highest value in the top 1” portion of the graph. Select a dry density increment that places the lowest value approximately 3” from the bottom portion of the graph. Label the incremental areas between the highest and lowest maximum density values. Note 1: An increment of 2.0 lbs/ft3 per vertical inch is a recommended scale, but any increment can be used to accommodate the data plotting. It is preferable to use a scale that places whole numbers at the bold one-inch gridlines on the graph.
3. Review the corresponding optimum moisture data for the upper and lower points used to establish the vertical dry density scale described in step 2. Select a horizontal moisture scale that places the high point about 3” from the left edge and the low point about 1” from the right edge of the graph. Label the incremental grids between the highest and lowest optimum moisture values. Note 2: An increment of 2.0% per horizontal inch is a recommended scale, but any increment can be used to accommodate the data plotting. It is preferable to use a scale that places the whole numbers at the bold one-inch gridlines on the graph.
4. Plot the maximum density and optimum moisture for each candidate curve to determine if they fit the desired pattern of a smooth curve that is slightly concave up and to the left. Eliminate points which do not fit this pattern. A minimum of three points is required to establish a family.
5. Draw a smooth “best fit” curve through the points, creating a curve that is slightly
concave, up and to the left.
EMBANKMENT AND BASE ODOT APPENDIX “A” R 75 IN-PLACE DENSITY
Appendix R 75 3 November 2016
Note 3: The “best fit” curve (or spine) now defines the maximum density and optimum moisture content of the soils represented by this family of curves. A dry density or dry side, reference needs to be established for each individual curve and is created by replicating the original curve shape. Each individual curve has a unique shape towards the maximum density/optimum moisture point and needs to be plotted. This can be accomplished with tracing paper, a French curve or other objects that can mimic the shape. The only useable area on a family of curves is on the “dry” side of optimum moisture, therefore, we only need to apply one half of the moisture-density curve shape configuration to the family of curves spine.
6. Mark each maximum density/optimum moisture point with a dry side arc of sufficient
length to meet the dry side leg. This is accomplished by centering the template directly below and touching the maximum density/optimum moisture point. Initially mark lightly in pencil. The exact length of the arc will be determined when the dry side leg is drawn in tangent to this arc. This process is repeated for each original curve. Note 4: To establish the “dry side” slope a single point near the bottom of the original curve is required. This point, when plotted, will be connected with the tangent on the arc using a straight line. This will complete the original individual curve or the dry half of the original curve. If the scale of the original curve is the same as the family then you should be able to overlay the family with the original curve and when held to the light, the “dry sides” should match. The point selected on the dry side must accurately reflect the slope of the original curve if another scale is utilized. The point selected may be a data point from the original curve or it may be a point scaled off of the graph of the original curve. This process is repeated for each original curve.
7. Establish the 80% of Optimum Moisture Line at the bottom of the “dry side” legs.
This provides a graphical guide for the Density Technician when using the family of curves in the field. Compute 80% of optimum moisture for each curve by multiplying the optimum moisture by 0.8. Lay a ruler vertically on the graph and at the 80% of optimum moisture calculated, make a tick mark where the ruler intercepts the “dry side” leg of that curve. This process is repeated for each original curve. Draw a smooth best-fit curve through the tick marks and label each end of the line with 80%.
8. At 2.0 lbs/ft3 increments draw moisture-density relationships using slopes similar to
those of the original moisture-density relationships.
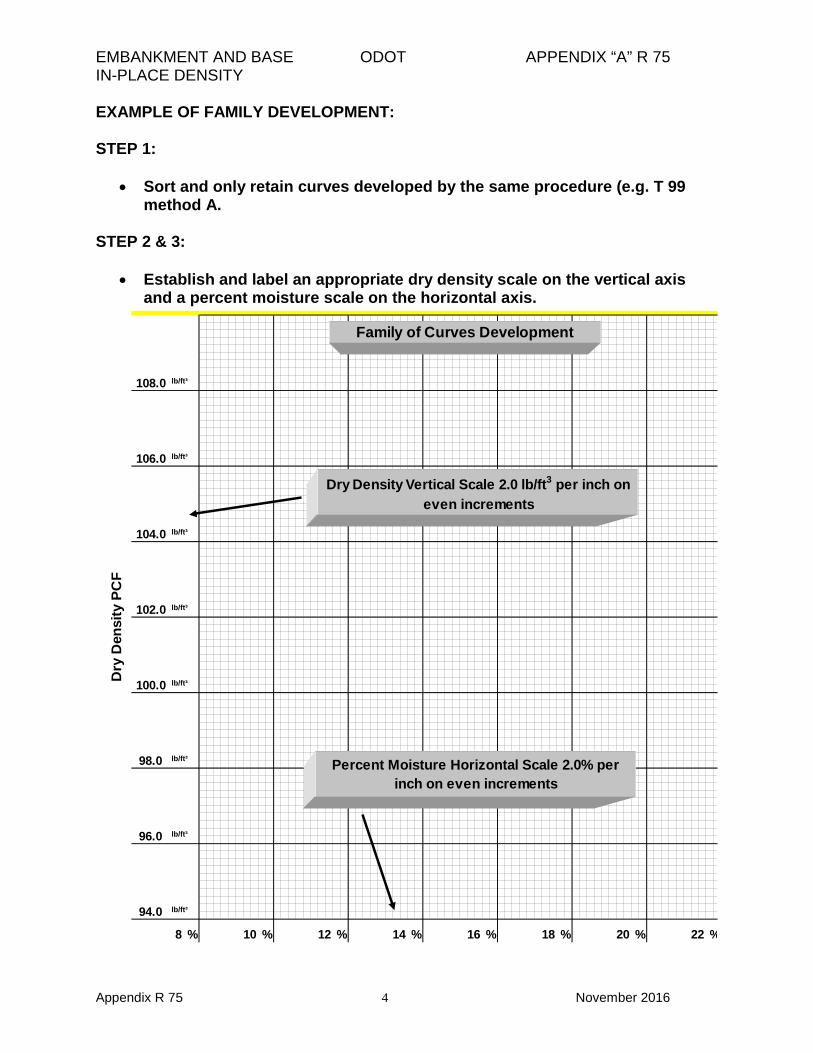
EMBANKMENT AND BASE ODOT APPENDIX “A” R 75 IN-PLACE DENSITY
Appendix R 75 4 November 2016
EXAMPLE OF FAMILY DEVELOPMENT: STEP 1:
• Sort and only retain curves developed by the same procedure (e.g. T 99 method A.
STEP 2 & 3:
• Establish and label an appropriate dry density scale on the vertical axis and a percent moisture scale on the horizontal axis.
x
x
x
x
x
x
1412 22%
Dry
Den
sity
PC
F
% %%% 1816 %
lb/ft³
lb/ft³
108
94.0
96.0
% % 20
lb/ft³
lb/ft³
lb/ft³
lb/ft³
108.0
102.0
104.0
106.0
98.0
100.0 lb/ft³
lb/ft³
Dry Density Vertical Scale 2.0 lb/ft3 per inch on even increments
Percent Moisture Horizontal Scale 2.0% per inch on even increments
Family of Curves Development
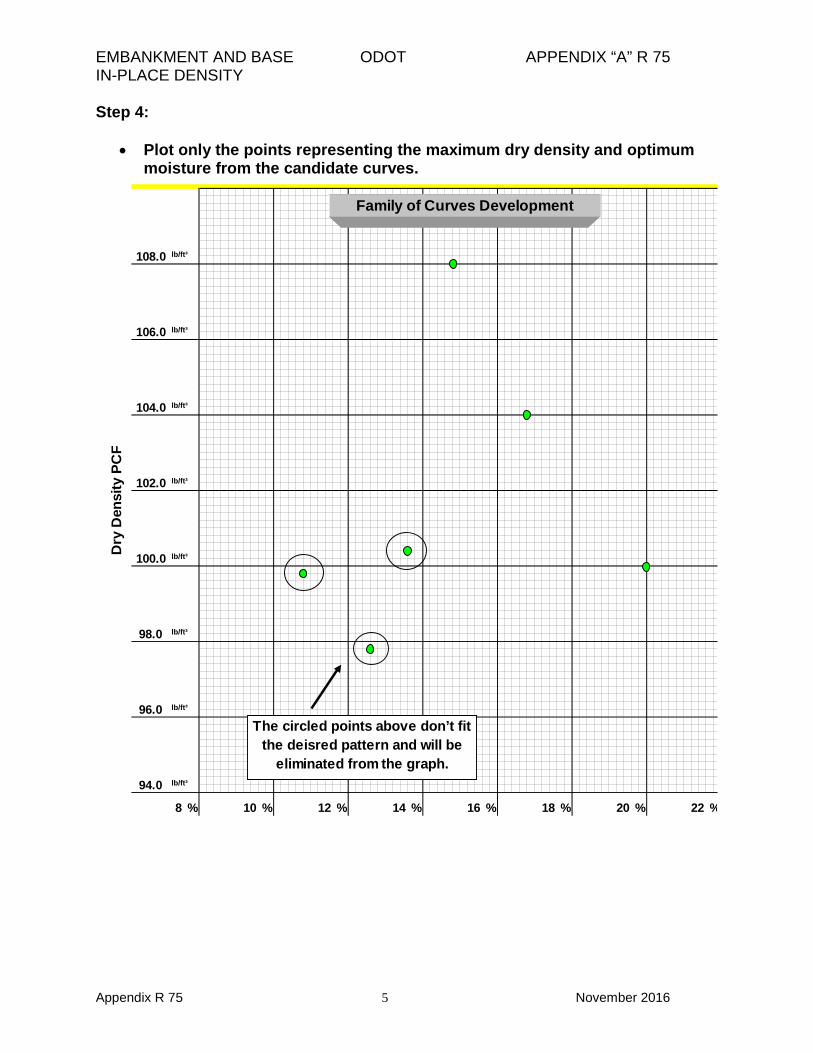
EMBANKMENT AND BASE ODOT APPENDIX “A” R 75 IN-PLACE DENSITY
Appendix R 75 5 November 2016
Step 4:
• Plot only the points representing the maximum dry density and optimum moisture from the candidate curves.
x
x
x
x
x
x
1412 22%
Dry
Den
sity
PC
F
% %%% 1816
98.0
100.0
%
lb/ft³
lb/ft³
108
94.0
96.0
% % 20
lb/ft³
lb/ft³
lb/ft³
lb/ft³
lb/ft³
lb/ft³
108.0
102.0
104.0
106.0
Family of Curves Development
The circled points above don’t fit the deisred pattern and will be
eliminated from the graph.
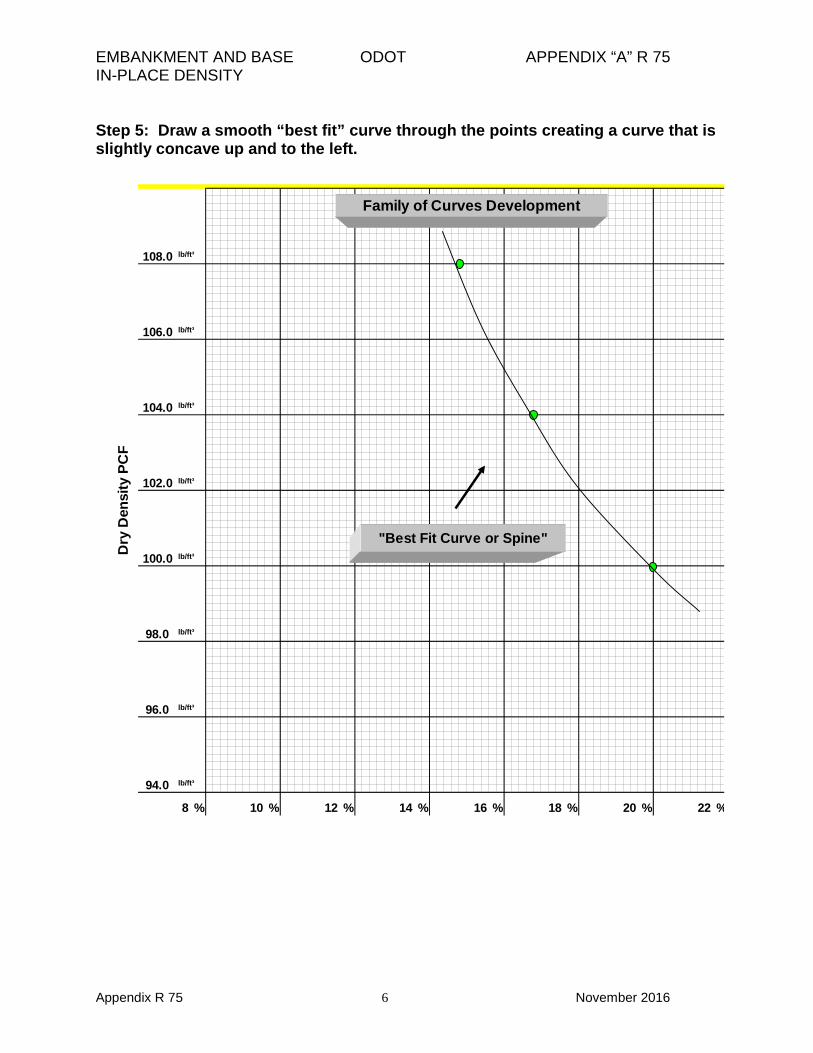
EMBANKMENT AND BASE ODOT APPENDIX “A” R 75 IN-PLACE DENSITY
Appendix R 75 6 November 2016
Step 5: Draw a smooth “best fit” curve through the points creating a curve that is slightly concave up and to the left.
x
x
x
x
x
x
1412 22%
Dry
Den
sity
PC
F
% %%% 1816
98.0
100.0
%
lb/ft³
lb/ft³
108
94.0
96.0
% % 20
lb/ft³
lb/ft³
lb/ft³
lb/ft³
lb/ft³
lb/ft³
108.0
102.0
104.0
106.0
Family of Curves Development
"Best Fit Curve or Spine"
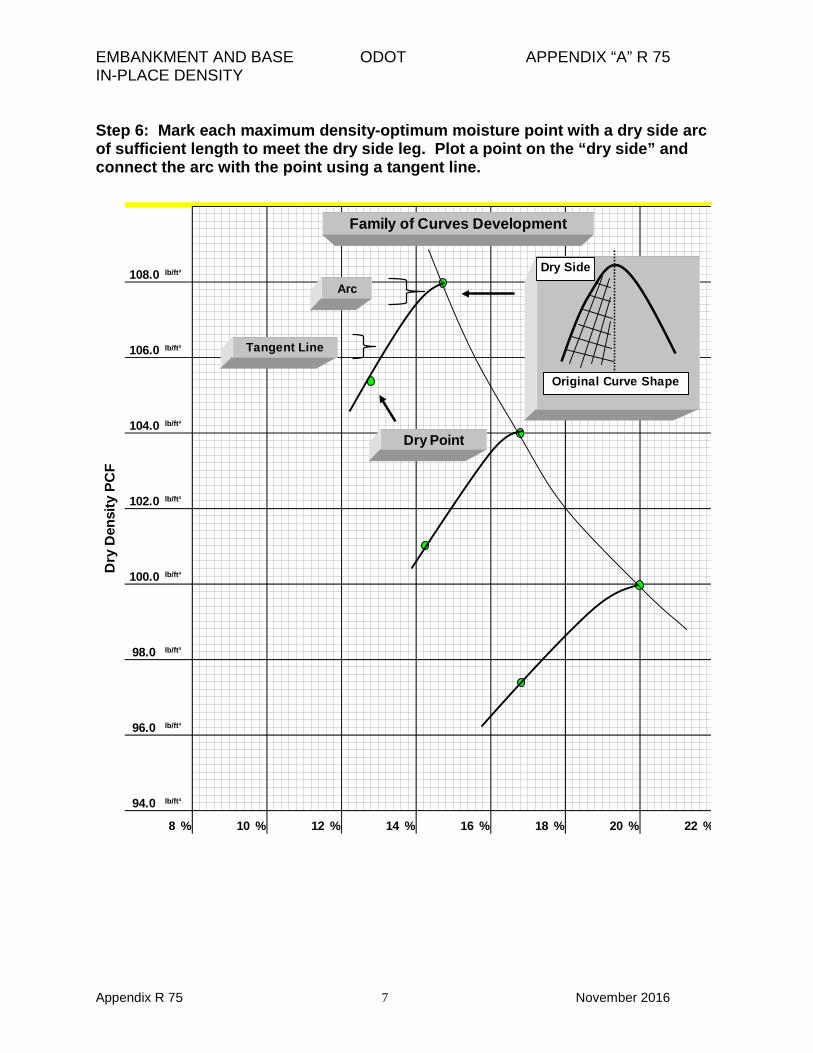
EMBANKMENT AND BASE ODOT APPENDIX “A” R 75 IN-PLACE DENSITY
Appendix R 75 7 November 2016
Step 6: Mark each maximum density-optimum moisture point with a dry side arc of sufficient length to meet the dry side leg. Plot a point on the “dry side” and connect the arc with the point using a tangent line.
x
x
x
x
x
x
1412 22%
Dry
Den
sity
PC
F
% %%% 1816
98.0
100.0
%
lb/ft³
lb/ft³
108
94.0
96.0
% % 20
lb/ft³
lb/ft³
lb/ft³
lb/ft³
lb/ft³
lb/ft³
108.0
102.0
104.0
106.0
Family of Curves Development
Dry Point
Original Curve Shape
Dry Side
Arc
Tangent Line
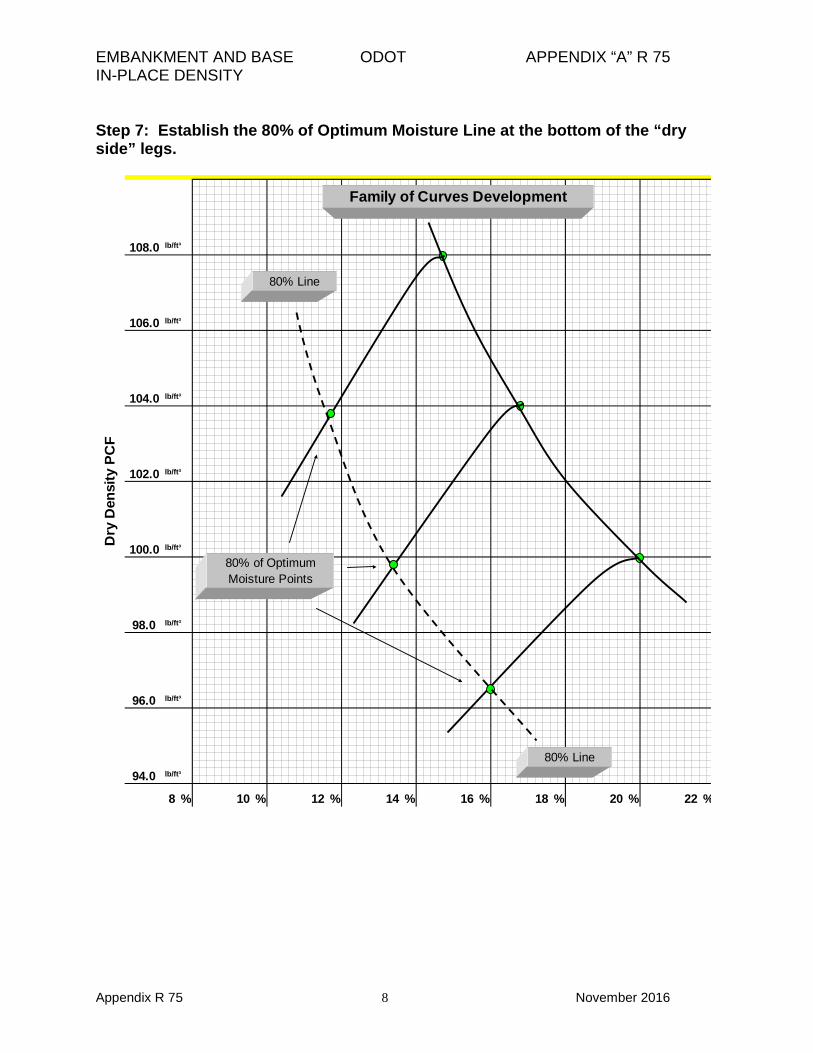
EMBANKMENT AND BASE ODOT APPENDIX “A” R 75 IN-PLACE DENSITY
Appendix R 75 8 November 2016
Step 7: Establish the 80% of Optimum Moisture Line at the bottom of the “dry side” legs. Step 8: At 2.0 lbs/ft3 increments draw moisture-density relationships using slopes similar to those of the original moisture-density relationships.
x
x
x
x
x
x
108.0
102.0
104.0
106.0
lb/ft³
lb/ft³
lb/ft³
lb/ft³
lb/ft³
lb/ft³
%
lb/ft³
lb/ft³
108
94.0
96.0
% % 20
Dry
Den
sity
PC
F
% %%% 1816
98.0
100.0
1412 22%
Family of Curves Development
80% Line
80% Line
80% of Optimum Moisture Points
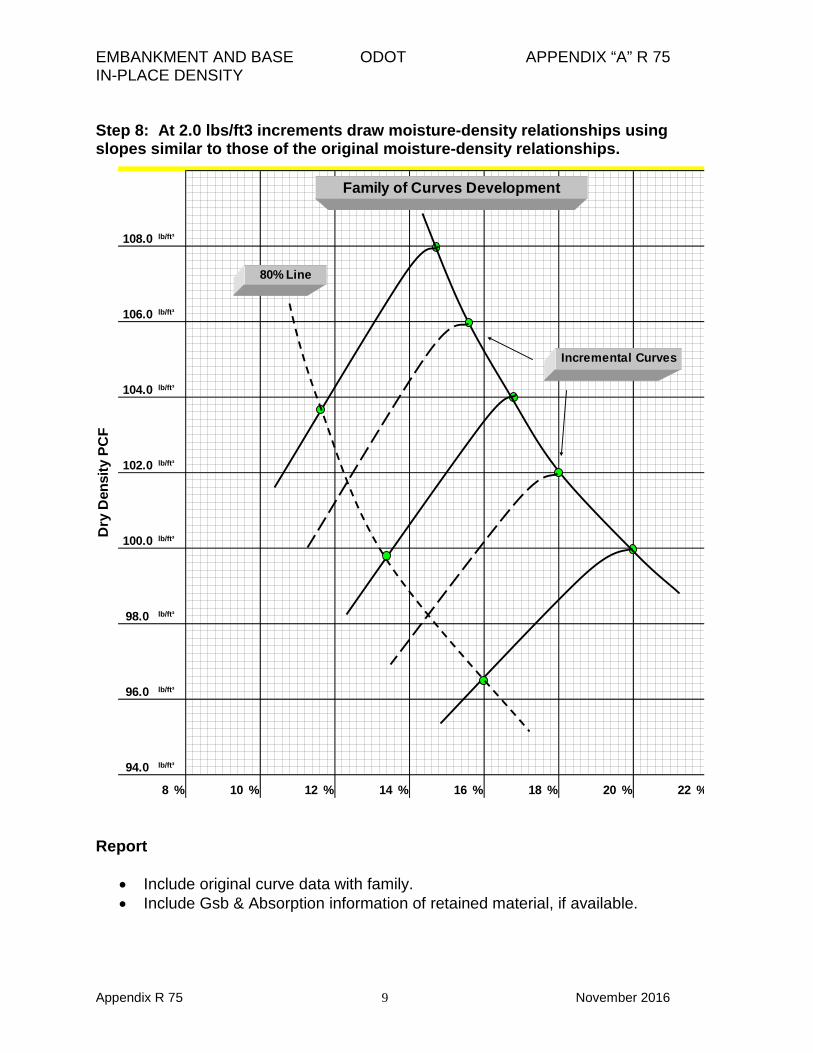
EMBANKMENT AND BASE ODOT APPENDIX “A” R 75 IN-PLACE DENSITY
Appendix R 75 9 November 2016
Step 8: At 2.0 lbs/ft3 increments draw moisture-density relationships using slopes similar to those of the original moisture-density relationships. Report
• Include original curve data with family. • Include Gsb & Absorption information of retained material, if available.
x
x
x
x
x
x
108.0
102.0
104.0
106.0
lb/ft³
lb/ft³
lb/ft³
lb/ft³
lb/ft³
lb/ft³
%
lb/ft³
lb/ft³
108
94.0
96.0
% % 20
Dry
Den
sity
PC
F
% %%% 1816
98.0
100.0
1412 22%
Family of Curves Development
80% Line
Incremental Curves


November 30, 2016 To: All Holders of the Manual of Field Test Procedures Section: Test Procedure AASHTO R 76 The Oregon Department of Transportation has specified method(s) for this Test Procedure. Please observe the following for our projects:
• Delete the Method Selection section and replace with the following
Samples of FA which are drier than the saturated surface dry (SSD) condition shall be reduced by a mechanical splitter according to Method A. As a quick determination, if the fine aggregate will retain its shape when molded with the hand, it is wetter than SSD.
Samples of FA that are at SSD or wetter than SSD shall be reduced by Method B, or the entire sample may be dried to the SSD condition – using temperatures that do not exceed those specified for any of the tests contemplated – and then reduced to test sample size using Method A.
Samples of CA or mixtures of FA and CA may be reduced by either method. Method A is not recommended for FA / CA mixtures that adhere to the apparatus.
Kate Brown, Governor
Department of Transportation Construction Section 800 Airport Road SE
Salem, OR 97301-4792 Phone: (503) 986-3000
Fax: (503) 986-3096
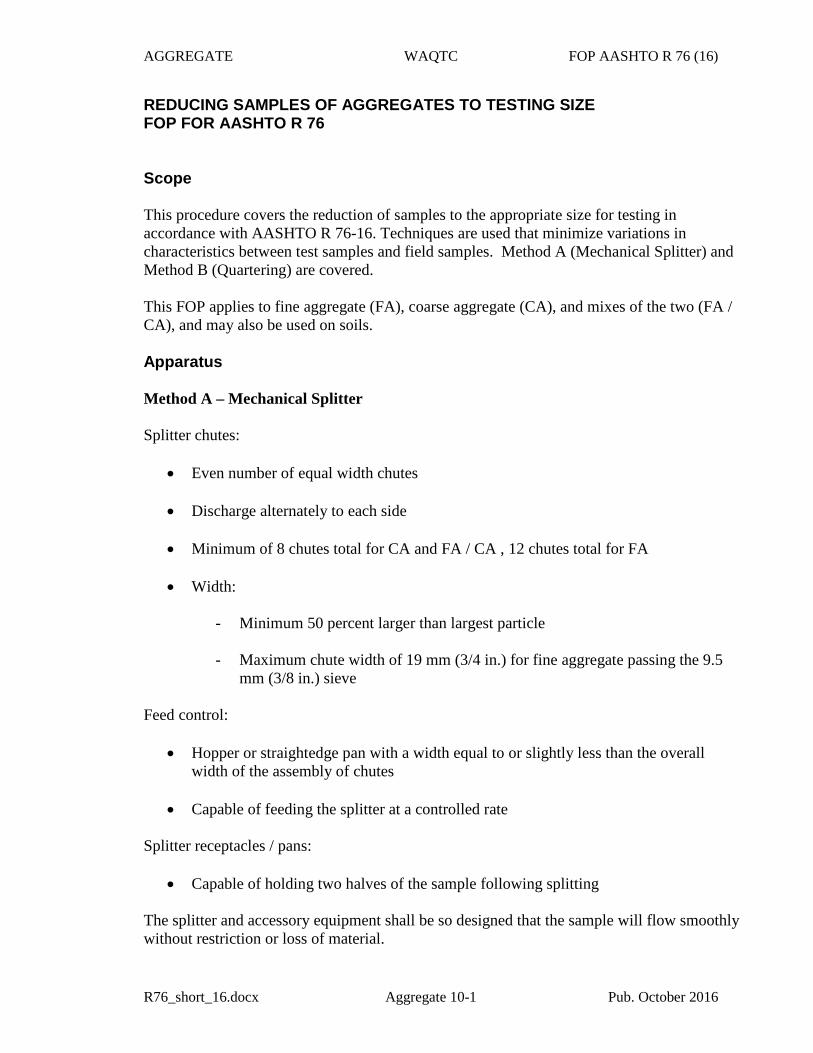
AGGREGATE WAQTC FOP AASHTO R 76 (16)
R76_short_16.docx Aggregate 10-1 Pub. October 2016
REDUCING SAMPLES OF AGGREGATES TO TESTING SIZE FOP FOR AASHTO R 76 Scope This procedure covers the reduction of samples to the appropriate size for testing in accordance with AASHTO R 76-16. Techniques are used that minimize variations in characteristics between test samples and field samples. Method A (Mechanical Splitter) and Method B (Quartering) are covered. This FOP applies to fine aggregate (FA), coarse aggregate (CA), and mixes of the two (FA / CA), and may also be used on soils. Apparatus Method A – Mechanical Splitter Splitter chutes:
• Even number of equal width chutes • Discharge alternately to each side • Minimum of 8 chutes total for CA and FA / CA , 12 chutes total for FA • Width:
- Minimum 50 percent larger than largest particle - Maximum chute width of 19 mm (3/4 in.) for fine aggregate passing the 9.5
mm (3/8 in.) sieve
Feed control:
• Hopper or straightedge pan with a width equal to or slightly less than the overall width of the assembly of chutes
• Capable of feeding the splitter at a controlled rate
Splitter receptacles / pans:
• Capable of holding two halves of the sample following splitting
The splitter and accessory equipment shall be so designed that the sample will flow smoothly without restriction or loss of material.
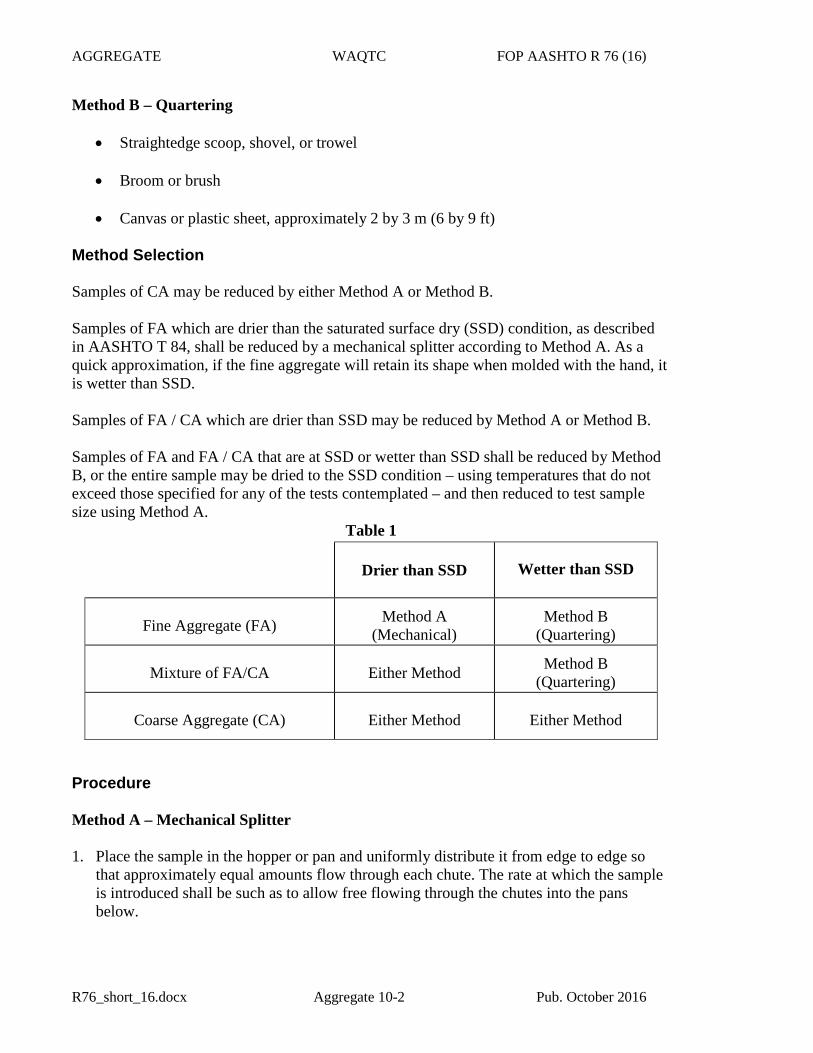
AGGREGATE WAQTC FOP AASHTO R 76 (16)
R76_short_16.docx Aggregate 10-2 Pub. October 2016
Method B – Quartering
• Straightedge scoop, shovel, or trowel • Broom or brush • Canvas or plastic sheet, approximately 2 by 3 m (6 by 9 ft)
Method Selection Samples of CA may be reduced by either Method A or Method B. Samples of FA which are drier than the saturated surface dry (SSD) condition, as described in AASHTO T 84, shall be reduced by a mechanical splitter according to Method A. As a quick approximation, if the fine aggregate will retain its shape when molded with the hand, it is wetter than SSD. Samples of FA / CA which are drier than SSD may be reduced by Method A or Method B. Samples of FA and FA / CA that are at SSD or wetter than SSD shall be reduced by Method B, or the entire sample may be dried to the SSD condition – using temperatures that do not exceed those specified for any of the tests contemplated – and then reduced to test sample size using Method A.
Table 1
Drier than SSD Wetter than SSD
Fine Aggregate (FA) Method A (Mechanical)
Method B (Quartering)
Mixture of FA/CA Either Method Method B (Quartering)
Coarse Aggregate (CA) Either Method Either Method
Procedure Method A – Mechanical Splitter 1. Place the sample in the hopper or pan and uniformly distribute it from edge to edge so
that approximately equal amounts flow through each chute. The rate at which the sample is introduced shall be such as to allow free flowing through the chutes into the pans below.
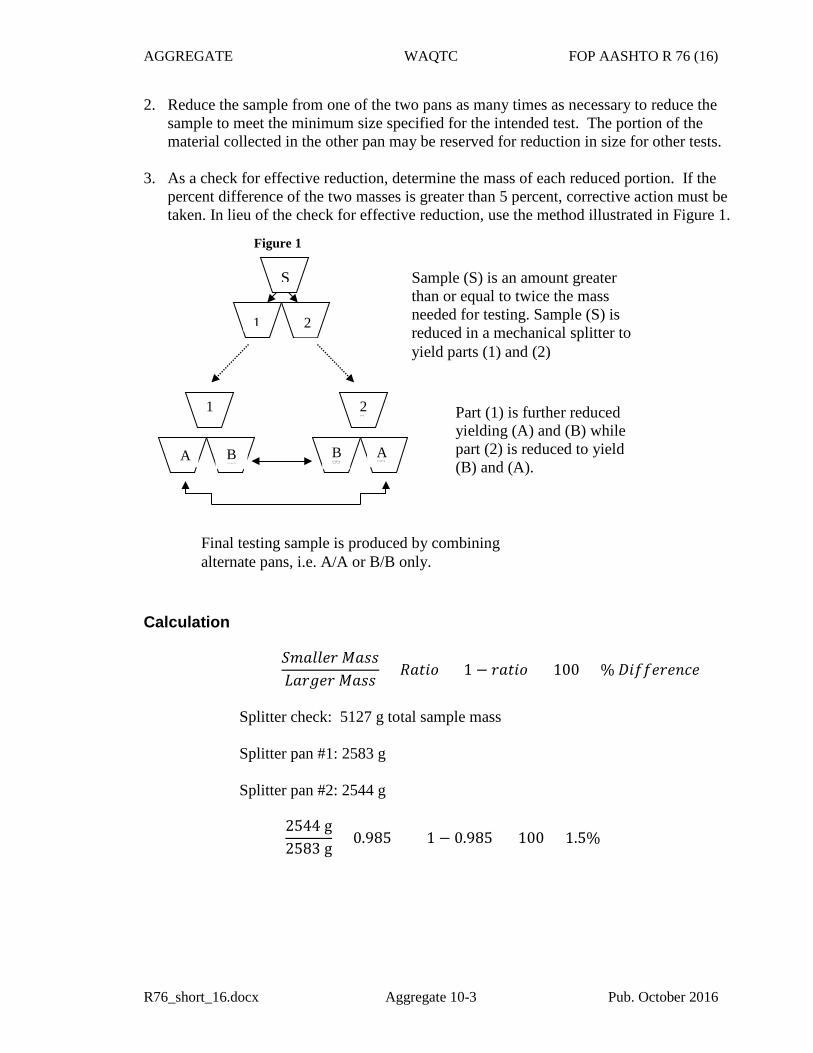
AGGREGATE WAQTC FOP AASHTO R 76 (16)
R76_short_16.docx Aggregate 10-3 Pub. October 2016
2. Reduce the sample from one of the two pans as many times as necessary to reduce the sample to meet the minimum size specified for the intended test. The portion of the material collected in the other pan may be reserved for reduction in size for other tests.
3. As a check for effective reduction, determine the mass of each reduced portion. If the
percent difference of the two masses is greater than 5 percent, corrective action must be taken. In lieu of the check for effective reduction, use the method illustrated in Figure 1.
Calculation
𝑆𝑆𝑆𝑆𝑆𝑆𝑆𝑆𝑆𝑆𝑆𝑆𝑆𝑆 𝑀𝑀𝑆𝑆𝑀𝑀𝑀𝑀𝐿𝐿𝑆𝑆𝑆𝑆𝐿𝐿𝑆𝑆𝑆𝑆 𝑀𝑀𝑆𝑆𝑀𝑀𝑀𝑀
= 𝑅𝑅𝑆𝑆𝑅𝑅𝑅𝑅𝑅𝑅 (1 − 𝑆𝑆𝑆𝑆𝑅𝑅𝑅𝑅𝑅𝑅) × 100 = % 𝐷𝐷𝑅𝑅𝐷𝐷𝐷𝐷𝑆𝑆𝑆𝑆𝑆𝑆𝐷𝐷𝐷𝐷𝑆𝑆
Splitter check: 5127 g total sample mass Splitter pan #1: 2583 g Splitter pan #2: 2544 g
2544 g2583 g
= 0.985 (1 − 0.985) × 100 = 1.5%
Figure 1
Sample (S) is an amount greater than or equal to twice the mass needed for testing. Sample (S) is reduced in a mechanical splitter to yield parts (1) and (2)
2
1
S
B
A
1
A
B
2
Part (1) is further reduced yielding (A) and (B) while part (2) is reduced to yield (B) and (A).
Final testing sample is produced by combining alternate pans, i.e. A/A or B/B only.
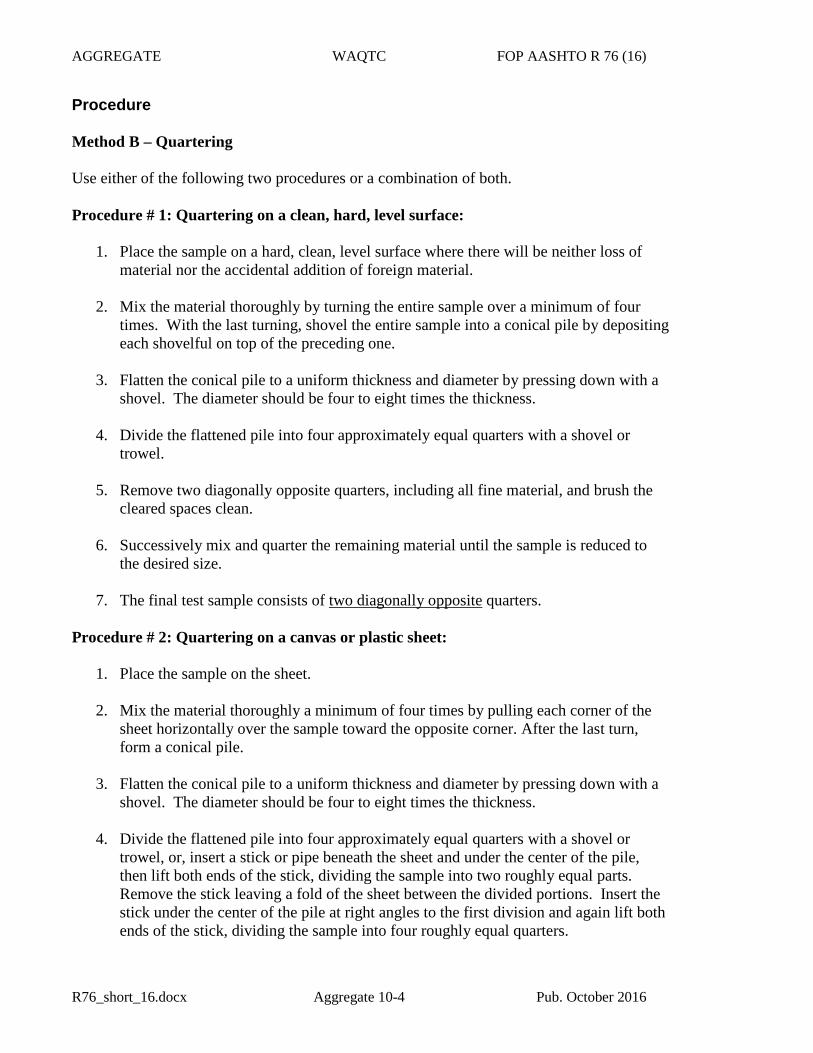
AGGREGATE WAQTC FOP AASHTO R 76 (16)
R76_short_16.docx Aggregate 10-4 Pub. October 2016
Procedure Method B – Quartering Use either of the following two procedures or a combination of both. Procedure # 1: Quartering on a clean, hard, level surface:
1. Place the sample on a hard, clean, level surface where there will be neither loss of material nor the accidental addition of foreign material.
2. Mix the material thoroughly by turning the entire sample over a minimum of four
times. With the last turning, shovel the entire sample into a conical pile by depositing each shovelful on top of the preceding one.
3. Flatten the conical pile to a uniform thickness and diameter by pressing down with a
shovel. The diameter should be four to eight times the thickness. 4. Divide the flattened pile into four approximately equal quarters with a shovel or
trowel. 5. Remove two diagonally opposite quarters, including all fine material, and brush the
cleared spaces clean. 6. Successively mix and quarter the remaining material until the sample is reduced to
the desired size. 7. The final test sample consists of two diagonally opposite quarters.
Procedure # 2: Quartering on a canvas or plastic sheet:
1. Place the sample on the sheet. 2. Mix the material thoroughly a minimum of four times by pulling each corner of the
sheet horizontally over the sample toward the opposite corner. After the last turn, form a conical pile.
3. Flatten the conical pile to a uniform thickness and diameter by pressing down with a
shovel. The diameter should be four to eight times the thickness. 4. Divide the flattened pile into four approximately equal quarters with a shovel or
trowel, or, insert a stick or pipe beneath the sheet and under the center of the pile, then lift both ends of the stick, dividing the sample into two roughly equal parts. Remove the stick leaving a fold of the sheet between the divided portions. Insert the stick under the center of the pile at right angles to the first division and again lift both ends of the stick, dividing the sample into four roughly equal quarters.

AGGREGATE WAQTC FOP AASHTO R 76 (16)
R76_short_16.docx Aggregate 10-5 Pub. October 2016
5. Remove two diagonally opposite quarters, being careful to clean the fines from the
sheet. 6. Successively mix and quarter the remaining material until the sample size is reduced
to the desired size. 7. The final test sample consists of two diagonally opposite quarters.