Embed Size (px)
Citation preview
� NTT Technical Review
1. Introduction
Terahertz (THz) spectroscopy has been used in the field of astronomy for the past few decades as a form of passive spectroscopy for observing the rotational modes of gaseous molecules. However, as the use of active spectroscopy for analyzing molecules, crys-tals, and even biological samples has become more common, it has attracted a lot of attention as a new spectroscopic analysis technique. THz spectroscopy involves the penetration of THz waves within a solid, which makes it possible to discriminate the intermo-lecular interactions between molecules or crystals inside the solid. It is anticipated that it will be applied in areas where it is difficult to apply X-ray diffraction methods such as with materials or ultrafine particles having multiple components that are mixed together.
THz waves lie between light waves and microwaves in the range from 0.� to �0 THz (�0�� to �0�3 Hz), and therefore, they easily penetrate materials that are not readily transparent to visible light such as paper, wood, and plastic, enabling nondestructive analysis.
In the region above � THz, there are many vibration modes of molecules or crystals that occur due to the intermolecular interactions. Consequently, the spec-tral fingerprint, in which the vibration modes absorb THz waves, allows us to identify the materials. The molecular interaction is stronger as the frequency increases. However, the penetration of THz waves within solids tends to decrease because the shorter wavelengths at higher frequencies are easily scattered by particles. Therefore, there is a limited region inside the frequency range from 0.3 to 5 THz where the two advantages of deep penetration and spectral fingerprint are both obtained. Even within the THz spectrum in the low frequency region of 0.�–0.3 THz, it is difficult to identify molecules or crystals even though penetration is easy, whereas in the higher fre-quency region of 5–�0 THz, extremely high loss limits the available sample thickness within thin films or surfaces.
Feature Articles: R&D on Devices Using Life-assist Technologies
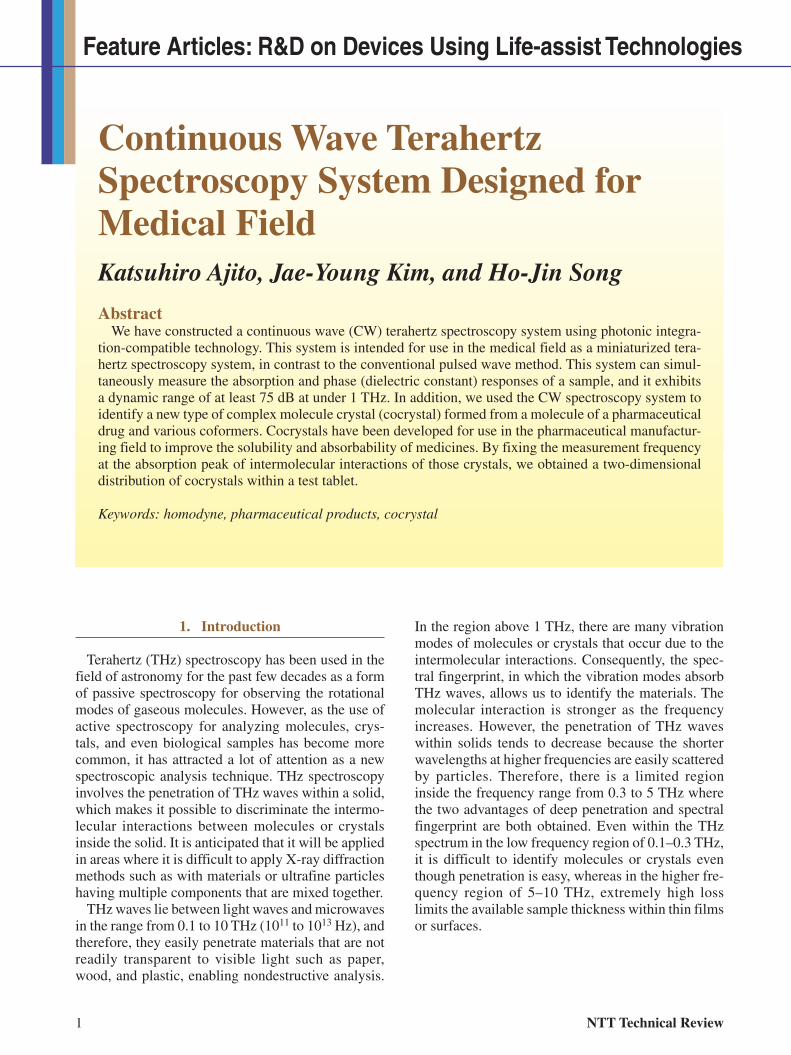
Continuous Wave Terahertz Spectroscopy System Designed for Medical FieldKatsuhiro Ajito, Jae-Young Kim, and Ho-Jin Song
AbstractWe have constructed a continuous wave (CW) terahertz spectroscopy system using photonic integra-
tion-compatible technology. This system is intended for use in the medical field as a miniaturized tera-hertz spectroscopy system, in contrast to the conventional pulsed wave method. This system can simul-taneously measure the absorption and phase (dielectric constant) responses of a sample, and it exhibits a dynamic range of at least 75 dB at under � THz. In addition, we used the CW spectroscopy system to identify a new type of complex molecule crystal (cocrystal) formed from a molecule of a pharmaceutical drug and various coformers. Cocrystals have been developed for use in the pharmaceutical manufactur-ing field to improve the solubility and absorbability of medicines. By fixing the measurement frequency at the absorption peak of intermolecular interactions of those crystals, we obtained a two-dimensional distribution of cocrystals within a test tablet.
Keywords: homodyne, pharmaceutical products, cocrystal
Vol. 13 No. 1 Jan. 2015 �
Feature Articles
2. Miniaturization of devices and application to medical field
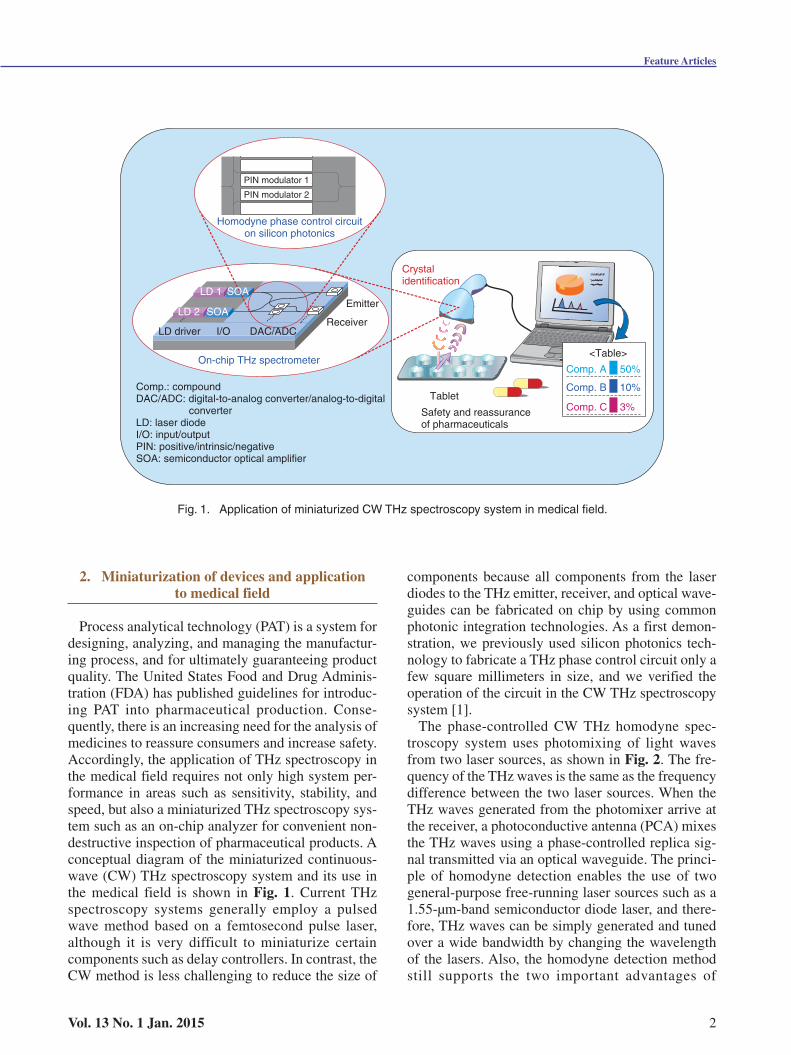
Process analytical technology (PAT) is a system for designing, analyzing, and managing the manufactur-ing process, and for ultimately guaranteeing product quality. The United States Food and Drug Adminis-tration (FDA) has published guidelines for introduc-ing PAT into pharmaceutical production. Conse-quently, there is an increasing need for the analysis of medicines to reassure consumers and increase safety. Accordingly, the application of THz spectroscopy in the medical field requires not only high system per-formance in areas such as sensitivity, stability, and speed, but also a miniaturized THz spectroscopy sys-tem such as an on-chip analyzer for convenient non-destructive inspection of pharmaceutical products. A conceptual diagram of the miniaturized continuous-wave (CW) THz spectroscopy system and its use in the medical field is shown in Fig. 1. Current THz spectroscopy systems generally employ a pulsed wave method based on a femtosecond pulse laser, although it is very difficult to miniaturize certain components such as delay controllers. In contrast, the CW method is less challenging to reduce the size of
components because all components from the laser diodes to the THz emitter, receiver, and optical wave-guides can be fabricated on chip by using common photonic integration technologies. As a first demon-stration, we previously used silicon photonics tech-nology to fabricate a THz phase control circuit only a few square millimeters in size, and we verified the operation of the circuit in the CW THz spectroscopy system [�].
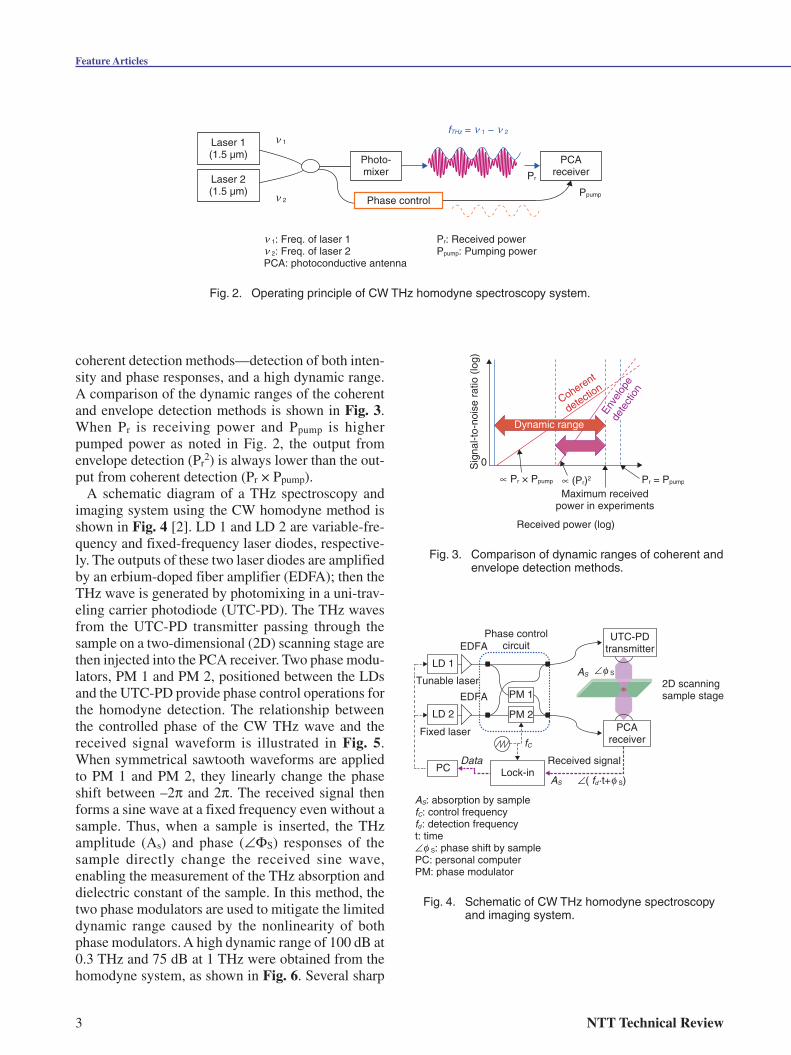
The phase-controlled CW THz homodyne spec-troscopy system uses photomixing of light waves from two laser sources, as shown in Fig. 2. The fre-quency of the THz waves is the same as the frequency difference between the two laser sources. When the THz waves generated from the photomixer arrive at the receiver, a photoconductive antenna (PCA) mixes the THz waves using a phase-controlled replica sig-nal transmitted via an optical waveguide. The princi-ple of homodyne detection enables the use of two general-purpose free-running laser sources such as a �.55-μm-band semiconductor diode laser, and there-fore, THz waves can be simply generated and tuned over a wide bandwidth by changing the wavelength of the lasers. Also, the homodyne detection method still supports the two important advantages of
Fig. 1. Application of miniaturized CW THz spectroscopy system in medical field.
Homodyne phase control circuiton silicon photonics
On-chip THz spectrometer
SOA
SOA
LD driver
Emitter
Receiver
Tablet
<Table>
PIN modulator 1
PIN modulator 2
LD 1
LD 2
I/O DAC/ADC
Comp.: compoundDAC/ADC: digital-to-analog converter/analog-to-digital
converterLD: laser diodeI/O: input/outputPIN: positive/intrinsic/negativeSOA: semiconductor optical amplifier
Crystalidentification
Safety and reassurance of pharmaceuticals
Comp. A
Comp. B
Comp. C
50%
10%
3%
3 NTT Technical Review
Feature Articles
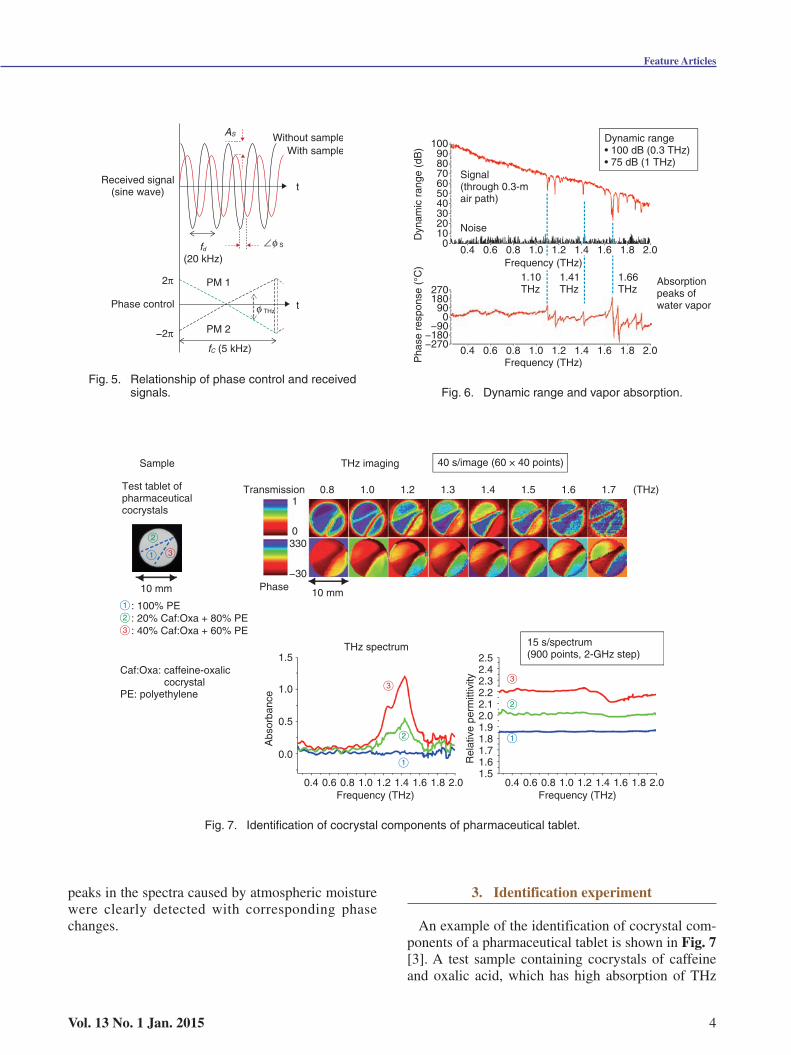
coherent detection methods—detection of both inten-sity and phase responses, and a high dynamic range. A comparison of the dynamic ranges of the coherent and envelope detection methods is shown in Fig. 3. When Pr is receiving power and Ppump is higher pumped power as noted in Fig. �, the output from envelope detection (Pr
�) is always lower than the out-put from coherent detection (Pr × Ppump).
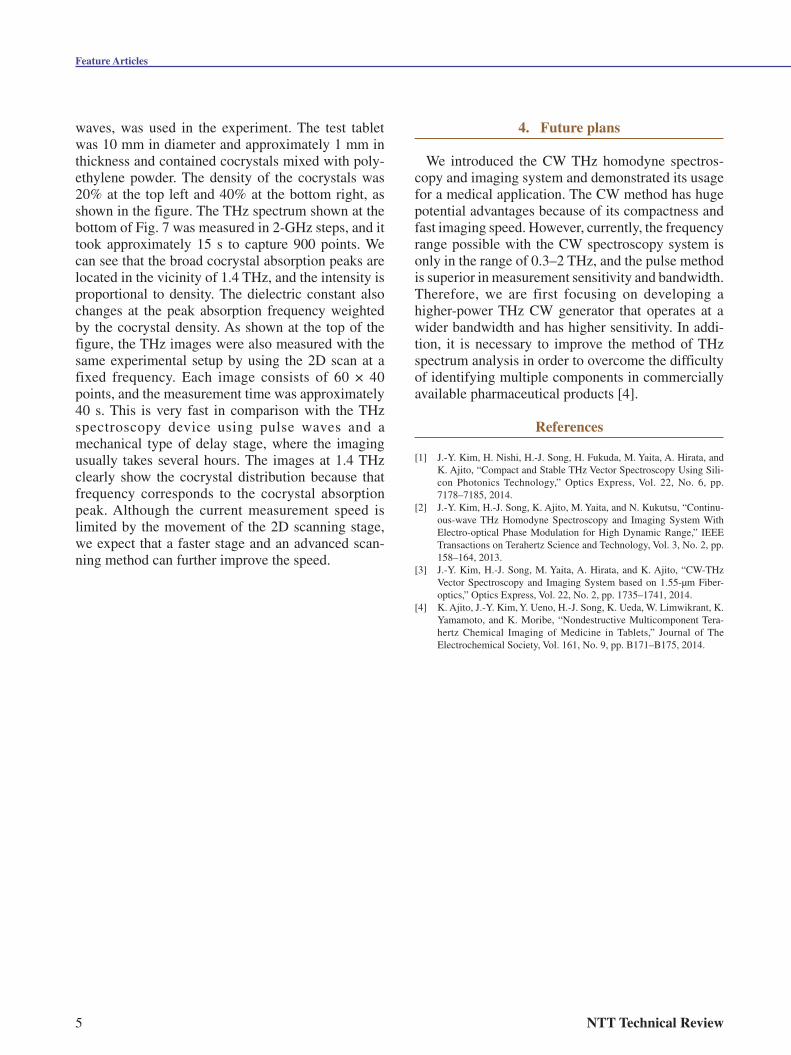
A schematic diagram of a THz spectroscopy and imaging system using the CW homodyne method is shown in Fig. 4 [�]. LD � and LD � are variable-fre-quency and fixed-frequency laser diodes, respective-ly. The outputs of these two laser diodes are amplified by an erbium-doped fiber amplifier (EDFA); then the THz wave is generated by photomixing in a uni-trav-eling carrier photodiode (UTC-PD). The THz waves from the UTC-PD transmitter passing through the sample on a two-dimensional (�D) scanning stage are then injected into the PCA receiver. Two phase modu-lators, PM � and PM �, positioned between the LDs and the UTC-PD provide phase control operations for the homodyne detection. The relationship between the controlled phase of the CW THz wave and the received signal waveform is illustrated in Fig. 5. When symmetrical sawtooth waveforms are applied to PM � and PM �, they linearly change the phase shift between –�π and �π. The received signal then forms a sine wave at a fixed frequency even without a sample. Thus, when a sample is inserted, the THz amplitude (As) and phase (∠ΦS) responses of the sample directly change the received sine wave, enabling the measurement of the THz absorption and dielectric constant of the sample. In this method, the two phase modulators are used to mitigate the limited dynamic range caused by the nonlinearity of both phase modulators. A high dynamic range of �00 dB at 0.3 THz and 75 dB at � THz were obtained from the homodyne system, as shown in Fig. 6. Several sharp
Fig. 2. Operating principle of CW THz homodyne spectroscopy system.
Phase control
Laser 1(1.5 µm)
Laser 2(1.5 µm)
ν 1
ν 2
Photo-mixer
fTHz = ν 1 − ν 2
ν 1: Freq. of laser 1ν 2: Freq. of laser 2PCA: photoconductive antenna
Pr: Received powerPpump: Pumping power
Pr
PCAreceiver
Ppump
Fig. 3. Comparison of dynamic ranges of coherent and envelope detection methods.
Dynamic range
0
Maximum receivedpower in experiments
Received power (log)
Coherent
detection
Enve
lope
dete
ctio
n
Sig
nal-t
o-no
ise
ratio
(lo
g)∝ Pr × Ppump ∝ (Pr)2 Pr = Ppump
Fig. 4. Schematic of CW THz homodyne spectroscopy and imaging system.
EDFA
Tunable laser
Fixed laser
Data Received signalPC
EDFA
Lock-in
Phase controlcircuit
LD 1
LD 2
PM 1
PM 2
fC
AS ∠( fd·t+φ S)
PCAreceiver
AS ∠φ S
UTC-PDtransmitter
2D scanningsample stage
AS: absorption by sample fC: control frequencyfd: detection frequencyt: time∠φ S: phase shift by samplePC: personal computerPM: phase modulator
Vol. 13 No. 1 Jan. 2015 �
Feature Articles
peaks in the spectra caused by atmospheric moisture were clearly detected with corresponding phase changes.
3. Identification experiment
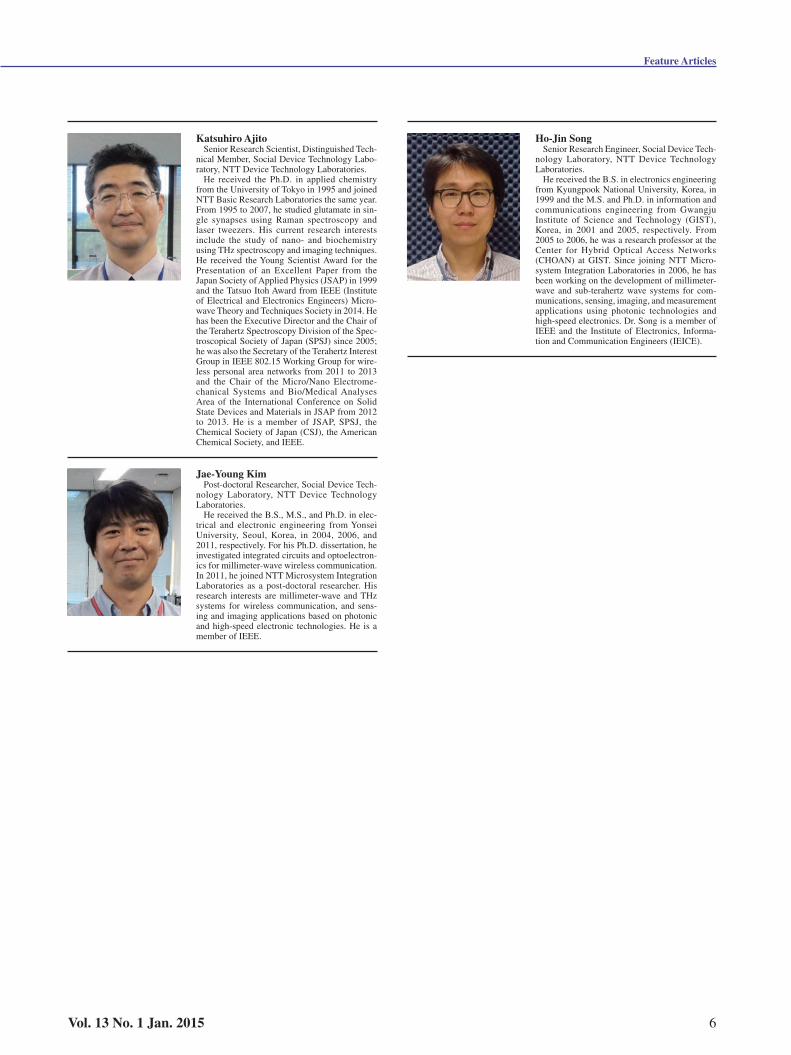
An example of the identification of cocrystal com-ponents of a pharmaceutical tablet is shown in Fig. 7 [3]. A test sample containing cocrystals of caffeine and oxalic acid, which has high absorption of THz
Fig. 5. Relationship of phase control and received signals.
Without sampleWith sample
Received signal(sine wave)
Phase control
2π
−2π
AS
t
∠φ S
fC (5 kHz)
PM 1
PM 2
tφ THz
fd
(20 kHz)
Fig. 6. Dynamic range and vapor absorption.
Noise
Absorptionpeaks ofwater vapor
Dynamic range• 100 dB (0.3 THz)• 75 dB (1 THz)
Dyn
amic
ran
ge (
dB)
Pha
se r
espo
nse
(°C
)
1009080706050403020100
0.4 0.6 0.8 1.0 1.2 1.4 1.6 1.8 2.0Frequency (THz)
Frequency (THz)0.4 0.6 0.8 1.0 1.2 1.4 1.6 1.8 2.0
27018090
0−90
−180−270
Signal (through 0.3-mair path)
1.10THz
1.41THz
1.66THz
Fig. 7. Identification of cocrystal components of pharmaceutical tablet.
Sample
THz spectrum
THz imaging
0.8Transmission
10 mm−30
Frequency (THz) Frequency (THz)
: 100% PE: 20% Caf:Oxa + 80% PE: 40% Caf:Oxa + 60% PE
1
2
3
1 3
2
Test tablet ofpharmaceuticalcocrystals
Phase10 mm
1
0330
40 s/image (60 × 40 points)
1.0 1.2 1.3 1.4 1.5 1.6 1.7 (THz)
15 s/spectrum(900 points, 2-GHz step)
Caf:Oxa: caffeine-oxalic cocrystal
PE: polyethylene
Abs
orba
nce
Rel
ativ
e pe
rmitt
ivity
1
2
33
2
1
1.5
1.0
0.5
0.0
0.4 0.6 0.8 1.0 1.2 1.4 1.6 1.8 2.0
2.52.42.32.22.12.01.91.81.71.61.5
0.4 0.6 0.8 1.0 1.2 1.4 1.6 1.8 2.0
5 NTT Technical Review
Feature Articles
waves, was used in the experiment. The test tablet was �0 mm in diameter and approximately � mm in thickness and contained cocrystals mixed with poly-ethylene powder. The density of the cocrystals was �0% at the top left and �0% at the bottom right, as shown in the figure. The THz spectrum shown at the bottom of Fig. 7 was measured in �-GHz steps, and it took approximately �5 s to capture 900 points. We can see that the broad cocrystal absorption peaks are located in the vicinity of �.� THz, and the intensity is proportional to density. The dielectric constant also changes at the peak absorption frequency weighted by the cocrystal density. As shown at the top of the figure, the THz images were also measured with the same experimental setup by using the �D scan at a fixed frequency. Each image consists of 60 × �0 points, and the measurement time was approximately �0 s. This is very fast in comparison with the THz spectroscopy device using pulse waves and a mechanical type of delay stage, where the imaging usually takes several hours. The images at �.� THz clearly show the cocrystal distribution because that frequency corresponds to the cocrystal absorption peak. Although the current measurement speed is limited by the movement of the �D scanning stage, we expect that a faster stage and an advanced scan-ning method can further improve the speed.
4. Future plans
We introduced the CW THz homodyne spectros-copy and imaging system and demonstrated its usage for a medical application. The CW method has huge potential advantages because of its compactness and fast imaging speed. However, currently, the frequency range possible with the CW spectroscopy system is only in the range of 0.3–� THz, and the pulse method is superior in measurement sensitivity and bandwidth. Therefore, we are first focusing on developing a higher-power THz CW generator that operates at a wider bandwidth and has higher sensitivity. In addi-tion, it is necessary to improve the method of THz spectrum analysis in order to overcome the difficulty of identifying multiple components in commercially available pharmaceutical products [�].
References
[�] J.-Y. Kim, H. Nishi, H.-J. Song, H. Fukuda, M. Yaita, A. Hirata, and K. Ajito, “Compact and Stable THz Vector Spectroscopy Using Sili-con Photonics Technology,” Optics Express, Vol. ��, No. 6, pp. 7�78–7�85, �0��.
[�] J.-Y. Kim, H.-J. Song, K. Ajito, M. Yaita, and N. Kukutsu, “Continu-ous-wave THz Homodyne Spectroscopy and Imaging System With Electro-optical Phase Modulation for High Dynamic Range,” IEEE Transactions on Terahertz Science and Technology, Vol. 3, No. �, pp. �58–�6�, �0�3.
[3] J.-Y. Kim, H.-J. Song, M. Yaita, A. Hirata, and K. Ajito, “CW-THz Vector Spectroscopy and Imaging System based on �.55-μm Fiber-optics,” Optics Express, Vol. ��, No. �, pp. �735–�7��, �0��.
[�] K. Ajito, J.-Y. Kim, Y. Ueno, H.-J. Song, K. Ueda, W. Limwikrant, K. Yamamoto, and K. Moribe, “Nondestructive Multicomponent Tera-hertz Chemical Imaging of Medicine in Tablets,” Journal of The Electrochemical Society, Vol. �6�, No. 9, pp. B�7�–B�75, �0��.
Vol. 13 No. 1 Jan. 2015 6
Feature Articles
Katsuhiro AjitoSenior Research Scientist, Distinguished Tech-
nical Member, Social Device Technology Labo-ratory, NTT Device Technology Laboratories.
He received the Ph.D. in applied chemistry from the University of Tokyo in �995 and joined NTT Basic Research Laboratories the same year. From �995 to �007, he studied glutamate in sin-gle synapses using Raman spectroscopy and laser tweezers. His current research interests include the study of nano- and biochemistry using THz spectroscopy and imaging techniques. He received the Young Scientist Award for the Presentation of an Excellent Paper from the Japan Society of Applied Physics (JSAP) in �999 and the Tatsuo Itoh Award from IEEE (Institute of Electrical and Electronics Engineers) Micro-wave Theory and Techniques Society in �0��. He has been the Executive Director and the Chair of the Terahertz Spectroscopy Division of the Spec-troscopical Society of Japan (SPSJ) since �005; he was also the Secretary of the Terahertz Interest Group in IEEE 80�.�5 Working Group for wire-less personal area networks from �0�� to �0�3 and the Chair of the Micro/Nano Electrome-chanical Systems and Bio/Medical Analyses Area of the International Conference on Solid State Devices and Materials in JSAP from �0�� to �0�3. He is a member of JSAP, SPSJ, the Chemical Society of Japan (CSJ), the American Chemical Society, and IEEE.
Jae-Young KimPost-doctoral Researcher, Social Device Tech-
nology Laboratory, NTT Device Technology Laboratories.
He received the B.S., M.S., and Ph.D. in elec-trical and electronic engineering from Yonsei University, Seoul, Korea, in �00�, �006, and �0��, respectively. For his Ph.D. dissertation, he investigated integrated circuits and optoelectron-ics for millimeter-wave wireless communication. In �0��, he joined NTT Microsystem Integration Laboratories as a post-doctoral researcher. His research interests are millimeter-wave and THz systems for wireless communication, and sens-ing and imaging applications based on photonic and high-speed electronic technologies. He is a member of IEEE.
Ho-Jin SongSenior Research Engineer, Social Device Tech-
nology Laboratory, NTT Device Technology Laboratories.
He received the B.S. in electronics engineering from Kyungpook National University, Korea, in �999 and the M.S. and Ph.D. in information and communications engineering from Gwangju Institute of Science and Technology (GIST), Korea, in �00� and �005, respectively. From �005 to �006, he was a research professor at the Center for Hybrid Optical Access Networks (CHOAN) at GIST. Since joining NTT Micro-system Integration Laboratories in �006, he has been working on the development of millimeter-wave and sub-terahertz wave systems for com-munications, sensing, imaging, and measurement applications using photonic technologies and high-speed electronics. Dr. Song is a member of IEEE and the Institute of Electronics, Informa-tion and Communication Engineers (IEICE).