Embed Size (px)
Citation preview
1
KBC GroupCompany presentation1Q 2019
KBC Group - Investor Relations Office – E-mail:
More information: www.kbc.com
2
▪ This presentation is provided for information purposes only. It does not constitute an offer to sell or the solicitation to buy anysecurity issued by the KBC Group.
▪ KBC believes that this presentation is reliable, although some information is condensed and therefore incomplete. KBC cannot beheld liable for any loss or damage resulting from the use of the information.
▪ This presentation contains non-IFRS information and forward-looking statements with respect to the strategy, earnings and capitaltrends of KBC, involving numerous assumptions and uncertainties. There is a risk that these statements may not be fulfilled andthat future developments differ materially. Moreover, KBC does not undertake any obligation to update the presentation in linewith new developments.
▪ By reading this presentation, each investor is deemed to represent that it possesses sufficient expertise to understand the risksinvolved.
Important information for investors
3
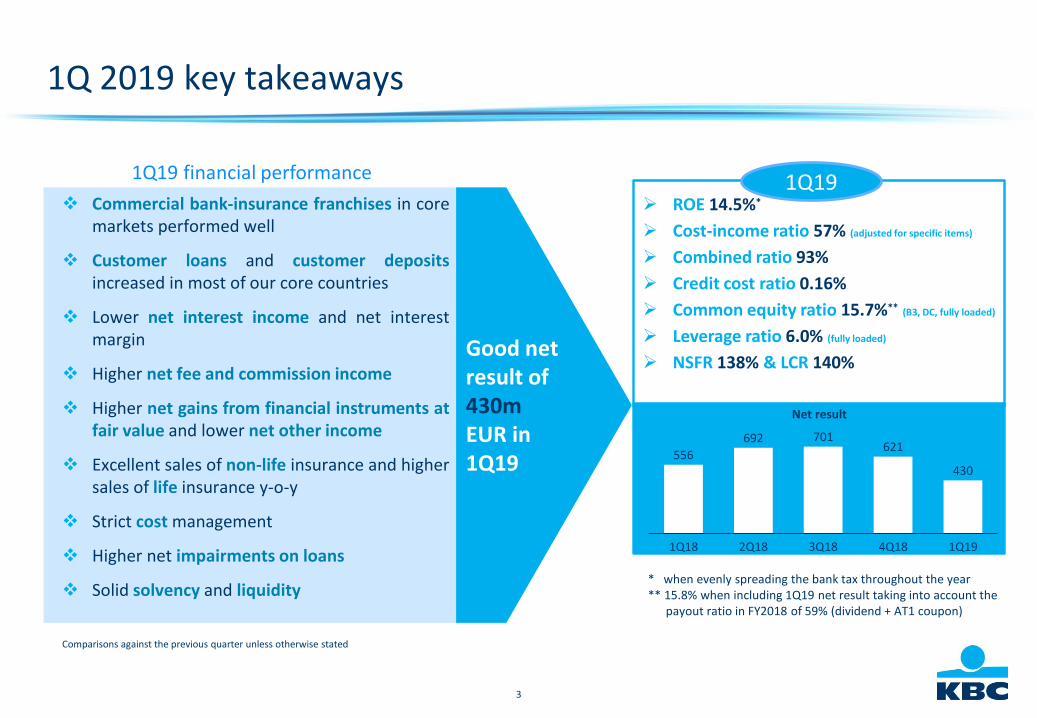
❖ Commercial bank-insurance franchises in coremarkets performed well
❖ Customer loans and customer depositsincreased in most of our core countries
❖ Lower net interest income and net interestmargin
❖ Higher net fee and commission income
❖ Higher net gains from financial instruments atfair value and lower net other income
❖ Excellent sales of non-life insurance and highersales of life insurance y-o-y
❖ Strict cost management
❖ Higher net impairments on loans
❖ Solid solvency and liquidity
Comparisons against the previous quarter unless otherwise stated
1Q 2019 key takeaways
Good net result of 430mEUR in 1Q19
➢ ROE 14.5%*
➢ Cost-income ratio 57% (adjusted for specific items)
➢ Combined ratio 93%
➢ Credit cost ratio 0.16%
➢ Common equity ratio 15.7%** (B3, DC, fully loaded)
➢ Leverage ratio 6.0% (fully loaded)
➢ NSFR 138% & LCR 140%
1Q19
556
692 701621
430
2Q181Q18 3Q18 4Q18 1Q19
1Q19 financial performance
Net result
* when evenly spreading the bank tax throughout the year** 15.8% when including 1Q19 net result taking into account the
payout ratio in FY2018 of 59% (dividend + AT1 coupon)
4
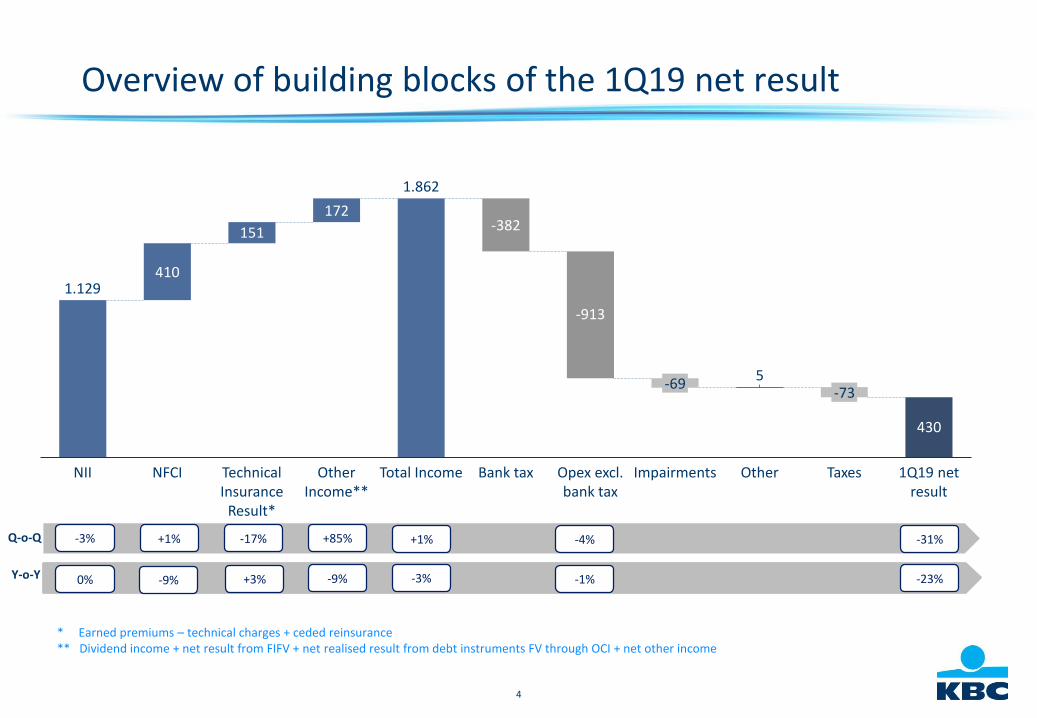
430
410
151
172
5
Total Income ImpairmentsNII
-382
-73
NFCI Bank taxTechnical Insurance
Result*
Other Income**
-913
Opex excl. bank tax
-69
Other Taxes 1Q19 net result
1.129
1.862
Q-o-Q
Y-o-Y
* Earned premiums – technical charges + ceded reinsurance** Dividend income + net result from FIFV + net realised result from debt instruments FV through OCI + net other income
-17%-3% +1% +85% +1% -4% -31%
0% -9% +3% -9% -3% -1% -23%
Overview of building blocks of the 1Q19 net result
5
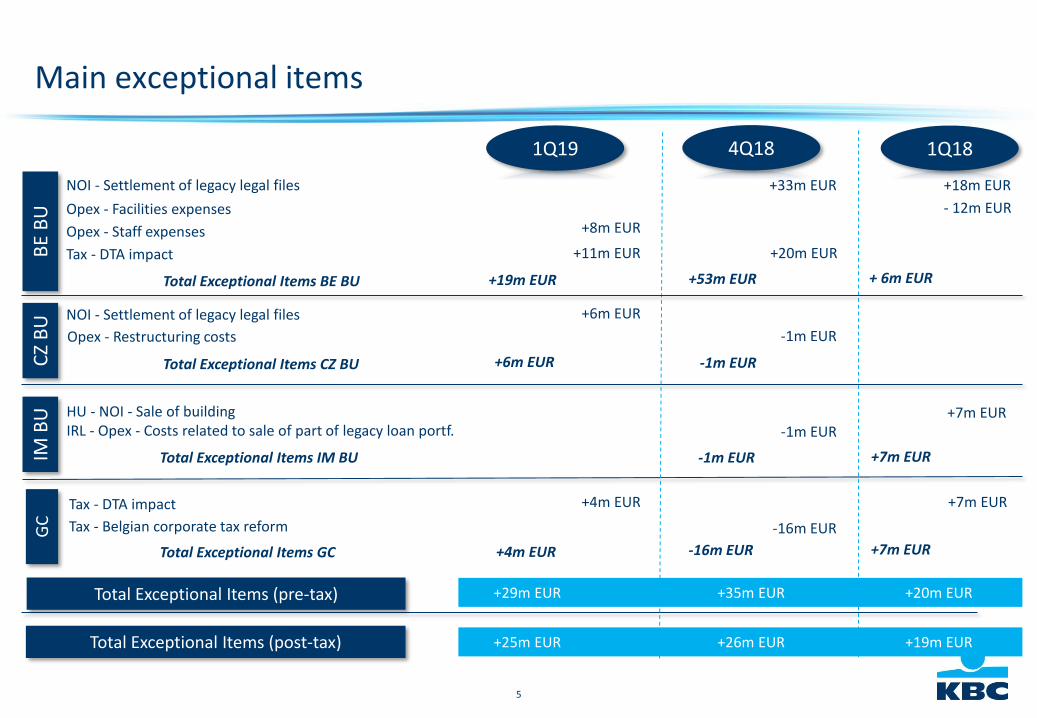
Main exceptional items
1Q19 4Q18
BE
BU
IM B
UG
C
Total Exceptional Items BE BU
+29m EUR +35m EUR +20m EUR
Total Exceptional Items IM BU
Total Exceptional Items GC
Total Exceptional Items (pre-tax)
Total Exceptional Items (post-tax) +25m EUR +26m EUR +19m EUR
1Q18
HU - NOI - Sale of buildingIRL - Opex - Costs related to sale of part of legacy loan portf.
+4m EUR
CZ
BU
Opex - Restructuring costs
Total Exceptional Items CZ BU +6m EUR
Opex - Facilities expenses
+19m EUR
Tax - Belgian corporate tax reform
Tax - DTA impact
+4m EUR
NOI - Settlement of legacy legal files
+8m EUR
-16m EUR
-1m EUR
-1m EUR
+53m EUR
+20m EUR
-16m EUR
+33m EUR
-1m EUR
-1m EUR
- 12m EUR
+18m EUR
+ 6m EUR
+7m EUR
+7m EUR
+7m EUR
Opex - Staff expenses
+11m EUR
NOI - Settlement of legacy legal files +6m EUR
Tax - DTA impact
+7m EUR
6
Contents
1
Strong solvency and solid liquidity
Looking forward
Annex 2: Other items
2
1Q 2019 performance of KBC Group
3
1Q 2019 performance of business units
Annex 1: Company profile
4
7
KBC Group
Section 1
1Q 2019 performance of KBC Group
8
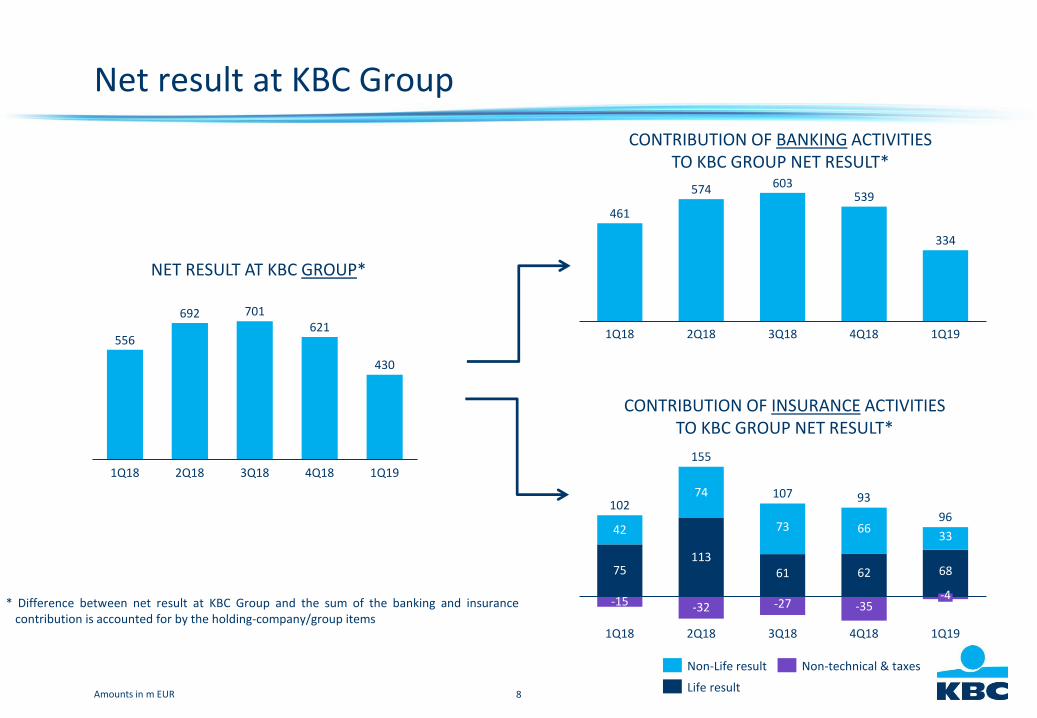
Net result at KBC Group
* Difference between net result at KBC Group and the sum of the banking and insurancecontribution is accounted for by the holding-company/group items
CONTRIBUTION OF BANKING ACTIVITIES TO KBC GROUP NET RESULT*
556
692 701621
430
4Q181Q18 3Q182Q18 1Q19
NET RESULT AT KBC GROUP*
461
574 603539
334
2Q18 4Q181Q18 1Q193Q18
75113
61 62 68
42
74
73 6633
-15 -32 -27 -35
102
1Q18
-4
2Q18 3Q18 1Q194Q18
155
107 93
96
CONTRIBUTION OF INSURANCE ACTIVITIES TO KBC GROUP NET RESULT*
Amounts in m EUR
Non-Life result
Life result
Non-technical & taxes
9
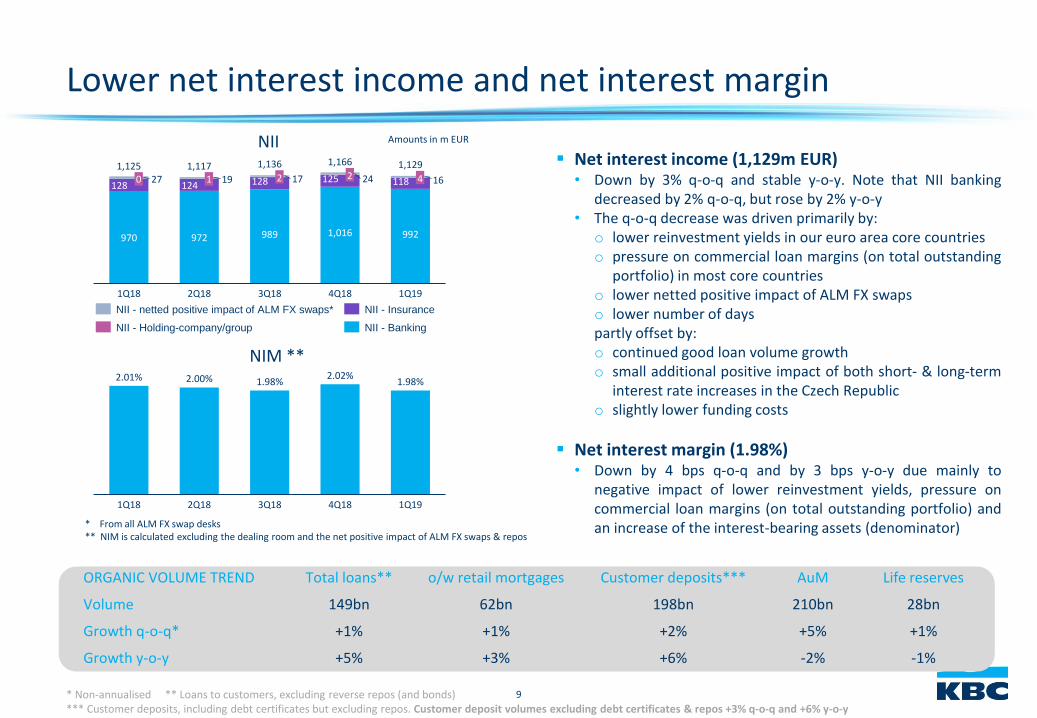
Lower net interest income and net interest margin
▪ Net interest income (1,129m EUR)• Down by 3% q-o-q and stable y-o-y. Note that NII banking
decreased by 2% q-o-q, but rose by 2% y-o-y• The q-o-q decrease was driven primarily by:
o lower reinvestment yields in our euro area core countrieso pressure on commercial loan margins (on total outstanding
portfolio) in most core countrieso lower netted positive impact of ALM FX swapso lower number of dayspartly offset by:o continued good loan volume growtho small additional positive impact of both short- & long-term
interest rate increases in the Czech Republico slightly lower funding costs
▪ Net interest margin (1.98%)• Down by 4 bps q-o-q and by 3 bps y-o-y due mainly to
negative impact of lower reinvestment yields, pressure oncommercial loan margins (on total outstanding portfolio) andan increase of the interest-bearing assets (denominator)
NIM **
NII
970 972 989 992
128 124 128 125 11827 19 17 241,117
2
1Q19
40
1Q18 2Q18
1,129
1
3Q18
2
1,016
4Q18
16
1,125 1,136 1,166
1Q18
1.98%
4Q182Q18
2.02%
3Q18
2.00%
1Q19
2.01% 1.98%
Amounts in m EUR
NII - netted positive impact of ALM FX swaps*
NII - Holding-company/group
NII - Insurance
NII - Banking
* From all ALM FX swap desks** NIM is calculated excluding the dealing room and the net positive impact of ALM FX swaps & repos
* Non-annualised ** Loans to customers, excluding reverse repos (and bonds)*** Customer deposits, including debt certificates but excluding repos. Customer deposit volumes excluding debt certificates & repos +3% q-o-q and +6% y-o-y
ORGANIC VOLUME TREND Total loans** o/w retail mortgages Customer deposits*** AuM Life reserves
Volume 149bn 62bn 198bn 210bn 28bn
Growth q-o-q* +1% +1% +2% +5% +1%
Growth y-o-y +5% +3% +6% -2% -1%
10
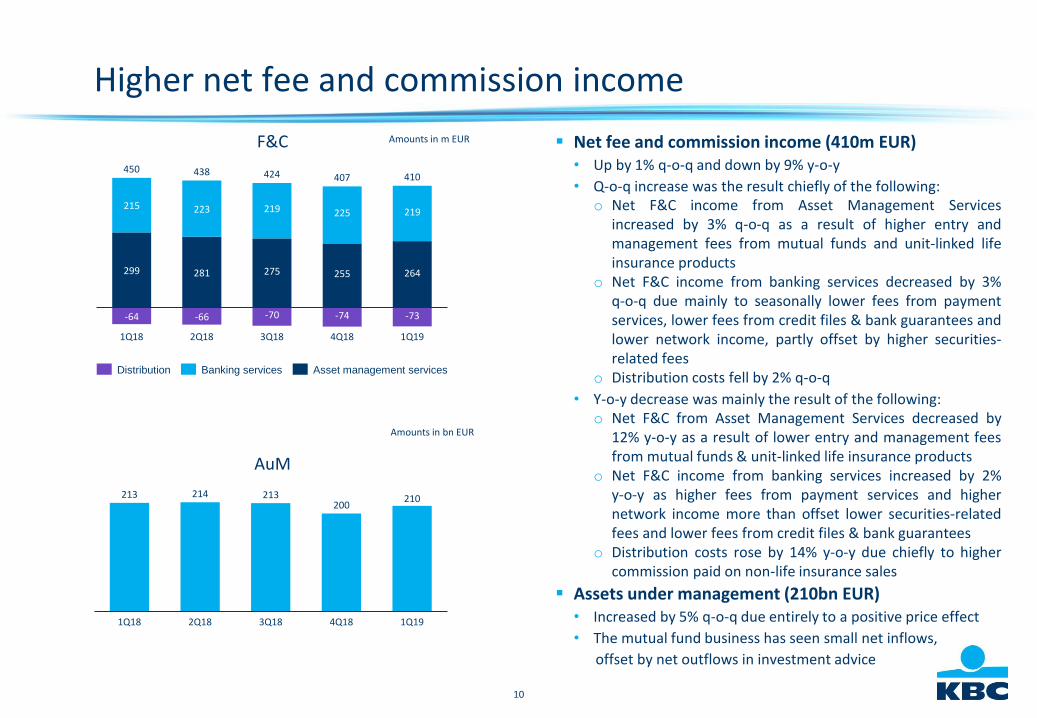
Higher net fee and commission income
Amounts in bn EUR
AuM
213 214 213200
210
1Q18 2Q18 3Q18 4Q18 1Q19
299 281 275 255 264
215 223 219 225 219
-64 -66 -70 -74 -73
424
4Q18 1Q191Q18 2Q18 3Q18
450 438407 410
Banking servicesDistribution Asset management services
Amounts in m EUR▪ Net fee and commission income (410m EUR)
• Up by 1% q-o-q and down by 9% y-o-y
• Q-o-q increase was the result chiefly of the following:o Net F&C income from Asset Management Services
increased by 3% q-o-q as a result of higher entry andmanagement fees from mutual funds and unit-linked lifeinsurance products
o Net F&C income from banking services decreased by 3%q-o-q due mainly to seasonally lower fees from paymentservices, lower fees from credit files & bank guarantees andlower network income, partly offset by higher securities-related fees
o Distribution costs fell by 2% q-o-q
• Y-o-y decrease was mainly the result of the following:o Net F&C from Asset Management Services decreased by
12% y-o-y as a result of lower entry and management feesfrom mutual funds & unit-linked life insurance products
o Net F&C income from banking services increased by 2%y-o-y as higher fees from payment services and highernetwork income more than offset lower securities-relatedfees and lower fees from credit files & bank guarantees
o Distribution costs rose by 14% y-o-y due chiefly to highercommission paid on non-life insurance sales
▪ Assets under management (210bn EUR)• Increased by 5% q-o-q due entirely to a positive price effect
• The mutual fund business has seen small net inflows,
offset by net outflows in investment advice
F&C
11
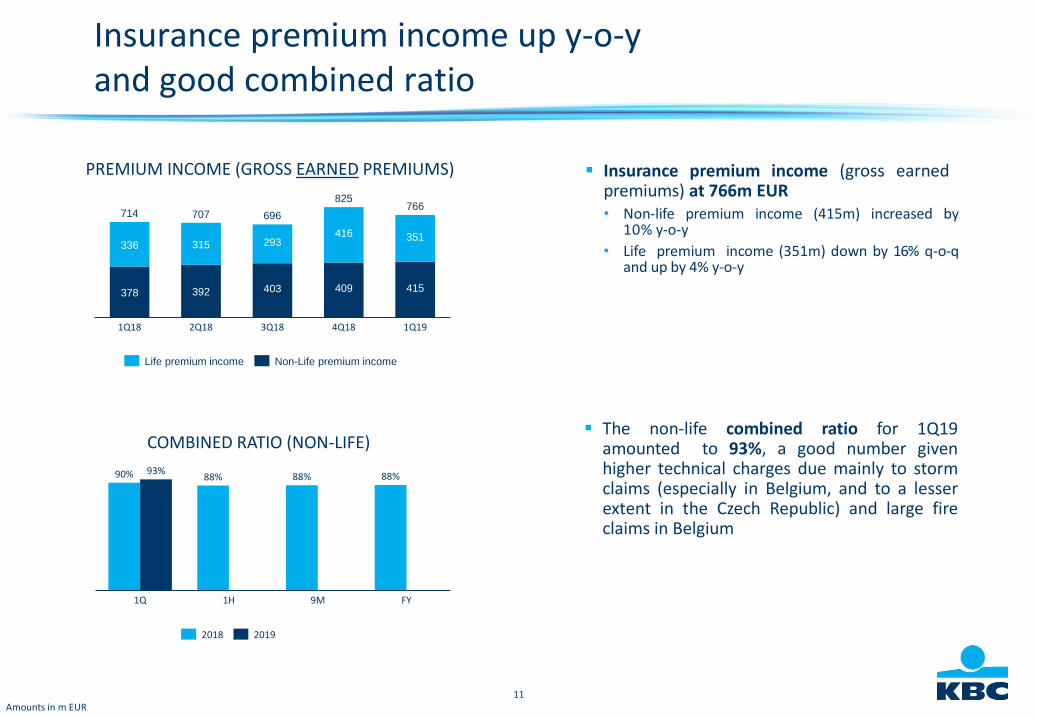
▪ Insurance premium income (gross earned premiums) at 766m EUR• Non-life premium income (415m) increased by
10% y-o-y
• Life premium income (351m) down by 16% q-o-qand up by 4% y-o-y
▪ The non-life combined ratio for 1Q19amounted to 93%, a good number givenhigher technical charges due mainly to stormclaims (especially in Belgium, and to a lesserextent in the Czech Republic) and large fireclaims in Belgium
Insurance premium income up y-o-y and good combined ratio
COMBINED RATIO (NON-LIFE)
PREMIUM INCOME (GROSS EARNED PREMIUMS)
9M
88%
1Q 1H
88%
FY
90% 93%88%
20192018
378 392 403 409 415
336 315 293416 351
696
4Q181Q18 3Q18 1Q192Q18
714 707
825766
Non-Life premium incomeLife premium income
Amounts in m EUR
12
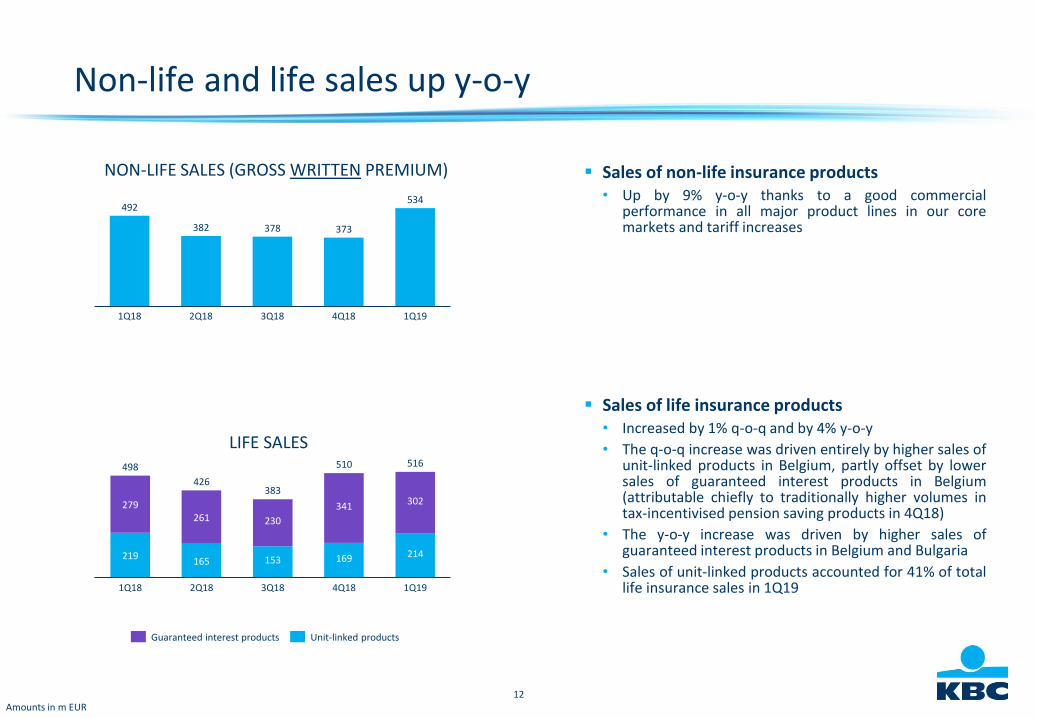
Non-life and life sales up y-o-y
▪ Sales of non-life insurance products• Up by 9% y-o-y thanks to a good commercial
performance in all major product lines in our coremarkets and tariff increases
▪ Sales of life insurance products• Increased by 1% q-o-q and by 4% y-o-y
• The q-o-q increase was driven entirely by higher sales ofunit-linked products in Belgium, partly offset by lowersales of guaranteed interest products in Belgium(attributable chiefly to traditionally higher volumes intax-incentivised pension saving products in 4Q18)
• The y-o-y increase was driven by higher sales ofguaranteed interest products in Belgium and Bulgaria
• Sales of unit-linked products accounted for 41% of totallife insurance sales in 1Q19
LIFE SALES
NON-LIFE SALES (GROSS WRITTEN PREMIUM)
219165 153 169 214
279261 230
341 302
1Q193Q181Q18 2Q18
383
4Q18
498
426
510 516
Guaranteed interest products Unit-linked products
492
382 378 373
534
1Q194Q182Q181Q18 3Q18
Amounts in m EUR
13
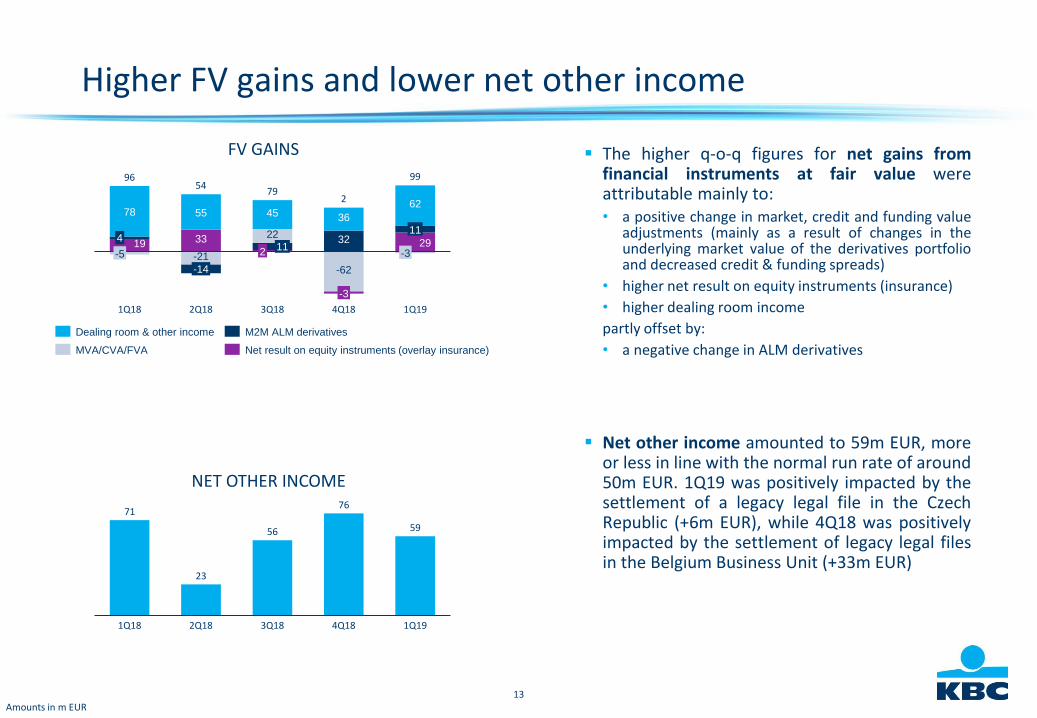
Higher FV gains and lower net other income
▪ The higher q-o-q figures for net gains fromfinancial instruments at fair value wereattributable mainly to:• a positive change in market, credit and funding value
adjustments (mainly as a result of changes in theunderlying market value of the derivatives portfolioand decreased credit & funding spreads)
• higher net result on equity instruments (insurance)
• higher dealing room income
partly offset by:
• a negative change in ALM derivatives
▪ Net other income amounted to 59m EUR, moreor less in line with the normal run rate of around50m EUR. 1Q19 was positively impacted by thesettlement of a legacy legal file in the CzechRepublic (+6m EUR), while 4Q18 was positivelyimpacted by the settlement of legacy legal filesin the Belgium Business Unit (+33m EUR)
FV GAINS
Amounts in m EUR
19 33 32
55 3678
-21
22
-62
6245
96
1Q18
-5 2
-14
4
2Q18 3Q18
11
-3
4Q18
-3
1Q19
5479
2
99
11
29
71
23
56
76
59
1Q18 1Q193Q182Q18 4Q18
NET OTHER INCOME
Net result on equity instruments (overlay insurance)
Dealing room & other income
MVA/CVA/FVA
M2M ALM derivatives
14
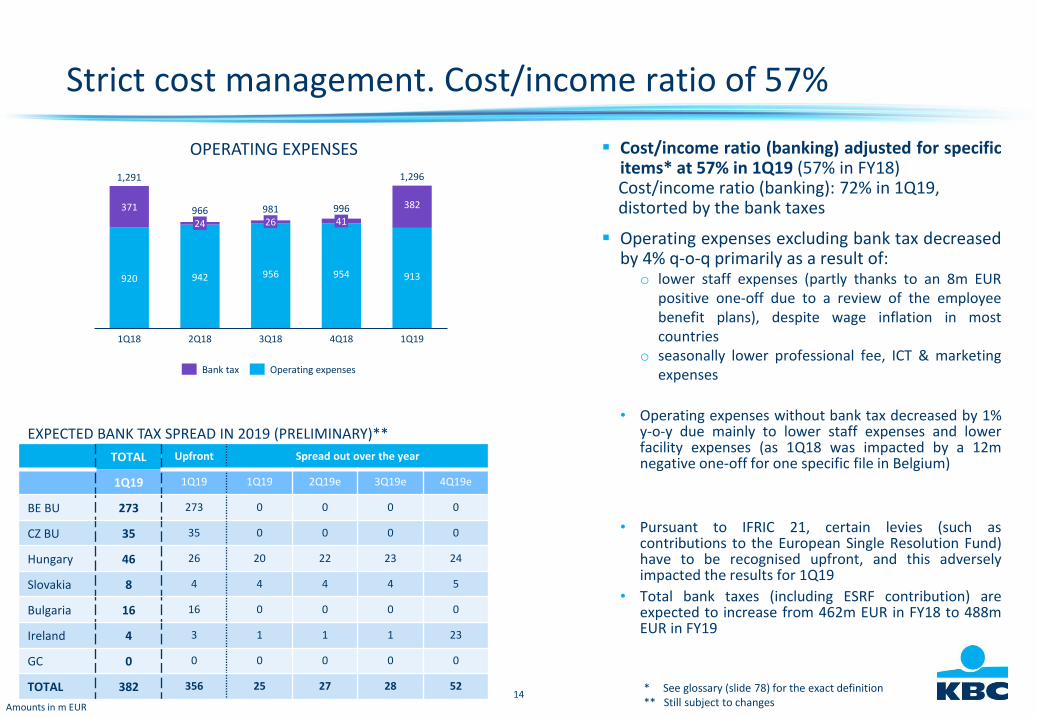
Strict cost management. Cost/income ratio of 57%
▪ Cost/income ratio (banking) adjusted for specificitems* at 57% in 1Q19 (57% in FY18)Cost/income ratio (banking): 72% in 1Q19,distorted by the bank taxes
▪ Operating expenses excluding bank tax decreasedby 4% q-o-q primarily as a result of:
o lower staff expenses (partly thanks to an 8m EURpositive one-off due to a review of the employeebenefit plans), despite wage inflation in mostcountries
o seasonally lower professional fee, ICT & marketingexpenses
• Operating expenses without bank tax decreased by 1%y-o-y due mainly to lower staff expenses and lowerfacility expenses (as 1Q18 was impacted by a 12mnegative one-off for one specific file in Belgium)
• Pursuant to IFRIC 21, certain levies (such ascontributions to the European Single Resolution Fund)have to be recognised upfront, and this adverselyimpacted the results for 1Q19
• Total bank taxes (including ESRF contribution) areexpected to increase from 462m EUR in FY18 to 488mEUR in FY19
OPERATING EXPENSES
920 942 956 954 913
371 382
1Q18
24
1Q194Q18
26
2Q18 3Q18
41
1,291
966 981 996
1,296
Bank tax Operating expenses
* See glossary (slide 78) for the exact definition** Still subject to changesAmounts in m EUR
TOTAL Upfront Spread out over the year
1Q19 1Q19 1Q19 2Q19e 3Q19e 4Q19e
BE BU 273 273 0 0 0 0
CZ BU 35 35 0 0 0 0
Hungary 46 26 20 22 23 24
Slovakia 8 4 4 4 4 5
Bulgaria 16 16 0 0 0 0
Ireland 4 3 1 1 1 23
GC 0 0 0 0 0 0
TOTAL 382 356 25 27 28 52
EXPECTED BANK TAX SPREAD IN 2019 (PRELIMINARY)**
15
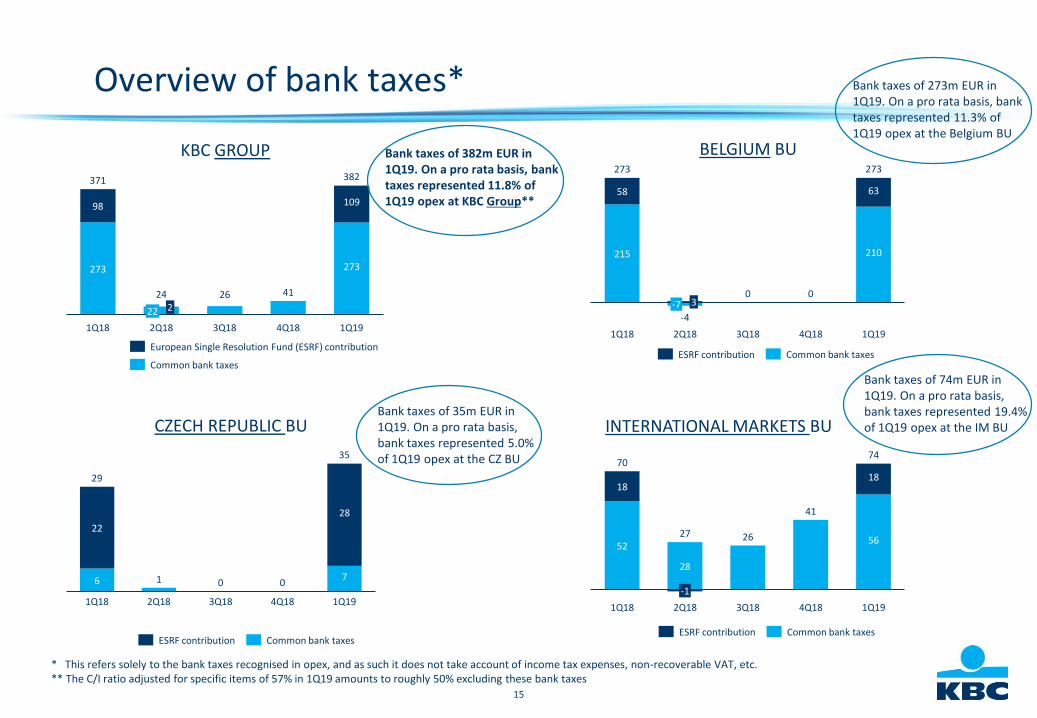
Overview of bank taxes*
INTERNATIONAL MARKETS BUCZECH REPUBLIC BU
BELGIUM BUKBC GROUP
52
28
26
41
56
1818
1Q191Q18
-1
2Q18 3Q18 4Q18
70
27
74
ESRF contribution Common bank taxes
215 210
58 63
4Q18
273
-7
1Q18
3
1Q192Q18 3Q18
-4
0 0
273
ESRF contribution Common bank taxes
6 1 7
22
28
2Q181Q18
29
3Q18
0
1Q194Q18
0
35
ESRF contribution Common bank taxes
273
26 41
273
98 109
1Q194Q18
22
1Q18
2
3Q182Q18
371
24
382
European Single Resolution Fund (ESRF) contribution
Common bank taxes
* This refers solely to the bank taxes recognised in opex, and as such it does not take account of income tax expenses, non-recoverable VAT, etc.** The C/I ratio adjusted for specific items of 57% in 1Q19 amounts to roughly 50% excluding these bank taxes
Bank taxes of 382m EUR in 1Q19. On a pro rata basis, banktaxes represented 11.8% of 1Q19 opex at KBC Group**
Bank taxes of 273m EUR in 1Q19. On a pro rata basis, banktaxes represented 11.3% of 1Q19 opex at the Belgium BU
Bank taxes of 35m EUR in 1Q19. On a pro rata basis, bank taxes represented 5.0% of 1Q19 opex at the CZ BU
Bank taxes of 74m EUR in 1Q19. On a pro rata basis, bank taxes represented 19.4% of 1Q19 opex at the IM BU
16
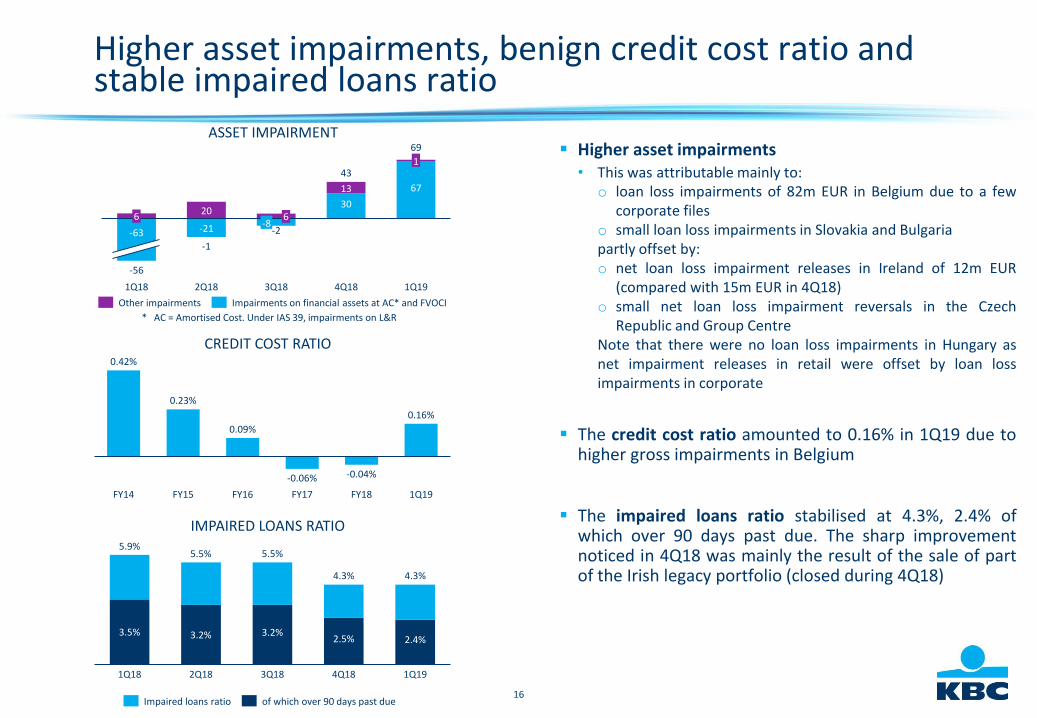
Higher asset impairments, benign credit cost ratio and stable impaired loans ratio
▪ Higher asset impairments• This was attributable mainly to:
o loan loss impairments of 82m EUR in Belgium due to a fewcorporate files
o small loan loss impairments in Slovakia and Bulgariapartly offset by:o net loan loss impairment releases in Ireland of 12m EUR
(compared with 15m EUR in 4Q18)o small net loan loss impairment reversals in the Czech
Republic and Group CentreNote that there were no loan loss impairments in Hungary asnet impairment releases in retail were offset by loan lossimpairments in corporate
▪ The credit cost ratio amounted to 0.16% in 1Q19 due tohigher gross impairments in Belgium
▪ The impaired loans ratio stabilised at 4.3%, 2.4% ofwhich over 90 days past due. The sharp improvementnoticed in 4Q18 was mainly the result of the sale of partof the Irish legacy portfolio (closed during 4Q18)
ASSET IMPAIRMENT
2030
67
-216
1Q18
6
13
-63
2Q18
-8
3Q18 4Q18
1
1Q19
-56
-1
-2
43
69
IMPAIRED LOANS RATIO
2.5%3.5%
2Q181Q18
3.2%
4Q183Q18
3.2%
5.9%
2.4%
1Q19
5.5% 5.5%
4.3% 4.3%
CREDIT COST RATIO
1Q19FY16
0.42%
FY18FY14 FY15 FY17
0.23%
0.16%
0.09%
-0.06% -0.04%
Impaired loans ratio of which over 90 days past due
Other impairments Impairments on financial assets at AC* and FVOCI
* AC = Amortised Cost. Under IAS 39, impairments on L&R
17
KBC Group
Section 2
1Q 2019 performance of business units
18
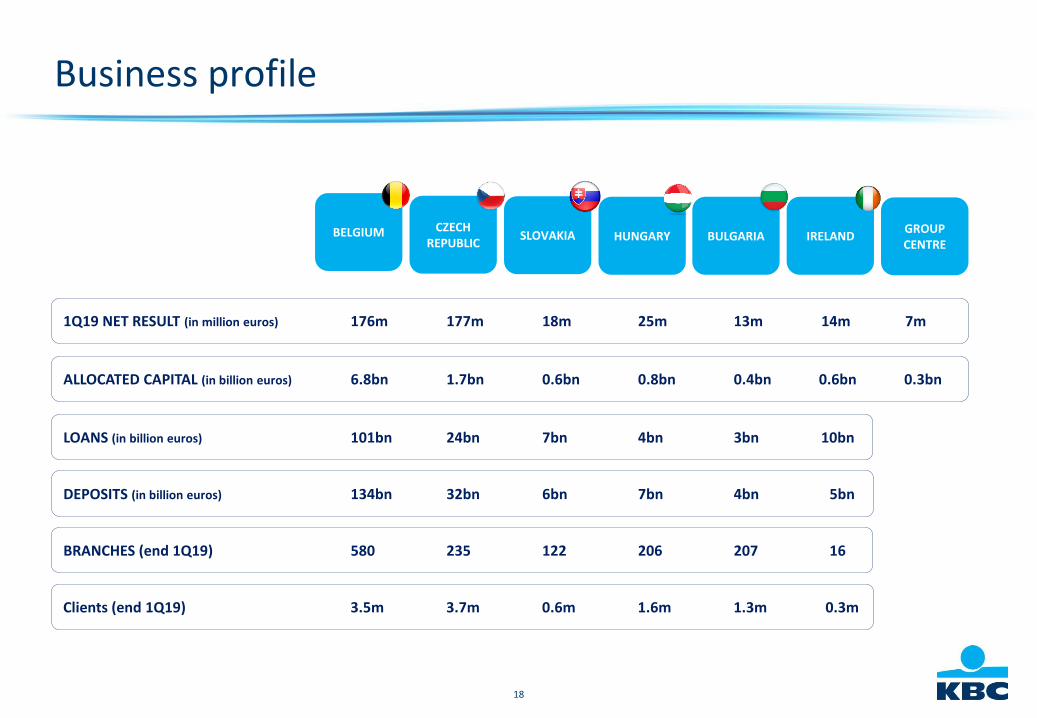
Business profile
1Q19 NET RESULT (in million euros) 176m 177m 18m 25m 13m 14m 7m
ALLOCATED CAPITAL (in billion euros) 6.8bn 1.7bn 0.6bn 0.8bn 0.4bn 0.6bn 0.3bn
LOANS (in billion euros) 101bn 24bn 7bn 4bn 3bn 10bn
BELGIUM CZECH REPUBLIC
SLOVAKIA HUNGARY BULGARIA IRELAND
DEPOSITS (in billion euros) 134bn 32bn 6bn 7bn 4bn 5bn
GROUPCENTRE
BRANCHES (end 1Q19) 580 235 122 206 207 16
Clients (end 1Q19) 3.5m 3.7m 0.6m 1.6m 1.3m 0.3m
19
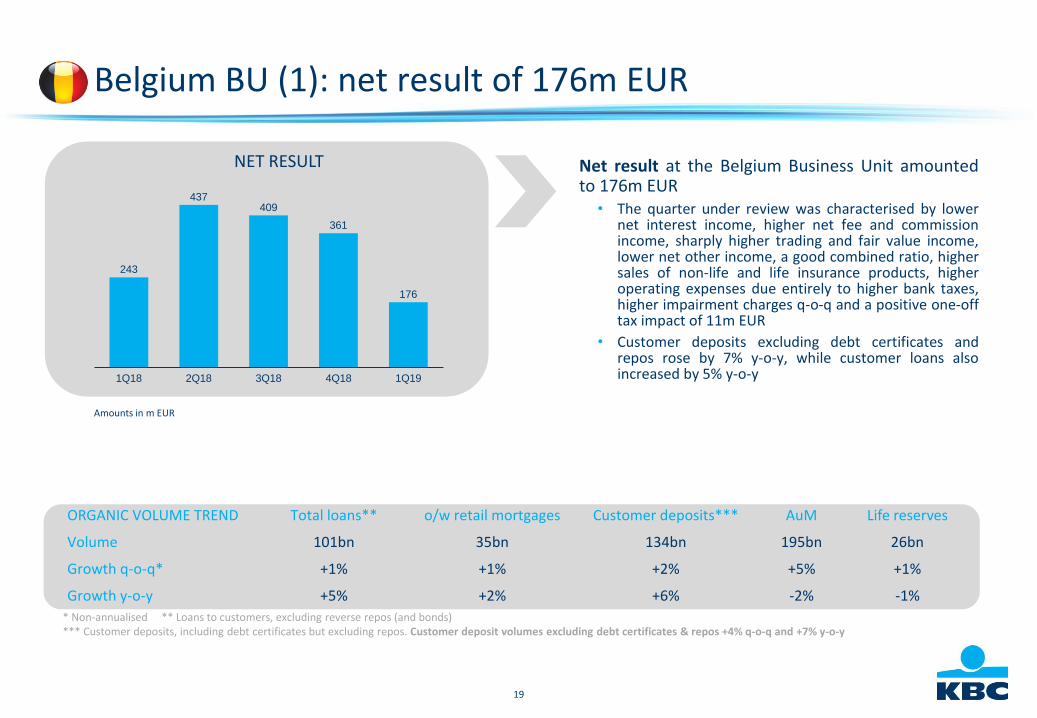
Belgium BU (1): net result of 176m EUR
Net result at the Belgium Business Unit amountedto 176m EUR
• The quarter under review was characterised by lowernet interest income, higher net fee and commissionincome, sharply higher trading and fair value income,lower net other income, a good combined ratio, highersales of non-life and life insurance products, higheroperating expenses due entirely to higher bank taxes,higher impairment charges q-o-q and a positive one-offtax impact of 11m EUR
• Customer deposits excluding debt certificates andrepos rose by 7% y-o-y, while customer loans alsoincreased by 5% y-o-y
243
437409
361
176
4Q181Q18 2Q18 3Q18 1Q19
NET RESULT
Amounts in m EUR
* Non-annualised ** Loans to customers, excluding reverse repos (and bonds) *** Customer deposits, including debt certificates but excluding repos. Customer deposit volumes excluding debt certificates & repos +4% q-o-q and +7% y-o-y
ORGANIC VOLUME TREND Total loans** o/w retail mortgages Customer deposits*** AuM Life reserves
Volume 101bn 35bn 134bn 195bn 26bn
Growth q-o-q* +1% +1% +2% +5% +1%
Growth y-o-y +5% +2% +6% -2% -1%
20
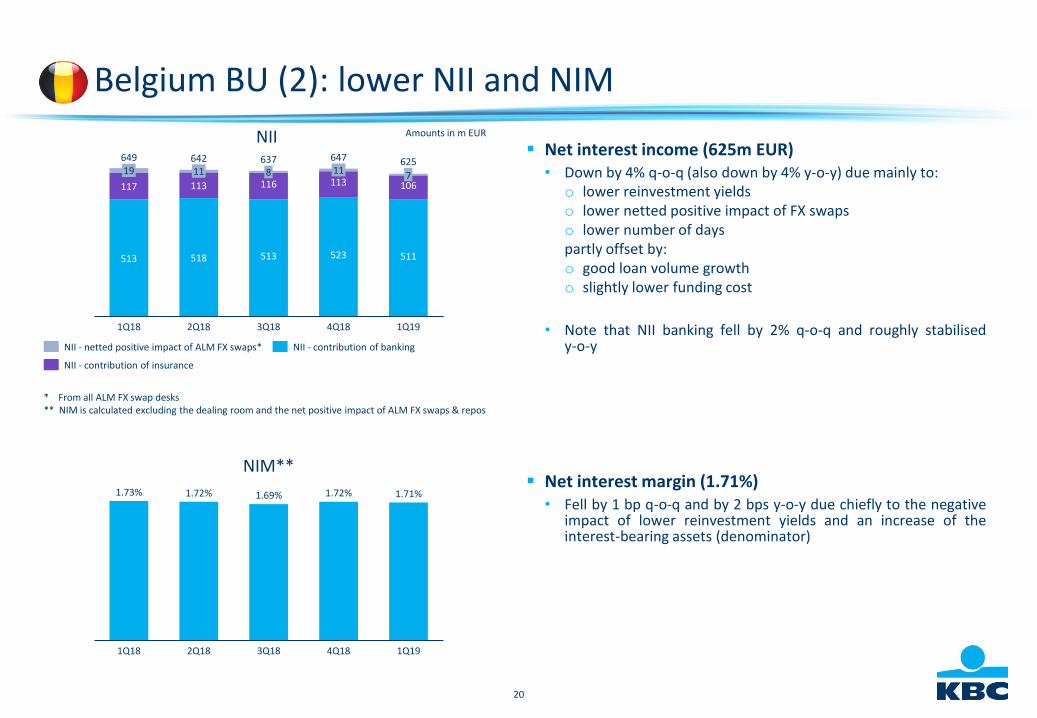
Belgium BU (2): lower NII and NIM
▪ Net interest income (625m EUR)• Down by 4% q-o-q (also down by 4% y-o-y) due mainly to:
o lower reinvestment yieldso lower netted positive impact of FX swapso lower number of dayspartly offset by:o good loan volume growtho slightly lower funding cost
• Note that NII banking fell by 2% q-o-q and roughly stabilisedy-o-y
▪ Net interest margin (1.71%)• Fell by 1 bp q-o-q and by 2 bps y-o-y due chiefly to the negative
impact of lower reinvestment yields and an increase of theinterest-bearing assets (denominator)
NIM**
NII Amounts in m EUR
513 518 513 523 511
117 113 116 113 106819
1Q18
11
1Q192Q18 4Q183Q18
64211 7
649 637 647 625
2Q181Q18
1.72%
4Q18
1.73%
3Q18 1Q19
1.69% 1.72% 1.71%
NII - contribution of bankingNII - netted positive impact of ALM FX swaps*
NII - contribution of insurance
* From all ALM FX swap desks** NIM is calculated excluding the dealing room and the net positive impact of ALM FX swaps & repos
21
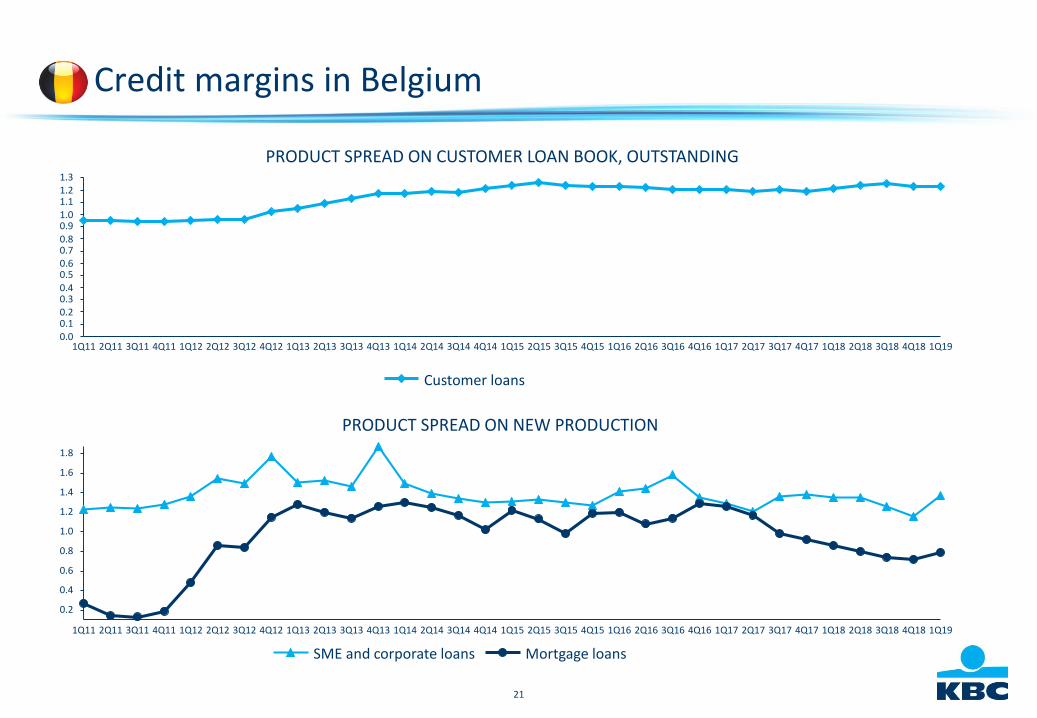
Credit margins in Belgium
PRODUCT SPREAD ON CUSTOMER LOAN BOOK, OUTSTANDING
PRODUCT SPREAD ON NEW PRODUCTION
0.8
0.4
0.0
0.6
0.1
1.0
1.3
0.2
0.7
0.3
0.5
1.21.1
0.9
1Q14 4Q164Q11 4Q134Q12 1Q181Q13 2Q141Q11 2Q11 3Q11 1Q12 2Q12 2Q13 3Q13 3Q14 1Q194Q14 1Q15 2Q153Q12 4Q15 3Q171Q16 2Q16 3Q163Q15 2Q17 3Q184Q17 2Q18 4Q181Q17
Customer loans
0.2
1.0
0.4
1.8
1.4
0.6
1.6
0.8
1.2
1Q13 3Q151Q15 2Q181Q17 1Q194Q15 1Q16 3Q171Q11 2Q11 3Q11 4Q11 3Q131Q12 2Q132Q12 3Q12 2Q174Q16 4Q174Q12 4Q13 4Q142Q14 3Q141Q14 2Q16 3Q16 1Q18 3Q18 4Q182Q15
SME and corporate loans Mortgage loans
22
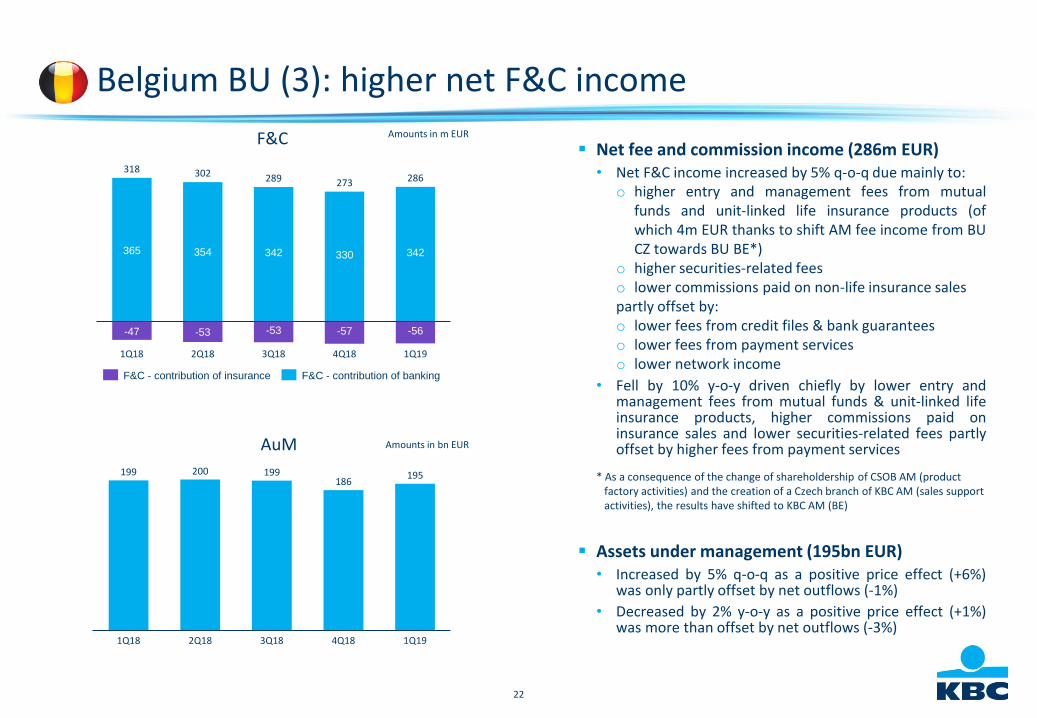
Belgium BU (3): higher net F&C income
▪ Net fee and commission income (286m EUR)• Net F&C income increased by 5% q-o-q due mainly to:
o higher entry and management fees from mutualfunds and unit-linked life insurance products (ofwhich 4m EUR thanks to shift AM fee income from BUCZ towards BU BE*)
o higher securities-related feeso lower commissions paid on non-life insurance salespartly offset by:o lower fees from credit files & bank guaranteeso lower fees from payment serviceso lower network income
• Fell by 10% y-o-y driven chiefly by lower entry andmanagement fees from mutual funds & unit-linked lifeinsurance products, higher commissions paid oninsurance sales and lower securities-related fees partlyoffset by higher fees from payment services
▪ Assets under management (195bn EUR)• Increased by 5% q-o-q as a positive price effect (+6%)
was only partly offset by net outflows (-1%)
• Decreased by 2% y-o-y as a positive price effect (+1%)was more than offset by net outflows (-3%)
AuM Amounts in bn EUR
199 200 199186
195
1Q18 2Q18 1Q193Q18 4Q18
F&C
365 354 342 330 342
-47 -53 -53 -57 -56
2Q181Q18 3Q18 1Q194Q18
318 302 289 273 286
Amounts in m EUR
F&C - contribution of insurance F&C - contribution of banking
* As a consequence of the change of shareholdership of CSOB AM (productfactory activities) and the creation of a Czech branch of KBC AM (sales supportactivities), the results have shifted to KBC AM (BE)
23
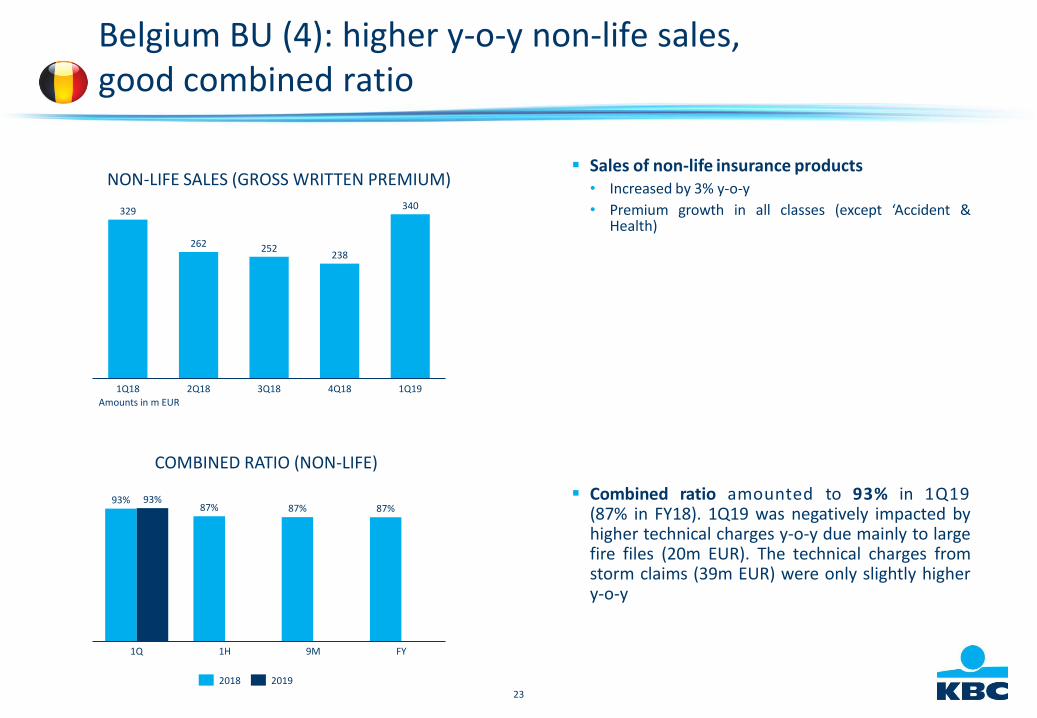
▪ Sales of non-life insurance products• Increased by 3% y-o-y
• Premium growth in all classes (except ‘Accident &Health)
▪ Combined ratio amounted to 93% in 1Q19(87% in FY18). 1Q19 was negatively impacted byhigher technical charges y-o-y due mainly to largefire files (20m EUR). The technical charges fromstorm claims (39m EUR) were only slightly highery-o-y
Belgium BU (4): higher y-o-y non-life sales, good combined ratio
COMBINED RATIO (NON-LIFE)
1H
87%
1Q 9M FY
93%87%
93%87%
2018 2019
NON-LIFE SALES (GROSS WRITTEN PREMIUM)
329
262 252238
340
3Q182Q181Q18 4Q18 1Q19
Amounts in m EUR
24
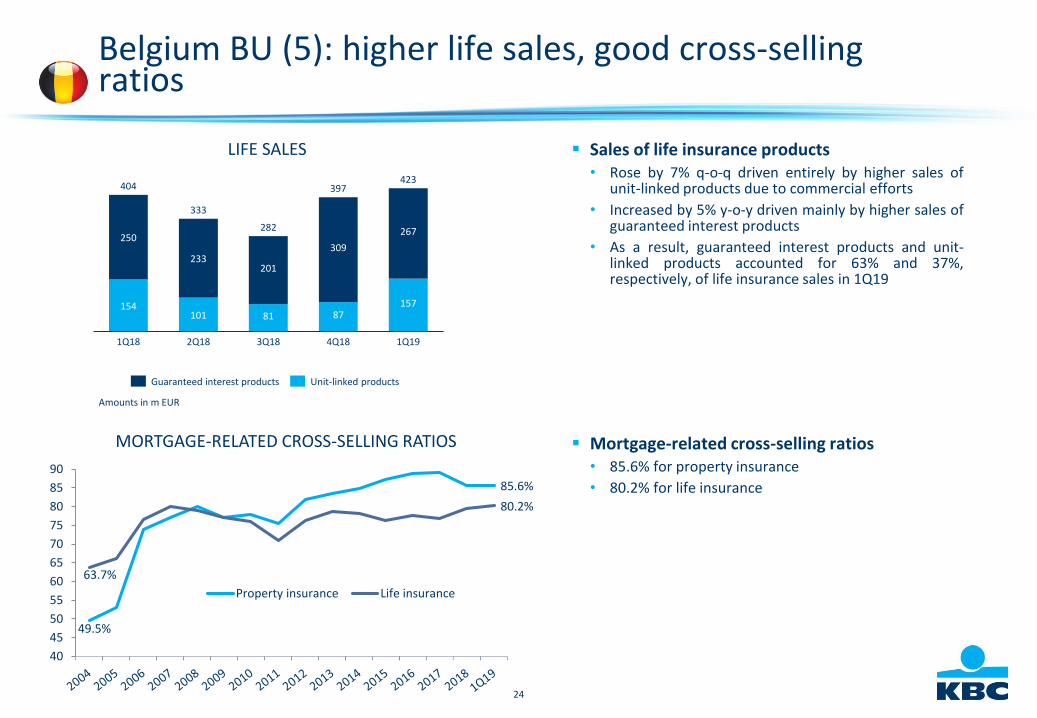
Belgium BU (5): higher life sales, good cross-sellingratios
▪ Sales of life insurance products• Rose by 7% q-o-q driven entirely by higher sales of
unit-linked products due to commercial efforts
• Increased by 5% y-o-y driven mainly by higher sales ofguaranteed interest products
• As a result, guaranteed interest products and unit-linked products accounted for 63% and 37%,respectively, of life insurance sales in 1Q19
▪ Mortgage-related cross-selling ratios• 85.6% for property insurance
• 80.2% for life insurance
LIFE SALES
Amounts in m EUR
154101 81 87
157
250
233201
309
267
1Q19
333
1Q18 2Q18 3Q18 4Q18
404
282
397423
Guaranteed interest products Unit-linked products
MORTGAGE-RELATED CROSS-SELLING RATIOS
49.5%
85.6%
63.7%
80.2%
40
45
50
55
60
65
70
75
80
85
90
Property insurance Life insurance
25
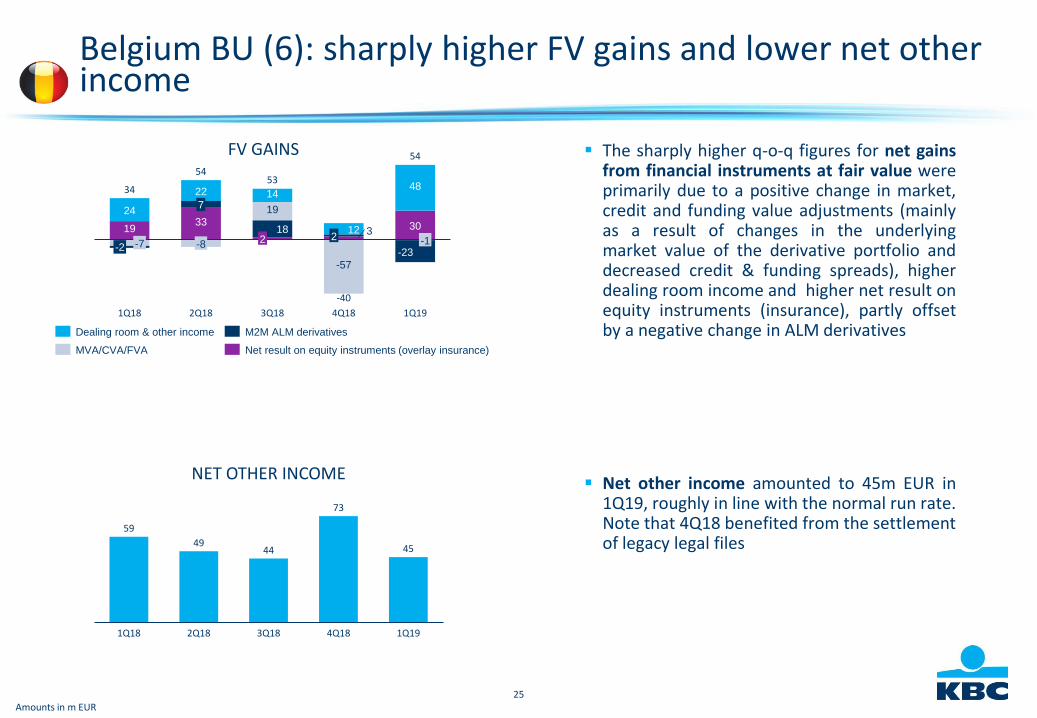
▪ The sharply higher q-o-q figures for net gainsfrom financial instruments at fair value wereprimarily due to a positive change in market,credit and funding value adjustments (mainlyas a result of changes in the underlyingmarket value of the derivative portfolio anddecreased credit & funding spreads), higherdealing room income and higher net result onequity instruments (insurance), partly offsetby a negative change in ALM derivatives
▪ Net other income amounted to 45m EUR in1Q19, roughly in line with the normal run rate.Note that 4Q18 benefited from the settlementof legacy legal files
Amounts in m EUR
59
4944
73
45
3Q181Q18 2Q18 4Q18 1Q19
NET OTHER INCOME
Belgium BU (6): sharply higher FV gains and lower net otherincome
FV GAINS
1933
24
18
4822
19
14
-57
-7
4Q18
-2
3Q18
54
1Q18
7
-8
54
2Q18
212
2
-40
3-1
-23
30
1Q19
3453
Dealing room & other income
Net result on equity instruments (overlay insurance)MVA/CVA/FVA
M2M ALM derivatives
26
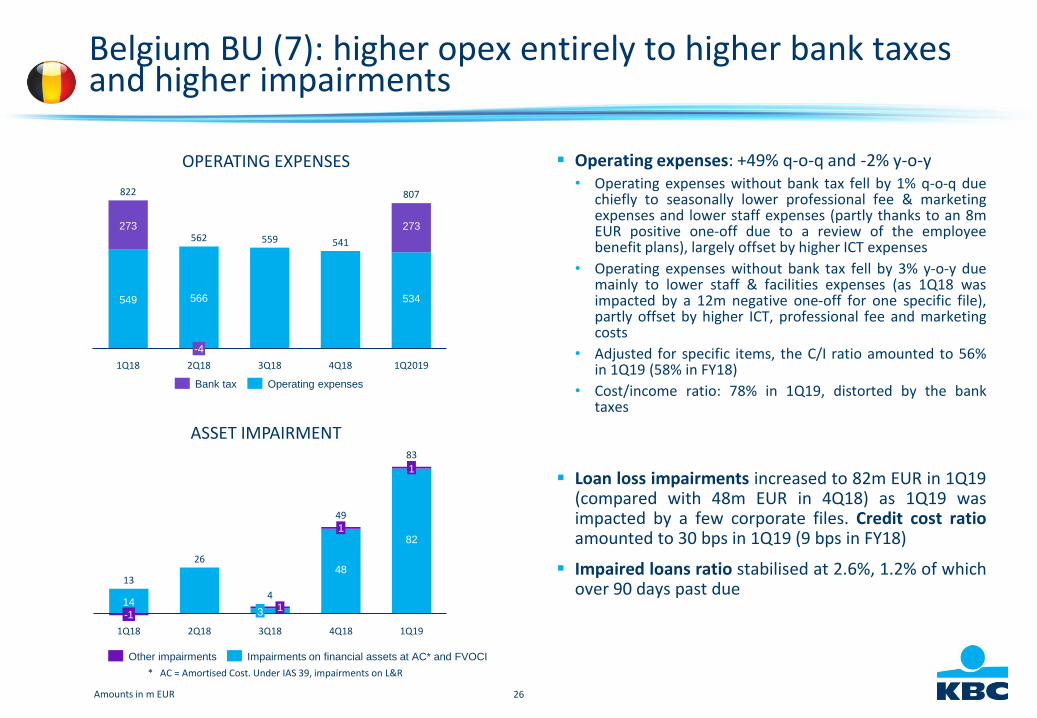
Belgium BU (7): higher opex entirely to higher bank taxesand higher impairments
▪ Operating expenses: +49% q-o-q and -2% y-o-y• Operating expenses without bank tax fell by 1% q-o-q due
chiefly to seasonally lower professional fee & marketingexpenses and lower staff expenses (partly thanks to an 8mEUR positive one-off due to a review of the employeebenefit plans), largely offset by higher ICT expenses
• Operating expenses without bank tax fell by 3% y-o-y duemainly to lower staff & facilities expenses (as 1Q18 wasimpacted by a 12m negative one-off for one specific file),partly offset by higher ICT, professional fee and marketingcosts
• Adjusted for specific items, the C/I ratio amounted to 56%in 1Q19 (58% in FY18)
• Cost/income ratio: 78% in 1Q19, distorted by the banktaxes
▪ Loan loss impairments increased to 82m EUR in 1Q19(compared with 48m EUR in 4Q18) as 1Q19 wasimpacted by a few corporate files. Credit cost ratioamounted to 30 bps in 1Q19 (9 bps in FY18)
▪ Impaired loans ratio stabilised at 2.6%, 1.2% of whichover 90 days past due
ASSET IMPAIRMENT
OPERATING EXPENSES
Amounts in m EUR
549 566
559 541
534
273 273
3Q18
822
1Q18
-4
2Q18 1Q20194Q18
807
562
14
2648
821
3-1
4Q181Q18 2Q18
1
3Q18
1
1Q19
13
4
49
83
Operating expensesBank tax
Impairments on financial assets at AC* and FVOCIOther impairments
* AC = Amortised Cost. Under IAS 39, impairments on L&R
27
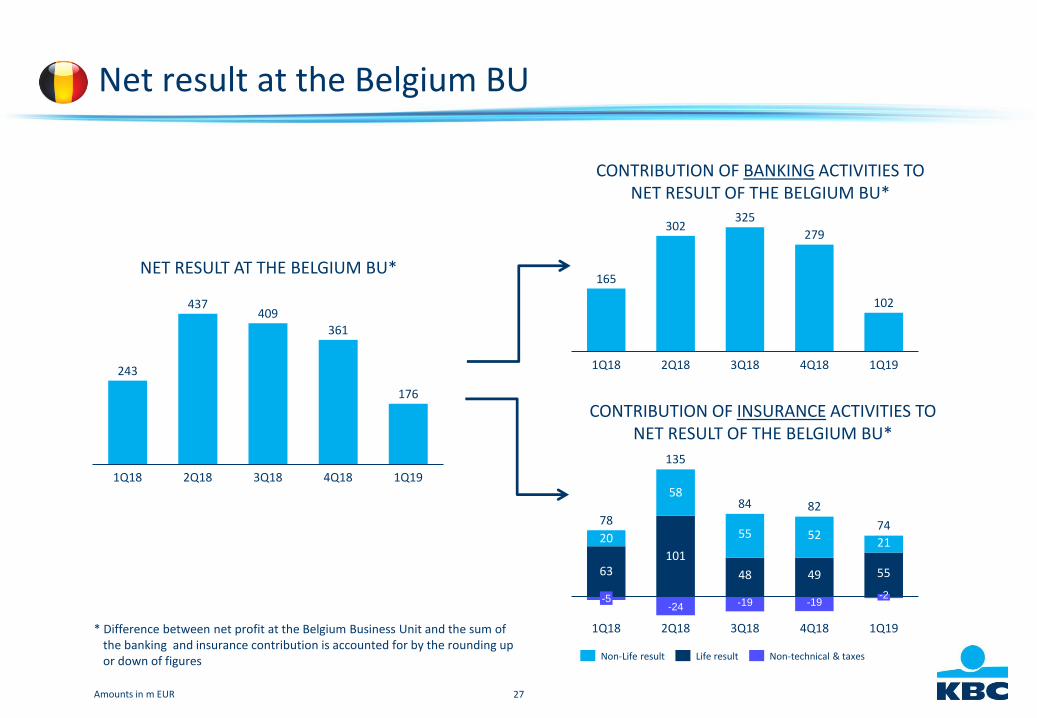
Net result at the Belgium BU
* Difference between net profit at the Belgium Business Unit and the sum of the banking and insurance contribution is accounted for by the rounding up or down of figures
CONTRIBUTION OF BANKING ACTIVITIES TO NET RESULT OF THE BELGIUM BU*
NET RESULT AT THE BELGIUM BU*
Amounts in m EUR
243
437409
361
176
1Q18 2Q18 1Q194Q183Q18
165
302325
279
102
1Q18 1Q192Q18 3Q18 4Q18
63101
48 49 55
20
58
55 5221
-24 -19 -19
2Q18
-5
135
1Q18 3Q18 4Q18
-2
1Q19
78
84 82
74
Non-Life result Life result Non-technical & taxes
CONTRIBUTION OF INSURANCE ACTIVITIES TO NET RESULT OF THE BELGIUM BU*
28
Czech Republic BU
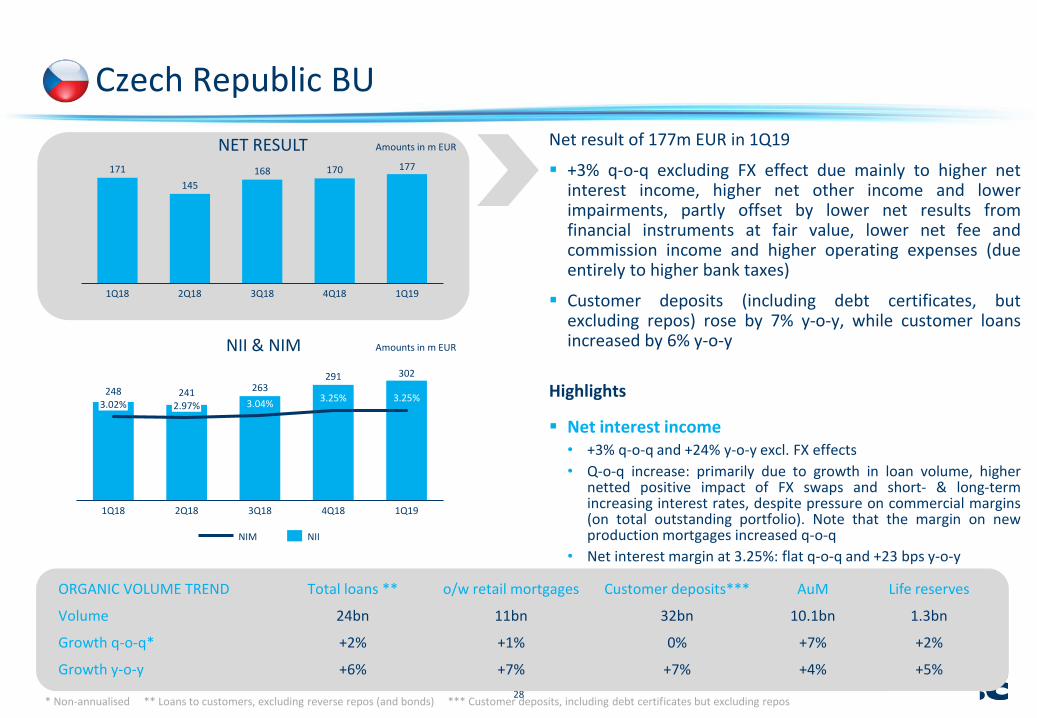
Net result of 177m EUR in 1Q19
▪ +3% q-o-q excluding FX effect due mainly to higher netinterest income, higher net other income and lowerimpairments, partly offset by lower net results fromfinancial instruments at fair value, lower net fee andcommission income and higher operating expenses (dueentirely to higher bank taxes)
▪ Customer deposits (including debt certificates, butexcluding repos) rose by 7% y-o-y, while customer loansincreased by 6% y-o-y
Highlights
▪ Net interest income• +3% q-o-q and +24% y-o-y excl. FX effects
• Q-o-q increase: primarily due to growth in loan volume, highernetted positive impact of FX swaps and short- & long-termincreasing interest rates, despite pressure on commercial margins(on total outstanding portfolio). Note that the margin on newproduction mortgages increased q-o-q
• Net interest margin at 3.25%: flat q-o-q and +23 bps y-o-y
NET RESULT Amounts in m EUR
171
145
168 170 177
4Q182Q181Q18 3Q18 1Q19
NII & NIM
248 241 263291 302
3.25%3.02%
4Q18
2.97%
1Q18 2Q18
3.04%
3Q18
3.25%
1Q19
NIINIM
Amounts in m EUR
ORGANIC VOLUME TREND Total loans ** o/w retail mortgages Customer deposits*** AuM Life reserves
Volume 24bn 11bn 32bn 10.1bn 1.3bn
Growth q-o-q* +2% +1% 0% +7% +2%
Growth y-o-y +6% +7% +7% +4% +5%
* Non-annualised ** Loans to customers, excluding reverse repos (and bonds) *** Customer deposits, including debt certificates but excluding repos
29
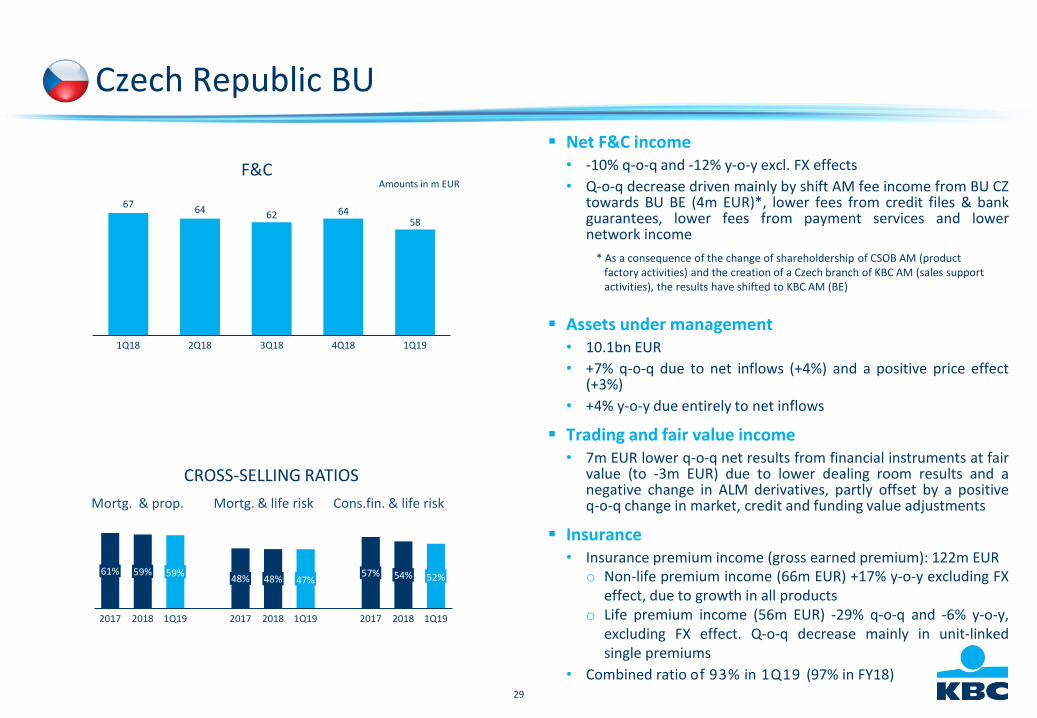
▪ Net F&C income• -10% q-o-q and -12% y-o-y excl. FX effects
• Q-o-q decrease driven mainly by shift AM fee income from BU CZtowards BU BE (4m EUR)*, lower fees from credit files & bankguarantees, lower fees from payment services and lowernetwork income
▪ Assets under management• 10.1bn EUR
• +7% q-o-q due to net inflows (+4%) and a positive price effect(+3%)
• +4% y-o-y due entirely to net inflows
▪ Trading and fair value income• 7m EUR lower q-o-q net results from financial instruments at fair
value (to -3m EUR) due to lower dealing room results and anegative change in ALM derivatives, partly offset by a positiveq-o-q change in market, credit and funding value adjustments
▪ Insurance• Insurance premium income (gross earned premium): 122m EUR
o Non-life premium income (66m EUR) +17% y-o-y excluding FXeffect, due to growth in all products
o Life premium income (56m EUR) -29% q-o-q and -6% y-o-y,excluding FX effect. Q-o-q decrease mainly in unit-linkedsingle premiums
• Combined ratio of 93% in 1Q19 (97% in FY18)
CROSS-SELLING RATIOS
Mortg. & prop. Mortg. & life risk Cons.fin. & life risk
1Q19
61%
20182017
59% 59%48%
1Q19
48%
20182017
47%
1Q19
57%
2017
54%
2018
52%
F&CAmounts in m EUR
6764 62 64
58
1Q192Q181Q18 3Q18 4Q18
Czech Republic BU
* As a consequence of the change of shareholdership of CSOB AM (productfactory activities) and the creation of a Czech branch of KBC AM (sales supportactivities), the results have shifted to KBC AM (BE)
30
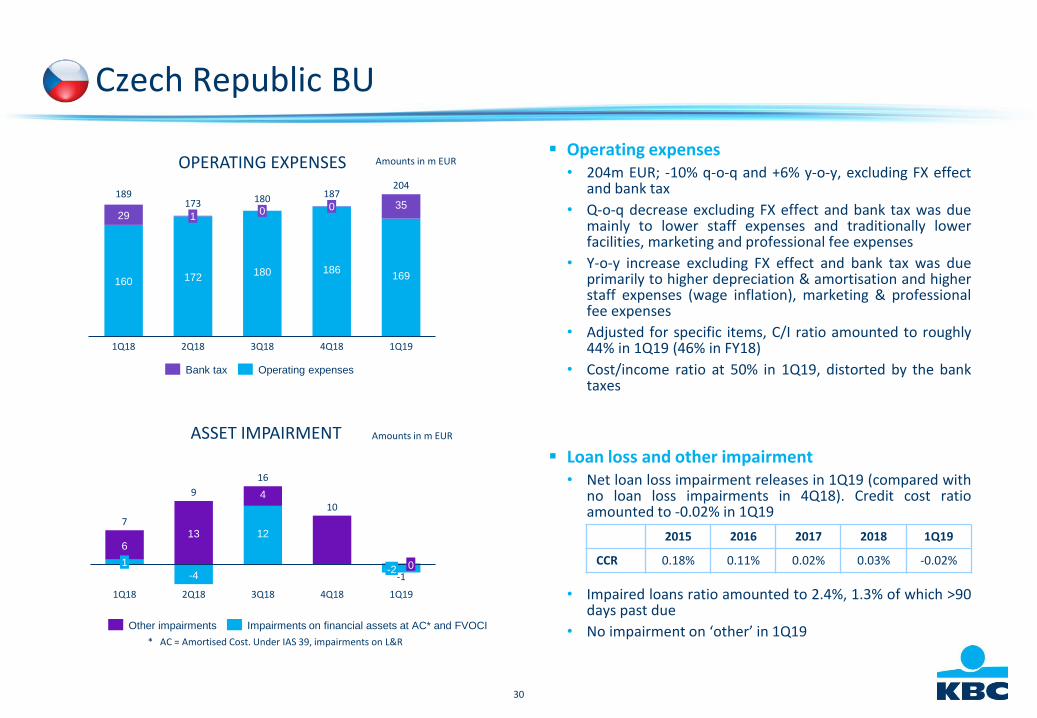
▪ Operating expenses• 204m EUR; -10% q-o-q and +6% y-o-y, excluding FX effect
and bank tax
• Q-o-q decrease excluding FX effect and bank tax was duemainly to lower staff expenses and traditionally lowerfacilities, marketing and professional fee expenses
• Y-o-y increase excluding FX effect and bank tax was dueprimarily to higher depreciation & amortisation and higherstaff expenses (wage inflation), marketing & professionalfee expenses
• Adjusted for specific items, C/I ratio amounted to roughly44% in 1Q19 (46% in FY18)
• Cost/income ratio at 50% in 1Q19, distorted by the banktaxes
▪ Loan loss and other impairment• Net loan loss impairment releases in 1Q19 (compared with
no loan loss impairments in 4Q18). Credit cost ratioamounted to -0.02% in 1Q19
• Impaired loans ratio amounted to 2.4%, 1.3% of which >90days past due
• No impairment on ‘other’ in 1Q19
OPERATING EXPENSES
160 172180 186
169
2935173
1Q18 3Q18
1
1Q192Q18
0 0180
4Q18
189 187204
2015 2016 2017 2018 1Q19
CCR 0.18% 0.11% 0.02% 0.03% -0.02%
Bank tax Operating expenses
Amounts in m EUR
Czech Republic BU
ASSET IMPAIRMENT
13 12
10
6
-4
4
4Q18
1
1Q191Q18 2Q18 3Q18
0
7
9
16
-1-2
Other impairments Impairments on financial assets at AC* and FVOCI
* AC = Amortised Cost. Under IAS 39, impairments on L&R
Amounts in m EUR
31
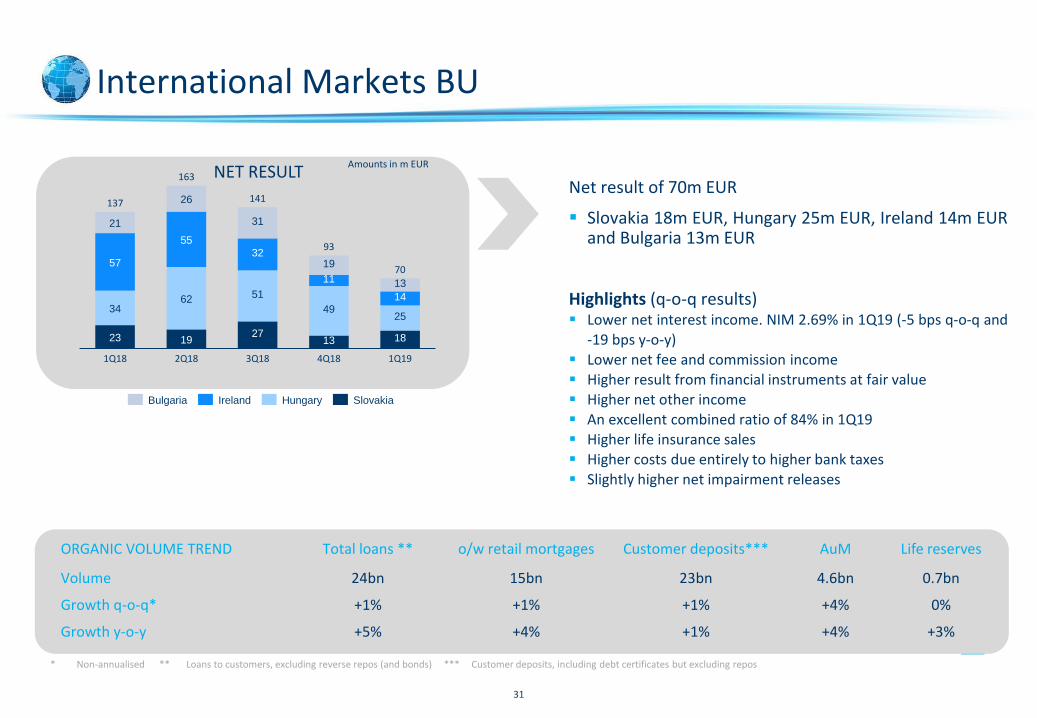
International Markets BU
ORGANIC VOLUME TREND Total loans ** o/w retail mortgages Customer deposits*** AuM Life reserves
Volume 24bn 15bn 23bn 4.6bn 0.7bn
Growth q-o-q* +1% +1% +1% +4% 0%
Growth y-o-y +5% +4% +1% +4% +3%
NET RESULTAmounts in m EUR
23 1927
13 18
3462 51
4925
57
55
32
11
14
21
26
31
19
13
1Q18 2Q18 3Q18
137
4Q18
141
1Q19
163
93
70
Net result of 70m EUR
▪ Slovakia 18m EUR, Hungary 25m EUR, Ireland 14m EURand Bulgaria 13m EUR
Highlights (q-o-q results)▪ Lower net interest income. NIM 2.69% in 1Q19 (-5 bps q-o-q and
-19 bps y-o-y)▪ Lower net fee and commission income
▪ Higher result from financial instruments at fair value▪ Higher net other income▪ An excellent combined ratio of 84% in 1Q19▪ Higher life insurance sales▪ Higher costs due entirely to higher bank taxes▪ Slightly higher net impairment releases
Bulgaria SlovakiaIreland Hungary
* Non-annualised ** Loans to customers, excluding reverse repos (and bonds) *** Customer deposits, including debt certificates but excluding repos
32
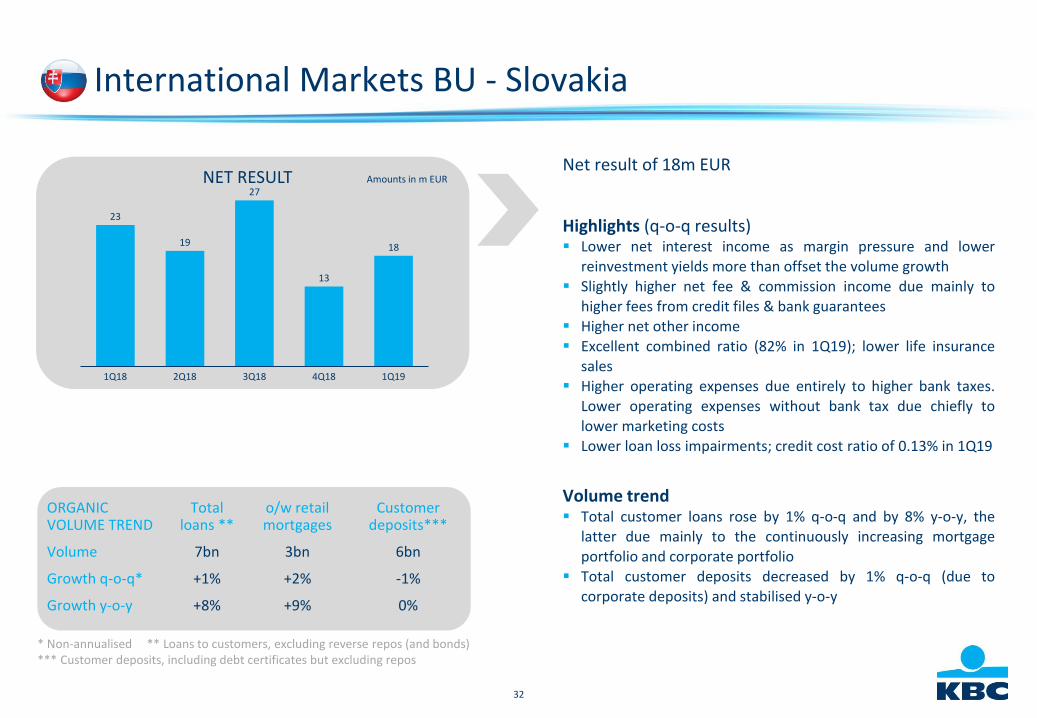
International Markets BU - Slovakia
Net result of 18m EUR
Highlights (q-o-q results)▪ Lower net interest income as margin pressure and lower
reinvestment yields more than offset the volume growth▪ Slightly higher net fee & commission income due mainly to
higher fees from credit files & bank guarantees▪ Higher net other income▪ Excellent combined ratio (82% in 1Q19); lower life insurance
sales▪ Higher operating expenses due entirely to higher bank taxes.
Lower operating expenses without bank tax due chiefly to
lower marketing costs▪ Lower loan loss impairments; credit cost ratio of 0.13% in 1Q19
Volume trend▪ Total customer loans rose by 1% q-o-q and by 8% y-o-y, the
latter due mainly to the continuously increasing mortgageportfolio and corporate portfolio
▪ Total customer deposits decreased by 1% q-o-q (due to
corporate deposits) and stabilised y-o-y
* Non-annualised ** Loans to customers, excluding reverse repos (and bonds)*** Customer deposits, including debt certificates but excluding repos
ORGANIC VOLUME TREND
Total loans **
o/w retail mortgages
Customerdeposits***
Volume 7bn 3bn 6bn
Growth q-o-q* +1% +2% -1%
Growth y-o-y +8% +9% 0%
NET RESULT Amounts in m EUR
23
19
27
13
18
4Q181Q18 2Q18 3Q18 1Q19
33
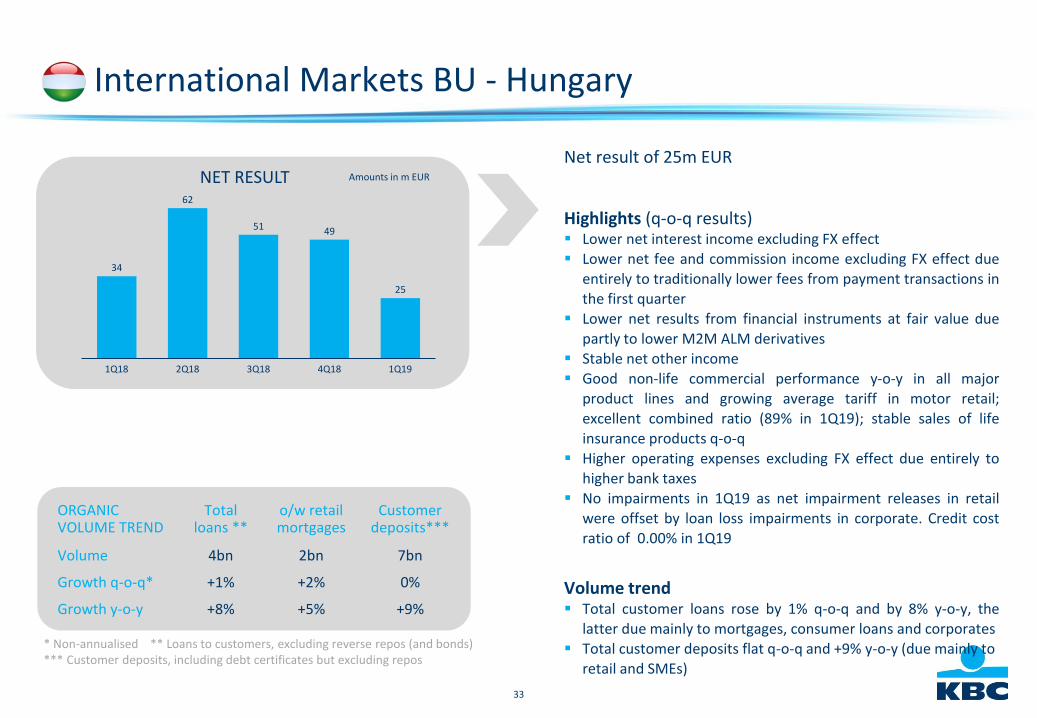
International Markets BU - Hungary
NET RESULT Amounts in m EUR
34
62
51 49
25
1Q18 1Q192Q18 3Q18 4Q18
* Non-annualised ** Loans to customers, excluding reverse repos (and bonds)*** Customer deposits, including debt certificates but excluding repos
ORGANIC VOLUME TREND
Total loans **
o/w retail mortgages
Customer deposits***
Volume 4bn 2bn 7bn
Growth q-o-q* +1% +2% 0%
Growth y-o-y +8% +5% +9%
Net result of 25m EUR
Highlights (q-o-q results)▪ Lower net interest income excluding FX effect▪ Lower net fee and commission income excluding FX effect due
entirely to traditionally lower fees from payment transactions inthe first quarter
▪ Lower net results from financial instruments at fair value duepartly to lower M2M ALM derivatives
▪ Stable net other income▪ Good non-life commercial performance y-o-y in all major
product lines and growing average tariff in motor retail;excellent combined ratio (89% in 1Q19); stable sales of lifeinsurance products q-o-q
▪ Higher operating expenses excluding FX effect due entirely tohigher bank taxes
▪ No impairments in 1Q19 as net impairment releases in retailwere offset by loan loss impairments in corporate. Credit costratio of 0.00% in 1Q19
Volume trend▪ Total customer loans rose by 1% q-o-q and by 8% y-o-y, the
latter due mainly to mortgages, consumer loans and corporates▪ Total customer deposits flat q-o-q and +9% y-o-y (due mainly to
retail and SMEs)
34
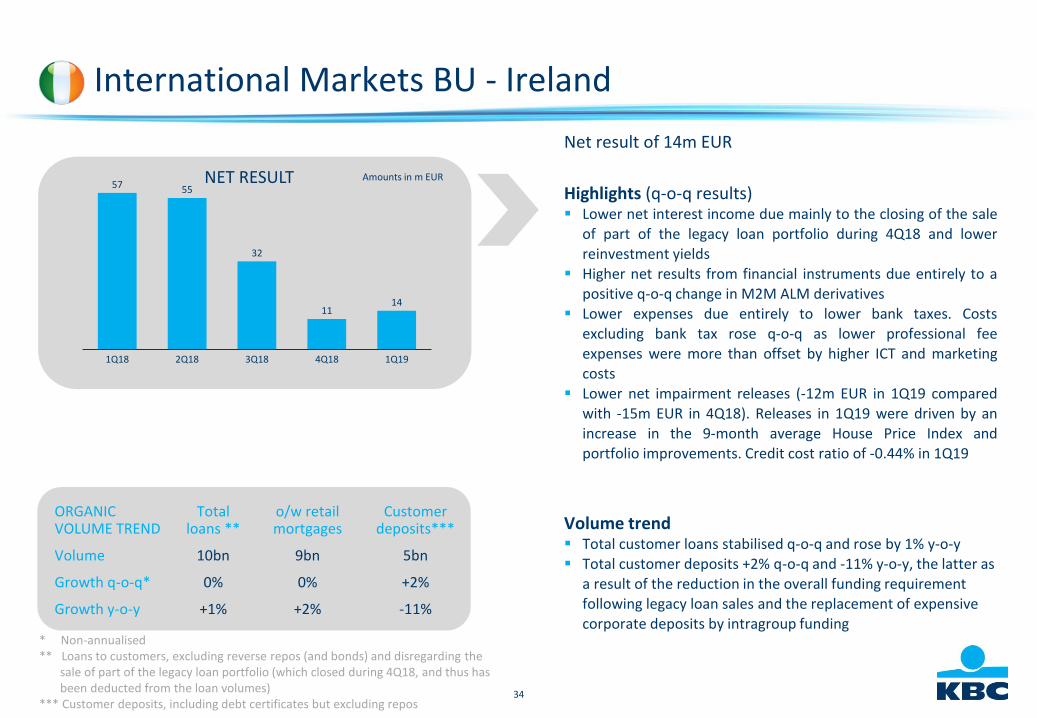
International Markets BU - Ireland
NET RESULT Amounts in m EUR57 55
32
1114
1Q18 2Q18 3Q18 4Q18 1Q19
* Non-annualised ** Loans to customers, excluding reverse repos (and bonds) and disregarding the
sale of part of the legacy loan portfolio (which closed during 4Q18, and thus has been deducted from the loan volumes)
*** Customer deposits, including debt certificates but excluding repos
ORGANIC VOLUME TREND
Total loans **
o/w retail mortgages
Customer deposits***
Volume 10bn 9bn 5bn
Growth q-o-q* 0% 0% +2%
Growth y-o-y +1% +2% -11%
Net result of 14m EUR
Highlights (q-o-q results)▪ Lower net interest income due mainly to the closing of the sale
of part of the legacy loan portfolio during 4Q18 and lower
reinvestment yields▪ Higher net results from financial instruments due entirely to a
positive q-o-q change in M2M ALM derivatives▪ Lower expenses due entirely to lower bank taxes. Costs
excluding bank tax rose q-o-q as lower professional feeexpenses were more than offset by higher ICT and marketingcosts
▪ Lower net impairment releases (-12m EUR in 1Q19 comparedwith -15m EUR in 4Q18). Releases in 1Q19 were driven by anincrease in the 9-month average House Price Index andportfolio improvements. Credit cost ratio of -0.44% in 1Q19
Volume trend▪ Total customer loans stabilised q-o-q and rose by 1% y-o-y▪ Total customer deposits +2% q-o-q and -11% y-o-y, the latter as
a result of the reduction in the overall funding requirement following legacy loan sales and the replacement of expensive corporate deposits by intragroup funding
35
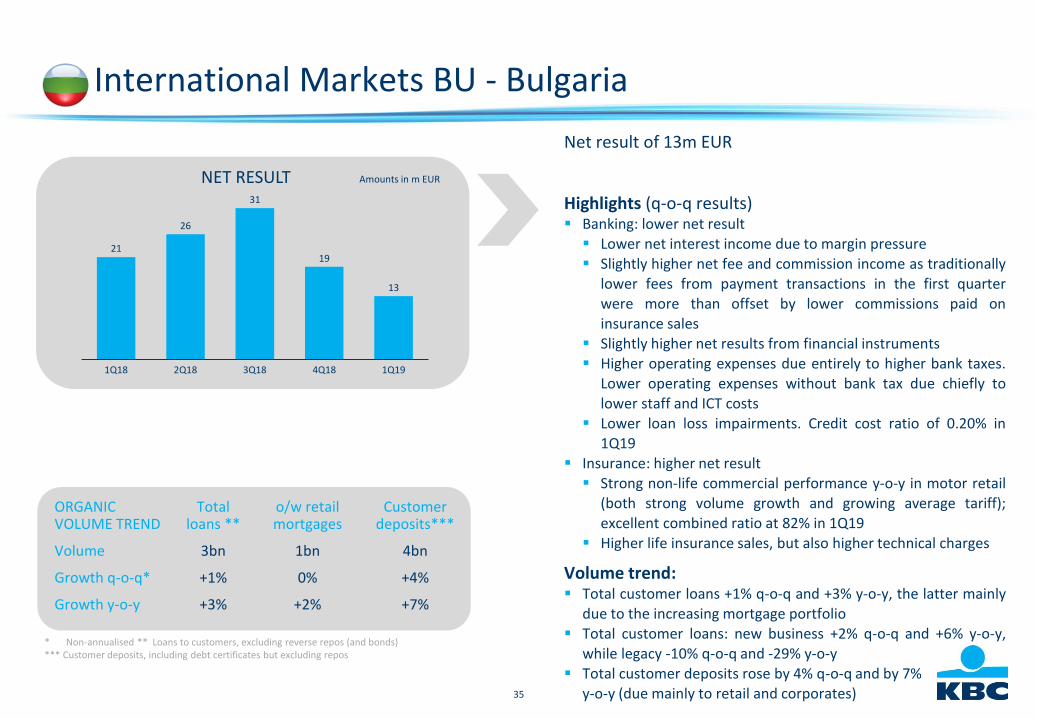
International Markets BU - Bulgaria
NET RESULT Amounts in m EUR
21
26
31
19
13
1Q18 2Q18 3Q18 1Q194Q18
ORGANIC VOLUME TREND
Total loans **
o/w retail mortgages
Customer deposits***
Volume 3bn 1bn 4bn
Growth q-o-q* +1% 0% +4%
Growth y-o-y +3% +2% +7%
Net result of 13m EUR
Highlights (q-o-q results)▪ Banking: lower net result▪ Lower net interest income due to margin pressure▪ Slightly higher net fee and commission income as traditionally
lower fees from payment transactions in the first quarterwere more than offset by lower commissions paid oninsurance sales
▪ Slightly higher net results from financial instruments▪ Higher operating expenses due entirely to higher bank taxes.
Lower operating expenses without bank tax due chiefly tolower staff and ICT costs
▪ Lower loan loss impairments. Credit cost ratio of 0.20% in1Q19
▪ Insurance: higher net result▪ Strong non-life commercial performance y-o-y in motor retail
(both strong volume growth and growing average tariff);excellent combined ratio at 82% in 1Q19
▪ Higher life insurance sales, but also higher technical charges
Volume trend:▪ Total customer loans +1% q-o-q and +3% y-o-y, the latter mainly
due to the increasing mortgage portfolio▪ Total customer loans: new business +2% q-o-q and +6% y-o-y,
while legacy -10% q-o-q and -29% y-o-y
▪ Total customer deposits rose by 4% q-o-q and by 7% y-o-y (due mainly to retail and corporates)
* Non-annualised ** Loans to customers, excluding reverse repos (and bonds) *** Customer deposits, including debt certificates but excluding repos
36
Group Centre
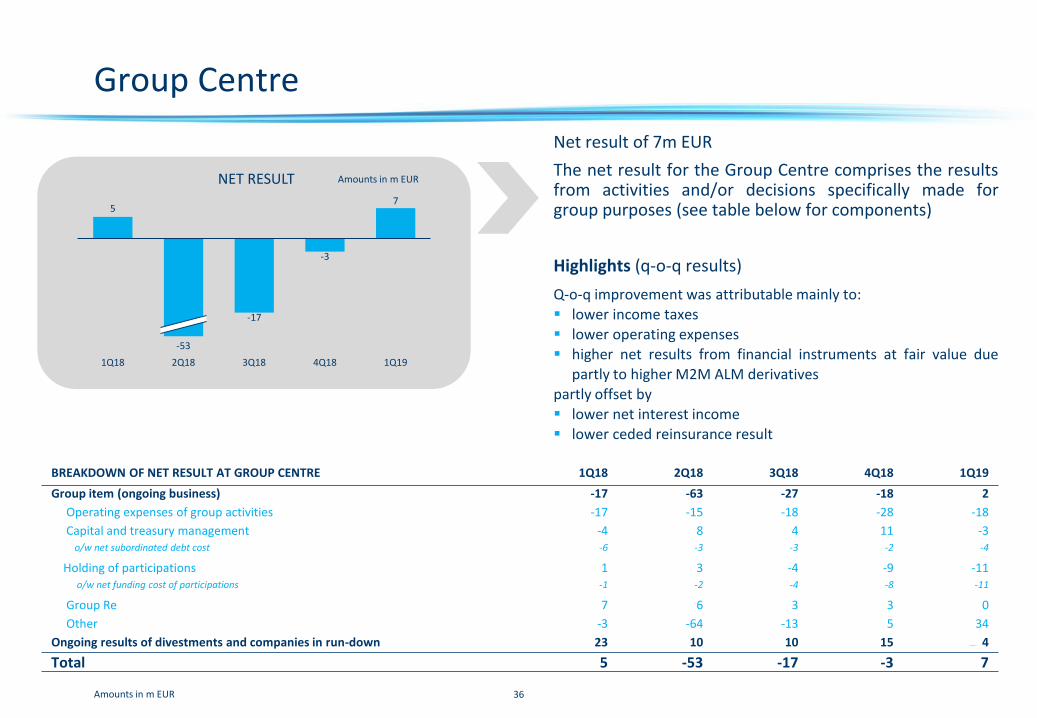
Net result of 7m EUR
The net result for the Group Centre comprises the resultsfrom activities and/or decisions specifically made forgroup purposes (see table below for components)
Highlights (q-o-q results)
Q-o-q improvement was attributable mainly to:▪ lower income taxes▪ lower operating expenses▪ higher net results from financial instruments at fair value due
partly to higher M2M ALM derivatives
partly offset by▪ lower net interest income▪ lower ceded reinsurance result
NET RESULT
Amounts in m EUR
5
-17
-3
7
4Q183Q181Q18 2Q18 1Q19
-53
Amounts in m EUR
BREAKDOWN OF NET RESULT AT GROUP CENTRE 1Q18 2Q18 3Q18 4Q18 1Q19
Group item (ongoing business) -17 -63 -27 -18 2
Operating expenses of group activities -17 -15 -18 -28 -18
Capital and treasury management -4 8 4 11 -3o/w net subordinated debt cost -6 -3 -3 -2 -4
Holding of participations 1 3 -4 -9 -11o/w net funding cost of participations -1 -2 -4 -8 -11
Group Re 7 6 3 3 0
Other -3 -64 -13 5 34
Ongoing results of divestments and companies in run-down 23 10 10 15 4
Total 5 -53 -17 -3 7
37
NET PROFIT – BELGIUM NET PROFIT – CZECH REPUBLIC
330209
301 243176
2016
1,2231,234
20172015
1,2071,274
2018 2019
1,5641,432
1,5751,450
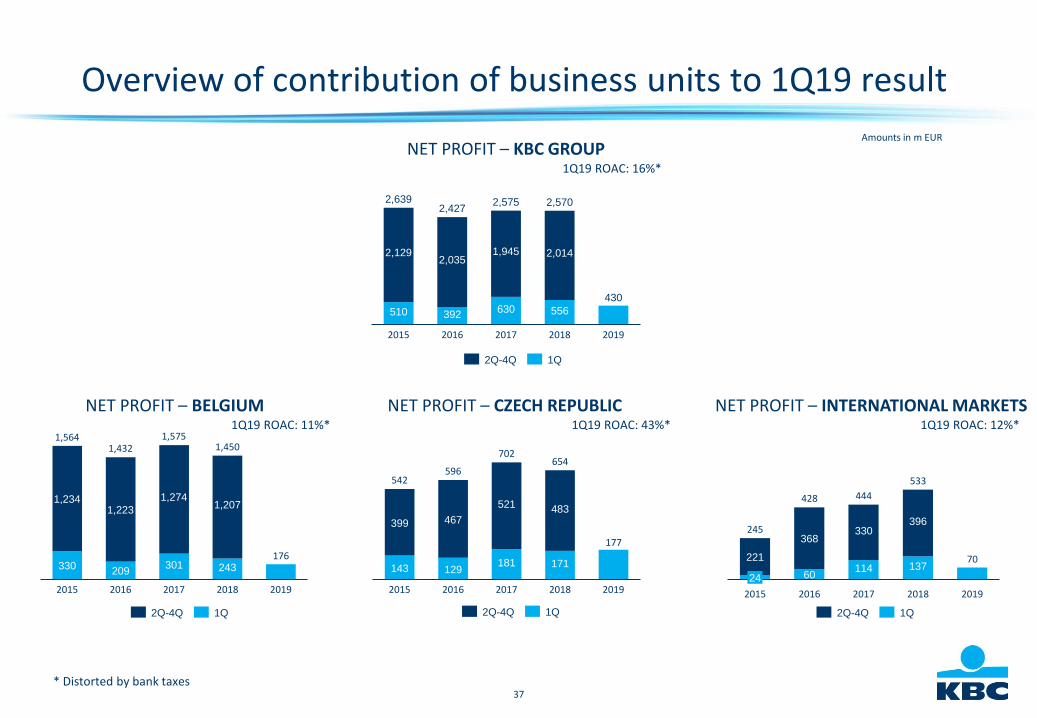
1Q19 ROAC: 11%*
Amounts in m EUR
143 129181 171
177
399 467
521 483
2015 20182016 20192017
702
542596
654
1Q19 ROAC: 43%*
NET PROFIT – INTERNATIONAL MARKETS
60114 137
70221
368330
396245
444
2015
24
2016 20182017 2019
428
533
1Q19 ROAC: 12%*
Overview of contribution of business units to 1Q19 result
2Q-4Q 1Q 2Q-4Q 1Q 1Q2Q-4Q
NET PROFIT – KBC GROUP
510 392630 556
430
2,0142,035
2016
2,575
2,129
2015
1,945
2017 2018 2019
2,6392,427
2,570
1Q19 ROAC: 16%*
2Q-4Q 1Q
* Distorted by bank taxes
38
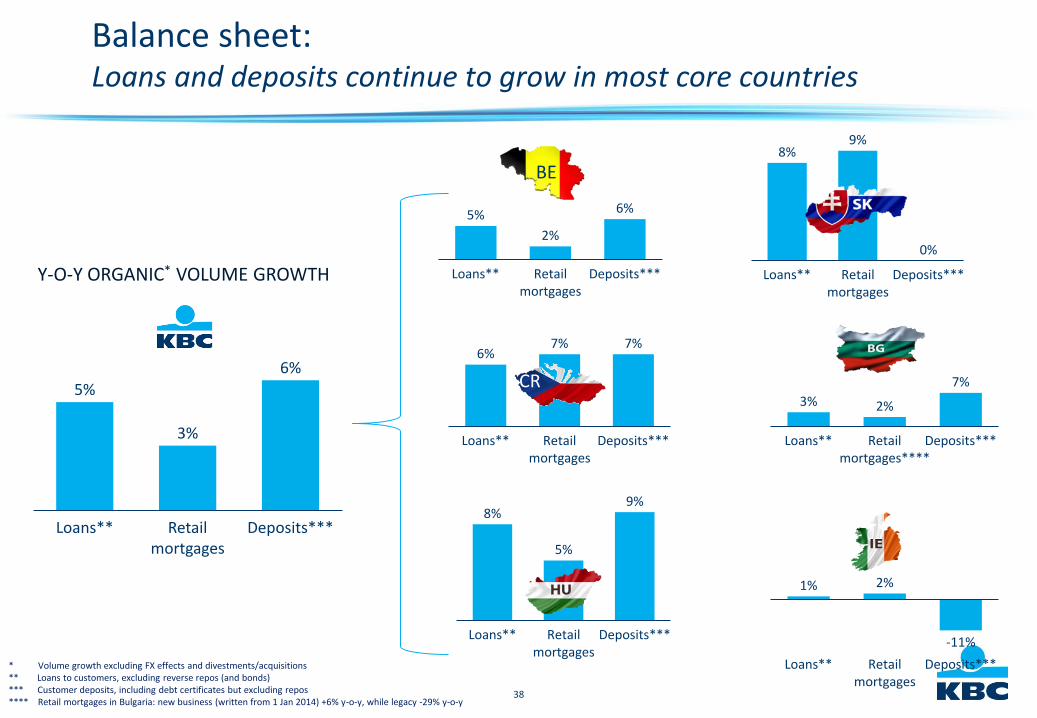
Y-O-Y ORGANIC* VOLUME GROWTH
4%
BE
* Volume growth excluding FX effects and divestments/acquisitions** Loans to customers, excluding reverse repos (and bonds)*** Customer deposits, including debt certificates but excluding repos**** Retail mortgages in Bulgaria: new business (written from 1 Jan 2014) +6% y-o-y, while legacy -29% y-o-y
Retail mortgages
Loans**
2%
Deposits***
5% 6%
6%
Deposits***Loans**
7%
Retail mortgages
7%
Loans**
2%
Retail mortgages****
Deposits***
3%
7%
Loans** Retail mortgages
9%8%
Deposits***
0%
Deposits***Retail mortgages
Loans**
9%8%
5%
Deposits***Loans**
2%
Retail mortgages
-11%
1%
Retail mortgages
Deposits***Loans**
5%
3%
6%
Balance sheet:Loans and deposits continue to grow in most core countries
CR
39
KBC Group
Section 3
Strong solvency andsolid liquidity
40
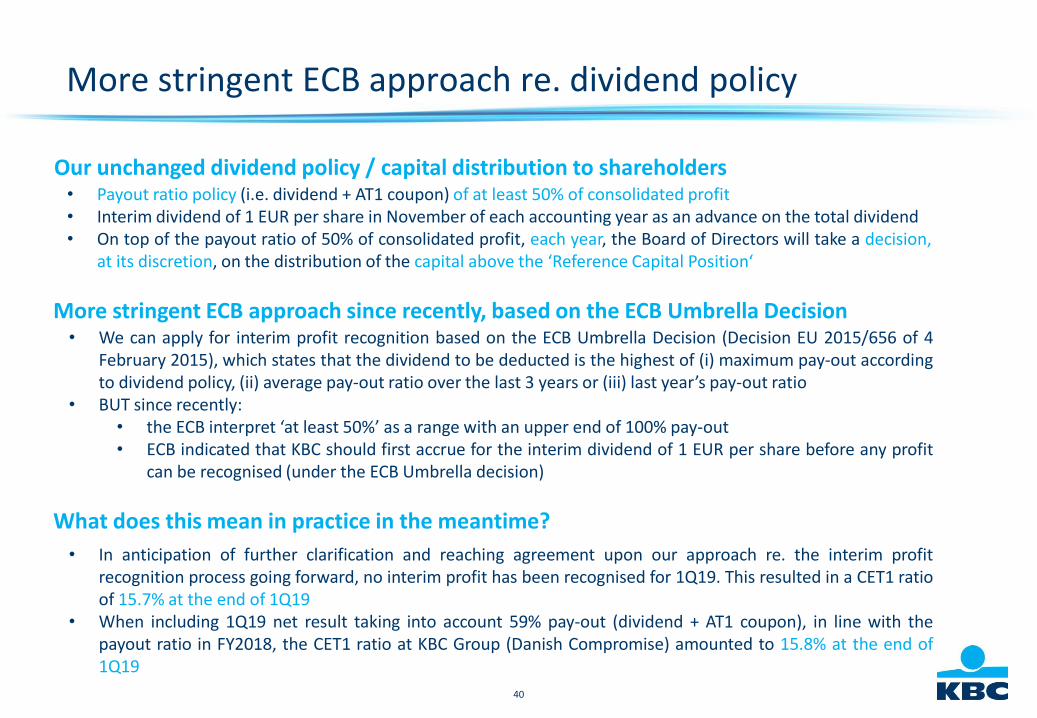
• Payout ratio policy (i.e. dividend + AT1 coupon) of at least 50% of consolidated profit• Interim dividend of 1 EUR per share in November of each accounting year as an advance on the total dividend• On top of the payout ratio of 50% of consolidated profit, each year, the Board of Directors will take a decision,
at its discretion, on the distribution of the capital above the ‘Reference Capital Position‘
Our unchanged dividend policy / capital distribution to shareholders
More stringent ECB approach re. dividend policy
• We can apply for interim profit recognition based on the ECB Umbrella Decision (Decision EU 2015/656 of 4February 2015), which states that the dividend to be deducted is the highest of (i) maximum pay-out accordingto dividend policy, (ii) average pay-out ratio over the last 3 years or (iii) last year’s pay-out ratio
• BUT since recently:• the ECB interpret ‘at least 50%’ as a range with an upper end of 100% pay-out• ECB indicated that KBC should first accrue for the interim dividend of 1 EUR per share before any profit
can be recognised (under the ECB Umbrella decision)
More stringent ECB approach since recently, based on the ECB Umbrella Decision
• In anticipation of further clarification and reaching agreement upon our approach re. the interim profitrecognition process going forward, no interim profit has been recognised for 1Q19. This resulted in a CET1 ratioof 15.7% at the end of 1Q19
• When including 1Q19 net result taking into account 59% pay-out (dividend + AT1 coupon), in line with thepayout ratio in FY2018, the CET1 ratio at KBC Group (Danish Compromise) amounted to 15.8% at the end of1Q19
What does this mean in practice in the meantime?
41
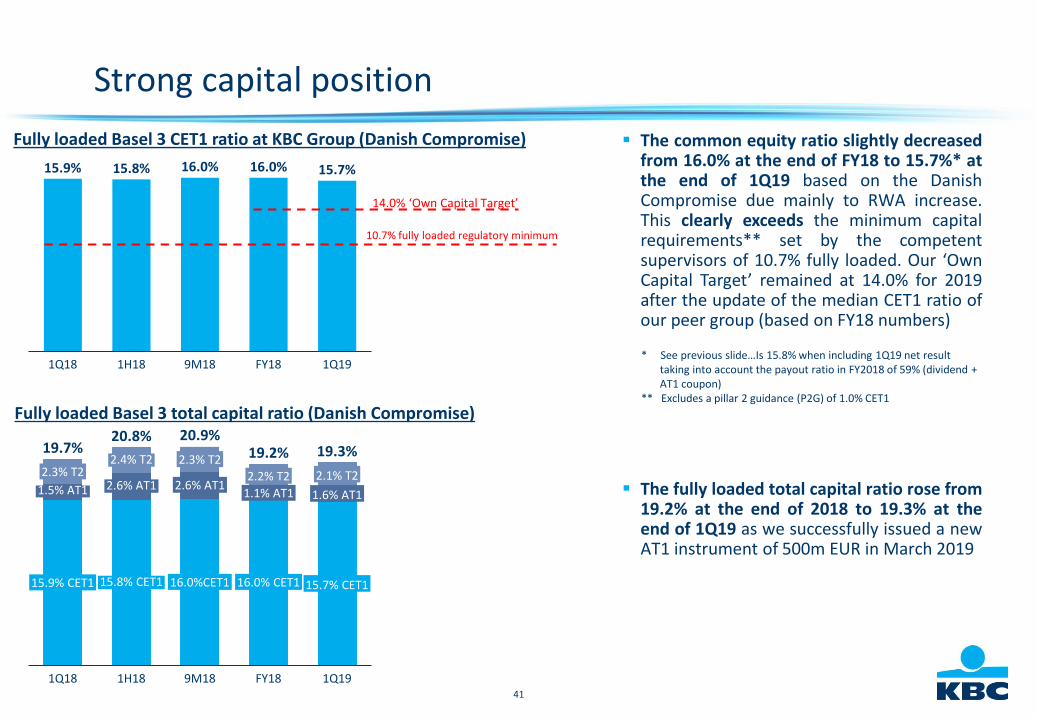
Strong capital position
Fully loaded Basel 3 CET1 ratio at KBC Group (Danish Compromise)
10.7% fully loaded regulatory minimum
1Q191Q18 1H18
15.9%
9M18
15.7%15.8%
FY18
16.0% 16.0%
▪ The common equity ratio slightly decreasedfrom 16.0% at the end of FY18 to 15.7%* atthe end of 1Q19 based on the DanishCompromise due mainly to RWA increase.This clearly exceeds the minimum capitalrequirements** set by the competentsupervisors of 10.7% fully loaded. Our ‘OwnCapital Target’ remained at 14.0% for 2019after the update of the median CET1 ratio ofour peer group (based on FY18 numbers)
* See previous slide…Is 15.8% when including 1Q19 net resulttaking into account the payout ratio in FY2018 of 59% (dividend +AT1 coupon)
** Excludes a pillar 2 guidance (P2G) of 1.0% CET1
14.0% ‘Own Capital Target’
Fully loaded Basel 3 total capital ratio (Danish Compromise)
1H18
2.3% T2
1.5% AT1
15.9% CET1
2.4% T2
2.6% AT1
15.8% CET1
1Q18
1.6% AT1
2.3% T2
2.6% AT1
16.0%CET1
9M18
2.2% T2
1.1% AT1
20.8%
16.0% CET1
FY18
2.1% T2
15.7% CET1
1Q19
19.7%20.9%
19.2% 19.3%
▪ The fully loaded total capital ratio rose from19.2% at the end of 2018 to 19.3% at theend of 1Q19 as we successfully issued a newAT1 instrument of 500m EUR in March 2019
42
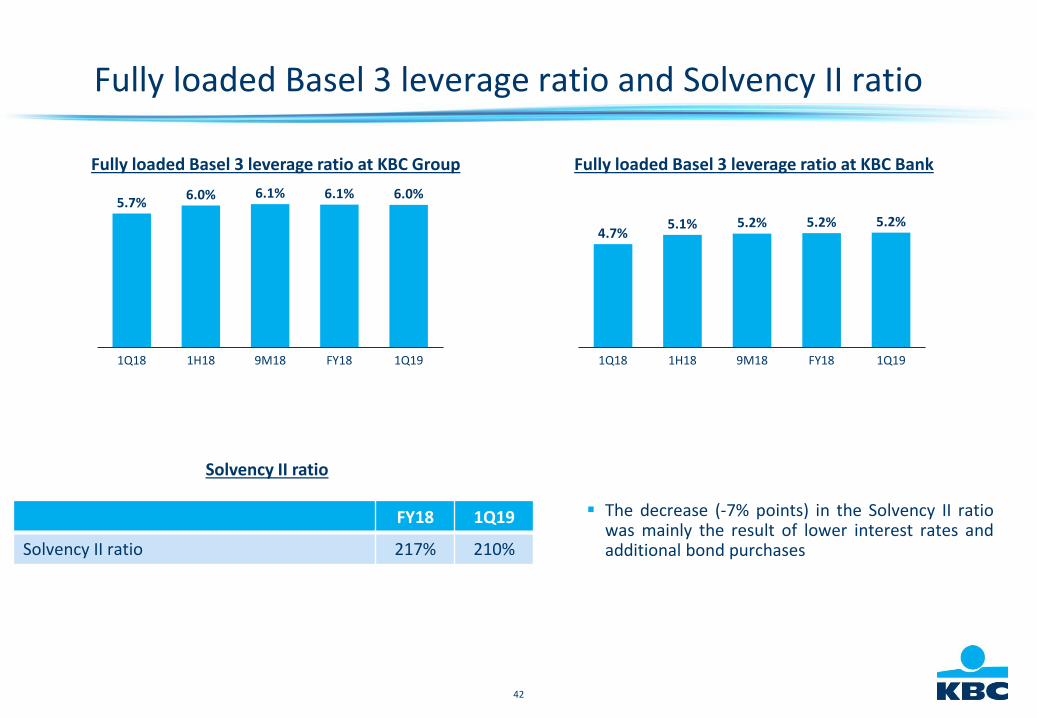
Fully loaded Basel 3 leverage ratio and Solvency II ratio
1Q18
5.2%4.7%
1H18 1Q19
5.1%
9M18 FY18
5.2% 5.2%
Fully loaded Basel 3 leverage ratio at KBC BankFully loaded Basel 3 leverage ratio at KBC Group
FY189M181Q18
5.7%
1H18 1Q19
6.0% 6.1% 6.1% 6.0%
Solvency II ratio
FY18 1Q19
Solvency II ratio 217% 210%
▪ The decrease (-7% points) in the Solvency II ratiowas mainly the result of lower interest rates andadditional bond purchases
43
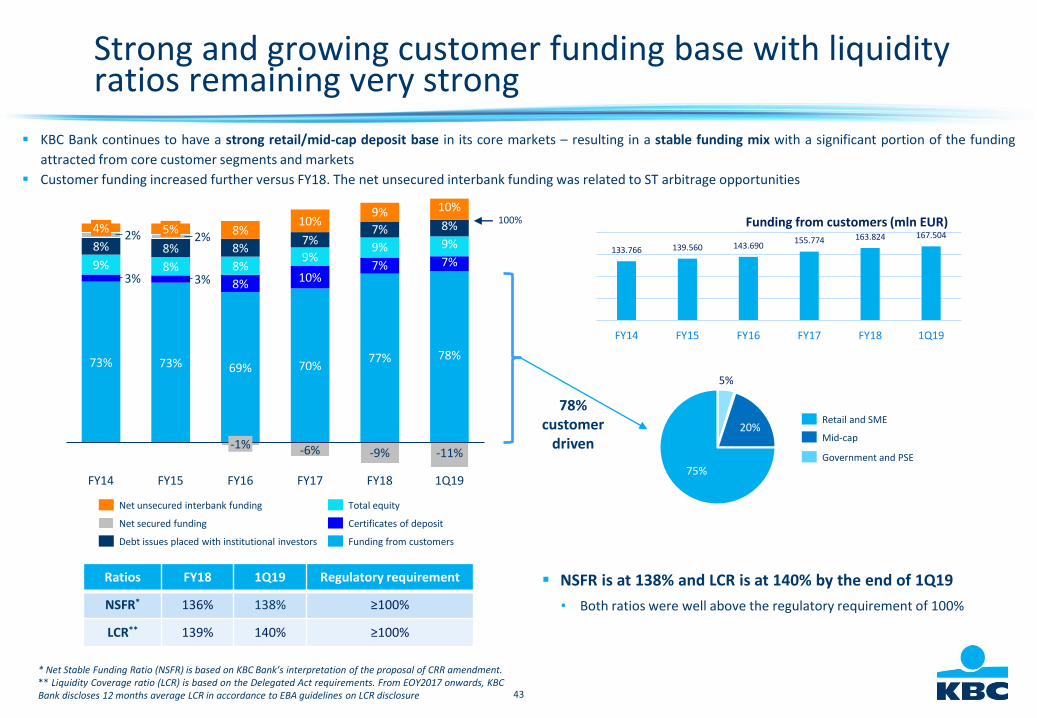
Strong and growing customer funding base with liquidity ratios remaining very strong
▪ KBC Bank continues to have a strong retail/mid-cap deposit base in its core markets – resulting in a stable funding mix with a significant portion of the funding
attracted from core customer segments and markets
▪ Customer funding increased further versus FY18. The net unsecured interbank funding was related to ST arbitrage opportunities
78% customer
driven
* Net Stable Funding Ratio (NSFR) is based on KBC Bank’s interpretation of the proposal of CRR amendment.** Liquidity Coverage ratio (LCR) is based on the Delegated Act requirements. From EOY2017 onwards, KBCBank discloses 12 months average LCR in accordance to EBA guidelines on LCR disclosure
Ratios FY18 1Q19 Regulatory requirement
NSFR* 136% 138% ≥100%
LCR** 139% 140% ≥100%
▪ NSFR is at 138% and LCR is at 140% by the end of 1Q19
• Both ratios were well above the regulatory requirement of 100%
100%
73% 73% 69% 70%77% 78%
3% 3% 8% 10%7% 7%9% 8% 8%
9%9% 9%8% 8% 8%
7%7% 8%
2% 2% 8%10%
9% 10%
-6% -9% -11%
4%
FY18
5%
FY16FY14 FY15
-1%
FY17 1Q19
Net unsecured interbank funding
Net secured funding Certificates of deposit
Debt issues placed with institutional investors
Total equity
Funding from customers
Government and PSE
Mid-cap
Retail and SME
5%
20%
75%
133.766 139.560 143.690155.774 163.824 167.504
FY14 FY15 FY16 FY17 FY18 1Q19
Funding from customers (mln EUR)

44
KBC Group
Section 4
Looking forward
45
Looking forward
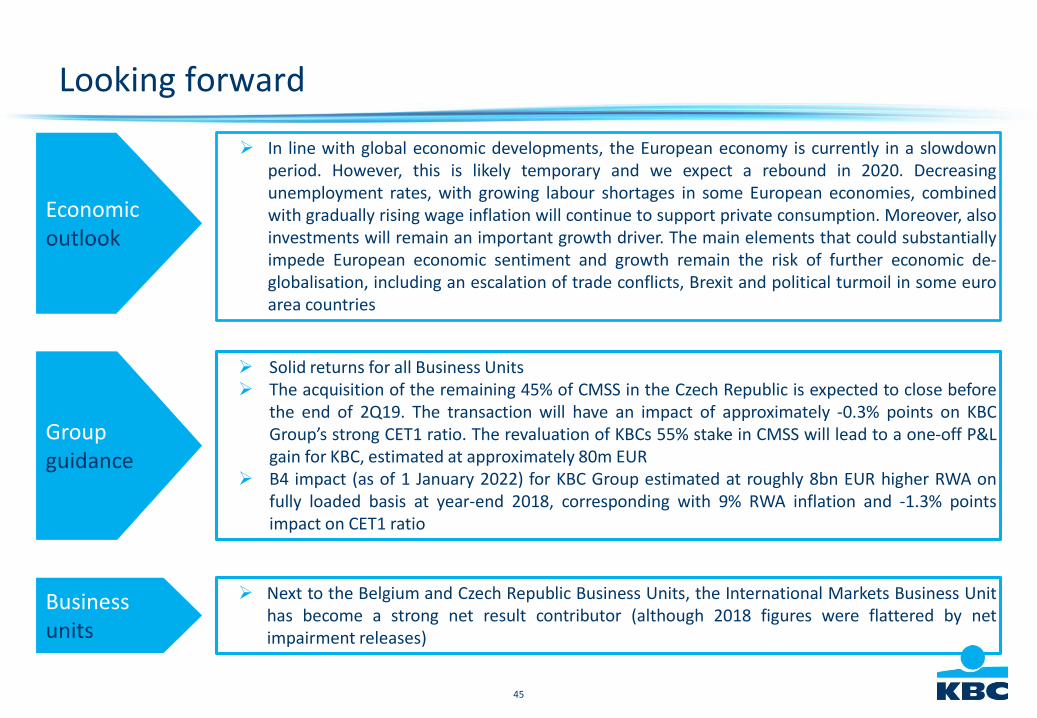
➢ In line with global economic developments, the European economy is currently in a slowdownperiod. However, this is likely temporary and we expect a rebound in 2020. Decreasingunemployment rates, with growing labour shortages in some European economies, combinedwith gradually rising wage inflation will continue to support private consumption. Moreover, alsoinvestments will remain an important growth driver. The main elements that could substantiallyimpede European economic sentiment and growth remain the risk of further economic de-globalisation, including an escalation of trade conflicts, Brexit and political turmoil in some euroarea countries
Economicoutlook
Group guidance
Business units
➢ Solid returns for all Business Units➢ The acquisition of the remaining 45% of CMSS in the Czech Republic is expected to close before
the end of 2Q19. The transaction will have an impact of approximately -0.3% points on KBCGroup’s strong CET1 ratio. The revaluation of KBCs 55% stake in CMSS will lead to a one-off P&Lgain for KBC, estimated at approximately 80m EUR
➢ B4 impact (as of 1 January 2022) for KBC Group estimated at roughly 8bn EUR higher RWA onfully loaded basis at year-end 2018, corresponding with 9% RWA inflation and -1.3% pointsimpact on CET1 ratio
➢ Next to the Belgium and Czech Republic Business Units, the International Markets Business Unithas become a strong net result contributor (although 2018 figures were flattered by netimpairment releases)
46
KBC Group
Annex 1
Company profile
47
KBC Group in a nutshell (1)
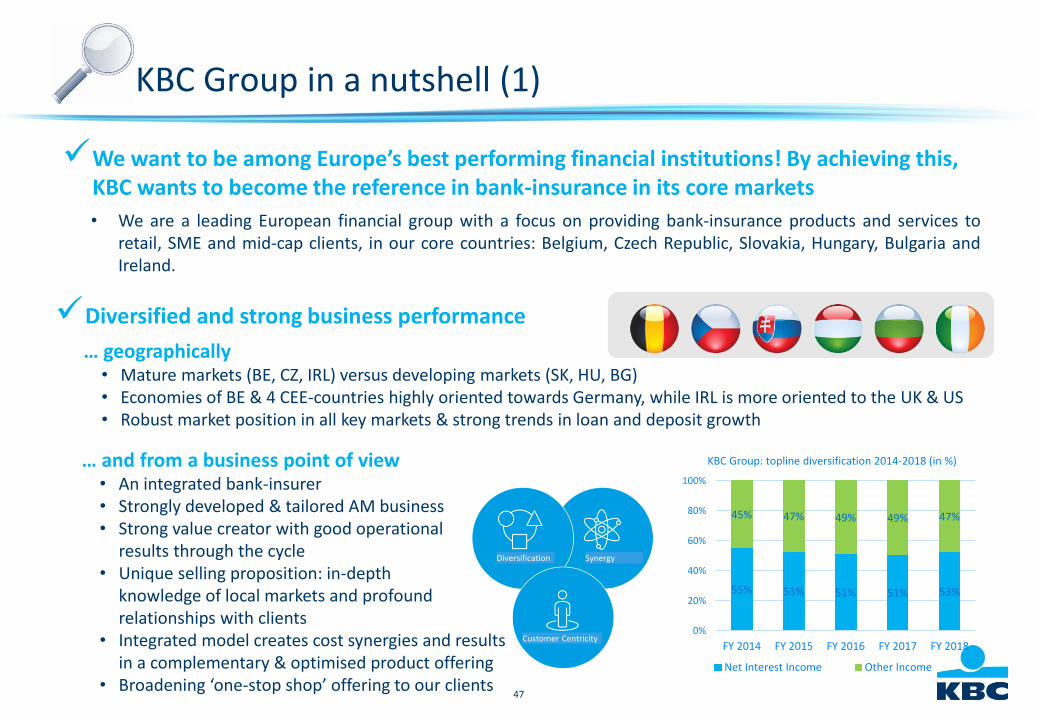
✓We want to be among Europe’s best performing financial institutions! By achieving this, KBC wants to become the reference in bank-insurance in its core markets
• We are a leading European financial group with a focus on providing bank-insurance products and services toretail, SME and mid-cap clients, in our core countries: Belgium, Czech Republic, Slovakia, Hungary, Bulgaria andIreland.
✓Diversified and strong business performance
… geographically• Mature markets (BE, CZ, IRL) versus developing markets (SK, HU, BG)• Economies of BE & 4 CEE-countries highly oriented towards Germany, while IRL is more oriented to the UK & US• Robust market position in all key markets & strong trends in loan and deposit growth
… and from a business point of view• An integrated bank-insurer• Strongly developed & tailored AM business• Strong value creator with good operational
results through the cycle• Unique selling proposition: in-depth
knowledge of local markets and profound relationships with clients
• Integrated model creates cost synergies and resultsin a complementary & optimised product offering
• Broadening ‘one-stop shop’ offering to our clients
Diversification Synergy
Customer Centricity
55% 53% 51% 51% 53%
45% 47% 49% 49% 47%
0%
20%
40%
60%
80%
100%
FY 2014 FY 2015 FY 2016 FY 2017 FY 2018
KBC Group: topline diversification 2014-2018 (in %)
Net Interest Income Other Income
48
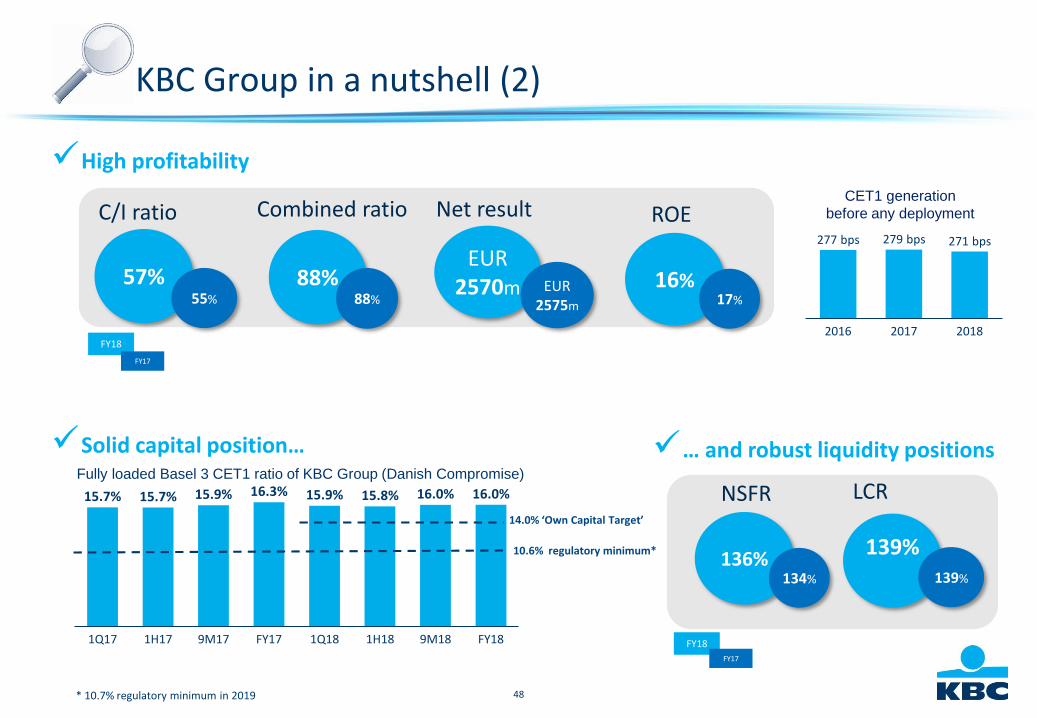
✓High profitability
✓Solid capital position…
FY18
Net result
EUR 2570m 16%
ROE
57% 88%
C/I ratio Combined ratio
FY17
EUR 2575m 17%55% 88%
CET1 generation
before any deployment
2016 2017
271 bps279 bps277 bps
2018
Fully loaded Basel 3 CET1 ratio of KBC Group (Danish Compromise)
14.0% ‘Own Capital Target’
10.6% regulatory minimum*
9M181Q17 1H17 9M17 1H18FY17 1Q18 FY18
15.7% 15.7% 15.9% 16.3% 15.8%15.9% 16.0% 16.0%
136%
NSFR
139%
LCR
134% 139%
✓… and robust liquidity positions
FY18
FY17
KBC Group in a nutshell (2)
* 10.7% regulatory minimum in 2019
49
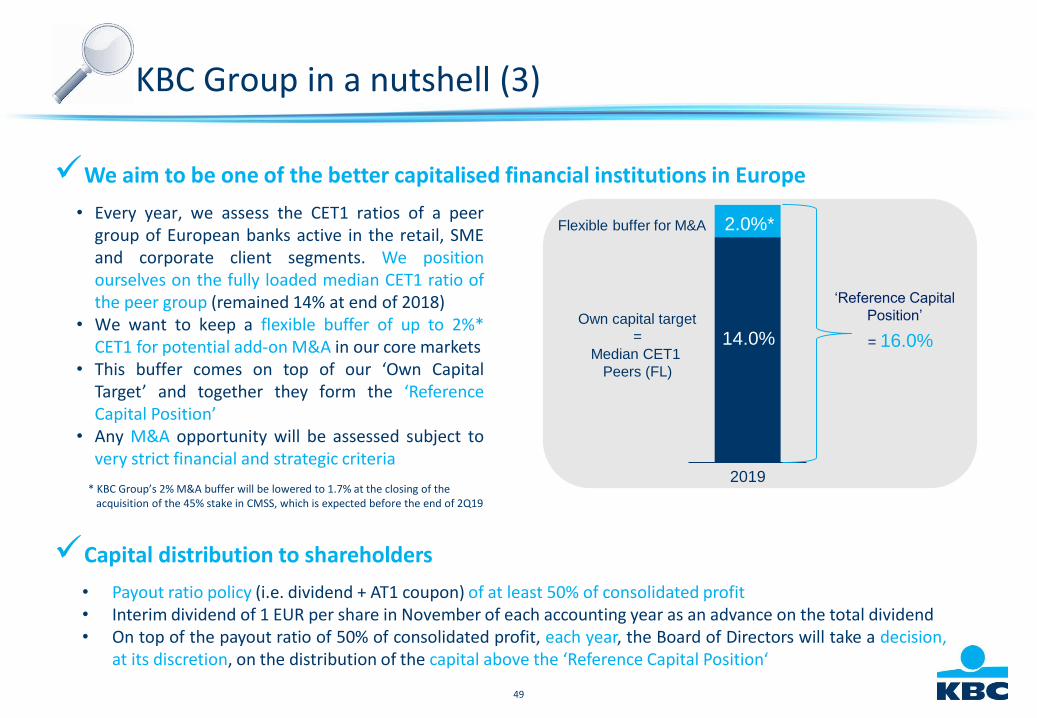
• Every year, we assess the CET1 ratios of a peergroup of European banks active in the retail, SMEand corporate client segments. We positionourselves on the fully loaded median CET1 ratio ofthe peer group (remained 14% at end of 2018)
• We want to keep a flexible buffer of up to 2%*CET1 for potential add-on M&A in our core markets
• This buffer comes on top of our ‘Own CapitalTarget’ and together they form the ‘ReferenceCapital Position’
• Any M&A opportunity will be assessed subject tovery strict financial and strategic criteria
Own capital target
=
Median CET1
Peers (FL)
2019
2.0%*
14.0%
‘Reference Capital
Position’
= 16.0%
Flexible buffer for M&A
✓We aim to be one of the better capitalised financial institutions in Europe
• Payout ratio policy (i.e. dividend + AT1 coupon) of at least 50% of consolidated profit• Interim dividend of 1 EUR per share in November of each accounting year as an advance on the total dividend• On top of the payout ratio of 50% of consolidated profit, each year, the Board of Directors will take a decision,
at its discretion, on the distribution of the capital above the ‘Reference Capital Position‘
✓Capital distribution to shareholders
KBC Group in a nutshell (3)
* KBC Group’s 2% M&A buffer will be lowered to 1.7% at the closing of theacquisition of the 45% stake in CMSS, which is expected before the end of 2Q19
50
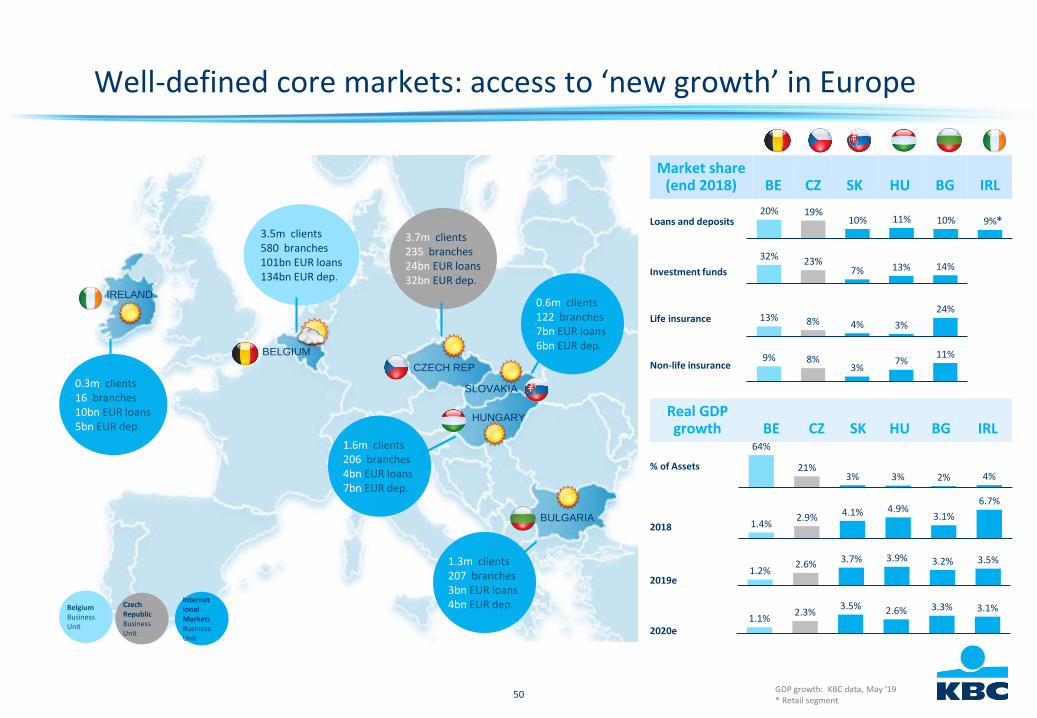
Market share (end 2018) BE CZ SK HU BG IRL
Loans and deposits
Investment funds
Life insurance
Non-life insurance
Well-defined core markets: access to ‘new growth’ in Europe
GDP growth: KBC data, May ‘19* Retail segment
11%10%20%
9%19%
10%
13%7%
32% 23% 14%
8%13%4%
24%
3%
11%
3%9% 8% 7%
Real GDP growth BE CZ SK HU BG IRL
% of Assets
2018
2019e
2020e
3%
64%
2%21%
3% 4%
6.7%
3.1%4.1%1.4%
2.9%4.9%
3.2%3.9% 3.5%1.2%
2.6% 3.7%
IRELAND
BELGIUM
CZECH REP
SLOVAKIA
HUNGARY
BULGARIA
*3.5m clients580 branches101bn EUR loans134bn EUR dep.
0.3m clients16 branches10bn EUR loans5bn EUR dep.
3.7m clients235 branches24bn EUR loans32bn EUR dep.
0.6m clients122 branches7bn EUR loans6bn EUR dep.
1.6m clients206 branches4bn EUR loans7bn EUR dep.
1.3m clients207 branches3bn EUR loans4bn EUR dep.Belgium
Business Unit
CzechRepublicBusiness Unit
InternationalMarkets Business Unit
3.5%2.3% 2.6%
1.1%3.3% 3.1%
51
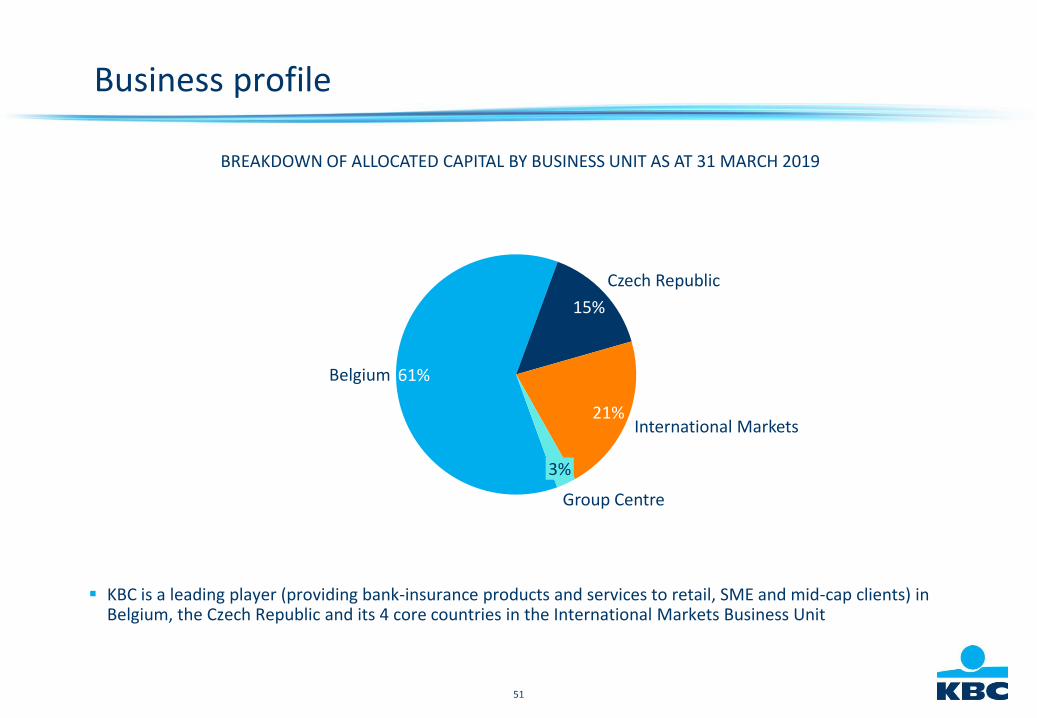
Business profile
▪ KBC is a leading player (providing bank-insurance products and services to retail, SME and mid-cap clients) in Belgium, the Czech Republic and its 4 core countries in the International Markets Business Unit
BREAKDOWN OF ALLOCATED CAPITAL BY BUSINESS UNIT AS AT 31 MARCH 2019
61%
15%
21%
Belgium
3%
International Markets
Czech Republic
Group Centre
52
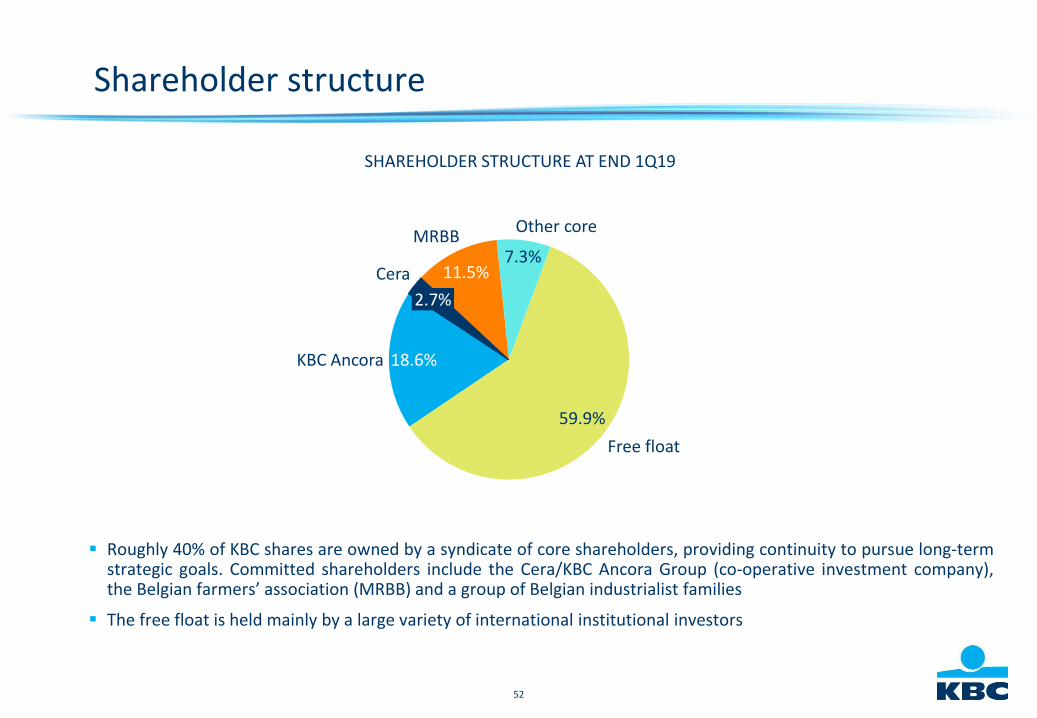
Shareholder structure
▪ Roughly 40% of KBC shares are owned by a syndicate of core shareholders, providing continuity to pursue long-termstrategic goals. Committed shareholders include the Cera/KBC Ancora Group (co-operative investment company),the Belgian farmers’ association (MRBB) and a group of Belgian industrialist families
▪ The free float is held mainly by a large variety of international institutional investors
SHAREHOLDER STRUCTURE AT END 1Q19
Cera
18.6%
2.7%
KBC Ancora
11.5%7.3%
Other coreMRBB
59.9%
Free float
53
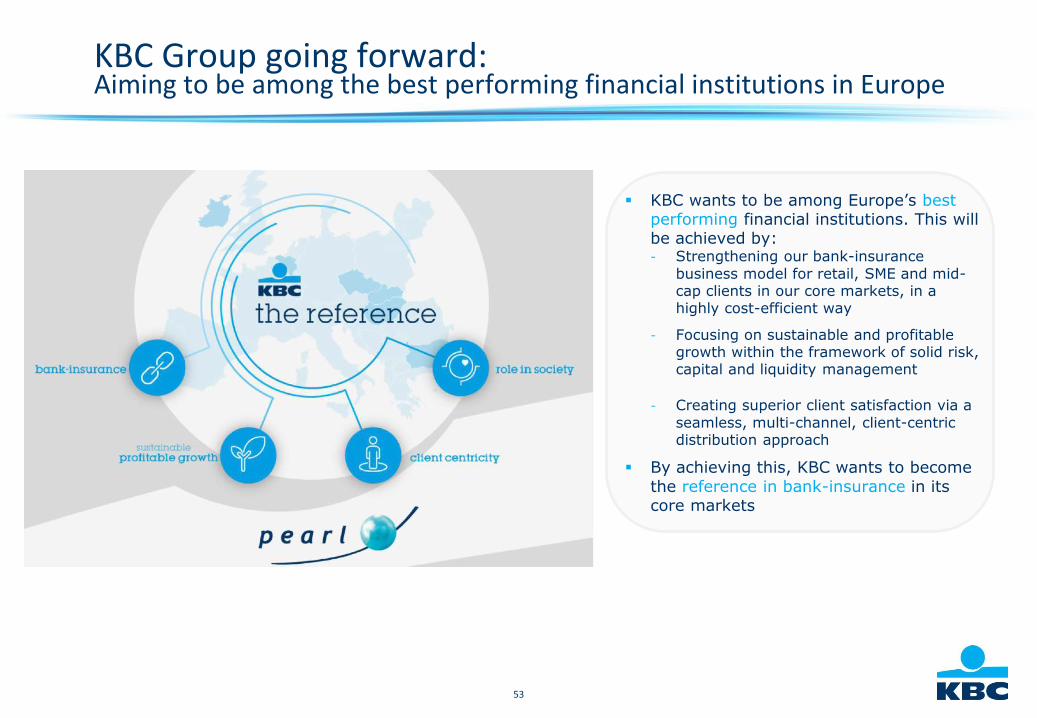
▪ KBC wants to be among Europe’s best performing financial institutions. This will be achieved by:- Strengthening our bank-insurance
business model for retail, SME and mid-cap clients in our core markets, in a highly cost-efficient way
- Focusing on sustainable and profitable growth within the framework of solid risk, capital and liquidity management
- Creating superior client satisfaction via a seamless, multi-channel, client-centric distribution approach
▪ By achieving this, KBC wants to become the reference in bank-insurance in its core markets
KBC Group going forward:Aiming to be among the best performing financial institutions in Europe
54
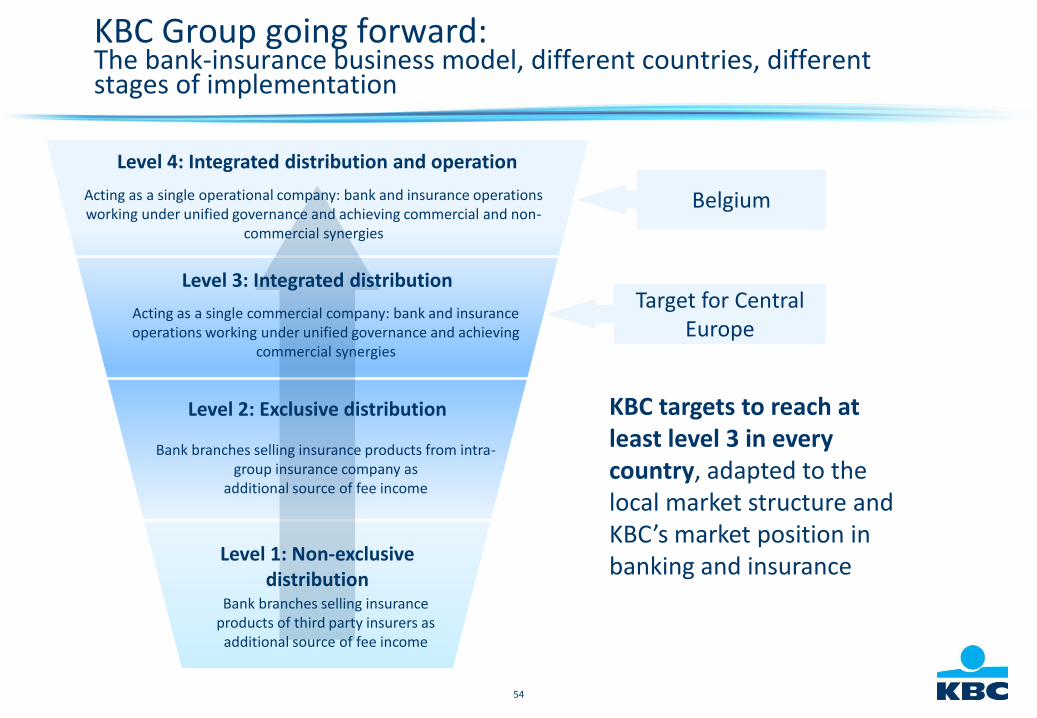
KBC Group going forward:The bank-insurance business model, different countries, different stages of implementation
Bank branches selling insurance products from intra-group insurance company as
additional source of fee income
Bank branches selling insurance products of third party insurers as
additional source of fee income
Acting as a single operational company: bank and insurance operations working under unified governance and achieving commercial and non-
commercial synergies
Acting as a single commercial company: bank and insurance operations working under unified governance and achieving
commercial synergies
Level 4: Integrated distribution and operation
Level 3: Integrated distribution
Level 2: Exclusive distribution
Level 1: Non-exclusive distribution
KBC targets to reach at least level 3 in every country, adapted to the local market structure and KBC’s market position in banking and insurance
Belgium
Target for Central Europe
55
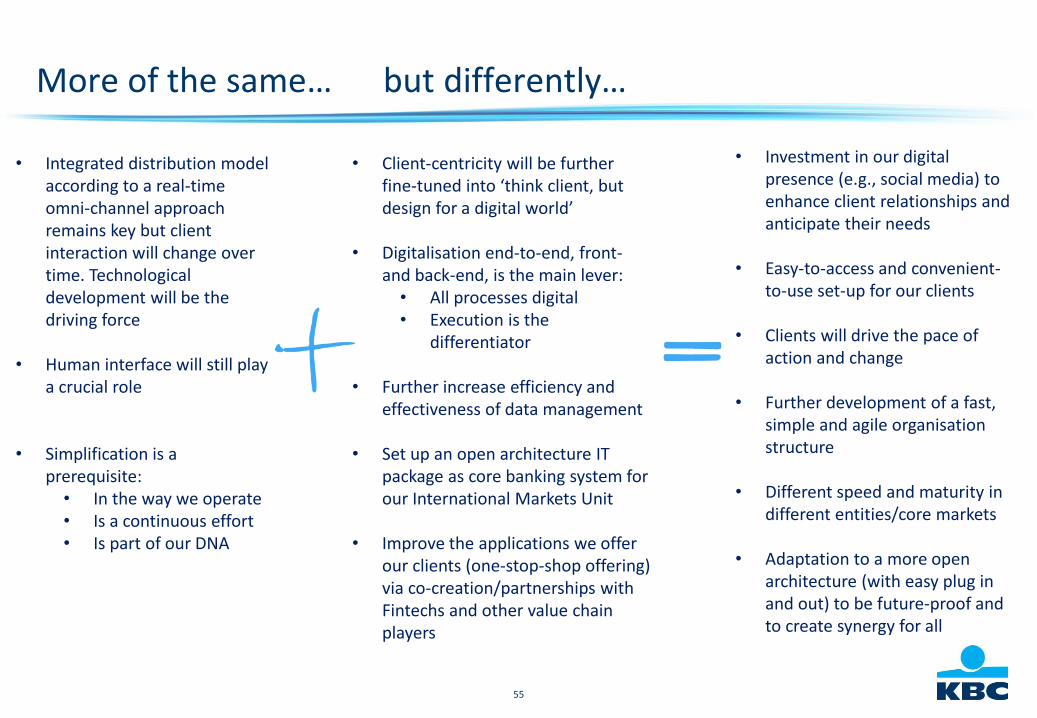
More of the same… but differently…
• Integrated distribution model according to a real-time omni-channel approach remains key but client interaction will change over time. Technological development will be the driving force
• Human interface will still play a crucial role
• Simplification is a prerequisite:
• In the way we operate• Is a continuous effort• Is part of our DNA
• Client-centricity will be further fine-tuned into ‘think client, but design for a digital world’
• Digitalisation end-to-end, front-and back-end, is the main lever:
• All processes digital • Execution is the
differentiator
• Further increase efficiency and effectiveness of data management
• Set up an open architecture IT package as core banking system for our International Markets Unit
• Improve the applications we offer our clients (one-stop-shop offering) via co-creation/partnerships with Fintechs and other value chain players
• Investment in our digital presence (e.g., social media) to enhance client relationships and anticipate their needs
• Easy-to-access and convenient-to-use set-up for our clients
• Clients will drive the pace of action and change
• Further development of a fast, simple and agile organisation structure
• Different speed and maturity in different entities/core markets
• Adaptation to a more open architecture (with easy plug in and out) to be future-proof and to create synergy for all
56
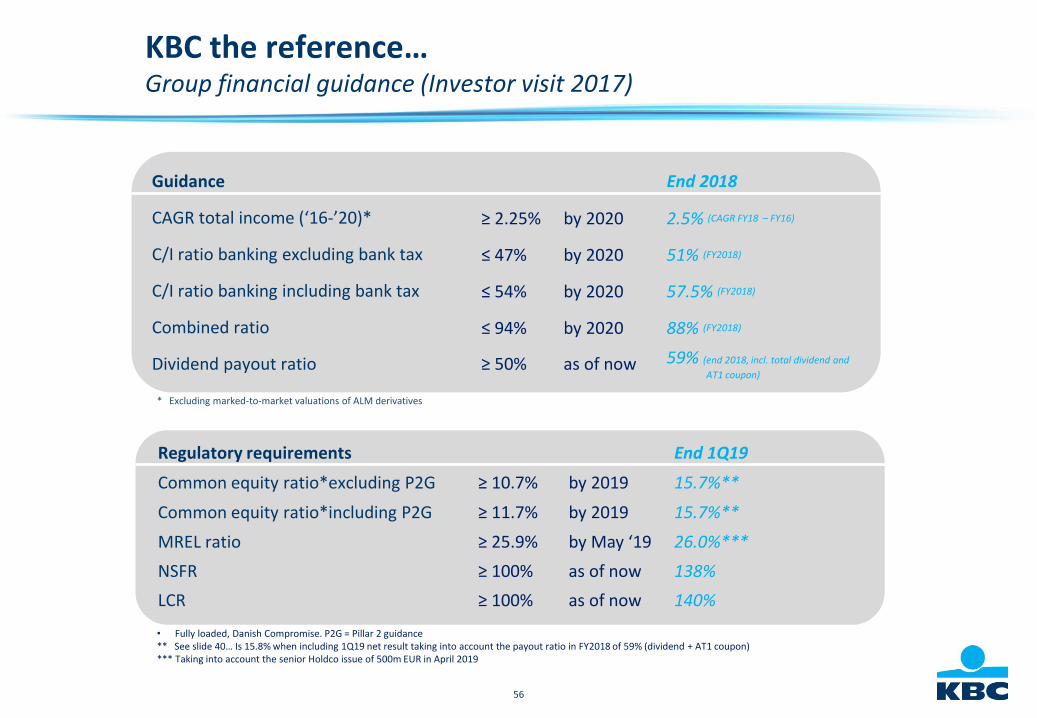
Guidance End 2018
CAGR total income (‘16-’20)* ≥ 2.25% by 2020 2.5% (CAGR FY18 – FY16)
C/I ratio banking excluding bank tax ≤ 47% by 2020 51% (FY2018)
C/I ratio banking including bank tax ≤ 54% by 2020 57.5% (FY2018)
Combined ratio ≤ 94% by 2020 88% (FY2018)
Dividend payout ratio ≥ 50% as of now 59% (end 2018, incl. total dividend and
AT1 coupon)
* Excluding marked-to-market valuations of ALM derivatives
Regulatory requirements End 1Q19
Common equity ratio*excluding P2G ≥ 10.7% by 2019 15.7%**
Common equity ratio*including P2G ≥ 11.7% by 2019 15.7%**
MREL ratio ≥ 25.9% by May ‘19 26.0%***
NSFR ≥ 100% as of now 138%
LCR ≥ 100% as of now 140%
• Fully loaded, Danish Compromise. P2G = Pillar 2 guidance** See slide 40… Is 15.8% when including 1Q19 net result taking into account the payout ratio in FY2018 of 59% (dividend + AT1 coupon)*** Taking into account the senior Holdco issue of 500m EUR in April 2019
KBC the reference…Group financial guidance (Investor visit 2017)
57
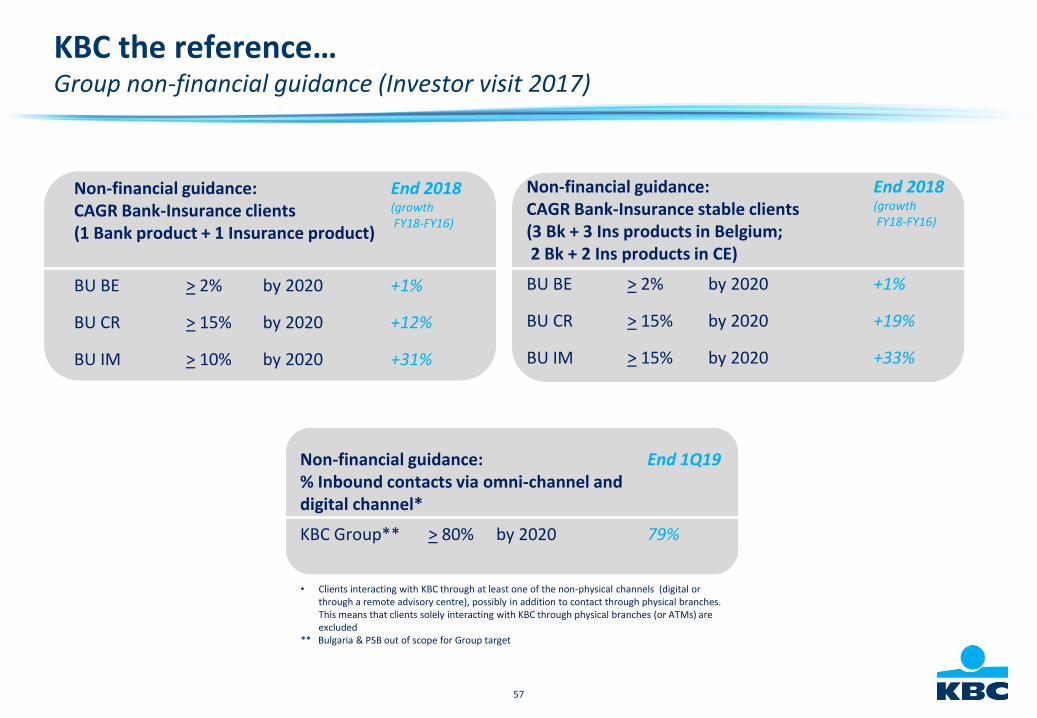
Non-financial guidance: % Inbound contacts via omni-channel and digital channel*
End 1Q19
KBC Group** > 80% by 2020 79%
Non-financial guidance: CAGR Bank-Insurance clients (1 Bank product + 1 Insurance product)
End 2018(growthFY18-FY16)
BU BE > 2% by 2020 +1%
BU CR > 15% by 2020 +12%
BU IM > 10% by 2020 +31%
Non-financial guidance: CAGR Bank-Insurance stable clients (3 Bk + 3 Ins products in Belgium; 2 Bk + 2 Ins products in CE)
End 2018(growthFY18-FY16)
BU BE > 2% by 2020 +1%
BU CR > 15% by 2020 +19%
BU IM > 15% by 2020 +33%
• Clients interacting with KBC through at least one of the non-physical channels (digital or through a remote advisory centre), possibly in addition to contact through physical branches. This means that clients solely interacting with KBC through physical branches (or ATMs) are excluded
** Bulgaria & PSB out of scope for Group target
KBC the reference…Group non-financial guidance (Investor visit 2017)
58
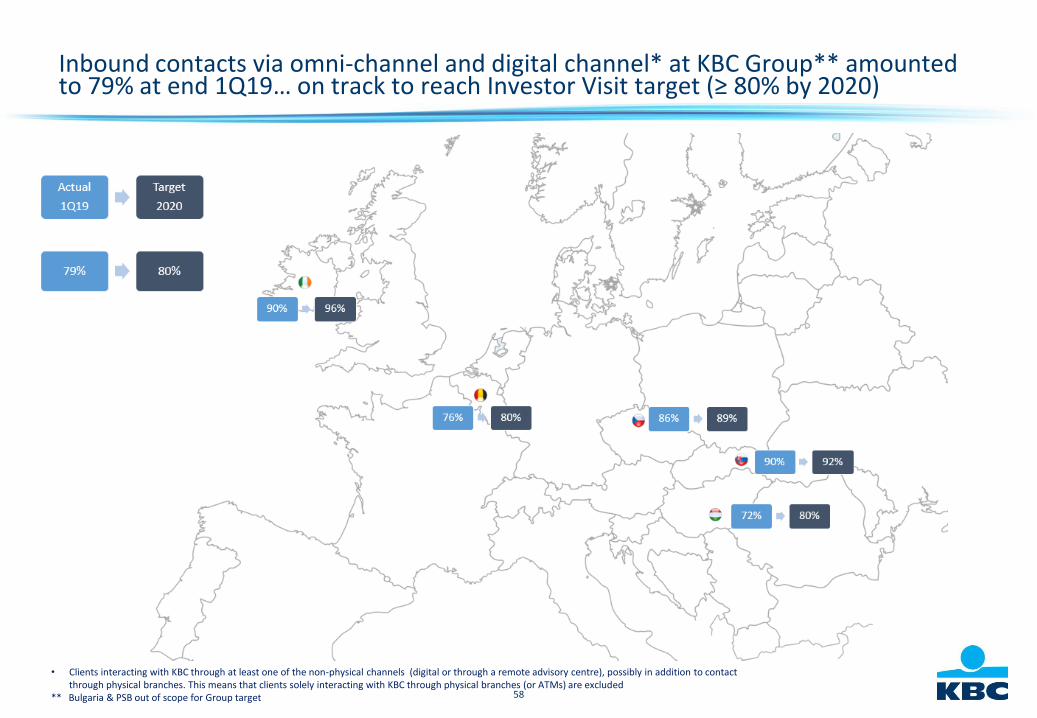
Inbound contacts via omni-channel and digital channel* at KBC Group** amounted to 79% at end 1Q19… on track to reach Investor Visit target (≥ 80% by 2020)
• Clients interacting with KBC through at least one of the non-physical channels (digital or through a remote advisory centre), possibly in addition to contact through physical branches. This means that clients solely interacting with KBC through physical branches (or ATMs) are excluded
** Bulgaria & PSB out of scope for Group target
59
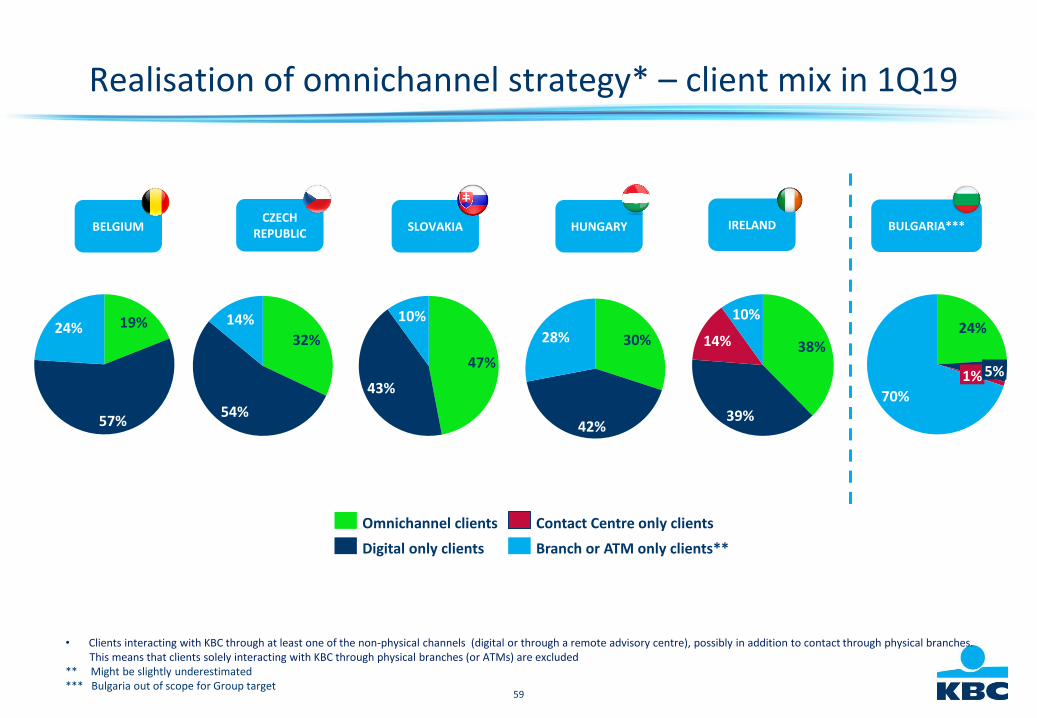
Realisation of omnichannel strategy* – client mix in 1Q19
19%
57%
24%
Omnichannel clients
Branch or ATM only clients**Digital only clients
Contact Centre only clients
BELGIUMCZECH
REPUBLICSLOVAKIA HUNGARY BULGARIA***IRELAND
32%
54%
14% 10%
47%
43%
30%
42%
28%24%
1% 5%
70%
38%
10%
39%
14%
• Clients interacting with KBC through at least one of the non-physical channels (digital or through a remote advisory centre), possibly in addition to contact through physical branches. This means that clients solely interacting with KBC through physical branches (or ATMs) are excluded
** Might be slightly underestimated*** Bulgaria out of scope for Group target
60
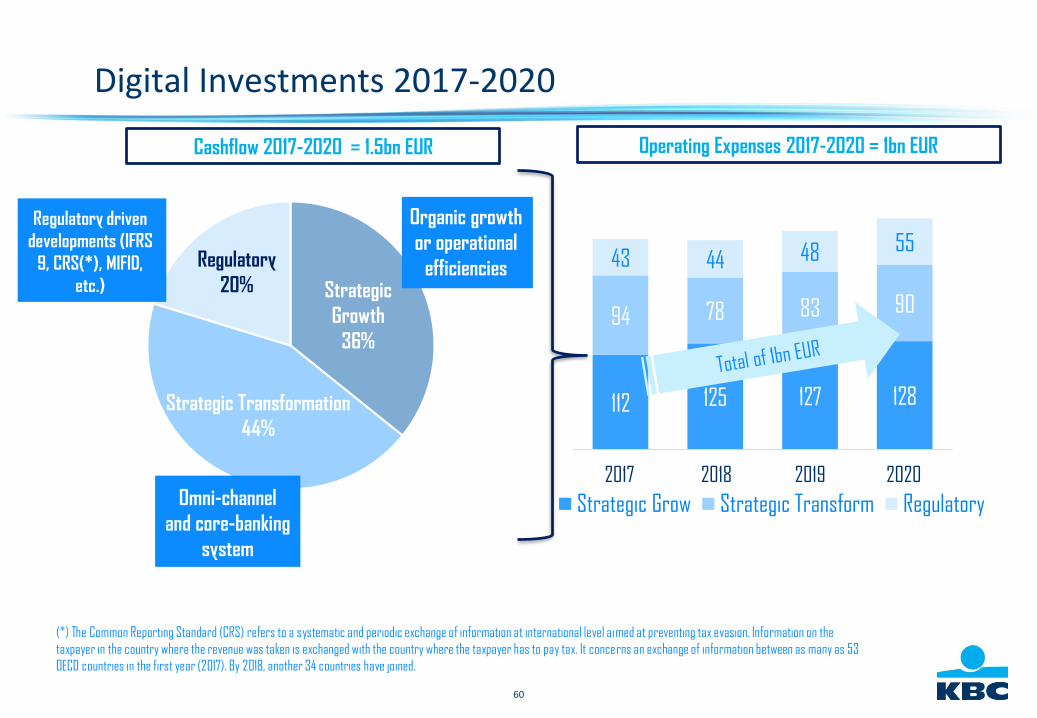
Digital Investments 2017-2020
112 125 127 128
94 78 83 90
43 44 48 55
Strategic Grow Strategic Transform Regulatory
Cashflow 2017-2020 = 1.5bn EUR Operating Expenses 2017-2020 = 1bn EUR
(*) The Common Reporting Standard (CRS) refers to a systematic and periodic exchange of information at international level aimed at preventing tax evasion. Information on the
taxpayer in the country where the revenue was taken is exchanged with the country where the taxpayer has to pay tax. It concerns an exchange of information between as many as 53
OECD countries in the first year (2017). By 2018, another 34 countries have joined.
2017 2018 2019 2020
Regulatory driven
developments (IFRS
9, CRS(*), MIFID,
etc.)
Omni-channel
and core-banking
system
Organic growth
or operational
efficienciesRegulatory
20% Strategic
Growth
36%
Strategic Transformation
44%
61
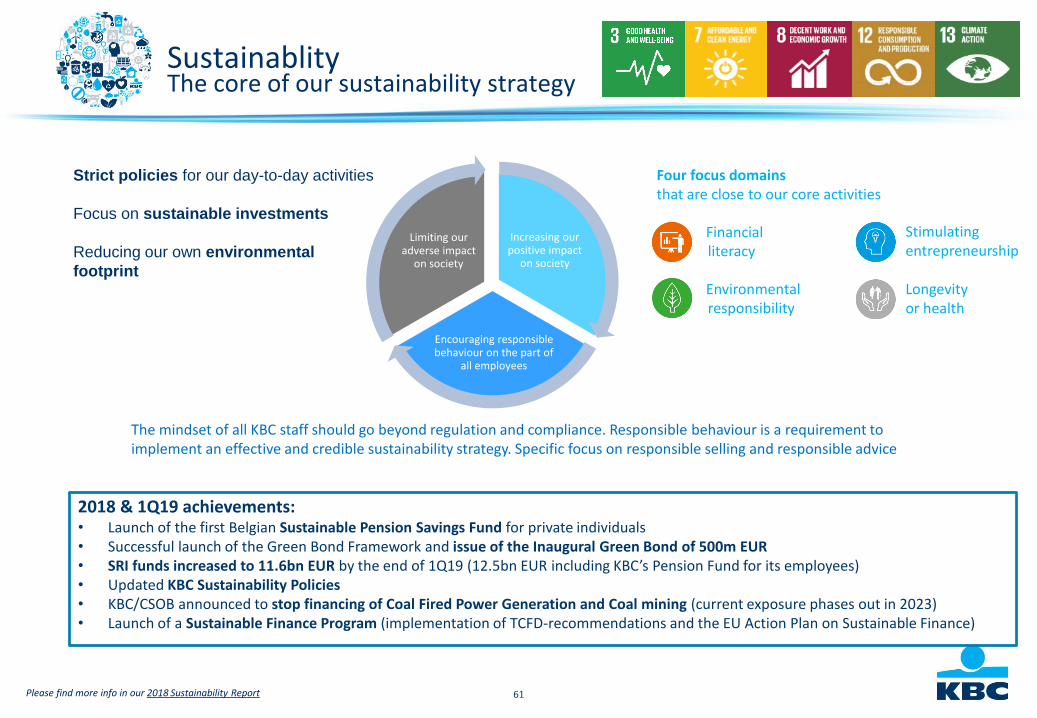
SustainablityThe core of our sustainability strategy
Increasing ourpositive impact
on society
Encouraging responsiblebehaviour on the part of
all employees
Limiting ouradverse impact
on society
The mindset of all KBC staff should go beyond regulation and compliance. Responsible behaviour is a requirement to implement an effective and credible sustainability strategy. Specific focus on responsible selling and responsible advice
Four focus domains that are close to our core activities
Financial literacy
Environmentalresponsibility
Stimulating entrepreneurship
Longevity or health
Strict policies for our day-to-day activities
Focus on sustainable investments
Reducing our own environmental
footprint
2018 & 1Q19 achievements:• Launch of the first Belgian Sustainable Pension Savings Fund for private individuals• Successful launch of the Green Bond Framework and issue of the Inaugural Green Bond of 500m EUR• SRI funds increased to 11.6bn EUR by the end of 1Q19 (12.5bn EUR including KBC’s Pension Fund for its employees)• Updated KBC Sustainability Policies• KBC/CSOB announced to stop financing of Coal Fired Power Generation and Coal mining (current exposure phases out in 2023)• Launch of a Sustainable Finance Program (implementation of TCFD-recommendations and the EU Action Plan on Sustainable Finance)
Please find more info in our 2018 Sustainability Report
62
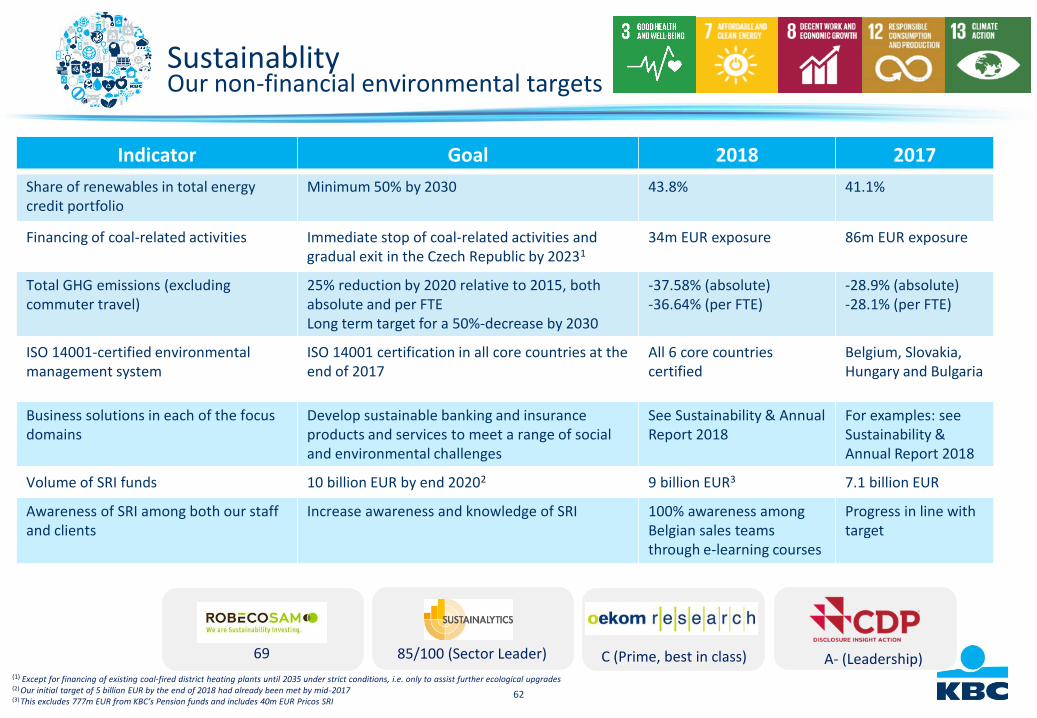
SustainablityOur non-financial environmental targets
Indicator Goal 2018 2017
Share of renewables in total energy credit portfolio
Minimum 50% by 2030 43.8% 41.1%
Financing of coal-related activities Immediate stop of coal-related activities and gradual exit in the Czech Republic by 20231
34m EUR exposure 86m EUR exposure
Total GHG emissions (excluding commuter travel)
25% reduction by 2020 relative to 2015, both absolute and per FTE Long term target for a 50%-decrease by 2030
-37.58% (absolute)-36.64% (per FTE)
-28.9% (absolute)-28.1% (per FTE)
ISO 14001-certified environmental management system
ISO 14001 certification in all core countries at the end of 2017
All 6 core countries certified
Belgium, Slovakia, Hungary and Bulgaria
Business solutions in each of the focus domains
Develop sustainable banking and insurance products and services to meet a range of social and environmental challenges
See Sustainability & AnnualReport 2018
For examples: seeSustainability & Annual Report 2018
Volume of SRI funds 10 billion EUR by end 20202 9 billion EUR3 7.1 billion EUR
Awareness of SRI among both our staff and clients
Increase awareness and knowledge of SRI 100% awareness among Belgian sales teams through e-learning courses
Progress in line with target
(1) Except for financing of existing coal-fired district heating plants until 2035 under strict conditions, i.e. only to assist further ecological upgrades(2) Our initial target of 5 billion EUR by the end of 2018 had already been met by mid-2017 (3) This excludes 777m EUR from KBC’s Pension funds and includes 40m EUR Pricos SRI
85/100 (Sector Leader) C (Prime, best in class) A- (Leadership)69
63
KBC Group
Annex 2
Other items
64
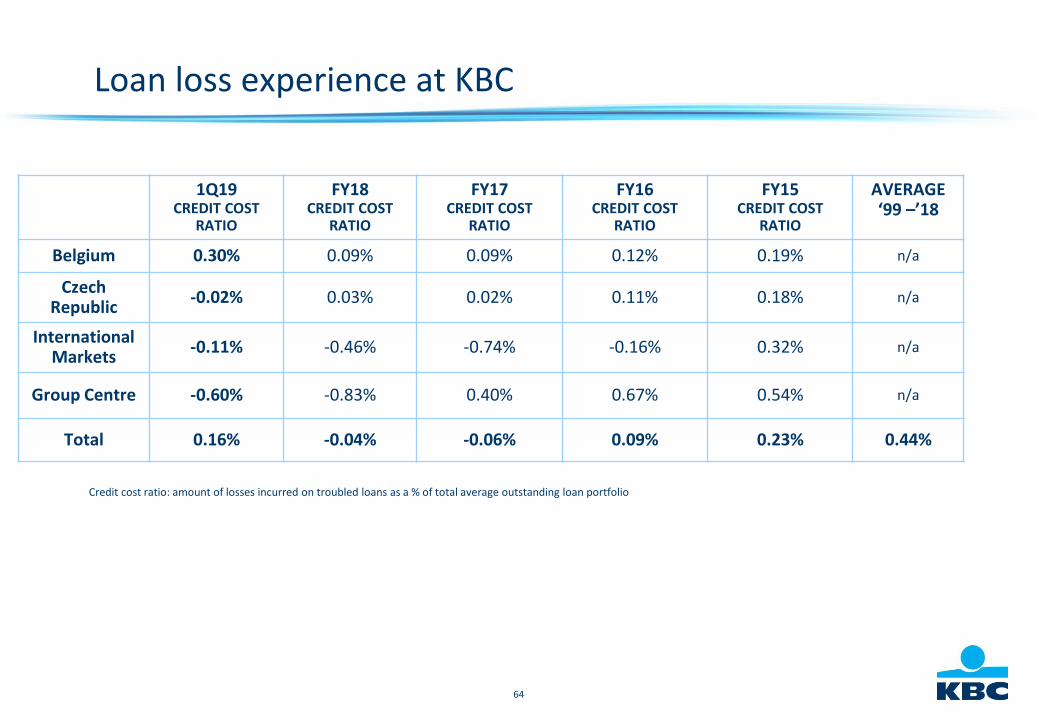
Loan loss experience at KBC
1Q19CREDIT COST
RATIO
FY18CREDIT COST
RATIO
FY17CREDIT COST
RATIO
FY16CREDIT COST
RATIO
FY15CREDIT COST
RATIO
AVERAGE ‘99 –’18
Belgium 0.30% 0.09% 0.09% 0.12% 0.19% n/a
Czech Republic
-0.02% 0.03% 0.02% 0.11% 0.18% n/a
International Markets
-0.11% -0.46% -0.74% -0.16% 0.32% n/a
Group Centre -0.60% -0.83% 0.40% 0.67% 0.54% n/a
Total 0.16% -0.04% -0.06% 0.09% 0.23% 0.44%
Credit cost ratio: amount of losses incurred on troubled loans as a % of total average outstanding loan portfolio
65
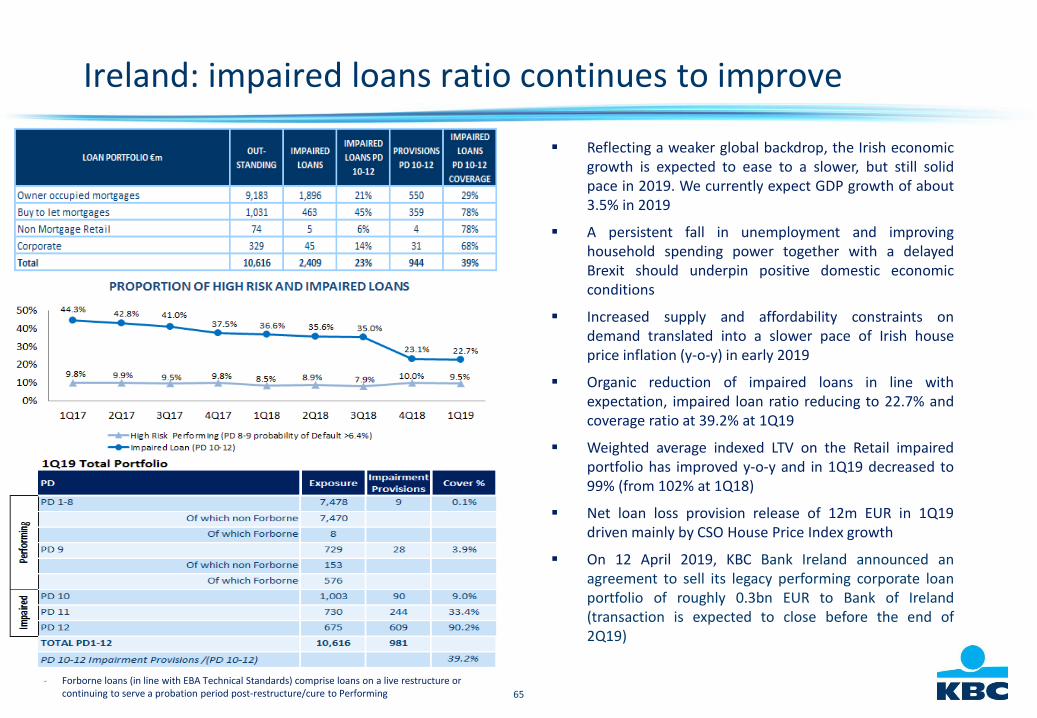
Ireland: impaired loans ratio continues to improve
- Forborne loans (in line with EBA Technical Standards) comprise loans on a live restructure or continuing to serve a probation period post-restructure/cure to Performing
▪ Reflecting a weaker global backdrop, the Irish economicgrowth is expected to ease to a slower, but still solidpace in 2019. We currently expect GDP growth of about3.5% in 2019
▪ A persistent fall in unemployment and improvinghousehold spending power together with a delayedBrexit should underpin positive domestic economicconditions
▪ Increased supply and affordability constraints ondemand translated into a slower pace of Irish houseprice inflation (y-o-y) in early 2019
▪ Organic reduction of impaired loans in line withexpectation, impaired loan ratio reducing to 22.7% andcoverage ratio at 39.2% at 1Q19
▪ Weighted average indexed LTV on the Retail impairedportfolio has improved y-o-y and in 1Q19 decreased to99% (from 102% at 1Q18)
▪ Net loan loss provision release of 12m EUR in 1Q19driven mainly by CSO House Price Index growth
▪ On 12 April 2019, KBC Bank Ireland announced anagreement to sell its legacy performing corporate loanportfolio of roughly 0.3bn EUR to Bank of Ireland(transaction is expected to close before the end of2Q19)
66
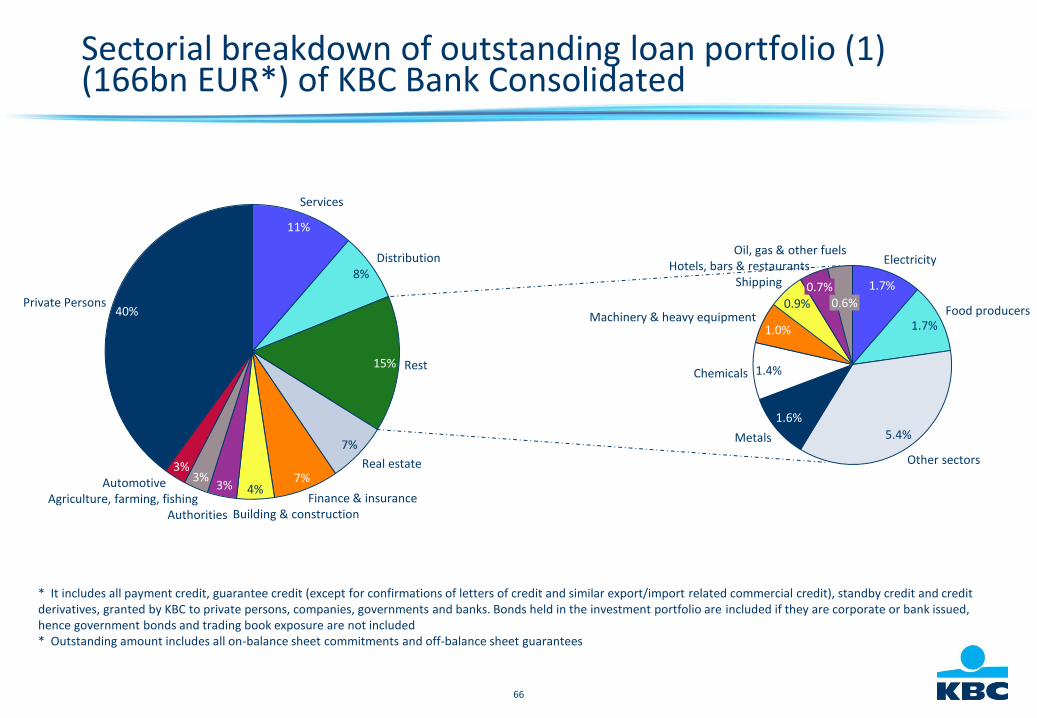
Sectorial breakdown of outstanding loan portfolio (1)(166bn EUR*) of KBC Bank Consolidated
11%
8%
15%
7%
7%4%3%
3%3%
40%
Agriculture, farming, fishing
Services
Building & construction
Distribution
Rest
Real estate
Finance & insuranceAutomotive
Authorities
Private PersonsFood producers
1.7%
1.4%
Electricity
Other sectors
Hotels, bars & restaurants
1.7%
Metals 5.4%
1.6%
1.0%
Chemicals
Machinery & heavy equipment0.9%
Shipping 0.7%0.6%
Oil, gas & other fuels
* It includes all payment credit, guarantee credit (except for confirmations of letters of credit and similar export/import related commercial credit), standby credit and credit derivatives, granted by KBC to private persons, companies, governments and banks. Bonds held in the investment portfolio are included if they are corporate or bank issued, hence government bonds and trading book exposure are not included* Outstanding amount includes all on-balance sheet commitments and off-balance sheet guarantees
67
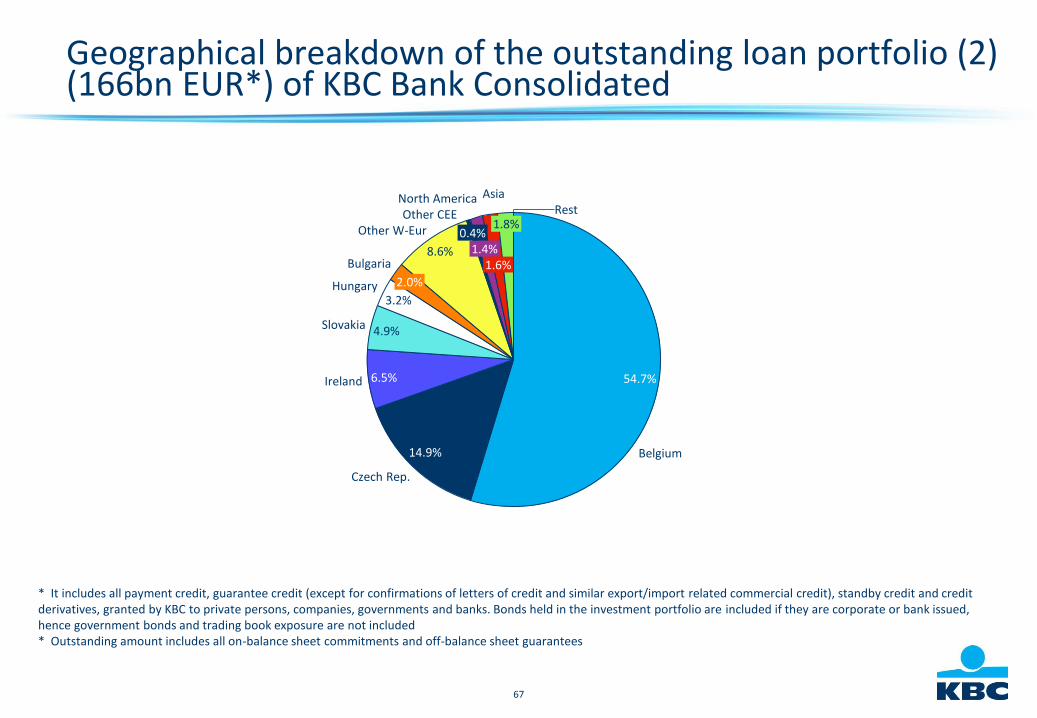
Geographical breakdown of the outstanding loan portfolio (2)(166bn EUR*) of KBC Bank Consolidated
6.5% 54.7%
Belgium14.9%
4.9%
Czech Rep.
3.2%
Ireland
Slovakia
Hungary 2.0%
Bulgaria8.6% 1.4%
Other W-Eur 0.4%
1.6%
Other CEENorth America Asia
1.8%Rest
* It includes all payment credit, guarantee credit (except for confirmations of letters of credit and similar export/import related commercial credit), standby credit and credit derivatives, granted by KBC to private persons, companies, governments and banks. Bonds held in the investment portfolio are included if they are corporate or bank issued, hence government bonds and trading book exposure are not included* Outstanding amount includes all on-balance sheet commitments and off-balance sheet guarantees
68
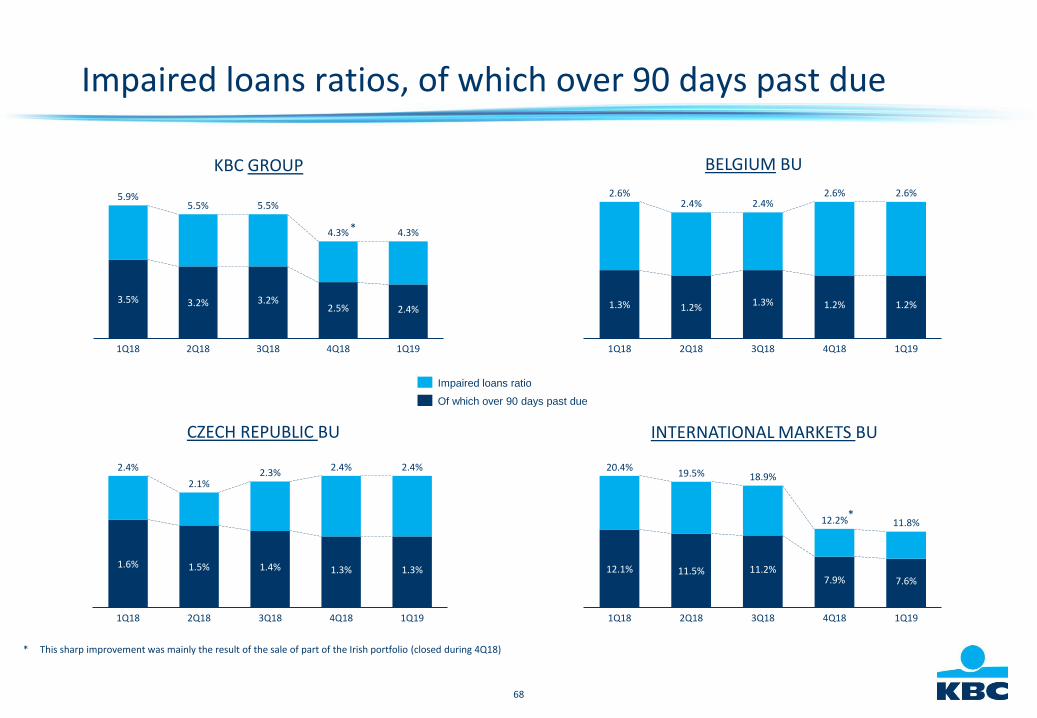
Impaired loans ratios, of which over 90 days past due
INTERNATIONAL MARKETS BUCZECH REPUBLIC BU
4Q183Q181Q18
3.5% 3.2% 3.2%
2Q18
2.5% 2.4%
1Q19
5.9%5.5% 5.5%
4.3% 4.3%
Impaired loans ratio
Of which over 90 days past due
1Q18
1.6% 1.4% 1.3%1.5%
2Q18
1.3%
2.1%
3Q18 4Q18 1Q19
2.4%2.4%2.3%
2.4%
11.2%7.6%
2Q181Q18
12.1%
1Q19
7.9%11.5%
3Q18
11.8%
4Q18
20.4%19.5% 18.9%
12.2%
BELGIUM BU
1.2%1.3% 1.2%
2.4%
1Q18 2Q18 4Q18
2.6%
1.3%
2.6%
3Q18
1.2%
1Q19
2.4%2.6%
KBC GROUP
* This sharp improvement was mainly the result of the sale of part of the Irish portfolio (closed during 4Q18)
*
*
69
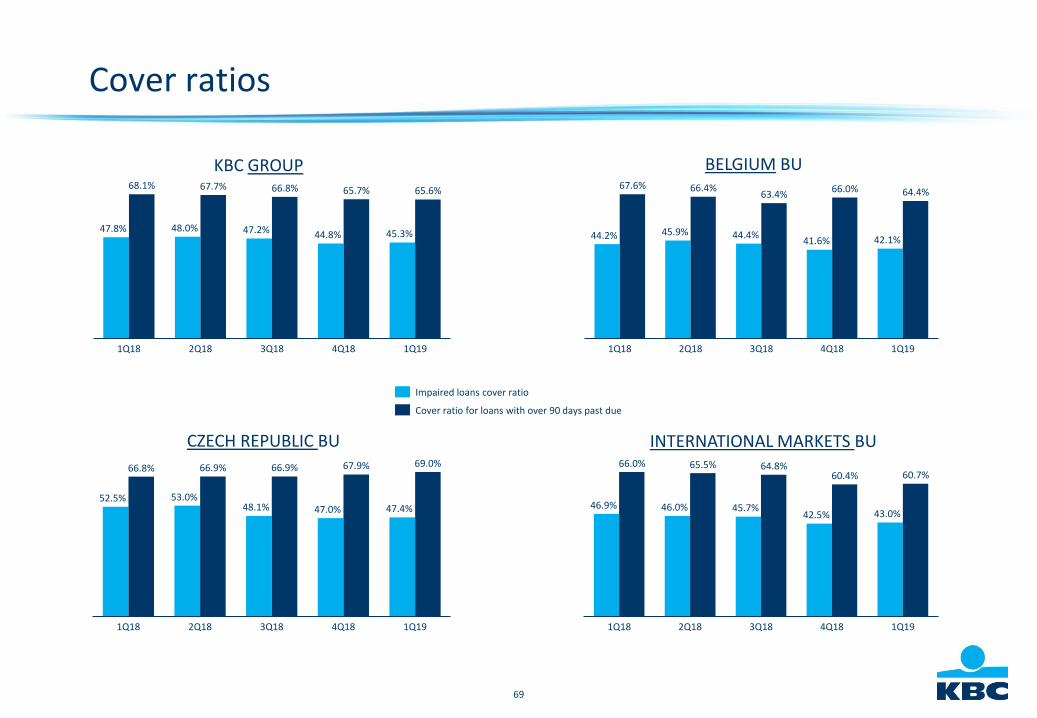
Cover ratios
INTERNATIONAL MARKETS BUCZECH REPUBLIC BU
BELGIUM BUKBC GROUP
47.8%44.8%
2Q181Q18 3Q18 4Q18
48.0%
68.1%
1Q19
67.7%
47.2%
66.8% 65.7%
45.3%
65.6%
Impaired loans cover ratio
Cover ratio for loans with over 90 days past due
66.9%
2Q181Q18
53.0%
3Q18 4Q18 1Q19
52.5%
66.8%
48.1%
66.9%
47.0%
67.9%
47.4%
69.0%
2Q181Q18 1Q19
66.0%
4Q183Q18
44.2%
67.6%
45.9%
66.4%
44.4%
63.4%
41.6% 42.1%
64.4%
3Q181Q18
66.0%
2Q18 4Q18 1Q19
45.7%46.0%46.9%
65.5% 64.8%
42.5%
60.4%
43.0%
60.7%
70
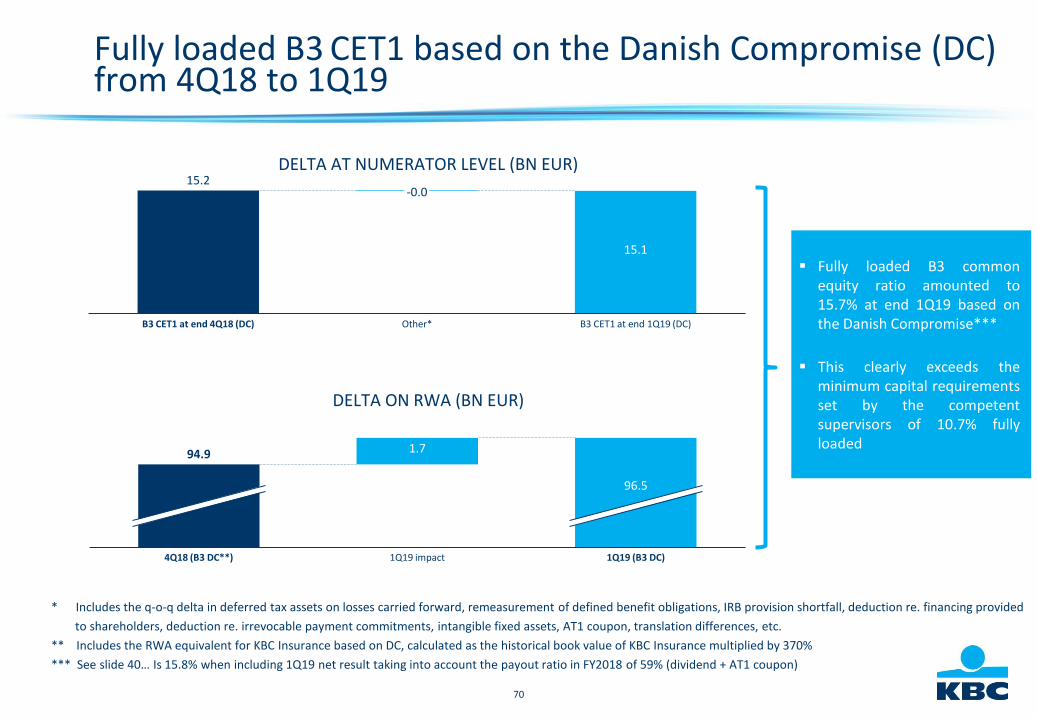
Fully loaded B3 CET1 based on the Danish Compromise (DC)from 4Q18 to 1Q19
Jan 2012 Dec 2012 2014-2020
4Q18 (B3 DC**)
1.7
96.5
1Q19 impact 1Q19 (B3 DC)
94.9
DELTA AT NUMERATOR LEVEL (BN EUR)
DELTA ON RWA (BN EUR)
* Includes the q-o-q delta in deferred tax assets on losses carried forward, remeasurement of defined benefit obligations, IRB provision shortfall, deduction re. financing provided
to shareholders, deduction re. irrevocable payment commitments, intangible fixed assets, AT1 coupon, translation differences, etc.
** Includes the RWA equivalent for KBC Insurance based on DC, calculated as the historical book value of KBC Insurance multiplied by 370%
*** See slide 40… Is 15.8% when including 1Q19 net result taking into account the payout ratio in FY2018 of 59% (dividend + AT1 coupon)
▪ Fully loaded B3 commonequity ratio amounted to15.7% at end 1Q19 based onthe Danish Compromise***
▪ This clearly exceeds theminimum capital requirementsset by the competentsupervisors of 10.7% fullyloaded
B3 CET1 at end 1Q19 (DC)B3 CET1 at end 4Q18 (DC)
15.1
-0.015.2
Other*
71
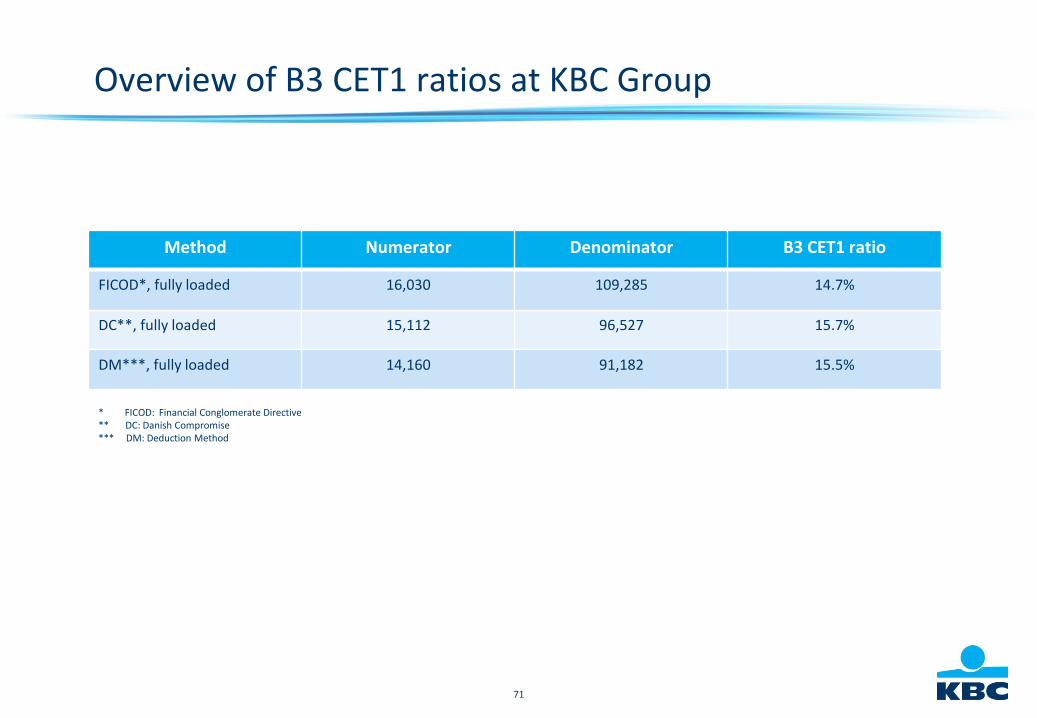
Overview of B3 CET1 ratios at KBC Group
Method Numerator Denominator B3 CET1 ratio
FICOD*, fully loaded 16,030 109,285 14.7%
DC**, fully loaded 15,112 96,527 15.7%
DM***, fully loaded 14,160 91,182 15.5%
* FICOD: Financial Conglomerate Directive** DC: Danish Compromise*** DM: Deduction Method
72
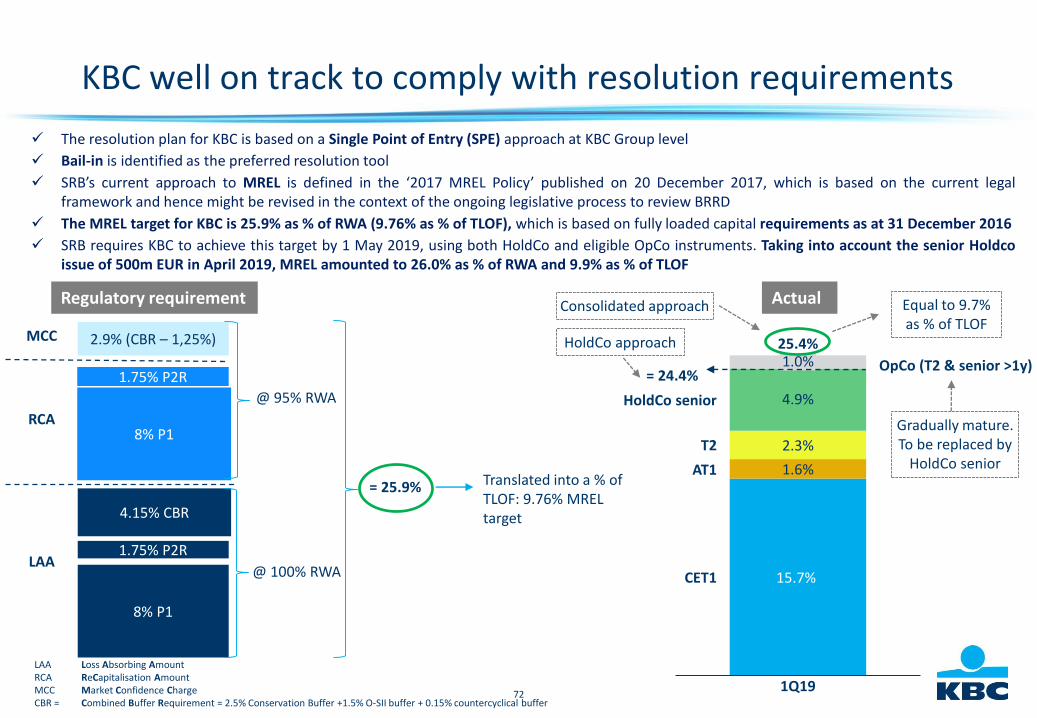
✓ The resolution plan for KBC is based on a Single Point of Entry (SPE) approach at KBC Group level
✓ Bail-in is identified as the preferred resolution tool
✓ SRB’s current approach to MREL is defined in the ‘2017 MREL Policy’ published on 20 December 2017, which is based on the current legalframework and hence might be revised in the context of the ongoing legislative process to review BRRD
✓ The MREL target for KBC is 25.9% as % of RWA (9.76% as % of TLOF), which is based on fully loaded capital requirements as at 31 December 2016
✓ SRB requires KBC to achieve this target by 1 May 2019, using both HoldCo and eligible OpCo instruments. Taking into account the senior Holdcoissue of 500m EUR in April 2019, MREL amounted to 26.0% as % of RWA and 9.9% as % of TLOF
LAA Loss Absorbing AmountRCA ReCapitalisation AmountMCC Market Confidence ChargeCBR = Combined Buffer Requirement = 2.5% Conservation Buffer +1.5% O-SII buffer + 0.15% countercyclical buffer
LAA
RCA
MCC
8% P1
1.75% P2R
4.15% CBR
8% P1
1.75% P2R
2.9% (CBR – 1,25%)
@ 100% RWA
@ 95% RWA
= 25.9%
1.0% OpCo (T2 & senior >1y)
15.7%
4.9%
2.3%
1Q19
1.6%
HoldCo senior
T2
AT1
CET1
25.4%
= 24.4%
Gradually mature.To be replaced by
HoldCo senior
HoldCo approach
Consolidated approach
KBC well on track to comply with resolution requirements
ActualRegulatory requirement
Translated into a % of TLOF: 9.76% MREL target
Equal to 9.7% as % of TLOF
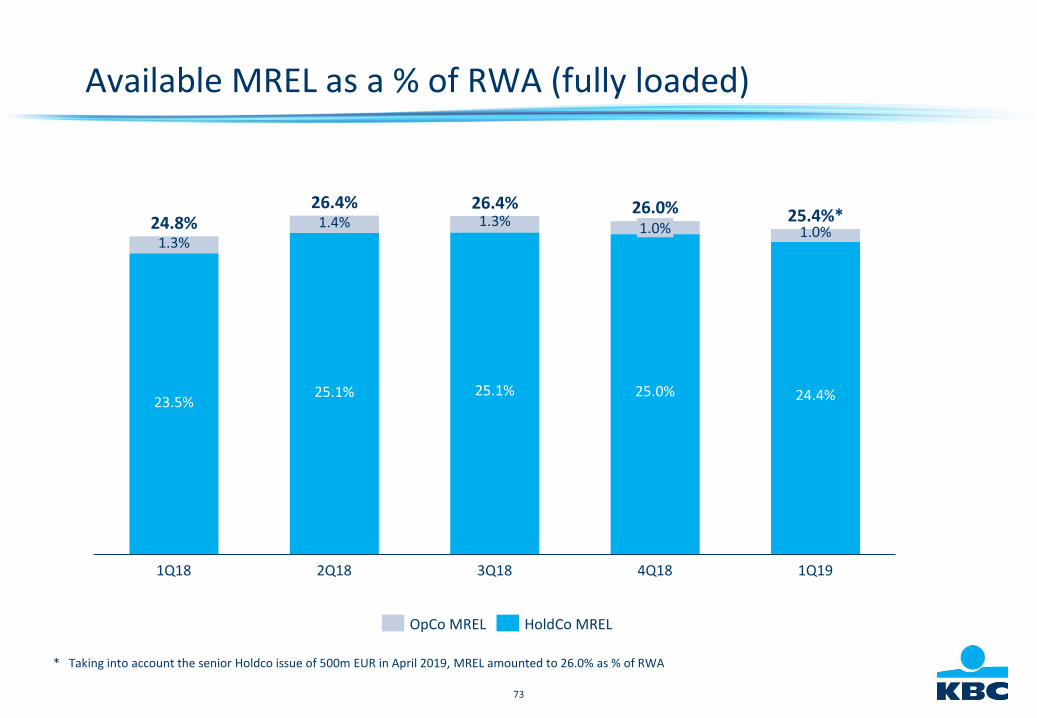
73
Available MREL as a % of RWA (fully loaded)
1.3%
2Q18
25.1%
26.4%
25.1%
1.3%
23.5%
1Q18
1.4%
3Q18
1.0%
25.0%
4Q18
1.0%
24.4%
1Q19
24.8%26.4% 26.0% 25.4%*
OpCo MREL HoldCo MREL
* Taking into account the senior Holdco issue of 500m EUR in April 2019, MREL amounted to 26.0% as % of RWA
74
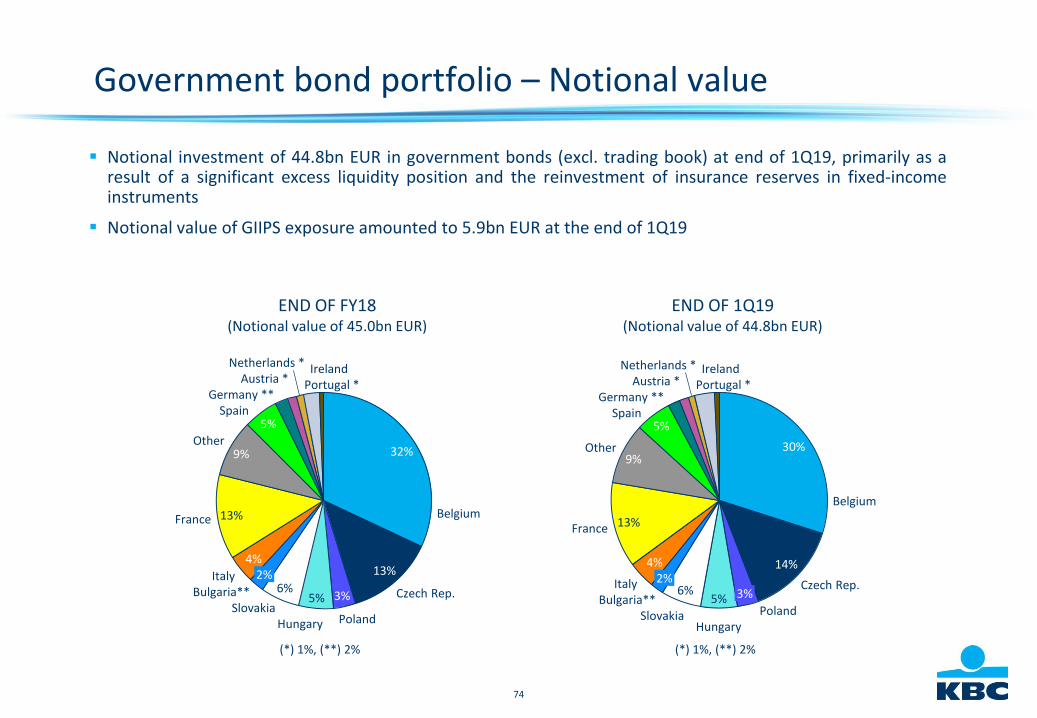
Government bond portfolio – Notional value
▪ Notional investment of 44.8bn EUR in government bonds (excl. trading book) at end of 1Q19, primarily as aresult of a significant excess liquidity position and the reinvestment of insurance reserves in fixed-incomeinstruments
▪ Notional value of GIIPS exposure amounted to 5.9bn EUR at the end of 1Q19
30%
14%
5%6%
4%
13%
9%
5%
France
Belgium
Czech Rep.
Poland
3%
Austria *
Other
Bulgaria**
HungarySlovakia
2%Italy
SpainGermany **
Netherlands * IrelandPortugal *
END OF 1Q19(Notional value of 44.8bn EUR)
(*) 1%, (**) 2%
32%
13%
3%5%6%
4%
13%
9%
5%
Other
Slovakia
Belgium
Bulgaria** Czech Rep.
Poland
France
Italy
Hungary
2%
SpainGermany **
Austria *Netherlands *
Portugal *Ireland
END OF FY18(Notional value of 45.0bn EUR)
(*) 1%, (**) 2%
75
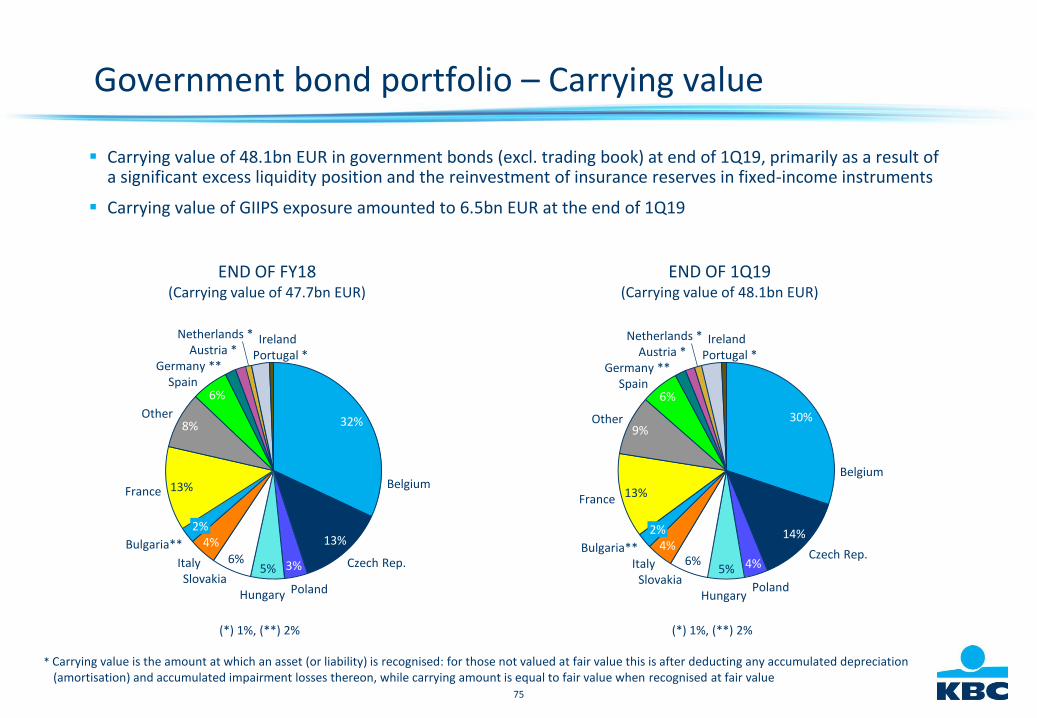
Government bond portfolio – Carrying value
▪ Carrying value of 48.1bn EUR in government bonds (excl. trading book) at end of 1Q19, primarily as a result of a significant excess liquidity position and the reinvestment of insurance reserves in fixed-income instruments
▪ Carrying value of GIIPS exposure amounted to 6.5bn EUR at the end of 1Q19
* Carrying value is the amount at which an asset (or liability) is recognised: for those not valued at fair value this is after deducting any accumulated depreciation (amortisation) and accumulated impairment losses thereon, while carrying amount is equal to fair value when recognised at fair value
END OF 1Q19(Carrying value of 48.1bn EUR)
(*) 1%, (**) 2%
30%
14%
4%5%6%
4%
13%
9%
6%
Hungary
Belgium
Bulgaria**
Ireland
Czech Rep.
PolandSlovakia
France
Italy
2%
Other
SpainGermany **
Austria *Netherlands *
Portugal *
END OF FY18(Carrying value of 47.7bn EUR)
(*) 1%, (**) 2%
32%
13%
3%5%6%
4%
13%
8%
6%
Belgium
2%
Slovakia
Portugal *
Czech Rep.
PolandHungary
Bulgaria**
Italy
Other
France
SpainGermany **
Austria *IrelandNetherlands *
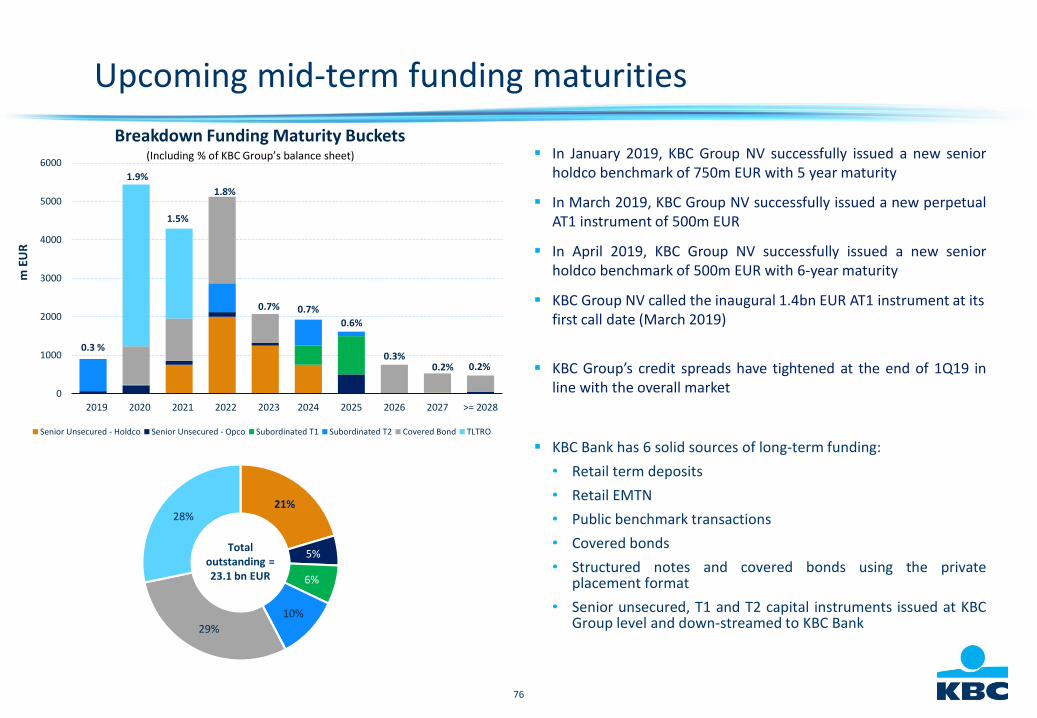
76
Upcoming mid-term funding maturities
▪ In January 2019, KBC Group NV successfully issued a new seniorholdco benchmark of 750m EUR with 5 year maturity
▪ In March 2019, KBC Group NV successfully issued a new perpetualAT1 instrument of 500m EUR
▪ In April 2019, KBC Group NV successfully issued a new seniorholdco benchmark of 500m EUR with 6-year maturity
▪ KBC Group NV called the inaugural 1.4bn EUR AT1 instrument at its first call date (March 2019)
▪ KBC Group’s credit spreads have tightened at the end of 1Q19 inline with the overall market
▪ KBC Bank has 6 solid sources of long-term funding:
• Retail term deposits
• Retail EMTN
• Public benchmark transactions
• Covered bonds
• Structured notes and covered bonds using the privateplacement format
• Senior unsecured, T1 and T2 capital instruments issued at KBCGroup level and down-streamed to KBC Bank
21%
5%
6%
10%
29%
28%
0.3 %
1.9%
1.5%
1.8%
0.7% 0.7%
0.6%
0.3%0.2% 0.2%
0
1000
2000
3000
4000
5000
6000
2019 2020 2021 2022 2023 2024 2025 2026 2027 >= 2028
m E
UR
Breakdown Funding Maturity Buckets
Senior Unsecured - Holdco Senior Unsecured - Opco Subordinated T1 Subordinated T2 Covered Bond TLTRO
Total outstanding = 23.1 bn EUR
(Including % of KBC Group’s balance sheet)
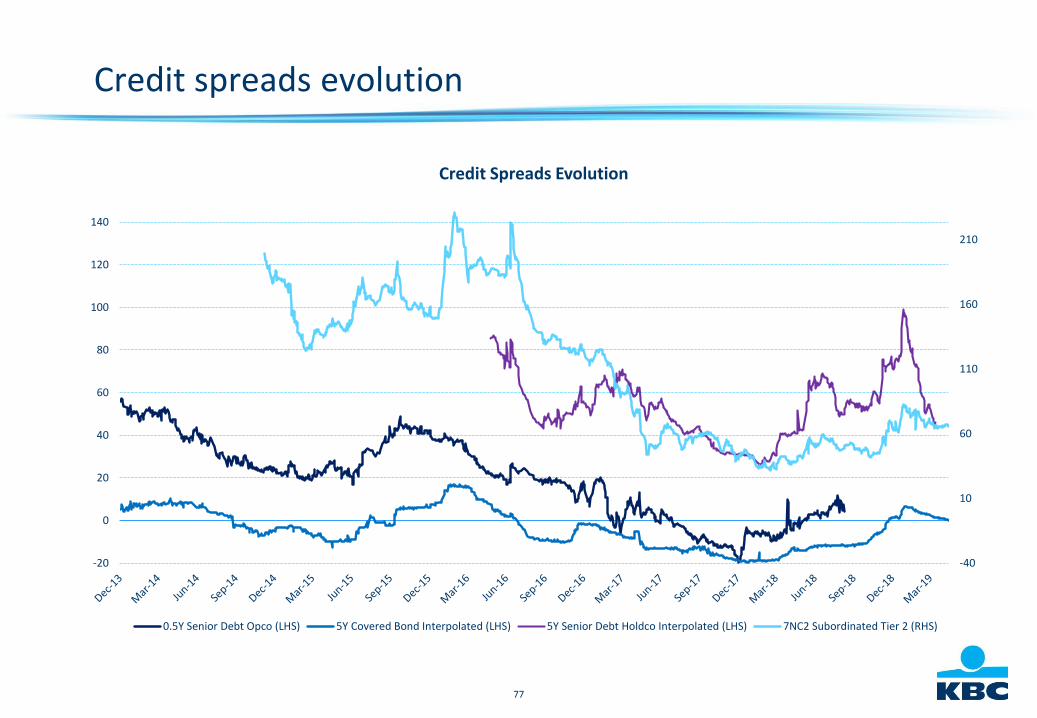
77
-40
10
60
110
160
210
-20
0
20
40
60
80
100
120
140
Credit Spreads Evolution
0.5Y Senior Debt Opco (LHS) 5Y Covered Bond Interpolated (LHS) 5Y Senior Debt Holdco Interpolated (LHS) 7NC2 Subordinated Tier 2 (RHS)
Credit spreads evolution
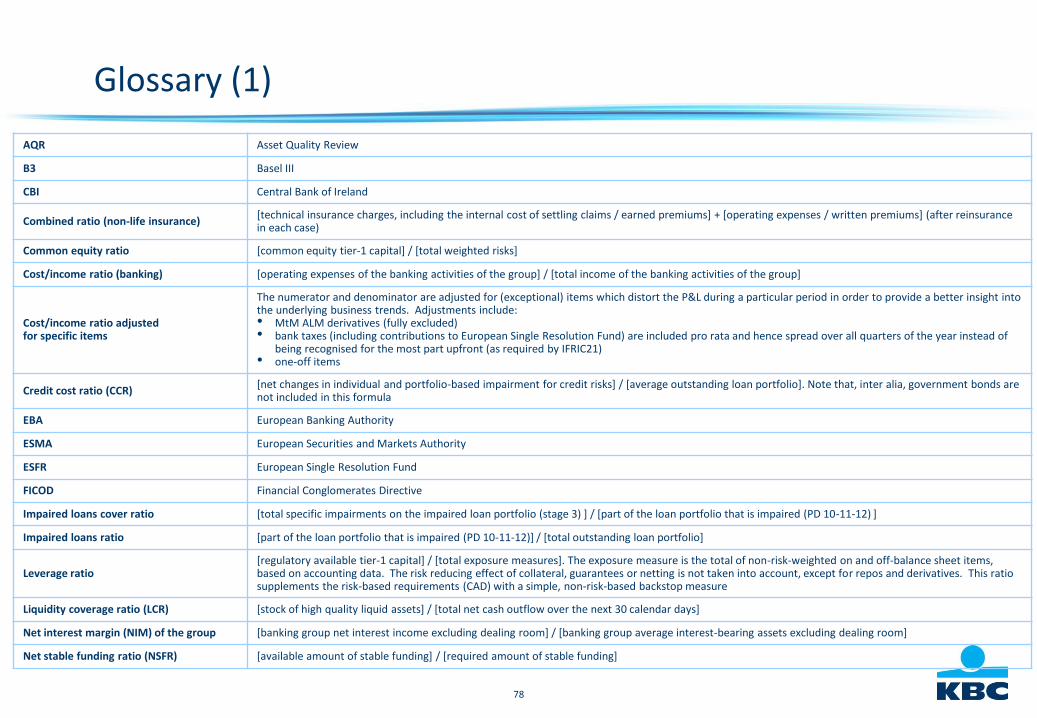
78
Glossary (1)
AQR Asset Quality Review
B3 Basel III
CBI Central Bank of Ireland
Combined ratio (non-life insurance)[technical insurance charges, including the internal cost of settling claims / earned premiums] + [operating expenses / written premiums] (after reinsurance in each case)
Common equity ratio [common equity tier-1 capital] / [total weighted risks]
Cost/income ratio (banking) [operating expenses of the banking activities of the group] / [total income of the banking activities of the group]
Cost/income ratio adjusted for specific items
The numerator and denominator are adjusted for (exceptional) items which distort the P&L during a particular period in order to provide a better insight into the underlying business trends. Adjustments include: • MtM ALM derivatives (fully excluded)• bank taxes (including contributions to European Single Resolution Fund) are included pro rata and hence spread over all quarters of the year instead of
being recognised for the most part upfront (as required by IFRIC21)• one-off items
Credit cost ratio (CCR)[net changes in individual and portfolio-based impairment for credit risks] / [average outstanding loan portfolio]. Note that, inter alia, government bonds are not included in this formula
EBA European Banking Authority
ESMA European Securities and Markets Authority
ESFR European Single Resolution Fund
FICOD Financial Conglomerates Directive
Impaired loans cover ratio [total specific impairments on the impaired loan portfolio (stage 3) ] / [part of the loan portfolio that is impaired (PD 10-11-12) ]
Impaired loans ratio [part of the loan portfolio that is impaired (PD 10-11-12)] / [total outstanding loan portfolio]
Leverage ratio[regulatory available tier-1 capital] / [total exposure measures]. The exposure measure is the total of non-risk-weighted on and off-balance sheet items, based on accounting data. The risk reducing effect of collateral, guarantees or netting is not taken into account, except for repos and derivatives. This ratio supplements the risk-based requirements (CAD) with a simple, non-risk-based backstop measure
Liquidity coverage ratio (LCR) [stock of high quality liquid assets] / [total net cash outflow over the next 30 calendar days]
Net interest margin (NIM) of the group [banking group net interest income excluding dealing room] / [banking group average interest-bearing assets excluding dealing room]
Net stable funding ratio (NSFR) [available amount of stable funding] / [required amount of stable funding]
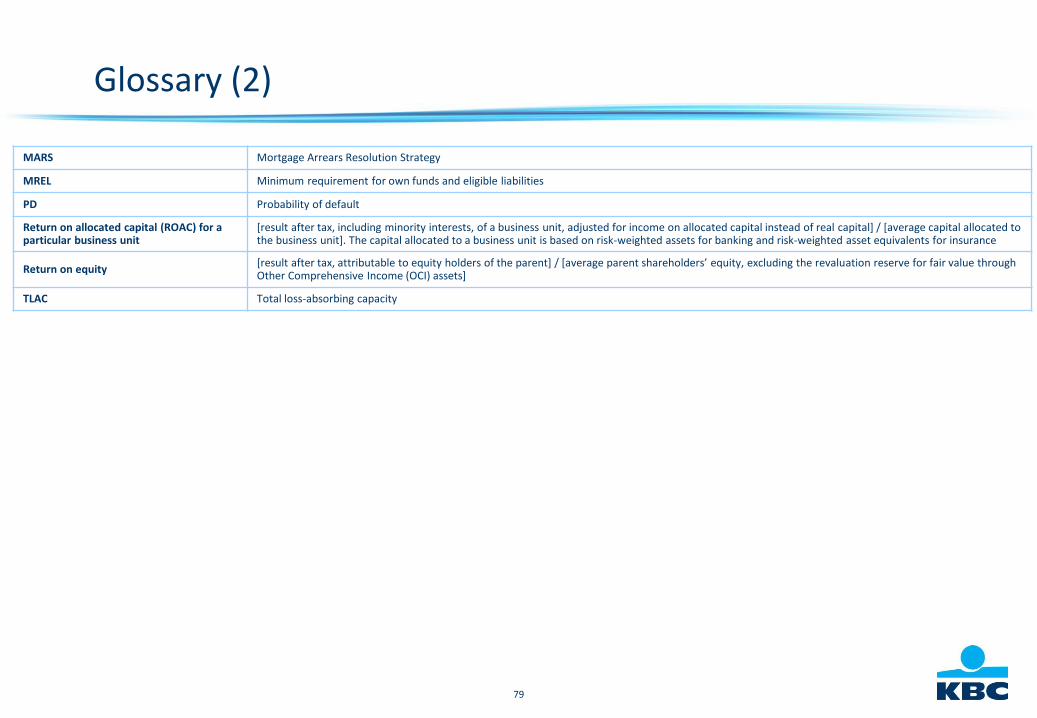
79
Glossary (2)
MARS Mortgage Arrears Resolution Strategy
MREL Minimum requirement for own funds and eligible liabilities
PD Probability of default
Return on allocated capital (ROAC) for a particular business unit
[result after tax, including minority interests, of a business unit, adjusted for income on allocated capital instead of real capital] / [average capital allocated to the business unit]. The capital allocated to a business unit is based on risk-weighted assets for banking and risk-weighted asset equivalents for insurance
Return on equity[result after tax, attributable to equity holders of the parent] / [average parent shareholders’ equity, excluding the revaluation reserve for fair value through Other Comprehensive Income (OCI) assets]
TLAC Total loss-absorbing capacity