Embed Size (px)
Citation preview
1
KBC GroupCompany presentation2Q 2017
KBC Group - Investor Relations Office – E-mail:
More information: www.kbc.com
2
This presentation is provided for information purposes only. It does not constitute an offer to sell or the solicitation to buy anysecurity issued by the KBC Group.
KBC believes that this presentation is reliable, although some information is condensed and therefore incomplete. KBC cannot beheld liable for any loss or damage resulting from the use of the information.
This presentation contains non-IFRS information and forward-looking statements with respect to the strategy, earnings and capitaltrends of KBC, involving numerous assumptions and uncertainties. There is a risk that these statements may not be fulfilled andthat future developments differ materially. Moreover, KBC does not undertake any obligation to update the presentation in linewith new developments.
By reading this presentation, each investor is deemed to represent that it possesses sufficient expertise to understand the risksinvolved.
Important information for investors

3
2Q 2017 key takeaways for KBC Group
EXCELLENT BUSINESS PERFORMANCE IN 2Q17Exceptionally strong net result of 855m EUR in 2Q17 (and 1,485m EUR in 1H17). ROE of 20% in 1H17o Excellent performance of the commercial bank-insurance franchises in our core markets and core activitieso Q-o-q increase in customer loan volumes and customer deposits in most of our core countrieso Slightly higher net interest income despite slightly lower net interest margin q-o-q o High net fee and commission incomeo Higher net gains from financial instruments at fair value and higher realised AFS gains, lower net other incomeo Exceptional combined ratio of 84% in 1H17. Excellent sales of non-life products, while sales of life insurance products were lowero Strict cost management resulted in a cost/income ratio of 53% YTD adjusted for specific items o Net impairment releases of 71m, mainly driven by Ireland (net release of 87m EUR). The impairment guidance for Ireland has been updated
towards a net release of a range of 160m-200m EUR for FY17, driven by a 40m EUR adjustment as a result of the model recalibration in 2Q17
SOLID CAPITAL AND ROBUST LIQUIDITY POSITIONSo The B3 common equity ratio based on the Danish Compromise at end 2Q17 amounted to 15.83% phased-in and 15.65% fully loaded*.
The earnings generation in 2Q17 fully absorbed the impact of the acquisition of UBB & Interlease in Bulgaria of 50bps on fully loaded CET1o Fully loaded B3 leverage ratio, based on current CRR legislation, amounted to 5.7% at KBC Groupo Continued strong liquidity position (NSFR at 130% and LCR at 141%) at end 2Q17o Referring to our dividend policy, KBC will pay an interim dividend of 1 EUR per share in November 2017, as an advance payment on the total
dividend. The pay-out ratio policy (i.e. dividend + AT1 coupon) of at least 50% of consolidated profit is reconfirmed
* This clearly exceeds the minimum capital requirements set by the ECB / NBB of respectively 8.65% and 10.40% for 2017. On top of the above-mentioned capital requirements, the ECB expects KBC to hold a pillar 2 guidance (P2G) of 1.0% CET1
4
Contents
1
4
Strong solvency and solid liquidity
2Q 2017 wrap up
Annex 2: Other items
2
2Q 2017 performance of KBC Group
3
2Q 2017 performance of business units
Annex 1: Company profile
5
KBC Group
Section 1
2Q 2017 performance of KBC Group
6
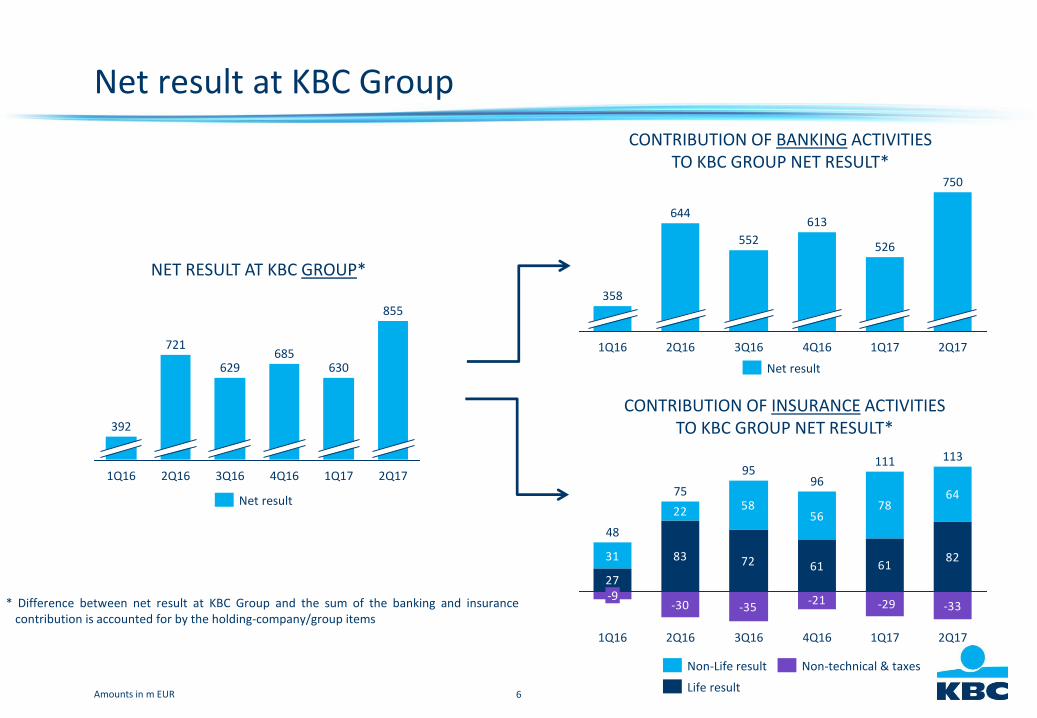
Net result at KBC Group
* Difference between net result at KBC Group and the sum of the banking and insurancecontribution is accounted for by the holding-company/group items
CONTRIBUTION OF BANKING ACTIVITIES TO KBC GROUP NET RESULT*
721
1Q16
392
2Q17
855
1Q17
630
4Q16
685
3Q16
629
2Q16
NET RESULT AT KBC GROUP*
2Q17
750
1Q17
526
4Q16
613
3Q16
552
2Q16
644
1Q16
358
-30 -35
83 72 61 6131
22 5856
7864
-29-21 -33
27
82
2Q17
113
1Q17
111
4Q16
96
3Q16
95
2Q16
75
1Q16
48
-9
CONTRIBUTION OF INSURANCE ACTIVITIES TO KBC GROUP NET RESULT*
Amounts in m EUR
Net result
Net result
Non-Life result
Life result
Non-technical & taxes
7
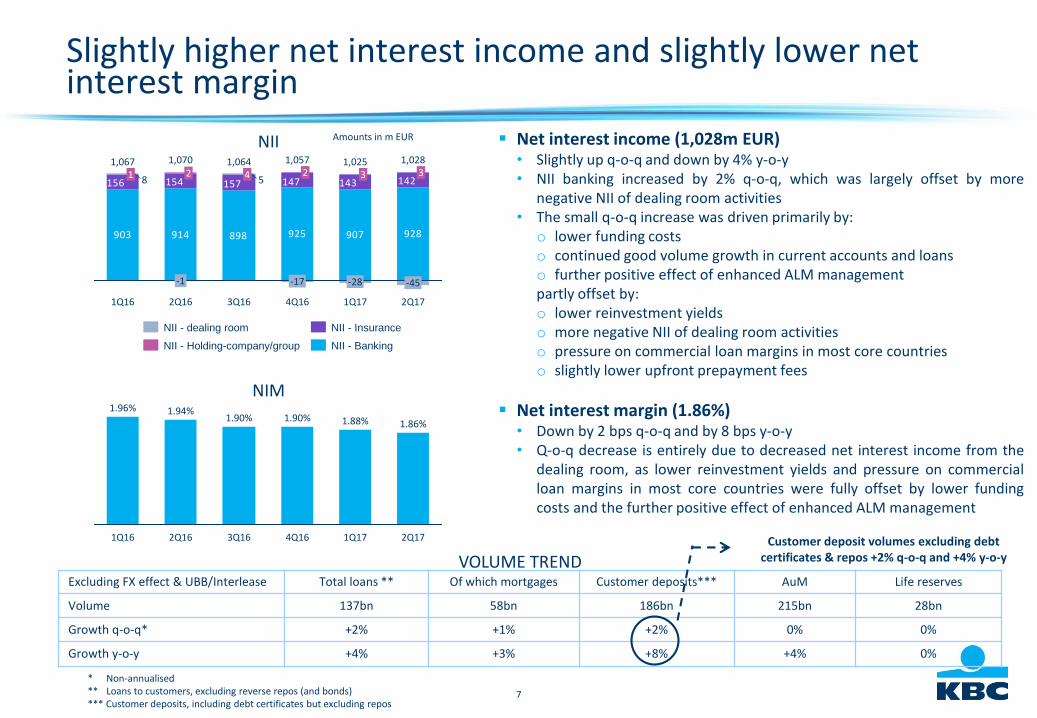
Slightly higher net interest income and slightly lower net interest margin
Net interest income (1,028m EUR)• Slightly up q-o-q and down by 4% y-o-y• NII banking increased by 2% q-o-q, which was largely offset by more
negative NII of dealing room activities• The small q-o-q increase was driven primarily by:
o lower funding costso continued good volume growth in current accounts and loanso further positive effect of enhanced ALM managementpartly offset by:o lower reinvestment yieldso more negative NII of dealing room activitieso pressure on commercial loan margins in most core countrieso slightly lower upfront prepayment fees
Net interest margin (1.86%)• Down by 2 bps q-o-q and by 8 bps y-o-y• Q-o-q decrease is entirely due to decreased net interest income from the
dealing room, as lower reinvestment yields and pressure on commercialloan margins in most core countries were fully offset by lower fundingcosts and the further positive effect of enhanced ALM management
NIM
NII
914 925 907898903
157156
928
143147154 142582
-1
1Q16
1,0671
2Q17
4
2Q16
1,070 1,0283
-45
1Q17
1,0253
-28-17
3Q16
1,064
4Q16
1,0572
2Q17
1.86%
1Q17
1.88%1.90%
3Q16
1.90%
2Q16
1.94%
1Q16
1.96%
4Q16
Amounts in m EUR
NII - Insurance
NII - Holding-company/group
NII - dealing room
NII - Banking
* Non-annualised ** Loans to customers, excluding reverse repos (and bonds)*** Customer deposits, including debt certificates but excluding repos
VOLUME TRENDExcluding FX effect & UBB/Interlease Total loans ** Of which mortgages Customer deposits*** AuM Life reserves
Volume 137bn 58bn 186bn 215bn 28bn
Growth q-o-q* +2% +1% +2% 0% 0%
Growth y-o-y +4% +3% +8% +4% 0%
Customer deposit volumes excluding debtcertificates & repos +2% q-o-q and +4% y-o-y

8
High net fee and commission income
Net fee and commission income (430m EUR)• Down by 2% q-o-q and up by 19% y-o-y
• Despite an increase of the net sales, net F&C incomedecreased q-o-q driven chiefly by:o high entry fees from mutual funds (due to a further
successful shift to the new discretionary-based serviceproposition in Belgium), but lower q-o-q due to theexceptionally strong 1Q17
o lower securities-related fees
• Y-o-y increase was mainly the result of:o higher management fees from mutual funds & unit-
linked life insurance products (mainly thanks to a goodequity market performance and a higher assets base)
o higher entry fees from mutual funds and unit-linked lifeinsurance products due to the successful shift to the newdiscretionary-based service proposition in Belgium
o higher fees from payment services (mainly in Hungary)o higher securities-related fees (in Belgium)
Assets under management (215bn EUR)• Slightly decreased q-o-q owing to a negative price effect
• Rose by 4% y-o-y owing to net outflows (-1%) and a positiveprice effect (+5%)
• The mutual fund business has seen net inflows again(substantially higher q-o-q), but this was offset mainly bynet outflows in group assets and investment advice
F&C
Amounts in m EUR
422 432 443 455 511
-72-80-74-71-76 -73
506
2Q17
430
1Q17
439
4Q16
-2
376
3Q16
368
2Q16
360
-1
1Q16
346
F&C - contribution of holding-company/group
F&C - banking contribution
F&C - insurance contribution
Amounts in bn EUR
AuM
215216213209207207
2Q171Q174Q163Q162Q161Q16
9
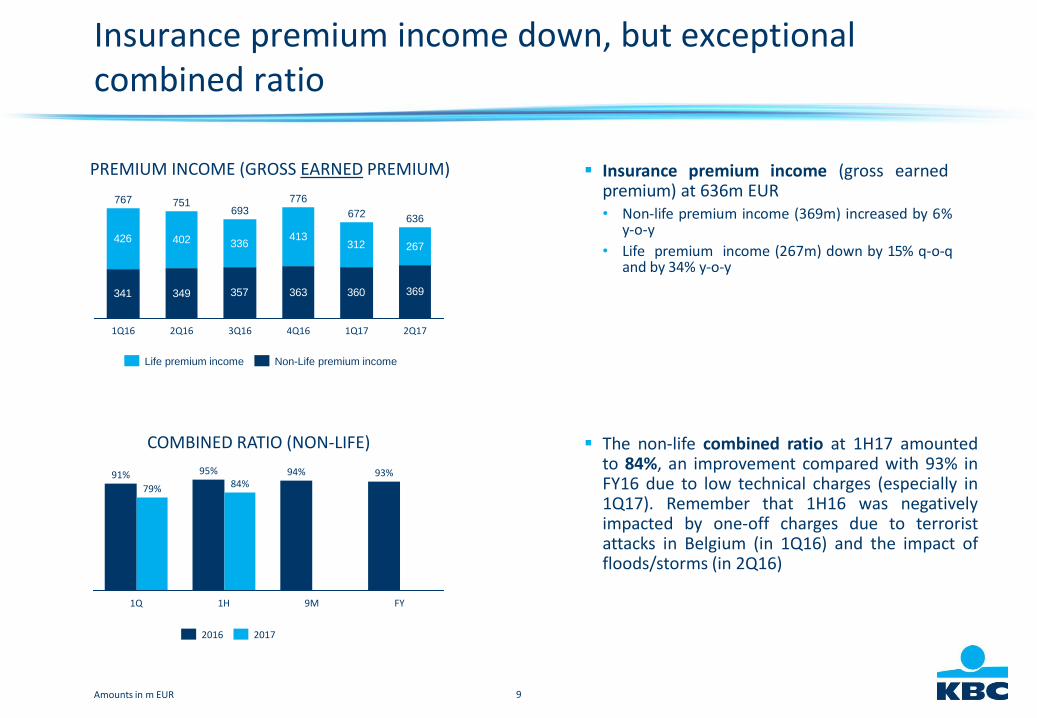
Insurance premium income (gross earned premium) at 636m EUR• Non-life premium income (369m) increased by 6%
y-o-y
• Life premium income (267m) down by 15% q-o-qand by 34% y-o-y
The non-life combined ratio at 1H17 amountedto 84%, an improvement compared with 93% inFY16 due to low technical charges (especially in1Q17). Remember that 1H16 was negativelyimpacted by one-off charges due to terroristattacks in Belgium (in 1Q16) and the impact offloods/storms (in 2Q16)
Amounts in m EUR
Insurance premium income down, but exceptional combined ratio
COMBINED RATIO (NON-LIFE)
PREMIUM INCOME (GROSS EARNED PREMIUM)
84%
FY
93%
9M
94%
1H
95%
1Q
79%
91%
20172016
341 349 357 363 360
426 402 336413
312
369
267
2Q17
636
1Q17
672
4Q16
776
3Q16
693
2Q16
751
1Q16
767
Non-Life premium incomeLife premium income
10
Non-life sales up y-o-y, life sales down q-o-q and y-o-y
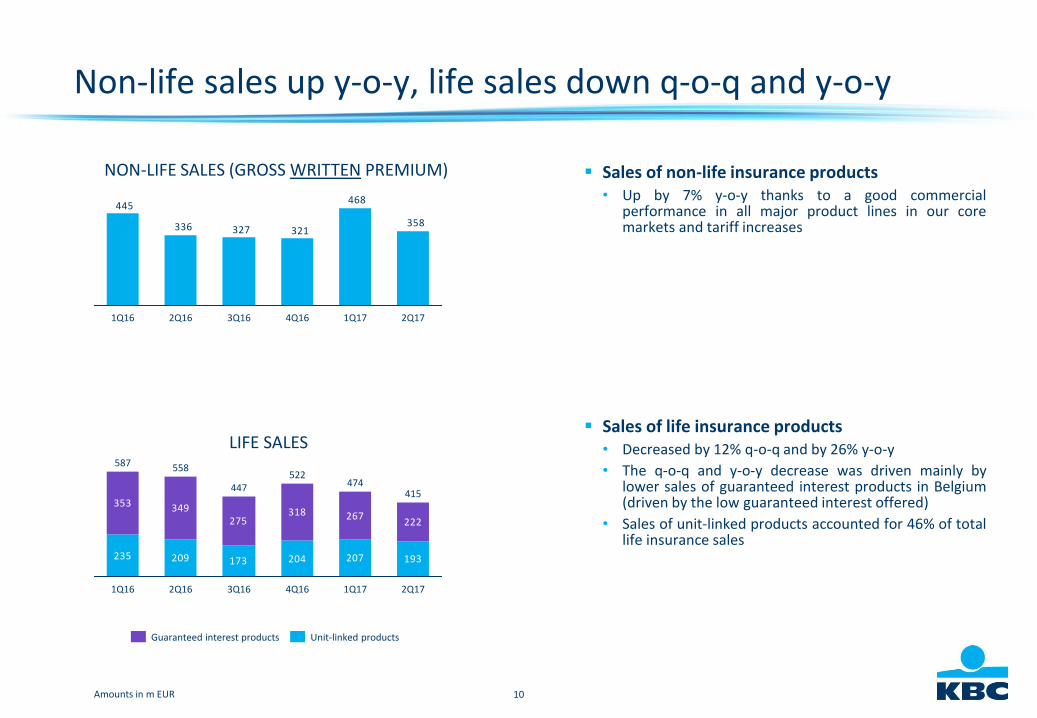
Sales of non-life insurance products• Up by 7% y-o-y thanks to a good commercial
performance in all major product lines in our coremarkets and tariff increases
Sales of life insurance products• Decreased by 12% q-o-q and by 26% y-o-y
• The q-o-q and y-o-y decrease was driven mainly bylower sales of guaranteed interest products in Belgium(driven by the low guaranteed interest offered)
• Sales of unit-linked products accounted for 46% of totallife insurance sales
LIFE SALES
NON-LIFE SALES (GROSS WRITTEN PREMIUM)
235 209 173 204 207
353 349275
318 267
193
222
474
1Q17
415
2Q174Q16
522
3Q16
447
2Q16
558
1Q16
587
Unit-linked productsGuaranteed interest products
Amounts in m EUR
358
468
321327336
445
2Q16 3Q161Q16 1Q174Q16 2Q17
11
Higher FV gains and gains realised on AFS assets, lower other net income
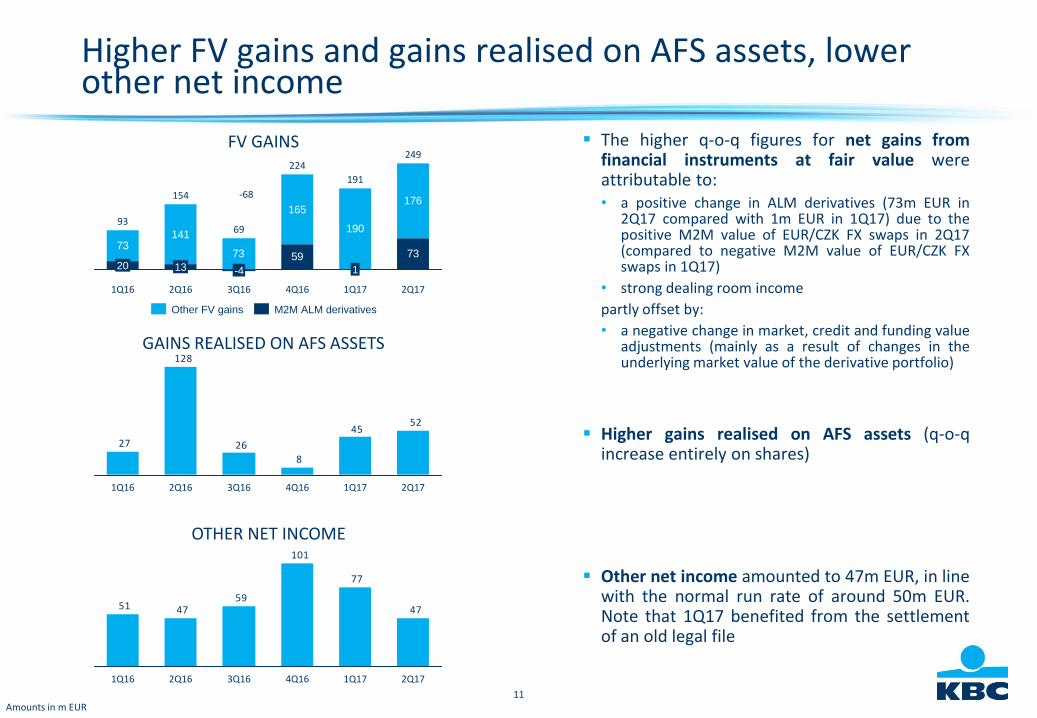
The higher q-o-q figures for net gains fromfinancial instruments at fair value wereattributable to:• a positive change in ALM derivatives (73m EUR in
2Q17 compared with 1m EUR in 1Q17) due to thepositive M2M value of EUR/CZK FX swaps in 2Q17(compared to negative M2M value of EUR/CZK FXswaps in 1Q17)
• strong dealing room income
partly offset by:
• a negative change in market, credit and funding valueadjustments (mainly as a result of changes in theunderlying market value of the derivative portfolio)
Higher gains realised on AFS assets (q-o-qincrease entirely on shares)
Other net income amounted to 47m EUR, in linewith the normal run rate of around 50m EUR.Note that 1Q17 benefited from the settlementof an old legal file
FV GAINS
Amounts in m EUR
73141
73
165
190
7359
176
249
2Q171Q17
191
1
4Q16
224
3Q16
69
-4
2Q16
154
13
1Q16
93
20
5245
8
26
128
27
2Q171Q174Q163Q162Q161Q16
GAINS REALISED ON AFS ASSETS
47
77
101
594751
2Q171Q174Q163Q162Q161Q16
OTHER NET INCOME
M2M ALM derivativesOther FV gains
-68
12
Operating expenses down, due entirely to lower bank taxes, and good cost/income ratio
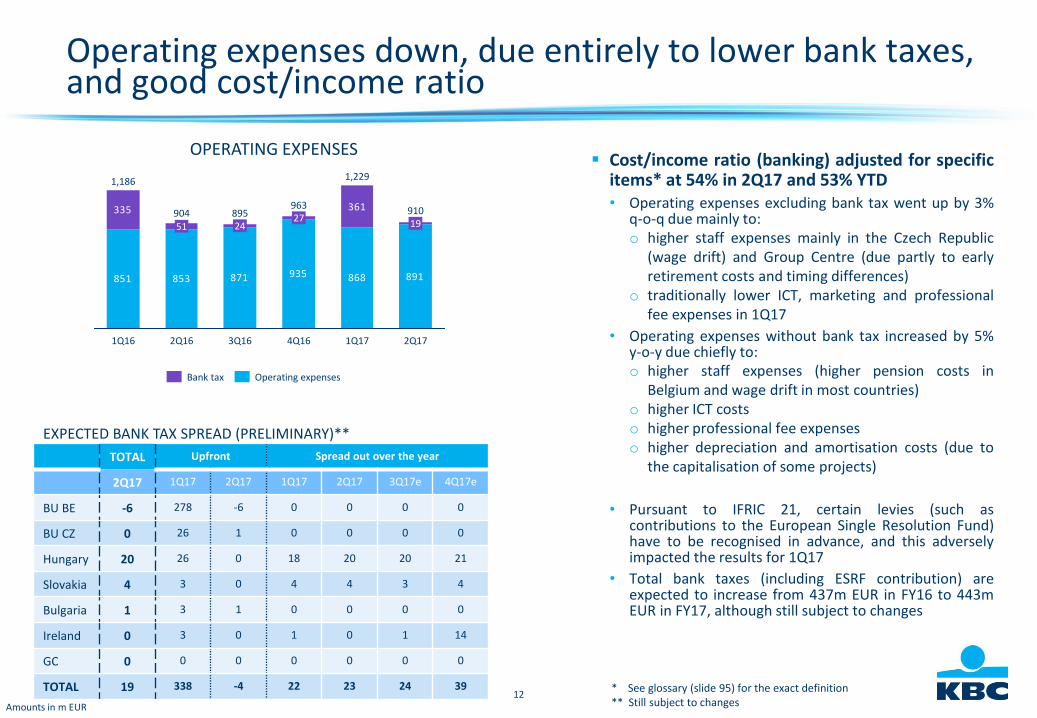
Cost/income ratio (banking) adjusted for specificitems* at 54% in 2Q17 and 53% YTD• Operating expenses excluding bank tax went up by 3%
q-o-q due mainly to:o higher staff expenses mainly in the Czech Republic
(wage drift) and Group Centre (due partly to earlyretirement costs and timing differences)
o traditionally lower ICT, marketing and professionalfee expenses in 1Q17
• Operating expenses without bank tax increased by 5%y-o-y due chiefly to:o higher staff expenses (higher pension costs in
Belgium and wage drift in most countries)o higher ICT costso higher professional fee expenseso higher depreciation and amortisation costs (due to
the capitalisation of some projects)
• Pursuant to IFRIC 21, certain levies (such ascontributions to the European Single Resolution Fund)have to be recognised in advance, and this adverselyimpacted the results for 1Q17
• Total bank taxes (including ESRF contribution) areexpected to increase from 437m EUR in FY16 to 443mEUR in FY17, although still subject to changes
OPERATING EXPENSES
851 853 871 935 868 891
361335
1,229
1Q17
27
4Q16
963
2Q17
904
1Q16
1,186
9101951
895
3Q162Q16
24
Bank tax Operating expenses
* See glossary (slide 95) for the exact definition** Still subject to changesAmounts in m EUR
TOTAL Upfront Spread out over the year
2Q17 1Q17 2Q17 1Q17 2Q17 3Q17e 4Q17e
BU BE -6 278 -6 0 0 0 0
BU CZ 0 26 1 0 0 0 0
Hungary 20 26 0 18 20 20 21
Slovakia 4 3 0 4 4 3 4
Bulgaria 1 3 1 0 0 0 0
Ireland 0 3 0 1 0 1 14
GC 0 0 0 0 0 0 0
TOTAL 19 338 -4 22 23 24 39
EXPECTED BANK TAX SPREAD (PRELIMINARY)**
13
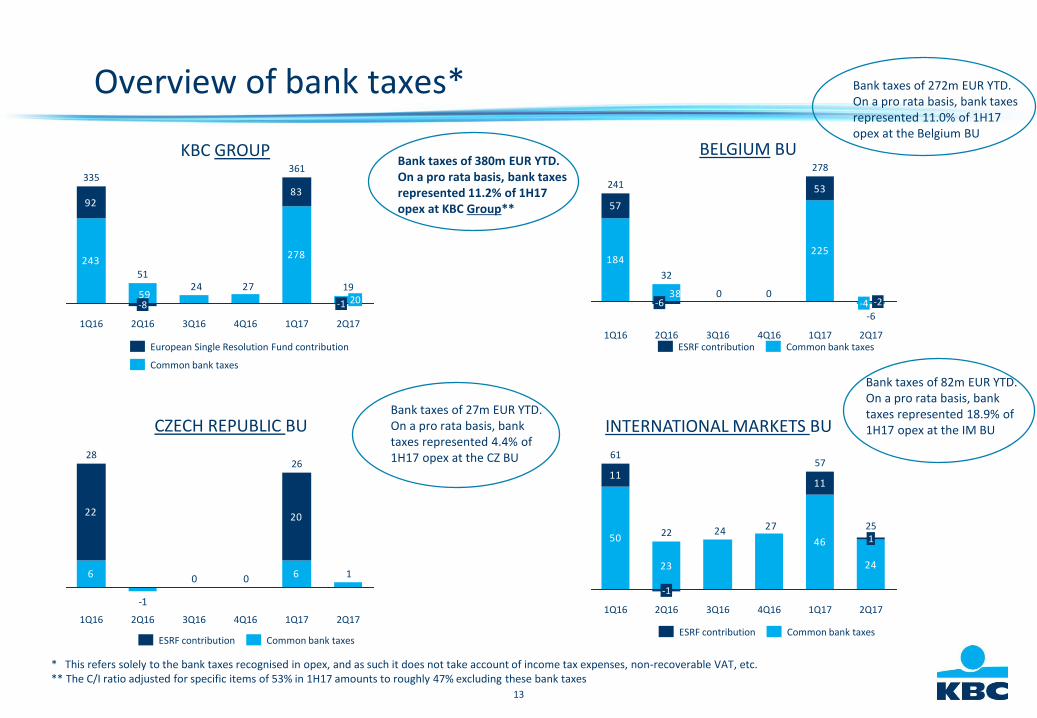
Overview of bank taxes*
INTERNATIONAL MARKETS BUCZECH REPUBLIC BU
BELGIUM BUKBC GROUP
11
23
11
27244650
24
2Q171Q17
57
4Q163Q162Q16
22
-1
1Q16
1
61
25
Common bank taxesESRF contribution
57
53
225184
38 00-2-4
2Q171Q17
278
4Q163Q162Q16
32
-6
1Q16
241
-6
ESRF contribution Common bank taxes
6 6
-1
100
2022
2Q171Q17
26
4Q163Q162Q161Q16
28
Common bank taxesESRF contribution
9283
2724
278243
59
2Q171Q17
361
4Q163Q162Q16
51
-8
1Q16
335
1920-1
Common bank taxes
European Single Resolution Fund contribution
* This refers solely to the bank taxes recognised in opex, and as such it does not take account of income tax expenses, non-recoverable VAT, etc.** The C/I ratio adjusted for specific items of 53% in 1H17 amounts to roughly 47% excluding these bank taxes
Bank taxes of 380m EUR YTD. On a pro rata basis, bank taxes represented 11.2% of 1H17 opex at KBC Group**
Bank taxes of 272m EUR YTD. On a pro rata basis, bank taxes represented 11.0% of 1H17 opex at the Belgium BU
Bank taxes of 27m EUR YTD. On a pro rata basis, banktaxes represented 4.4% of 1H17 opex at the CZ BU
Bank taxes of 82m EUR YTD. On a pro rata basis, banktaxes represented 18.9% of 1H17 opex at the IM BU

14
Net impairment releases, excellent credit cost ratio and slightly increased impaired loans ratio
Net impairment releases• This was attributable mainly to:
o net loan loss provision releases in Ireland of 87m EUR(compared with 50m in 1Q17)
o also small reversals in Belgium and Hungary
• Impairment of 2m EUR on AFS shares (in Belgium)
• Impairment of 5m on other (of which 3m due to a revaluation ofleased cars in CSOB Leasing in the Czech Republic)
The credit cost ratio amounted to -0.10% in 1H17 due tolow gross impairments and several releases
The impaired loans ratio slightly increased to 6.9% duemainly to the consolidation of UBB in Bulgaria
ASSET IMPAIRMENT
25
21 19
5450
18
2Q17
-71
-78
7
1Q17
8
6 1
4Q16
73
3Q16
28
10
2Q16
71
1Q16
28
4
IMPAIRED LOANS RATIO
2Q17
6.9%
3.9%
1Q17
6.8%
3.6%
4Q16
7.2%
3.9%
3Q16
7.6%
4.2%
2Q16
7.8%
4.4%
1Q16
8.2%
4.7%
CREDIT COST RATIO
1H17
-0.10%
FY16
0.09%
FY15
0.23%
FY14
0.42%
FY13
1.21%
FY12
0.71%
FY11
0.82%
FY10
0.91%
of which over 90 days past dueImpaired loan ratio
Other impairments Impairments on L&R
15
KBC Group
Section 2
2Q 2017 performance of business units
16
BELGIUM BUSINESS UNIT
CFO SERVICES
CRO SERVICES
CORPORATE STAFF
BELGIUMCZECH
REPUBLICINTERNATIONAL
MARKETS
17
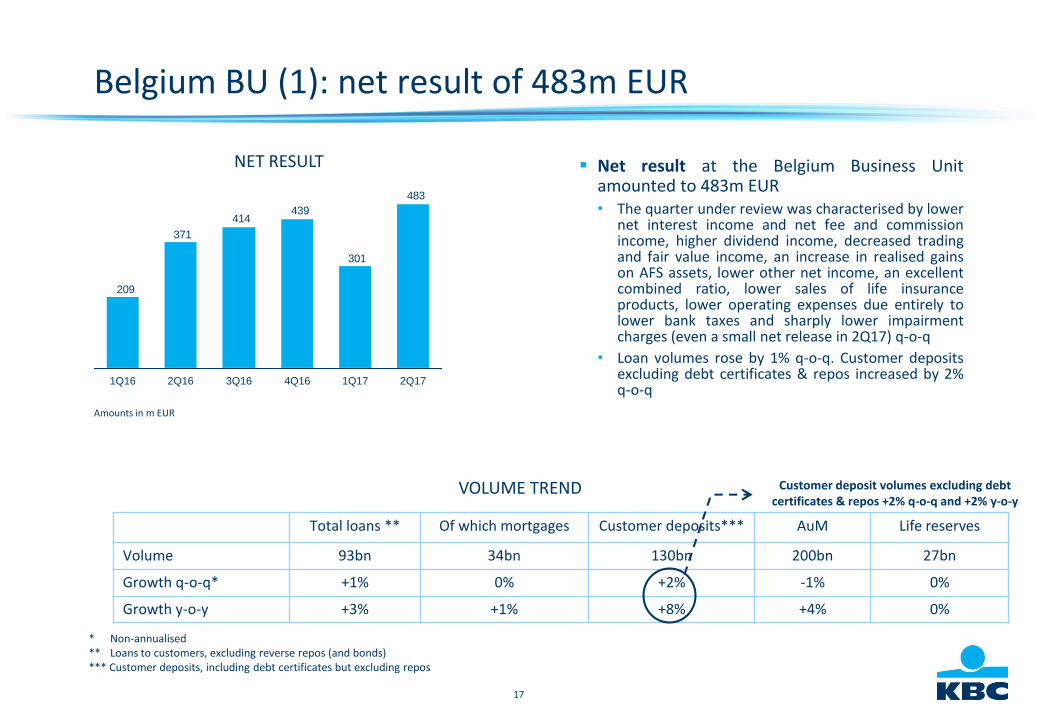
Belgium BU (1): net result of 483m EUR
Net result at the Belgium Business Unitamounted to 483m EUR• The quarter under review was characterised by lower
net interest income and net fee and commissionincome, higher dividend income, decreased tradingand fair value income, an increase in realised gainson AFS assets, lower other net income, an excellentcombined ratio, lower sales of life insuranceproducts, lower operating expenses due entirely tolower bank taxes and sharply lower impairmentcharges (even a small net release in 2Q17) q-o-q
• Loan volumes rose by 1% q-o-q. Customer depositsexcluding debt certificates & repos increased by 2%q-o-q
* Non-annualised ** Loans to customers, excluding reverse repos (and bonds)*** Customer deposits, including debt certificates but excluding repos
VOLUME TREND
Total loans ** Of which mortgages Customer deposits*** AuM Life reserves
Volume 93bn 34bn 130bn 200bn 27bn
Growth q-o-q* +1% 0% +2% -1% 0%
Growth y-o-y +3% +1% +8% +4% 0%
483
301
439414
371
209
2Q16 4Q163Q16 2Q171Q171Q16
NET RESULT
Amounts in m EUR
Customer deposit volumes excluding debtcertificates & repos +2% q-o-q and +2% y-o-y
18
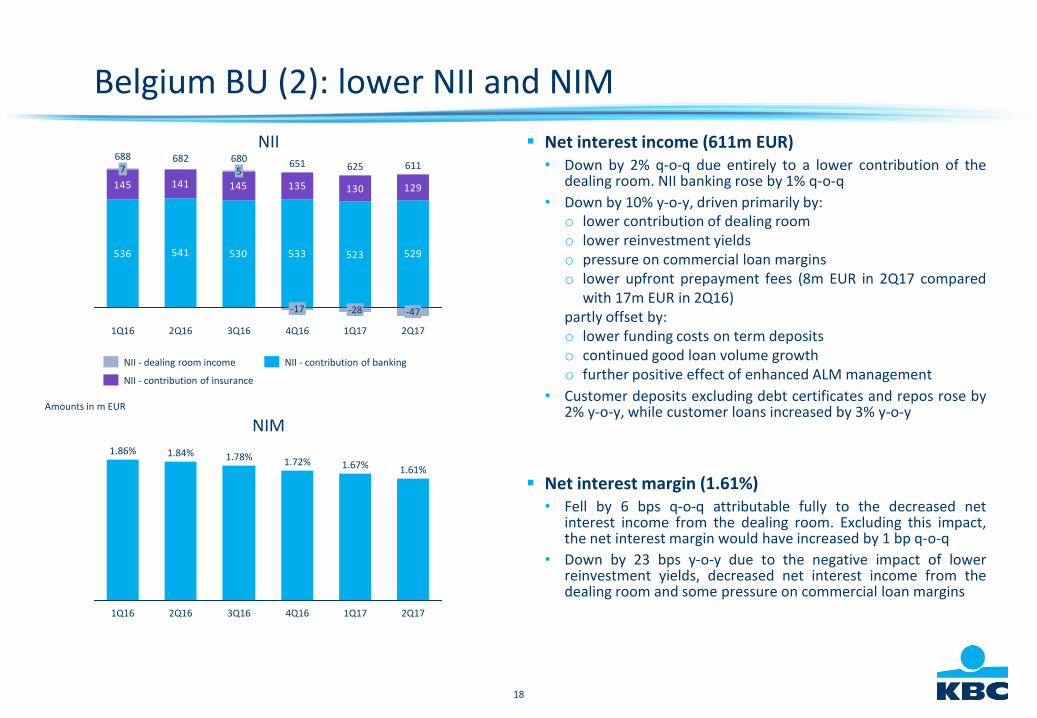
Belgium BU (2): lower NII and NIM
Net interest income (611m EUR)• Down by 2% q-o-q due entirely to a lower contribution of the
dealing room. NII banking rose by 1% q-o-q
• Down by 10% y-o-y, driven primarily by:o lower contribution of dealing roomo lower reinvestment yieldso pressure on commercial loan marginso lower upfront prepayment fees (8m EUR in 2Q17 compared
with 17m EUR in 2Q16)partly offset by:o lower funding costs on term depositso continued good loan volume growtho further positive effect of enhanced ALM management
• Customer deposits excluding debt certificates and repos rose by2% y-o-y, while customer loans increased by 3% y-o-y
Net interest margin (1.61%)• Fell by 6 bps q-o-q attributable fully to the decreased net
interest income from the dealing room. Excluding this impact,the net interest margin would have increased by 1 bp q-o-q
• Down by 23 bps y-o-y due to the negative impact of lowerreinvestment yields, decreased net interest income from thedealing room and some pressure on commercial loan margins
NIM
NII
Amounts in m EUR
536 541 530
145 141 145
533 523 529
129130135
2Q17
611
-47
1Q17
625
-28
4Q16
651
-17
3Q16
6805
2Q16
682
1Q16
6887
2Q17
1.61%
1Q17
1.67%
4Q16
1.72%
3Q16
1.78%
2Q16
1.84%
1Q16
1.86%
NII - contribution of banking
NII - contribution of insurance
NII - dealing room income
19
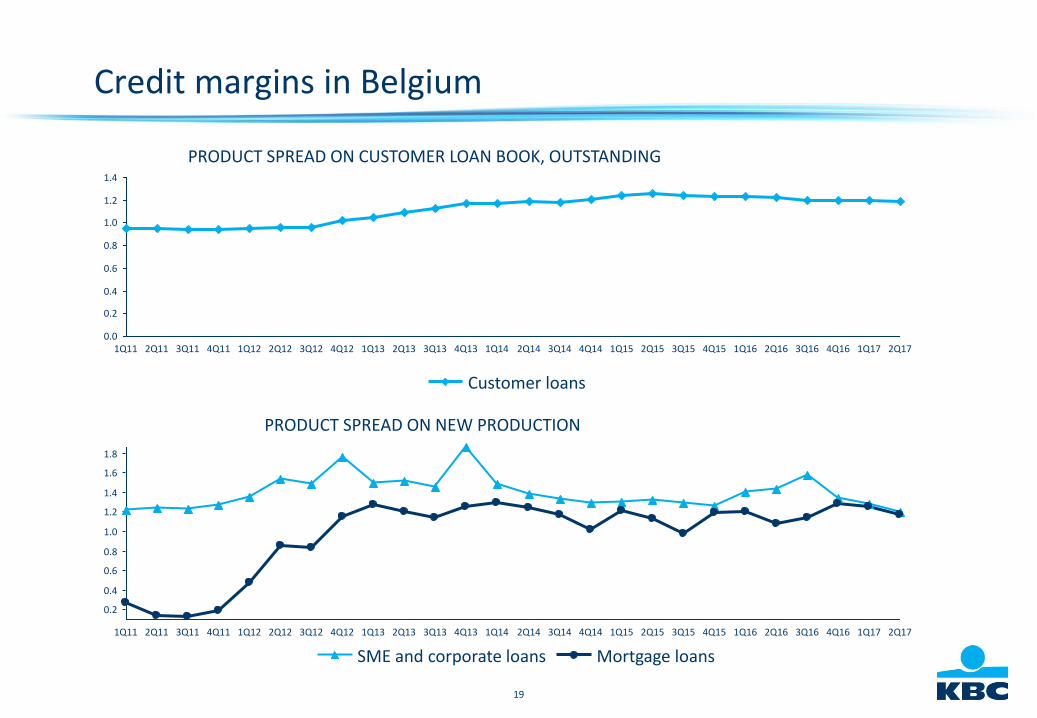
Credit margins in Belgium
PRODUCT SPREAD ON CUSTOMER LOAN BOOK, OUTSTANDING
PRODUCT SPREAD ON NEW PRODUCTION
1.4
1.2
1.0
0.8
0.6
0.4
0.2
0.02Q171Q174Q163Q162Q161Q164Q153Q152Q151Q154Q143Q142Q141Q144Q133Q132Q131Q134Q123Q122Q121Q124Q113Q112Q111Q11
Customer loans
1.0
1.2
1.8
1.4
0.6
0.2
0.8
0.4
1.6
4Q143Q142Q14 2Q16 2Q171Q174Q163Q161Q164Q153Q152Q151Q151Q144Q133Q132Q131Q134Q123Q122Q121Q124Q113Q112Q111Q11
SME and corporate loans Mortgage loans
20
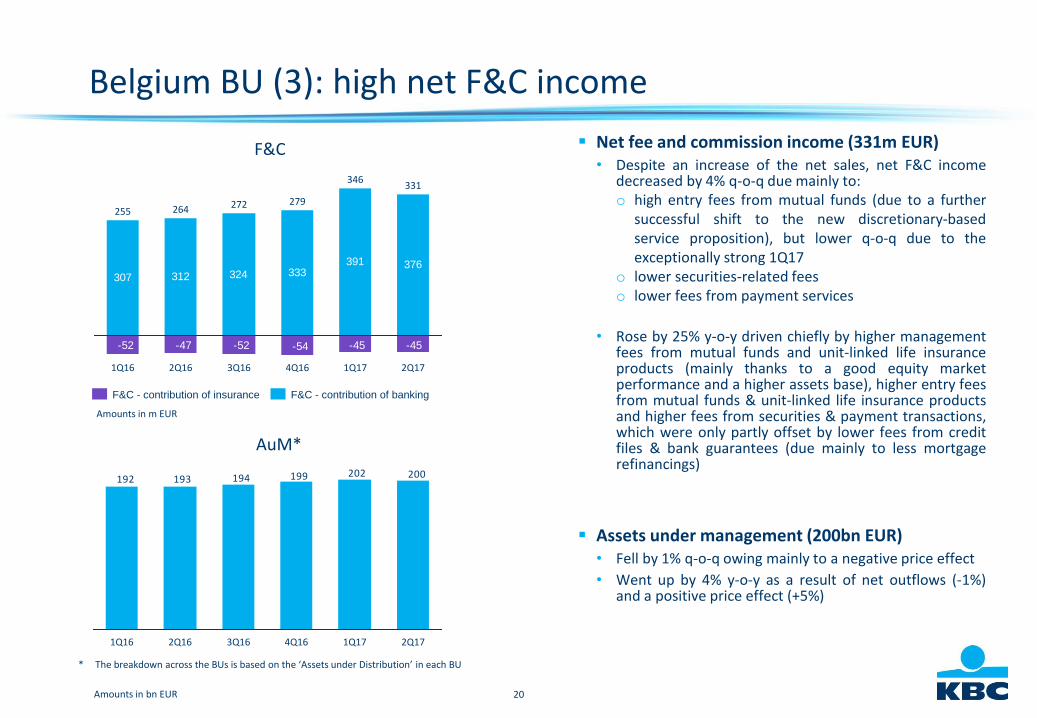
Belgium BU (3): high net F&C income
Net fee and commission income (331m EUR)• Despite an increase of the net sales, net F&C income
decreased by 4% q-o-q due mainly to:o high entry fees from mutual funds (due to a further
successful shift to the new discretionary-basedservice proposition), but lower q-o-q due to theexceptionally strong 1Q17
o lower securities-related feeso lower fees from payment services
• Rose by 25% y-o-y driven chiefly by higher managementfees from mutual funds and unit-linked life insuranceproducts (mainly thanks to a good equity marketperformance and a higher assets base), higher entry feesfrom mutual funds & unit-linked life insurance productsand higher fees from securities & payment transactions,which were only partly offset by lower fees from creditfiles & bank guarantees (due mainly to less mortgagerefinancings)
Assets under management (200bn EUR)• Fell by 1% q-o-q owing mainly to a negative price effect
• Went up by 4% y-o-y as a result of net outflows (-1%)and a positive price effect (+5%)
AuM*
F&C
Amounts in bn EUR
307 312 324 333391
-45-54-52-47-52 -45
376
2Q171Q17
346
4Q16
279
3Q16
272
2Q16
264
1Q16
255
331
200202199194193192
2Q171Q174Q163Q162Q161Q16
Amounts in m EUR
* The breakdown across the BUs is based on the ‘Assets under Distribution’ in each BU
F&C - contribution of bankingF&C - contribution of insurance
21
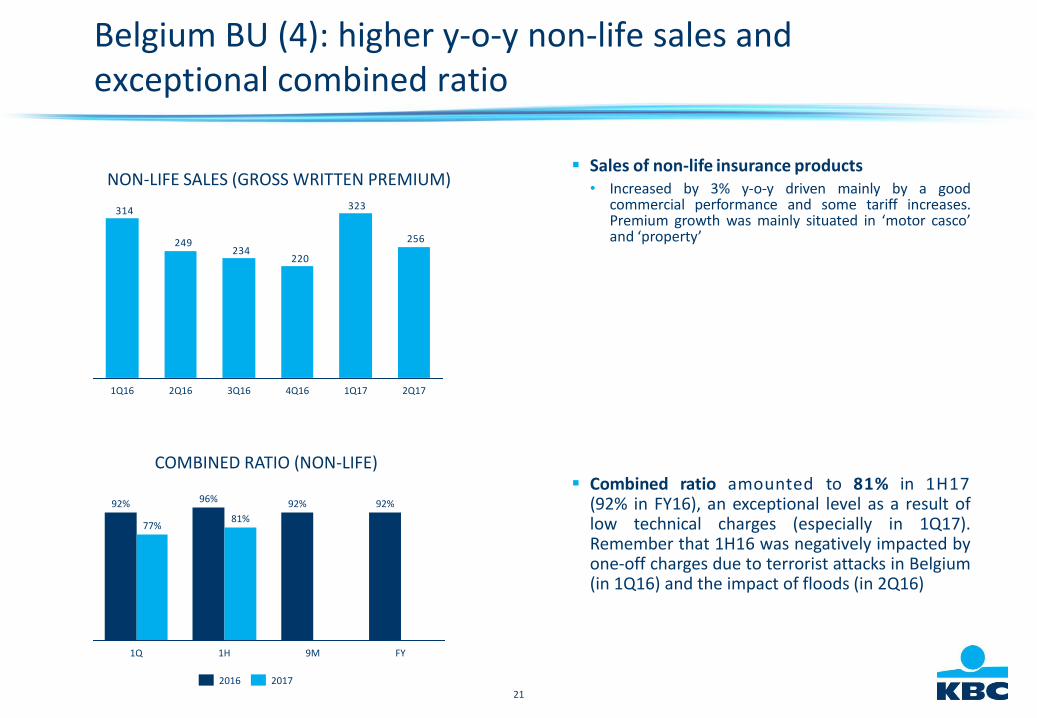
Sales of non-life insurance products• Increased by 3% y-o-y driven mainly by a good
commercial performance and some tariff increases.Premium growth was mainly situated in ‘motor casco’and ‘property’
Combined ratio amounted to 81% in 1H17(92% in FY16), an exceptional level as a result oflow technical charges (especially in 1Q17).Remember that 1H16 was negatively impacted byone-off charges due to terrorist attacks in Belgium(in 1Q16) and the impact of floods (in 2Q16)
Belgium BU (4): higher y-o-y non-life sales andexceptional combined ratio
COMBINED RATIO (NON-LIFE)
FY
92%
9M
92%
1H
96%
1Q
77%
92%
81%
20172016
NON-LIFE SALES (GROSS WRITTEN PREMIUM)
256
323
220234
249
314
2Q171Q174Q163Q162Q161Q16
22
Belgium BU (5): lower life sales, but good cross-sellingratios
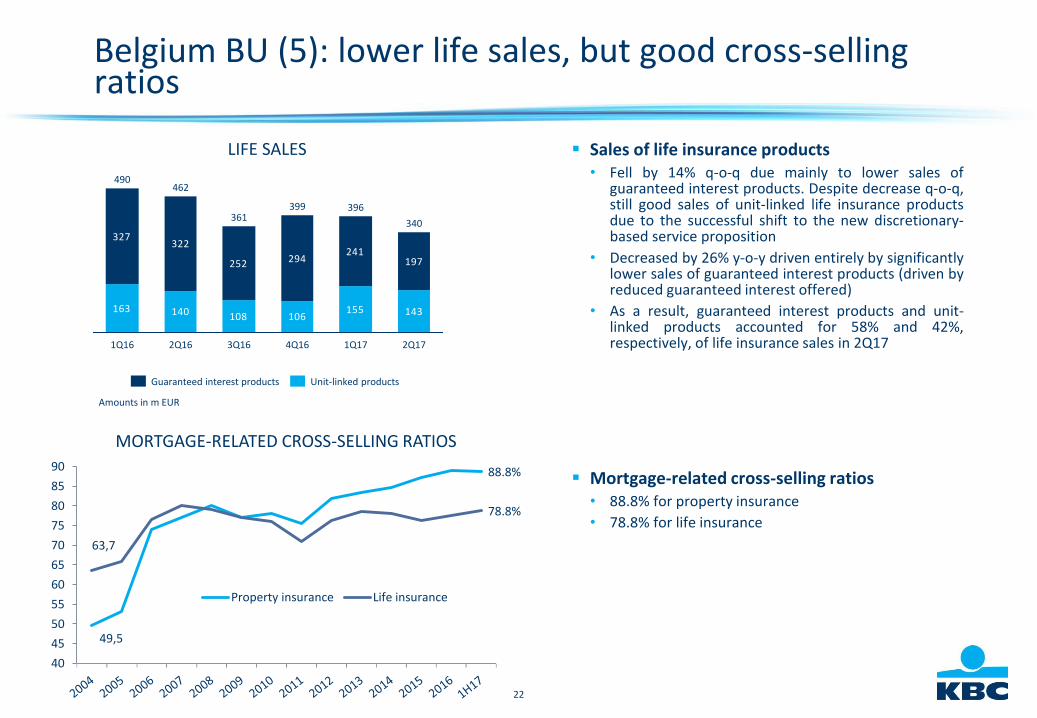
Sales of life insurance products• Fell by 14% q-o-q due mainly to lower sales of
guaranteed interest products. Despite decrease q-o-q,still good sales of unit-linked life insurance productsdue to the successful shift to the new discretionary-based service proposition
• Decreased by 26% y-o-y driven entirely by significantlylower sales of guaranteed interest products (driven byreduced guaranteed interest offered)
• As a result, guaranteed interest products and unit-linked products accounted for 58% and 42%,respectively, of life insurance sales in 2Q17
Mortgage-related cross-selling ratios• 88.8% for property insurance
• 78.8% for life insurance
LIFE SALES
Amounts in m EUR
163 140 108 106155
327322
252 294241
143
197
2Q171Q17
396
4Q16
399
3Q16
361
2Q16
462
1Q16
490
340
Unit-linked productsGuaranteed interest products
MORTGAGE-RELATED CROSS-SELLING RATIOS
49,5
88.8%
63,7
78.8%
40
45
50
55
60
65
70
75
80
85
90
Property insurance Life insurance
23
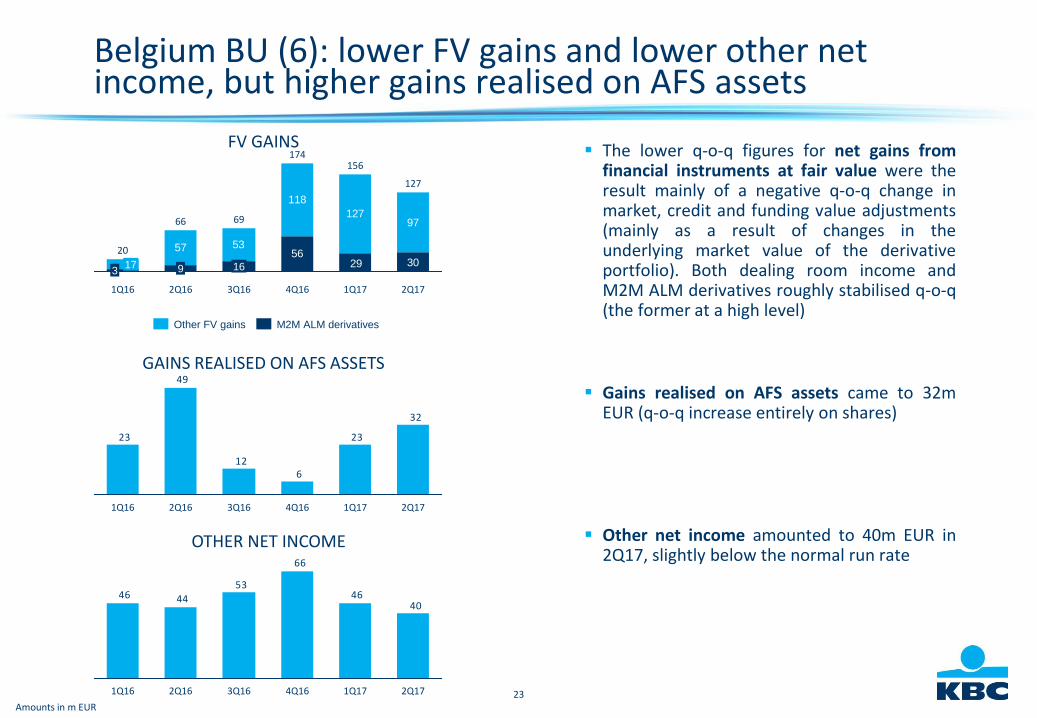
The lower q-o-q figures for net gains fromfinancial instruments at fair value were theresult mainly of a negative q-o-q change inmarket, credit and funding value adjustments(mainly as a result of changes in theunderlying market value of the derivativeportfolio). Both dealing room income andM2M ALM derivatives roughly stabilised q-o-q(the former at a high level)
Gains realised on AFS assets came to 32mEUR (q-o-q increase entirely on shares)
Other net income amounted to 40m EUR in2Q17, slightly below the normal run rate
FV GAINS
Amounts in m EUR
57 53
118
127
302956
97
1Q16
20
317
127
69
16
3Q162Q16
66
2Q171Q17
156
4Q16
174
9
32
23
612
49
23
2Q171Q174Q163Q162Q161Q16
GAINS REALISED ON AFS ASSETS
4046
66
53
4446
2Q171Q174Q163Q162Q161Q16
OTHER NET INCOME
Belgium BU (6): lower FV gains and lower other net income, but higher gains realised on AFS assets
M2M ALM derivativesOther FV gains
24
Belgium BU (7): lower operating expenses, net impairmentsreleases, good credit cost ratio
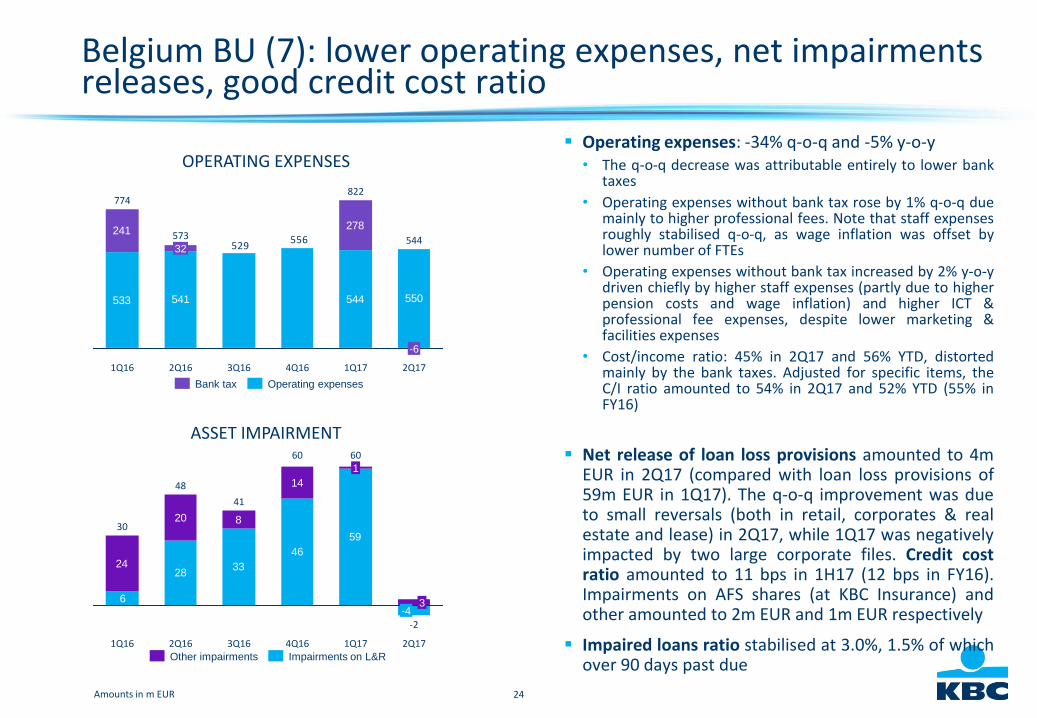
Operating expenses: -34% q-o-q and -5% y-o-y• The q-o-q decrease was attributable entirely to lower bank
taxes
• Operating expenses without bank tax rose by 1% q-o-q duemainly to higher professional fees. Note that staff expensesroughly stabilised q-o-q, as wage inflation was offset bylower number of FTEs
• Operating expenses without bank tax increased by 2% y-o-ydriven chiefly by higher staff expenses (partly due to higherpension costs and wage inflation) and higher ICT &professional fee expenses, despite lower marketing &facilities expenses
• Cost/income ratio: 45% in 2Q17 and 56% YTD, distortedmainly by the bank taxes. Adjusted for specific items, theC/I ratio amounted to 54% in 2Q17 and 52% YTD (55% inFY16)
Net release of loan loss provisions amounted to 4mEUR in 2Q17 (compared with loan loss provisions of59m EUR in 1Q17). The q-o-q improvement was dueto small reversals (both in retail, corporates & realestate and lease) in 2Q17, while 1Q17 was negativelyimpacted by two large corporate files. Credit costratio amounted to 11 bps in 1H17 (12 bps in FY16).Impairments on AFS shares (at KBC Insurance) andother amounted to 2m EUR and 1m EUR respectively
Impaired loans ratio stabilised at 3.0%, 1.5% of whichover 90 days past due
ASSET IMPAIRMENT
OPERATING EXPENSES
Amounts in m EUR
533 541 544
556529
550
278241
2Q171Q17
822
4Q163Q162Q16
57332
1Q16
774
-6
544
2833
46
59
24
20 8
14
6-4
2Q17
601
4Q16 1Q17
60
3Q16
41
2Q16
48
1Q16
30
3
-2
Operating expensesBank tax
Impairments on L&ROther impairments
25
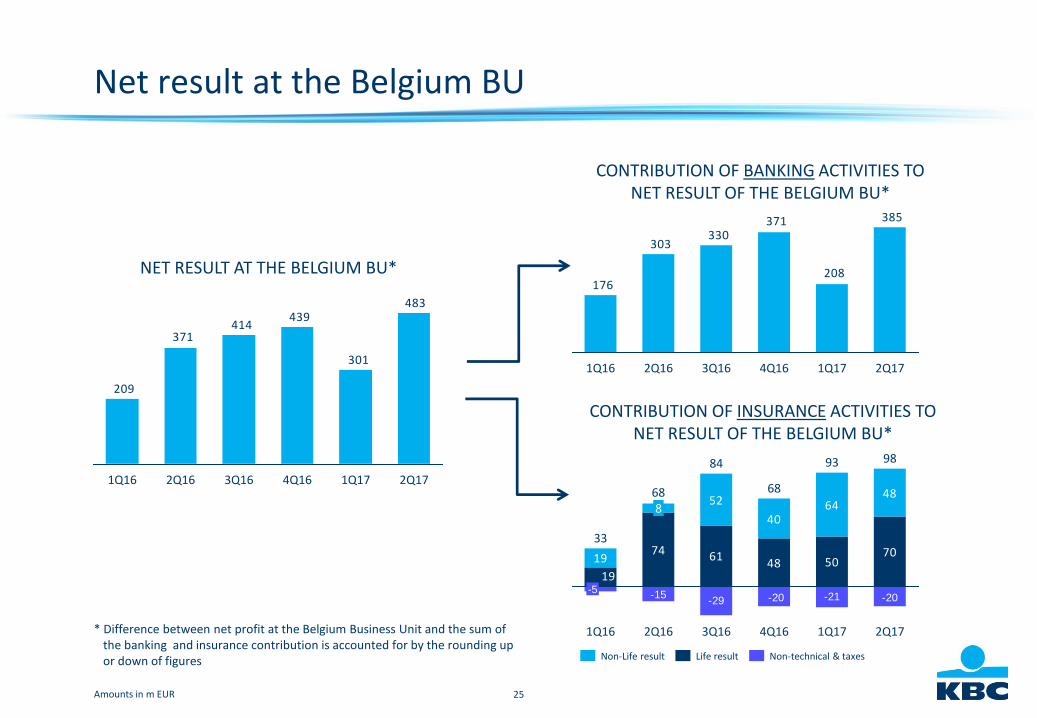
Net result at the Belgium BU
* Difference between net profit at the Belgium Business Unit and the sum of the banking and insurance contribution is accounted for by the rounding up or down of figures
CONTRIBUTION OF BANKING ACTIVITIES TO NET RESULT OF THE BELGIUM BU*
NET RESULT AT THE BELGIUM BU*
Amounts in m EUR
483
301
439414
371
209
2Q171Q174Q163Q162Q161Q16
385
208
371330
303
176
2Q171Q174Q163Q162Q161Q16
-29 -21
74 6148 5019
52
4064
48
-20-15 -20
19
70
98
2Q171Q17
93
4Q16
68
3Q16
84
2Q16
688
1Q16
33
-5
Non-technical & taxesNon-Life result Life result
CONTRIBUTION OF INSURANCE ACTIVITIES TO NET RESULT OF THE BELGIUM BU*
26
CZECH REPUBLIC BUSINESS UNIT
CFO SERVICES
CRO SERVICES
CORPORATE STAFF
BELGIUMCZECH
REPUBLICINTERNATIONAL
MARKETS
27
Czech Republic BU (1): net result of 183m EUR
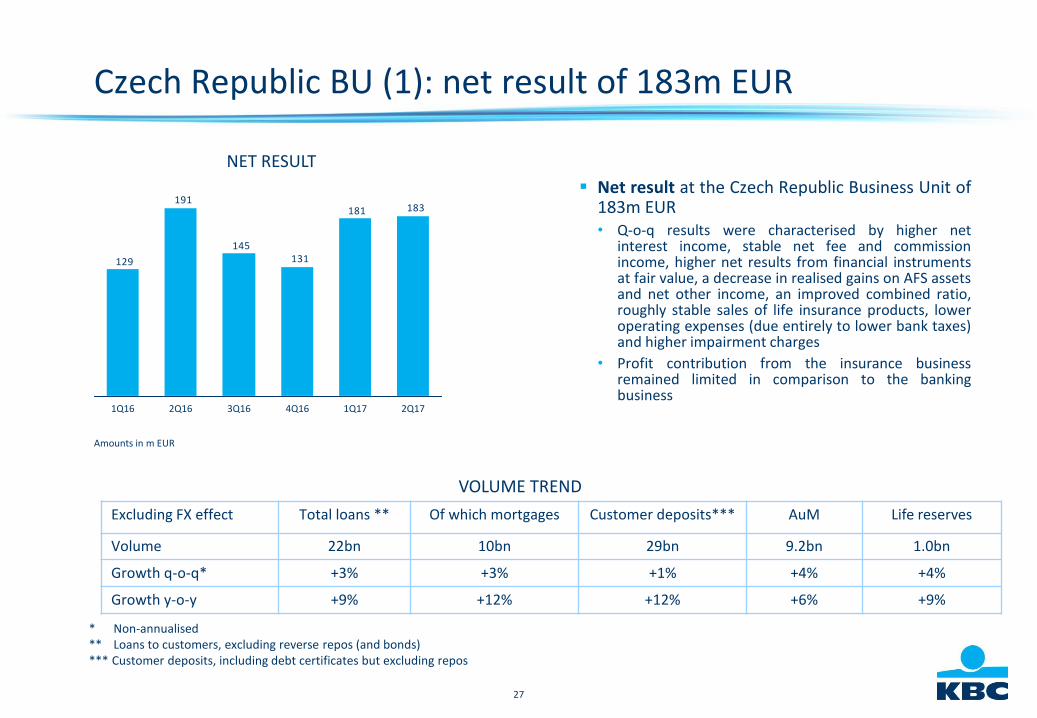
Net result at the Czech Republic Business Unit of183m EUR• Q-o-q results were characterised by higher net
interest income, stable net fee and commissionincome, higher net results from financial instrumentsat fair value, a decrease in realised gains on AFS assetsand net other income, an improved combined ratio,roughly stable sales of life insurance products, loweroperating expenses (due entirely to lower bank taxes)and higher impairment charges
• Profit contribution from the insurance businessremained limited in comparison to the bankingbusiness
* Non-annualised ** Loans to customers, excluding reverse repos (and bonds)*** Customer deposits, including debt certificates but excluding repos
VOLUME TREND
Excluding FX effect Total loans ** Of which mortgages Customer deposits*** AuM Life reserves
Volume 22bn 10bn 29bn 9.2bn 1.0bn
Growth q-o-q* +3% +3% +1% +4% +4%
Growth y-o-y +9% +12% +12% +6% +9%
NET RESULT
Amounts in m EUR
183181
131145
191
129
2Q171Q174Q163Q162Q161Q16
28
Czech Republic BU (2): higher NII, but lower NIM
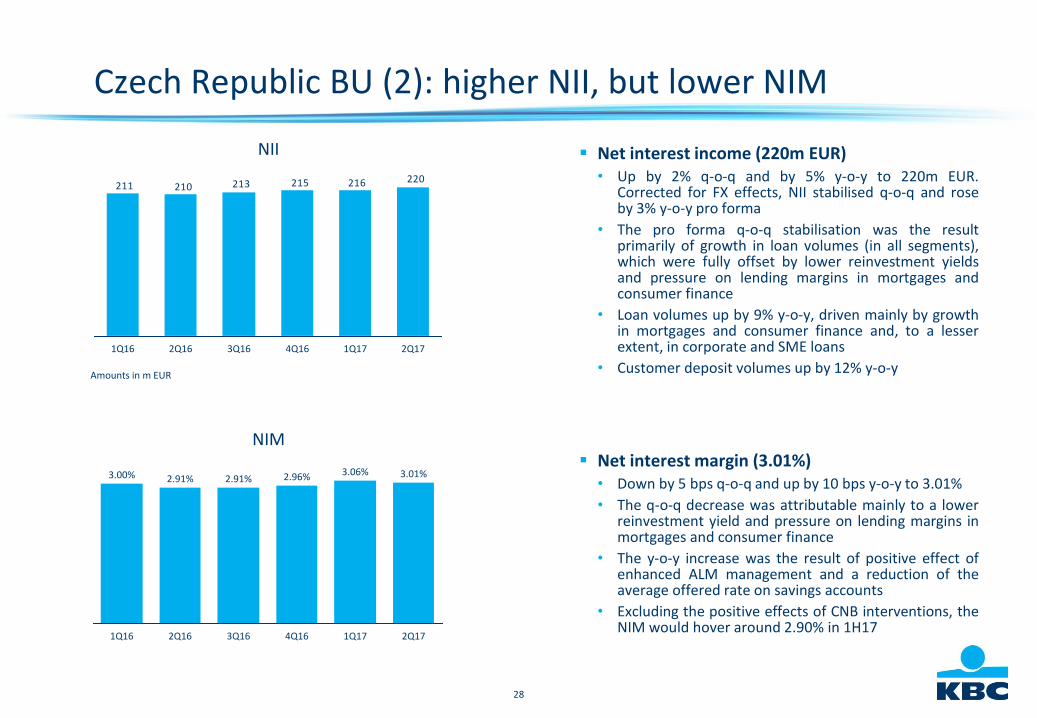
Net interest income (220m EUR)• Up by 2% q-o-q and by 5% y-o-y to 220m EUR.
Corrected for FX effects, NII stabilised q-o-q and roseby 3% y-o-y pro forma
• The pro forma q-o-q stabilisation was the resultprimarily of growth in loan volumes (in all segments),which were fully offset by lower reinvestment yieldsand pressure on lending margins in mortgages andconsumer finance
• Loan volumes up by 9% y-o-y, driven mainly by growthin mortgages and consumer finance and, to a lesserextent, in corporate and SME loans
• Customer deposit volumes up by 12% y-o-y
Net interest margin (3.01%)• Down by 5 bps q-o-q and up by 10 bps y-o-y to 3.01%
• The q-o-q decrease was attributable mainly to a lowerreinvestment yield and pressure on lending margins inmortgages and consumer finance
• The y-o-y increase was the result of positive effect ofenhanced ALM management and a reduction of theaverage offered rate on savings accounts
• Excluding the positive effects of CNB interventions, theNIM would hover around 2.90% in 1H17
NIM
NII
Amounts in m EUR
220216215213210211
4Q163Q162Q161Q16 2Q171Q17
3.01%
2Q171Q17
3.06%
4Q16
2.96%
3Q16
2.91%
2Q16
2.91%
1Q16
3.00%

29
Czech Republic BU (3): stable net F&C income
Net fee and commission income (47m EUR)• Stabilised q-o-q and down by 3% y-o-y (or -1% q-o-q
and -5% y-o-y pro forma, adjusted to take account ofFX effect)
• The q-o-q stabilisation was mainly the result of higherentry fees and higher fees from payment services,offset by lower securities-related fees
• The y-o-y decrease was attributable chiefly to lowerfees from payment services and lower securities-related fees, partly offset by higher management &entry fees and higher fees from credit files & bankguarantees
Assets under management (9.2bn EUR)• Increased by 4.5% q-o-q owing to net inflows (+1.6%)
and a positive price effect (+2.9%)
• Y-o-y, assets under management rose by 6.5%, drivenby net inflows (+3.5%) and a positive price effect(+2.9%)
AuM*
F&C
Amounts in bn EUR
Amounts in m EUR
474750
4649
46
2Q171Q174Q163Q162Q161Q16
8.6
4Q16
8.8
2Q16 1Q17
8.5
3Q16 2Q17
8.6
1Q16
8.79.2
* The breakdown across the BUs is based on the ‘Assets under Distribution’ in each BU
30
Czech Republic BU (4): higher premium income,combined ratio impacted by several large claims
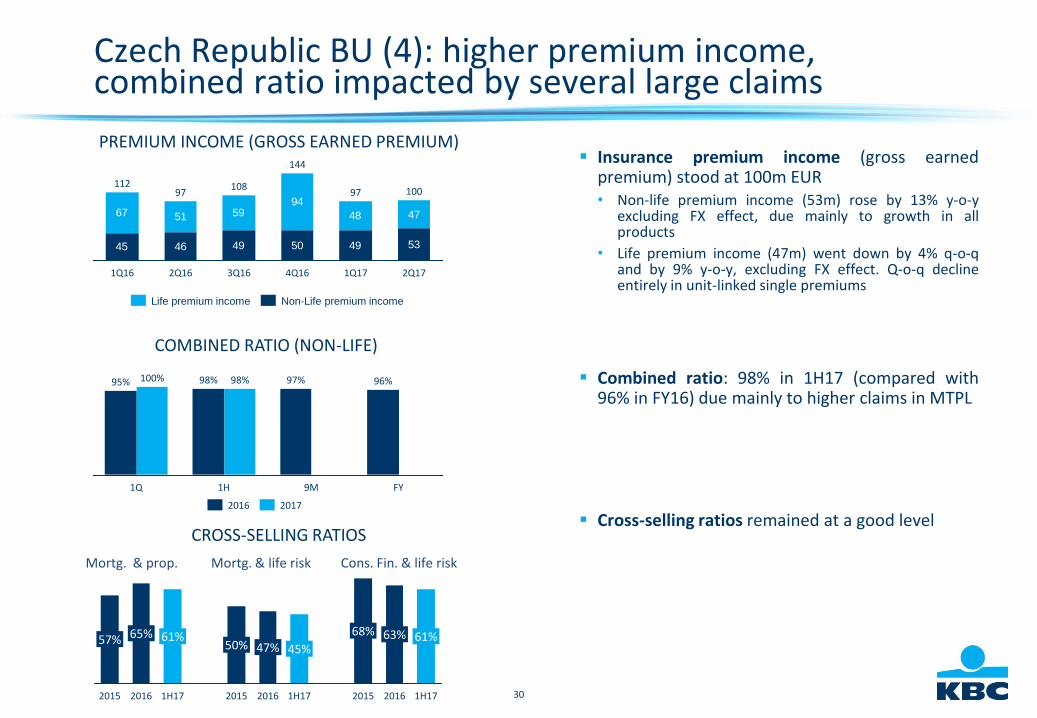
Insurance premium income (gross earnedpremium) stood at 100m EUR• Non-life premium income (53m) rose by 13% y-o-y
excluding FX effect, due mainly to growth in allproducts
• Life premium income (47m) went down by 4% q-o-qand by 9% y-o-y, excluding FX effect. Q-o-q declineentirely in unit-linked single premiums
Combined ratio: 98% in 1H17 (compared with96% in FY16) due mainly to higher claims in MTPL
Cross-selling ratios remained at a good level
COMBINED RATIO (NON-LIFE)
PREMIUM INCOME (GROSS EARNED PREMIUM)
45 46 49 50 49
67 51 5994
48
53
47
3Q16
108
2Q16
97
1Q16 1Q17
97112
4Q16
144
2Q17
100
98%
1H
98%
1Q
100%
FY
96%
9M
97%95%
20172016
Non-Life premium incomeLife premium income
CROSS-SELLING RATIOS
Mortg. & prop. Mortg. & life risk Cons. Fin. & life risk
47%
2015
50%
1H17
61%
2016
63%
2015
68%
1H17
45%
2016 1H17
61%
2016
65%
2015
57%
31
Czech Republic BU (5): lower operating expenses, still low impairments, excellent credit cost ratio
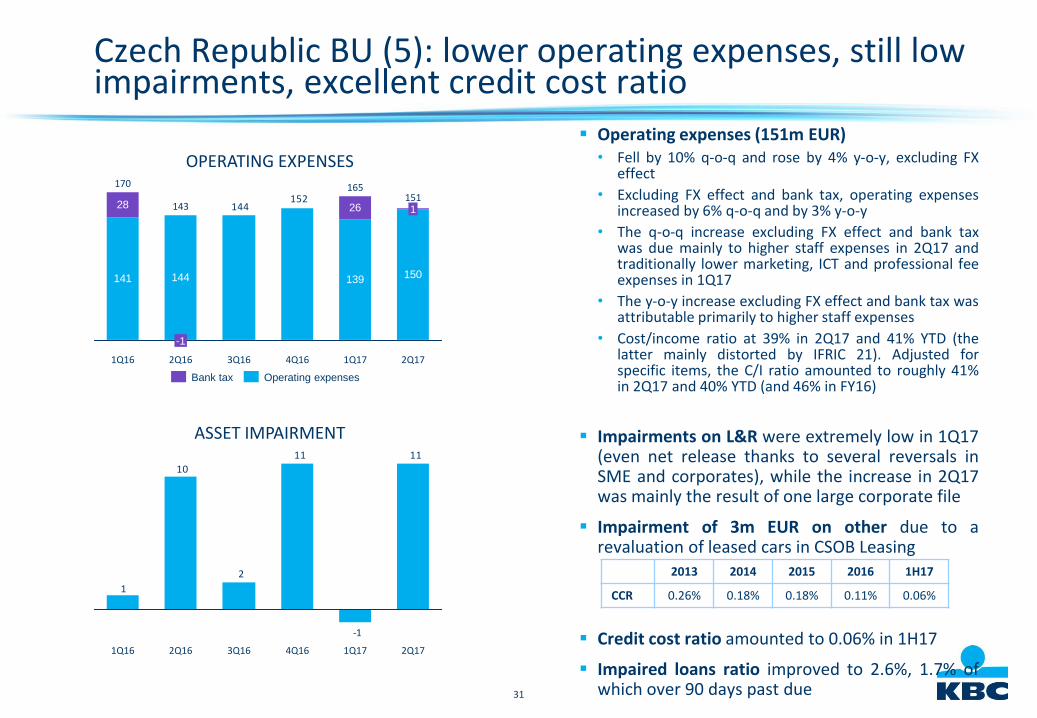
Operating expenses (151m EUR)• Fell by 10% q-o-q and rose by 4% y-o-y, excluding FX
effect
• Excluding FX effect and bank tax, operating expensesincreased by 6% q-o-q and by 3% y-o-y
• The q-o-q increase excluding FX effect and bank taxwas due mainly to higher staff expenses in 2Q17 andtraditionally lower marketing, ICT and professional feeexpenses in 1Q17
• The y-o-y increase excluding FX effect and bank tax wasattributable primarily to higher staff expenses
• Cost/income ratio at 39% in 2Q17 and 41% YTD (thelatter mainly distorted by IFRIC 21). Adjusted forspecific items, the C/I ratio amounted to roughly 41%in 2Q17 and 40% YTD (and 46% in FY16)
Impairments on L&R were extremely low in 1Q17(even net release thanks to several reversals inSME and corporates), while the increase in 2Q17was mainly the result of one large corporate file
Impairment of 3m EUR on other due to arevaluation of leased cars in CSOB Leasing
Credit cost ratio amounted to 0.06% in 1H17
Impaired loans ratio improved to 2.6%, 1.7% ofwhich over 90 days past due
ASSET IMPAIRMENT
OPERATING EXPENSES
141 139 150
28
144
26152
144
2Q17
151
1Q17
165
4Q163Q162Q16
143
-1
1Q16
170
1
11
-1
11
2
10
1
1Q16 2Q171Q174Q163Q162Q16
2013 2014 2015 2016 1H17
CCR 0.26% 0.18% 0.18% 0.11% 0.06%
Operating expensesBank tax
32
INTERNATIONAL MARKETS BUSINESS UNIT
CFO SERVICES
CRO SERVICES
CORPORATE STAFF
BELGIUMCZECH
REPUBLICINTERNATIONAL
MARKETS
33
Acquisition of UBB/Interlease was closed mid-June 2017
On 13 June 2017, KBC completed the acquisition of UBB & Interlease after approval by the relevantregulatory authorities and received anti-trust approval (final total consideration is 609m EUR fullypaid in cash)
This transaction substantially strengthens KBC’s position in Bulgaria. Together, UBB-CIBANK and DZI willbecome the reference in bank-insurance in Bulgaria, one of KBC’s core markets. Following this acquisition, KBCwill also become active in leasing, asset management and factoring in Bulgaria, offering its clients now a fullrange of financial services
The operational integration of the business entities will be gradually introduced in the coming 18 months. KBCenvisages substantial value creation for shareholders through income and cost synergies
The consolidated figures in these condensed interim financial statements include the impact of this announcedacquisition as of 30 June 2017:• KBC recorded a provisional goodwill in its consolidated financial statements of 107m EUR at 30 June 2017,
taking into account specific negative fair value adjustments amounting to 81m EUR after tax which KBCidentified during the due diligence process
• The impact of this acquisition on the financial assets and liabilities by product is shown in note 4.1 of the2Q17 quarterly report
• There is no impact yet on the P&L (only from 3Q17 onwards)• The transaction had a very limited impact of -0.50% on KBC’s fully loaded CET1 ratio based on the Danish
Compromise
34
International Markets BU (1): net result of 177m EUR
* Non-annualised ** Loans to customers, excluding reverse repos (and bonds)*** Customer deposits, including debt certificates but excluding repos
VOLUME TREND
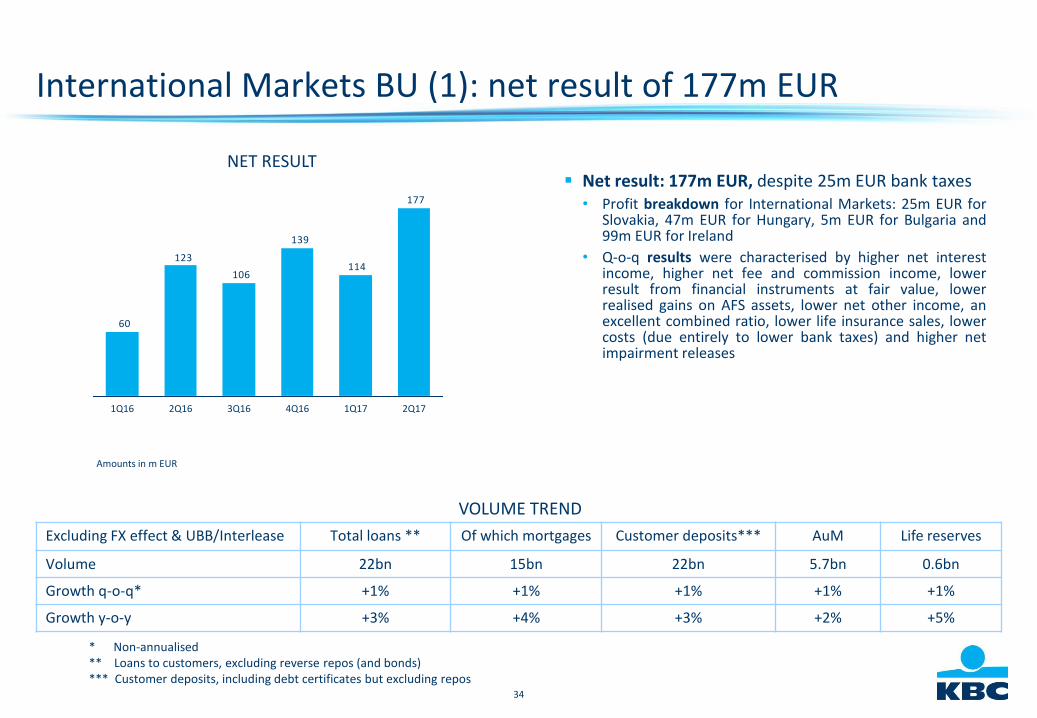
Excluding FX effect & UBB/Interlease Total loans ** Of which mortgages Customer deposits*** AuM Life reserves
Volume 22bn 15bn 22bn 5.7bn 0.6bn
Growth q-o-q* +1% +1% +1% +1% +1%
Growth y-o-y +3% +4% +3% +2% +5%
NET RESULT
Amounts in m EUR
177
114
139
106
123
60
3Q162Q161Q16 1Q174Q16 2Q17
Net result: 177m EUR, despite 25m EUR bank taxes• Profit breakdown for International Markets: 25m EUR for
Slovakia, 47m EUR for Hungary, 5m EUR for Bulgaria and99m EUR for Ireland
• Q-o-q results were characterised by higher net interestincome, higher net fee and commission income, lowerresult from financial instruments at fair value, lowerrealised gains on AFS assets, lower net other income, anexcellent combined ratio, lower life insurance sales, lowercosts (due entirely to lower bank taxes) and higher netimpairment releases
35
International Markets BU (2): organic growth
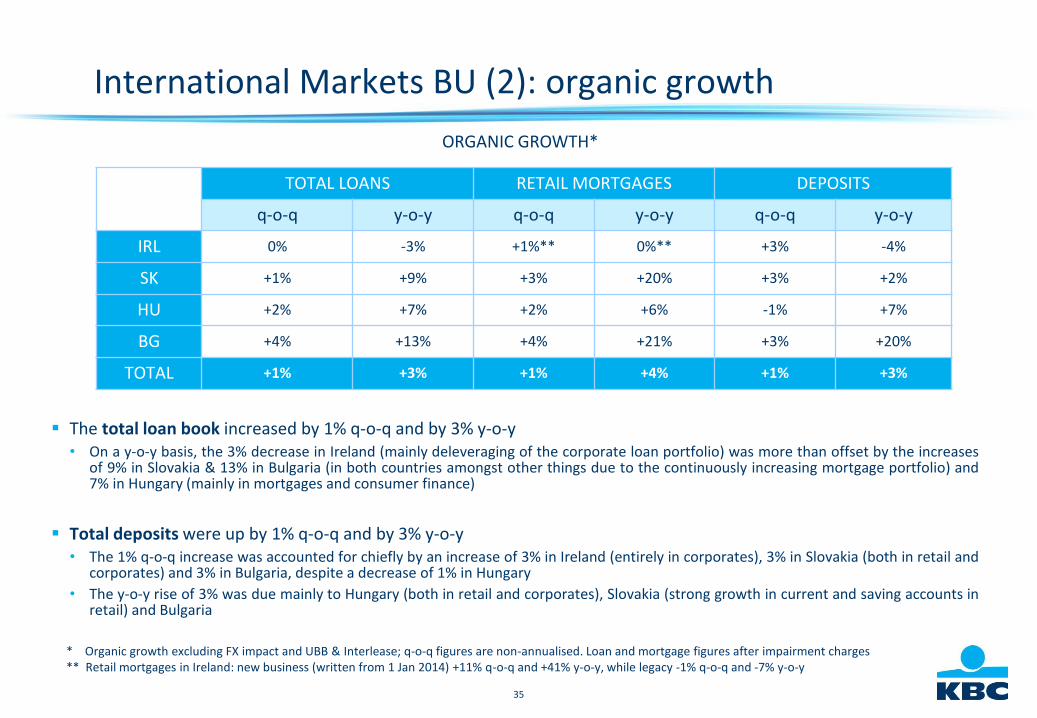
The total loan book increased by 1% q-o-q and by 3% y-o-y• On a y-o-y basis, the 3% decrease in Ireland (mainly deleveraging of the corporate loan portfolio) was more than offset by the increases
of 9% in Slovakia & 13% in Bulgaria (in both countries amongst other things due to the continuously increasing mortgage portfolio) and7% in Hungary (mainly in mortgages and consumer finance)
Total deposits were up by 1% q-o-q and by 3% y-o-y• The 1% q-o-q increase was accounted for chiefly by an increase of 3% in Ireland (entirely in corporates), 3% in Slovakia (both in retail and
corporates) and 3% in Bulgaria, despite a decrease of 1% in Hungary
• The y-o-y rise of 3% was due mainly to Hungary (both in retail and corporates), Slovakia (strong growth in current and saving accounts inretail) and Bulgaria
* Organic growth excluding FX impact and UBB & Interlease; q-o-q figures are non-annualised. Loan and mortgage figures after impairment charges** Retail mortgages in Ireland: new business (written from 1 Jan 2014) +11% q-o-q and +41% y-o-y, while legacy -1% q-o-q and -7% y-o-y
ORGANIC GROWTH*
TOTAL LOANS RETAIL MORTGAGES DEPOSITS
q-o-q y-o-y q-o-q y-o-y q-o-q y-o-y
IRL 0% -3% +1%** 0%** +3% -4%
SK +1% +9% +3% +20% +3% +2%
HU +2% +7% +2% +6% -1% +7%
BG +4% +13% +4% +21% +3% +20%
TOTAL +1% +3% +1% +4% +1% +3%

36
International Markets BU (3): higher NII and NIM
Net interest income (194m EUR)• Rose by 3% q-o-q and by 8% y-o-y
• The q-o-q increase was driven entirely by:o Ireland due to lower funding costs and lower hedging
costso Hungary due to higher margins on lending and
current accounts
• The y-o-y rise was attributable entirely to:o Ireland due to lower allocated liquidity and funding
costso Hungary due mainly to higher lending volumes
Net interest margin (2.72%)• Up by 5 bps q-o-q and by 24 bps y-o-y
• The q-o-q increase was driven mainly by Hungary (higherlending margins both in retail, SME & corporates) andIreland (lower funding costs and lower hedging costs)
• The y-o-y increase was accounted for mainly by Ireland(lower allocated liquidity and funding costs)
NIM
NII
Amounts in m EUR
194189198
184179178
2Q171Q174Q163Q162Q161Q16
2Q171Q17
2.67%
4Q16
2.70%
3Q16
2.52%
2Q16
2.48%
1Q16
2.47%
2.72%
37
International Markets BU (4): higher net F&C income
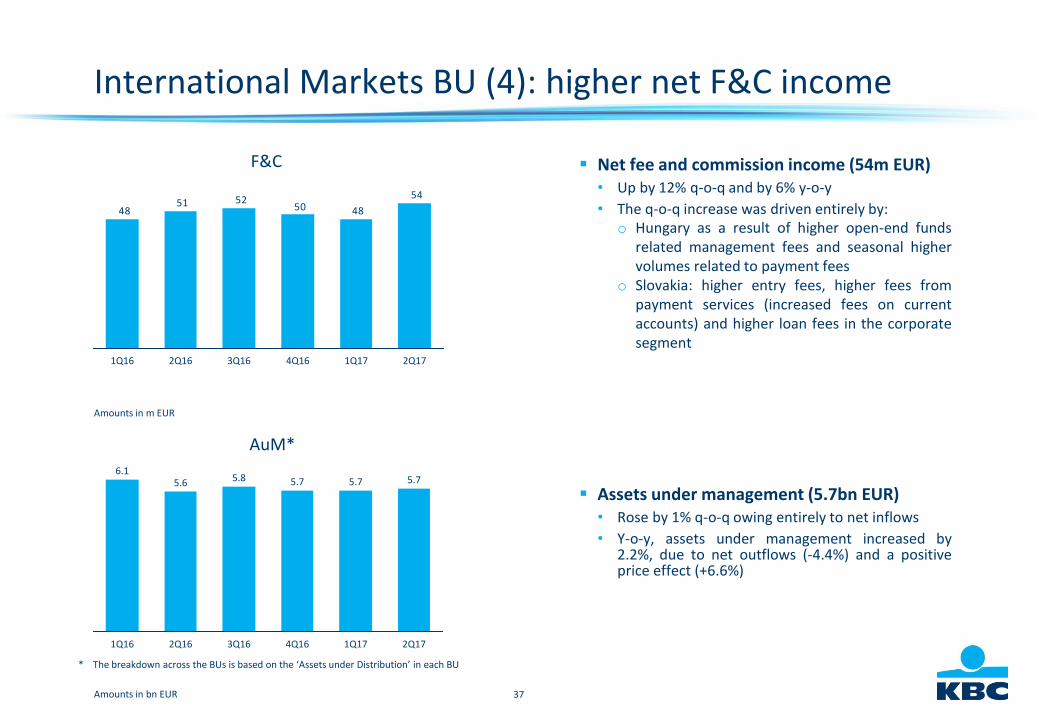
Net fee and commission income (54m EUR)• Up by 12% q-o-q and by 6% y-o-y
• The q-o-q increase was driven entirely by:o Hungary as a result of higher open-end funds
related management fees and seasonal highervolumes related to payment fees
o Slovakia: higher entry fees, higher fees frompayment services (increased fees on currentaccounts) and higher loan fees in the corporatesegment
Assets under management (5.7bn EUR)• Rose by 1% q-o-q owing entirely to net inflows
• Y-o-y, assets under management increased by2.2%, due to net outflows (-4.4%) and a positiveprice effect (+6.6%)
AuM*
F&C
Amounts in bn EUR
Amounts in m EUR
54
48505251
48
2Q171Q174Q163Q162Q161Q16
5.7
1Q17 2Q17
5.7
4Q16
5.7
3Q16
5.8
2Q16
5.6
1Q16
6.1
* The breakdown across the BUs is based on the ‘Assets under Distribution’ in each BU
38
International Markets BU (5): higher premium incomeand excellent combined ratio
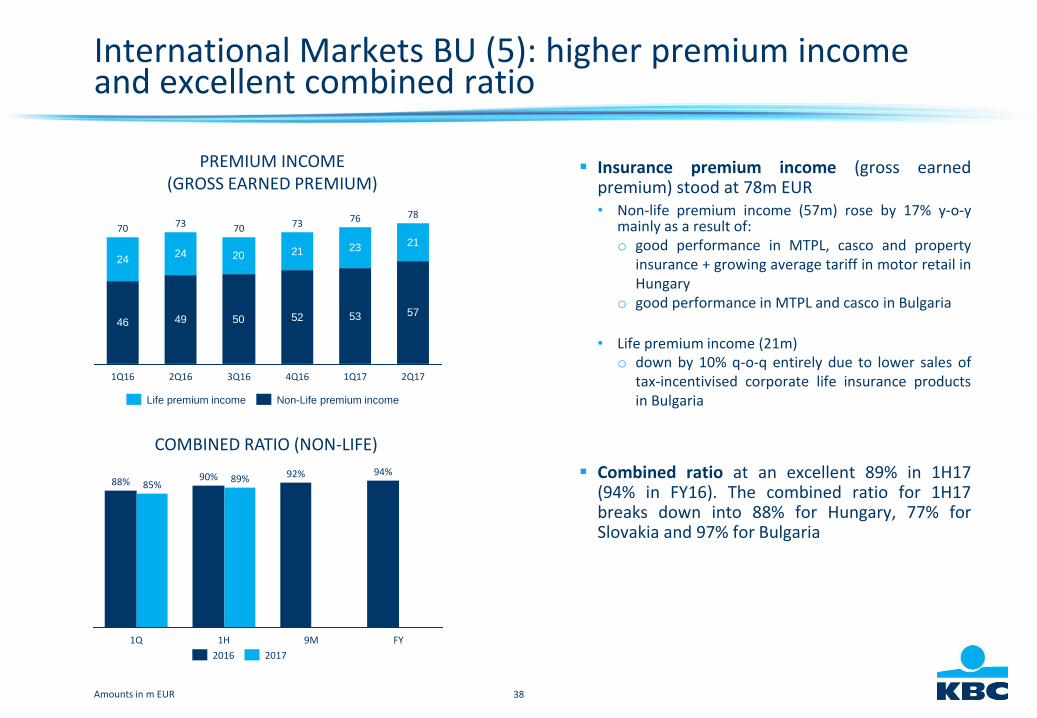
Insurance premium income (gross earnedpremium) stood at 78m EUR• Non-life premium income (57m) rose by 17% y-o-y
mainly as a result of:o good performance in MTPL, casco and property
insurance + growing average tariff in motor retail inHungary
o good performance in MTPL and casco in Bulgaria
• Life premium income (21m)o down by 10% q-o-q entirely due to lower sales of
tax-incentivised corporate life insurance productsin Bulgaria
Combined ratio at an excellent 89% in 1H17(94% in FY16). The combined ratio for 1H17breaks down into 88% for Hungary, 77% forSlovakia and 97% for Bulgaria
COMBINED RATIO (NON-LIFE)
PREMIUM INCOME(GROSS EARNED PREMIUM)
Amounts in m EUR
46 49 50 52 53
2424 20 21 23
57
21
2Q17
78
1Q17
76
4Q16
73
3Q16
70
2Q16
73
1Q16
70
89%
FY
94%
9M
92%
1H
90%
1Q
85%88%
20172016
Non-Life premium incomeLife premium income
39
International Markets BU (6): lower operating expenses, impairment releases, excellent credit cost ratio
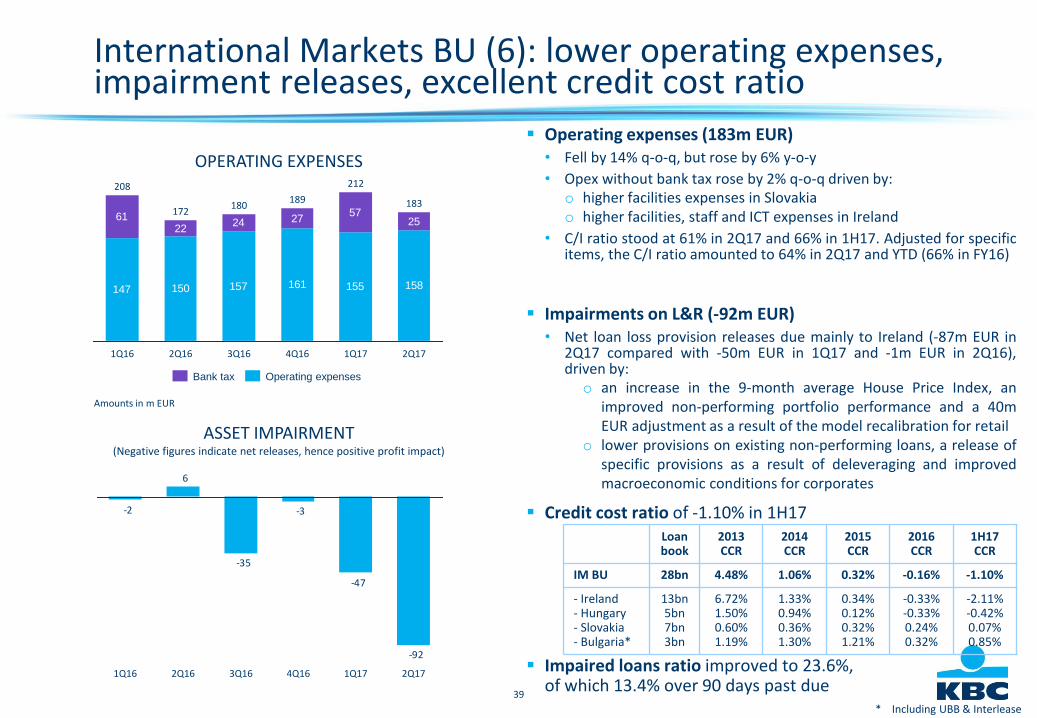
Operating expenses (183m EUR)• Fell by 14% q-o-q, but rose by 6% y-o-y
• Opex without bank tax rose by 2% q-o-q driven by:o higher facilities expenses in Slovakiao higher facilities, staff and ICT expenses in Ireland
• C/I ratio stood at 61% in 2Q17 and 66% in 1H17. Adjusted for specificitems, the C/I ratio amounted to 64% in 2Q17 and YTD (66% in FY16)
Impairments on L&R (-92m EUR)• Net loan loss provision releases due mainly to Ireland (-87m EUR in
2Q17 compared with -50m EUR in 1Q17 and -1m EUR in 2Q16),driven by:o an increase in the 9-month average House Price Index, an
improved non-performing portfolio performance and a 40mEUR adjustment as a result of the model recalibration for retail
o lower provisions on existing non-performing loans, a release ofspecific provisions as a result of deleveraging and improvedmacroeconomic conditions for corporates
Credit cost ratio of -1.10% in 1H17
Impaired loans ratio improved to 23.6%, of which 13.4% over 90 days past due
ASSET IMPAIRMENT(Negative figures indicate net releases, hence positive profit impact)
OPERATING EXPENSES
Amounts in m EUR
147 150 157 161 155
6122
24 2757
158
25
2Q171Q17
212
4Q16
189
3Q16
180
2Q16
172
1Q16
208
183
-92
-47
-3
-35
6
-2
1Q171Q16 2Q16 4Q163Q16 2Q17
Loan book
2013CCR
2014CCR
2015CCR
2016CCR
1H17CCR
IM BU 28bn 4.48% 1.06% 0.32% -0.16% -1.10%
- Ireland- Hungary- Slovakia- Bulgaria*
13bn5bn7bn3bn
6.72%1.50%0.60%1.19%
1.33%0.94%0.36%1.30%
0.34%0.12%0.32%1.21%
-0.33%-0.33%0.24%0.32%
-2.11%-0.42%0.07%0.85%
Operating expensesBank tax
* Including UBB & Interlease
40
GROUP CENTRE
CFO SERVICES
CRO SERVICES
CORPORATE STAFF
BELGIUMCZECH
REPUBLICINTERNATIONAL
MARKETS
41
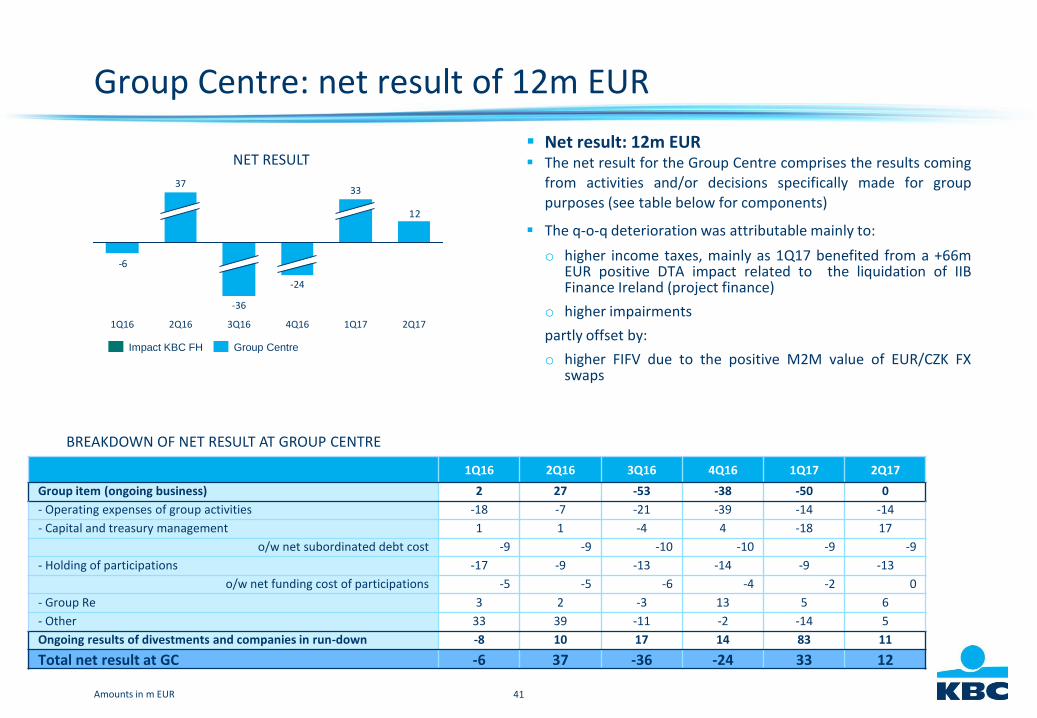
Group Centre: net result of 12m EUR
Net result: 12m EUR The net result for the Group Centre comprises the results coming
from activities and/or decisions specifically made for grouppurposes (see table below for components)
The q-o-q deterioration was attributable mainly to:
o higher income taxes, mainly as 1Q17 benefited from a +66mEUR positive DTA impact related to the liquidation of IIBFinance Ireland (project finance)
o higher impairments
partly offset by:
o higher FIFV due to the positive M2M value of EUR/CZK FXswaps
NET RESULT
Amounts in m EUR
12
-6
2Q171Q17
33
4Q16
-24
3Q16
-36
2Q16
37
1Q16
BREAKDOWN OF NET RESULT AT GROUP CENTRE
1Q16 2Q16 3Q16 4Q16 1Q17 2Q17
Group item (ongoing business) 2 27 -53 -38 -50 0
- Operating expenses of group activities -18 -7 -21 -39 -14 -14
- Capital and treasury management 1 1 -4 4 -18 17
o/w net subordinated debt cost -9 -9 -10 -10 -9 -9
- Holding of participations -17 -9 -13 -14 -9 -13
o/w net funding cost of participations -5 -5 -6 -4 -2 0
- Group Re 3 2 -3 13 5 6
- Other 33 39 -11 -2 -14 5
Ongoing results of divestments and companies in run-down -8 10 17 14 83 11
Total net result at GC -6 37 -36 -24 33 12
Group CentreImpact KBC FH

42
NET PROFIT – BELGIUM NET PROFIT – CZECH REPUBLIC
730 803 703858
579
630767
812706
853785
2016
1,432
2015
1,564
2014 1H17
1,515
2013
1,570
2012
1,360
1H17 ROAC: 26%
Amounts in m EUR
317 279 277 271 320
264275 251 271
276364
2012
581
1H172016
596
2015
542
2014
528
2013
554
1H17 ROAC: 47%
NET PROFIT – INTERNATIONAL MARKETS
-743
-203-204
-110
153
245
183
292
21
1H17
428
20162015
92
245
2013 2014
-182
-853
2012
-260
-56
1H17 ROAC: 30%
Overview of results based on business units
1H2H 2H 1H
2H 1H
43
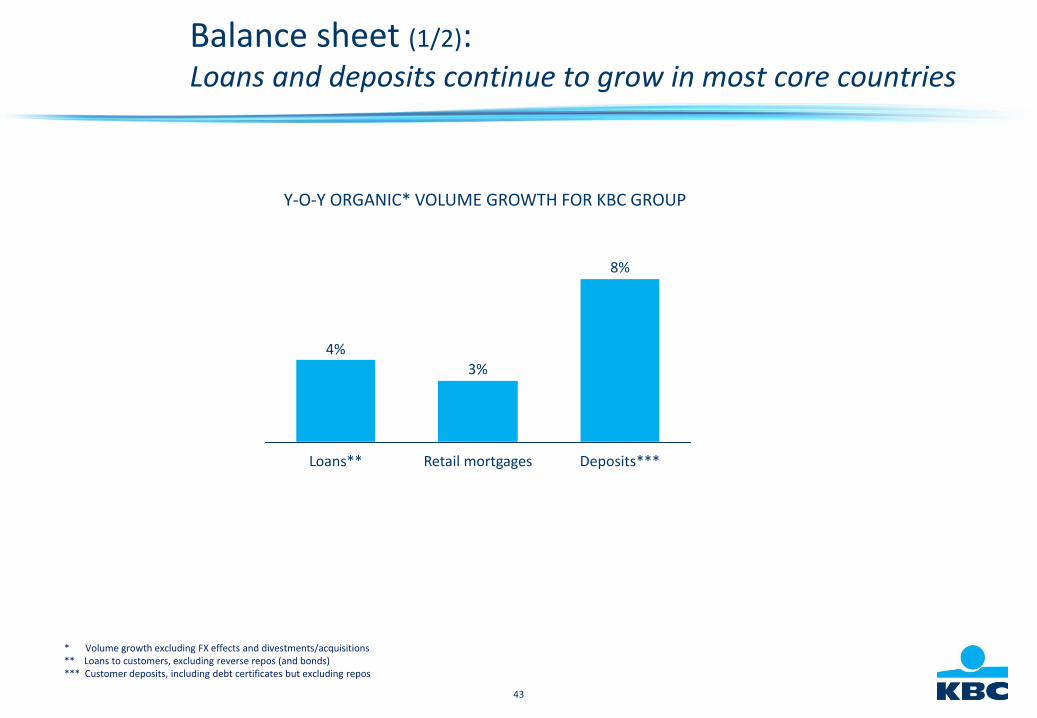
Balance sheet (1/2):Loans and deposits continue to grow in most core countries
Deposits***
8%
4%3%
Retail mortgagesLoans**
* Volume growth excluding FX effects and divestments/acquisitions** Loans to customers, excluding reverse repos (and bonds)*** Customer deposits, including debt certificates but excluding repos
Y-O-Y ORGANIC* VOLUME GROWTH FOR KBC GROUP
44
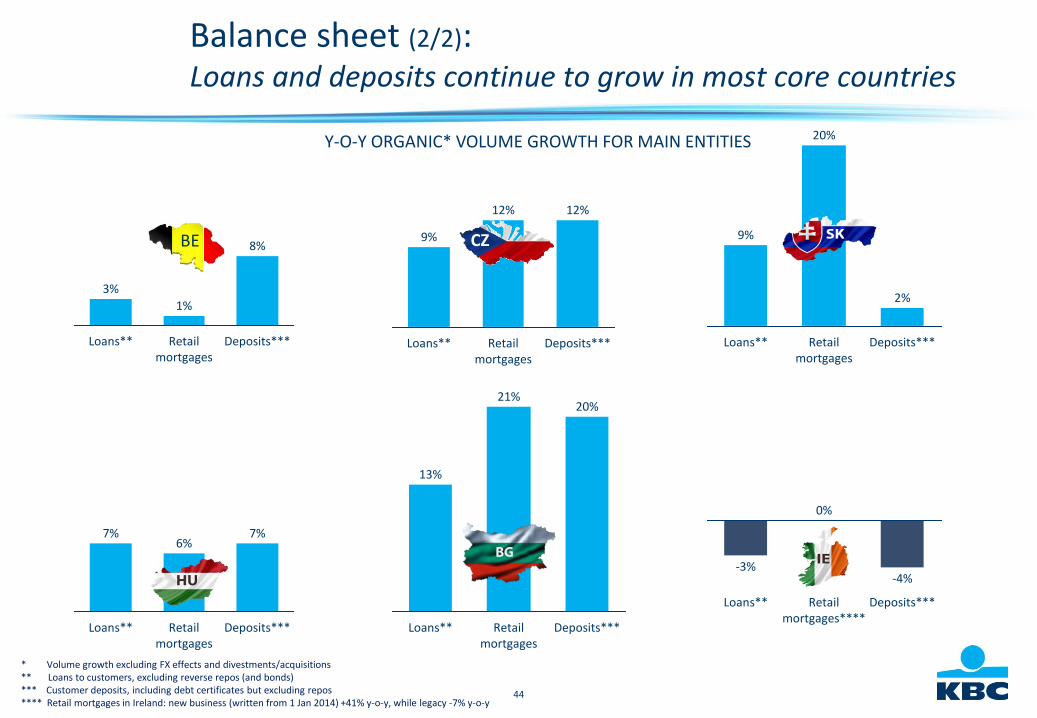
Balance sheet (2/2):Loans and deposits continue to grow in most core countries
Deposits***
8%
Retail mortgages
1%
Loans**
3%
Deposits***
12%
Retail mortgages
12%
Loans**
9%
Deposits***
-4%
Retail mortgages****
0%
Loans**
-3%
Deposits***
2%
Retail mortgages
20%
Loans**
9%
Deposits***
7%
Retail mortgages
6%
Loans**
7%
13%
Loans**
20%21%
Retail mortgages
Deposits***
BE CZ
Y-O-Y ORGANIC* VOLUME GROWTH FOR MAIN ENTITIES
* Volume growth excluding FX effects and divestments/acquisitions** Loans to customers, excluding reverse repos (and bonds)*** Customer deposits, including debt certificates but excluding repos**** Retail mortgages in Ireland: new business (written from 1 Jan 2014) +41% y-o-y, while legacy -7% y-o-y
45
KBC Group
Section 3
Strong solvency andsolid liquidity
46
Strong capital position
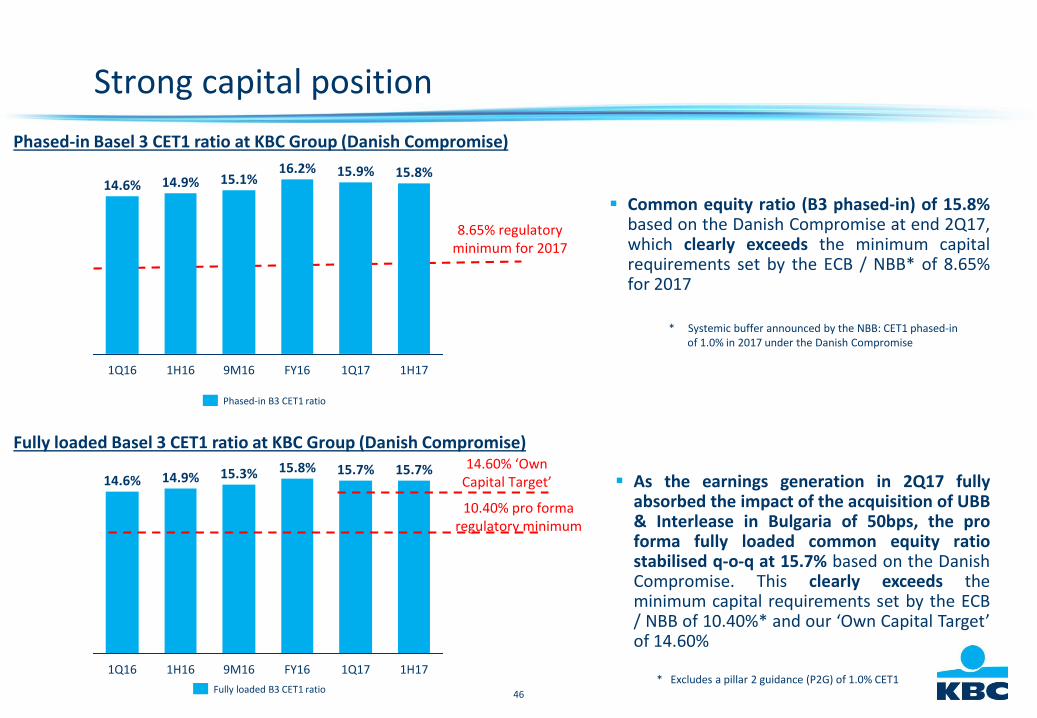
Phased-in Basel 3 CET1 ratio at KBC Group (Danish Compromise)
8.65% regulatoryminimum for 2017
1H17
15.8%
1Q17
15.9%
FY16
16.2%
9M16
15.1%
1H16
14.9%
1Q16
14.6%
Phased-in B3 CET1 ratio
Common equity ratio (B3 phased-in) of 15.8%based on the Danish Compromise at end 2Q17,which clearly exceeds the minimum capitalrequirements set by the ECB / NBB* of 8.65%for 2017
* Systemic buffer announced by the NBB: CET1 phased-in of 1.0% in 2017 under the Danish Compromise
Fully loaded Basel 3 CET1 ratio at KBC Group (Danish Compromise)
10.40% pro forma regulatory minimum
1H17
15.7%
1Q17
15.7%
FY16
15.8%
9M16
15.3%
1H16
14.9%
1Q16
14.6% As the earnings generation in 2Q17 fullyabsorbed the impact of the acquisition of UBB& Interlease in Bulgaria of 50bps, the proforma fully loaded common equity ratiostabilised q-o-q at 15.7% based on the DanishCompromise. This clearly exceeds theminimum capital requirements set by the ECB/ NBB of 10.40%* and our ‘Own Capital Target’of 14.60%
* Excludes a pillar 2 guidance (P2G) of 1.0% CET1Fully loaded B3 CET1 ratio
14.60% ‘OwnCapital Target’
47
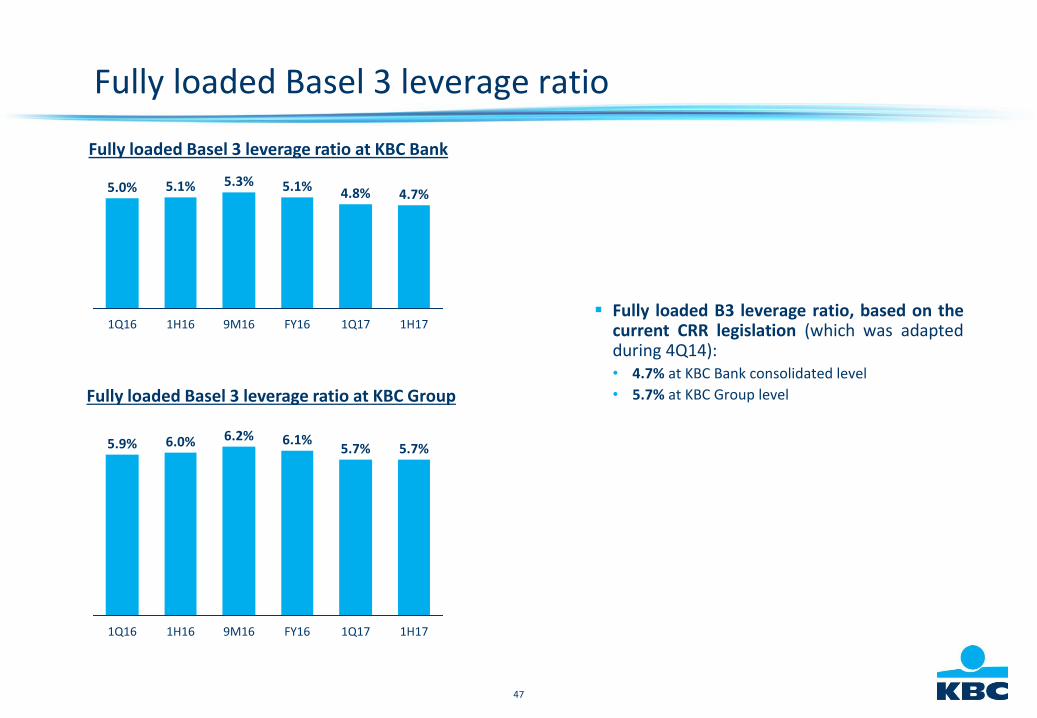
Fully loaded Basel 3 leverage ratio
Fully loaded B3 leverage ratio, based on thecurrent CRR legislation (which was adaptedduring 4Q14):• 4.7% at KBC Bank consolidated level
• 5.7% at KBC Group level
4.7%
1H171Q17
4.8%
FY16
5.1%
9M16
5.3%
1H16
5.1%
1Q16
5.0%
Fully loaded Basel 3 leverage ratio at KBC Bank
Fully loaded Basel 3 leverage ratio at KBC Group
6.0%
1H16
5.7%
1H171Q17
5.7%
FY16
6.1%
9M16
6.2%
1Q16
5.9%
48
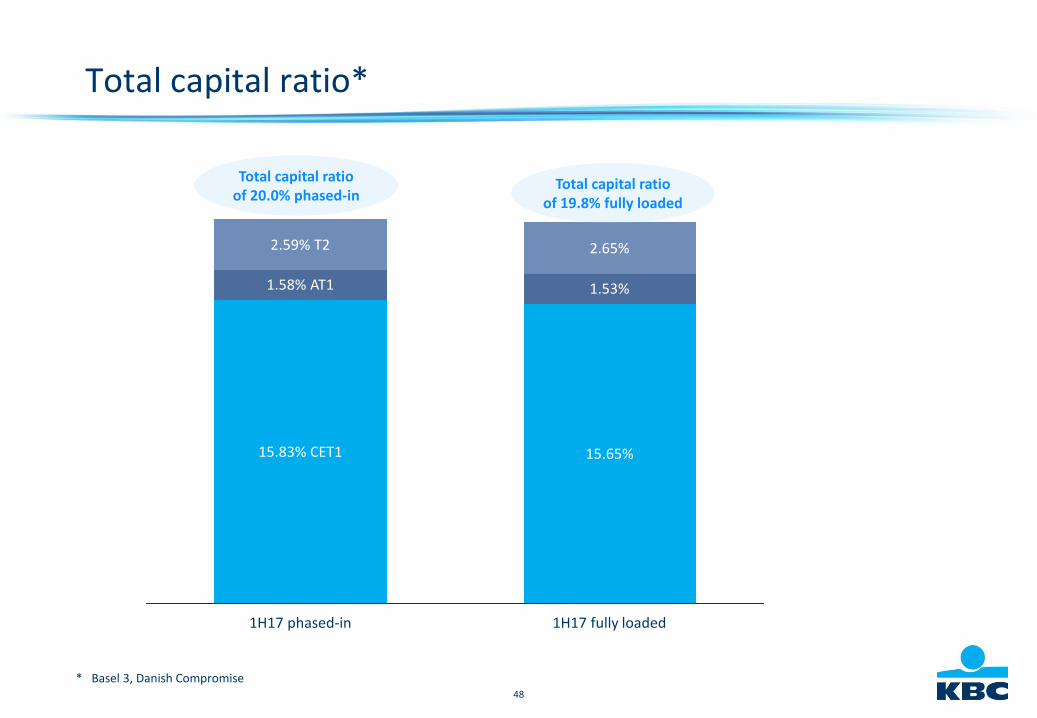
Total capital ratio*
Total capital ratioof 20.0% phased-in
15.83% CET1 15.65%
1.58% AT1
2.59% T2
1.53%
2.65%
1H17 phased-in 1H17 fully loaded
* Basel 3, Danish Compromise
Total capital ratioof 19.8% fully loaded
49
Solid liquidity position (1)
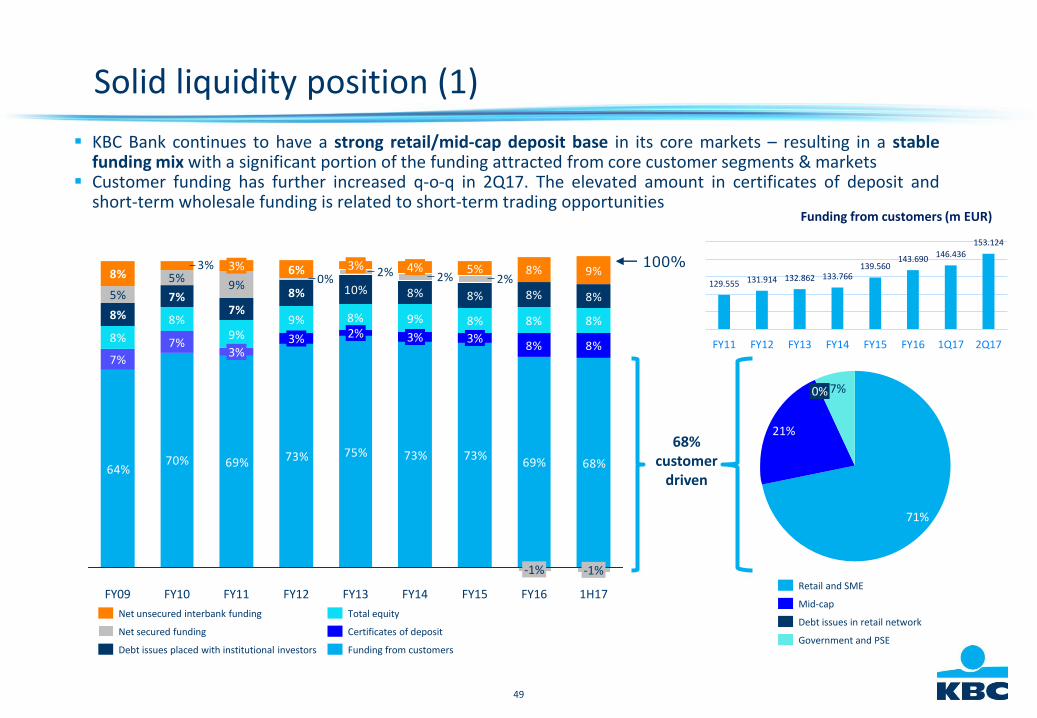
KBC Bank continues to have a strong retail/mid-cap deposit base in its core markets – resulting in a stablefunding mix with a significant portion of the funding attracted from core customer segments & markets
Customer funding has further increased q-o-q in 2Q17. The elevated amount in certificates of deposit andshort-term wholesale funding is related to short-term trading opportunities
64%70% 69% 73% 75% 73% 73%
7%
7%
68%
10% 8% 8%
8%
69%
8%9%8%9%9%
8%
8%8%8%
8%
8%
7%7%
8%
9%5%
5%2%2%2%
0%
8%8%
9%5%6%3%8% 8%
100%
1H17
-1%
FY16
-1%
FY15
3%
FY14
3%
4%
FY13
2%
3%
FY12
3%
FY11
3%
3%
FY10FY09
Funding from customers
Certificates of deposit
Total equity
Debt issues placed with institutional investors
Net secured funding
Net unsecured interbank funding
7%0%
21%
71%
Government and PSE
Debt issues in retail network
Mid-cap
Retail and SME
68% customer
driven
129.555 131.914 132.862 133.766139.560
143.690146.436
153.124
FY11 FY12 FY13 FY14 FY15 FY16 1Q17 2Q17
Funding from customers (m EUR)
50
* Graphs are based on Note 18 of KBC’s quarterly report, except for the ‘available liquid assets’ and‘liquid assets coverage’, which are based on the KBC Group Treasury Management Report
(*)
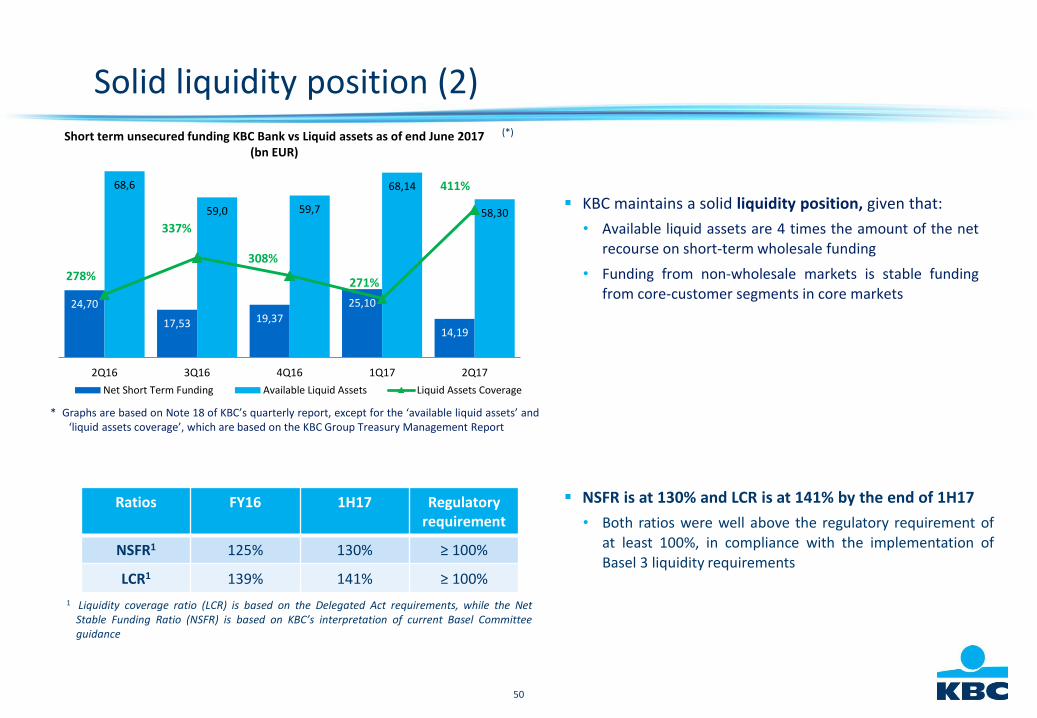
NSFR is at 130% and LCR is at 141% by the end of 1H17
• Both ratios were well above the regulatory requirement ofat least 100%, in compliance with the implementation ofBasel 3 liquidity requirements
Solid liquidity position (2)
Ratios FY16 1H17 Regulatory requirement
NSFR1 125% 130% ≥ 100%
LCR1 139% 141% ≥ 100%
1 Liquidity coverage ratio (LCR) is based on the Delegated Act requirements, while the NetStable Funding Ratio (NSFR) is based on KBC’s interpretation of current Basel Committeeguidance
KBC maintains a solid liquidity position, given that:
• Available liquid assets are 4 times the amount of the netrecourse on short-term wholesale funding
• Funding from non-wholesale markets is stable fundingfrom core-customer segments in core markets
24,70
17,53 19,37
25,10
14,19
68,6
59,0 59,7
68,14
58,30
278%
337%
308%
271%
411%
2Q16 3Q16 4Q16 1Q17 2Q17
Net Short Term Funding Available Liquid Assets Liquid Assets Coverage
Short term unsecured funding KBC Bank vs Liquid assets as of end June 2017 (bn EUR)
51
KBC Group
Section 4
2Q 2017 wrap up
52
2Q 2017 wrap up
Strong commercial bank-insurance results in our core countries
Successful underlying earnings track record
Solid capital and robust liquidity position
53
Post balance-sheet event: planned reform of the Belgiancorporate income tax regime
The planned reform of the Belgian corporate income tax regime as announced on 26 July 2017would impact KBC due mainly to the gradual decrease of the tax rate from 33.99% to 29.58% asof accounting year 2018 and 25.00% as of accounting year 2020. This would lead to:
a slightly positive one-off impact on the CET1 ratio (fully loaded under the Danish Compromise) in 2H17 ofroughly +0.2% thanks to amongst others:o higher AFS revaluation reserves after taxo lower risk weighted assets due to lower outstanding deferred tax assetsdespiteo an estimated one-off upfront negative P&L impact of 230m EUR expected in 2H17, which will only have a
small effect on CET1 as most of the impact was already deducted from common equity through thededuction of tax-loss-carry-forward DTAs
a recurring positive P&L impact as of 2018 onwards as:• the lower tax rate from 2018 onwards will have a positive impact on income taxes of the Belgian KBC
entities: amount depending on the pre-tax profit numbers in the coming years.
54
Looking forward
We expect 2017 to be a year of sustained economic growth in both the euro area and the US
Management guides for:• solid returns for all Business Units
• loan impairments for Ireland towards a release of a 160m-200m EUR range for FY17
Next to the Belgium and the Czech Republic Business Units, the International Markets Business Unitbecomes a strong contributor to the net result of KBC Group thanks to:• Ireland: re-positioning as a core country with a sustainable profit contribution• Bulgaria: after the acquisition of UBB and Interlease, UBB-CIBank and DZI will become the largest bank-
insurance group in Bulgaria with a substantial increase in profit contribution• Sustainable profit contribution of Hungary and Slovakia
55
KBC Group
Annex 1
Company profile
56
Business profile
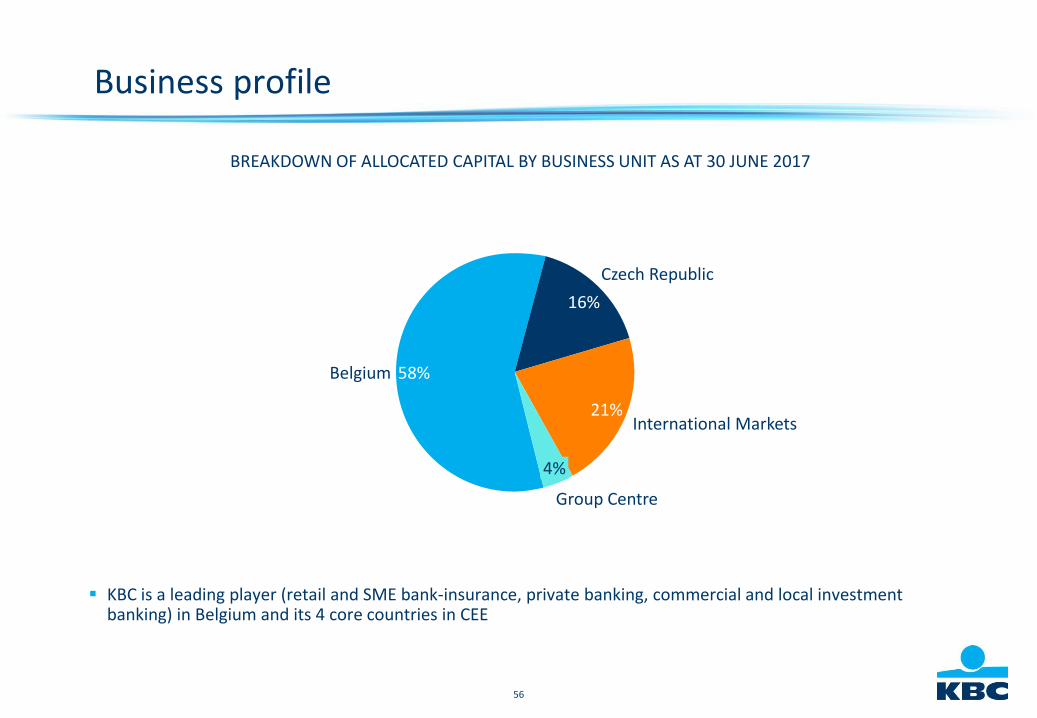
KBC is a leading player (retail and SME bank-insurance, private banking, commercial and local investment banking) in Belgium and its 4 core countries in CEE
BREAKDOWN OF ALLOCATED CAPITAL BY BUSINESS UNIT AS AT 30 JUNE 2017
Group Centre
4%
International Markets21%
Czech Republic
16%
Belgium 58%

57
BE CZ SK HU BG IRL
Loans and deposits
Investment funds
Life insurance
Non-life insurance
Well-defined core markets provide access to ‘new growth’ in Europe
1. Source: KBC data, August 2017
MARKET SHARE (END 2016)
10%11%20%21%
7%3%
15%7%23%
33%
11%4%4%7%
13%
9% 10%6%3%
7%
BE CZ SK HU BG IRL
% of Assets
2016
2017e
2018e
4%2%3%3%18%
67%
2.0%3.3%2.4%
1.2%
5.2%3.4%
4.0%3.4%3.7%3.2%2.6%1.5%
3.5%3.6%3.5%3.5%2.7%1.7%
REAL GDP GROWTH OUTLOOK FOR CORE MARKETS1
Macroeconomic outlookBased on GDP, CPI and unemployment trendsInspired by the Financial Times
IRELAND UK
BELGIUM
NETHERLANDS
GERMANY
CZECH REP
SLOVAKIA
HUNGARY
BULGARIA
GREECE
ITALY
PORTUGAL
SPAIN
FRANCE
KBC Group’s core markets *
* Only for retail segment

58
Loan loss experience at KBC
1H17CREDIT COST RATIO
FY16CREDIT COST RATIO
FY15CREDIT COST RATIO
FY14CREDIT COST RATIO
FY13CREDIT COST RATIO
AVERAGE ‘99 –’16
Belgium 0.11% 0.12% 0.19% 0.23% 0.37% n/a
Czech Republic
0.06% 0.11% 0.18% 0.18% 0.26% n/a
International Markets
-1.10% -0.16% 0.32% 1.06% 4.48%* n/a
Group Centre 0.32% 0.67% 0.54% 1.17% 1.85% n/a
Total -0.10% 0.09% 0.23% 0.42% 1.21%** 0.50%
Credit cost ratio: amount of losses incurred on troubled loans as a % of total average outstanding loan portfolio
* The high credit cost ratio at the International Markets Business Unit is due in full to KBC Bank Ireland. Excluding Ireland, the CCR at this business unit amounted to 108 bps in FY13
** Credit cost ratio amounted to 1.21% in FY13 due to the reassessment of the loan books in Ireland and Hungary
59
Key strengths
Well-developed bank-insurance strategy and strong cross-selling capabilities
Strong commercial bank-insurance franchises in Belgium and the Czech Republic with stable and solid returns. The International Markets Business Unit becomes a strong contributor to the net result of KBC Group
Successful underlying earnings track record
Solid capital and robust liquidity position
60
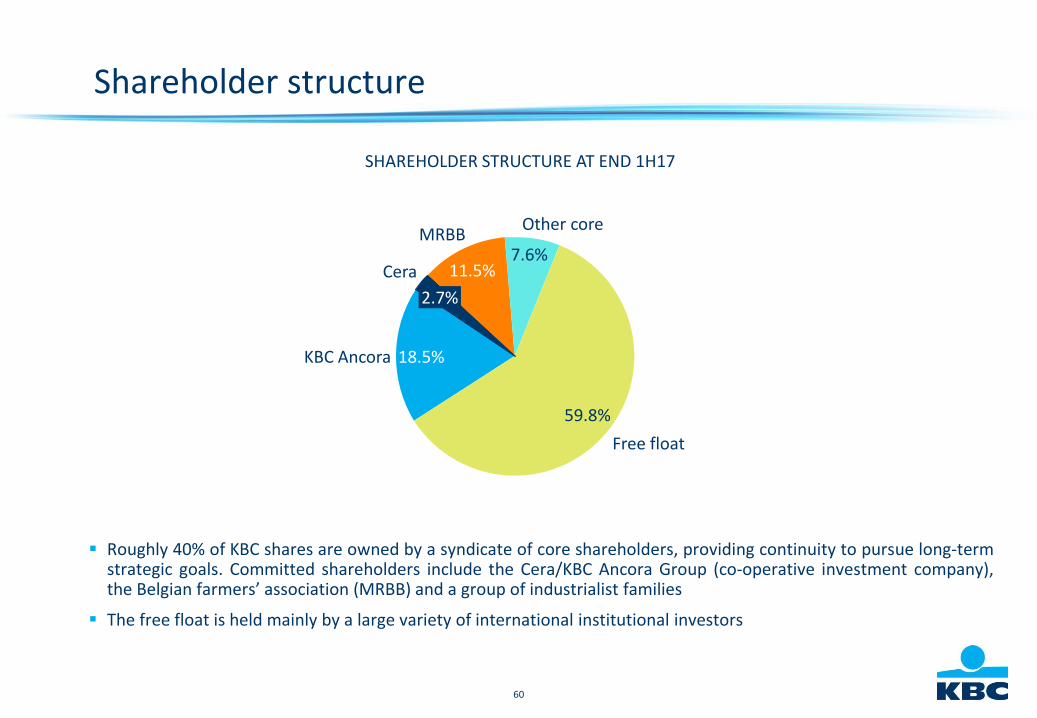
Shareholder structure
Roughly 40% of KBC shares are owned by a syndicate of core shareholders, providing continuity to pursue long-termstrategic goals. Committed shareholders include the Cera/KBC Ancora Group (co-operative investment company),the Belgian farmers’ association (MRBB) and a group of industrialist families
The free float is held mainly by a large variety of international institutional investors
SHAREHOLDER STRUCTURE AT END 1H17
18.5%
Free float
59.8%
Other core
7.6%MRBB
11.5%Cera
2.7%
KBC Ancora

61
KBC Group going forward:Wants to be among the best performing financial institutions in Europe
KBC wants to be among Europe’s best performing financial institutions. This will be achieved by:
• Strengthening our bank-insurance business model for retail, SME and mid-cap clients in our core markets, in a highly cost-efficient way
• Focusing on sustainable and profitable growth within the framework of solid risk, capital and liquidity management
• Creating superior client satisfaction via a seamless, multi-channel, client-centric distribution approach
By achieving this, KBC wants to become the reference in bank-insurance in its core markets
62
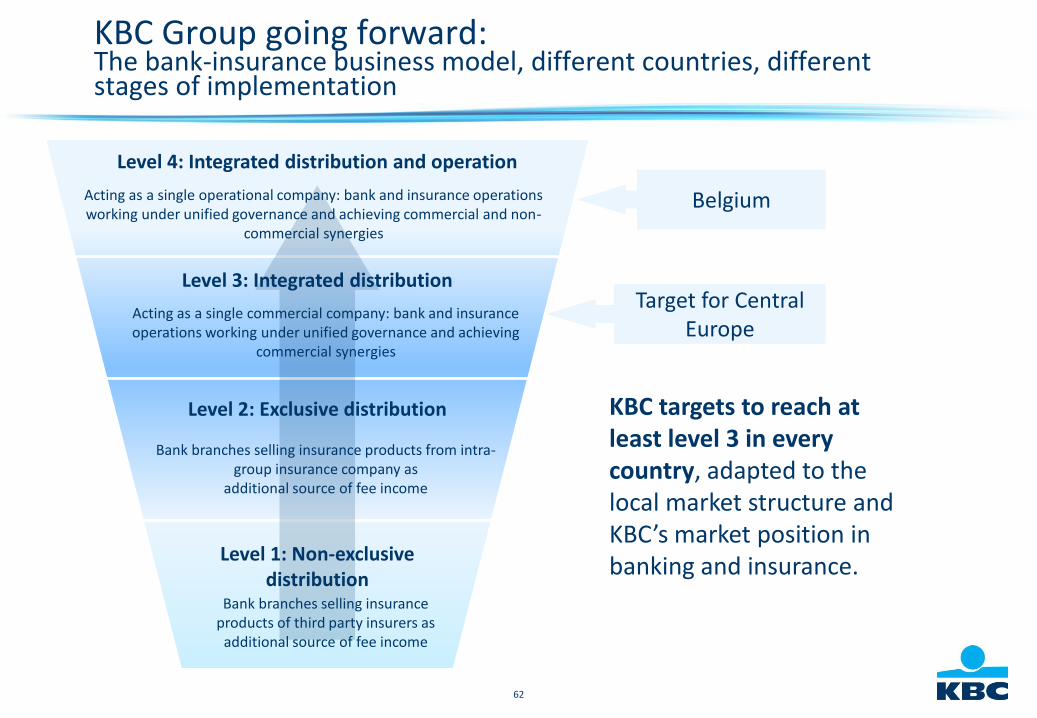
KBC Group going forward:The bank-insurance business model, different countries, different stages of implementation
Bank branches selling insurance products from intra-group insurance company as
additional source of fee income
Bank branches selling insurance products of third party insurers as
additional source of fee income
Acting as a single operational company: bank and insurance operations working under unified governance and achieving commercial and non-
commercial synergies
Acting as a single commercial company: bank and insurance operations working under unified governance and achieving
commercial synergies
Level 4: Integrated distribution and operation
Level 3: Integrated distribution
Level 2: Exclusive distribution
Level 1: Non-exclusive distribution
KBC targets to reach at least level 3 in every country, adapted to the local market structure and KBC’s market position in banking and insurance.
Belgium
Target for Central Europe
63
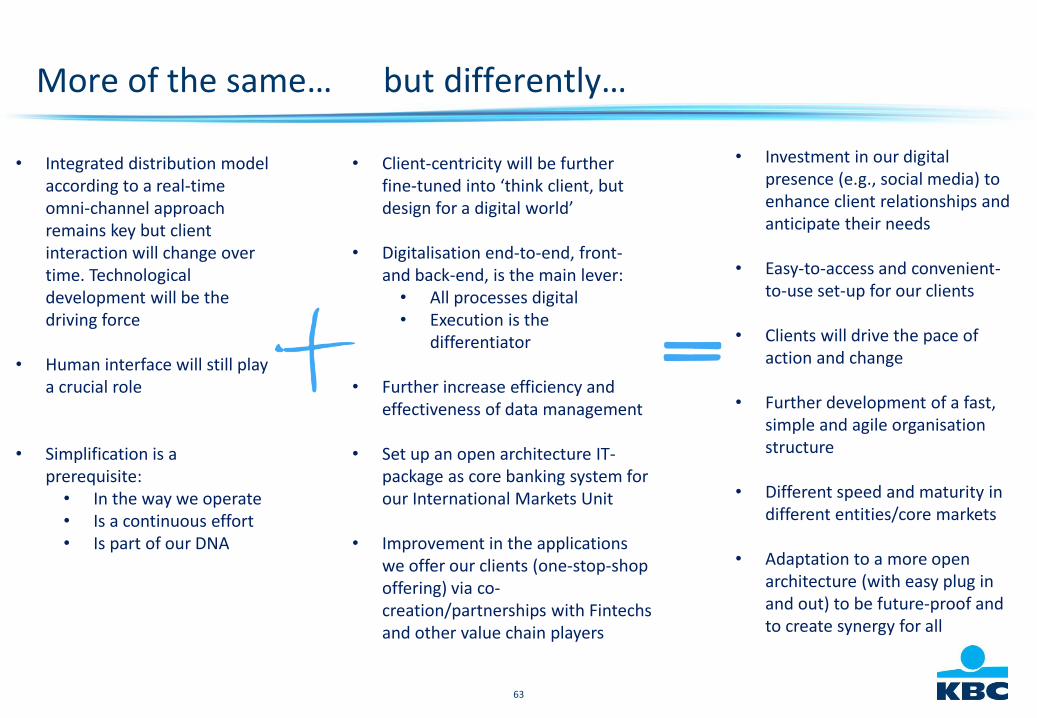
More of the same… but differently…
• Integrated distribution model according to a real-time omni-channel approach remains key but client interaction will change over time. Technological development will be the driving force
• Human interface will still play a crucial role
• Simplification is a prerequisite:• In the way we operate• Is a continuous effort• Is part of our DNA
• Client-centricity will be further fine-tuned into ‘think client, but design for a digital world’
• Digitalisation end-to-end, front-and back-end, is the main lever:• All processes digital • Execution is the
differentiator
• Further increase efficiency and effectiveness of data management
• Set up an open architecture IT-package as core banking system for our International Markets Unit
• Improvement in the applications we offer our clients (one-stop-shop offering) via co-creation/partnerships with Fintechsand other value chain players
• Investment in our digital presence (e.g., social media) to enhance client relationships and anticipate their needs
• Easy-to-access and convenient-to-use set-up for our clients
• Clients will drive the pace of action and change
• Further development of a fast, simple and agile organisation structure
• Different speed and maturity in different entities/core markets
• Adaptation to a more open architecture (with easy plug in and out) to be future-proof and to create synergy for all
64
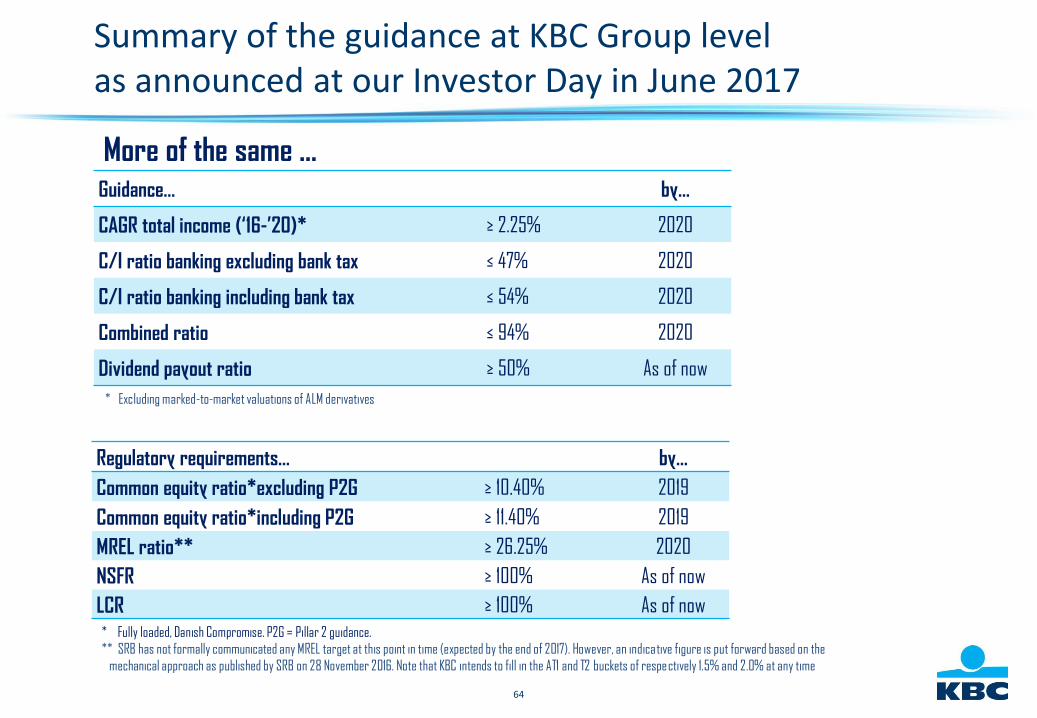
Summary of the guidance at KBC Group levelas announced at our Investor Day in June 2017
Guidance… by…
CAGR total income (‘16-’20)* ≥ 2.25% 2020
C/I ratio banking excluding bank tax ≤ 47% 2020
C/I ratio banking including bank tax ≤ 54% 2020
Combined ratio ≤ 94% 2020
Dividend payout ratio ≥ 50% As of now
* Excluding marked-to-market valuations of ALM derivatives
More of the same …
Regulatory requirements… by…
Common equity ratio*excluding P2G ≥ 10.40% 2019
Common equity ratio*including P2G ≥ 11.40% 2019
MREL ratio** ≥ 26.25% 2020
NSFR ≥ 100% As of now
LCR ≥ 100% As of now* Fully loaded, Danish Compromise. P2G = Pillar 2 guidance.
** SRB has not formally communicated any MREL target at this point in time (expected by the end of 2017). However, an indicative figure is put forward based on the
mechanical approach as published by SRB on 28 November 2016. Note that KBC intends to fill in the AT1 and T2 buckets of respectively 1.5% and 2.0% at any time
65
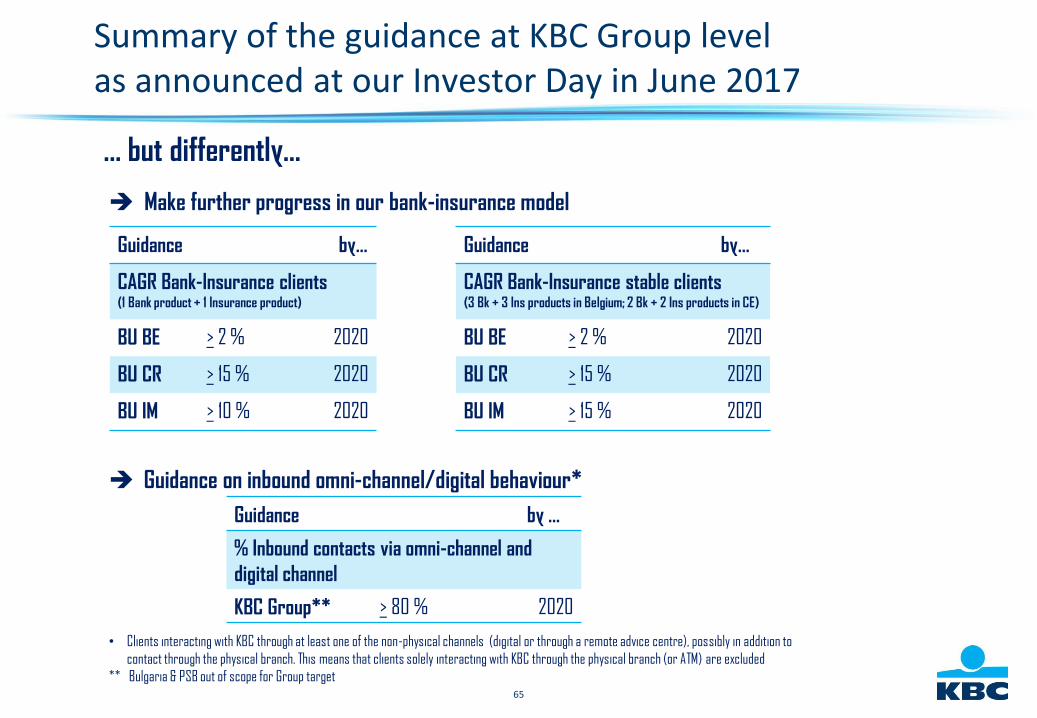
Summary of the guidance at KBC Group levelas announced at our Investor Day in June 2017
… but differently…
Make further progress in our bank-insurance model
Guidance on inbound omni-channel/digital behaviour*
Guidance by …
% Inbound contacts via omni-channel and
digital channel
KBC Group** > 80 % 2020
Guidance by…
CAGR Bank-Insurance clients (1 Bank product + 1 Insurance product)
BU BE > 2 % 2020
BU CR > 15 % 2020
BU IM > 10 % 2020
Guidance by…
CAGR Bank-Insurance stable clients (3 Bk + 3 Ins products in Belgium; 2 Bk + 2 Ins products in CE)
BU BE > 2 % 2020
BU CR > 15 % 2020
BU IM > 15 % 2020
• Clients interacting with KBC through at least one of the non-physical channels (digital or through a remote advice centre), possibly in addition to
contact through the physical branch. This means that clients solely interacting with KBC through the physical branch (or ATM) are excluded
** Bulgaria & PSB out of scope for Group target
66
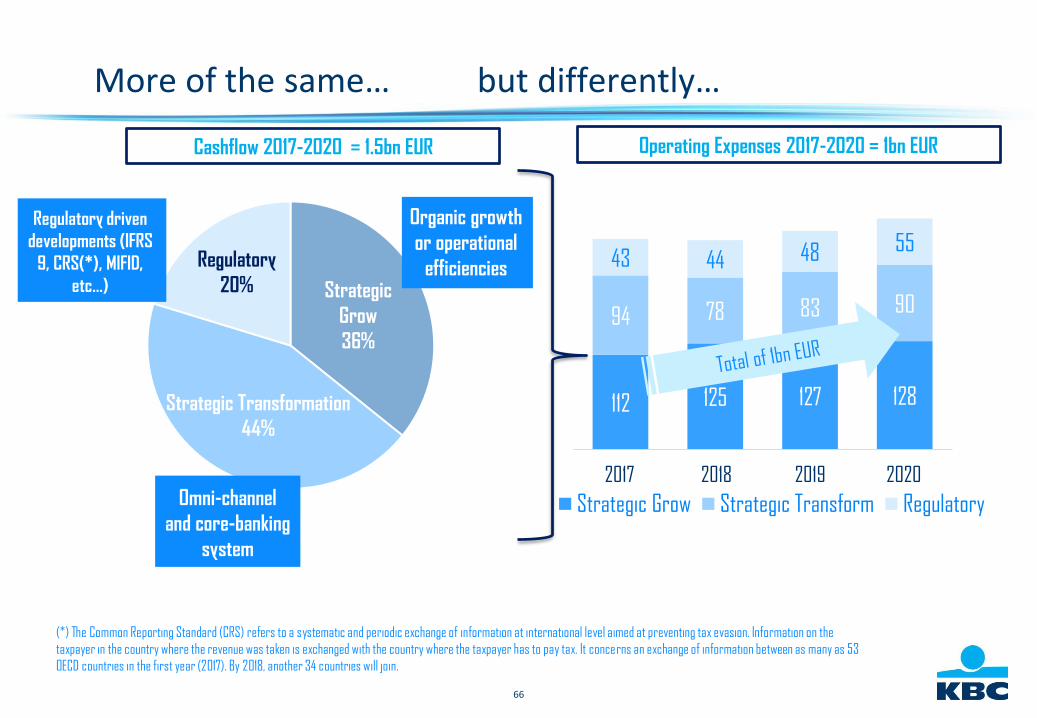
More of the same… but differently…
112 125 127 128
94 78 83 90
43 44 48 55
Strategic Grow Strategic Transform Regulatory
Cashflow 2017-2020 = 1.5bn EUR Operating Expenses 2017-2020 = 1bn EUR
(*) The Common Reporting Standard (CRS) refers to a systematic and periodic exchange of information at international level aimed at preventing tax evasion. Information on the
taxpayer in the country where the revenue was taken is exchanged with the country where the taxpayer has to pay tax. It concerns an exchange of information between as many as 53
OECD countries in the first year (2017). By 2018, another 34 countries will join.
2017 2018 2019 2020
Regulatory driven
developments (IFRS
9, CRS(*), MIFID,
etc...)
Omni-channel
and core-banking
system
Organic growth
or operational
efficienciesRegulatory
20% Strategic
Grow
36%
Strategic Transformation
44%
67
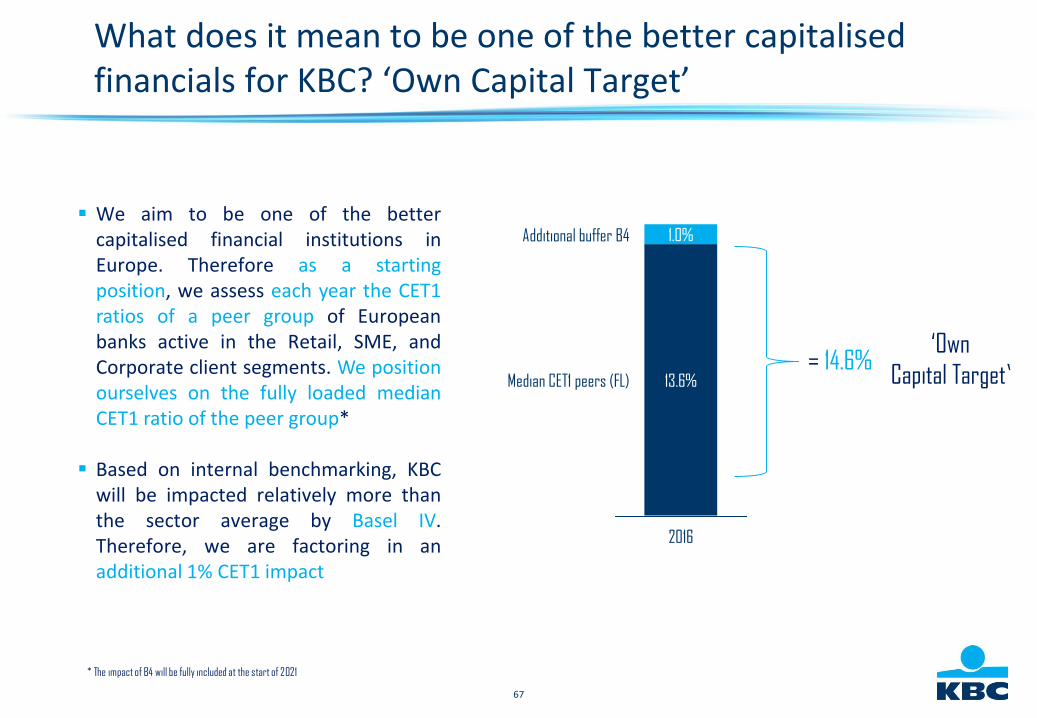
Median CET1 peers (FL)
Additional buffer B4 1.0%
13.6%
2016
We aim to be one of the bettercapitalised financial institutions inEurope. Therefore as a startingposition, we assess each year the CET1ratios of a peer group of Europeanbanks active in the Retail, SME, andCorporate client segments. We positionourselves on the fully loaded medianCET1 ratio of the peer group*
Based on internal benchmarking, KBCwill be impacted relatively more thanthe sector average by Basel IV.Therefore, we are factoring in anadditional 1% CET1 impact
‘Own
Capital Target’= 14.6%
* The impact of B4 will be fully included at the start of 2021
What does it mean to be one of the better capitalisedfinancials for KBC? ‘Own Capital Target’

68
2.0%
Own Capital Target
Flexible buffer for M&A
14.6%
2016
‘Reference
Capital Position’= 16.6%
KBC Group wants to keep a flexiblebuffer of up to 2% CET1 for potentialadd-on M&A in our core markets
This buffer comes on top of the ‘OwnCapital Target’ of KBC Group, and alltogether forms the ‘Reference CapitalPosition’
Any M&A opportunity will be assessedsubject to very strict financial andstrategic criteria
What does it mean for our capital deployment?‘Reference Capital Position’
69
Capital distribution to shareholders
The payout ratio policy (i.e. dividend + AT1 coupon) of at least 50% of consolidatedprofit is reconfirmed, with an annual interim dividend of 1 EUR per share being paid inNovember of each accounting year as an advance on the total dividend
On top of the payout ratio of 50% of consolidated profit, each year, the Board ofDirectors will take a decision, at its discretion, on the distribution of the capital abovethe ‘Reference Capital Position‘

70
KBC Group going forward: An optimised geographic footprint
Strengthen current geographic footprint
Optimise business portfolio by strengthening current bank-insurance presence through organic growth or through acquisitions if possible
No further plans to expand beyond current geographic footprint
KBC Group will consider acquisition options, if any, to strengthen current geographic bank-insurance footprint
Clear financial criteria for investment decision-making, based on:
Solid capital position of KBC GroupInvestment returns in the short and mid termsNew investment contributing positively to group ROE
71
KBC Group going forward: An optimised geographic footprint
Become a reference in bank-insurance in each core country
Through a locally embedded bank-insurance business model and a strong corporate culture, creating superior client satisfaction
With a clear focus on sustainable and profitable growth
72
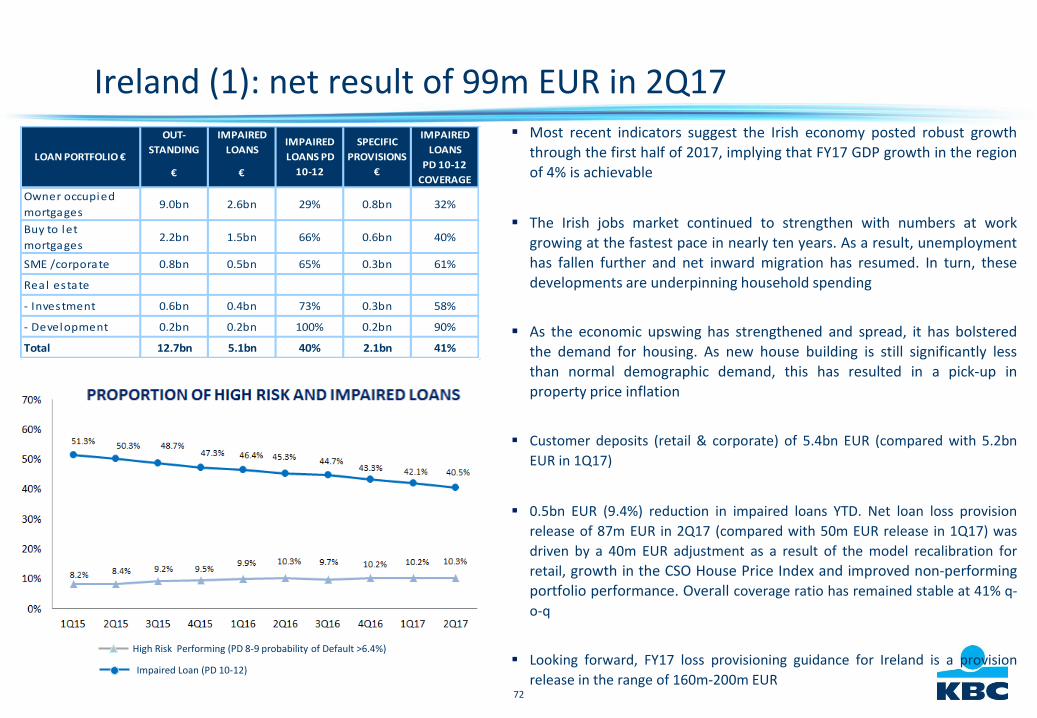
Ireland (1): net result of 99m EUR in 2Q17 Most recent indicators suggest the Irish economy posted robust growth
through the first half of 2017, implying that FY17 GDP growth in the regionof 4% is achievable
The Irish jobs market continued to strengthen with numbers at workgrowing at the fastest pace in nearly ten years. As a result, unemploymenthas fallen further and net inward migration has resumed. In turn, thesedevelopments are underpinning household spending
As the economic upswing has strengthened and spread, it has bolstered
the demand for housing. As new house building is still significantly lessthan normal demographic demand, this has resulted in a pick-up inproperty price inflation
Customer deposits (retail & corporate) of 5.4bn EUR (compared with 5.2bn
EUR in 1Q17)
0.5bn EUR (9.4%) reduction in impaired loans YTD. Net loan loss provision
release of 87m EUR in 2Q17 (compared with 50m EUR release in 1Q17) was
driven by a 40m EUR adjustment as a result of the model recalibration for
retail, growth in the CSO House Price Index and improved non-performingportfolio performance. Overall coverage ratio has remained stable at 41% q-
o-q
Looking forward, FY17 loss provisioning guidance for Ireland is a provision
release in the range of 160m-200m EUR
OUT-
STANDING
IMPAIRED
LOANS
IMPAIRED
LOANS
€ €PD 10-12
COVERAGE
Owner occupied
mortgages9.0bn 2.6bn 29% 0.8bn 32%
Buy to let
mortgages2.2bn 1.5bn 66% 0.6bn 40%
SME /corporate 0.8bn 0.5bn 65% 0.3bn 61%
Real estate
- Investment 0.6bn 0.4bn 73% 0.3bn 58%
- Development 0.2bn 0.2bn 100% 0.2bn 90%
Total 12.7bn 5.1bn 40% 2.1bn 41%
LOAN PORTFOLIO €
IMPAIRED
LOANS PD
10-12
SPECIFIC
PROVISIONS
€
High Risk Performing (PD 8-9 probability of Default >6.4%)
Impaired Loan (PD 10-12)
73
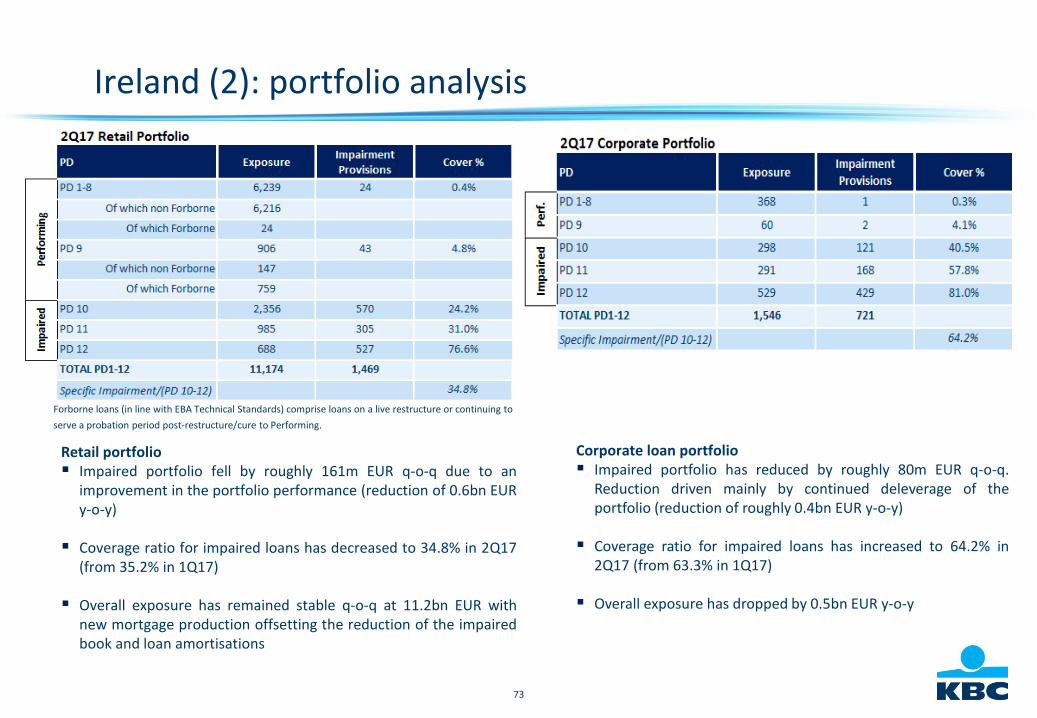
Retail portfolio Impaired portfolio fell by roughly 161m EUR q-o-q due to an
improvement in the portfolio performance (reduction of 0.6bn EURy-o-y)
Coverage ratio for impaired loans has decreased to 34.8% in 2Q17(from 35.2% in 1Q17)
Overall exposure has remained stable q-o-q at 11.2bn EUR withnew mortgage production offsetting the reduction of the impairedbook and loan amortisations
Ireland (2): portfolio analysis
Corporate loan portfolio Impaired portfolio has reduced by roughly 80m EUR q-o-q.
Reduction driven mainly by continued deleverage of theportfolio (reduction of roughly 0.4bn EUR y-o-y)
Coverage ratio for impaired loans has increased to 64.2% in2Q17 (from 63.3% in 1Q17)
Overall exposure has dropped by 0.5bn EUR y-o-y
Forborne loans (in line with EBA Technical Standards) comprise loans on a live restructure or continuing to
serve a probation period post-restructure/cure to Performing.
74
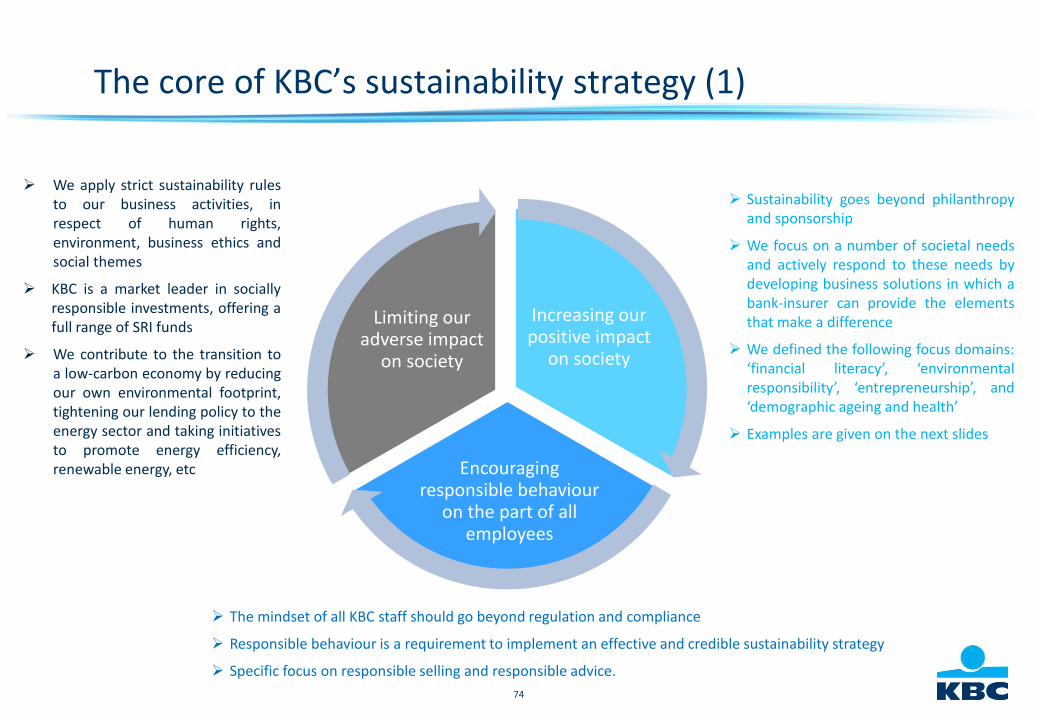
The core of KBC’s sustainability strategy (1)
The mindset of all KBC staff should go beyond regulation and compliance
Responsible behaviour is a requirement to implement an effective and credible sustainability strategy
Specific focus on responsible selling and responsible advice.
We apply strict sustainability rulesto our business activities, inrespect of human rights,environment, business ethics andsocial themes
KBC is a market leader in sociallyresponsible investments, offering afull range of SRI funds
We contribute to the transition toa low-carbon economy by reducingour own environmental footprint,tightening our lending policy to theenergy sector and taking initiativesto promote energy efficiency,renewable energy, etc
Sustainability goes beyond philanthropyand sponsorship
We focus on a number of societal needsand actively respond to these needs bydeveloping business solutions in which abank-insurer can provide the elementsthat make a difference
We defined the following focus domains:‘financial literacy’, ‘environmentalresponsibility’, ‘entrepreneurship’, and‘demographic ageing and health’
Examples are given on the next slides
Increasing ourpositive impact
on society
Encouragingresponsible behaviour
on the part of allemployees
Limiting ouradverse impact
on society
75
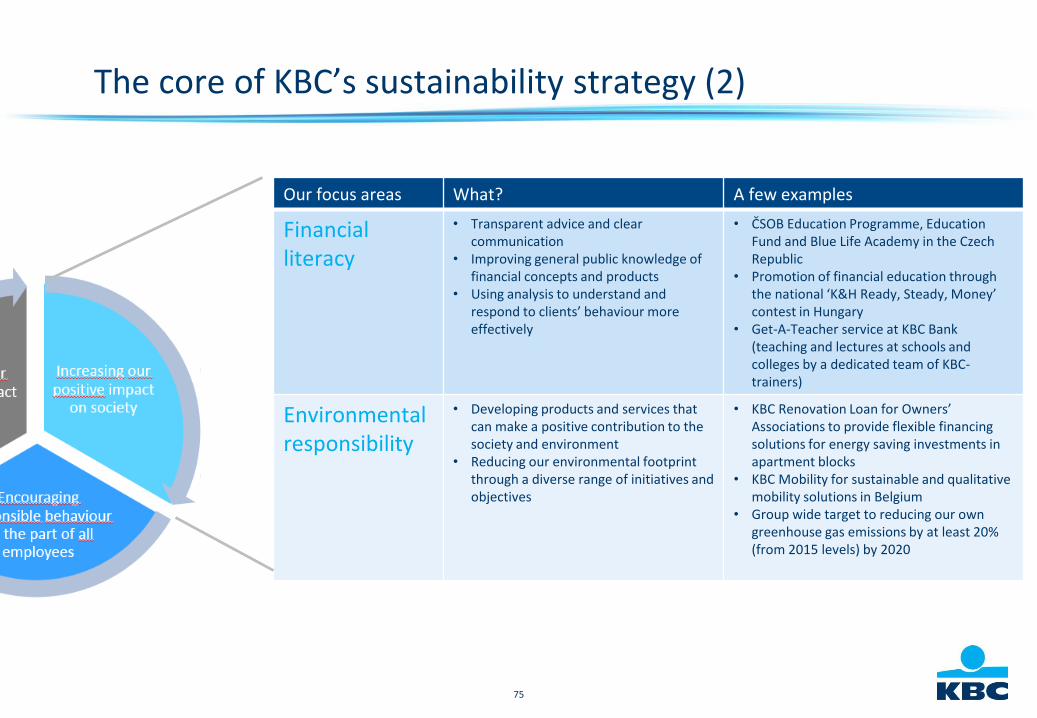
The core of KBC’s sustainability strategy (2)
Our focus areas What? A few examples
Financialliteracy
• Transparent advice and clear communication
• Improving general public knowledge of financial concepts and products
• Using analysis to understand and respond to clients’ behaviour more effectively
• ČSOB Education Programme, Education Fund and Blue Life Academy in the Czech Republic
• Promotion of financial education through the national ‘K&H Ready, Steady, Money’ contest in Hungary
• Get-A-Teacher service at KBC Bank (teaching and lectures at schools and colleges by a dedicated team of KBC-trainers)
Environmental responsibility
• Developing products and services that can make a positive contribution to the society and environment
• Reducing our environmental footprint through a diverse range of initiatives and objectives
• KBC Renovation Loan for Owners’ Associations to provide flexible financing solutions for energy saving investments in apartment blocks
• KBC Mobility for sustainable and qualitative mobility solutions in Belgium
• Group wide target to reducing our own greenhouse gas emissions by at least 20% (from 2015 levels) by 2020
76
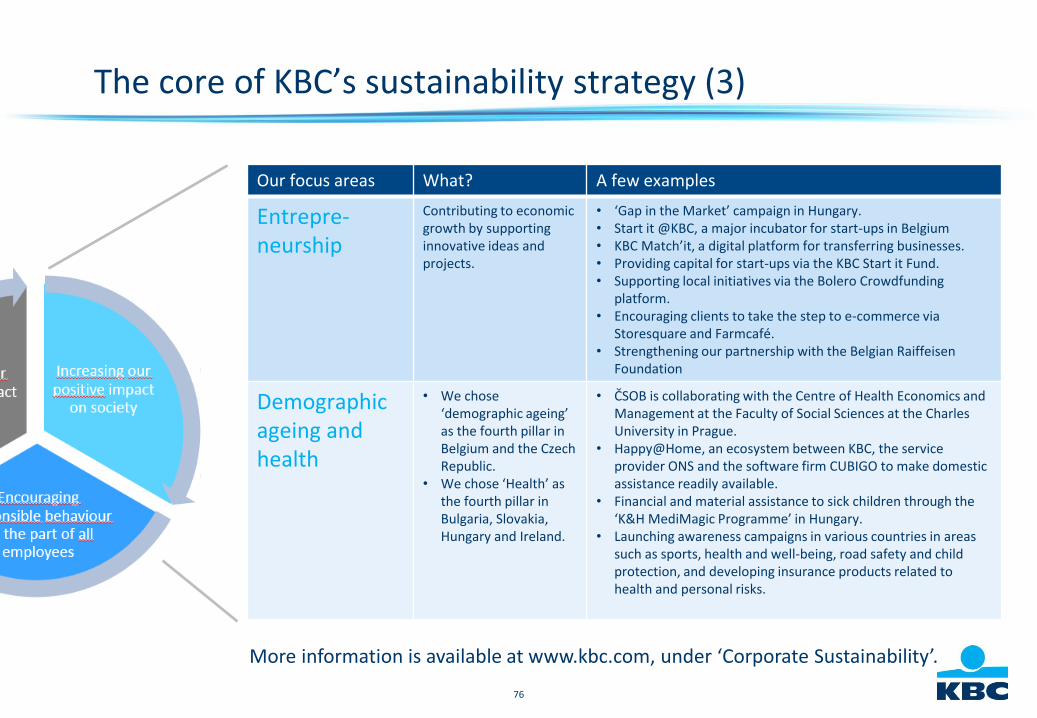
The core of KBC’s sustainability strategy (3)
Our focus areas What? A few examples
Entrepre-neurship
Contributing to economic growth by supporting innovative ideas and projects.
• ‘Gap in the Market’ campaign in Hungary.• Start it @KBC, a major incubator for start-ups in Belgium• KBC Match’it, a digital platform for transferring businesses.• Providing capital for start-ups via the KBC Start it Fund.• Supporting local initiatives via the Bolero Crowdfunding
platform.• Encouraging clients to take the step to e-commerce via
Storesquare and Farmcafé.• Strengthening our partnership with the Belgian Raiffeisen
Foundation
Demographic ageing and health
• We chose ‘demographic ageing’ as the fourth pillar in Belgium and the Czech Republic.
• We chose ‘Health’ as the fourth pillar in Bulgaria, Slovakia, Hungary and Ireland.
• ČSOB is collaborating with the Centre of Health Economics and Management at the Faculty of Social Sciences at the Charles University in Prague.
• Happy@Home, an ecosystem between KBC, the service provider ONS and the software firm CUBIGO to make domestic assistance readily available.
• Financial and material assistance to sick children through the ‘K&H MediMagic Programme’ in Hungary.
• Launching awareness campaigns in various countries in areas such as sports, health and well-being, road safety and child protection, and developing insurance products related to health and personal risks.
More information is available at www.kbc.com, under ‘Corporate Sustainability’.
77
KBC Group
Annex 2
Other items
78
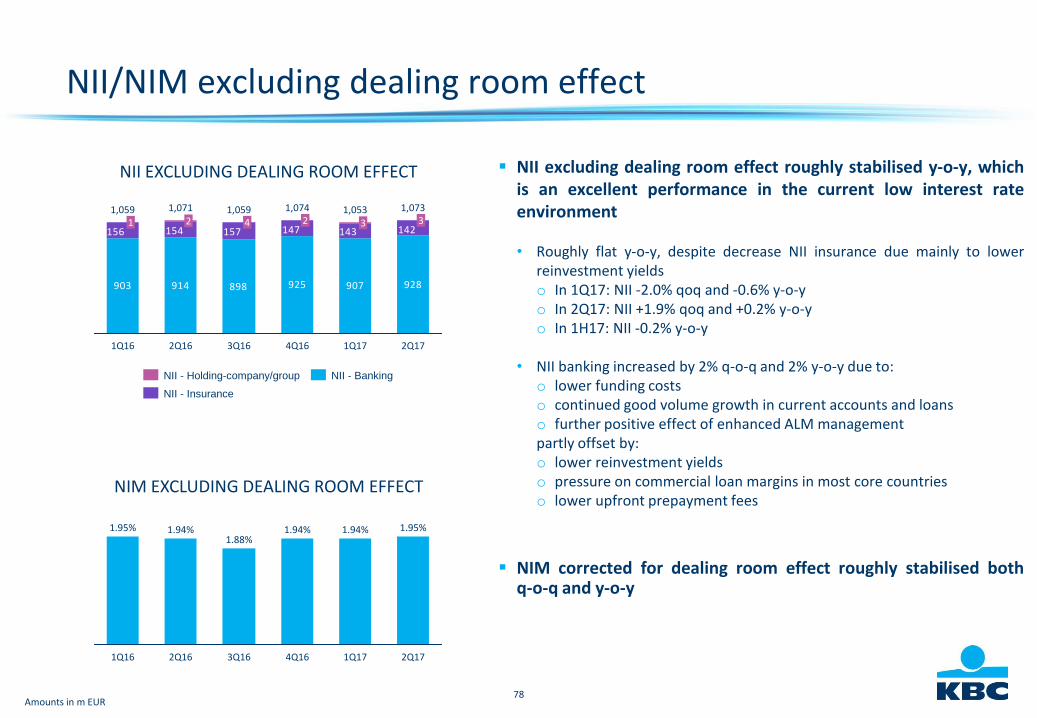
NII/NIM excluding dealing room effect
NII excluding dealing room effect roughly stabilised y-o-y, whichis an excellent performance in the current low interest rateenvironment
• Roughly flat y-o-y, despite decrease NII insurance due mainly to lowerreinvestment yieldso In 1Q17: NII -2.0% qoq and -0.6% y-o-yo In 2Q17: NII +1.9% qoq and +0.2% y-o-yo In 1H17: NII -0.2% y-o-y
• NII banking increased by 2% q-o-q and 2% y-o-y due to:o lower funding costso continued good volume growth in current accounts and loanso further positive effect of enhanced ALM managementpartly offset by:o lower reinvestment yieldso pressure on commercial loan margins in most core countrieso lower upfront prepayment fees
NIM corrected for dealing room effect roughly stabilised bothq-o-q and y-o-y
NII EXCLUDING DEALING ROOM EFFECT
903 914 898 925 907 928
142143147157154156
1,07332
3Q16
1,0594
2Q16
1,071
1Q17
1,0533
4Q16
1,0741,0591 2
1Q16 2Q17
NII - Banking
NII - Insurance
NII - Holding-company/group
Amounts in m EUR
NIM EXCLUDING DEALING ROOM EFFECT
1.94% 1.94% 1.95%
1Q17 2Q174Q16
1.95%
3Q161Q16
1.94%1.88%
2Q16
79
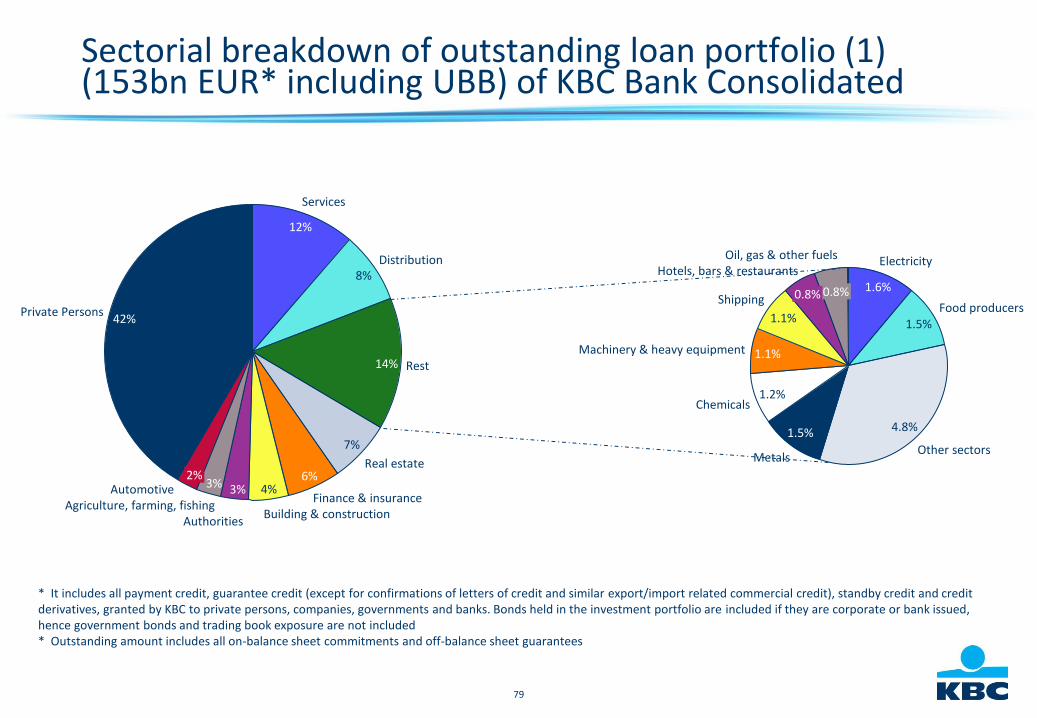
Sectorial breakdown of outstanding loan portfolio (1)(153bn EUR* including UBB) of KBC Bank Consolidated
Private Persons42%
Automotive2%
Agriculture, farming, fishing
3%
Authorities
3%
Building & construction
4%Finance & insurance
6%Real estate
7%
Rest14%
Distribution8%
Services
12%
Oil, gas & other fuels
0.8%
Hotels, bars & restaurants
0.8%Shipping
1.1%
Machinery & heavy equipment 1.1%
Chemicals1.2%
Metals
1.5%
Other sectors
4.8%
Food producers1.5%
Electricity
1.6%
* It includes all payment credit, guarantee credit (except for confirmations of letters of credit and similar export/import related commercial credit), standby credit and credit derivatives, granted by KBC to private persons, companies, governments and banks. Bonds held in the investment portfolio are included if they are corporate or bank issued, hence government bonds and trading book exposure are not included* Outstanding amount includes all on-balance sheet commitments and off-balance sheet guarantees
80
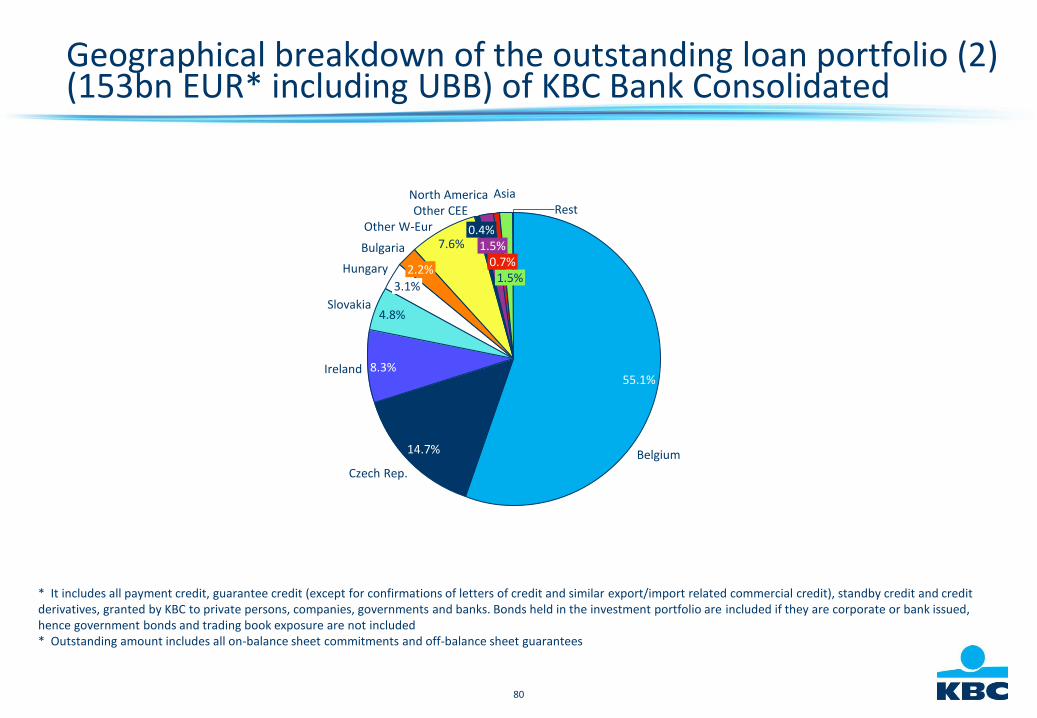
Geographical breakdown of the outstanding loan portfolio (2)(153bn EUR* including UBB) of KBC Bank Consolidated
Rest
1.5%
Asia
0.7%
North America
1.5%
Other CEE
0.4%Other W-Eur
7.6%Bulgaria
2.2%Hungary
3.1%
Slovakia4.8%
Ireland 8.3%
Czech Rep.
14.7% Belgium
55.1%
* It includes all payment credit, guarantee credit (except for confirmations of letters of credit and similar export/import related commercial credit), standby credit and credit derivatives, granted by KBC to private persons, companies, governments and banks. Bonds held in the investment portfolio are included if they are corporate or bank issued, hence government bonds and trading book exposure are not included* Outstanding amount includes all on-balance sheet commitments and off-balance sheet guarantees
81
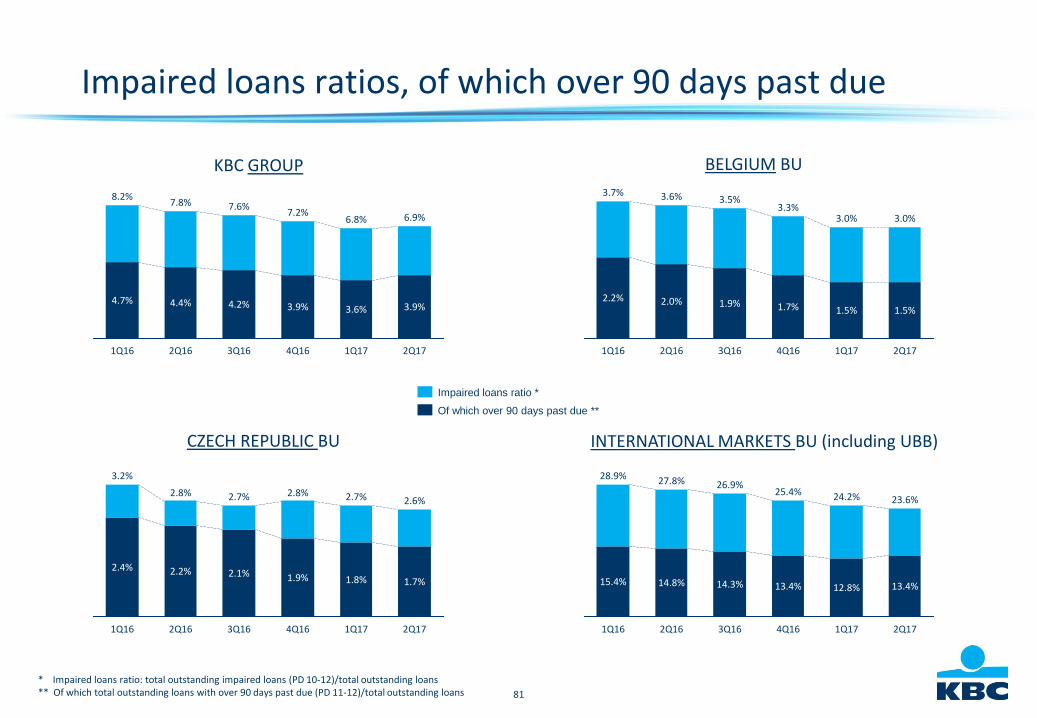
Impaired loans ratios, of which over 90 days past due
INTERNATIONAL MARKETS BU (including UBB)CZECH REPUBLIC BU
2Q17
6.9%
3.9%
1Q17
6.8%
3.6%
4Q16
7.2%
3.9%
3Q16
7.6%
4.2%
2Q16
7.8%
4.4%
1Q16
8.2%
4.7%
Of which over 90 days past due **
Impaired loans ratio *
2Q17
2.6%
1.7%
1Q17
2.7%
1.8%
4Q16
2.8%
1.9%
3Q16
2.7%
2.1%
2Q16
2.8%
2.2%
1Q16
3.2%
2.4%
2Q17
23.6%
13.4%
1Q17
24.2%
12.8%
4Q16
25.4%
13.4%
3Q16
26.9%
14.3%
2Q16
27.8%
14.8%
1Q16
28.9%
15.4%
BELGIUM BU
2Q17
3.0%
1.5%
1Q17
3.0%
1.5%
4Q16
3.3%
1.7%
3Q16
3.5%
1.9%
2Q16
3.6%
2.0%
1Q16
3.7%
2.2%
KBC GROUP
* Impaired loans ratio: total outstanding impaired loans (PD 10-12)/total outstanding loans** Of which total outstanding loans with over 90 days past due (PD 11-12)/total outstanding loans
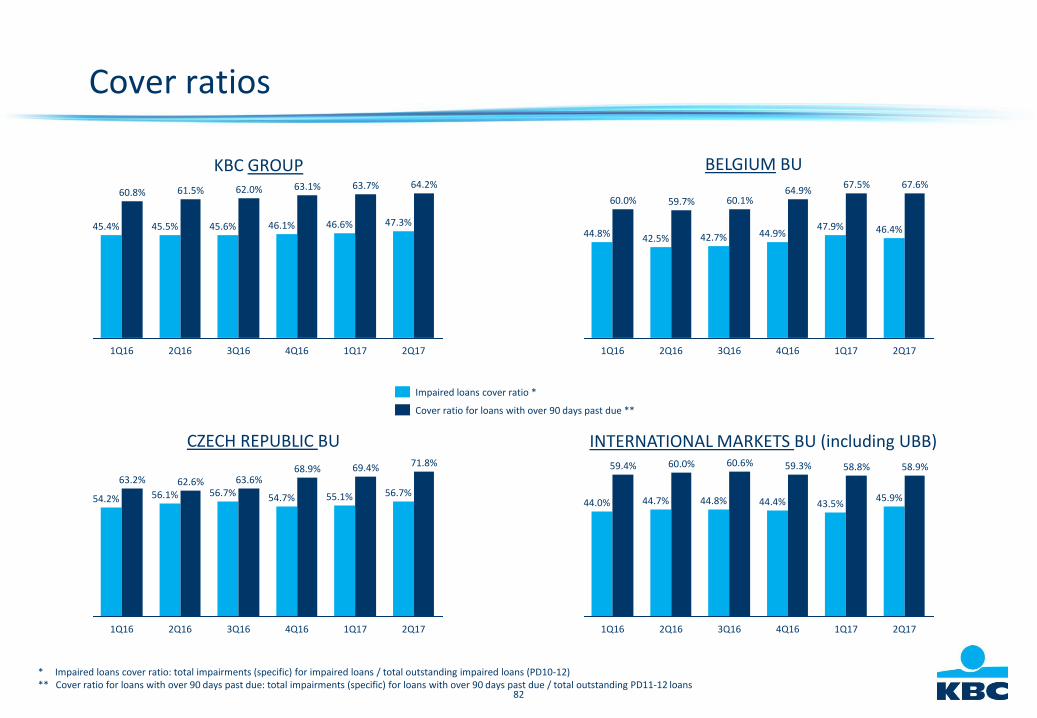
82
Cover ratios
INTERNATIONAL MARKETS BU (including UBB)CZECH REPUBLIC BU
BELGIUM BUKBC GROUP
* Impaired loans cover ratio: total impairments (specific) for impaired loans / total outstanding impaired loans (PD10-12)** Cover ratio for loans with over 90 days past due: total impairments (specific) for loans with over 90 days past due / total outstanding PD11-12 loans
2Q17
45.4%
1Q17
63.7%
46.6%
4Q16
63.1%
46.1%
3Q16
47.3%
64.2%62.0%
45.6%
2Q16
61.5%
45.5%
1Q16
60.8%
Cover ratio for loans with over 90 days past due **
Impaired loans cover ratio *
56.7%
1Q17 2Q174Q16
68.9%
54.7%
3Q16
63.6%56.7%
2Q16
62.6%
71.8%69.4%
55.1%56.1%
1Q16
63.2%
54.2%
2Q17
67.6%
46.4%42.5%
1Q16
60.0%64.9%
44.9%
3Q16
60.1%
42.7%
2Q16
59.7%
44.8%
1Q17
67.5%
47.9%
4Q16
44.8%
2Q16
60.0%
2Q17
58.9%
45.9%44.7%
1Q16
59.4%
44.0%
58.8%
43.5%
4Q16 1Q17
59.3%
44.4%
3Q16
60.6%
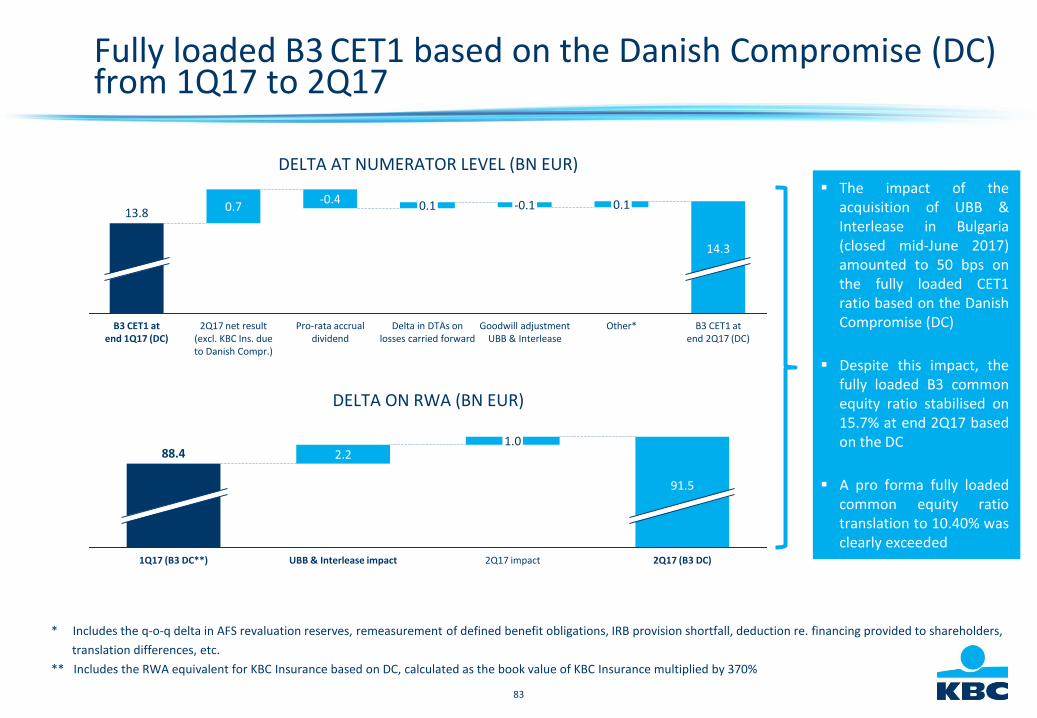
83
Fully loaded B3 CET1 based on the Danish Compromise (DC)from 1Q17 to 2Q17
Jan 2012 Dec 2012 2014-2020
2Q17 (B3 DC)
91.5
88.4
2Q17 impact
2.2
1Q17 (B3 DC**) UBB & Interlease impact
1.0
DELTA AT NUMERATOR LEVEL (BN EUR)
DELTA ON RWA (BN EUR)
* Includes the q-o-q delta in AFS revaluation reserves, remeasurement of defined benefit obligations, IRB provision shortfall, deduction re. financing provided to shareholders,
translation differences, etc.
** Includes the RWA equivalent for KBC Insurance based on DC, calculated as the book value of KBC Insurance multiplied by 370%
The impact of theacquisition of UBB &Interlease in Bulgaria(closed mid-June 2017)amounted to 50 bps onthe fully loaded CET1ratio based on the DanishCompromise (DC)
Despite this impact, thefully loaded B3 commonequity ratio stabilised on15.7% at end 2Q17 basedon the DC
A pro forma fully loadedcommon equity ratiotranslation to 10.40% wasclearly exceeded
Delta in DTAs on losses carried forward
0.1
Goodwill adjustment UBB & Interlease
-0.1
Other*
0.1
B3 CET1 at end 2Q17 (DC)
14.3
Pro-rata accrual dividend
B3 CET1 at end 1Q17 (DC)
13.8 0.7-0.4
2Q17 net result (excl. KBC Ins. due to Danish Compr.)
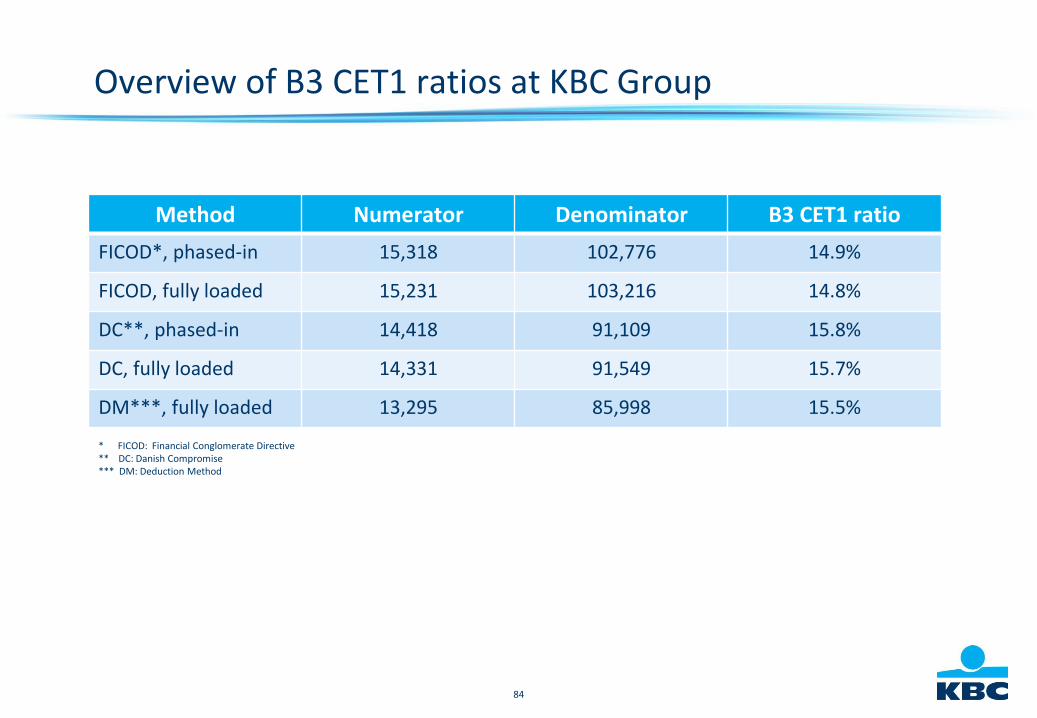
84
Overview of B3 CET1 ratios at KBC Group
Method Numerator Denominator B3 CET1 ratio
FICOD*, phased-in 15,318 102,776 14.9%
FICOD, fully loaded 15,231 103,216 14.8%
DC**, phased-in 14,418 91,109 15.8%
DC, fully loaded 14,331 91,549 15.7%
DM***, fully loaded 13,295 85,998 15.5%
* FICOD: Financial Conglomerate Directive** DC: Danish Compromise*** DM: Deduction Method

85
Solvency II ratio
Solvency II ratio
1Q17 2Q17
Solvency II ratio without strict cap of the NBB 214%* 217%
On 19 April 2017, the NBB retroactively relaxed thestrict cap on the loss absorbing capacity ofdeferred taxes in the calculation of the requiredcapital. Belgian insurance companies are nowallowed to apply a higher adjustment for deferredtaxes, in line with general European standards, ifthey pass the recoverability test. This is the casefor KBC
The increase (+3%-points) in the Solvency II ratiowithout this cap was mainly the result of astronger euro and slightly lower equity marketsperformance
* Note that the solvency II ratio of 1Q17 has been restated from 220% to 214% as an error occurred in the available capital
(the final dividend paid in May 2017 was not reported as foreseeable dividends in 1Q17)
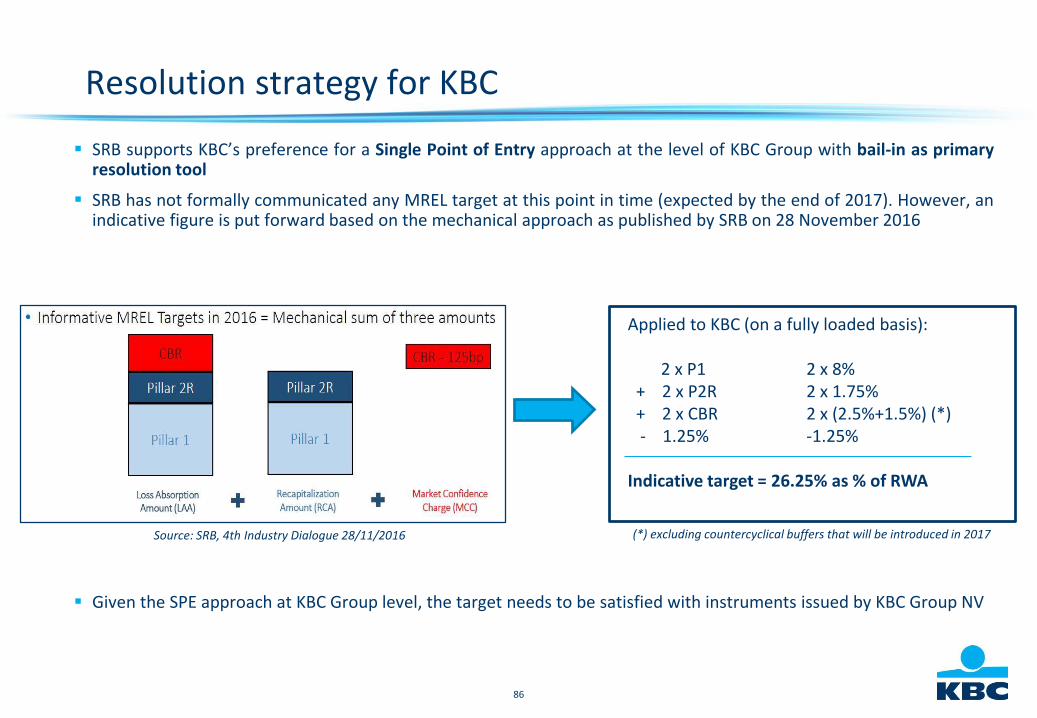
86
Resolution strategy for KBC
SRB supports KBC’s preference for a Single Point of Entry approach at the level of KBC Group with bail-in as primaryresolution tool
SRB has not formally communicated any MREL target at this point in time (expected by the end of 2017). However, anindicative figure is put forward based on the mechanical approach as published by SRB on 28 November 2016
Source: SRB, 4th Industry Dialogue 28/11/2016
Applied to KBC (on a fully loaded basis):
2 x P1 2 x 8%+ 2 x P2R 2 x 1.75%+ 2 x CBR 2 x (2.5%+1.5%) (*)- 1.25% -1.25%
Indicative target = 26.25% as % of RWA
(*) excluding countercyclical buffers that will be introduced in 2017
Given the SPE approach at KBC Group level, the target needs to be satisfied with instruments issued by KBC Group NV
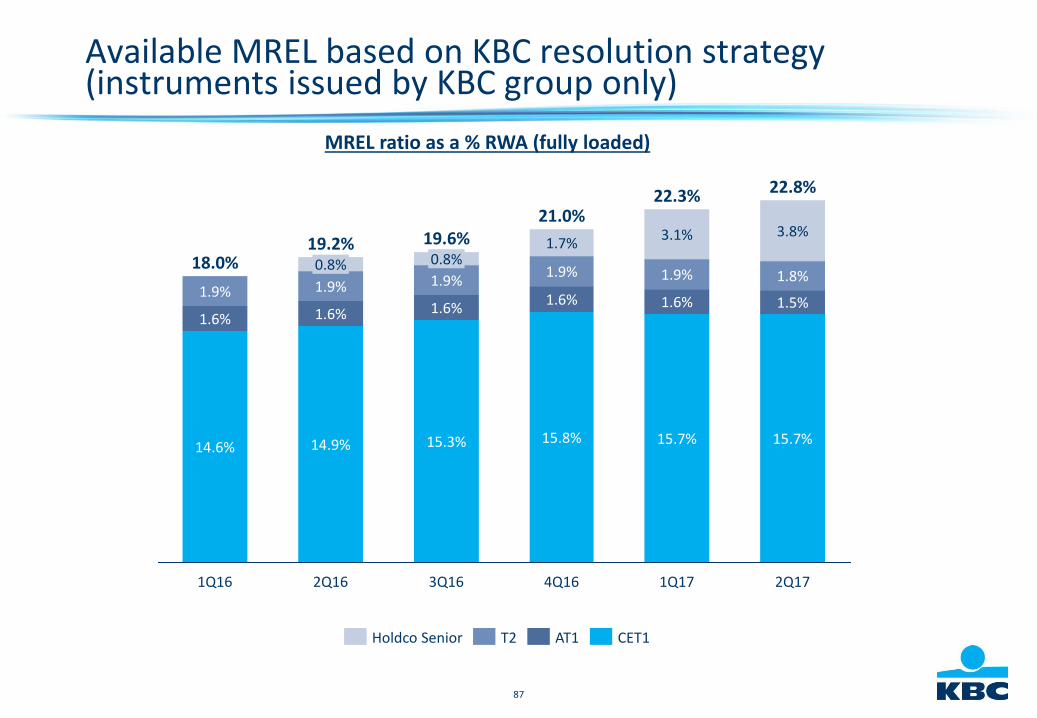
87
Available MREL based on KBC resolution strategy(instruments issued by KBC group only)
1.9%
22.3%
1.6%
22.8%
1.5%
3.8%
4Q16
15.7%
1.7%
3Q16
15.7%
1Q17
1.8%
15.8%
2Q17
1.6%
19.6%
15.3%
1.6%
21.0%3.1%
1.9%1.9%
0.8%
2Q16
19.2%
14.9%
1.6%
1.9%
0.8%
1Q16
18.0%
14.6%
1.6%
1.9%
MREL ratio as a % RWA (fully loaded)
CET1T2Holdco Senior AT1
88
P&L volatility from ALM derivatives
ALM derivatives (swaps and options) are used to hedge the interest rate risk of the loan & deposit portfolios. This creates an accounting mismatch between derivatives (at market value) and hedged products (at amortised cost)• Options are used to hedge the caps/floors that KBC is obliged by law to include in Belgian mortgages
Most of this mismatch is removed with IFRS hedge accounting
A part of the ALM derivatives has not been included in any hedge accounting structure for different reasons:• Option hedging for mortgage loans: no hedge accounting possible given the dynamic hedging strategy used
• Part of the ALM interest rate derivatives has not been included in a hedge accounting structure, due to the offsetting effect with AFS bonds impact on capital ratios (which is not the case with valuation changes of cash flow hedges due to the applied regulatory capital filter)
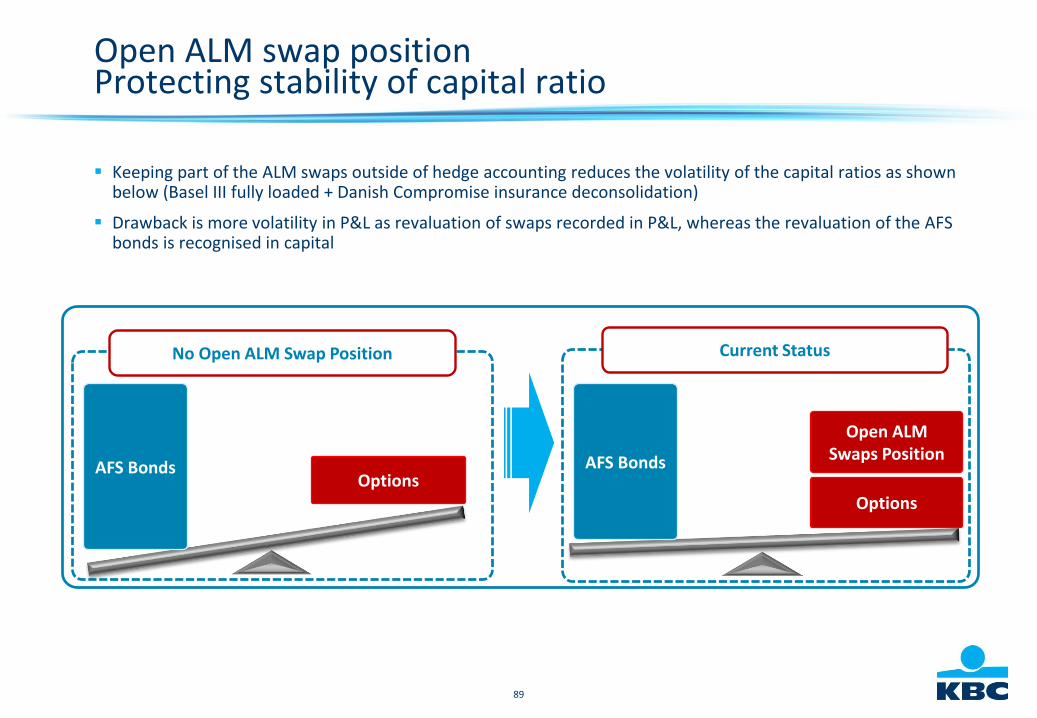
89
Open ALM swap positionProtecting stability of capital ratio
Keeping part of the ALM swaps outside of hedge accounting reduces the volatility of the capital ratios as shown below (Basel III fully loaded + Danish Compromise insurance deconsolidation)
Drawback is more volatility in P&L as revaluation of swaps recorded in P&L, whereas the revaluation of the AFS bonds is recognised in capital
AFS BondsOptions
AFS Bonds
Options
Open ALM Swaps Position
No Open ALM Swap Position Current Status
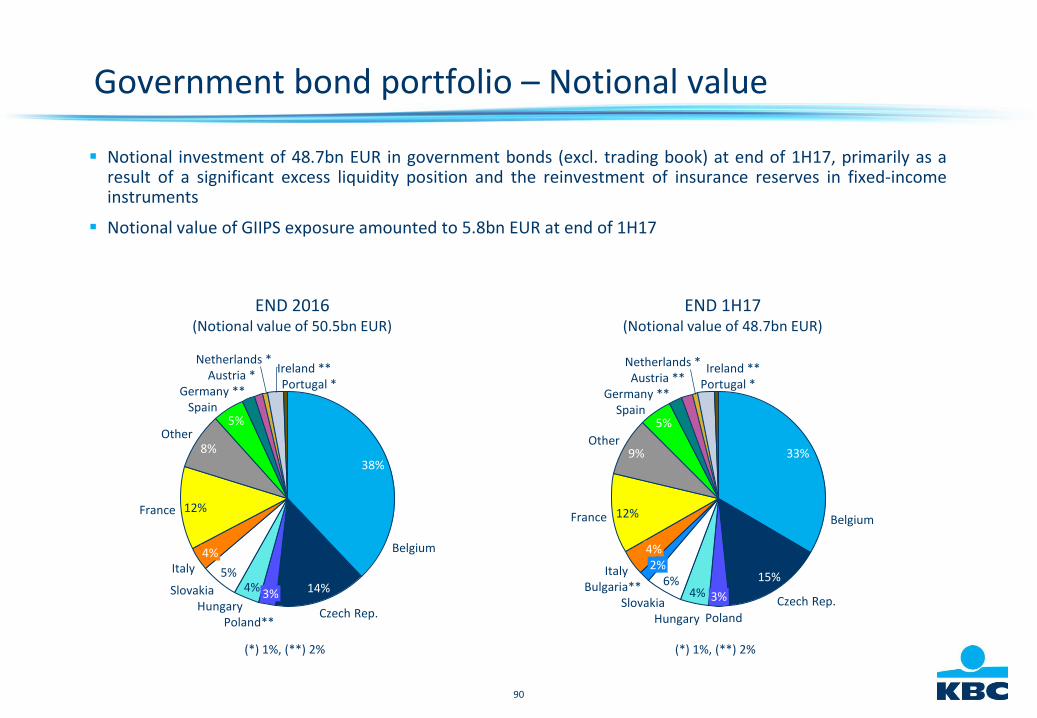
90
Government bond portfolio – Notional value
Notional investment of 48.7bn EUR in government bonds (excl. trading book) at end of 1H17, primarily as aresult of a significant excess liquidity position and the reinvestment of insurance reserves in fixed-incomeinstruments
Notional value of GIIPS exposure amounted to 5.8bn EUR at end of 1H17
Portugal *Ireland **Netherlands *
Austria **Germany **
Spain5%
Other9%
France 12%
Italy
4%
Slovakia
6%
Hungary
4%
Poland
3% Czech Rep.
15%
Belgium
33%
2%
Bulgaria**
END 1H17(Notional value of 48.7bn EUR)
(*) 1%, (**) 2%
Portugal *Ireland **
Netherlands *Austria *
Germany **Spain
5%Other
8%
France 12%
Italy4%
Slovakia
5%
Hungary
4%
Poland**
3%
Czech Rep.
14%
Belgium
38%
END 2016(Notional value of 50.5bn EUR)
(*) 1%, (**) 2%
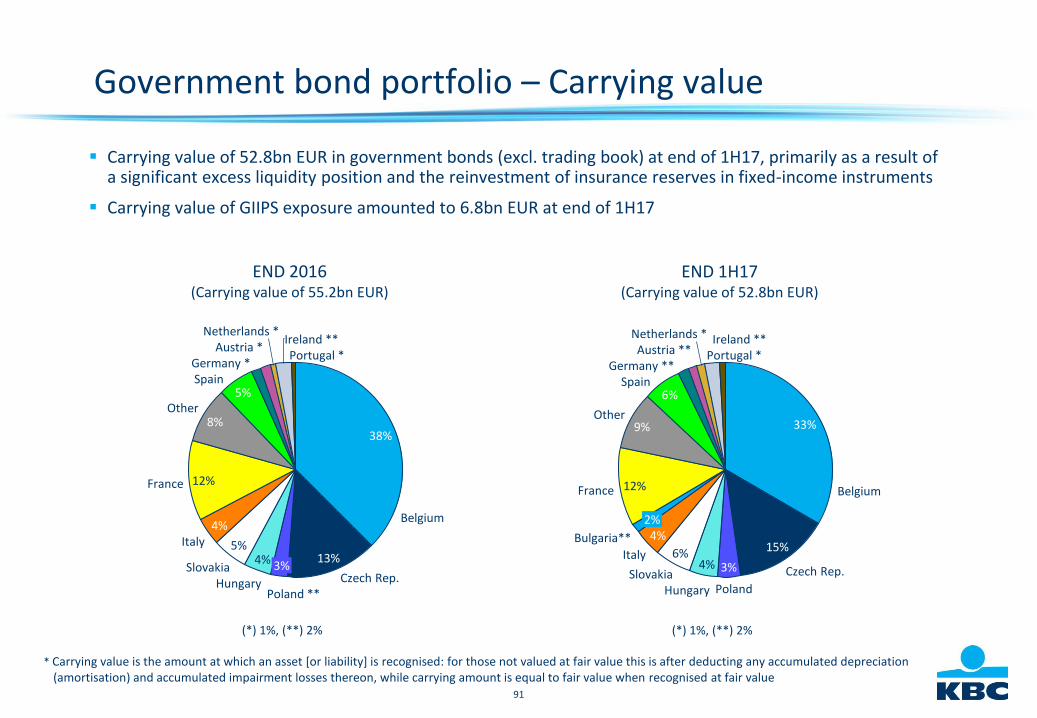
91
Government bond portfolio – Carrying value
Carrying value of 52.8bn EUR in government bonds (excl. trading book) at end of 1H17, primarily as a result of a significant excess liquidity position and the reinvestment of insurance reserves in fixed-income instruments
Carrying value of GIIPS exposure amounted to 6.8bn EUR at end of 1H17
* Carrying value is the amount at which an asset [or liability] is recognised: for those not valued at fair value this is after deducting any accumulated depreciation (amortisation) and accumulated impairment losses thereon, while carrying amount is equal to fair value when recognised at fair value
END 1H17(Carrying value of 52.8bn EUR)
(*) 1%, (**) 2%
Bulgaria**
Portugal *Ireland **Netherlands *
Austria **Germany **
Spain6%
Other9%
France 12%
Italy
4%
Slovakia
6%
Hungary
4%
Poland
3% Czech Rep.
15%
Belgium
33%
2%
END 2016(Carrying value of 55.2bn EUR)
(*) 1%, (**) 2%
Portugal *Ireland **
Netherlands *Austria *
Germany *Spain
5%Other
8%
France 12%
Italy4%
Slovakia
5%
Hungary
4%
Poland **
3%Czech Rep.
13%
Belgium
38%
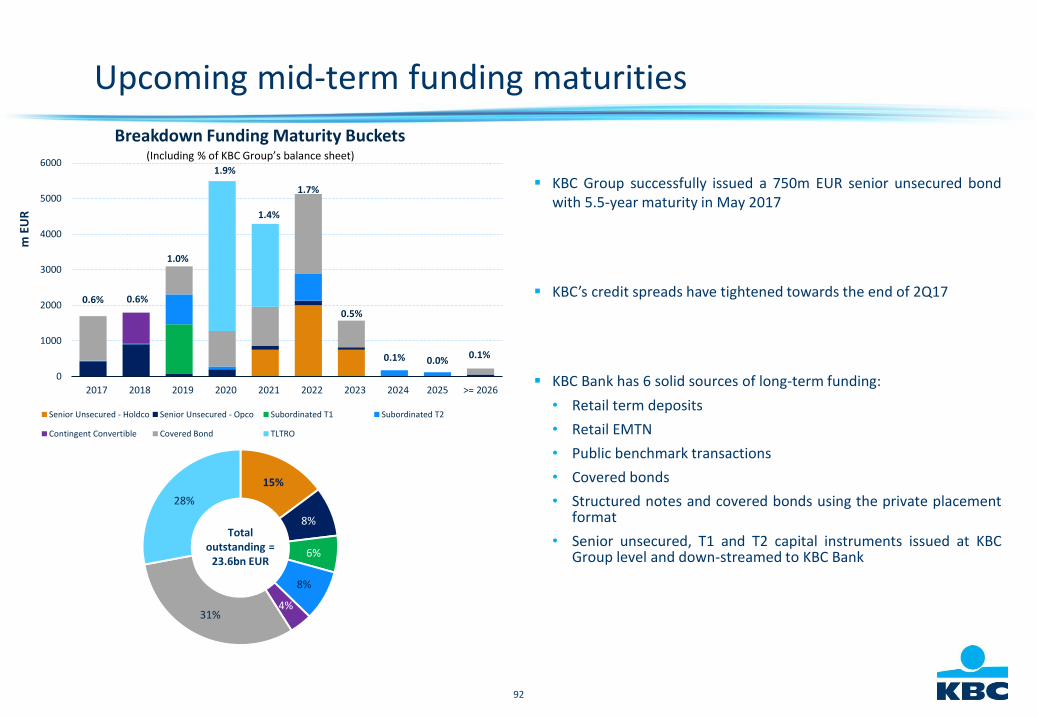
92
Upcoming mid-term funding maturities
KBC Group successfully issued a 750m EUR senior unsecured bondwith 5.5-year maturity in May 2017
KBC’s credit spreads have tightened towards the end of 2Q17
KBC Bank has 6 solid sources of long-term funding:
• Retail term deposits
• Retail EMTN
• Public benchmark transactions
• Covered bonds
• Structured notes and covered bonds using the private placementformat
• Senior unsecured, T1 and T2 capital instruments issued at KBCGroup level and down-streamed to KBC Bank
15%
8%
6%
8%
4%31%
28%
0.6% 0.6%
1.0%
1.9%
1.4%
1.7%
0.5%
0.1% 0.0%0.1%
0
1000
2000
3000
4000
5000
6000
2017 2018 2019 2020 2021 2022 2023 2024 2025 >= 2026
m E
UR
Breakdown Funding Maturity Buckets
Senior Unsecured - Holdco Senior Unsecured - Opco Subordinated T1 Subordinated T2
Contingent Convertible Covered Bond TLTRO
Total outstanding =
23.6bn EUR
(Including % of KBC Group’s balance sheet)
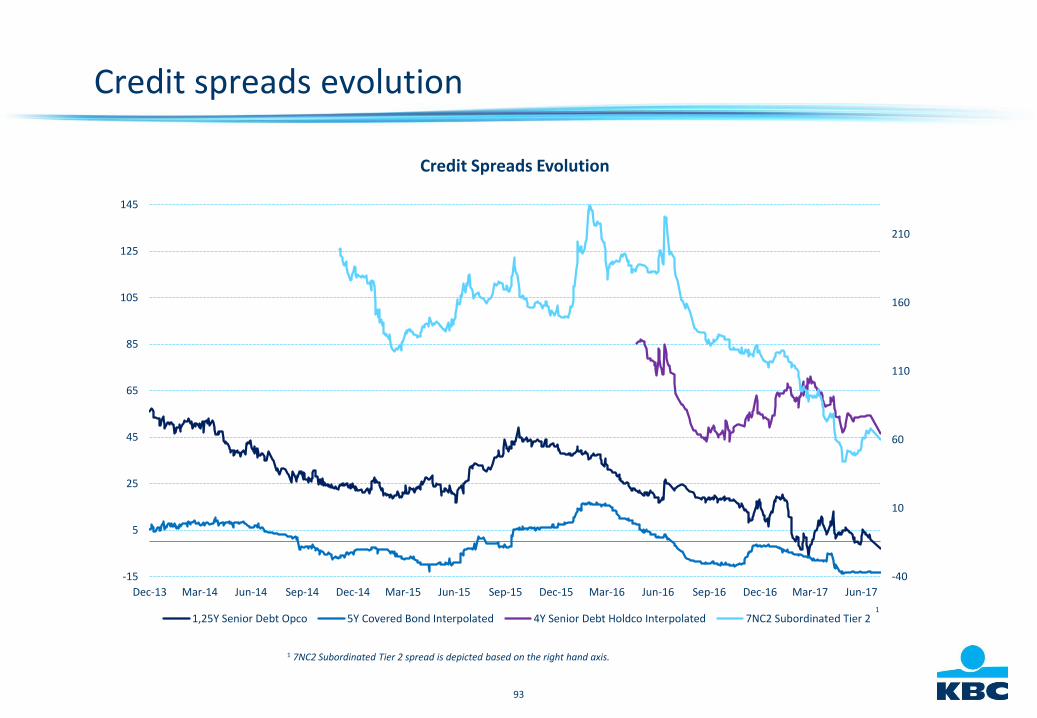
93
-40
10
60
110
160
210
-15
5
25
45
65
85
105
125
145
Dec-13 Mar-14 Jun-14 Sep-14 Dec-14 Mar-15 Jun-15 Sep-15 Dec-15 Mar-16 Jun-16 Sep-16 Dec-16 Mar-17 Jun-17
Credit Spreads Evolution
1,25Y Senior Debt Opco 5Y Covered Bond Interpolated 4Y Senior Debt Holdco Interpolated 7NC2 Subordinated Tier 2
Credit spreads evolution
1 7NC2 Subordinated Tier 2 spread is depicted based on the right hand axis.
1
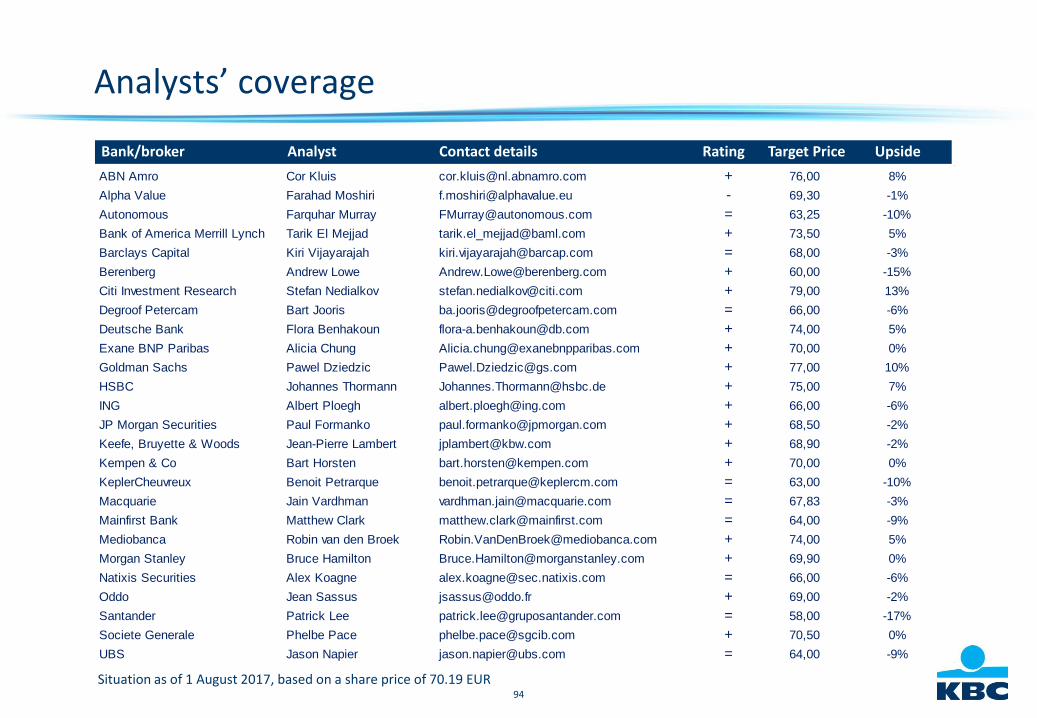
94
Analysts’ coverage
Bank/broker Analyst Contact details Rating Target Price Upside
Situation as of 1 August 2017, based on a share price of 70.19 EUR
ABN Amro Cor Kluis [email protected] + 76,00 8%
Alpha Value Farahad Moshiri [email protected] - 69,30 -1%
Autonomous Farquhar Murray [email protected] = 63,25 -10%
Bank of America Merrill Lynch Tarik El Mejjad [email protected] + 73,50 5%
Barclays Capital Kiri Vijayarajah [email protected] = 68,00 -3%
Berenberg Andrew Lowe [email protected] + 60,00 -15%
Citi Investment Research Stefan Nedialkov [email protected] + 79,00 13%
Degroof Petercam Bart Jooris [email protected] = 66,00 -6%
Deutsche Bank Flora Benhakoun [email protected] + 74,00 5%
Exane BNP Paribas Alicia Chung [email protected] + 70,00 0%
Goldman Sachs Pawel Dziedzic [email protected] + 77,00 10%
HSBC Johannes Thormann [email protected] + 75,00 7%
ING Albert Ploegh [email protected] + 66,00 -6%
JP Morgan Securities Paul Formanko [email protected] + 68,50 -2%
Keefe, Bruyette & Woods Jean-Pierre Lambert [email protected] + 68,90 -2%
Kempen & Co Bart Horsten [email protected] + 70,00 0%
KeplerCheuvreux Benoit Petrarque [email protected] = 63,00 -10%
Macquarie Jain Vardhman [email protected] = 67,83 -3%
Mainfirst Bank Matthew Clark [email protected] = 64,00 -9%
Mediobanca Robin van den Broek [email protected] + 74,00 5%
Morgan Stanley Bruce Hamilton [email protected] + 69,90 0%
Natixis Securities Alex Koagne [email protected] = 66,00 -6%
Oddo Jean Sassus [email protected] + 69,00 -2%
Santander Patrick Lee [email protected] = 58,00 -17%
Societe Generale Phelbe Pace [email protected] + 70,50 0%
UBS Jason Napier [email protected] = 64,00 -9%
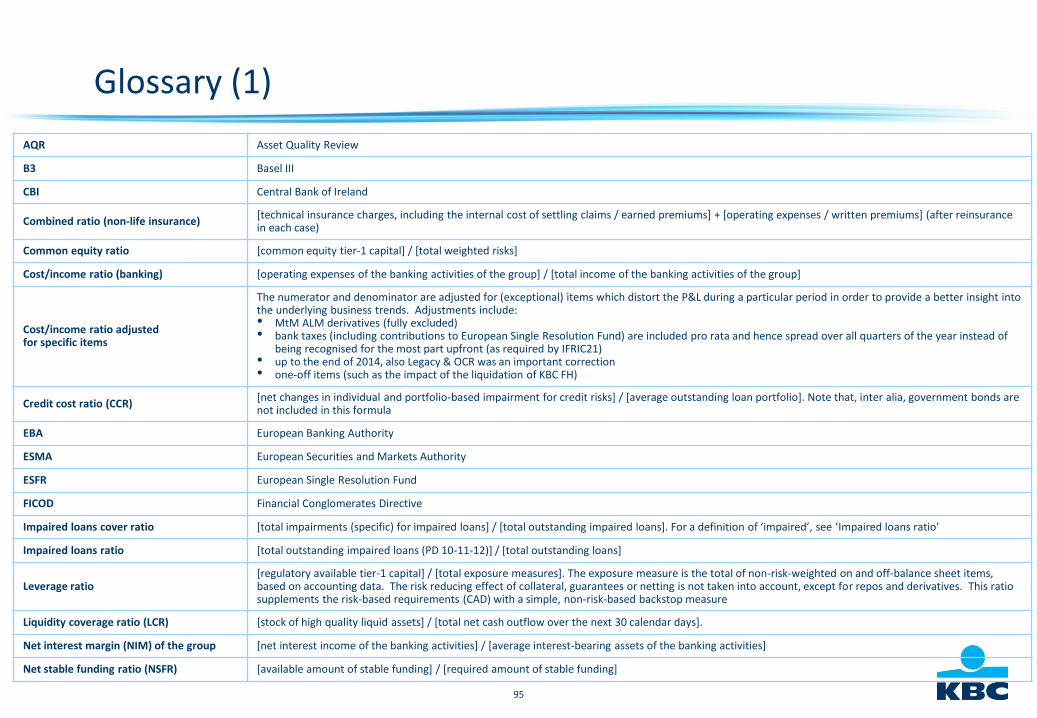
95
Glossary (1)
AQR Asset Quality Review
B3 Basel III
CBI Central Bank of Ireland
Combined ratio (non-life insurance)[technical insurance charges, including the internal cost of settling claims / earned premiums] + [operating expenses / written premiums] (after reinsurance in each case)
Common equity ratio [common equity tier-1 capital] / [total weighted risks]
Cost/income ratio (banking) [operating expenses of the banking activities of the group] / [total income of the banking activities of the group]
Cost/income ratio adjusted for specific items
The numerator and denominator are adjusted for (exceptional) items which distort the P&L during a particular period in order to provide a better insight into the underlying business trends. Adjustments include: • MtM ALM derivatives (fully excluded)• bank taxes (including contributions to European Single Resolution Fund) are included pro rata and hence spread over all quarters of the year instead of
being recognised for the most part upfront (as required by IFRIC21)• up to the end of 2014, also Legacy & OCR was an important correction• one-off items (such as the impact of the liquidation of KBC FH)
Credit cost ratio (CCR)[net changes in individual and portfolio-based impairment for credit risks] / [average outstanding loan portfolio]. Note that, inter alia, government bonds are not included in this formula
EBA European Banking Authority
ESMA European Securities and Markets Authority
ESFR European Single Resolution Fund
FICOD Financial Conglomerates Directive
Impaired loans cover ratio [total impairments (specific) for impaired loans] / [total outstanding impaired loans]. For a definition of ‘impaired’, see ‘Impaired loans ratio’
Impaired loans ratio [total outstanding impaired loans (PD 10-11-12)] / [total outstanding loans]
Leverage ratio[regulatory available tier-1 capital] / [total exposure measures]. The exposure measure is the total of non-risk-weighted on and off-balance sheet items, based on accounting data. The risk reducing effect of collateral, guarantees or netting is not taken into account, except for repos and derivatives. This ratio supplements the risk-based requirements (CAD) with a simple, non-risk-based backstop measure
Liquidity coverage ratio (LCR) [stock of high quality liquid assets] / [total net cash outflow over the next 30 calendar days].
Net interest margin (NIM) of the group [net interest income of the banking activities] / [average interest-bearing assets of the banking activities]
Net stable funding ratio (NSFR) [available amount of stable funding] / [required amount of stable funding]
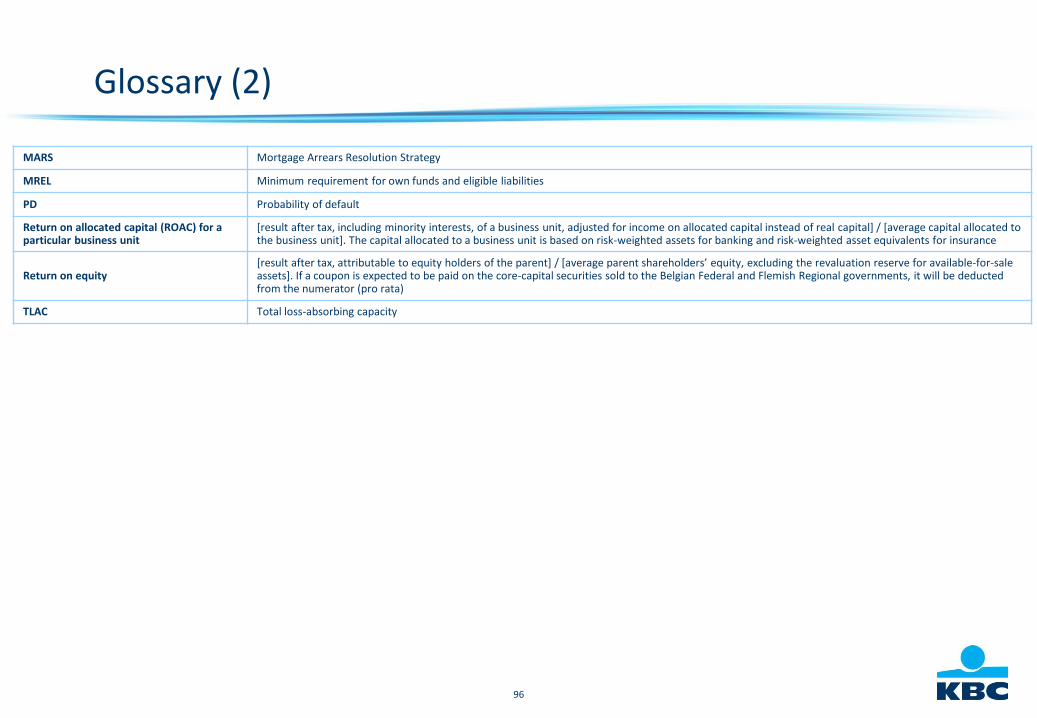
96
Glossary (2)
MARS Mortgage Arrears Resolution Strategy
MREL Minimum requirement for own funds and eligible liabilities
PD Probability of default
Return on allocated capital (ROAC) for a particular business unit
[result after tax, including minority interests, of a business unit, adjusted for income on allocated capital instead of real capital] / [average capital allocated to the business unit]. The capital allocated to a business unit is based on risk-weighted assets for banking and risk-weighted asset equivalents for insurance
Return on equity[result after tax, attributable to equity holders of the parent] / [average parent shareholders’ equity, excluding the revaluation reserve for available-for-sale assets]. If a coupon is expected to be paid on the core-capital securities sold to the Belgian Federal and Flemish Regional governments, it will be deducted from the numerator (pro rata)
TLAC Total loss-absorbing capacity
97
Contact informationInvestor Relations OfficeE-mail: [email protected]
www.kbc.comvisit for the latest update