Embed Size (px)
Citation preview

The Determinants of Detecting Veterinary Drugs Residues: Evidence from Shrimp Farmers
in Southern Viet Nam
Guenwoo Lee1, Aya Suzuki2, and Vu Hoang Nam3
Abstract While export-oriented shrimp farming has become an important source of income for
many small-scale farmers in developing countries, the rate at which products are rejected at the
ports of developed countries has remained high mainly due to the overuse of prohibited substances.
To reveal what determines the overuse of such substances, we interviewed 201 shrimp farmers in
Vietnam in 2015 and collected shrimp samples from each household’s pond for the screening of
residual drugs. These tests revealed that residual drugs exceeding acceptable limits by Japanese
standards were found in the samples of 40 farmers. We conducted cross-sectional Probit and Tobit
regressions to examine whether results of the residue tests are significantly associated with farmers’
characteristics and management practices. This study finds that: 1) receiving BMPs training and
keeping a record of shrimp seed have significant and positive effects on reducing residual drugs; 2)
risk aversion is positively and significantly related to residual drugs; 3) there is a positive
correlation between residual drugs and a dummy for time-inconsistent preferences of farmers; 4) if
farmers know multiple extension officers, these relationships have significant and positive effects
on reducing residual drugs; 5) farmers with experience of shrimp disease outbreaks reduce use of
antibiotics.
Keywords Better management practices, Shrimp aquaculture, Veterinary drug, Viet Nam
JEL Classification D80, Q01, Q12
1 Corresponding author: Department of International Studies, Graduate School of Frontier Sciences, University of Tokyo, Environmental Studies Building #706, 5-1-5 Kashiwanoha, Kashiwa-shi, Chiba-ken 277-8563 Phone: +81 80-4726-6874 email: [email protected] Department of International Studies, Graduate School of Frontier Sciences, University of Tokyo 3 Faculty of International Economics, Foreign Trade University
1

1. Introduction
The Food and Agriculture Organization of the United Nations (FAO) has released statistics showing
that developing countries account for about 78 percent of total shrimp exports (FAO, 2016). For
developing countries, intensive shrimp aquaculture is a profitable business, and a means of
acquiring foreign currency. The producing countries use veterinary medicinal drugs to mitigate the
risk of crop failures due to shrimp viral diseases, but such inputs contain substances harmful to the
human body such as chloramphenicol, enrofloxacin, ciprofloxacin, and oxytetracycline.
Accordingly, the EU, Japan, and the US, the major importers of shrimps, have been raising the
standards of quarantine inspections on shrimps from developing countries (UNIDO, 2013).
Unless the exporting countries can change the situation, the export volume of shrimps will
decline, and it is expected to hold back the economies of the producing countries (Suzuki & Vu,
2013; UNIDO, 2013). Further, another serious problem is the effect of waste water on the residents
in surrounding villages as farmers discharge water to canals (Dierberg & Kiattisimkul, 1996;
Jackson, Preston, & Thompson, 2004; Pham et al., 2010; Senarath & Visvanathan, 2001; Taya,
2003; Tzachi et al., 2004). According to Taya (2003), this is an important issue for village people
who use river water for domestic and agricultural purposes.
The difficulty in changing the situation lies in the fact that shrimps are mainly produced by
small-scale farmers in many of the Asian countries, except in the case of Indonesia. As the
producers are numerous and dispersed, it is hard to control their farming practices. Collectors, who
purchase shrimps from smallholders and sell to exporters, often mix shrimps from many farmers to
fill a container; this makes it even harder to trace the source of problems (Suzuki & Vu, 2016).
Shrimp aquaculture in Vietnam has been growing discernibly since the Doi Moi.1 Between
1986 and 2013, the country’s shrimp exports increased from 20 000 tons to 358 000 tons; in terms
of dollar value, it rose from $75 million to over $3 billion over the same period. This represents
nearly an 18-fold increase in volume and a 40-fold increase in monetary value, testifying to the
remarkable growth achieved by the Vietnamese shrimp industry (FAO, 2016). However, despite the
high growth, the port rejection rate, or the share of Vietnamese shrimps that are rejected at the ports
of importing countries, continues to grow, mainly due to the overuse of veterinary drugs (UNIDO,
2013).
To understand why this issue persists, we first need to understand what leads to the use of
these prohibited substances among small-scale producers. While there are studies examining the
determinants of chemical inputs in agriculture (such as Liu & Huang, 2013), empirical studies in an
aquaculture context are few and tend to rely on subjective data or use inappropriate methodologies.
1 Doi Moi is the Vietnamese for the English renovation. The economic reform of Viet Nam initiated in 1986 with the goal of creating a socialist-oriented market economy (World Library Foundation, n.d.).
2
Thus, we focus on a case of small-scale farmers in southern Vietnam and examine the determinants
of antibiotic use in shrimp farming.
We interviewed 201 shrimp farmers randomly selected from the population list in a district
in Ca Mau province in southern Vietnam in 2015 and collected shrimp samples from each
household’s pond for the screening of residual drugs. The drug residue tests were conducted in a
laboratory at Can Tho University in 2016. The tests revealed residual veterinary drugs exceeding
acceptable limits set by the Japan Ministry of Health, Labor and Welfare (MHLW) standard2 in 40
farmers’ shrimps. We also collected data on the farmers’ socio-economic characteristics, social
networks, farm characteristics, sales performance, risk and time preferences, and farming behaviors
by Better Management Practices (henceforth, BMPs). We conducted Probit and Tobit regressions
using cross-sectional data to examine whether results of the residue tests were significantly
associated with particular farmers’ characteristics and farm management practices, as mentioned
above.
This study finds that: 1) receiving BMPs training and keeping a record of shrimp seed have
significant and positive effects on reducing residual drugs; 2) risk aversion is positively and
significantly related to chloramphenicol and ciprofloxacin; 3) there is a positive correlation between
residual drugs and a dummy for time-inconsistent preferences of farmers; 4) if farmers know
multiple extension officers, these relationships have significant and positive effects on reducing
residual drugs; 5) farmers with experience of shrimp disease outbreaks reduce use of antibiotics,
which contain veterinary drugs because of distrust in the efficacy of these drugs. Our contribution is
threefold: 1) we found the above results using objective data on the use of prohibited substances
from farmers’ pond samples; 2) we showed that social networks and experience matter in the use of
these prohibited substances; and 3) we showed that psychological parameters such as time and risk
preferences matter in the veterinary drug residues.
The remainder of the paper proceeds as follows. Section 2 describes Vietnam’s shrimp
industry, the port rejection rates due to veterinary drug residues, and the BMPs. In Section 3, we
review relevant extant literature on veterinary substance abuse in Thailand, risk preferences and
pesticide use by cotton farmers in China, and the impact of BMPs on shrimp farming. Section 4
describes and explains the data used herein, presents summary statistics, and describes experimental
designs for eliciting farmers’ risk preferences and distinguishing hyperbolic consumers from other
survey respondents. Section 5 describes the estimation methods used, and the results are presented
in Section 6. Finally, Section 7 concludes the study.
2 If the MHLW detects an amount of oxytetracycline residue from shrimp samples above 0.2 ppm, they reject these shrimp imports. The MHLW rejects shrimp imports depending on the presence of chloramphenicol, enrofloxacin, and ciprofloxacin residues (The Japan Food Chemical Research Foundation, 2015).
3

2. Previous Literature and Hypotheses
2.1. Previous literature
Currently, there is a dearth of literature examining the determinants of chemical input use in
agriculture. Holmstrom et al. (2003) and Liu and Huang (2013) are most relevant to our study, and
thus are described below.
The closest comparator to this study is provided by Holmstrom et al. (2003), who conducted
interviews with shrimp farmers along the Thai coast in 2000. The interviews were based on a
questionnaire regarding management practices and the use of chemicals on farms. Their data reveals
that norfloxacin, oxytetracycline, and enrofloxacin are the antibiotics most widely used by Thai
shrimp farmers. A large proportion of shrimp farmers, 74 percent (56 out of 76 farmers), use those
antibiotics in pond management to prevent and treat shrimp diseases. Based on the interviews,
Holmstrom et al. (2003) find that farmers who have experienced shrimp disease outbreaks tend to
use greater quantities of antibiotics than farmers who are not experienced in this respect.
Furthermore, they find that the age of ponds is also associated with antibiotic use: older ponds were
at greater risk of disease outbreaks. In other words, farmers who have recently established farms are
less likely to use antibiotics than farmers who have longer-established farms, because they have a
lower risk of suffering from shrimp disease outbreaks. Also, they point out that 88 percent of the
farmers they interviewed used antibiotics simultaneously with probiotics. One interpretation of such
behavior is that a large number of farmers have insufficient or inaccurate information on the effects
of antibiotics and probiotics (Holmstrom et al., 2003). While this study exhibits similarities with our
aims and objectives, Holmstrom et al. (2003) do not employ inferential quantitative methods such
as regression analysis; they rely solely on farmers’ subjective answers to questions regarding the
use of antibiotics and pesticides. Thus, their answers may not generalize well beyond these
subjectively ascertained answers. By contrast, our study provides objective indicators for drug
residues.
Another important study in this domain is Liu and Huang (2013), which revealed a
relationship between Chinese cotton farmers’ risk preferences and pesticide use—to combat
Bacillus thuringiensis (Bt)—using primary data collected by the Center for Chinese Agricultural
Policy (CCAP) in four provinces (Shandong, Hebei, Henan, and Anhui) in 2006. These data consist
of detailed information about 320 farmers’ inputs to and outputs from cotton plots, experiences of
pesticide poisoning, and risk preferences. Their methodology was mainly based on the experimental
design of Tanaka, Camerer, and Nguyen (2010). Results therein revealed that more risk-averse
farmers applied greater amounts of pesticides in an effort to minimize infestation risks, while more
loss-averse farmers tended to use fewer pesticides. In terms of the latter group, the authors note that
loss aversion was conceptualized and characterized in terms of aversion to negative health impacts
4

incurred because of pesticide poisoning, rather than aversion to economic (cotton yield) losses (Liu
& Huang, 2013).
As shrimp farming is known for its environmental externalities, a guide for good
aquaculture practice, called better management practices (BMPs).3 The purpose of BMPs is to
improve farmers’ management practices, delivering increased profitability and environmental
performance through more efficient use of resources (Khiem et al., 2010; Mantingh and V.H., 2008;
NACA, 2006, UNIDO, 2013).
In particular, NACA has implemented BMPs in several countries, such as Indonesia,
Thailand, and Vietnam. According to NACA (2016), well-designed and -implemented BMPs
support smallholder shrimp aquaculture to 1) increase productivity by reducing the risk of shrimp
disease outbreaks, 2) mitigate the impacts of farming on the environment, 3) improve food safety
and the quality of shrimp farm products, and 4) improve the social benefits from shrimp farming
and its social acceptability and sustainability. BMPs are likely to play a significant role in
enhancing the quality of shrimp, as well as the welfare of farmers.
During the 2004 crop, NACA implemented a project to promote BMPs as a useful disease
control method in Vietnam—in Ca Mau, Nghe An, Ha Tinh, Quang Ninh, and Khanh Hoa
provinces. To promote BMPs to these pilot farming communities, they provided advice on pond
preparation, stocking practices, pond management, and health management for shrimp farmers and
distributed materials about BMPs to the farmers. Overall, pilot farmers accepted a solution for
shrimp health problems that involved no use of antibiotics or other chemicals. The farmers also
recognized the importance of keeping records on management practices and started to keep records
concerning water quality and shrimp health status (NACA, 2006). NACA’s analysis shows the
differences between the shrimp mortality experiences of pilot farmers who followed BMPs and the
experiences of a comparison (control) group during the production cycle. Their results reveal that
the application of BMPs by farmers significantly decreases shrimp mortality, and that pilot farmers’
productivities are considerably higher than farmers who do not follow BMPs (NACA, 2006).
In summary, these studies point out that the use of chemicals seems to correlate with
farmers’ prior experiences of shrimp disease outbreaks, the age of shrimp ponds, risk and time
preferences of famers, and experience of BMPs training.
2.2. Hypotheses
Based on the previous studies, we specify the following hypotheses.
Hypothesis 1:
3 BMPs was developed by the international community, spearheaded by the World Bank, the Network of Aquaculture Centers in Asia-Pacific (NACA), the World Wildlife Fund (WWF), FAO, and the United Nations Environment Program (UNEP) (NACA, 2006).
5

The adoption of BMPs decreases farmers’ use of antibiotics, because farmers who follow BMPs can
control shrimp diseases without antibiotics.
Hypothesis 2:
More risk-averse farmers will use greater amounts of antibiotics in their ponds to minimize the risk
of shrimp mortality.
Hypothesis 3:
Farmers with inconsistent time preferences (“hyperbolic consumers,” as explained below) will
overuse antibiotics because they tend to buy on impulse.
Hypothesis 4:
Farmers who know more extension officers or more shrimp input sellers will not use products that
contain prohibited elements because they are able to get more and various information on products
from multiple sources.
As mentioned in Section 4, residual quantities of four substances form the basis of our
hypothesis testing, i.e., chloramphenicol, enrofloxacin, ciprofloxacin, and oxytetracycline. 4
3. Study Context, Data, and Summary Statistics
3.1. Vietnamese shrimp industry and port rejection rates
Since market liberalization, the Vietnamese government has fostered a more strategic approach to
shrimp aquaculture. Consequently, in 2013, Vietnam was ranked as the largest exporter of shrimp in
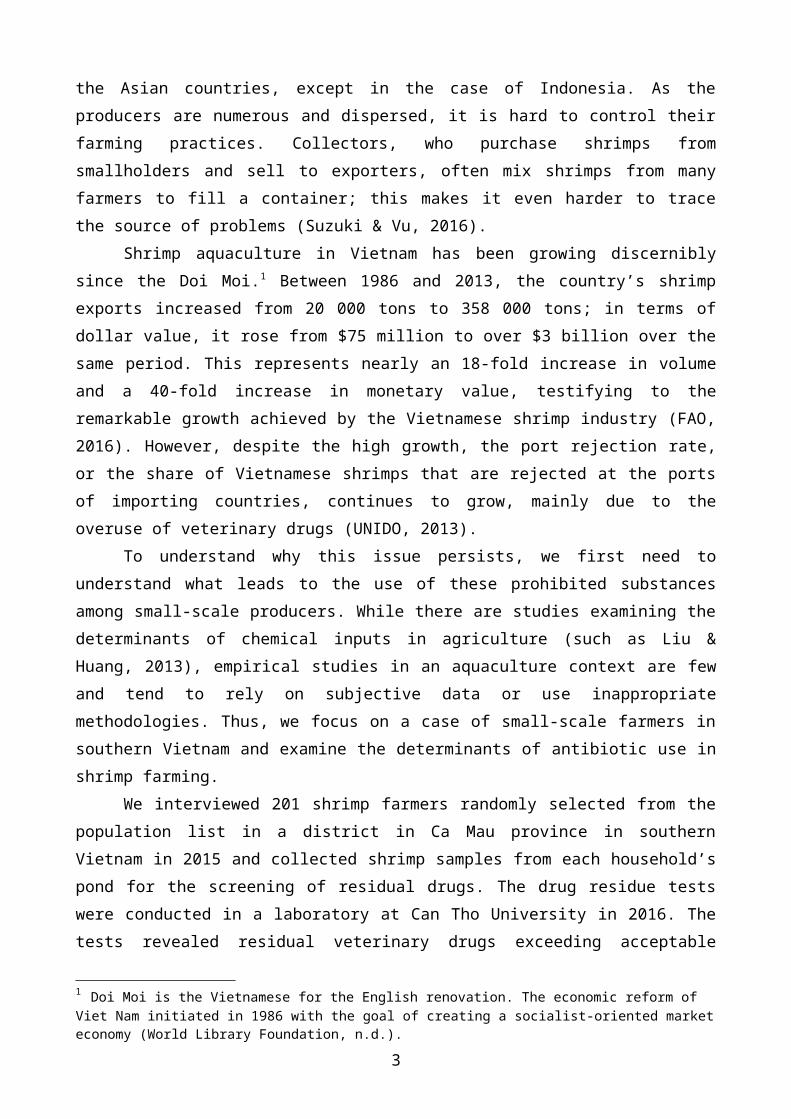
the world (UNIDO, 2013; FAO, 2016). Figure 1 shows the trend in the country’s shrimp exports
between 1990 and 2013. During this period, Vietnamese shrimp exports increased from 20 000 tons
to 358 000 tons. This represents nearly an 18-fold increase in volume, and shrimp farming has
become a multi-billion-dollar industry.
According to the United Nations Industrial Development Organization (UNIDO) (2013), the
Vietnamese fish and fishery products are rejected the most at the ports of Japan relative to those
from other countries between 2006 and 2010.5 The reasons for the port rejections of Vietnamese
fish and fishery products are shown in Table 1. In terms of veterinary drug residues in products
between 2006 and 2010, Japan, the EU, and the US rejected imports of Vietnamese fish and fishery
products 297, 172, and 170 times, respectively. The number of rejected cases by Japan due to drug
residues represents more than half of all import rejections of these products at the Japanese border,
and the number of rejected cases by the EU due to the same reason represents about 40 percent of
the EU’s total rejections of fish and fishery products. The rejection rate due to veterinary drug
4 The residual drugs may come from different sources such as antibiotics, industrial feeds, shrimp seeds, and so on. Therefore, it is possible to detect these residuals even if farmers do not use antibiotics.5 Between 2006 and 2010, average rejection rates of Vietnamese fish and fishery products rank 9th in the EU, 6th in the US, and 10th in the Australia, respectively.
6

residues at the US border is relatively small compared to Japan and the EU. Regarding quantity, the
Vietnamese shrimp industry has unequivocally grown, yet it appears that a number of problems
remain, such as veterinary drug residues, that diminish the quality profile of this growth.
3.2. Shrimp survey
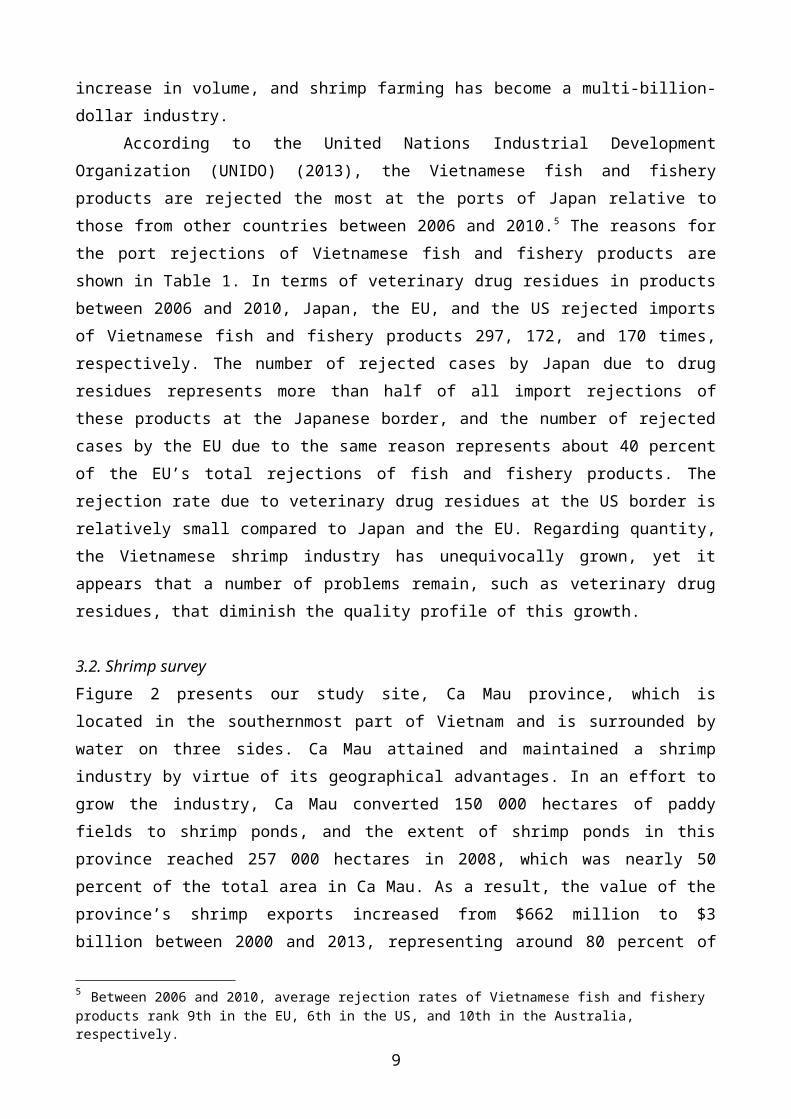
Figure 2 presents our study site, Ca Mau province, which is located in the southernmost part of
Vietnam and is surrounded by water on three sides. Ca Mau attained and maintained a shrimp
industry by virtue of its geographical advantages. In an effort to grow the industry, Ca Mau
converted 150 000 hectares of paddy fields to shrimp ponds, and the extent of shrimp ponds in this
province reached 257 000 hectares in 2008, which was nearly 50 percent of the total area in Ca
Mau. As a result, the value of the province’s shrimp exports increased from $662 million to $3
billion between 2000 and 2013, representing around 80 percent of Vietnam’s total shrimp exports
(Ngo, 2011; Ca Mau Province, 2008).
To examine the determinants of antibiotic use by shrimp farmers in Vietnam, we conducted
a household survey in Ca Mau province in 2015, collecting information from 201 households.6
Concomitantly, shrimp samples were taken from the ponds of these 201 households and screened
for residual antibiotics. The respondents were chosen randomly among shrimp farmers on
population lists that were obtained from the Ca Mau provincial government. The data include
information on farmers’ social networks, farm characteristics, sales performance, and behavior
regarding BMPs, as well as their socio-economic characteristics. The cornerstone of these data is
the results from laboratory tests for antibiotic residues. We chose four substances for the purposes
of drug residue testing: chloramphenicol, enrofloxacin, ciprofloxacin, and oxytetracycline.7 The
tests were conducted in the food safety laboratory of the Department of Aquatic Nutrition and
Product Processing in the College of Aquaculture and Fisheries, Can Tho University. Shrimp
samples were collected directly from farmers’ ponds by university staff and transported in ice-cold
storage boxes. Residues were analyzed using liquid chromatography–mass spectrometry (LCMS).
The results revealed that chloramphenicol, enrofloxacin, ciprofloxacin, and oxytetracycline were
indeed detected in the shrimp produced by 13 households, 22 households, 15 households, and 11
households, respectively. Specifically, and importantly, substances found in 40 samples exceeded
amounts allowed by the MHLW standard, as shown in Table 2.
Table 3 summarizes respondents’ socio-economic characteristics, farm characteristics, and
sales performance. The average age of interviewees is about 50 years old, and most of them are
male. On average, they have completed eight years of formal school education and resided for 45 6 This survey was granted permission by Ca Mau Department of Agriculture and Rural Development.7 This was based on advice from industry experts, as these are the most frequently tested and detected substances at the ports of developed countries.
7

years in each commune. While the detection group’s shrimp farmland is approximately 0.29
hectares larger than that of the non-detection group, the revenue of the non-detection group
averages 688 million VND (Vietnamese dong) more than that of the detection group. This
difference between both groups’ incomes seems to be due to shrimp mortality. Significant
differences are found in shrimp farming experience, and in the cost of shrimp feed, both of which
are higher (lower) in the detection (non-detection) group.
Table 4 illustrates respondents’ social network characteristics and their behaviors regarding
BMPs. The farmers in the non-detection group know more buyers, seed sellers, and input sellers
than do farmers in the detection group, and 73 percent of the farmers in the non-detection group
answered that they had received BMPs training. This is about 13 percent higher than the detection
group; however, these differences between the two groups are not statistically significant. Nearly 85
percent of farmers in both groups do not know the exact names of prohibited elements and which
inputs contain these elements.
Lastly, Table 5 describes the informants whom respondents rely on to obtain information on
shrimp cultivation technologies and shrimp disease control; in each case respondents were
permitted to select only one answer. Regarding shrimp cultivation technology, 92 percent of all
respondents stated that they obtained information from their friends, with only 3 percent of
respondents depending on extension officers. Concerning shrimp disease treatment information,
most people also responded that they acquired this information from their friends. However, the
number of respondents depending on extension officers in this respect increased 11 percent
compared to the previous question. Furthermore, we observed a difference between the two groups
in terms of the degree of reliance on extension agents to obtain information. For both shrimp
cultivation and treatment of diseases, the share of farmers relying on extension officers is higher for
the undetected group.
3.3. Risk preferences
Several studies posit that farmers’ risk preferences play a significant role in agricultural decision-
making (Feder, 1980; Just et al., 1983; Liu & Huang, 2013). Liu and Huang (2013) empirically test
the correlation between Chinese cotton farmers’ risk preferences and pesticide use (to combat Bt)
and find that more risk-averse farmers use greater quantities of pesticides. Based on their findings,
we assume that shrimp farmers’ risk preferences have significant effects on the use of veterinary
drugs.
To elicit individual risk preferences, either prospect theory (henceforth, PT) or expected
utility theory (henceforth, EUT) approaches can be employed. PT adopts three parameters, such as
risk aversion, loss aversion, and nonlinear probability weighting, for determining the shape of the
8
utility function. On the other hand, EUT uses risk aversion as the sole parameter. Agricultural
economists have debated which theory is most suitable to capture farmers’ risk preferences
(Kahneman & Tversky, 1979; Liu & Huang, 2013; Moscardi & Janvry, 1977; Tanaka et al., 2010).
This study adopts Suzuki’s approach, which follows EUT instead of PT, favoring the simplicity of
this method to elicit individual risk preferences in order to create risk-aversion indices for farmers
(Suzuki, 2015).
Each farmer’s risk-aversion index is based on the results of a survey-based risk preference
game (see Table 6). This risk preference game has six stages and two options, namely, projects A
and B, with different probabilities of receiving prizes. To elaborate, farmers who choose project A,
definitely win (100 percent chance) a prize at each stage, while if farmers select project B, they
have a fifty-fifty chance of winning the reward. Apart from stage six, the amount of the prize
associated with project B is higher than project A, but the risk is also higher. Because their
decisions are considered irrational, we drop those observations where project B is chosen in stage 6.
The risk-averse index, then, is as follows:
σ=∑s=1
n
V s (1)
where s denotes each stage of the risk preference game; V s equals 1 if project A is chosen at stage s,
and zero otherwise; and σ is the risk-averse index. The index ranges from 1 (least risk-averse) to 6
(very risk-averse). Table 3 indicates that farmers in the non-detection group have lower risk-averse
indexes σ than the detection group. In other words, it appears that farmers in the detection group
tend to avoid risks more than do the non-detection group. However, this difference between the two
groups is not statistically significant.
3.4. Hyperbolic discounting
Hyperbolic discounting has an advantage in terms of explaining an individual’s time-inconsistent
preferences (Ainslie, 1996). For that reason, the number of studies that adopt hyperbolic
discounting functions is increasing (Angeletos et al., 2001; Kubota & Fukushige, 2009; Laibson,
1996; Morimoto, 2009). Furthermore, Morimoto (2009) identified differences between hyperbolic
consumers (time inconsistency) and non-hyperbolic consumers (time consistency) vis-à-vis
spending behavior, using panel data from a household survey in Japan. According to Morimoto
(2009), the hyperbolic consumer is inclined to spend money on impulse even if s/he has a saving
plan for the future. On the other hand, non-hyperbolic consumers are more likely to adhere to
9

personal spending plans and saving schemes.
To demarcate hyperbolic consumers, we tested respondents using a time preference game
(see Table 7). This game has ten stages in two series and two options—project A and B—associated
with different paydays and different amounts of money. In series 1, a player who chooses project A
receives an immediate prize in each stage. If the player prefers project B, the award is paid three
months from now. Overall, the amount of money associated with project B is higher than project A.
Series 2 has the same conditions as series 1. Because their choices are considered irrational, we
dropped the observations who switched to project A. Based on the results of this game, we use a
dummy variable for indicating whether a farmer is a hyperbolic consumer or not as follows:
λ={1if U (a )U (b )
<U (c )U ( d )
¿0 otherwise(2)
where U (a )/U (b ) is a discount factor for series 1; U (a )/U (b ) is a discount factor for series 2;λis the
hyperbolic consumer dummy, equal to one if series 2’s discount factor is greater than series 1’s and
0 otherwise. Table 3 shows that 53 percent of the farmers are hyperbolic consumers. Among the
detection group, this is about 8 percent higher, although the difference between the two groups is
not statistically significant.
4. Empirical Strategy
Using the combined data from the household survey and the screenings for residual antibiotics, we
first evaluate the average marginal probability effects (AMPE) in the Probit model to test the
hypotheses stated above:
Pr (Y ijk=1 )=β0+ β1 SC ijk+β2 FPijk+β3 BMPijk+ β4 SN ijk+β5 σ i+β6 λi+μk+εijk (3)
where i denotes individual, j denotes veterinary drug, and k denotes commune; Y j is the detection
dummy for each veterinary drug j (chloramphenicol, enrofloxacin, ciprofloxacin, and
oxytetracycline) equal to one where a sample is found to contain more than the MHLW permissible
amount of that antibiotic and 0 otherwise; SC captures individual i’s socio-economic characteristics
and FP is individual i’s farming characteristics and sales performance relevant to the abuse of
antibiotic j; BMP is a dummy variable set for BMPs; SN refers to individual i’s social network
10

characteristics, such as how many shrimp input sellers and extension officers individual i knows; σ is the risk-averse index of individual i; λis the hyperbolic consumer dummy variable; μk is
commune fixed effect; and ε ijkis the error term.
Next, equations (4) and (6) are estimated using the Tobit model, because our dependent
variable is a mixture of observations with zero and positive values (Cameron & Trivedi, 2010).
Among the four substances tested, for three (i.e., chloramphenicol, enrofloxacin, and ciprofloxacin),
any amount detected is subject to rejection, while for oxytetracycline there is a threshold for
rejection set by the MHLW. We therefore created an index that shows the total number of
substances detected, and also used the quantity of oxytetracycline as dependent variables. The
regressions are as follows:
∑j=1
n
Y ijk=β0+β1 SCijk+ β2 FPijk+β3 BMPijk+β4 SN ijk+β5σ i+ β6 λ i+μk+εijk (4)
Y iok=β0+ β1 SC iok+β2 FPiok+ β3 BMPiok+β4 SN iok+β5 σ i+β6 λ i+μk+εiok (5)
where o denotes oxytetracycline; ∑j=1
n
Y ijk is the total number of substances detected—for example, if
two of the four drugs are detected, the value is two—the variable’s minimum (maximum) value is zero (four); and Y iok denotes the amount of oxytetracycline residue—if the substance is not detected
the value is zero parts per billion (ppb).
5. Estimation Results
We evaluate AMPE in the Probit model to examine the determinants of chloramphenicol,
enrofloxacin, ciprofloxacin, and oxytetracycline residues. The AMPE results shown in most
columns in Table 8 indicate that the probability of drug residues, except oxytetracycline, increases
as the age of respondents increases. The results in column (5) show that the probability of
oxytetracycline residue decreases as the years of shrimp farming increase. The BMPs training
dummy indicates a negative and significant impact on both chloramphenicol and enrofloxacin
residues: receiving this training decreases the probability of detecting any drug residues by 11
percent. Where farmers are networked with extension officers, the probability of detecting any drug
residue decreases by 7 percent and, again, this decrease is statistically significant. These results
support hypotheses 1 and 4. The risk aversion and hyperbolic consumer coefficients are positive
and significant in different substances. These results thus support hypotheses 2 and 3.
11

Tables 9 and 10 show the results from estimating the Tobit model in terms of equations (4)
and (5), respectively. The total number of elements detected is the dependent variable in Table 9.
The amount of oxytetracycline residue is explained by independent variables in Table 10.
Depending on the model, both tables include different explanatory variables as listed below.
Column (1) includes variables for individual i’s socio-economic characteristics, farm
characteristics, and sales performance, but excludes the dummy set for BMPs, risk-aversion index,
hyperbolic consumer dummy, and individual i’s social network features. Column (2) excludes the
risk-aversion index, hyperbolic consumer dummy, and individual i’s social network features.
Column (3) excludes individual i’s social network characteristics only. The models in columns
(4) contain all of the variables in equations (2) and (3).
In Table 9, the Tobit results shown in all columns confirm that the sum of detected
veterinary drugs increases as the age of respondents increases. The dummy variables pertaining to
receiving BMPs training and keeping records of seed use are statistically significant in most models
and decrease the sum of detected veterinary drugs substantively. This result directly supports
hypothesis 1. On the other hand, the results concerning the recording of input use are opposite to the
results just described, despite this representing one of the BMPs. Both risk aversion and hyperbolic
consumer variables are insignificant.
Table 10 indicates that prior experience of shrimp disease outbreaks decreases the amount of
oxytetracycline residue significantly. The BMPs training dummy is significant in column (4) only.
Keeping records of seed use, one of the BMPs, has a significant and negative impact on the quantity
of oxytetracycline residue. Keeping records of input use shows opposite results compared to
keeping records of seed use, despite them both being BMPs.
6. Conclusion
Solving problems arising from veterinary drug residues is considered an important strategy to
improve both shrimp producers’ welfare and food safety for consumers. To optimize appropriate
intervention strategies, determinants of drug use should be identified, and the impact of existing
management efforts should be measured. Although many shrimp-exporting and -importing
countries have maintained interest in this issue, few studies have attempted to quantitatively
examine these determinants or estimate these impacts.
Therefore, we conducted a survey to collect information from 201 farmers in Vietnam.
Based on regression analyses of these data we note that: 1) receiving BMPs training and keeping
records of shrimp seed had positive, significant effects on reducing veterinary drug residues; 2) risk
aversion is positively and significantly related to chloramphenicol and ciprofloxacin; 3) there is a
positive correlation between residual drugs and a dummy for time-inconsistent preferences of
12

farmers; and 4) where farmers are networked with extension officers this has a significant and
positive effect on preventing use of prohibited substances. Unlike the study of Holmstrom et al.
(2003), our results suggest that farmers with prior experience of shrimp disease outbreaks use
smaller quantities of antibiotics. Therefore, arguably, farmers distrust the efficacy of antibiotics
because prior experience of using these drugs did not reduce shrimp mortality as expected. Overall,
this study contributes to revealing the determinants of detecting veterinary drugs residues in shrimp
farming in multiple (social, economic, psychological) dimensions.
Further, almost all the farmers in our sample did not know the exact names of elements that
are prohibited, or which inputs contain these elements. Judging from these findings, it can be
presumed that farmers’ lack of knowledge about antibiotics led to an increase in veterinary drug use
despite the fact that the farmers had kept records of input use.
Based on our findings, we suggest that BMPs are likely to play significant roles in reducing
port rejections arising from the presence of veterinary drug residues. Thus, a way of spreading the
effects of BMPs training to other farmers who do not currently receive this training should be
considered. This is likely to decrease farmers’ use of veterinary drugs. Moreover, we propose that
efforts to improve producers’ knowledge about antibiotics and chemicals is necessary to decrease
port rejection rates given the results herein concerning inadequate knowledge. Taken together,
optimizing management interventions will enhance the economic and environmental sustainability
of shrimp farming.
13

References
Ainslie, G. (1996). Breakdown of Will. Cambridge: Cambridge University Press.
Angeletos, G., Laibson, D., Repetto, A., Tobacman, J., & Weinberg, S. (2001). The Hyperbolic
Consumption Model: Calibration, Simulation, and Empirical, Evaluation. Journal of
Economic Perspectives, pp. 47-68.
Ca Mau Province. (2008). Ca Mau Portal. Retrieved November 25, 2016, from
http://www.camau.gov.vn/wps/portal/camauportal
Cameron, C. A., & Trivedi, P. (2010). Microeconimetrics Usin Stata, Revised Edition. Texas: Stata
Press.
Dierberg, F., & Kiattisimkul, W. (1996). Impacts and Implications of Shrimp Aquaculture in
Thailand. Environmental Management, 20, 649-666.
FAO. (2016). Fishery commodities global production and trade (online query). Retrieved 11 21,
2016, from http://www.fao.org/fishery/statistics/global-commodities-production/query/en
Feder, G. (1980). Farm Size, Risk Aversion and the Adoption of new Technology under
Uncertainty. Oxford Economic Papers(30(2)), pp. 263-283.
Holmstrom, K., Graslund, S., Wahlstrom, A., Poungshompoo, S., Bengtsson, B.-E., & Kautsky, N.
(2003). Antibiotic Use in Shrimp Farming and Implications for Environmental Impacts and
Human Health. International Journal of Food Science and Technology, 38, 255-266.
Jackson, C., Preston, N., & Thompson, P. (2004). Intake and Discharge Nutrient Loads at Three
Intensive Shrimp Farms. Aquaculture Research, 35, 1053-1061.
Just, E. R., Zilberman, D., & Hochman, E. (1983). Estimation of Multicrop Production Functions.
American Journal o Agricultural Economics(65 (4)), pp. 770-780.
Kahneman, D., & Tversky, A. (1979). Prospect Theory: An Analysis of Decision under Risk.
Econometrica, 47, pp. 263-292.
Khiem, N., Simon , B. R., Nguyen, M., & Vo, T. (2010). Upgrading Small-Holders in the
Vietnamese Pangasius Value Chain (Odi Grant Number Ro334).
Kubota, K., & Fukushige, M. (2009). Rational Consumers. Discussion Paper.
Laibson , D. I. (1996). Hyperbolic Discount Function, Undersaving, and Savings Policy. NBER
Working Paper Series(5635).
Liu, E. M., & Huang, J. (2013). Risk Preferences and Pesticide Use by Cotton Farmers in China.
Journal of Development Economics, 202-215.
14

Mantingh, I., & V.H., N. (2008). Pre-Assessment of Pangasius Sector: Toward Sustainability.
Report commissioned by the Dutch Ministry of Agriculture.
Morimoto, S. (2009). Hyperbolic Discounting and Household Consumption: an Analysis based on a
Large-scale Survey in Japan. Behavioral Economics(2), pp. 49-59.
Moscardi, E., & Janvry, A. (1977). Attitudes toward Risk among Peasants: An Econometric
Approach. American Journal of Agricultural Economics(59 (4)), pp. 710-716.
NACA. (2006). Reducing the Risk of Aquatic Animal Disease Outbreaks and Improving
Environmental Management o Coastal Aquaculture in Viet Nam. Final report of the
NACA/SUMA projects FSPS I .
NCAA. (2016). Better Management Practices for Shrimp Aquaculture. Retrieved November 23,
2016, from http://www.enaca.org/modules/cms/start.php?tag_id=24
Ngo, T. (2011). From Rice to Shrimp: Ecological Change and Human Adaptation in the Mekong
Delta of Vietnam. In M. A. Stewart, & C. P. A. (Eds.), Environmental Change and
Agricultural Sustainability in the Mekong Delta (pp. pp 271-285). New York: Springer
Science+Business Media .
Pham, T., Kroeze, C., Bush, S., & Mol, A. (2010). Water Pollution by Intensive Brackish Shrimp
Farming in South-east Vietnam: Causes and Options for Control. Agricultural Water
Management.
Sebora, T. C., & Cornwall, J. R. (1995). Expected Utility Theory Vs. Prospect Theory: Implications
for Strategic Decision Makers. Journal of Manageraial Issues, pp. 41-61.
Senarath, U., & Visvanathan, C. (2001). ENvironmantal Issues in Brackish Water Shrimp
Aquaculture in Sri Lanka. Environmental Management, 27, 335-348.
Suzuki, A. (2015). Risk on Dynamic Behavior of Farmers in the Export Market: A Case from the
Pineapple Industry in Ghana. 2014 AAEA Annual Meeting . Minneapolis: The Agricultural
& Applied Economics Association.
Suzuki, A., & Vu, H. (2016, March). Food Quality Awareness: Cases from Shrimp Producers in
Thailand and Vegetable Producers in Vietnam. IDE Discussion Paper, 569.
Suzuki, A., & Vu, H. N. (2013, March). Status and Constraints of Costly Port Rejection: A Case
from the Vietnamese Frozen Seafood Export Industry. IDE discussion paper, 395.
Tanaka, T., Camerer, F. C., & Nguyen, Q. (2010). Risk and Time Preferences: Linking
Experimental and Household Survey Data from Vietnam. American Economic Review(100
(1)), pp. 557-571.
Taya, K. (2003). Asia No Ebi Youshoku to Boueki (Shrimp Aquaculture and Trade in Asia) (in
Japanese). Tokyo: Seizando.
15

The Japan Food Chemical Research Foundation. (2015, February 20). The MHLW Administrative
Information. Retrieved November 28, 2016, from
http://www.ffcr.or.jp/zaidan/MHWinfo.nsf/ab440e922b7f68e2492565a700176026/7f4e59f6
35ff2d0149257df20019b161?OpenDocument
Tzachi, M., Lopez, I., Jones, E., Jackson, S., & Lawrence, A. (2004). Characterization of Intake and
Effluent Waters from Intensive and Semi-intensive Shrimp Farms in Texas. Aquaculture
Research, 35, 321-339.
UNIDO. (2013). Meeting Standards, Winning Markets Regional Trade Standards Compliance
Report East Asia 2013. Vienna: United Nations Industrial Development Organization.
Viet Nam News. (2014, April 30). Japan may stop Vietnamese shrimp imports. Retrieved
November 22, 2016, from http://vietnamnews.vn/economy/254296/japan-may-stop-
vietnamese-shrimp-imports.html#9G8TwP7KTDFmCdrg.97
World Library Foundation. (n.d.). Đổi Mới. Retrieved March 14, 2017, from Project Gutenberg
Self-Publishing Press: http://self.gutenberg.org/articles/eng/Đổi_Mới?View=embedded's,
%20newfoundland%20and%20labrador#1970s
16

Table 1. Reasons for Import Rejection of Vietnamese Fish and Fishery Products
between 2006 and 2010
Japan EUUnited
States
Bacterial contamination 145 127 961
Other contaminants 1 24 209
Additives 32 33 120
Pesticide residues 50 4 0
Adulteration/ missing document 0 7 103
Hygienic condition/ controls 23 20 981
Mycotoxins 7 0 -
Packaging 2 2 0
Veterinary drug residues 297 172 170
Labelling 0 2 349
Heavy metals 0 61 0
Others 6 6 21
Other microbiological contaminants 0 26 -
Total 563 484 2914
Source: UNIDO dataset and analysis, based on EU RASFF, US OASIS,
AQUIS, and Japanese MHLW data
Table 2. The Veterinary Drug Residue Testing Results
Substances Undetected Share Detected Share
Veterinary drug 161 80% 40 20%
Chloramphenicol (CML) 188 94% 13 6%
Ciprofloxacin (CIPRO) 186 93% 15 7%
Enrofloxacin (ENR) 179 89% 22 11%
Oxytetracycline (OTC) 190 95% 11 5%
Source: From own survey
17

Table 3. Socio-economic and Farm Characteristics, and Sales Performance
(a) Undetected (b) Detected Dif.
Variable Unit Obs Mean Obs Mean (a) - (b)
Socio-economic Characteristics
Gender Female=0 161 0.94 40 0.93 0.01
Male=1 [0.24] [0.27] (0.04)
Age Years 161 49.78 40 52.90 -3.12
[12.31] [10.75] (2.12)
Education Years 153 7.87 37 7.70 0.17
[2.83] [3.21] (0.53)
Can read in English No=0 161 0.01 40 0.00 0.01
Yes=1 [0.08] [0.00] (0.01)
Non-farm activities No=0 161 0.16 40 0.10 0.06
Yes=1 [0.36] [0.30] (0.06)
σ (Risk aversion) Index 147 5.47 35 5.77 -0.30
[1.20] [0.69] (0.21)
λ (HC) No=0 161 0.53 40 0.45 0.08
Yes=1 [0.50] [0.50] (0.09)
Farm & Sales Performance
Shrimp farming experience Years 160 7.95 40 5.48 2.47**
[7.41] [4.72] (1.23)
Total farm land ha 161 1.33 40 1.48 -0.14
[1.66] [1.83] (0.30)
Shrimp farm size ha 161 1.16 40 1.45 -0.29
[1.53] [1.85] (0.28)
# of ponds Number 161 2.73 40 2.80 -0.07
[2.23] [1.59] (0.37)
18

Shrimp seed density Piece/m2 150 79.70 37 80.89 -1.19
[90.01] [88.44] (16.29)
Shrimp seed price VND/piece 151 95.88 38 96.45 -0.57
[18.75] [10.41] (3.16)
Cost of shrimp seed Million VND 160 157.00 39 139.00 18.00
[263.00] [189.00] (447.28)
Cost of shrimp feed Million VND 161 838.00 40 289.00 549*
[1850.00] [304.00] (294.00)
Cost of permanent labors Million VND 161 21.30 40 15.90 5.47
[53.40] [48.30] (9.26)
Cost of casual labors Million VND 161 9.61 40 5.63 3.98
[29.30] [19.60] (4.89)
Revenue Million VND 161 1840.00 40 1150.00 688.00
[10700.00] [2480.00] (1710.00)
Notes: Standard deviations are reported in brackets. Standard errors are reported in parentheses. * significant at
10%; ** significant at 5%; *** significant at 1%.
Table 4. Social Network Characteristics and Better Management Practices
(a) Undetected (b) Detected Dif.
Variable Unit Obs Mean Obs Mean (a) - (b)
Social Network
# of shrimp buyers Number 161 7.80 40 6.18 1.62
[6.53] [6.28] (1.14)
# of shrimp seed sellers Number 161 4.82 39 4.05 0.77
[6.09] [3.78] (1.02)
# of shrimp input sellers Number 161 4.39 39 4.03 0.36
[6.10] [3.87] (1.03)
Better Management Practices
BMPs training No=0 161 0.73 40 0.60 0.13
Yes=1 [0.45] [0.50] (0.08)
Knowledge on antibiotics No=0 161 0.18 40 0.15 0.03
Yes=1 [0.38] [0.36] (0.07)
Knowledge on products No=0 161 0.12 40 0.13 -0.01
19
Yes=1 [0.32] [0.33] (0.06)
Recording water quality No=0 161 0.16 40 0.18 -0.02
Yes=1 [0.36] [0.38] (0.06)
Recording seed use No=0 161 0.47 40 0.48 -0.00
Yes=1 [0.50] [0.51] (0.09)
Recording input use No=0 161 0.30 40 0.43 -0.12
Yes=1 [0.46] [0.50] (0.08)
Recording feeding No=0 161 0.42 40 0.48 -0.05
Yes=1 [0.50] [0.51] (0.09)
Recording sales price No=0 161 0.40 40 0.43 -0.02
Yes=1 [0.49] [0.50] (0.09)
Recording sales volume No=0 161 0.31 40 0.33 -0.01
Yes=1 [0.46] [0.47] (0.08)
Notes: Standard deviations are reported in brackets. Standard errors are reported in parentheses. *
significant at 10%; ** significant at 5%; *** significant at 1%.
Table 5. Types of Information Sources for Shrimp Cultivation in each Household
Undetected Detected Total
Shrimp Cultivating Technology
Friends 144 (89%) 40 (100%) 184 (92%)
Input seller 5 (3%) 0 (0%) 5 (2%)
Extension officer 6(4%) 0 (0%) 6 (3%)
Others 6 (4%) 0 (0%) 6 (1%)
Total 161(100%) 40 (100%) 201 (100%)
20

Treating Diseases
Friends 120 (75%) 32 (80%) 152 (76%)
Input seller 6 (4%) 2 (5%) 8 (4%)
Extension officer 25 (16%) 4 (10%) 29 (14%)
Family 2 (1%) 0 (0%) 2 (1%)
Others 8 (4%) 2 (5%) 10 (5%)
Total 161 (100%) 40 (100%) 201 (100%)
Table 6. Risk Preference Game
Project A Project B
You obtain for sure:50% chance of
obtaining:
50% chance of
obtaining
S1 1 million VND 2 million VND 0 VNDS2 1.2 million VND 2 million VND 0 VNDS3 1.4 million VND 2 million VND 0 VNDS4 1.6 million VND 2 million VND 0 VNDS5 1.8 million VND 2 million VND 0 VNDS6 2 million VND 2 million VND 0 VND
Table 7. Hyperbolic Discounting
Series 1 Project A
Today (a)
Project B
3 months later (b)
21

S1 2 million VND 2.2 million VND
S2 2 million VND 2.4 million VND
S3 2 million VND 2.6 million VND
S4 2 million VND 2.8 million VND
S5 2 million VND 3 million VND
S6 2 million VND 3 million VND
S7 2 million VND 3.4 million VND
S8 2 million VND 3.6 million VND
S9 2 million VND 3.8 million VND
S10 2 million VND 4 million VND
Series 2 Project A
3 months later (c)
Project B
6 months later (d)
S1 2 million VND 2.2 million VND
S2 2 million VND 2.4 million VND
S3 2 million VND 2.6 million VND
S4 2 million VND 2.8 million VND
S5 2 million VND 3 million VND
S6 2 million VND 3.2 million VND
S7 2 million VND 3.4 million VND
S8 2 million VND 3.6 million VND
S9 2 million VND 3.8 million VND
S10 2 million VND 4 million VND
22

Table 8. Determinants of the Veterinary Drug Residue: Average Marginal Probability Effects
(AMPE) from the Probit Model
Dependent variableDummy
drug
Dummy
CML
Dummy
ENR
Dummy
CIPRO
Dummy
OTC
(1) (2) (3) (4) (5)
Respondent’s age 0.004** 0.0000000005** 0.003** 0.0000002* -0.0000009
(0.002) (0.000000002) (0.002) (0.0000003) (0.000001)
Years of education 0.01 0.0000000001 0.01 0.0000002 -0.0000005
(0.01) (0.0000000007) (0.00) (0.0000006) (0.000003)
Shrimp farming experience -0.003 -0.0000000003 -0.001 -0.0000002 -0.000004**
(0.003) (0.000000001) (0.002) (0.0000003) (0.000005)
Shrimp seed density/m2 0.0003 0.00000000002 0.0003** -0.000000003 -0.00000003
(0.0003) (0.00000000008) (0.0002) (0.00000002) (0.00000007)
Shrimp farm land 0.005 -0.000000006** 0.02** 0.000002 -0.00001***
(0.01) (0.00000002) (0.01) (0.000002) (0.00002)
Shrimp seed price/piece -0.00003 0.00000000003 -0.0003 -0.00000004 0.0000002
(0.001) (0.0000000001) (0.0004) (0.00000006) (0.0000002)
Cost for feeding/ha -0.0001*** -0.00000000002 -0.00001 -0.000000001 -0.000000007
(0.00004) (0.00000000005) (0.000009) (0.000000002) (0.00000001)
Disease outbreak -0.11** 0.000000003 -0.14*** -0.00001 0.00001
(0.07) (0.00000001) (0.06) (0.00002) (0.00001)
BMPs training -0.11** -0.00000006* -0.06* -0.00001 -0.000002
(0.07) (0.0000003) (0.05) (0.00001) (0.00002)
Recording water quality -0.01 0.0000002 -0.05* -0.000002 0.001**
(0.07) (0.0000009) (0.02) (0.000003) (0.003)
Recording seed use -0.21 -0.00000005 0.14* 0.000006 -0.00945***
(0.15) (0.0000002) (0.10) (0.00001) (0.01)
Recording input use 0.10 0.000000004 0.12*** 0.00003** -0.00002*
23

(0.09) (0.00000002) (0.07) (0.00004) (0.00003)
Recording feeding 0.11 0.00000004 -0.26*** -0.00003** 0.003***
(0.15) (0.0000002) (0.10) (0.00004) (0.005)
σ (Risk aversion) 0.01 0.00000003*** -0.002 0.00004*** -0.000008
(0.02) (0.0000001) (0.01) (0.00004) (0.00001)
λ (HC) -0.02 -0.000000001 -0.03 -0.000005 0.00008**
(0.04) (0.000000007) (0.03) (0.000006) (0.0001)
No. shrimp input sellers -0.001 -0.0000000001 0.001 0.0000002 -0.000001
(0.004) (0.0000000007) (0.003) (0.0000003) (0.000002)
No. extension officers -0.07* -0.000000004 -0.02 -0.000002 -0.0003
(0.04) (0.00000002) (0.02) (0.000003) -0.0004
Commune fixed effect Yes Yes Yes Yes Yes
Observations 147 147 147 147 147
Pseudo R2 0.25 0.45 0.24 0.23 0.40
Notes: Standard errors in parentheses are clustered for 9 communes. * significant at 10%; ** significant at 5%; ***
significant at 1%. CML is the abbreviation for chloramphenicol, ENR is the abbreviation for enrofloxacin, CIPRO
is the abbreviation for ciprofloxacin, OTC is the abbreviation for oxytetracycline. Nine communes exist in our data
set.
Table 9. The Sum of Veterinary Drugs: Tobit Model
Dependent variable Total number of substances detected (0-4)
(1) (2) (3) (4)
Respondent’s age 0.04* 0.05** 0.05* 0.05**
(0.02) (0.02) (0.02) (0.02)
Years of education 0.09 0.08 0.07 0.07
(0.08) (0.09) (0.09) (0.09)
Shrimp farming experience -0.08** -0.06 -0.05 -0.05
(0.04) (0.04) (0.04) (0.04)
Shrimp seed density/m2 0.003 0.003 0.003 0.003
(0.003) (0.003) (0.003) (0.003)
Shrimp farm land 0.19 0.15 0.14 0.08
24

(0.18) (0.18) (0.19) (0.19)
Shrimp seed price/piece -0.001 0.0003 0.0005 -0.00
(0.01) (0.01) (0.01) (0.01)
Cost for feeding/ha -0.001*** -0.001** -0.001** -0.001**
(0.0004) (0.0005) (0.0004) (0.0005)
Disease outbreak -0.88 -1.01* -1.12** -1.17**
(0.58) (0.56) (0.55) (0.56)
BMPs training -1.11* -1.05* -1.20**
(0.59) (0.60) (0.60)
Recording water quality -0.23 -0.38 -0.23
(1.00) (0.98) (0.97)
Recording seed use -2.91* -2.79* -2.54
(1.61) (1.61) (1.59)
Recording input use 1.29* 1.35* 1.29
(0.73) (0.78) (0.81)
Recording feeding 0.98 1.02 0.95
(1.59) (1.57) (1.53)
σ (Risk aversion) 0.25 0.21
(0.25) (0.25)
λ (HC) -0.31 -0.28
(0.58) (0.58)
No. shrimp input sellers -0.01
(0.05)
No. extension officers -1.25
(0.84)
Commune fixed effect Yes Yes Yes Yes
Constant -4.08** -3.65 -4.81* -4.18
(2.00) (2.27) (2.68) (2.68)
Observations 147 147 147 147
Notes: Robust standard errors in parentheses. * significant at 10%; ** significant
at 5%; *** significant at 1%. Nine communes exist in our data set.
Table 10. The Amount of Oxytetracycline Residue: Tobit Model
25

Dependent variable Amount of OTC detected
26

(1) (2) (3) (4)
Respondent’s age -5.32 -3.35 -3.39 -2.90
(4.40) (4.95) (4.93) (4.84)
Years of education -4.71 -10.48 -10.60 -6.43
(20.93) (22.08) (22.16) (21.34)
Shrimp farming experience -7.77 -5.81 -6.41 -5.72
(7.76) (8.18) (7.76) (7.97)
Shrimp seed density/m2 0.38 0.50 0.53 0.54
(0.67) (0.69) (0.69) (0.69)
Shrimp farm land 19.64 9.01 9.69 -1.74
(25.17) (26.77) (26.60) (27.47)
Shrimp seed price/piece 1.54 2.02 2.00 1.83
(2.44) (2.42) (2.46) (2.50)
Cost for feeding/ha -0.04 -0.04 -0.04 -0.05
(0.06) (0.05) (0.06) (0.06)
Disease outbreak -192.48 -207.36* -197.63* -190.07*
(116.46) (112.09) (109.41) (110.72)
BMPs training -193.00 -195.38 -224.16*
(121.81) (125.24) (123.46)
Recording water quality -28.04 -19.93 28.02
(181.88) (172.75) (175.94)
Recording seed use -790.89* -805.32* -727.41*
(433.23) (426.85) (411.66)
Recording input use 425.97* 422.53** 376.68*
(219.54) (206.88) (200.73)
Recording feeding 373.49 377.28 346.83
(373.25) (365.25) (357.48)
σ (Risk aversion) -13.20 -14.38
(40.97) (41.07)
λ (HC) 23.21 35.62
(105.58) (106.25)
No. shrimp input sellers -7.82
(10.88)
No. extension officers -225.93
27

(175.72)
Commune fixed effect Yes Yes Yes Yes
Constant -63.30 -29.56 39.23 68.62
(393.06) (404.50) (481.21) (491.11)
Observations 147 147 147 147
Notes: Robust standard errors in parentheses. * significant at 10%; ** significant at
5%; *** significant at 1%. OTC is the abbreviation for oxytetracycline. Nine
communes exist in our data set.
Source: FAO
Figure 1. Viet Nam’s Shrimp Exports between 1990 and 2013
Ca Mau
Hanoi
Ho Chi Minh
28

Source: GADM (2015)
Figure 2. The Map of Viet Nam
29