Embed Size (px)
Citation preview
GNB Edition 59 – September 30, 2015 | 1Strategic Goal: XXX
WSDOT’s quarterly performance report on transportation systems, programs, and strategic prioritiesQuarter ending March 31, 2017 • Published May 2017 Roger Millar, Secretary of Transportation, PE, AICP
65
WSDOT uses social media to provide travelers the information they need before hitting the road
p 18
In the know
p 29
Tomorrow’s leaders WSDOT developing its workforce to meet the future needs of the state
Keep on truckin’
WSDOT systems help commercial vehicles get from point A to point B with fewer stops
p. 31
2 | GNB Edition 65 – March 31, 2017 Table of Contents
Table of Contents65Results WSDOT & Agency Emphasis Areas 3Results Washington 5 Statewide Transportation Policy Goals 6Multimodal Asset Management Dashboard 7Safety Performance Dashboard 9 Moving Ahead for Progress in the 21st Century 10Safety Pedestrian and Bicyclist Safety Annual Report 12PreservationAsset Management: Safety Rest Areas Annual Report 16MobilityTravel Information Annual Report 18Incident Response Quarterly Update 19WSDOT Ferries Quarterly Update 21Rail: Amtrak Cascades Quarterly Update 23EnvironmentWetlands Protection Annual Report 25Noise Quality Annual Report 28
Economic Vitality Commercial Vehicle Information Systems and Networks Annual Report 29
Transportation and the Economy: Annual Report 30Stewardship Workforce Development Annual Report 31Capital Project Delivery Programs Quarterly Update 33 Current Legislative Evaluation and Accountability Program 34
Watch List and Change Orders 36 Advertisement Record 38 Schedule and Budget Summaries 39 Pre-existing Funds 40Transportation Policy Goals & Gray Notebook Information Guide 43
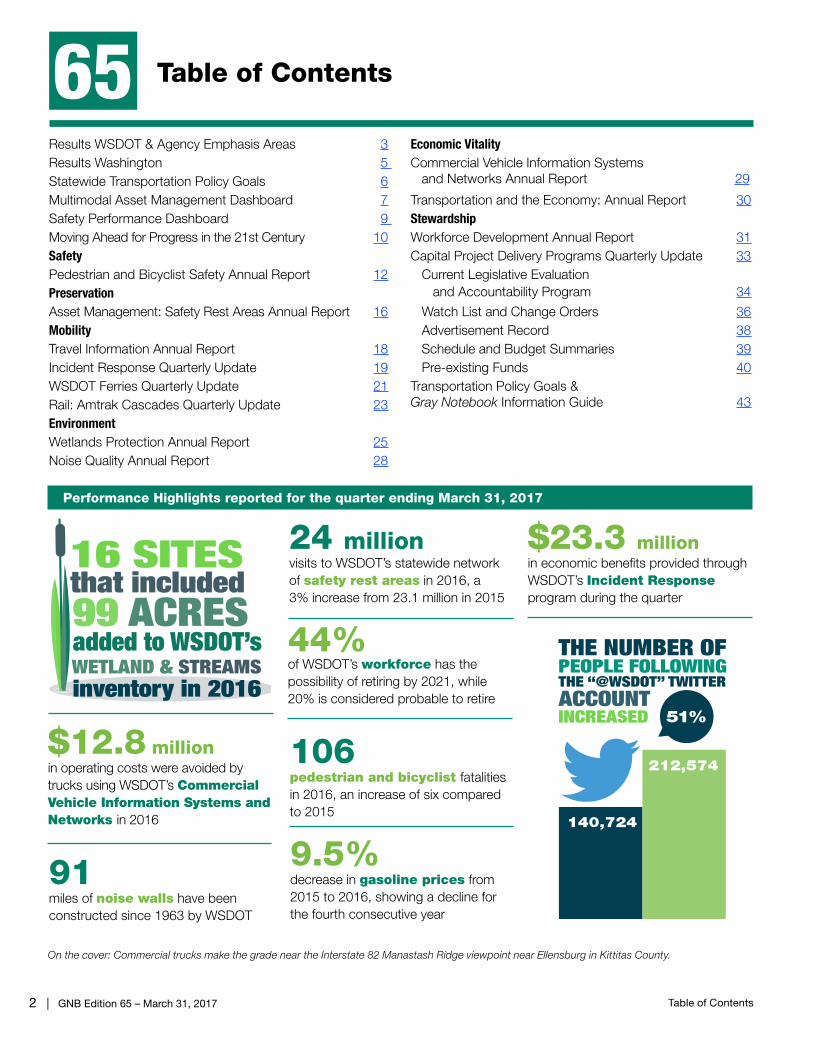
Performance Highlights reported for the quarter ending March 31, 2017
THE NUMBER OF PEOPLE FOLLOWINGTHE “@WSDOT” TWITTER ACCOUNT INCREASED 51%
140,724
212,574
91miles of noise walls have been constructed since 1963 by WSDOT
106pedestrian and bicyclist fatalities in 2016, an increase of six compared to 2015
On the cover: Commercial trucks make the grade near the Interstate 82 Manastash Ridge viewpoint near Ellensburg in Kittitas County.
9.5%decrease in gasoline prices from 2015 to 2016, showing a decline for the fourth consecutive year
$12.8 millionin operating costs were avoided by trucks using WSDOT’s Commercial Vehicle Information Systems and Networks in 2016
24 millionvisits to WSDOT’s statewide network of safety rest areas in 2016, a 3% increase from 23.1 million in 2015
44% of WSDOT’s workforce has the possibility of retiring by 2021, while 20% is considered probable to retire
$23.3 millionin economic benefits provided through WSDOT’s Incident Response program during the quarter
16 SITESthat included 99 ACRES added to WSDOT’s
WETLAND & STREAMSinventory in 2016
GNB Edition 65 – March 31, 2017 | 3Results WSDOT & Agency Emphasis Areas
Results WSDOT &Agency Emphasis Areas 65
How Results WSDOT is making a differenceWhen the Legislature approved the $16 billion Connecting Washington transportation package in 2015, WSDOT was delivering the last of the 2003 Nickel and 2005 Transportation Partnership Account funded transportation projects. The shift within the agency from gearing down from this work to now delivering the largest transportation investment in WSDOT history has created new opportunities and challenges.
To respond to these challenges, the agency is focusing on three areas of its strategic plan to deliver effective, strategic investments in the state’s transportation system. These Agency Emphasis Areas (AEAs) create an ethic for how WSDOT is delivering Connecting Washington:
Workforce development - WSDOT aspires to maintain highly competent and motivated employees
who continue to grow through appropriate training and developmental opportunities,
with fair and equitable compensation.
Inclusion - WSDOT wants a workforce that looks like the diverse communities the agency serves. All
businesses desiring to work with WSDOT will have fair and equal access to contracting opportunities.
In order to be accountable to all citizens of Washington, WSDOT strives to be sensitive to the cultures of the many diverse communities the agency serves.
Practical solutions is WSDOT’s approach to achieving its mission—how the agency plans, designs, builds,
operates and maintains the state’s transportation system. WSDOT’s goal is to identify and solve problems, not just apply standards. This approach
uses performance-based, data-driven decision making and early community involvement to guide the development and delivery of transportation investment strategies. Practical solutions strategies include safety, state of good repair, system management, demand management and capacity expansion investments.
These AEAs are strategies in Results WSDOT, the agency’s strategic plan, which has six goals: Strategic Investments, Modal Integration, Environmental Stewardship,
Organizational Strength, Community Engagement and Smart Technology. They also support WSDOT’s six legislatively-established policy goals.
Workforce development efforts help attract and keep qualified workers While WSDOT delivers the 16-year Connecting Washington program, the agency is experiencing increasing attrition in mid-career and late-career engineering staff. Within the next five years, WSDOT projects it could lose up to 44% of its engineering staff through retirement or attrition.
A recent study found that WSDOT’s engineers lag up to 33% behind both public and private sector employers in compensation, health care, leave and employee pension benefits. This negatively affects the agency’s ability to hire and keep experienced, qualified engineers.
The Governor’s budget supports WSDOT’s retention efforts and included $300,000 for resources specifically for workforce and leadership development training to successfully meet Connecting Washington delivery needs. Salary adjustments were funded at a level that begins to address the market disparity that exists for a number of engineering, technical, and maintenance positions.
Recruitment efforts include targeted outreach to minorities and military; expanded apprenticeship and internship programs; a reentry program for hiring ex -offenders; and, a retire/rehire option that would allow retired employees to work reduced hours.
Inclusion demonstrates WSDOT’s commitment to diverse communities WSDOT’s values reflect an increased commitment to diversity and inclusion in planning, operations and services, both internally and externally. Results WSDOT goals reflect a renewed commitment to the diverse communities of Washington.
These commitments focus the agency’s workforce, equal access and opportunity, and public accountability. WSDOT’s inclusion efforts are designed to increase the agency’s cultural awareness and collaboration with Washington’s communities. Work focuses on implementing business practices that result in a more diverse workforce and increased outreach and inclusion
Return toTable of Contents

4 | GNB Edition 65 – March 31, 2017 Results WSDOT & Agency Emphasis Areas
Results WSDOT strategic plan sets agency directionbuilding costly new infrastructure expansion. Community engagement is key in developing solutions.
Practical Solutions also represents a cultural shift among WSDOT employees, moving from a standards-based approach to a performance-based approach to solving transportation problems. The Legislature directed WSDOT to apply Practical Solutions to the projects funded through the Connecting Washington package.
Gray Notebook articles linked to strategic plan, emphasis areasWSDOT’s strategic plan goals are defined in the table below. Articles in this issue, indicated by a box with a goal logo, show how the plan’s goals and AEAs are being implemented. For a copy of Results WSDOT, go to bit.ly/ResultsWSDOTStrategicPlan.
strategies to historically under-served communities. Activities include conducting cultural competency and diversity training for WSDOT staff; emphasizing environmental justice through community engagement; strengthening our Disadvantaged Business Enterprise program to ensure equal access and opportunity; and increasing outreach in workforce recruitment to reflect the diversity of the communities WSDOT serves.
Practical Solutions helps deliver Connecting Washington Practical Solutions is a performance- based approach to transportation decision making. This data-driven approach uses tools and performance measures to seek lower-cost approaches in operating highways, ferries, transit and rail to reduce travel demand; to reduce project costs; and to reduce the need for
-
Results WSDOT sets agency direction 2014 through 2017 Strategic Plan
Recent Gray Notebook articles linked to goals and Agency Emphasis Areas (AEA)
Goal 1: STRATEGIC INVESTMENTSEffectively manage system assets and multimodal investments on corridors to enhance economic vitality
-Aviation: GNB 63, pp. 16-19-Bridges: GNB 62, pp. 14-22-Capital facilities: GNB 63, p. 13-15-Ferries preservation: GNB 62, pp. 23-28-Highway maintenance: GNB 64, pp. 21-22 (AEA1, 2)-Multimodal assets: GNB 65, pp. 7-8-Pavement conditions: GNB 64, pp. 13-20 (AEA2)
Goal 2: MODAL INTEGRATIONOptimize existing system capacity through better interconnectivity of all transportation modes
-Ferries: GNB 65, pp. 21-22-Freight: GNB 64, pp. 32-34-Highway system safety: GNB 62, pp. 10-13-Pedestrian and bicyclist safety: GNB 65, pp. 11-15 (AEA2, 3)-Public transit: GNB 63, pp. 11-12-Rail: Amtrak Cascades: GNB 65, pp. 23-24-Trip reduction: GNB 60, pp. 22-24
Goal 3: ENVIRONMENTAL STEWARDSHIPPromote sustainable practices to reduce greenhouse gas emissions and protect natural habitat and water quality
-Air quality: GNB 61, pp. 21-23-Environmental compliance: GNB 64, pp. 30-31-Fish passage barriers: GNB 62, pp. 35-36-General permitting: GNB 62, p. 38-Noise quality: GNB 65, p. 28-Water quality: GNB 63, pp. 28-30-Wetlands protection: GNB 65, pp. 25-27
Goal 4: ORGANIZATIONAL STRENGTHSupport a culture of multi-disciplinary teams, innovation and people development through training, continuous improvement and Lean efforts
-Lean: GNB 64, p. 40 (AEA1)-Worker safety and health: GNB 64, p. 12 (AEA1)-Workforce development: GNB 65, pp. 31-32 (AEA1, 3)
Goal 5: COMMUNITY ENGAGEMENTStrengthen partnerships to increase credibility, drive priorities and inform decision making
-Disadvantaged Business Enterprise: GNB 64, p. 38-39 (AEA3)-Incident Response GNB 65, pp. 18-19 (AEA2)-Local programs: GNB 62, p. 37
Goal 6: SMART TECHNOLOGYImprove information system efficiency to users and enhance service delivery by expanding the use of technology
-Commercial Vehicle Information Systems and Networks: GNB 65, pp. 28-Tolling: GNB 64, p. 35-37-Travel information: GNB 65, pp. 17 (AEA3)
Data source: WSDOT Office of Strategic Assessment and Performance Analysis.
Notes: 1 = Workforce Development. 2 = Practical Solutions. 3 = Inclusion.
$
GNB Edition 65 – March 31, 2017 | 5Results Washington
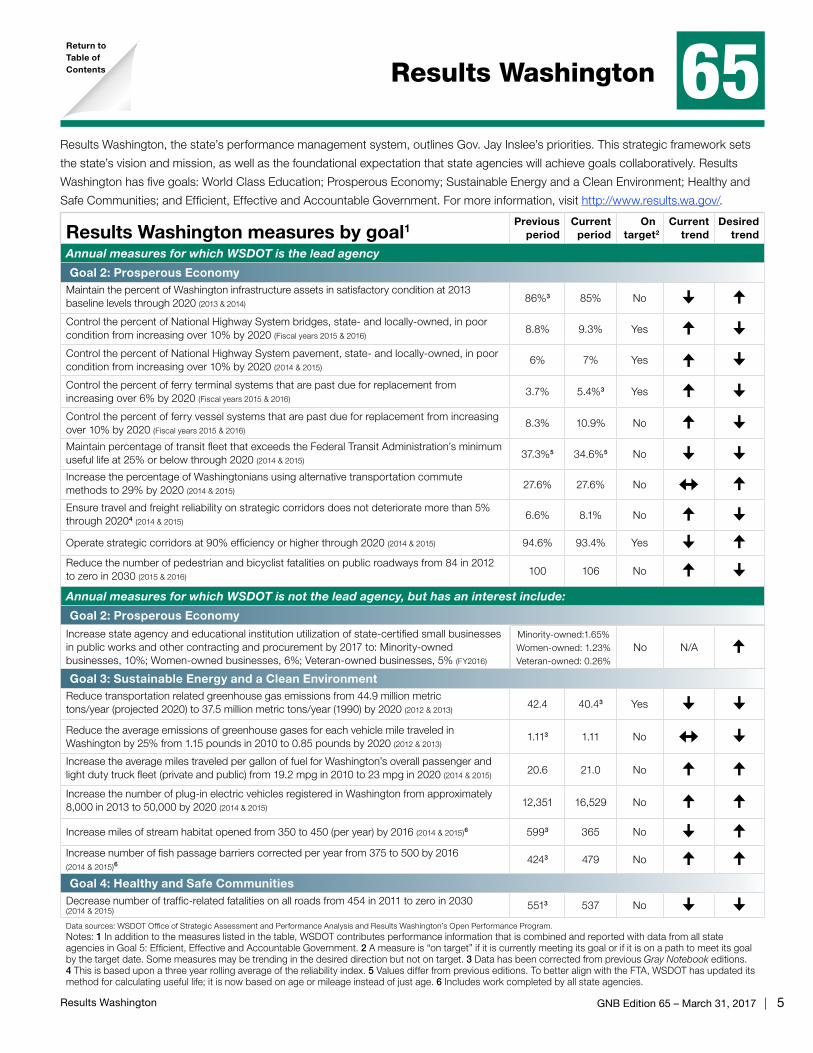
Results Washington 65Results Washington, the state’s performance management system, outlines Gov. Jay Inslee’s priorities. This strategic framework sets
the state’s vision and mission, as well as the foundational expectation that state agencies will achieve goals collaboratively. Results
Washington has five goals: World Class Education; Prosperous Economy; Sustainable Energy and a Clean Environment; Healthy and
Safe Communities; and Efficient, Effective and Accountable Government. For more information, visit http://www.results.wa.gov/.
Results Washington measures by goal1Previous
periodCurrent
periodOn
target2
Current trend
Desired trend
Annual measures for which WSDOT is the lead agency
Goal 2: Prosperous EconomyMaintain the percent of Washington infrastructure assets in satisfactory condition at 2013 baseline levels through 2020 (2013 & 2014)
86%3 85% No Control the percent of National Highway System bridges, state- and locally-owned, in poor condition from increasing over 10% by 2020 (Fiscal years 2015 & 2016)
8.8% 9.3% Yes Control the percent of National Highway System pavement, state- and locally-owned, in poor condition from increasing over 10% by 2020 (2014 & 2015)
6% 7% Yes Control the percent of ferry terminal systems that are past due for replacement from increasing over 6% by 2020 (Fiscal years 2015 & 2016)
3.7% 5.4%3 Yes Control the percent of ferry vessel systems that are past due for replacement from increasing over 10% by 2020 (Fiscal years 2015 & 2016)
8.3% 10.9% No Maintain percentage of transit fleet that exceeds the Federal Transit Administration’s minimum useful life at 25% or below through 2020 (2014 & 2015)
37.3%5 34.6%5 No Increase the percentage of Washingtonians using alternative transportation commute methods to 29% by 2020 (2014 & 2015)
27.6% 27.6% No
Ensure travel and freight reliability on strategic corridors does not deteriorate more than 5% through 20204 (2014 & 2015)
6.6% 8.1% No Operate strategic corridors at 90% efficiency or higher through 2020 (2014 & 2015) 94.6% 93.4% Yes Reduce the number of pedestrian and bicyclist fatalities on public roadways from 84 in 2012 to zero in 2030 (2015 & 2016)
100 106 No Annual measures for which WSDOT is not the lead agency, but has an interest include:
Goal 2: Prosperous EconomyIncrease state agency and educational institution utilization of state-certified small businesses in public works and other contracting and procurement by 2017 to: Minority-owned businesses, 10%; Women-owned businesses, 6%; Veteran-owned businesses, 5% (FY2016)
Goal 3: Sustainable Energy and a Clean EnvironmentReduce transportation related greenhouse gas emissions from 44.9 million metric tons/year (projected 2020) to 37.5 million metric tons/year (1990) by 2020 (2012 & 2013)
42.4 40.43 Yes Reduce the average emissions of greenhouse gases for each vehicle mile traveled in Washington by 25% from 1.15 pounds in 2010 to 0.85 pounds by 2020 (2012 & 2013)
1.113 1.11 No
Increase the average miles traveled per gallon of fuel for Washington’s overall passenger and light duty truck fleet (private and public) from 19.2 mpg in 2010 to 23 mpg in 2020 (2014 & 2015) 20.6 21.0 No Increase the number of plug-in electric vehicles registered in Washington from approximately 8,000 in 2013 to 50,000 by 2020 (2014 & 2015) 12,351 16,529 No
Increase miles of stream habitat opened from 350 to 450 (per year) by 2016 (2014 & 2015)6 5993 365 No Increase number of fish passage barriers corrected per year from 375 to 500 by 2016 (2014 & 2015)6
4243 479 No Goal 4: Healthy and Safe Communities
Decrease number of traffic-related fatalities on all roads from 454 in 2011 to zero in 2030(2014 & 2015) 5513 537 No Data sources: WSDOT Office of Strategic Assessment and Performance Analysis and Results Washington’s Open Performance Program.Notes: 1 In addition to the measures listed in the table, WSDOT contributes performance information that is combined and reported with data from all state agencies in Goal 5: Efficient, Effective and Accountable Government. 2 A measure is “on target” if it is currently meeting its goal or if it is on a path to meet its goal by the target date. Some measures may be trending in the desired direction but not on target. 3 Data has been corrected from previous Gray Notebook editions. 4 This is based upon a three year rolling average of the reliability index. 5 Values differ from previous editions. To better align with the FTA, WSDOT has updated its method for calculating useful life; it is now based on age or mileage instead of just age. 6 Includes work completed by all state agencies.
Minority-owned:1.65%Women-owned: 1.23%Veteran-owned: 0.26%
No N/A
Return toTable of Contents

6 | GNB Edition 65 – March 31, 2017 Statewide Transportation Policy Goals
Statewide Transportation Policy Goals65
Statewide policy goal/ WSDOT performance measure
Previous period
Current period Goal Goal met Five-year trend (unless noted)
Desired trend
SafetyRate of traffic fatalities per 100 million vehicle miles traveled statewide(Annual measure: calendar years 2014 & 2015)
0.80 0.951 <1.00435
552
Rate of recordable incidents for every 100 full-time WSDOT workers (Annual measure: calendar years 2015 & 2016)
4.3 4.6 <5.0
PreservationPercentage of state highway pavement in fair or better condition by vehicle miles traveled(Annual measure: calendar years 2014 & 2015)
93.3% 93.0% > 90.0%91.90
93.35
Percentage of state bridges in fair or better condition by bridge deck area(Annual measure: fiscal years 2015 & 2016)
92.1% 91.2% > 90.0%91
Mobility (Congestion Relief)Highways: Annual (weekday) vehicle hours of delay statewide relative to maximum throughput speeds2 (Annual measure: calendar years 2014 & 2015)
32.3 million N/A N/A N/A
30.900000
31.724999
32.549999
Highways: Average incident clearance times for all Incident Response program responses(Calendar quarterly measure: Q4 2016 & Q1 2017)
12.6 minutes
12.0 minutes N/A N/A
11.25
11.95
12.65
Ferries: Percentage of trips departing on time3
(Fiscal quarterly measure: year to year Q3 FY2016 & Q3 FY2017)96.3% 96.2% > 95%
96.1
97.0
Rail: Amtrak Cascades on-time performance4
(Annual measure: fiscal years 2015 & 2016)72.1% 74.8% > 80%
71.0
73.8
EnvironmentNumber of WSDOT stormwater management facilities constructed(Annual measure: fiscal years 2015 & 2016)
130 151 N/A N/A129.000000
155.999974
182.999949
209.999923
Not applicable
Cumulative number of WSDOT fish passage improvement projects constructed(Annual measure: calendar years 2014 & 2015)
291 301 N/A N/A257.0
279.5
302.0
StewardshipCumulative number of Nickel and TPA projects completed5 and percentage on time6
(Calendar quarterly measure: Q4 2016 & Q1 2017, trendline for percentage on time)
377/87%
377/87%
> 90% on time
86
88
Cumulative number of Nickel and TPA projects completed5 and percentage on budget6
(Calendar quarterly measure: Q4 2016 & Q1 2017, trendline for percentage on budget)
377/91%
377/91%
> 90% on budget
90
92
Variance of total project costs5 compared to budget expectations6
(Calendar quarterly measure: Q4 2016 & Q1 2017)
Under budget by 2.2%
Under budget by 2.2%
On or under
budget -2.2
-1.8
Not applicable
Data source: WSDOT Office of Strategic Assessment and Performance Analysis.
Notes: See p. 43 for more information on statewide goals. N/A = not available: goal has not been set. Dash (—) = goal was not met in the reporting period. 1 Traffic fatality data for 2015 was finalized January 1, 2017. 2 Compares the average travel time to the travel time associated with “maximum throughput,” the speed which allows the greatest number of motor vehicles to pass by a location on the highway in a given amount of time (70-85% of the posted speed limits). 3 WSDOT Ferries’ on-time departures include any trip recorded by automated tracking as leaving the ter-minal within 10 minutes of scheduled time. 4 Amtrak Cascades’ on-time performance includes any trip arriving within 10-15 minutes, depending on the route, of scheduled arrival time. 5 Construction projects only. 6 Budget and schedule expectations are defined in the last approved State Trans-portation Budget. See p. 33 for more information.
4.300000
4.773334
5.246668
(Five-quarter trend)
(Five-quarter trend)
(Five-quarter trend)
(Five-quarter trend)
(Four-year trend)
Return toTable of
Contents

GNB Edition 65 – March 31, 2017 | 7Multimodal Asset Performance Dashboard
Multimodal Asset Performance Dashboard 65
Continued on p. 8
(Two-year trend)
WSDOT performance measurePrevious
periodCurrent
period Goal Goal met Five-year trend (unless noted)Desired
trend
Highway Assets Bridges
Percentage of WSDOT-owned bridges in fair or better condition by bridge deck area(Fiscal years 2015 & 2016, GNB 62, p. 14)
92.1% 91.2% ≥90.0%
91
Number of WSDOT-owned bridgesload restricted or load posted(Fiscal years 2015 & 2016, GNB 62, p. 18)
120 126 N/A119
141
Current WSDOT-owned steel bridge painting backlog in millions of dollars(Fiscal years 2015 & 2016, GNB 62, p. 20)
$394.0 $414.5 N/A197
469
Projected 10-year WSDOT owned steel bridgepainting backlog in millions of dollars(Fiscal years 2015-2025 & 2016-2026, GNB 62, p. 20)
$684.0 $706.6 N/A565
751
Current WSDOT-owned bridge deck area due or past due for replacement in millions of dollars(Fiscal years 2015 & 2016, GNB 62, p. 19)
$70.8 $115.6 N/A70
116
Projected 10-year WSDOT owned bridge deck area due or past due for replacement in millions of dollars(Fiscal years 2015-2025 & 2016-2026, GNB 62, p. 19)
$71.5 $726.51 N/A70
730
Structurally deficient local and WSDOT-owned NHS bridges; percentage of deck area(MAP-21 criteria, see p. 10)(Fiscal years 2015 & 2016, GNB 62, p. 15)
8.8% 9.3% ≤10.0%0.078
0.095
PavementPercentage of WSDOT-owned pavement2
in fair or better condition; (Calendar years 2014 & 2015, GNB 64, p. 15)
93.3% 93.0% >90.0%91.90
93.35
Highway Pavement Asset Sustainability Ratio;long term service replenishment rate3
(Calendar years 2014 & 2015, GNB 64, p. 14)
0.53 0.57 >0.900.52
0.77
Highway Pavement Deferred Preservation Liability (backlog) in millions of dollars(Calendar years 2014 & 2015, GNB 64, p. 16)
$351 $403 $0343.000000
403.999963
Highway Pavement Remaining Service Life aspercentage of total useful life(Calendar years 2014 & 2015, GNB 64, p. 16)
46.9% 47.1% 45%-55%0.46
Percentage of lane miles of interstate pavement in poor condition (MAP-21 criteria, see p. 10)(Calendar years 2014 & 2015)
3.9% 4.0% ≤5.0%3.9
Safety Rest AreasSafety rest area score4 through theMaintenance Accountability Process(Calendar years 2015 & 2016, p. 16)
B B B
2.000000
3.999999
Total visitors at safety rest areasin millions of visitors(Calendar years 2015 & 2016, p. 16)
23.1 24.0 N/A20.7
24.1
N/A
Highway MaintenancePercentage of funded maintenance condition targets achieved5
(Calendar years 2015 & 2016, GNB 64, p. 21)
85% 93% 100%0.79
(Two-year trend)
(Two-year trend)
(Four-year trend)
53.5 million square feet of bridge deck
18,679 lane miles of pavement
47 safety rest areas
Return toTable of Contents
8 | GNB Edition 65 – March 31, 2017 Multimodal Asset Performance Dashboard
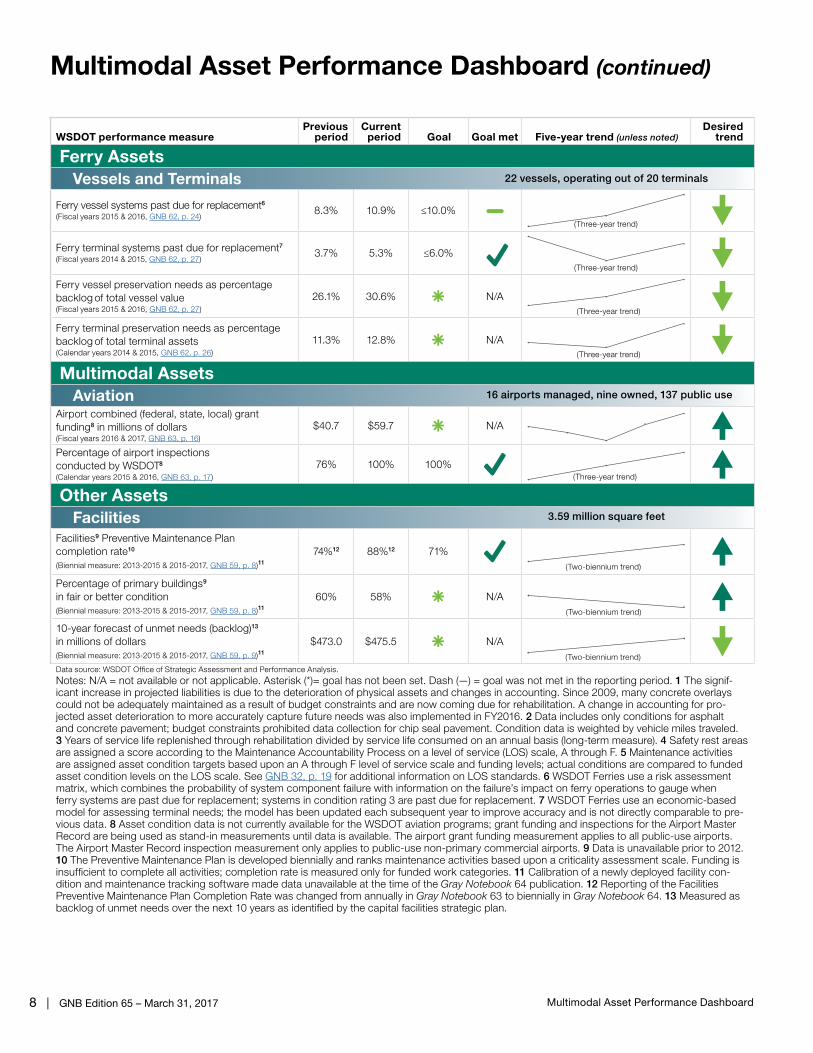
Multimodal Asset Performance Dashboard (continued)
(Three-year trend)
(Three-year trend)
(Three-year trend)
(Three-year trend)
WSDOT performance measurePrevious
periodCurrent
period Goal Goal met Five-year trend (unless noted)Desired
trend
Ferry Assets Vessels and Terminals
Ferry vessel systems past due for replacement6
(Fiscal years 2015 & 2016, GNB 62, p. 24)8.3% 10.9% ≤10.0%
0.07
0.11
Ferry terminal systems past due for replacement7
(Fiscal years 2014 & 2015, GNB 62, p. 27)3.7% 5.3% ≤6.0%
0.036
0.061
Ferry vessel preservation needs as percentage backlog of total vessel value(Fiscal years 2015 & 2016, GNB 62, p. 27)
26.1% 30.6% N/A0.07
0.11
Ferry terminal preservation needs as percentage backlog of total terminal assets(Calendar years 2014 & 2015, GNB 62, p. 26)
11.3% 12.8% N/A0.112
0.129
Multimodal Assets Aviation
Airport combined (federal, state, local) grant funding8 in millions of dollars(Fiscal years 2016 & 2017, GNB 63, p. 16)
$40.7 $59.7 N/A9.20
59.95
Percentage of airport inspectionsconducted by WSDOT8
(Calendar years 2015 & 2016, GNB 63, p. 17)
76% 100% 100%0.49
1.01
Other Assets Facilities
Facilities9 Preventive Maintenance Plan completion rate10
(Biennial measure: 2013-2015 & 2015-2017, GNB 59, p. 8)11
74%12 88%12 71%0.73
0.98
Percentage of primary buildings9
in fair or better condition(Biennial measure: 2013-2015 & 2015-2017, GNB 59, p. 8)11
60% 58% N/A0.588
0.620
10-year forecast of unmet needs (backlog)13
in millions of dollars(Biennial measure: 2013-2015 & 2015-2017, GNB 59, p. 9)11
$473.0 $475.5 N/A472.899994
478.999972
Data source: WSDOT Office of Strategic Assessment and Performance Analysis.
Notes: N/A = not available or not applicable. Asterisk (*)= goal has not been set. Dash (—) = goal was not met in the reporting period. 1 The signif-icant increase in projected liabilities is due to the deterioration of physical assets and changes in accounting. Since 2009, many concrete overlays could not be adequately maintained as a result of budget constraints and are now coming due for rehabilitation. A change in accounting for pro-jected asset deterioration to more accurately capture future needs was also implemented in FY2016. 2 Data includes only conditions for asphalt and concrete pavement; budget constraints prohibited data collection for chip seal pavement. Condition data is weighted by vehicle miles traveled. 3 Years of service life replenished through rehabilitation divided by service life consumed on an annual basis (long-term measure). 4 Safety rest areas are assigned a score according to the Maintenance Accountability Process on a level of service (LOS) scale, A through F. 5 Maintenance activities are assigned asset condition targets based upon an A through F level of service scale and funding levels; actual conditions are compared to funded asset condition levels on the LOS scale. See GNB 32, p. 19 for additional information on LOS standards. 6 WSDOT Ferries use a risk assessment matrix, which combines the probability of system component failure with information on the failure’s impact on ferry operations to gauge when ferry systems are past due for replacement; systems in condition rating 3 are past due for replacement. 7 WSDOT Ferries use an economic-based model for assessing terminal needs; the model has been updated each subsequent year to improve accuracy and is not directly comparable to pre-vious data. 8 Asset condition data is not currently available for the WSDOT aviation programs; grant funding and inspections for the Airport Master Record are being used as stand-in measurements until data is available. The airport grant funding measurement applies to all public-use airports. The Airport Master Record inspection measurement only applies to public-use non-primary commercial airports. 9 Data is unavailable prior to 2012. 10 The Preventive Maintenance Plan is developed biennially and ranks maintenance activities based upon a criticality assessment scale. Funding is insufficient to complete all activities; completion rate is measured only for funded work categories. 11 Calibration of a newly deployed facility con-dition and maintenance tracking software made data unavailable at the time of the Gray Notebook 64 publication. 12 Reporting of the Facilities Preventive Maintenance Plan Completion Rate was changed from annually in Gray Notebook 63 to biennially in Gray Notebook 64. 13 Measured as backlog of unmet needs over the next 10 years as identified by the capital facilities strategic plan.
(Three-year trend)
(Two-biennium trend)
(Two-biennium trend)
(Two-biennium trend)
3.59 million square feet
16 airports managed, nine owned, 137 public use
22 vessels, operating out of 20 terminals
GNB Edition 65 – March 31, 2017 | 9Multimodal Safety Performance Dashboard
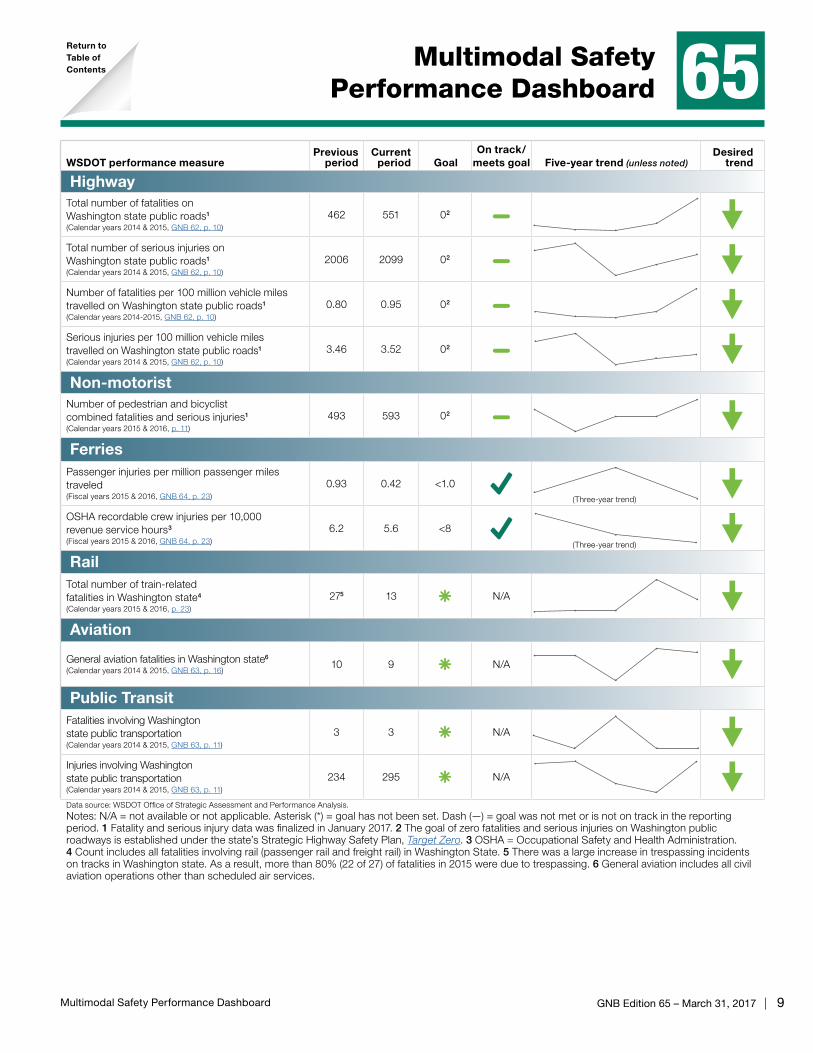
Multimodal Safety Performance Dashboard 65
WSDOT performance measurePrevious
periodCurrent
period GoalOn track/
meets goal Five-year trend (unless noted)Desired
trend
HighwayTotal number of fatalities on Washington state public roads1
(Calendar years 2014 & 2015, GNB 62, p. 10)
462 551 02
435
552
Total number of serious injuries onWashington state public roads1
(Calendar years 2014 & 2015, GNB 62, p. 10)
2006 2099 02
1910
2200
Number of fatalities per 100 million vehicle miles travelled on Washington state public roads1
(Calendar years 2014-2015, GNB 62, p. 10)
0.80 0.95 02
0.75
Serious injuries per 100 million vehicle miles travelled on Washington state public roads1
(Calendar years 2014 & 2015, GNB 62, p. 10)
3.46 3.52 02
3.34
3.89
Non-motoristNumber of pedestrian and bicyclistcombined fatalities and serious injuries1
(Calendar years 2015 & 2016, p. 11)
493 593 02
403
595
FerriesPassenger injuries per million passenger miles traveled(Fiscal years 2015 & 2016, GNB 64, p. 23)
0.93 0.42 <1.00.41
0.94
OSHA recordable crew injuries per 10,000revenue service hours3
(Fiscal years 2015 & 2016, GNB 64, p. 23)
6.2 5.6 <85.5
7.6
RailTotal number of train-related fatalities in Washington state4
(Calendar years 2015 & 2016, p. 23)
275 13 N/A4.0
27.2
Aviation
General aviation fatalities in Washington state6
(Calendar years 2014 & 2015, GNB 63, p. 16)10 9 N/A
1.0
10.2
Public TransitFatalities involving Washingtonstate public transportation(Calendar years 2014 & 2015, GNB 63, p. 11)
3 3 N/A3.0
8.1
Injuries involving Washingtonstate public transportation(Calendar years 2014 & 2015, GNB 63, p. 11)
234 295 N/A233
297
Data source: WSDOT Office of Strategic Assessment and Performance Analysis.
Notes: N/A = not available or not applicable. Asterisk (*) = goal has not been set. Dash (—) = goal was not met or is not on track in the reporting period. 1 Fatality and serious injury data was finalized in January 2017. 2 The goal of zero fatalities and serious injuries on Washington public roadways is established under the state’s Strategic Highway Safety Plan, Target Zero. 3 OSHA = Occupational Safety and Health Administration. 4 Count includes all fatalities involving rail (passenger rail and freight rail) in Washington State. 5 There was a large increase in trespassing incidents on tracks in Washington state. As a result, more than 80% (22 of 27) of fatalities in 2015 were due to trespassing. 6 General aviation includes all civil aviation operations other than scheduled air services.
(Three-year trend)
(Three-year trend)
Return toTable of Contents

10 | GNB Edition 65 – March 31, 2017 MAP-21
Moving Ahead for Progress in the 21st Century (MAP-21)65
MAP-21 measures by program area
Federal threshold/
benchmark1
MAP-21 target2
WSDOT penalty3 (Yes/No)
Rule release
dateExisting WSDOT performance measures for this program area
Combined Rule – FINAL (frozen) 23 CFR Part 490; Rule ID No. 2125-AF54
- System Performance (Congestion)
Percent of the Interstate System providing for reliable travel
NoTBD(To be
determined)
NoFinal
1/18/174
The 2016 Corridor Capacity Report details highway travel times and congestion trends in Washington state
Percent of the non-Interstate National Highway System (NHS) providing for reliable travel
No TBD NoFinal
1/18/174
The 2016 Corridor Capacity Report details highway travel times and congestion trends in Washington state
Percent change in tailpipe CO2 emissions on the NHS compared to the calendar year 2017 level
No TBD NoFinal
1/18/174
Fuel sales data is reported to FHWA on a monthly basis for Washington state
- National Freight Movement Program
Truck travel time reliability index No TBD NoFinal
1/18/174
A truck travel time reliability measure was established as part of the 2014 Washington State Freight Mobility Plan
- Congestion Mitigation and Air Quality Program
Annual hours of peak-hour excessive delay per capita
No TBD NoFinal
1/18/174
The 2016 Corridor Capacity Report details highway travel times and congestion trends in Washington state
Percent of non-SOV travel No TBD NoFinal
1/18/174
Data is available from the United States Census Bureau’s American Community Survey
Two- and four-year total emission reductions for each applicable criteria pollutant and precursor
No TBD NoFinal
1/18/174
CMAQ project emissions reductions are reported to FHWA annually
National Highway Performance Program – RULE (frozen) 23 CFR Part 490; Rule ID No. 2125-AF53
National Highway System interstate pavement in good and poor condition
% of interstate pavement lane
miles in poor condition not to
exceed 5%
TBD YesFinal
1/18/174
See GNB 64, p. 20 for an update on MAP-21 implications for pavement. On October 24, 2016, the Asset Management Plan final rule was released. It is linked to the final rule for pavement and bridge performance measures.
National Highway System bridges classified in good and poor condition
% of SD5 bridges not to exceed
10%TBD Yes
Final1/18/174
Several measures of bridge condition including good/fair/poor condition rating and structural deficiency rating; see GNB 62, p. 14 and p.22
White House extends freeze on two final MAP-21 rules A current freeze on federal rulemaking was extended by the White House in March for a second 60-day period, which will now expire on May 20, 2017. This prevents two new performance management rules from the Federal Highway Administration (FHWA) from taking effect, and allows federal reviewers to determine whether to implement the rules, continue the freeze, or retract the rules.
If the current freeze is lifted, a one-year period for state departments of transportation (DOTs) to establish numeric targets for the performance measures prescribed by
the two affected rules begins. Metropolitan Planning Organizations (MPOs) then have 180 additional days to report targets for their jurisdictions. State DOTs may incur federal penalties and be held accountable if significant progress toward established targets is not made.
One of the frozen rules, the “combined rule,” relates to highway system performance (i.e. congestion), freight movement, and vehicle emissions. The other relates to the condition of pavement and bridge assets. The frozen rules are the second and third regulations to prescribe performance measures and reporting standards for states as mandated by the 2012 MAP-21 Act.
Return toTable of
Contents
GNB Edition 65 – March 31, 2017 | 11MAP-21
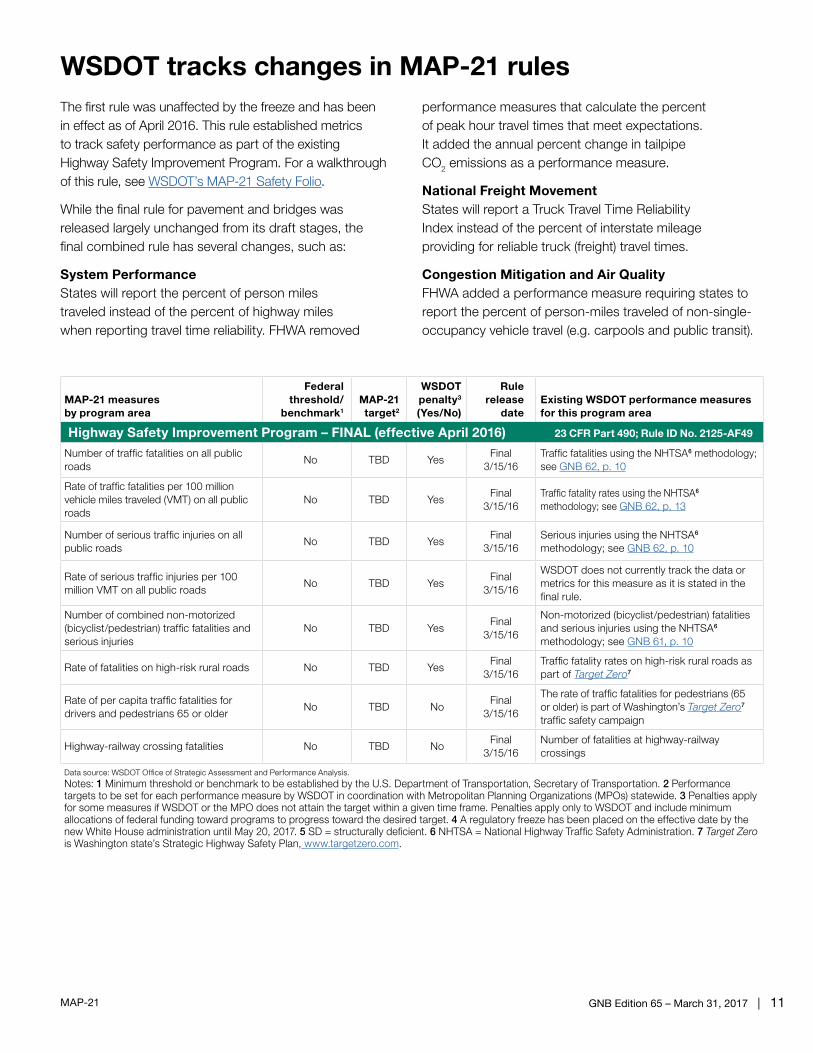
The first rule was unaffected by the freeze and has been in effect as of April 2016. This rule established metrics to track safety performance as part of the existing Highway Safety Improvement Program. For a walkthrough of this rule, see WSDOT’s MAP-21 Safety Folio.
While the final rule for pavement and bridges was released largely unchanged from its draft stages, the final combined rule has several changes, such as:
System PerformanceStates will report the percent of person miles traveled instead of the percent of highway miles when reporting travel time reliability. FHWA removed
WSDOT tracks changes in MAP-21 rules
MAP-21 measures by program area
Federal threshold/
benchmark1
MAP-21 target2
WSDOT penalty3 (Yes/No)
Rule release
dateExisting WSDOT performance measures for this program area
Highway Safety Improvement Program – FINAL (effective April 2016) 23 CFR Part 490; Rule ID No. 2125-AF49
Number of traffic fatalities on all public roads
No TBD YesFinal
3/15/16Traffic fatalities using the NHTSA6 methodology; see GNB 62, p. 10
Rate of traffic fatalities per 100 million vehicle miles traveled (VMT) on all public roads
No TBD YesFinal
3/15/16Traffic fatality rates using the NHTSA6 methodology; see GNB 62, p. 13
Number of serious traffic injuries on all public roads
No TBD YesFinal
3/15/16Serious injuries using the NHTSA6 methodology; see GNB 62, p. 10
Rate of serious traffic injuries per 100 million VMT on all public roads
No TBD YesFinal
3/15/16
WSDOT does not currently track the data or metrics for this measure as it is stated in the final rule.
Number of combined non-motorized (bicyclist/pedestrian) traffic fatalities and serious injuries
No TBD YesFinal
3/15/16
Non-motorized (bicyclist/pedestrian) fatalities and serious injuries using the NHTSA6 methodology; see GNB 61, p. 10
Rate of fatalities on high-risk rural roads No TBD YesFinal
3/15/16Traffic fatality rates on high-risk rural roads as part of Target Zero7
Rate of per capita traffic fatalities for drivers and pedestrians 65 or older
No TBD NoFinal
3/15/16
The rate of traffic fatalities for pedestrians (65 or older) is part of Washington’s Target Zero7 traffic safety campaign
Highway-railway crossing fatalities No TBD NoFinal
3/15/16Number of fatalities at highway-railway crossings
Data source: WSDOT Office of Strategic Assessment and Performance Analysis.
Notes: 1 Minimum threshold or benchmark to be established by the U.S. Department of Transportation, Secretary of Transportation. 2 Performance targets to be set for each performance measure by WSDOT in coordination with Metropolitan Planning Organizations (MPOs) statewide. 3 Penalties apply for some measures if WSDOT or the MPO does not attain the target within a given time frame. Penalties apply only to WSDOT and include minimum allocations of federal funding toward programs to progress toward the desired target. 4 A regulatory freeze has been placed on the effective date by the new White House administration until May 20, 2017. 5 SD = structurally deficient. 6 NHTSA = National Highway Traffic Safety Administration. 7 Target Zero is Washington state’s Strategic Highway Safety Plan, www.targetzero.com.
performance measures that calculate the percent of peak hour travel times that meet expectations. It added the annual percent change in tailpipe CO2 emissions as a performance measure.
National Freight MovementStates will report a Truck Travel Time Reliability Index instead of the percent of interstate mileage providing for reliable truck (freight) travel times.
Congestion Mitigation and Air Quality FHWA added a performance measure requiring states to report the percent of person-miles traveled of non-single-occupancy vehicle travel (e.g. carpools and public transit).

12 | GNB Edition 65 – March 31, 2017 Strategic goal: Safety – Pedestrian and Bicyclist Safety
Pedestrian and Bicyclist Safety Annual Report65
Total annual pedestrian and bicyclist fatalities climb to 106 in Washington2010 through 20161; Washington state; reduction goalis 5% annually
20
40
60
80
100
20161201520142013201220112010
Pedestrian fatalities
Bicyclist fatalities
Reductiongoal
Notes: 1 2016 data is preliminary; 2015 data is finalized as of January 2017.
Data source: Washington State Traffic Safety Commission - Fatality Analysis Reporting System
6368
75
50
7886
891112
1417
611
7
106
Fatalities of people walking, biking rises 2%as share of all Washington traffic fatalities in 20162012 through 2016; number of fatalities and percentage of total traffic fatalities on all public roads
2012 2013 2014 2015 20162
Total1 statewide traffic fatalities = 100%
438 436 462 551 537
Pedestrian and bicyclist fatalities
87 (20%)
61 (14%)
85 (18%)
100 (18%)
106 (20%)
Data source: Washington State Traffic Safety Commission - Fatality Analysis Reporting System.
Notes: 1 Total statewide fatalities includes all modes of travel. 2 2016 data is preliminary; 2015 data is finalized as of January 2017.
Children walking, biking to school up 19% in 2016The number of children in grades K-8 walking and biking to school grew 19% in 2016 compared to 2014. More than 11,000 adults with children participated in the 2016 Student Travel Survey, which informs WSDOT about students’ travel patterns (see box at right).
Children living in urban areas are more likely to walk to school (18.2%) than those in rural areas (11.2%). A greater percentage of Washington state children rode the school bus in 2016 (41.8%) compared to the 2014 national average (29.8%), the latest available, and a smaller percentage traveled to school via private vehicle (38.4% versus 51.5% nationwide). At schools where the percentage of children receiving free and reduced-price meals is less than the state average, fewer Washington children walk to school (14.9%) compared to other schools (17%). About 43% of children who live within one mile of school walk or bike there.
Fatalities, serious injuries increase for pedestrians, bicyclistsPeople walking and biking accounted for 20% of statewide traffic fatalities in 2016, up from 18% in 2015. Total annual deaths of people biking and walking on Washington state roads totaled 106 in 2016, up from 100 in the previous calendar year (six more fatalities). There has been an overall upward trend in the number of pedestrian and bicyclist fatalities, with an average of 88 fatalities per year since 2012.
The number of serious injuries involving pedestrians and bicyclists increased 19% from 393 in 2015 to 486 in 2016 (93 more injuries). Serious injury numbers and rates have varied over the years, with a slight upward trend between 2012 and 2016. Washington averaged 415 serious injuries involving bicyclists and pedestrians annually during that five-year period.
Notable results � The share of Washington traffic fatalities
involving people walking and biking grew 2% from 2015 to 2016
� Washington saw a 19% increase in K-8 children walking and biking to school in 2016 compared to 2014
� There were 93 more serious injuries to bicyclists and pedestrians statewide in 2016 compared to 2015
� WSDOT expanded Bicyclist and Pedestrian Count Program to develop estimates of statewide biking and walking trips
Tracking student travel trendsWSDOT partnered with the Washington Department of Health and the Office of the Superintendent of Public Instruction to administer the Washington State Student Travel Survey. The survey collects information on how students travel to and from school. More information about the survey will be available in July 2017.
Return toTable of
Contents
GNB Edition 65 – March 31, 2017 | 13Strategic goal: Safety – Pedestrian and Bicyclist Safety
Preliminary results using data from nine permanent count locations in Bainbridge Island, Bellevue, Lacey, Redmond, Spokane and Wenatchee indicate a 12% increase in biking and walking compared to 2015. There were 2,445 and 1,887 daily bicycle and pedestrian trips, respectively, at those sites on average in 2016. Over 1.58 million non-motorized trips were recorded there during 2016, with a split of 56% bicycle trips and 44% walking trips.
WSDOT, in partnership with local agencies across the state, will be installing additional permanent counters with the intent to have over 80 total permanent count locations established by the end of the 2017-2019 biennium (ending September 30, 2019). As the program expands, these counters allow WSDOT to monitor bicycle and pedestrian traffic on active transportation corridors throughout the state.
Knowing how many people are bicycling and walking informs planning efforts, provides insights into the use and value of facilities, and helps compare safety outcomes between modes. This data will allow WSDOT to determine estimates of bicycle miles traveled and pedestrian miles traveled to better understand changes in risk exposure rates for non-motorized transportation.
Risk to bicyclists and pedestrians of fatal crash varies by demographicAge and other demographic factors play a role in the exposure to risk for those walking and biking. Children who walk and bike are under-represented in traffic fatalities, compared to those in other age groups. From 2012 to 2016, children aged 14 and younger represented 18% of the total state population, and were involved in 5% of pedestrian and bicyclist fatalities in Washington state.
Persons over the age of 65 are disproportionately represented in traffic fatalities of people walking and
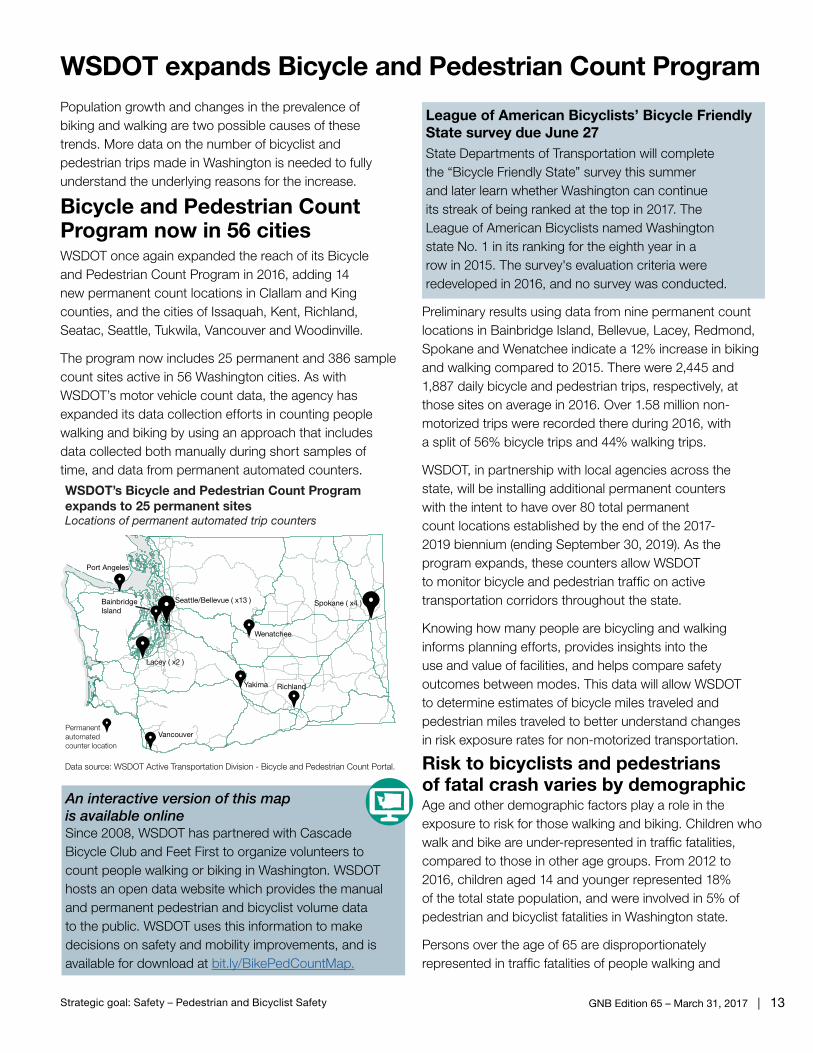
WSDOT expands Bicycle and Pedestrian Count ProgramPopulation growth and changes in the prevalence of biking and walking are two possible causes of these trends. More data on the number of bicyclist and pedestrian trips made in Washington is needed to fully understand the underlying reasons for the increase.
Bicycle and Pedestrian Count Program now in 56 cities WSDOT once again expanded the reach of its Bicycle and Pedestrian Count Program in 2016, adding 14 new permanent count locations in Clallam and King counties, and the cities of Issaquah, Kent, Richland, Seatac, Seattle, Tukwila, Vancouver and Woodinville.
The program now includes 25 permanent and 386 sample count sites active in 56 Washington cities. As with WSDOT’s motor vehicle count data, the agency has expanded its data collection efforts in counting people walking and biking by using an approach that includes data collected both manually during short samples of time, and data from permanent automated counters.
Data source: WSDOT Active Transportation Division - Bicycle and Pedestrian Count Portal.
Permanent automated counter location
Seattle/Bellevue ( x13 )
Wenatchee
Spokane ( x4 )
RichlandYakima
Vancouver
Port Angeles
Lacey ( x2 )
Bainbridge Island
WSDOT’s Bicycle and Pedestrian Count Program expands to 25 permanent sitesLocations of permanent automated trip counters
League of American Bicyclists’ Bicycle Friendly State survey due June 27State Departments of Transportation will complete the “Bicycle Friendly State” survey this summer and later learn whether Washington can continue its streak of being ranked at the top in 2017. The League of American Bicyclists named Washington state No. 1 in its ranking for the eighth year in a row in 2015. The survey's evaluation criteria were redeveloped in 2016, and no survey was conducted.
An interactive version of this map is available online Since 2008, WSDOT has partnered with Cascade Bicycle Club and Feet First to organize volunteers to count people walking or biking in Washington. WSDOT hosts an open data website which provides the manual and permanent pedestrian and bicyclist volume data to the public. WSDOT uses this information to make decisions on safety and mobility improvements, and is available for download at bit.ly/BikePedCountMap.
14 | GNB Edition 65 – March 31, 2017 Strategic goal: Safety – Pedestrian and Bicyclist Safety
biking. From 2012 to 2016, persons aged 65 and older represented 14% of the total population and were involved in 24% of fatal non-motorist traffic incidents.
Income also correlates with the risk of a fatal crash. Locations which have poverty rates above Washington's average saw 53% of fatal injury crashes involving pedestrians and bicyclists although these areas comprise only 38% of the state's population. Fifty-six percent of such serious injury crashes also occurred in these areas.
WSDOT focuses on active transportationActive transportation, any human-powered mode of transport, is essential to a transportation system that works for everyone. WSDOT reorganized its pedestrian and bicycle program into the new Active Transportation Division in March 2017. By creating the Active Transportation Division, WSDOT brings biking and walking to the table alongside other modes in agency structure and processes to achieve its vision of an integrated, multimodal transportation system for all travelers in the state.
Risk-reduction research will help guide safety improvementsWSDOT is undertaking research to develop a method to proactively reduce the potential for pedestrian crashes at different locations throughout the state roadway system. This effort will analyze pedestrian-vehicle crash data in an attempt to identify locations where a combination of factors might lead to increased exposure or higher future crash potential. The research will consider roadway, land use, traffic mix, traffic volume, socioeconomic and other data. Because crashes involving pedestrians are less common, relatively, this model would be used to compare and
prioritize locations and identify potential countermeasures, including at sites which may not yet have a crash history.
WSDOT collaborates on state’s traffic safety plan, Target ZeroIn 2016, WSDOT helped update the Washington state highway safety plan, Target Zero (www.targetzero.com). The goal is to decrease traffic fatalities and serious injuries of all types to zero by 2030. The plan sets priorities, lists potential strategies and monitors safety outcomes. The pedestrian and bicycle chapters emphasize the need to focus on vehicle speed, road crossings, and visibility. Recommended strategies include:
�Considering the context of the roadway and adjacent land use when designing speed limits;
� Installing features to lower traffic operating speeds, such as trees or lane configuration changes;
� Installing refuge islands, curb extensions and/or flashing beacons where pedestrian crossing enhancements are needed.
The plan points to the need to prioritize these efforts at locations where many people are walking and biking—
where the risk exposure is expected to be highest. Such a data-driven approach to traffic safety is exemplary of WSDOT's Practical Solutions Agency Emphasis Area, which focuses on using data to guide decisions.
Fatality data helps prioritize locations for safety improvements statewideInsights from data reinforce the need to focus investment toward the strategies outlined in Target Zero. Over a five-year period from 2012 to 2016, 86% of fatal traffic incidents involving people walking and biking occurred at sites with a posted speed limit of at least 30 mph.
A lack of traffic control devices, such as stop signs or painted crosswalks, is another characteristic of many crash sites. During the same five years, these locations saw 83% of the fatal traffic incidents involving people walking and biking.
Such crashes occurred in urban areas 77% of the time, likely because biking and walking prevalence is higher there relative to rural areas. Fifty-four percent of incidents occurred while the person was crossing the street, and one-third occurred at designated intersections.
Strategic Plan Goal 2: MODAL INTEGRATIONMultimodal Safety Strategy - Align
multimodal safety policy-making across the agency.
In support of this strategy, WSDOT has been working toward expanding the pedestrian and bicyclist count program through the use of electronic counters to more accurately estimate user demand, measure investment benefits, and help prioritize and design safety projects.
WSDOT focusing on multimodal traffic safety
GNB Edition 65 – March 31, 2017 | 15Strategic goal: Safety – Pedestrian and Bicyclist Safety
Two new councils will advise on bicyclist and pedestrian safetyThe Washington state Legislature passed Senate Bill 5402 in April 2017, requiring the establishment of the Cooper Jones Bicycle Safety Advisory Council. Jones was a 13-year-old Spokane resident, who died due to a negligent driver in 1997 while participating in a race with his cycling club. The council will review and analyze data related to bicyclist fatalities and serious injuries, identify points at which the transportation system can be improved and identify patterns in bicyclist fatalities and serious injuries. The council reports to the Legislature's transportation committees on the strategies that have been deployed to improve bicyclist safety, and will recommend whether it should be continued by December 1, 2018.
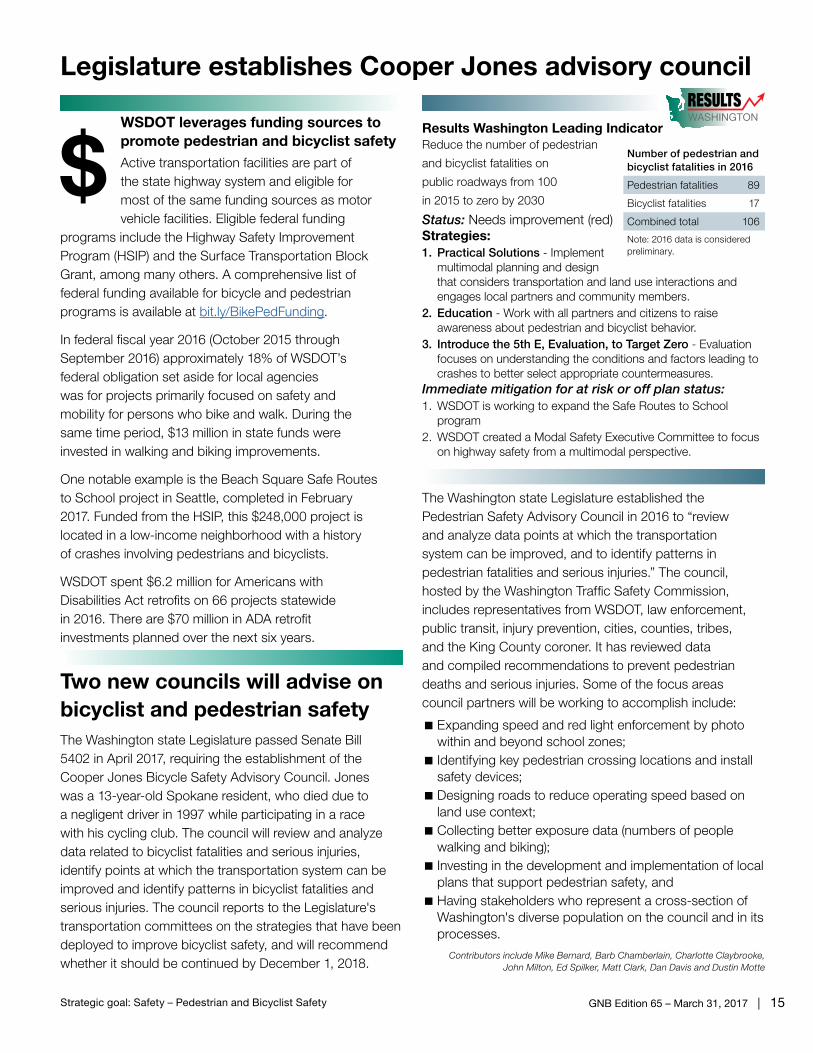
Results Washington Leading IndicatorReduce the number of pedestrian
and bicyclist fatalities on
public roadways from 100
in 2015 to zero by 2030
Status: Needs improvement (red)Strategies: 1. Practical Solutions - Implement
multimodal planning and design that considers transportation and land use interactions and engages local partners and community members.
2. Education - Work with all partners and citizens to raise awareness about pedestrian and bicyclist behavior.
3. Introduce the 5th E, Evaluation, to Target Zero - Evaluation focuses on understanding the conditions and factors leading to crashes to better select appropriate countermeasures.
Immediate mitigation for at risk or off plan status:1. WSDOT is working to expand the Safe Routes to School
program2. WSDOT created a Modal Safety Executive Committee to focus
on highway safety from a multimodal perspective.
Number of pedestrian and bicyclist fatalities in 2016
Pedestrian fatalities 89
Bicyclist fatalities 17
Combined total 106
Note: 2016 data is considered preliminary.
The Washington state Legislature established the Pedestrian Safety Advisory Council in 2016 to “review and analyze data points at which the transportation system can be improved, and to identify patterns in pedestrian fatalities and serious injuries.” The council, hosted by the Washington Traffic Safety Commission, includes representatives from WSDOT, law enforcement, public transit, injury prevention, cities, counties, tribes, and the King County coroner. It has reviewed data and compiled recommendations to prevent pedestrian deaths and serious injuries. Some of the focus areas council partners will be working to accomplish include:
�Expanding speed and red light enforcement by photo within and beyond school zones; � Identifying key pedestrian crossing locations and install safety devices; �Designing roads to reduce operating speed based on land use context; �Collecting better exposure data (numbers of people walking and biking); � Investing in the development and implementation of local plans that support pedestrian safety, and �Having stakeholders who represent a cross-section of Washington's diverse population on the council and in its processes.
Contributors include Mike Bernard, Barb Chamberlain, Charlotte Claybrooke, John Milton, Ed Spilker, Matt Clark, Dan Davis and Dustin Motte
Legislature establishes Cooper Jones advisory council
WSDOT leverages funding sources to promote pedestrian and bicyclist safetyActive transportation facilities are part of the state highway system and eligible for most of the same funding sources as motor vehicle facilities. Eligible federal funding
programs include the Highway Safety Improvement Program (HSIP) and the Surface Transportation Block Grant, among many others. A comprehensive list of federal funding available for bicycle and pedestrian programs is available at bit.ly/BikePedFunding.
In federal fiscal year 2016 (October 2015 through September 2016) approximately 18% of WSDOT’s federal obligation set aside for local agencies was for projects primarily focused on safety and mobility for persons who bike and walk. During the same time period, $13 million in state funds were invested in walking and biking improvements.
One notable example is the Beach Square Safe Routes to School project in Seattle, completed in February 2017. Funded from the HSIP, this $248,000 project is located in a low-income neighborhood with a history of crashes involving pedestrians and bicyclists.
WSDOT spent $6.2 million for Americans with Disabilities Act retrofits on 66 projects statewide in 2016. There are $70 million in ADA retrofit investments planned over the next six years.
$

16 | GNB Edition 65 – March 31, 2017 Strategic goal: Preservation – Safety Rest Areas
Asset Management:Safety Rest Areas Annual Report65
WSDOT rest area operation costs per visitor increase slightlyWSDOT’s rest area expenditures are within 1% of the $13.2 million 2015-2017 biennial budget. The cost per visitor using WSDOT rest areas increased slightly from the previous biennium. In the 2013-2015 biennium, the cost ranged from 10 cents to 80 cents per visitor. The 2015-2017 cost is 14 to 90 cents per visitor. Costs vary due to both the volume of visitors and the fixed costs to maintain and operate rest area facilities, regardless of use. The slight increase in cost between the bienniums is due in part to increased labor costs. WSDOT continues to track individual rest area expenditures to identify operational efficiencies. Tracking expenditures and preventive and corrective maintenance tasks provides WSDOT the information it needs to develop and analyze scenarios for operations improvements and cost savings. Tracking repair costs helps WSDOT accurately identify future system replacement needs.
Rest area use increases in 2016 to 24 million visitorsAn estimated 24 million visitors used WSDOT safety rest areas in calendar year 2016, which is about 615,000 or 3% more than the 23.1 million estimated visitors in 2015, and the highest number in the past decade.
Visitor estimates are generally based on water use. WSDOT is planning to install permanent traffic counters at rest areas to generate more accurate visitor and recreational vehicle (RV) dump station user information. WSDOT expects to add the counters as funding becomes available and anticipates the process will begin in 2018.
The 47 statewide rest areas provide safe places for travelers to take a break from driving. All rest areas provide bathroom facilities while most also have traveler information, picnic tables, pet areas, and may offer free coffee through a volunteer program.
Notable results � Visits to safety rest areas increased statewide
by 3% between 2015 and 2016, to 24 million � Aging rest area systems resulted in
13 unanticipated emergent needs projects totaling more than $730,000
Site with RV dump station
Site without RV dump station
This map is interactive online and is updated annually. Click anywhere
on the map to explore information on visitor use levels for each safety rest area or go to http://bit.ly/GNBrestareasmap.
WSDOT operates 47 safety rest areas in Washington state, 20 with recreational vehicle dump stations. Twenty-eight rest areas are located on the interstate highway system, each approximately 30 to 45 miles apart. This is consistent with the Federal Highway Administration’s recommended spacing guidelines for safety rest areas on highways and major arterials. Another 20 rest areas are located on state routes and are particularly vital due to their more remote locations in areas with limited public services. The annual visitor use is much greater at the interstate sites, which are heavily used by commercial truck drivers.
WSDOT safety rest areas have 24 million visitorsCalendar year 2016
Return toTable of
Contents
GNB Edition 65 – March 31, 2017 | 17Strategic goal: Preservation – Safety Rest Areas
WSDOT keeps its “B” grade for rest area maintenanceWhile visitor use increased, WSDOT safety rest areas again met their maintenance goal. As part of WSDOT’s Maintenance Accountability Process, staff conducts regular, random operational surveys of rest areas. Each survey examines the condition of a rest area at the time staff arrived on site. Survey items are scored and graded on an “A” through “F” scale. WSDOT rest areas continue to score a “B” grade on average. To earn a “B” grade a rest area site must appear clean, and have water and sewer systems that are operational. While the surveys indicate that the grounds and building are well cared for, some may show signs of wear, graffiti, or have minor damage.
Other factors that contribute to the grades include non-operational building utilities, fixtures, recreational vehicle dumps, and the appearance of landscaped areas, sidewalks and pavement. Gray Notebook 60, p. 20 has a detailed overview of the grading scale for maintenance items.
Emergent needs projects total $730,000 to date in current bienniumFrom July 1, 2015 through March 31, 2017, WSDOT executed 13 unanticipated emergent needs projects to repair or replace failed site infrastructure at a cost of more than $730,000. These projects include repairs to failing rest area sewer systems at Elma, Maytown, and Quincy Valley, as well as repairs to failing water systems at Schrag Eastbound, Ryegrass Westbound, and Winchester Westbound. A major lagoon study is underway that will improve operation and maintenance and reduce emergent issues.
Thirty-nine of WSDOT’s 47 rest areas are 30 years old or older. This includes 31 restroom buildings that are at least 30 years old. The age of rest areas is a major contributing factor to the maintenance preservation backlog for buildings and the utilities that serve them. The highest priority is to maintain, operate and preserve building and system assets to extend their useful life and the service life of the safety rest area. As assets age, it is increasingly difficult to forecast needs for site infrastructure such as water, wastewater, and electrical
systems that are often underground. These deficiencies are typically detectable only upon system failure.
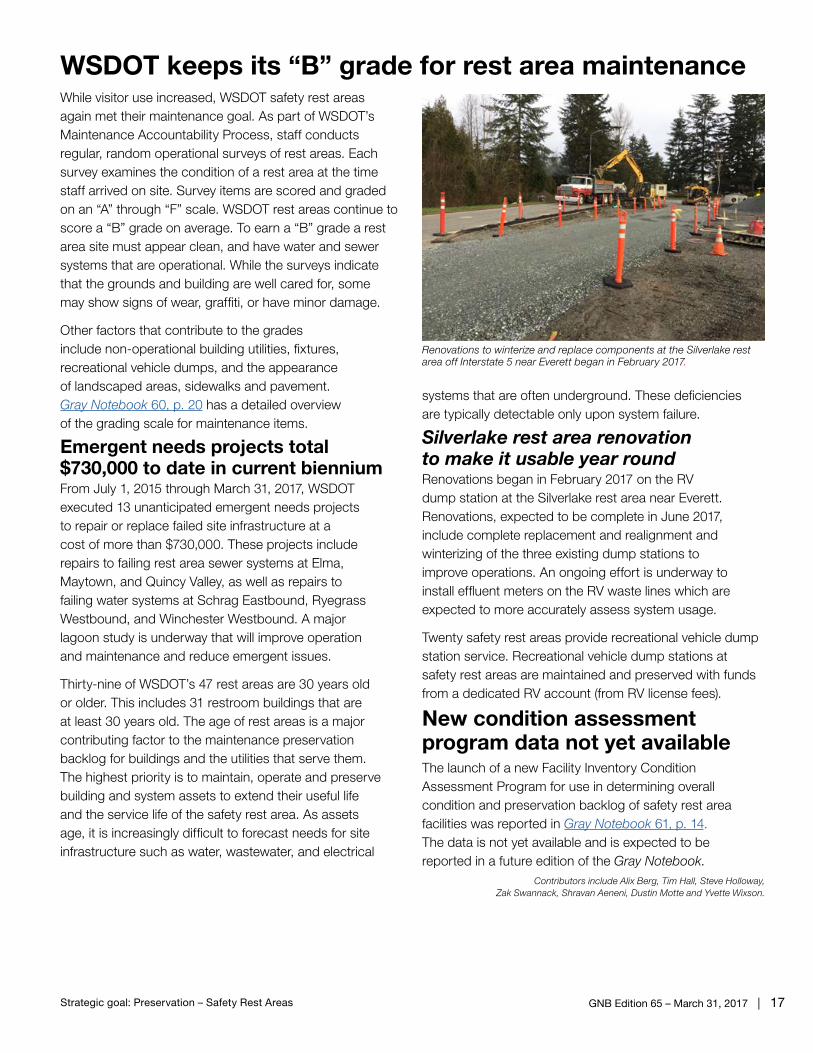
Silverlake rest area renovation to make it usable year roundRenovations began in February 2017 on the RV dump station at the Silverlake rest area near Everett. Renovations, expected to be complete in June 2017, include complete replacement and realignment and winterizing of the three existing dump stations to improve operations. An ongoing effort is underway to install effluent meters on the RV waste lines which are expected to more accurately assess system usage.
Twenty safety rest areas provide recreational vehicle dump station service. Recreational vehicle dump stations at safety rest areas are maintained and preserved with funds from a dedicated RV account (from RV license fees).
New condition assessment program data not yet availableThe launch of a new Facility Inventory Condition Assessment Program for use in determining overall condition and preservation backlog of safety rest area facilities was reported in Gray Notebook 61, p. 14. The data is not yet available and is expected to be reported in a future edition of the Gray Notebook.
Contributors include Alix Berg, Tim Hall, Steve Holloway, Zak Swannack, Shravan Aeneni, Dustin Motte and Yvette Wixson.
Renovations to winterize and replace components at the Silverlake rest area off Interstate 5 near Everett began in February 2017.
18 | GNB Edition 65 – March 31, 2017 Strategic goal: Mobility – Travel Information
Travel Information Annual Report65
Notable results � WSDOT’s Facebook page “likes” increased
77% from 34,832 in April 2016 to 61,688 in March 2017
� The number of “@wsdot_traffic” Twitter followers increased 130% from 143,194 in April 2016 to 329,381 in March 2017
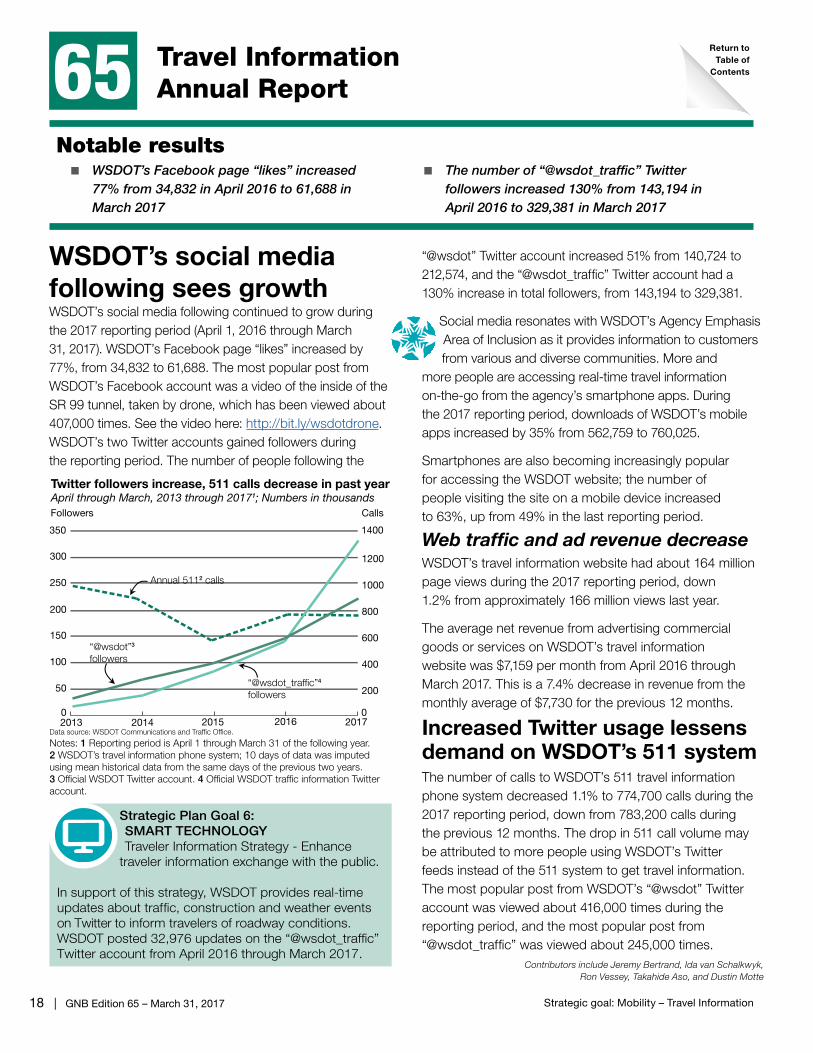
“@wsdot” Twitter account increased 51% from 140,724 to 212,574, and the “@wsdot_traffic” Twitter account had a 130% increase in total followers, from 143,194 to 329,381.
Social media resonates with WSDOT’s Agency Emphasis Area of Inclusion as it provides information to customers from various and diverse communities. More and
more people are accessing real-time travel information on-the-go from the agency’s smartphone apps. During the 2017 reporting period, downloads of WSDOT’s mobile apps increased by 35% from 562,759 to 760,025.
Smartphones are also becoming increasingly popular for accessing the WSDOT website; the number of people visiting the site on a mobile device increased to 63%, up from 49% in the last reporting period.
Web traffic and ad revenue decreaseWSDOT’s travel information website had about 164 million page views during the 2017 reporting period, down 1.2% from approximately 166 million views last year.
The average net revenue from advertising commercial goods or services on WSDOT’s travel information website was $7,159 per month from April 2016 through March 2017. This is a 7.4% decrease in revenue from the monthly average of $7,730 for the previous 12 months.
Increased Twitter usage lessens demand on WSDOT’s 511 systemThe number of calls to WSDOT’s 511 travel information phone system decreased 1.1% to 774,700 calls during the 2017 reporting period, down from 783,200 calls during the previous 12 months. The drop in 511 call volume may be attributed to more people using WSDOT’s Twitter feeds instead of the 511 system to get travel information. The most popular post from WSDOT’s “@wsdot” Twitter account was viewed about 416,000 times during the reporting period, and the most popular post from “@wsdot_traffic” was viewed about 245,000 times.
Contributors include Jeremy Bertrand, Ida van Schalkwyk, Ron Vessey, Takahide Aso, and Dustin Motte
WSDOT’s social media following sees growthWSDOT’s social media following continued to grow during the 2017 reporting period (April 1, 2016 through March 31, 2017). WSDOT’s Facebook page “likes” increased by 77%, from 34,832 to 61,688. The most popular post from WSDOT’s Facebook account was a video of the inside of the SR 99 tunnel, taken by drone, which has been viewed about 407,000 times. See the video here: http://bit.ly/wsdotdrone. WSDOT’s two Twitter accounts gained followers during the reporting period. The number of people following the
Twitter followers increase, 511 calls decrease in past yearApril through March, 2013 through 20171; Numbers in thousands
Data source: WSDOT Communications and Traffic Office.
Notes: 1 Reporting period is April 1 through March 31 of the following year. 2 WSDOT’s travel information phone system; 10 days of data was imputed using mean historical data from the same days of the previous two years. 3 Official WSDOT Twitter account. 4 Official WSDOT traffic information Twitter account.
0
50
100
150
200
250
300
0
200
400
600
800
1000
1200
2016201520142013
350 1400
Followers Calls
“@wsdot”3
followers
“@wsdot_traffic”4 followers
Annual 5112 calls
2017
Strategic Plan Goal 6: SMART TECHNOLOGYTraveler Information Strategy - Enhance
traveler information exchange with the public.
In support of this strategy, WSDOT provides real-time updates about traffic, construction and weather events on Twitter to inform travelers of roadway conditions.WSDOT posted 32,976 updates on the “@wsdot_traffic”Twitter account from April 2016 through March 2017.
Return toTable of
Contents
GNB Edition 65 – March 31, 2017 | 19Strategic goal: Mobility – Incident Response
Incident ResponseQuarterly Update 65
Notable results � WSDOT responded to 15,387 incidents
during the quarter, providing an estimated $23.3 million in economic benefits
� WSDOT cleared incidents in 12 minutes and 6 seconds on average, reducing traffic delay and the risk of secondary incidents
incidents happen in the congestion resulting from a primary incident and may be caused by distracted driving, unexpected slowdowns or debris in the roadway. The IR teams help alert drivers about incidents and clear the roadway to reduce the likelihood of secondary incidents. A table summarizing the IR program’s performance and benefits for the quarter is on the next page.
WSDOT’s assistance at incident scenes provided an estimated $23.3 million in economic benefits during the first quarter of 2017 by reducing the impacts of incidents on drivers. These benefits are provided in two ways. First, by clearing incidents quickly, WSDOT reduces the time and fuel motorists waste in incident-induced traffic delay.
About $13.1 million of IR’s economic benefits for the quarter comes from reduced traffic delay. Second, by proactively managing traffic at incident scenes, WSDOT helps prevent secondary incidents. About $10.1 million of IR’s economic benefit results from preventing an estimated 2,933 secondary incidents and resulting delay. This figure is based on Federal Highway Administration data, which indicates that about 20% of primary incidents on highways result in a secondary incident.
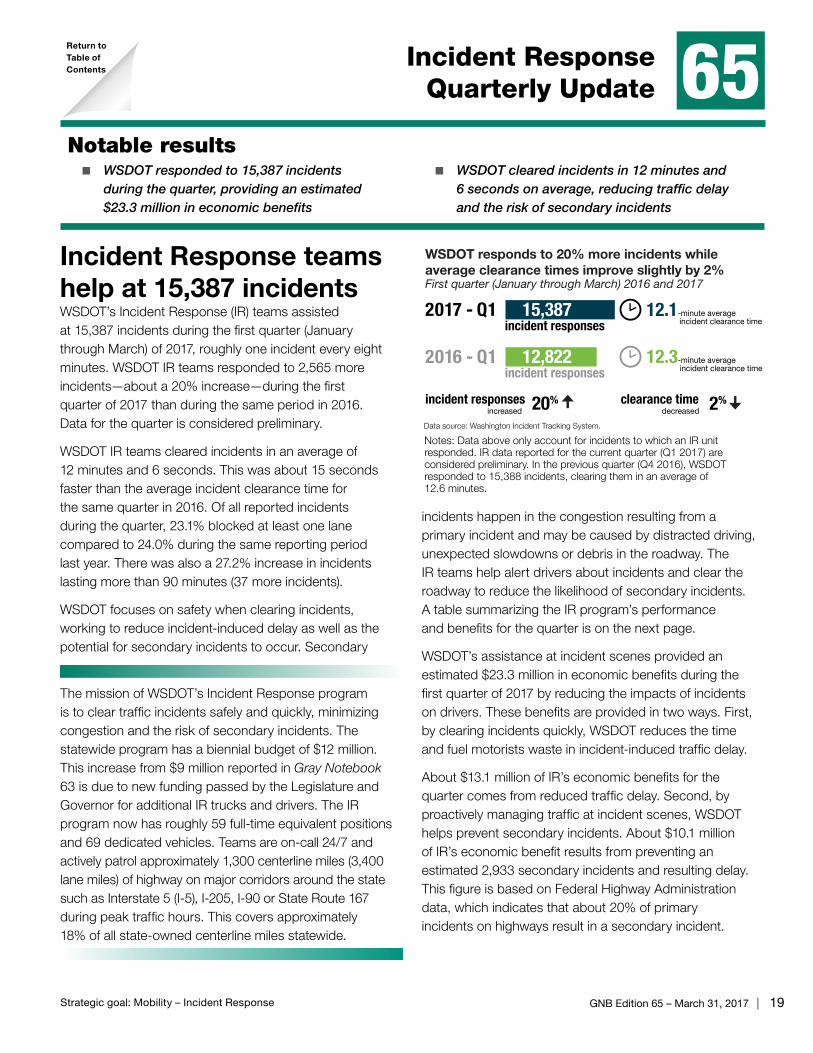
Incident Response teams help at 15,387 incidentsWSDOT’s Incident Response (IR) teams assisted at 15,387 incidents during the first quarter (January through March) of 2017, roughly one incident every eight minutes. WSDOT IR teams responded to 2,565 more incidents—about a 20% increase—during the first quarter of 2017 than during the same period in 2016. Data for the quarter is considered preliminary.
WSDOT IR teams cleared incidents in an average of 12 minutes and 6 seconds. This was about 15 seconds faster than the average incident clearance time for the same quarter in 2016. Of all reported incidents during the quarter, 23.1% blocked at least one lane compared to 24.0% during the same reporting period last year. There was also a 27.2% increase in incidents lasting more than 90 minutes (37 more incidents).
WSDOT focuses on safety when clearing incidents, working to reduce incident-induced delay as well as the potential for secondary incidents to occur. Secondary
12.3-minute average incident clearance time
12.1-minute average incident clearance time
Data source: Washington Incident Tracking System.
WSDOT responds to 20% more incidents while average clearance times improve slightly by 2% First quarter (January through March) 2016 and 2017
Notes: Data above only account for incidents to which an IR unit responded. IR data reported for the current quarter (Q1 2017) are considered preliminary. In the previous quarter (Q4 2016), WSDOT responded to 15,388 incidents, clearing them in an average of 12.6 minutes.
2016 - Q1 12,822
15,387
incident responses
incident responses
incident responses increased
20% clearance time decreased 2%
2017 - Q1
The mission of WSDOT’s Incident Response program is to clear traffic incidents safely and quickly, minimizing congestion and the risk of secondary incidents. The statewide program has a biennial budget of $12 million. This increase from $9 million reported in Gray Notebook 63 is due to new funding passed by the Legislature and Governor for additional IR trucks and drivers. The IR program now has roughly 59 full-time equivalent positions and 69 dedicated vehicles. Teams are on-call 24/7 and actively patrol approximately 1,300 centerline miles (3,400 lane miles) of highway on major corridors around the state such as Interstate 5 (I-5), I-205, I-90 or State Route 167 during peak traffic hours. This covers approximately 18% of all state-owned centerline miles statewide.
Return toTable of Contents

20 | GNB Edition 65 – March 31, 2017 Strategic goal: Mobility – Incident Response
Incident Response saves motorists $23.3 millionThe Incident Response program aligns with WSDOT’s Agency Emphasis Area, Practical Solutions, by improving the performance of the multimodal
transportation system at the least cost. Based on WSDOT’s budget for IR every $1 spent on the program this quarter provided drivers roughly $15.53 in economic benefit.
WSDOT teams help reduce incident-related delayIncident-induced traffic delay on state highways cost motorists an estimated $52.7 million in wasted time and fuel during the first quarter of 2017. This is about $8 million more than in the same quarter of 2016. Without WSDOT’s assistance, this economic impact would have been roughly $76.0 million ($23.3 million in prevented delay and secondary incidents plus $52.7 million in actual delay).
For more information on how WSDOT calculates these figures and all IR performance metrics, see WSDOT’s Handbook for Corridor Capacity Evaluation 2nd edition, pp. 45-47.
WSDOT teams respond to 173 over-90-minute incidentsWSDOT Incident Response units provided assistance at the scene of 173 incidents that lasted more than 90 minutes during the first quarter of 2017. This is 37 more incidents (27.2%) than the same quarter in 2016. The increase was likely influenced by record below-normal temperatures and above-normal precipitation. While these over-90-minute incidents accounted for 1.1% of all incidents, they resulted
in 19.5% of all incident-related delay costs.
Ten of the 173 over-90-minute incidents took six hours or more to clear (referred to as extraordinary incidents). The 10 extraordinary incidents took an average of eight hours and 36 minutes to clear, accounting for about 3.4% of all incident-induced delay costs for the quarter. This is seven more extraordinary incidents than the same quarter in 2016.
The average clearance time for all over-90-minute incidents was about two hours and 58 minutes. This is about seven minutes longer than the same quarter in 2016. Excluding the 10 extraordinary incidents, WSDOT’s average clearance time for over-90-minute incidents was two hours and 37 minutes. Performance data reported in this article is from WSDOT’s Washington Incident Tracking System, which tracks incidents to which a WSDOT IR team responded.
Contributors include Vince Fairhurst, Ida van Schalkwyk Takahide Aso and Dustin Motte
WSDOT’s Incident Response prevents $23.3 million in traffic delays and secondary incidentsJanuary through March 2017; Incidents by duration; Times in minutes; Costs and benefits in millions of dollars
Incident duration
Number of incidents1
Percent blocking2
Average roadway clearance time3
(blocking only)
Average roadway clearance time3
(all incidents)
Average incident clearance time4
(all incidents)
Cost of incident-
induced delay
Economic benefits from
IR program5
Less than 15 min. 11,940 13.3% 3.1 0.4 4.7 $14.2 $6.6
Between 15 and 90 min.
3,274 55.4% 16.8 9.3 30.1 $28.2 $12.3
Over 90 min. 173 91.2% 146.8 133.9 178.2 $10.3 $4.3
Total 15,387 23.1% 16.6 3.8 12.1 $52.7 $23.3
Percent change from first quarter 2016
20% 1% 24% 27% 2% 18% 18%
Data source: Washington Incident Tracking System.
Notes: Some numbers do not add up due to rounding. 1 Teams were unable to locate 721 of the 15,387 incidents. Because an IR team attempted to respond, these incidents are included in the total incident count, but are not factored into other performance measures. 2 An incident is considered blocking when it shuts down one or more lanes of travel. 3 Roadway clearance time is the time between the IR team’s first awareness of an incident (when a call comes in or the incident is spotted by a patrolling IR unit) and when all lanes are available for traffic flow. 4 Incident clearance time is the time between an IR team’s first awareness of an incident and when the last responder has left the scene. 5 Estimated economic benefits include benefits from delay reduction and prevented secondary incidents.
Customer feedback: WSDOT IR teams give comment cards to drivers they help. Below are samples of the comments received from drivers WSDOT assisted during the first quarter of 2017:
�With heartfelt gratitude to Richard for rescuing in my most dangerous situation on I-405 South Freeway. Thank you for changing my flat tire. You are amazing.
�Trent showed up about 5 minutes after our flat tire on I-5 and had us on our way in less than 15 minutes!
“
“
GNB Edition 65 – March 31, 2017 | 21Strategic goal: Mobility – WSDOT Ferries
WSDOT Ferries Quarterly Update 65
Notable results � WSDOT Ferries made 99.8% of its regularly
scheduled trips during the third quarter of fiscal year 2017
� WSDOT Ferries on-time performance decreased from 96.3% to 96.2% between the third quarters of FY2016 and FY2017
Four Ferries routes attain 100% reliability for quarterWSDOT Ferries completed 99.8% (38,583 of 38,676) of its regularly scheduled trips during the third quarter of fiscal year 2017 (January 1 through March 31, 2017). This was above the annual reliability performance goal of 99% and slightly higher than the 99.7% achieved during the same quarter in fiscal year (FY) 2016. In the third quarter of FY2017, WSDOT canceled 152 trips and was able to replace 59 of them, resulting in 93 net missed trips. This was five less net missed trips compared to the same quarter in FY2016.
Four routes, Edmonds – Kingston, Fauntleroy – Vashon – Southworth, Mukilteo – Clinton, and the International Route all completed the third quarter of FY2017 with a trip reliability rate of 100.0%. The Fauntleroy – Vashon – Southworth route had the largest increase for last quarter compared to the same quarter in FY2016, improving from
99.8% to 100% in FY2017. That increase equates to 14 fewer net missed trips than the same quarter the prior year.
The Port Townsend – Coupeville route had the largest drop in reliability (1.1%) from the third quarter of FY2016 to the third quarter of FY2017, as well as the lowest reliability overall (96.1%). Weather and tides were the reasons for all cancellations on the Port Townsend – Coupeville route. Without those cancellations, the route would have performed at a 100% reliability level.
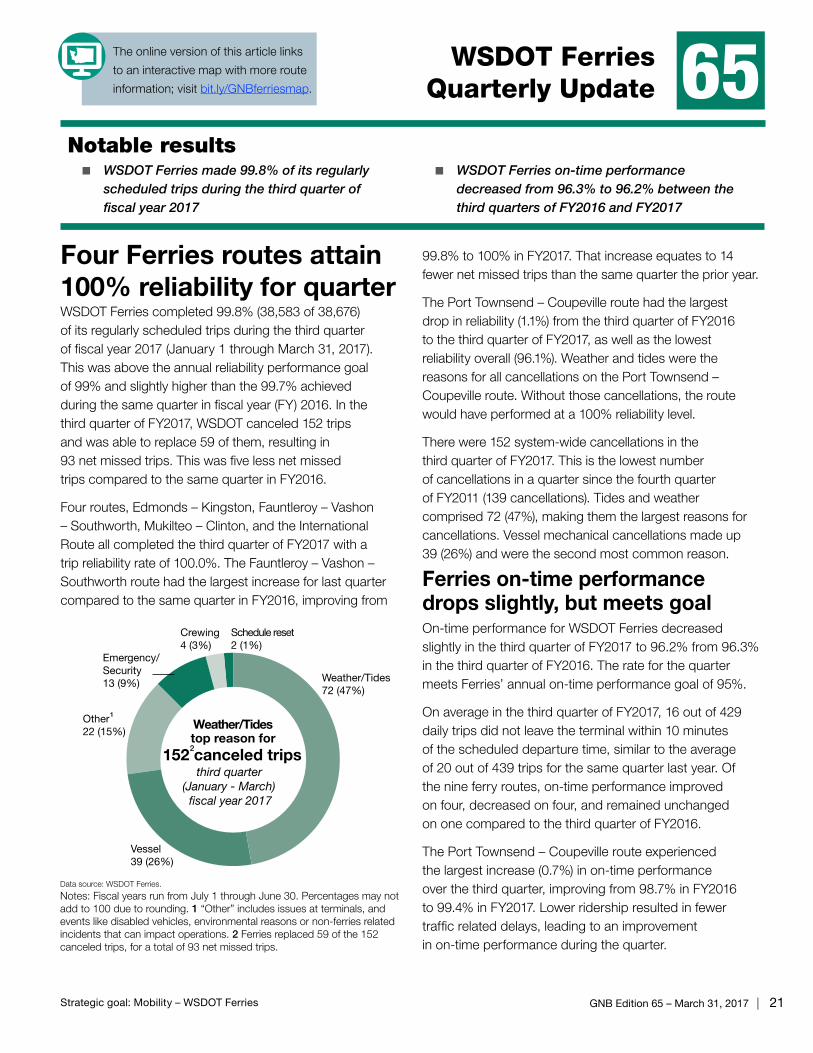
There were 152 system-wide cancellations in the third quarter of FY2017. This is the lowest number of cancellations in a quarter since the fourth quarter of FY2011 (139 cancellations). Tides and weather comprised 72 (47%), making them the largest reasons for cancellations. Vessel mechanical cancellations made up 39 (26%) and were the second most common reason.
Ferries on-time performance drops slightly, but meets goalOn-time performance for WSDOT Ferries decreased slightly in the third quarter of FY2017 to 96.2% from 96.3% in the third quarter of FY2016. The rate for the quarter meets Ferries’ annual on-time performance goal of 95%.
On average in the third quarter of FY2017, 16 out of 429 daily trips did not leave the terminal within 10 minutes of the scheduled departure time, similar to the average of 20 out of 439 trips for the same quarter last year. Of the nine ferry routes, on-time performance improved on four, decreased on four, and remained unchanged on one compared to the third quarter of FY2016.
The Port Townsend – Coupeville route experienced the largest increase (0.7%) in on-time performance over the third quarter, improving from 98.7% in FY2016 to 99.4% in FY2017. Lower ridership resulted in fewer traffic related delays, leading to an improvement in on-time performance during the quarter.
Data source: WSDOT Ferries.
Notes: Fiscal years run from July 1 through June 30. Percentages may not add to 100 due to rounding. 1 “Other” includes issues at terminals, and events like disabled vehicles, environmental reasons or non-ferries related incidents that can impact operations. 2 Ferries replaced 59 of the 152 canceled trips, for a total of 93 net missed trips.
Emergency/Security13 (9%) Weather/Tides
72 (47%)
Vessel39 (26%)
Other22 (15%)
1
Crewing4 (3%)
Weather/Tidestop reason for
152 canceled trips third quarter
(January - March) fiscal year 2017
2
Schedule reset2 (1%)
The online version of this article links
to an interactive map with more route
information; visit bit.ly/GNBferriesmap.
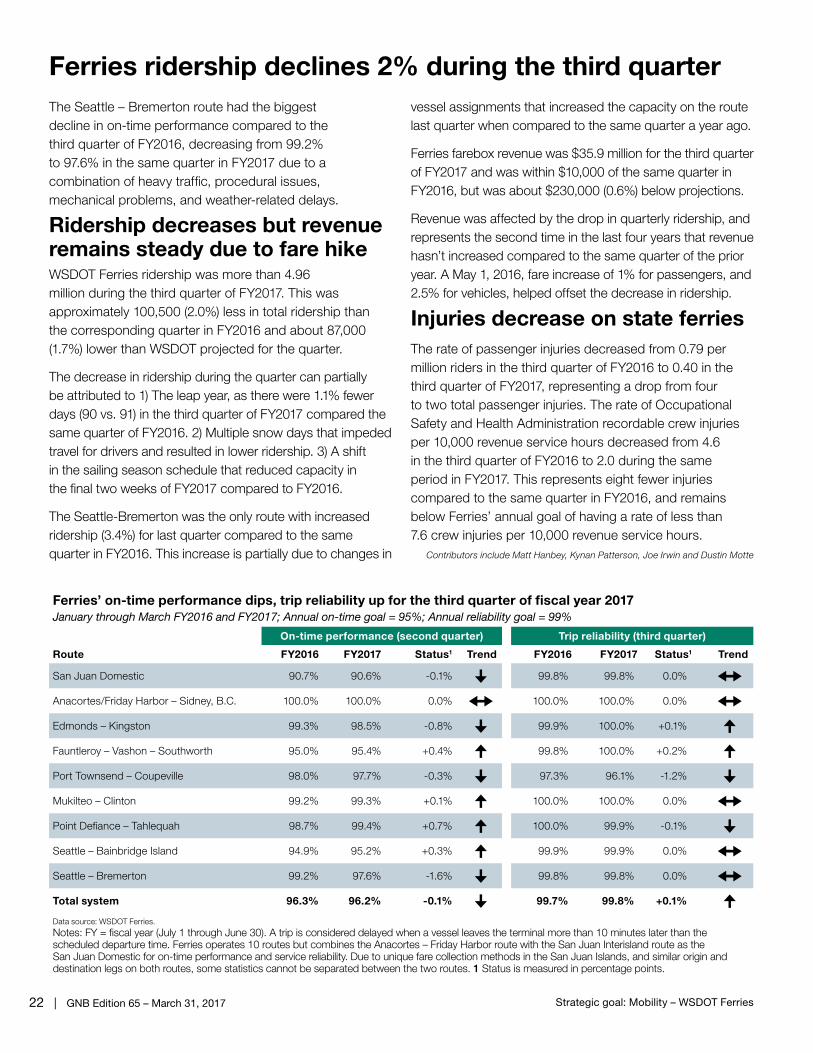
22 | GNB Edition 65 – March 31, 2017 Strategic goal: Mobility – WSDOT Ferries
Ferries ridership declines 2% during the third quarterThe Seattle – Bremerton route had the biggest decline in on-time performance compared to the third quarter of FY2016, decreasing from 99.2% to 97.6% in the same quarter in FY2017 due to a combination of heavy traffic, procedural issues, mechanical problems, and weather-related delays.
Ridership decreases but revenue remains steady due to fare hikeWSDOT Ferries ridership was more than 4.96 million during the third quarter of FY2017. This was approximately 100,500 (2.0%) less in total ridership than the corresponding quarter in FY2016 and about 87,000 (1.7%) lower than WSDOT projected for the quarter.
The decrease in ridership during the quarter can partially be attributed to 1) The leap year, as there were 1.1% fewer days (90 vs. 91) in the third quarter of FY2017 compared the same quarter of FY2016. 2) Multiple snow days that impeded travel for drivers and resulted in lower ridership. 3) A shift in the sailing season schedule that reduced capacity in the final two weeks of FY2017 compared to FY2016.
The Seattle-Bremerton was the only route with increased ridership (3.4%) for last quarter compared to the same quarter in FY2016. This increase is partially due to changes in
vessel assignments that increased the capacity on the route last quarter when compared to the same quarter a year ago.
Ferries farebox revenue was $35.9 million for the third quarter of FY2017 and was within $10,000 of the same quarter in FY2016, but was about $230,000 (0.6%) below projections.
Revenue was affected by the drop in quarterly ridership, and represents the second time in the last four years that revenue hasn’t increased compared to the same quarter of the prior year. A May 1, 2016, fare increase of 1% for passengers, and 2.5% for vehicles, helped offset the decrease in ridership.
Injuries decrease on state ferriesThe rate of passenger injuries decreased from 0.79 per million riders in the third quarter of FY2016 to 0.40 in the third quarter of FY2017, representing a drop from four to two total passenger injuries. The rate of Occupational Safety and Health Administration recordable crew injuries per 10,000 revenue service hours decreased from 4.6 in the third quarter of FY2016 to 2.0 during the same period in FY2017. This represents eight fewer injuries compared to the same quarter in FY2016, and remains below Ferries’ annual goal of having a rate of less than 7.6 crew injuries per 10,000 revenue service hours.
Contributors include Matt Hanbey, Kynan Patterson, Joe Irwin and Dustin Motte
Ferries’ on-time performance dips, trip reliability up for the third quarter of fiscal year 2017January through March FY2016 and FY2017; Annual on-time goal = 95%; Annual reliability goal = 99%
Route
On-time performance (second quarter) Trip reliability (third quarter)
FY2016 FY2017 Status1 Trend FY2016 FY2017 Status1 Trend
San Juan Domestic 90.7% 90.6% -0.1% 99.8% 99.8% 0.0% Anacortes/Friday Harbor – Sidney, B.C. 100.0% 100.0% 0.0% 100.0% 100.0% 0.0% Edmonds – Kingston 99.3% 98.5% -0.8% 99.9% 100.0% +0.1% Fauntleroy – Vashon – Southworth 95.0% 95.4% +0.4% 99.8% 100.0% +0.2% Port Townsend – Coupeville 98.0% 97.7% -0.3% 97.3% 96.1% -1.2% Mukilteo – Clinton 99.2% 99.3% +0.1% 100.0% 100.0% 0.0% Point Defiance – Tahlequah 98.7% 99.4% +0.7% 100.0% 99.9% -0.1% Seattle – Bainbridge Island 94.9% 95.2% +0.3% 99.9% 99.9% 0.0% Seattle – Bremerton 99.2% 97.6% -1.6% 99.8% 99.8% 0.0% Total system 96.3% 96.2% -0.1% 99.7% 99.8% +0.1% Data source: WSDOT Ferries.
Notes: FY = fiscal year (July 1 through June 30). A trip is considered delayed when a vessel leaves the terminal more than 10 minutes later than the scheduled departure time. Ferries operates 10 routes but combines the Anacortes – Friday Harbor route with the San Juan Interisland route as the San Juan Domestic for on-time performance and service reliability. Due to unique fare collection methods in the San Juan Islands, and similar origin and destination legs on both routes, some statistics cannot be separated between the two routes. 1 Status is measured in percentage points.
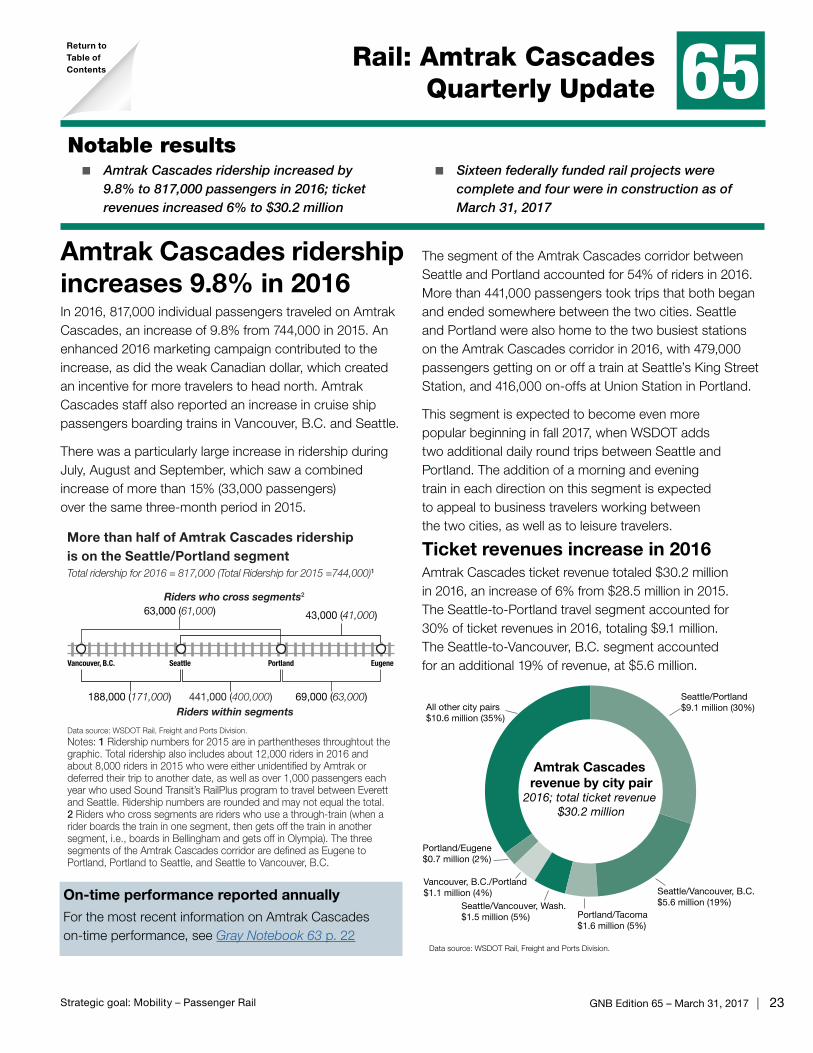
GNB Edition 65 – March 31, 2017 | 23Strategic goal: Mobility – Passenger Rail
Rail: Amtrak Cascades Quarterly Update 65
Notable results � Amtrak Cascades ridership increased by
9.8% to 817,000 passengers in 2016; ticket revenues increased 6% to $30.2 million
� Sixteen federally funded rail projects were complete and four were in construction as of March 31, 2017
The segment of the Amtrak Cascades corridor between Seattle and Portland accounted for 54% of riders in 2016. More than 441,000 passengers took trips that both began and ended somewhere between the two cities. Seattle and Portland were also home to the two busiest stations on the Amtrak Cascades corridor in 2016, with 479,000 passengers getting on or off a train at Seattle’s King Street Station, and 416,000 on-offs at Union Station in Portland.
This segment is expected to become even more popular beginning in fall 2017, when WSDOT adds two additional daily round trips between Seattle and Portland. The addition of a morning and evening train in each direction on this segment is expected to appeal to business travelers working between the two cities, as well as to leisure travelers.
Ticket revenues increase in 2016 Amtrak Cascades ticket revenue totaled $30.2 million in 2016, an increase of 6% from $28.5 million in 2015. The Seattle-to-Portland travel segment accounted for 30% of ticket revenues in 2016, totaling $9.1 million. The Seattle-to-Vancouver, B.C. segment accounted for an additional 19% of revenue, at $5.6 million.
Amtrak Cascades ridership increases 9.8% in 2016In 2016, 817,000 individual passengers traveled on Amtrak Cascades, an increase of 9.8% from 744,000 in 2015. An enhanced 2016 marketing campaign contributed to the increase, as did the weak Canadian dollar, which created an incentive for more travelers to head north. Amtrak Cascades staff also reported an increase in cruise ship passengers boarding trains in Vancouver, B.C. and Seattle.
There was a particularly large increase in ridership during July, August and September, which saw a combined increase of more than 15% (33,000 passengers) over the same three-month period in 2015.
More than half of Amtrak Cascades ridership is on the Seattle/Portland segmentTotal ridership for 2016 = 817,000 (Total Ridership for 2015 =744,000)1
Data source: WSDOT Rail, Freight and Ports Division.
Notes: 1 Ridership numbers for 2015 are in parthentheses throughtout the graphic. Total ridership also includes about 12,000 riders in 2016 and about 8,000 riders in 2015 who were either unidentified by Amtrak or deferred their trip to another date, as well as over 1,000 passengers each year who used Sound Transit’s RailPlus program to travel between Everett and Seattle. Ridership numbers are rounded and may not equal the total. 2 Riders who cross segments are riders who use a through-train (when a rider boards the train in one segment, then gets off the train in another segment, i.e., boards in Bellingham and gets off in Olympia). The three segments of the Amtrak Cascades corridor are defined as Eugene to Portland, Portland to Seattle, and Seattle to Vancouver, B.C.
Riders who cross segments2
Riders within segments
Vancouver, B.C. Seattle Portland Eugene
63,000 (61,000) 43,000 (41,000)
188,000 (171,000) 441,000 (400,000) 69,000 (63,000)
Data source: WSDOT Rail, Freight and Ports Division.
Portland/Eugene$0.7 million (2%)
Seattle/Vancouver, Wash.$1.5 million (5%) Portland/Tacoma
$1.6 million (5%)
Seattle/Vancouver, B.C.$5.6 million (19%)
Seattle/Portland$9.1 million (30%)
Vancouver, B.C./Portland$1.1 million (4%)
Amtrak Cascades revenue by city pair
2016; total ticket revenue $30.2 million
All other city pairs$10.6 million (35%)
On-time performance reported annuallyFor the most recent information on Amtrak Cascades on-time performance, see Gray Notebook 63 p. 22
Return toTable of Contents
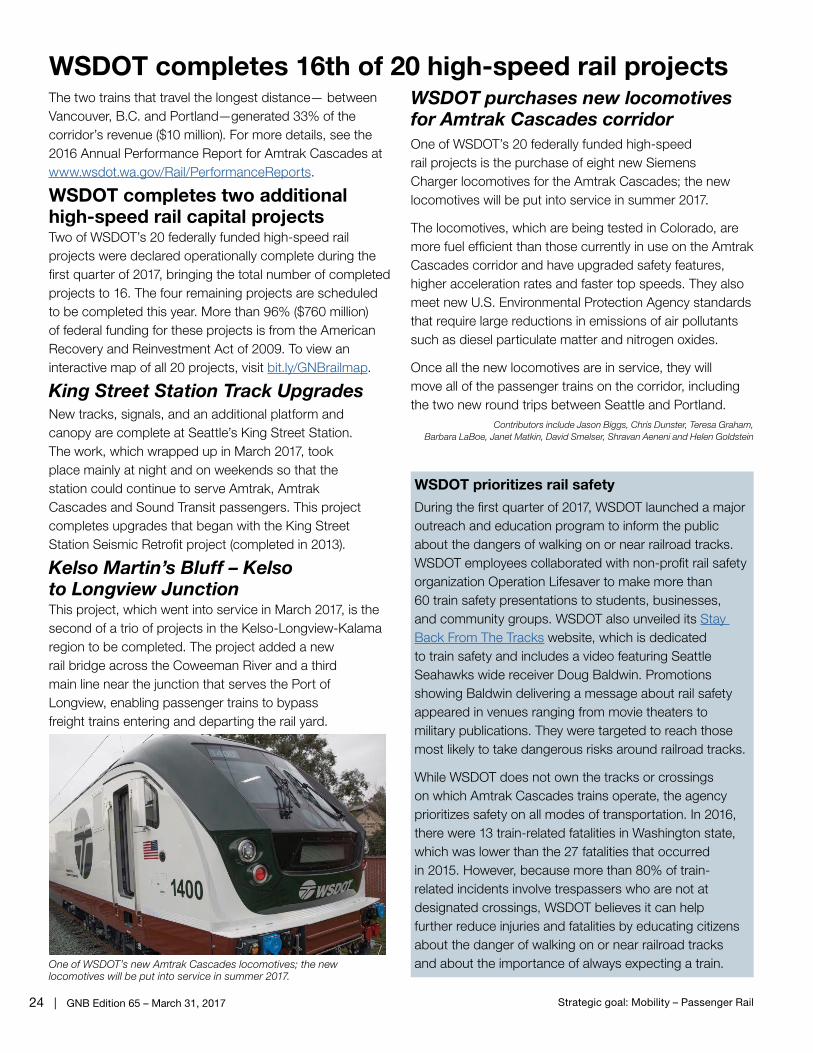
24 | GNB Edition 65 – March 31, 2017 Strategic goal: Mobility – Passenger Rail
WSDOT completes 16th of 20 high-speed rail projectsThe two trains that travel the longest distance— between Vancouver, B.C. and Portland—generated 33% of the corridor’s revenue ($10 million). For more details, see the 2016 Annual Performance Report for Amtrak Cascades at www.wsdot.wa.gov/Rail/PerformanceReports.
WSDOT completes two additional high-speed rail capital projectsTwo of WSDOT’s 20 federally funded high-speed rail projects were declared operationally complete during the first quarter of 2017, bringing the total number of completed projects to 16. The four remaining projects are scheduled to be completed this year. More than 96% ($760 million) of federal funding for these projects is from the American Recovery and Reinvestment Act of 2009. To view an interactive map of all 20 projects, visit bit.ly/GNBrailmap.
King Street Station Track UpgradesNew tracks, signals, and an additional platform and canopy are complete at Seattle’s King Street Station. The work, which wrapped up in March 2017, took place mainly at night and on weekends so that the station could continue to serve Amtrak, Amtrak Cascades and Sound Transit passengers. This project completes upgrades that began with the King Street Station Seismic Retrofit project (completed in 2013).
Kelso Martin’s Bluff – Kelso to Longview JunctionThis project, which went into service in March 2017, is the second of a trio of projects in the Kelso-Longview-Kalama region to be completed. The project added a new rail bridge across the Coweeman River and a third main line near the junction that serves the Port of Longview, enabling passenger trains to bypass freight trains entering and departing the rail yard.
One of WSDOT’s new Amtrak Cascades locomotives; the new locomotives will be put into service in summer 2017.
WSDOT purchases new locomotives for Amtrak Cascades corridorOne of WSDOT’s 20 federally funded high-speed rail projects is the purchase of eight new Siemens Charger locomotives for the Amtrak Cascades; the new locomotives will be put into service in summer 2017.
The locomotives, which are being tested in Colorado, are more fuel efficient than those currently in use on the Amtrak Cascades corridor and have upgraded safety features, higher acceleration rates and faster top speeds. They also meet new U.S. Environmental Protection Agency standards that require large reductions in emissions of air pollutants such as diesel particulate matter and nitrogen oxides.
Once all the new locomotives are in service, they will move all of the passenger trains on the corridor, including the two new round trips between Seattle and Portland.
Contributors include Jason Biggs, Chris Dunster, Teresa Graham, Barbara LaBoe, Janet Matkin, David Smelser, Shravan Aeneni and Helen Goldstein
WSDOT prioritizes rail safety
During the first quarter of 2017, WSDOT launched a major outreach and education program to inform the public about the dangers of walking on or near railroad tracks. WSDOT employees collaborated with non-profit rail safety organization Operation Lifesaver to make more than 60 train safety presentations to students, businesses, and community groups. WSDOT also unveiled its Stay Back From The Tracks website, which is dedicated to train safety and includes a video featuring Seattle Seahawks wide receiver Doug Baldwin. Promotions showing Baldwin delivering a message about rail safety appeared in venues ranging from movie theaters to military publications. They were targeted to reach those most likely to take dangerous risks around railroad tracks.
While WSDOT does not own the tracks or crossings on which Amtrak Cascades trains operate, the agency prioritizes safety on all modes of transportation. In 2016, there were 13 train-related fatalities in Washington state, which was lower than the 27 fatalities that occurred in 2015. However, because more than 80% of train-related incidents involve trespassers who are not at designated crossings, WSDOT believes it can help further reduce injuries and fatalities by educating citizens about the danger of walking on or near railroad tracks and about the importance of always expecting a train.

GNB Edition 65 – March 31, 2017 | 25Strategic goal: Environment – Wetlands Protection
Wetlands Protection Annual Report 65
Notable results
� WSDOT added 16 new wetland and stream mitigation sites on 99 acres in 2016, bringing the total to 279 sites on 1,573 acres
� WSDOT closed out 25 mitigation sites in 2016; 11 of these closed before the end of the 10-year monitoring period
� WSDOT completed the Pilchuck Creek advance mitigation site four years early
� Advance mitigation sites and banks provided agency transportation projects 2.2 credits in 2016
�98 wetland and stream mitigation sites currently in the 10-year monitoring period;
�One site past the initial monitoring period that has not yet met all its permit requirements;
�14 sites being evaluated by the U.S. Army Corps of Engineers (Corps) and Washington State Department of Ecology (Ecology) for completion of their permit requirements; and,
�166 sites in long-term stewardship that have met their permit requirements.
Refer to Gray Notebook 53, p. 20 for a description of the life of a typical WSDOT wetland mitigation site.
The number of monitored wetland and stream mitigation sites increased from 2001 to 2016 by 120% (54 to 119) and total acreage increased by 447% (213 to 1,165), mostly as a result of construction projects funded by the 2003 Nickel and the 2005 Transportation Partnership Account (TPA) revenue packages. The number of sites that required monitoring dropped from 2015 to 2016 as more sites funded by the Nickel and TPA revenue packages transferred to long-term stewardship compared to the
WSDOT adds 99 acres of wetland mitigation sitesWSDOT began monitoring 16 new wetland and stream mitigation sites on 99 acres in 2016, bringing the all-time total to 279 wetland and stream mitigation sites on 1,573 acres. WSDOT started issuing monitoring reports on mitigation sites in 1988 and has since transferred 166 sites to long-term stewardship with WSDOT partners.
WSDOT designs and builds transportation projects to avoid or minimize disturbance to wetlands and streams. When construction impacts cannot be avoided and are outside the service areas of other cost-effective mitigation options, WSDOT designs and builds wetland and stream mitigation sites as compensation.
To ensure these sites meet permit requirements, WSDOT monitors them as they develop—typically for 10 years—and then transfers them to long-term stewardship. WSDOT’s inventory of mitigation sites includes:
1,573acres
Establishment: Develops wetlands in a non-wetland area, 294 acres (19%)
Preservation: Protects wetlands from threats to their function or condition, 240 acres (15%)
Restoration: Re-establishes functions to a former wetland, 135 acres (9%)
Stream mitigation: Repairs or relocates stream beds and banks, 122 acres (8%)
Buffer: Protects a wetland or stream from disturbance and may enhance adjacent wetland functions, 382 acres (24%)
Rehabilitation: Re-plants temporarily disturbed vegetation, 123 acres (8%)
Enhancement: Improves an existing wetland to increase its function, 277 acres (18%)
WSDOT mitigation site acreage increases to 1,5731988 through 2016; Total acreage (and percent of total) of replacement wetlands and stream mitigation sites by type
Data source: WSDOT Environmental Services Office.
Note: These totals do not include mitigation banks. Percentages may not add to 100 due to rounding.
Data source: WSDOT Environmental Services Office.
Note: Of the 119 sites above, WSDOT has 98 active mitigation sites,14 sites submitted for closeout that are being evaluated, one site beyondthe initial monitoring period and six bank unit sites.
0
200
400
600
800
1,000
1,200
1,400
0
20
40
60
80
100
120
140
Sites
Acres
Transportation Partnership Account funding passed
Connecting Washingtonfunding passed
Nickel funding passed
Number of acresNumber of sites
monitored
WSDOT monitors 119 mitigation sites and six bank units2001 through 2016; Number of sites and acres monitored
2016201420122010200820042002 2006
Return toTable of Contents

26 | GNB Edition 65 – March 31, 2017 Strategic goal: Environment – Wetlands Protection
WSDOT uses strategic partnerships to mitigate impactsnumber of new mitigation sites that got underway through the 2015 Connecting Washington revenue package.
WSDOT completes monitoring requirements for 25 sitesWSDOT completed monitoring work at 25 mitigation sites where permit requirements were met. WSDOT has interagency agreements with the Corps and Ecology for liaisons, who issue and close permits for WSDOT projects. Many projects funded by Connecting Washington were being designed but not ready for permitting in 2016, which provided capacity for liaisons to increase the number of permits they closed.
The Corps and Ecology agreed to close 11 of the 25 sites before the end of the standard 10-year monitoring period because they achieved their permit requirements ahead of schedule. Sites that are at least five years old and meet final performance standards two years in a row can be considered for early closeout.
WSDOT mitigation sites provide benefits such as water quality improvement, wildlife and pollinator habitat, and a storage area for floodwater.
WSDOT improves five mitigation sites not meeting requirementsThe number of sites past their initial monitoring period that had not yet met all permit requirements decreased from nine sites in 2015 to four in 2016. Of the five sites that were determined adequate and closed in 2016, four were closed by the Corps and one was closed internally under WSDOT’s “no net loss” policy. Closing a site under the “no net loss” policy means an external review was not required. WSDOT determined the site provided adequate compensation for impacts.
WSDOT is waiting for requested permit completion reviews from the Corps and Ecology for three of the remaining four sites. The last site does not meet permit requirements and needs additional time to develop after recent plant replacement and weed control.
WSDOT increases efficiency with fewer staff on mitigation sitesWSDOT reduced the number of summer interns who worked on mitigation sites from 20 in 2015 to 16 in 2016. The reduction was due to the diminished
number of sites to monitor and increased efficiency because of new technology used to identify sample points. WSDOT staff used geographic information systems and global positioning satellites to collect data faster and more accurately on larger sites.
Mitigation banks benefit WSDOT projects and the environmentWSDOT’s three mitigation banks earned 2.1 credits and debited 0.431 credits to transportation projects in 2016. Mitigation banks preserve, enhance, restore or create wetlands to offset impacts of construction projects on existing wetlands. WSDOT mitigation banks efficiently meet future project needs and maximize environmental benefits by replacing ecological functions—like creating amphibian habitat and providing a storage area for floodwater—prior to any damage project activity would cause to the ecological functions. The agency’s mitigation banks save time and money by consolidating work efforts and banking credits for future projects.
WSDOT completes Pilchuck Creek site ahead of scheduleThe Pilchuck Creek advance mitigation site met its performance standards four years early, and in 2016 the Corps and Ecology agreed to close the site. The site provides 12.56 credits, of which 6.23 have been used by projects and 6.33 are available for future use.
The Pilchuck Creek advance mitigation site compensated for impacts from four projects on state routes (SR) 9, 530 and 532 as it was being constructed in 2009. WSDOT designed and constructed this mitigation site in close collaboration with the Stillaguamish Tribe. These activities were partially funded through a Salmon Recovery Funding Board grant. The Pilchuck Creek advance mitigation site is a 30-acre parcel that was once drained for farming. The collaborative design restored wetland
Strategic Plan Goal 3: ENVIRONMENTAL STEWARDSHIPPromote sustainable practices to reducegreenhouse gas emissions and protectnatural habitat and water quality.
In support of this strategy, WSDOT added 16 new wetland and stream mitigation sites on 99 acres in 2016, bringing the total to 279 sites on 1,573 acres.
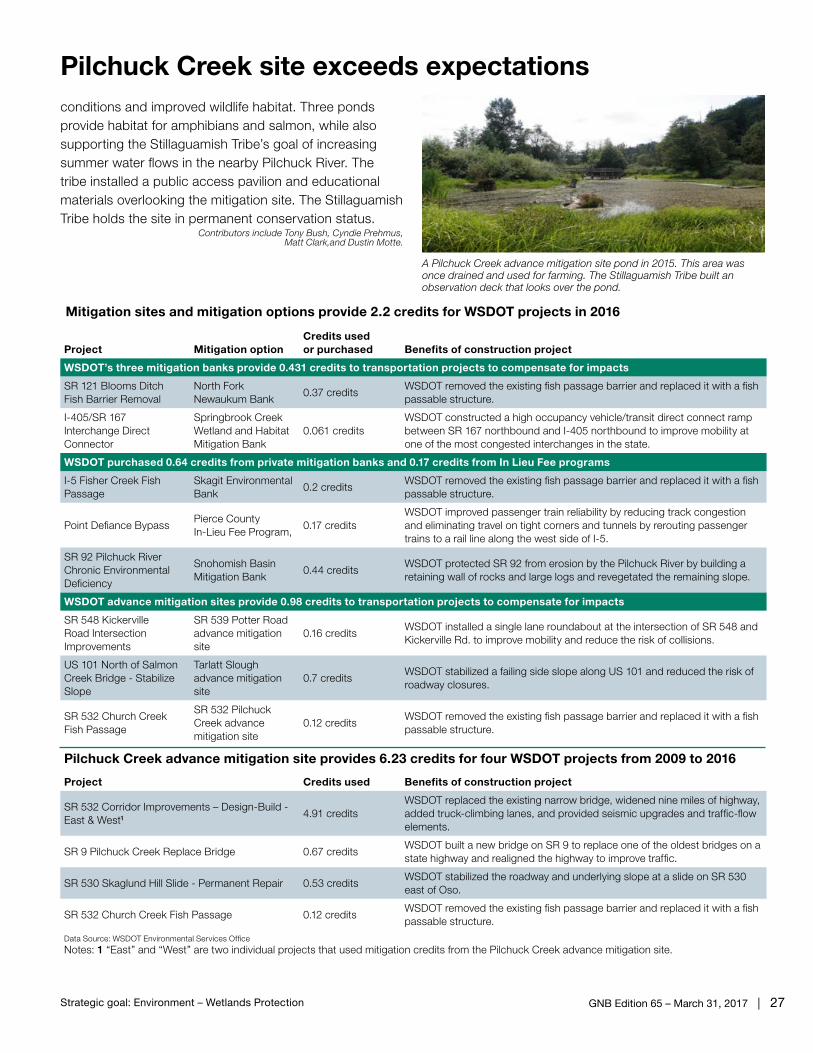
GNB Edition 65 – March 31, 2017 | 27Strategic goal: Environment – Wetlands Protection
Pilchuck Creek site exceeds expectationsconditions and improved wildlife habitat. Three ponds provide habitat for amphibians and salmon, while also supporting the Stillaguamish Tribe’s goal of increasing summer water flows in the nearby Pilchuck River. The tribe installed a public access pavilion and educational materials overlooking the mitigation site. The Stillaguamish Tribe holds the site in permanent conservation status.
Contributors include Tony Bush, Cyndie Prehmus, Matt Clark,and Dustin Motte.
A Pilchuck Creek advance mitigation site pond in 2015. This area was once drained and used for farming. The Stillaguamish Tribe built an observation deck that looks over the pond.
Mitigation sites and mitigation options provide 2.2 credits for WSDOT projects in 2016
Project Mitigation optionCredits used or purchased Benefits of construction project
WSDOT’s three mitigation banks provide 0.431 credits to transportation projects to compensate for impacts
SR 121 Blooms Ditch Fish Barrier Removal
North Fork Newaukum Bank
0.37 credits WSDOT removed the existing fish passage barrier and replaced it with a fish passable structure.
I-405/SR 167 Interchange Direct Connector
Springbrook Creek Wetland and Habitat Mitigation Bank
0.061 creditsWSDOT constructed a high occupancy vehicle/transit direct connect ramp between SR 167 northbound and I-405 northbound to improve mobility at one of the most congested interchanges in the state.
WSDOT purchased 0.64 credits from private mitigation banks and 0.17 credits from In Lieu Fee programs
I-5 Fisher Creek Fish Passage
Skagit Environmental Bank
0.2 creditsWSDOT removed the existing fish passage barrier and replaced it with a fish passable structure.
Point Defiance BypassPierce County In-Lieu Fee Program,
0.17 creditsWSDOT improved passenger train reliability by reducing track congestion and eliminating travel on tight corners and tunnels by rerouting passenger trains to a rail line along the west side of I-5.
SR 92 Pilchuck River Chronic Environmental Deficiency
Snohomish Basin Mitigation Bank
0.44 creditsWSDOT protected SR 92 from erosion by the Pilchuck River by building a retaining wall of rocks and large logs and revegetated the remaining slope.
WSDOT advance mitigation sites provide 0.98 credits to transportation projects to compensate for impacts
SR 548 Kickerville Road Intersection Improvements
SR 539 Potter Road advance mitigation site
0.16 creditsWSDOT installed a single lane roundabout at the intersection of SR 548 and Kickerville Rd. to improve mobility and reduce the risk of collisions.
US 101 North of Salmon Creek Bridge - Stabilize Slope
Tarlatt Slough advance mitigation site
0.7 creditsWSDOT stabilized a failing side slope along US 101 and reduced the risk of roadway closures.
SR 532 Church Creek Fish Passage
SR 532 Pilchuck Creek advance mitigation site
0.12 creditsWSDOT removed the existing fish passage barrier and replaced it with a fish passable structure.
Pilchuck Creek advance mitigation site provides 6.23 credits for four WSDOT projects from 2009 to 2016
Project Credits used Benefits of construction project
SR 532 Corridor Improvements – Design-Build - East & West1 4.91 credits
WSDOT replaced the existing narrow bridge, widened nine miles of highway, added truck-climbing lanes, and provided seismic upgrades and traffic-flow elements.
SR 9 Pilchuck Creek Replace Bridge 0.67 creditsWSDOT built a new bridge on SR 9 to replace one of the oldest bridges on a state highway and realigned the highway to improve traffic.
SR 530 Skaglund Hill Slide - Permanent Repair 0.53 creditsWSDOT stabilized the roadway and underlying slope at a slide on SR 530 east of Oso.
SR 532 Church Creek Fish Passage 0.12 creditsWSDOT removed the existing fish passage barrier and replaced it with a fish passable structure.
Data Source: WSDOT Environmental Services Office
Notes: 1 “East” and “West” are two individual projects that used mitigation credits from the Pilchuck Creek advance mitigation site.

28 | GNB Edition 65 – March 31, 2017 Strategic goal: Environment – Noise Quality
Noise Quality Annual Report65
Notable results � WSDOT conducted 23 traffic noise studies for
upcoming transportation projects between April 2016 and March 2017
� Approximately 91 miles of noise walls have been constructed since 1963, with 1.4 miles built between April 2016 and March 2017
Algona. The wall was completed in September 2016 and was expected to reduce noise levels at adjacent homes by 5 to 10 decibels (dB). Reducing noise by 5 dB is like hearing a blender operate three feet away versus a neighbor mowing the lawn 50 feet away. Reducing noise by 10 dB is the difference between standing 50 feet away from a freeway and hearing a television 10 feet away. Overall, WSDOT has constructed approximately 91 miles of noise barriers since 1963.
WSDOT utilizes noise variance permits for construction noiseBetween April 1, 2016 and March 31, 2017, WSDOT obtained 37 noise variance permits from local jurisdictions, primarily in the central Puget Sound region. These permits give construction crews permission to produce more noise than is generally acceptable during night hours, allowing for construction work to be completed on time in areas with heavy traffic and safety concerns during the day.
WSDOT continues research into reducing rumble strip noiseWSDOT is continuing to research rumble strip designs that may reduce roadway noise. Rumble strips are grooves cut into pavement that, when driven over, produce noise and vibration within the vehicle to alert inattentive drivers that they are beginning to drift out of their lanes.
WSDOT installed several sections of experimental rumble strips in fall 2016. Three of these, all on SR 24 south of Othello, were designed following an analysis of previous WSDOT research into the noise levels produced by rumble strips with different divot dimensions. The second test section, which is on SR 155 near Grand Coulee, is a sinusoidal centerline rumble strip, or “mumble strip”—a type of rumble strip with shallow waves in long parallel grooves rather than the typical divots. “Mumble strips” are currently used in California, Minnesota, and Pennsylvania.
Contributors include Jim Laughlin, Helen Goldstein and Zach Mason
WSDOT conducts 23 noise studies for future projectsBetween April 1, 2016 and March 31, 2017, WSDOT conducted 23 traffic noise studies, all of which were for Type 1 projects (see box below). Two of the 23 studies (the I-405 hard shoulder running project and the I-405 Renton-to-Bellevue project) resulted in recommendations that a new noise wall be built.
Noise barriers reduce traffic sounds along State Route 167 corridorWSDOT constructed one new Type 1 noise barrier between April 1, 2016 and March 31, 2017—a 1.4-mile noise wall along northbound State Route (SR) 167 near
WSDOT evaluates noise for Type 1, Type 2 projects
WSDOT conducts noise studies by collecting noise measurements and traffic counts, using computer modeling to project future noise levels with and without a noise barrier, and then determining whether a barrier would meet standards for noise reduction and cost-effectiveness. WSDOT conducts these studies for two types of projects:
�Type 1 projects are prospective noise barriers near new construction which could potentially increase traffic noise for nearby residents;
�Type 2 projects are retrofits for existing high-traffic roadways near residential areas that were constructed before 1976 (when noise evaluations were first required for highway projects). WSDOT maintains a prioritized list of eligible Type 2 projects to be considered for completion.
For both types of projects, WSDOT evaluates how noise can be cost-effectively reduced and seeks input from affected communities before taking any noise-reducing action (such as constructing a noise wall).
Return toTable of
Contents

GNB Edition 65 – March 31, 2017 | 29Strategic goal: Economic Vitality – CVISN
Commercial Vehicles Information Systems & Networks Annual Report 65
2016, down from $9.75 in 2015 due to lower average diesel fuel cost. See Gray Notebook 45, p. 45, for more on how WSDOT estimates CVISN program benefits.
Transponder sales decrease in 2016WSDOT transponder sales decreased slightly in 2016, with 6,693 sold. This is 3.3% less than the 6,918 sold in 2015. However, total vehicles with transponders continued to increase. This increase is due to carriers obtaining transponders from other jurisdictions and registering them for use in Washington. In 2015, there were 99,325 vehicles with transponders in the Washington state commercial vehicle database. In 2016, this number increased by 3.2% to 102,922.
Weigh station investment and operations plan underwayIn October 2016, WSDOT and Washington State Patrol, which owns and operates all weigh stations in the state, collaborated to create a weigh station strategic
investment and operations plan. The plan will provide strategic direction for future weigh station construction and
preservation statewide. The final plan is scheduled to be completed by June 30, 2017.Contributors include Anne Ford, Doug Deckert,
Shravan Aeneni and Yvette Wixson
WSDOT saves trucking industry time and moneyWSDOT gave commercial trucks equipped with Commercial Vehicle Information Systems and Networks (CVISN) transponders the green light to bypass open weigh stations 1.33 million times in 2016. This is 5% more than the 1.27 million given in 2015.
A weigh station on southbound Interstate 5 near Everett was destroyed by a drunk driver in 2011 and reopened in June 2015. As a result, roughly 50% of the data for this station, which has approximately 3,800 green lights daily, was not available for 2015.
Weigh station bypasses (green lights) created roughly $12.8 million in economic benefit in 2016 by helping the trucking industry avoid an estimated 110,695 hours of travel time and saving an estimated 531,000 gallons of diesel fuel. Trucks not equipped with CVISN transponders must pull into each open weigh station they pass. As a result of the reduced diesel, carbon dioxide emissions were cut by 11.9 million pounds. WSDOT calculates these benefits using industry standards of five minutes avoided travel time and 0.4 gallons of fuel saved for each bypass. This provided a $9.60 economic benefit per bypass in
Strategic Plan Goal 6: SMART TECHNOLOGY Innovative Technology Strategy: Assess innovative technologies to identify tools to
support operational and demand management strategies.
WSDOT’s CVISN program uses multiple technologies to screen trucks nearing weigh stations including weigh-in-motion, automatic license plate readers and transponders to reduce freight travel delay and fuel use.
2015 2015 20152016 2016 2016
1,268,060 1,328,229 105,672 110,695 $12.4million
$12.8million
Data source: WSDOT Commercial Vehicle Information Services Office.
Notes: A truck’s transponder is read each time it nears an open weigh station. There were 1,632,066 readings in 2016 and 1,513,559 in 2015. Not all resulted in a green light. 1 WSDOT assumes five minutes and 0.4 gallons of fuel saved per bypass providing an economic benefit of $9.60 in 2016 and $9.75 in 2015 per bypass.
Notable results � WSDOT’s electronic screening system helped
the trucking industry avoid 110,695 travel hours and $12.8 million in operating costs in 2016
� There were approximately 1.33 million “green lights” given in 2016 in the state, 5% more than the 1.27 million given in 2015
Return toTable of Contents
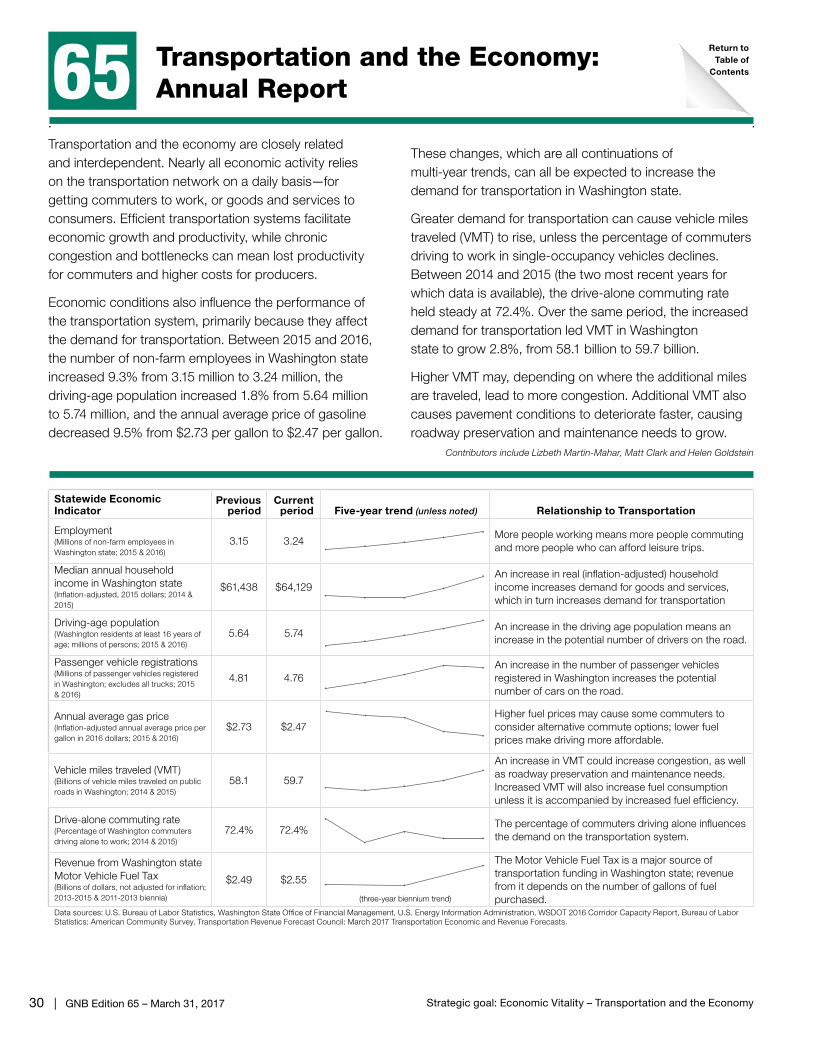
30 | GNB Edition 65 – March 31, 2017 Strategic goal: Economic Vitality – Transportation and the Economy
Statewide Economic Indicator
Previous period
Current period Five-year trend (unless noted) Relationship to Transportation
Employment(Millions of non-farm employees in Washington state; 2015 & 2016)
3.15 3.24More people working means more people commuting and more people who can afford leisure trips.
Median annual household income in Washington state (Inflation-adjusted, 2015 dollars; 2014 & 2015)
$61,438 $64,129An increase in real (inflation-adjusted) household income increases demand for goods and services, which in turn increases demand for transportation
Driving-age population(Washington residents at least 16 years of age; millions of persons; 2015 & 2016)
5.64 5.74An increase in the driving age population means an increase in the potential number of drivers on the road.
Passenger vehicle registrations(Millions of passenger vehicles registered in Washington; excludes all trucks; 2015 & 2016)
4.81 4.76An increase in the number of passenger vehicles registered in Washington increases the potential number of cars on the road.
Annual average gas price (Inflation-adjusted annual average price per gallon in 2016 dollars; 2015 & 2016)
$2.73 $2.47Higher fuel prices may cause some commuters to consider alternative commute options; lower fuel prices make driving more affordable.
Vehicle miles traveled (VMT) (Billions of vehicle miles traveled on public roads in Washington; 2014 & 2015)
58.1 59.7
An increase in VMT could increase congestion, as well as roadway preservation and maintenance needs. Increased VMT will also increase fuel consumption unless it is accompanied by increased fuel efficiency.
Drive-alone commuting rate(Percentage of Washington commuters driving alone to work; 2014 & 2015)
72.4% 72.4%The percentage of commuters driving alone influences the demand on the transportation system.
Revenue from Washington state Motor Vehicle Fuel Tax(Billions of dollars, not adjusted for inflation; 2013-2015 & 2011-2013 biennia)
$2.49 $2.55
The Motor Vehicle Fuel Tax is a major source of transportation funding in Washington state; revenue from it depends on the number of gallons of fuel purchased.
Data sources: U.S. Bureau of Labor Statistics, Washington State Office of Financial Management, U.S. Energy Information Administration, WSDOT 2016 Corridor Capacity Report, Bureau of Labor Statistics: American Community Survey, Transportation Revenue Forecast Council: March 2017 Transportation Economic and Revenue Forecasts.
Transportation and the economy are closely related and interdependent. Nearly all economic activity relies on the transportation network on a daily basis—for getting commuters to work, or goods and services to consumers. Efficient transportation systems facilitate economic growth and productivity, while chronic congestion and bottlenecks can mean lost productivity for commuters and higher costs for producers.
Economic conditions also influence the performance of the transportation system, primarily because they affect the demand for transportation. Between 2015 and 2016, the number of non-farm employees in Washington state increased 9.3% from 3.15 million to 3.24 million, the driving-age population increased 1.8% from 5.64 million to 5.74 million, and the annual average price of gasoline decreased 9.5% from $2.73 per gallon to $2.47 per gallon.
These changes, which are all continuations of multi-year trends, can all be expected to increase the demand for transportation in Washington state.
Greater demand for transportation can cause vehicle miles traveled (VMT) to rise, unless the percentage of commuters driving to work in single-occupancy vehicles declines. Between 2014 and 2015 (the two most recent years for which data is available), the drive-alone commuting rate held steady at 72.4%. Over the same period, the increased demand for transportation led VMT in Washington state to grow 2.8%, from 58.1 billion to 59.7 billion.
Higher VMT may, depending on where the additional miles are traveled, lead to more congestion. Additional VMT also causes pavement conditions to deteriorate faster, causing roadway preservation and maintenance needs to grow.
Contributors include Lizbeth Martin-Mahar, Matt Clark and Helen Goldstein
4200
4900
2450
2550
(three-year biennium trend)
2800
3400
5400
5800
2.25
4.25
55
60
72.0
73.5
58000
65000
Transportation and the Economy: Annual Report65
Return toTable of
Contents

GNB Edition 65 – March 31, 2017 | 31Strategic goal: Stewardship – Workforce Development
WSDOT had 6,586 permanent full-time employees as of March 31, 2017. This is 96 more than the same quarter one year ago, and 9.5% below the peak of 7,280 employees in June 2010.
Agency-wide, 44% (2,870) of employees have the “possibility” of retiring by 2021 and 20% (1,277) are considered “probable” to retire. Retirement forecasts are as of September 2016, when there were 6,472 employees with retirement benefits. The forecasts are based on employee age, retirement plan and years of service. “Possible” refers to those eligible to retire with reduced or full benefits. “Probable” refers to employees eligible to retire with full benefits.
Notable results � WSDOT’s workforce is at 6,586 permanent
full-time employees, 96 more than the same quarter in 2016
� WSDOT’s workforce development initiatives strive to make the agency an employer of choice to recruit and retain employees
Workforce increases while retirements expected
Dedicated positions increase agency’s recruitment effortsTo support outreach for engineering and maintenance staff, the agency dedicated one recruiter in 2016 and added two more recruiters in 2017. Organized outreach efforts were new to the agency in 2016, when WSDOT was represented at 31 events. Agency-wide, there was a 33.3% increase in the number of positions filled between calendar year 2015, when 783 were filled, to 2016, when 1,044 were filled.
Referral program offers incentives for hiring new WSDOT employeesIn April 2017, WSDOT implemented a pilot Employee Referral Incentive Program in the Northwest Region (Seattle area) to assist WSDOT’s efforts to recruit high-demand and hard-to-fill maintenance positions and advance WSDOT’s employment goals and initiatives. WSDOT’s goal is to increase recruitments through the referral program by 5% to 10%.
WSDOT’s retirement forecasts guide recruitment outreach efforts. The incentive program provides eligible employees with a lump-sum payment of $200 per hired referral. This is a pilot program anticipated to last one year.
Agency Emphasis Area WORKFORCE DEVELOPMENTAlign the needs and priorities of the organization with those of WSDOT’s
workforce to ensure the agency can meet its legislative, regulatory, service and production
requirements and organizational objectives. This is a strategy of Results WSDOT Strategic Plan Goal 4, Organizational Strength.
WSDOT is taking steps to build a modern work environment, including teleworking, flexible schedules and compressed work weeks, and an Infant At Work pilot program. These efforts are consistent with Gov. Jay Inslee’s executive order and supporting workforce development.
Probable1
retirement (20%)Possible2
retirement (44%)
Forty-four percent of WSDOT employees eligible to retire by 20212016 retirement forecast
Data source: WSDOT Office of Human Resources and Safety.
Notes: 1 “Probable” refers to employees eligible to retire with full benefits. 2 “Possible” refers to those eligible to retire with reduced or full benefits.
Retirements drive workforce development strategiesAs of September 2016, engineering and maintenance employees made up 74% of the agency’s workforce. Of the agency’s 2,320 permanent engineering employees, 44% (1,031) have the possibility of retirement, and 18% (421) are considered probable to retire by 2021. Forty-two percent (1,044) of the agency’s 2,498 permanent maintenance employees have the possibility of retirement, and 20% (509) are considered probable to retire by 2021. Given significant retirement probabilities, WSDOT is implementing strategies to support a stable and skilled workforce including increased outreach and referral programs.
Workforce Development Annual Report 65
Return toTable of Contents

32 | GNB Edition 65 – March 31, 2017 Strategic goal: Stewardship – Workforce Development
At left, five and a half month old Tatum accompanies mom Jennifer Kanick, a Human Resources Consultant 2, to work at WSDOT headquarters. At right, four month old Hendric, goes to work with mom Chelsey Martin in the Environmental Services department at Southwest Region.
WSDOT strives to build a modern work environment, to become an employer of choice to recruit and retain employees. Initiatives include allowing eligible employees to telework, work flexible schedules and/or compressed work weeks, and an Infant At Work (IAW) pilot program. They are part of WSDOT’s workforce development strategy, which is an agency emphasis area of Results WSDOT, the agency’s strategic plan. These initiatives are designed to implement Gov. Jay Inslee’s Executive Order 16-07, “Building a Modern Work Environment.”
Telework and flexible schedules demonstrate modern workplaceWSDOT is providing a workplace and tools that support the tasks being performed and the customers being served, in a cost-effective and space-efficient way that promotes work-life balance, job satisfaction, flexibility, collaboration, and productivity. Currently, 8% (260) of WSDOT’s eligible workforce are teleworking—working from home or another remote location at least one to two days a month. The governor’s modern work environment executive order sets a goal of increasing participation in telework to 9% in 2017 in support of Results Washington Goal 3, Sustainable Energy and a Clean Environment. WSDOT’s telework participation target for 2020 is 12%.
Telework is an effective strategy to reduce emissions from employee commuting and energy consumption in WSDOT facilities. WSDOT believes telework enhances productivity, job satisfaction and morale. It is a strategy to retain and recruit talent, provide continuity of operations, and meet future agency office space requirements.
As of March 2017, 66.5% (3,947) of WSDOT employees were working compressed work weeks, and approximately 63% (3,214) were working flexible schedules. The agency’s participation targets for these are 67% and 63%, respectively. In a compressed work week, employees work fewer than five days each week, but work longer hours each day.
Supervisors complete entry level management trainingSince February 2016, 124 supervisors completed WSDOT “Entry Level Management” training and five supervisors have completed a “Leading Others” supervisory training provided by the state’s Department of Enterprise Services. Leading Others, a pilot in 2016, has been adopted as an official training. An additional 62 supervisors are slated to attend “Leading Others” within the next six months. The
training efforts support the agency’s strategic plan Results WSDOT, and are designed to help develop the workforce.
Infant at Work pilot program supports positive work/life balanceIn March 2017, WSDOT implemented a pilot program which allows parents to bring their infants to work instead of having to take leave. The IAW pilot program was established for eligible employees who are new parents or legal guardians of a single infant, in an effort to support a positive work/life balance and supports productivity. There are five employees and babies currently participating in this pilot.
WSDOT examines rehire program, builds partnership with CorrectionsWSDOT is exploring a rehire/retire program which would identify staff who are eligible to retire and who have knowledge, skill sets or expertise that is in critical need of being transferred. The agency is looking at opportunities such as job sharing, mentorship and special project work to retain and transfer this expertise to the future generations of employees and leaders. WSDOT is also exploring the possibility of bringing interested retirees back to serve as mentors for new employees, but there is no timeline yet for a launch.
WSDOT is committed to offering increased employment opportunities for applicants with criminal records. WSDOT is building a partnership with Washington State Department of Corrections and Correctional Industries to explore the possibilities helping interested offenders become work-ready for WSDOT positions upon their release. The effort supports Gov. Inslee’s Executive Order 16-05 “Building Safe and Strong Communities Through Successful Reentry.”
Contributors include Matt Elam, Amber Erdahl, Alvina Mao, Sharon McDaniel, Cathy Roberts, Zach Mason and Yvette Wixson
WSDOT emphasizes workforce development

GNB Edition 65 – March 31, 2017 | 33Strategic goal: Stewardship – Capital Project Delivery Programs
Capital Project Delivery ProgramsQuarterly Update 65
Notable results � WSDOT has completed 377 Nickel and TPA
projects, and two Connecting Washington Account (CWA) projects to date
� WSDOT added 13 projects and removed 11 from the Watch List, leaving it with three projects on the list as of March 31, 2017
No CWA, TPA or Nickel projects done in quarterWSDOT did not complete any 2015 Connecting Washington Account (CWA), 2005 Transportation Partnership Account (TPA) or 2003 Nickel construction projects during the seventh quarter (January through March 2017) of the 2015-2017 biennium. To date, WSDOT has completed two CWA projects and has three underway.
WSDOT also has completed 377 Nickel and TPA construction projects, with 87% on time and 91% on budget. Projects are on time if they are operationally complete within the quarter planned in the last approved schedule; and on budget if costs are within 5% of the last approved budget.
The 2015 Connecting Washington Account projects are discussed in greater detail in Gray Notebook 58, p. 9, and WSDOT is tracking CWA projects as they progress, see pp. 36-38 and for details.
The cost at completion for the 377 Nickel and TPA construction projects is $6.83 billion, 2.2% less than the baseline cost of $6.98 billion. As of March 31, 2017, WSDOT has 22 Nickel and TPA projects that have yet to be completed. These remaining projects have a total value of more than $8.52 billion.
WSDOT reconciled its total count of Nickel and TPA construction projects in Gray Notebook 63, p. 35, reducing the total number from 421 to 404
projects. WSDOT currently has nine Nickel and TPA projects underway; see p. 38 for details.
So far in the 2015-2017 biennium, WSDOT has completed 11 Nickel and TPA construction projects on time and on budget when compared to the last legislatively approved schedules and budgets. The cost at completion for these 11 projects is $777.7 million, 4.0% less than the baseline cost of $809.9 million.
Beige Page contributors include Mike Ellis, Mitzi Frick, Penny Haeger, Heather Jones, Thanh Nguyen, Theresa Scott, Aaron Ward, Matt Clark and Joe Irwin
Strategic Plan Goal 1: STRATEGIC INVESTMENTSProject Delivery – Deliver transportation
projects that are on time and on budget.
WSDOT continues to deliver its Nickel and TPA program funded projects with a high rate of success. Of the total 377 construction projects completed to date, 87% have been on time and 91% have been on budget.
$
Nickel, TPA funding remains short of original 2003, 2005 projections
Fuel tax collections show 2003 and 2005 revenue forecasts, which were used to determine the project lists, did not anticipate the economic recession in projecting future growth in fuel tax revenues. The 2003 Nickel and 2005 TPA gas taxes that fund projects are based on a fixed tax rate per gallon and do not change with the price of fuel. As a result, reduced gasoline and diesel consumption leads to reduced tax revenue.
The 2003 Nickel transportation package was originally a 10-year plan, with revenues forecasted to total $1.9 billion from 2003 through 2013. Fuel tax revenues collected during this period came in 10.2% less than the original March 2003 projections. Fuel tax funding from the 2005 TPA package is also less than the original March 2005 projections. The original projection for the TPA account was $4.9 billion over a 16-year period from 2005 through 2021. Current TPA projections through 2021 are estimated to be $4 billion, roughly $900 million less (18.0%) than the original 2005 projection.
Nickel and TPA gas tax revenues are used to pay the debt on the bonds sold to finance the planned projects. Once all the bonds are sold, revenues collected will be used to pay the debt.
Return toTable of Contents

34 | GNB Edition 65 – March 31, 2017 Strategic goal: Stewardship – Current Legislative Evaluation and Accountability Program
WSDOT has 22 Nickel, TPA projects left to completeHighway construction performance summary shows about $8.6 billion in projects remain to be completedCurrent Legislative Evaluation and Accountability Program as of March 31, 2017; Dollars in millions
Combined Nickel and TPA programsNumber of
projectsValue of
program
Subtotal of completed construction projects1 377 $6,976.8
Non-construction projects that have been completed or otherwise removed from Nickel/TPA lists2, 3 5 $74.4
Projects included in the current transportation budget but not yet complete 22 $8,523.8
Projects that have been deferred indefinitely or deleted and removed from Nickel/TPA lists2, 4 13 $499.2
Projects now funded by Connecting Washington and removed from Nickel/TPA lists (see GNB 63, p. 35) 4 $101.7
Total number of projects4 in improvement and preservation budget 421 $16,176.0
Schedule and budget summary Nickel & TPA combined: Results of completed construction projects in the current Legislative Transportation Budget and prior budgets.
Completed in 2015- 2017 biennium budget
Cumulative program
Number of projects completed 11 377
Percent completed early or on time 91% 87%
Percent completed under or on budget 91% 91%
Baseline cost at completion $809.9 $6,976.8
Current cost at completion $777.7 $6,826.5
Percent of total program over or under budget 4.0% under 2.2% under
Advertisement record: Results of projects entering into the construction phase or under construction, detailed on p. 38 Combined Nickel & TPA
Total current number of projects in construction phase as of March 31, 2017 9
Percent advertised early or on time 78%
Total number of projects advertised for construction in the 2015-2017 biennium (July 1, 2015, through June 30, 2017)
2
Percent advertised early or on time 50%
Projects to be advertised: Results of projects now being advertised for construction or planned to be advertised, detailed below. Combined Nickel & TPA
Total projects being advertised for construction bids (January 1 through June 31, 2017) 0
Percent on target for advertisement on schedule or early 0%
Budget status for the 2015-2017 biennium: WSDOT biennial budget
Budget amount for 2015-2017 biennium $1,769.7
Actual expenditures in 2015-2017 biennium to date (July 1, 2015, through March 31, 2017) $1,304.7
Total 2003 Transportation Funding Package (Nickel) expenditures $85.8
Total 2005 Transportation Partnership Account expenditures $694.6
Total Pre-existing Funds expenditures5 $524.3
Data source: WSDOT Capital Program Development and Management.
Notes: Numbers have been rounded. This chart was updated in GNB 63 to reflect reconciled Nickel and TPA project counts, and as a result it does not exactly match Current Legislative Evaluation and Accountability Program charts from previous editions. 1 Cumulative projects completed from July 1, 2003, to March 31, 2017. 2 Non-construction projects include commitments for engineering and right of way work. 3 Projects that have been deferred indefinitely or deleted include projects that have no funding available, projects that have been halted by the Legislature and those for which other entities (e.g., cities and counties) are now serving as the lead agency. 4 The project total has been updated to show “unbundled” projects which may have been previously reported in programmatic construction groupings (such as Roadside Safety Improvements or Bridges Seismic Retrofit). See Gray Notebook 38, p. 55 for more details. 5 For full details of the Pre-existing Funds program, see pp. 40-42.
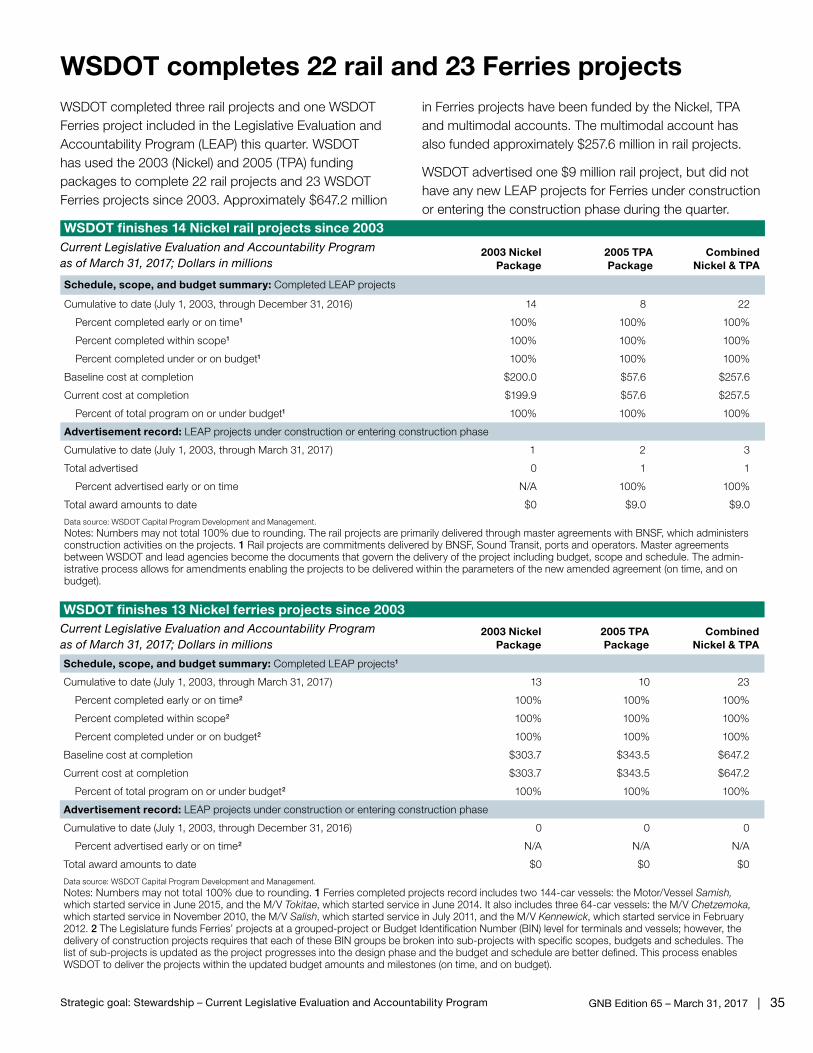
GNB Edition 65 – March 31, 2017 | 35Strategic goal: Stewardship – Current Legislative Evaluation and Accountability Program
WSDOT finishes 14 Nickel rail projects since 2003
Schedule, scope, and budget summary: Completed LEAP projects
Cumulative to date (July 1, 2003, through December 31, 2016) 14 8 22
Percent completed early or on time1 100% 100% 100%
Percent completed within scope1 100% 100% 100%
Percent completed under or on budget1 100% 100% 100%
Baseline cost at completion $200.0 $57.6 $257.6
Current cost at completion $199.9 $57.6 $257.5
Percent of total program on or under budget1 100% 100% 100%
Advertisement record: LEAP projects under construction or entering construction phase
Cumulative to date (July 1, 2003, through March 31, 2017) 1 2 3
Total advertised 0 1 1
Percent advertised early or on time N/A 100% 100%
Total award amounts to date $0 $9.0 $9.0
Data source: WSDOT Capital Program Development and Management.
Notes: Numbers may not total 100% due to rounding. The rail projects are primarily delivered through master agreements with BNSF, which administers construction activities on the projects. 1 Rail projects are commitments delivered by BNSF, Sound Transit, ports and operators. Master agreements between WSDOT and lead agencies become the documents that govern the delivery of the project including budget, scope and schedule. The admin-istrative process allows for amendments enabling the projects to be delivered within the parameters of the new amended agreement (on time, and on budget).
2003 NickelPackage
2005 TPAPackage
Combined Nickel & TPA
Schedule, scope, and budget summary: Completed LEAP projects1
Cumulative to date (July 1, 2003, through March 31, 2017) 13 10 23
Percent completed early or on time2 100% 100% 100%
Percent completed within scope2 100% 100% 100%
Percent completed under or on budget2 100% 100% 100%
Baseline cost at completion $303.7 $343.5 $647.2
Current cost at completion $303.7 $343.5 $647.2
Percent of total program on or under budget2 100% 100% 100%
Advertisement record: LEAP projects under construction or entering construction phase
Cumulative to date (July 1, 2003, through December 31, 2016) 0 0 0
Percent advertised early or on time2 N/A N/A N/A
Total award amounts to date $0 $0 $0
Data source: WSDOT Capital Program Development and Management.
Notes: Numbers may not total 100% due to rounding. 1 Ferries completed projects record includes two 144-car vessels: the Motor/Vessel Samish, which started service in June 2015, and the M/V Tokitae, which started service in June 2014. It also includes three 64-car vessels: the M/V Chetzemoka, which started service in November 2010, the M/V Salish, which started service in July 2011, and the M/V Kennewick, which started service in February 2012. 2 The Legislature funds Ferries’ projects at a grouped-project or Budget Identification Number (BIN) level for terminals and vessels; however, the delivery of construction projects requires that each of these BIN groups be broken into sub-projects with specific scopes, budgets and schedules. The list of sub-projects is updated as the project progresses into the design phase and the budget and schedule are better defined. This process enables WSDOT to deliver the projects within the updated budget amounts and milestones (on time, and on budget).
2003 NickelPackage
2005 TPAPackage
Combined Nickel & TPA
WSDOT completed three rail projects and one WSDOT Ferries project included in the Legislative Evaluation and Accountability Program (LEAP) this quarter. WSDOT has used the 2003 (Nickel) and 2005 (TPA) funding packages to complete 22 rail projects and 23 WSDOT Ferries projects since 2003. Approximately $647.2 million
in Ferries projects have been funded by the Nickel, TPA and multimodal accounts. The multimodal account has also funded approximately $257.6 million in rail projects.
WSDOT advertised one $9 million rail project, but did not have any new LEAP projects for Ferries under construction or entering the construction phase during the quarter.
WSDOT completes 22 rail and 23 Ferries projects
Current Legislative Evaluation and Accountability Program as of March 31, 2017; Dollars in millions
Current Legislative Evaluation and Accountability Program as of March 31, 2017; Dollars in millions
WSDOT finishes 13 Nickel ferries projects since 2003

36 | GNB Edition 65 – March 31, 2017 Strategic goal: Stewardship – Watch List
WSDOT’s Watch List expands to three as of March 2017WSDOT added 13 new projects to its Watch List and removed 11 this quarter (January through March 2017), leaving three projects on the Watch List as of March 31. See the table below for this quarter’s Watch List projects.
WSDOT maintains the Watch List to fulfill the agency’s commitment to “No Surprises” reporting. The agency continuously monitors its projects’ performance to ensure issues affecting schedule or budget are brought to the attention of legislators, executives and the public. The Watch List provides information on issues that have the potential to impact the schedules and budgets of projects funded by Pre-existing Funds (PEF), Nickel,
WSDOT’s Watch List projects with schedule or budget concernsQuarter ending March 31, 2017
Project (County)Revenue Package
Date added
Date removed Watch List issue
Projects remaining on Watch List
SR 99/South King St. vicinity to Roy St. – Viaduct Replacement (King)1
Nickel, TPA
Dec- 2013
The project completion date has been delayed. The project’s contractor, Seattle Tunnel Partners, updated the projected tunnel opening date to early 2019.
I-5/SR 510 Interchange – Reconstruct Interchange (Thurston)
CWAJan-2017
Project funding is insufficient to implement the current interchange design concept. A value engineering workshop has identified the construction of a different interchange design—a diverging diamond interchange—as a better-performing, less costly design alternative.
SR 14/West Camas Slough Bridge – Bridge Widening (Clark)
CWAJan-2017
WSDOT is deferring funding and construction of this project, shifting funding to a congestion-reduction project on SR 14 near the I-205 interchange.
Data sources: WSDOT Capital Program Development and Management; WSDOT Regions.
Notes: 1 The schedule for this project changes frequently and WSDOT cannot verify the contractor’s schedule.
Transportation Partnership Account (TPA) and Connecting Washington Account (CWA) revenue packages.
The Watch List helps track projects by providing status reports, and by explaining the factors affecting delivery and what the agency is doing to address them. Projects are removed from the Watch List when these issues are resolved.
See Gray Notebook 51, p. 40, for a list of common issues that might put projects on the Watch List. To read more about the Watch List items, visit: bit.ly/WSDOTWatchList.
Continued on p. 37
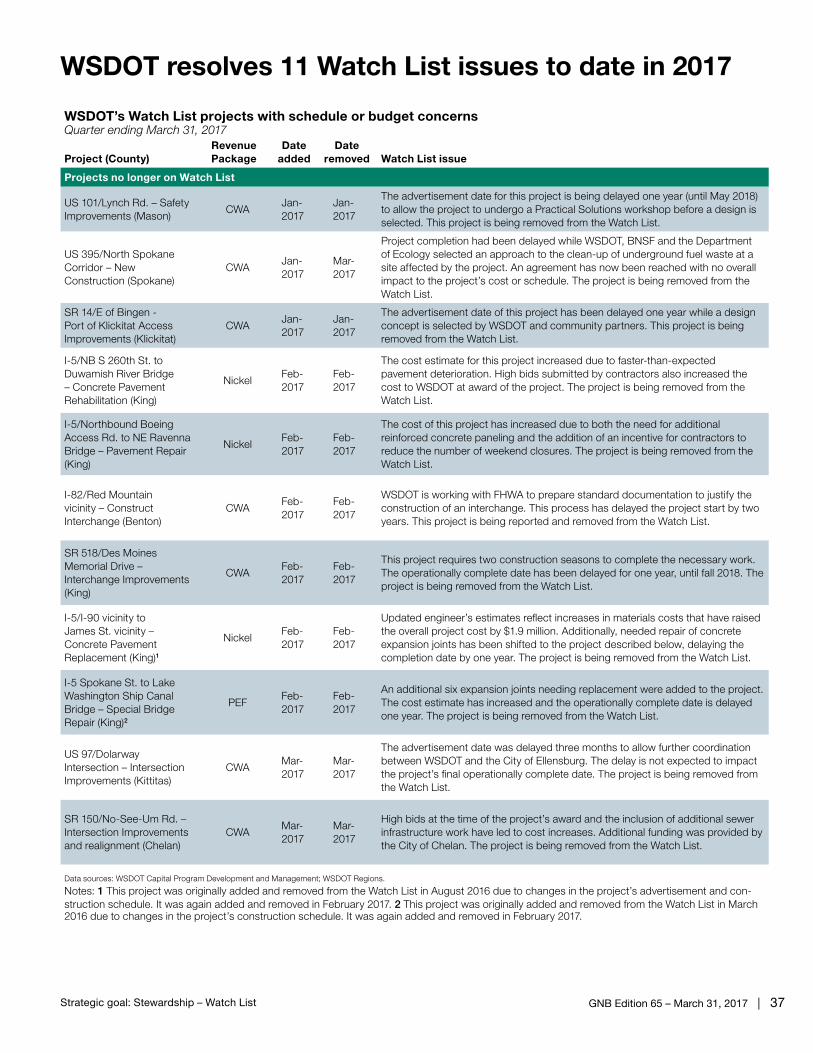
GNB Edition 65 – March 31, 2017 | 37Strategic goal: Stewardship – Watch List
WSDOT resolves 11 Watch List issues to date in 2017
WSDOT’s Watch List projects with schedule or budget concernsQuarter ending March 31, 2017
Project (County)Revenue Package
Date added
Date removed Watch List issue
Projects no longer on Watch List
US 101/Lynch Rd. – Safety Improvements (Mason)
CWAJan-2017
Jan-2017
The advertisement date for this project is being delayed one year (until May 2018) to allow the project to undergo a Practical Solutions workshop before a design is selected. This project is being removed from the Watch List.
US 395/North Spokane Corridor – New Construction (Spokane)
CWAJan-2017
Mar-2017
Project completion had been delayed while WSDOT, BNSF and the Department of Ecology selected an approach to the clean-up of underground fuel waste at a site affected by the project. An agreement has now been reached with no overall impact to the project’s cost or schedule. The project is being removed from the Watch List.
SR 14/E of Bingen - Port of Klickitat Access Improvements (Klickitat)
CWAJan-2017
Jan-2017
The advertisement date of this project has been delayed one year while a design concept is selected by WSDOT and community partners. This project is being removed from the Watch List.
I-5/NB S 260th St. to Duwamish River Bridge – Concrete Pavement Rehabilitation (King)
NickelFeb-2017
Feb-2017
The cost estimate for this project increased due to faster-than-expected pavement deterioration. High bids submitted by contractors also increased the cost to WSDOT at award of the project. The project is being removed from the Watch List.
I-5/Northbound Boeing Access Rd. to NE Ravenna Bridge – Pavement Repair (King)
NickelFeb-2017
Feb-2017
The cost of this project has increased due to both the need for additional reinforced concrete paneling and the addition of an incentive for contractors to reduce the number of weekend closures. The project is being removed from the Watch List.
I-82/Red Mountain vicinity – Construct Interchange (Benton)
CWAFeb-2017
Feb-2017
WSDOT is working with FHWA to prepare standard documentation to justify the construction of an interchange. This process has delayed the project start by two years. This project is being reported and removed from the Watch List.
SR 518/Des Moines Memorial Drive – Interchange Improvements (King)
CWAFeb-2017
Feb-2017
This project requires two construction seasons to complete the necessary work. The operationally complete date has been delayed for one year, until fall 2018. The project is being removed from the Watch List.
I-5/I-90 vicinity to James St. vicinity – Concrete Pavement Replacement (King)1
NickelFeb-2017
Feb-2017
Updated engineer’s estimates reflect increases in materials costs that have raised the overall project cost by $1.9 million. Additionally, needed repair of concrete expansion joints has been shifted to the project described below, delaying the completion date by one year. The project is being removed from the Watch List.
I-5 Spokane St. to Lake Washington Ship Canal Bridge – Special Bridge Repair (King)2
PEFFeb-2017
Feb-2017
An additional six expansion joints needing replacement were added to the project. The cost estimate has increased and the operationally complete date is delayed one year. The project is being removed from the Watch List.
US 97/Dolarway Intersection – Intersection Improvements (Kittitas)
CWAMar-2017
Mar-2017
The advertisement date was delayed three months to allow further coordination between WSDOT and the City of Ellensburg. The delay is not expected to impact the project’s final operationally complete date. The project is being removed from the Watch List.
SR 150/No-See-Um Rd. – Intersection Improvements and realignment (Chelan)
CWAMar-2017
Mar-2017
High bids at the time of the project’s award and the inclusion of additional sewer infrastructure work have led to cost increases. Additional funding was provided by the City of Chelan. The project is being removed from the Watch List.
Data sources: WSDOT Capital Program Development and Management; WSDOT Regions.
Notes: 1 This project was originally added and removed from the Watch List in August 2016 due to changes in the project’s advertisement and con-struction schedule. It was again added and removed in February 2017. 2 This project was originally added and removed from the Watch List in March 2016 due to changes in the project’s construction schedule. It was again added and removed in February 2017.

38 | GNB Edition 65 – March 31, 2017 Strategic goal: Stewardship – Advertisement Record
Project descriptionCumulative to date (County) Fund type
On-time advertised
Ad date
Operationally complete date
Award amount
I-5 Concrete Rehabilitation Program (King)Nickel √ Jul-2009 May-2023 N/A
Multiple contractors continue to work on this project.
• I-5/Northbound South 260th to Duwamish River Bridge - Concrete Rehab Nickel N/A Nov-2016 Oct-2018 $30.8
• I-5/Northbound Boeing Access Rd. to Northeast Ravenna Bridge - Pavement Repair
Nickel N/A Dec-2016 Sep-2019 $38.6
• I-5/Northbound South Spokane St. Vicinity - Concrete Pavement Replacement
(Work is included in project above)
• I-5/Northbound I-90 Vicinity to James St. Vicinity - Concrete Pavement Replacement
Work is included in project above)
SR 99/Alaskan Way Viaduct – Replacement (King)
This project replaces an aging viaduct with a new viaduct on the south end and adds a tunnel in downtown Seattle. WSDOT is funding or leading 30 contracts or projects as part of the viaduct replacement effort. Active Nickel/TPA projects are shown below:
• SR 99/South King Street Vicinity to Roy Street – Viaduct Replacement
Nickel/TPA √ May-2010 TBD $1,089.7
This subproject has several contract components; the bored tunnel, north and south access connections and associated work. The schedule for this project changes frequently and WSDOT cannot verify the contractor’s schedule at this time.
US 395/North Spokane Corridor (NSC) – Design and Right of Way – New Alignment (Spokane)
Nickel/TPA1 √ Apr-2012 Nov-2018 N/A
• US 395/NSC - Spokane River to Francis Ave. - Grading TPA N/A Dec-2016 $0.4
• US 395/NSC Freya St. - Structures TPA N/A Dec-2016 $7.6
I-90/Concrete Rehabilitation Nickel/TPA
Multiple contractors continue to work on this project.
SR 520/Bridge Replacement and HOV (King)
• SR 520/I-5 to Medina – Evergreen Point Floating Bridge and Landings
TPA √ Dec-2010 Jul-2017 $586.6
An additional contract award for this project is pending.
SR 3/Belfair Area – Widening and Safety Improvements (Mason) TPA Late Apr-2015 Aug-2017 $10.3
Advertisement was delayed due to revised project limits, which affected right of way acquisition.
I-5/Tacoma HOV Improvements (Pierce) Nickel/TPA
• I-5/M Street to Portland Avenue – Add HOV Lanes Nickel √ Mar-2014 Feb-2017 $1.7
I-90/Snoqualmie Pass East – Hyak to Keechelus Dam – Corridor Improvement (Kittitas)
TPA
• I-90/Snowshed to Keechelus Dam Phase 1C – Replace Snowshed and Add Lanes
TPA Late Apr-2011 Oct-2017 $177.1
Advertisement was delayed to address fire and safety issues with the original snowshed design, resulting in long-term savings.
SR 16/Anderson Creek Tributary to Sinclair Inlet — Fish Barriers (Kitsap)
TPA Late Feb-2016 Jun-2017 $4.4
Nine WSDOT Nickel and Transportation Partnership Account projects in construction phaseThrough March 2017; Costs estimated at completion; Dollars in millions
Work continues on Connecting Washington projectsThree Connecting Washington Account (CWA) projects in construction phase, two new projects advertised Through March 2017; Costs estimated at completion; Dollars in millions
CWA projects under construction (County) On schedule Completion date Construction cost
I-405 Renton to Lynnwood - Corridor Widening (King)
• I-405/SR 167 Direct Connector - Widening √ Dec-2018 $171.3
• I-405/Northeast 30th St. and Northeast 44th St. - Ramp Improvements √ Apr-2017 $1.1
SR 150/No-See-Um Road - Intersection Improvements and realignment (Chelan) √ Dec-2017 $5.9
CWA projects advertised (County)Delivery
statusAdvertisement date
(Completion date)Award
amount
I-5/Chamber Way Bridge - Emergency Repair and Replacement (Lewis) √ Feb-2017 (Oct-2018) Pending
US 97/Dolarway Intersection - Intersection Improvements (Kittitas) √ Jan-2017 (Oct-2017) $2.7
Source: Capital Project Delivery Programs.

GNB Edition 65 – March 31, 2017 | 39Strategic goal: Stewardship – Schedule and Budget Summaries
Biennial summary: Eleven projects completed in 2015-2017 bienniumNickel and Transportation Partnership Account projects; Costs estimated at completion; Dollars in millions
Cumulative to dateFund type
On-time advertised
On-time completed
Within scope
Baseline estimated cost
Current estimated cost
On budget completed
Current biennium reporting on capital project delivery
2015-2017 biennium summary1
This information is updated quarterly throughout the biennium.
0 Nickel11 TPA
7 on time2
4 late10 on time1 late
11 $809.9 $777.710 on budget1 over budget
Earlier biennia reporting on capital project delivery
2013-2015 biennium summarySee Gray Notebook 58, p. 55.
6 Nickel15 TPA
16 on time5 late
15 on time6 late
21 $555.7 $514.018 on budget3 over budget
2011-2013 biennium summarySee Gray Notebook 50, p. 31.
5 Nickel 361 TPA
311 on time10 late
321 on time9 late
411 $1,485.51 $1,459.61 371 on budget 4 over budget
2009-2011 biennium summary1
See Gray Notebook 42, p. 45.16 Nickel74 TPA
73 on time17 late
80 on time10 late
90 $1,641.6 $1,597.085 on budget5 over budget
2007-2009 biennium summarySee Gray Notebook 34, p. 58.
42 Nickel69 TPA
91 on time20 late
96 on time15 late
111 $1,685.7 $1,685.2102 on budget9 over budget
2005-2007 biennium summarySee Gray Notebook 26, p. 5.
52 Nickel24 TPA
71 on time5 late
68 on time8 late
76 $673.9 $668.867 on budget9 over budget
2003-2005 biennium summary See Gray Notebook 19, p. 5.
27 Nickel25 on time2 late
27 on time0 late
27 $124.6 $124.425 on budget2 over budget
Most TPA projects on budget for 2015-2017 biennium
Data source: WSDOT Capital Program Development and Management.
Notes: Dollar amounts are rounded up. 1 In Gray Notebooks published before the 2009-2011 biennium, WSDOT used a project count of 391 combined Nickel and TPA projects for project completion data. In conjunction with the 2009-2011 biennium wrap-up, the tables were reorganized to present the completed information for the current construction project count of 404. In the revised count, several projects that were developed as part of larger programs, like bridge, rail, and roadside safety, were included in the new count though they had been completed earlier. 2 Number of on-time projects was updated in the chart above for Gray Notebook 63.
WSDOT reports three change orders with values exceeding $500,000 during the quarter ending March 31, 2017 The largest of the three change orders, valued at $3.65 million, was a negotiated settlement which compensated contractors for services rendered during the Interstate 90 Two-way Transit and HOV Operations Stage 3 project. Complex electrical and mechanical site conditions had led to an accumulation of added work and schedule delays. The SR 520 Floating Bridge and Landings Project issued a change order amounting to a net $2.0 million cost increase to settle a variety of disputes with the contractor, chiefly relating to the replacement of 19 damaged anchor cables. The cost of temporary traffic control on the SR 522 Snohomish River Bridge to US 2 Vicinity project resulted in a change order of just over $2.0 million.
After an extensive review, which can involve subject matter experts, contract specialists and other outside stakeholders, WSDOT must sometimes change its engineers’ original plans and specifications in order to complete projects. When this occurs, WSDOT issues a formal modification (or change order) to the contract containing a description of the change and details about how or if the contractor may be compensated for it. Each month, WSDOT posts all change orders estimated to cost $500,000 or more online at http://bit.ly/WSDOTchangeorders.
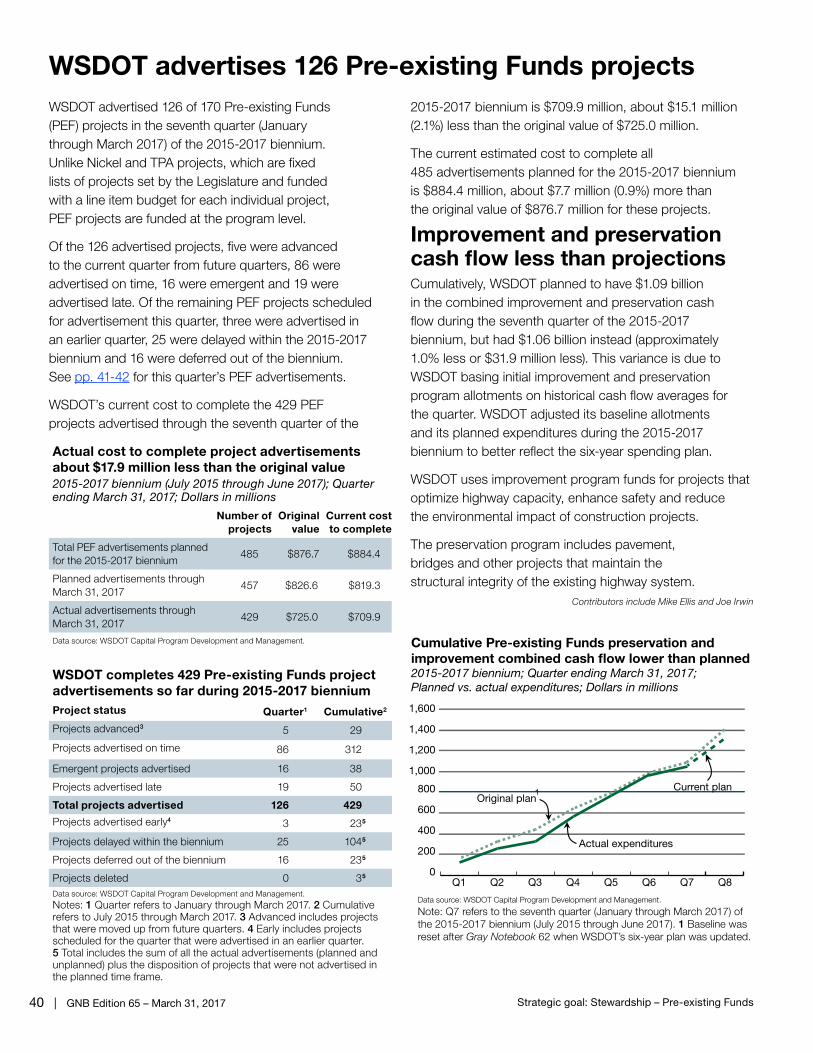
40 | GNB Edition 65 – March 31, 2017 Strategic goal: Stewardship – Pre-existing Funds
WSDOT advertised 126 of 170 Pre-existing Funds (PEF) projects in the seventh quarter (January through March 2017) of the 2015-2017 biennium. Unlike Nickel and TPA projects, which are fixed lists of projects set by the Legislature and funded with a line item budget for each individual project, PEF projects are funded at the program level.
Of the 126 advertised projects, five were advanced to the current quarter from future quarters, 86 were advertised on time, 16 were emergent and 19 were advertised late. Of the remaining PEF projects scheduled for advertisement this quarter, three were advertised in an earlier quarter, 25 were delayed within the 2015-2017 biennium and 16 were deferred out of the biennium. See pp. 41-42 for this quarter’s PEF advertisements.
WSDOT’s current cost to complete the 429 PEF projects advertised through the seventh quarter of the
WSDOT advertises 126 Pre-existing Funds projects
Actual cost to complete project advertisements about $17.9 million less than the original value2015-2017 biennium (July 2015 through June 2017); Quarter ending March 31, 2017; Dollars in millions
Number of projects
Original value
Current cost to complete
Total PEF advertisements planned for the 2015-2017 biennium
485 $876.7 $884.4
Planned advertisements through March 31, 2017
457 $826.6 $819.3
Actual advertisements through March 31, 2017
429 $725.0 $709.9
Data source: WSDOT Capital Program Development and Management.
2015-2017 biennium is $709.9 million, about $15.1 million (2.1%) less than the original value of $725.0 million.
The current estimated cost to complete all 485 advertisements planned for the 2015-2017 biennium is $884.4 million, about $7.7 million (0.9%) more than the original value of $876.7 million for these projects.
Improvement and preservation cash flow less than projectionsCumulatively, WSDOT planned to have $1.09 billion in the combined improvement and preservation cash flow during the seventh quarter of the 2015-2017 biennium, but had $1.06 billion instead (approximately 1.0% less or $31.9 million less). This variance is due to WSDOT basing initial improvement and preservation program allotments on historical cash flow averages for the quarter. WSDOT adjusted its baseline allotments and its planned expenditures during the 2015-2017 biennium to better reflect the six-year spending plan.
WSDOT uses improvement program funds for projects that optimize highway capacity, enhance safety and reduce the environmental impact of construction projects.
The preservation program includes pavement, bridges and other projects that maintain the structural integrity of the existing highway system.
Contributors include Mike Ellis and Joe Irwin
Cumulative Pre-existing Funds preservation and improvement combined cash flow lower than planned 2015-2017 biennium; Quarter ending March 31, 2017; Planned vs. actual expenditures; Dollars in millions
Data source: WSDOT Capital Program Development and Management.
Note: Q7 refers to the seventh quarter (January through March 2017) of the 2015-2017 biennium (July 2015 through June 2017). 1 Baseline was reset after Gray Notebook 62 when WSDOT’s six-year plan was updated.
0
200
400
600
800
1,000
1,200
1,400
1,600
Q8Q7Q6Q5Q4Q3Q2Q1
Original plan
Actual expenditures
Current plan1
WSDOT completes 429 Pre-existing Funds project advertisements so far during 2015-2017 bienniumProject status Quarter1 Cumulative2
Projects advanced3 5 29
Projects advertised on time 86 312
Emergent projects advertised 16 38
Projects advertised late 19 50
Total projects advertised 126 429
Projects advertised early4 3 235
Projects delayed within the biennium 25 1045
Projects deferred out of the biennium 16 235
Projects deleted 0 35
Data source: WSDOT Capital Program Development and Management.
Notes: 1 Quarter refers to January through March 2017. 2 Cumulative refers to July 2015 through March 2017. 3 Advanced includes projects that were moved up from future quarters. 4 Early includes projects scheduled for the quarter that were advertised in an earlier quarter. 5 Total includes the sum of all the actual advertisements (planned and unplanned) plus the disposition of projects that were not advertised in the planned time frame.

GNB Edition 65 – March 31, 2017 | 41Strategic goal: Stewardship – Pre-existing Funds
WSDOT advertises 86 Pre-existing Funds projects on time
WSDOT advertises 126 of 170 Pre-existing Funds projects during the quarterJanuary through March 2017
On time (86)
Northwest Region Guardrail Update (2015-2017 and 2017-2019) I-5/Southbound Cowlitz River Bridge - Known third party - Repair Bridge
US 2/Fern Bluff Rd. Vicinity to 10th St. Vicinity - Paving I-5/Southbound Cowlitz River Bridge - Repair Bridge
US 2/Fern Bluff Rd. Vicinity to 5th St. Intersection - Americans with Disabilities Act (ADA) Compliance
US 12/Rimrock Lake Vicinity - Stabilize Slope
SR 20/Collins Rd. Vicinity to SR 9 - Paving SR 10/SR 970 to US 97 - Chip Seal
SR 20/Collins Rd. Vicinity to SR 9 - ADA Compliance US 12/White Pass Vicinity - Major Drainage Phase 1
I-90/North Fork Issaquah Creek - Fish Passage US 12/Indian Creek Vicinity to Wildcat Creek Bridge Vicinity - Paving
SR 169/140th Ave. Southeast to Cedar River Park Vicinity - Paving US 12/Wallula Vicinity to North Shore Rd. Vicinity - Chip Seal
SR 169/140th Way Southeast to Monroe Ave. Southeast - ADA Compliance
US 12/Low Rd. - Intersection Safety Improvements
SR 509/Northbound South 160th St. to South 112th St. Vicinity - Paving SR 24/2 Miles East of Badger Ln. to 7.4 Miles West of SR 241 - Chip Seal
SR 509/South 128th St. Interchange - ADA Compliance SR 24/SR 241 to Cold Creek Rd. Vicinity - Chip Seal
SR 525/Southbound Alderwood Mall Pkwy. - Intersection Improvements I-82/Yakima Valley Highway Bridge Westbound - Deck Rehabilitation
SR 526/5th Ave. West Vicinity to I-5 - Paving I-82/SR 821/Thrall Road Bridge Eastbound - Deck Rehabilitation
SR 526/Evergreen Way Interchange Vicinity - ADA Compliance I-82/Columbia River Bridge Eastbound - Truss Deck Replacement
SR 528/55th Dr. Northeast Vicinity to 83rd Ave. Northeast Vicinity - Paving I-82/Military Road Interchange - Chip Seal
SR 528/55th Dr. Northeast Vicinity to 83rd Ave. Northeast Vicinity - ADA Compliance
I-90/West Side Canal Bridge Westbound - Deck Rehabilitation
SR 529/Northbound Steamboat Slough Bridge - PaintingI-90/468th Ave. Southeast to West Summit Rd. Eastbound - Rehabilitate Concrete
SR 542/Hedrick Creek - Fish Barrier I-90/Franklin Falls Bridge Westbound - Deck Rehabilitation
North Central Region Sign Update 2015-2017 I-90/Renslow Bridge Eastbound - Deck Rehabilitation
North Central Region 2015-2017 Electrical Service Upgrade I-90/Denny Creek Viaduct Westbound - Deck Rehabilitation
North Central Region 2015-2017 Regionwide Intersection Safety Implementation
I-90/Taneum Creek Bridge Westbound - Deck Rehabilitation
SR 17/Airway Dr. to Phoenix Dr. - Roadside Safety Improvements I-90/Big Creek Bridge Westbound - Deck Rehabilitation
SR 28/North of East Wenatchee - Safety Improvements I-90/Denny Creek Rd. Bridge Westbound - Deck Rehabilitation
SR 171/Beech St. Intersection - Safety ImprovementsI-90/2 miles West of West Summit Interchange Eastbound - Culvert Rehabilitation
SR 3/Kitsap Way to SR 305 - Install Cable BarrierI-90/South Fork Snoqualmie Bridge East of North Bend Eastbound - Deck Rehabilitation
I-5/North of Maytown Rd. to Martin Way - Paving US 97/SR 22 Vicinity to West Wapato Rd. Vicinity - Paving
SR 16/Olympic Dr. Northwest to Burley Olalla Rd. - Install Cable Barrier US 97/Branch Rd. - Intersection Improvements
US 101/North of Lower Salmon Creek - Culvert Replacement US 97/Progressive - Intersection Improvements
SR 105/West of Constantine Way to Edward P. Smith Dr. - Chip Seal US 97/Satus Creek 3rd Crossing Bridge - Deck Rehabilitation
SR 119/US 101 to Lake Cushman Recreation Area - Chip Seal US 97/2nd Ave. Vicinity - Roadside Improvements
SR 162/SR 410 to South of 96th St. East - Paving US 97/SR 22 Vicinity to West Wapato Rd. Vicinity - ADA Compliance
SR 162/SR 410 to South of 96th St. East - ADA Compliance SR 125/Carrie Ave. to SR 124 - Chip Seal
SR 303/SR 304 to William E. Sutton Rd. Northeast - Paving SR 260/SR 17 to Kahlotus - Chip Seal
Data source: WSDOT Capital Program Development and Management. Continued on p. 42

42 | GNB Edition 65 – March 31, 2017 Strategic goal: Stewardship – Pre-existing Funds
On time (86) Continued
SR 410/Yakima County Line to East Winter Gate - Chip Seal SR 28/Lamona to Harrington - Chip Seal
SR 410/Sawmill Flat Campground Vicinity to Nile Rd. - Chip Seal SR 28/Harrington to Davenport - Chip Seal
SR 410/Nile Rd. to US 12 - Chip Seal SR 31/Tiger to Metaline Falls - Chip Seal
SR 903/Cle Elum to Roslyn - Chip Seal I-90/3rd Ave. Bridge - Special Repair - Eastbound
SR 903/Roslyn to National Forest Boundary - Chip Seal SR 174/Grant County Line to SR 21 - Chip Seal
2015-2017 Eastern Region: Regionwide Basic Safety - Signing SR 270/Junction US 195 to Bishop Blvd. - Paving
Eastern Region Hot Mix Asphalt Route Rumble Strips - Install Rumble Strips
SR 272/Colfax to Idaho State Line - Chip Seal
Eastern Region Chip Seal Rumble Strips - Install Rumble Strips SR 290/Mission Ave. to Sullivan Rd. - Paving
US 2/Francis Ave. to Division Wye - Paving SR 290/Spokane River Trent Bridges - Strip Seal Rehabilitation
SR 21/US 2 to Keller Ferry - Chip Seal SR 291/Suncrest to SR 231 - Chip Seal
SR 26/Bridge Approach Repair and Deck Overlay SR 904/Mullenix Rd. to Betz Rd. - Paving
Emergent (16)
Statewide Recreational Vehicle (RV) Meter Replacement SR 14/Skamania County Winter Pavement Damage 2017
SR 8/Elma Safety Rest Area (SRA) Sewer Line Upgrade - Olympic Region
US 12/Old Naches Highway Vicinity to I-82 - Repair Bridge Joint Headers
I-90/Indian John Hill Eastbound Safety Rest Area - RV Slab Replacement - South Central Region
SR 240/Columbia Center Blvd. to US 395 - ADA Compliance
SR 906/Travelers Rest Safety Rest Area - Roof Repair - South Central Region
SR 21/Motor/Vessel Sanpoil Repairs
I-5/Northbound Off-Ramp to SR 526 - Expansion Joint Replacement SR 25/Northport Bridge Repairs - Traffic Control
SR 11/MP 12.76 Chuckanut Drive Vicinity - Emergency Rock Scaling I-90/Spokane Viaduct - Repair Expansion Joints
I-90/Eastbound MP 23.0 to SR 18 - Active Warning Sign (AWS) Safety Improvements
US 195/BNSF and Pine Creek Bridges - Expansion Joint Repair
SR 14/Klickitat County Winter Pavement Damage 2017 US 395/Little Spokane River Bridge - Repair Expansion Joints
Advertised Early (5)
US 101/Sol Duc River Bridge - Bridge Painting US 395/I-182 to Foster Wells Road Vicinity - Paving
US 101/Sol Duc River Bridge - Bridge Painting SR 271/Oakesdale to US 195 - Chip Seal
SR 240/Columbia Center Blvd. to US 395 - Paving
Advertised Late (19)
I-5/Toutle River Northbound/Southbound SRA Water System - Minor Rehabilitation - Southwest Region
SR 20/North of Eaglemount Half Bridge - Culvert Replacement
I-5/Southbound SR 528 Vicinity to SR 531 Vicinity - Paving US 101/Matriotti Creek - Remove Fish Barrier
I-5/Southbound SR 528 Vicinity to SR 531 Vicinity - ADA Compliance SR 112/Nordstrom Creek - Remove Fish Barrier
I-5 Northbound/Ebey Slough to SR 531 - Paving SR 240/0.2 Miles East of Jadwin Ave. to I-182 - Paving
I-5 Northbound/Ebey Slough to SR 531 - ADA Compliance SR 240/SR 224/Van Giesen Street - Intersection Improvements
I-5/Southbound SR 531 Interchange - Paving SR 240/0.2 Miles East of Jadwin Ave. to I-182 - ADA Compliance
SR 516/102nd Pl. Southeast Vicinity to 132nd Ave. Southeast - Paving SR 397/S Yew St. to South 10th Ave. - Paving
SR 516/108th Ave. Southeast to 132nd Ave. Southeast - ADA Compliance SR 397/S Yew St. Vicinity - Roadside Improvements
SR 900/Green Creek - Fish Passage Eastern Region Regionwide ADA Project - Pedestrian Access Upgrades
SR 16/Tacoma Narrows Bridge - Replace Maintenance Platform
Data source: WSDOT Capital Program Development and Management.
WSDOT advertises 16 emergent Pre-existing Funds projects
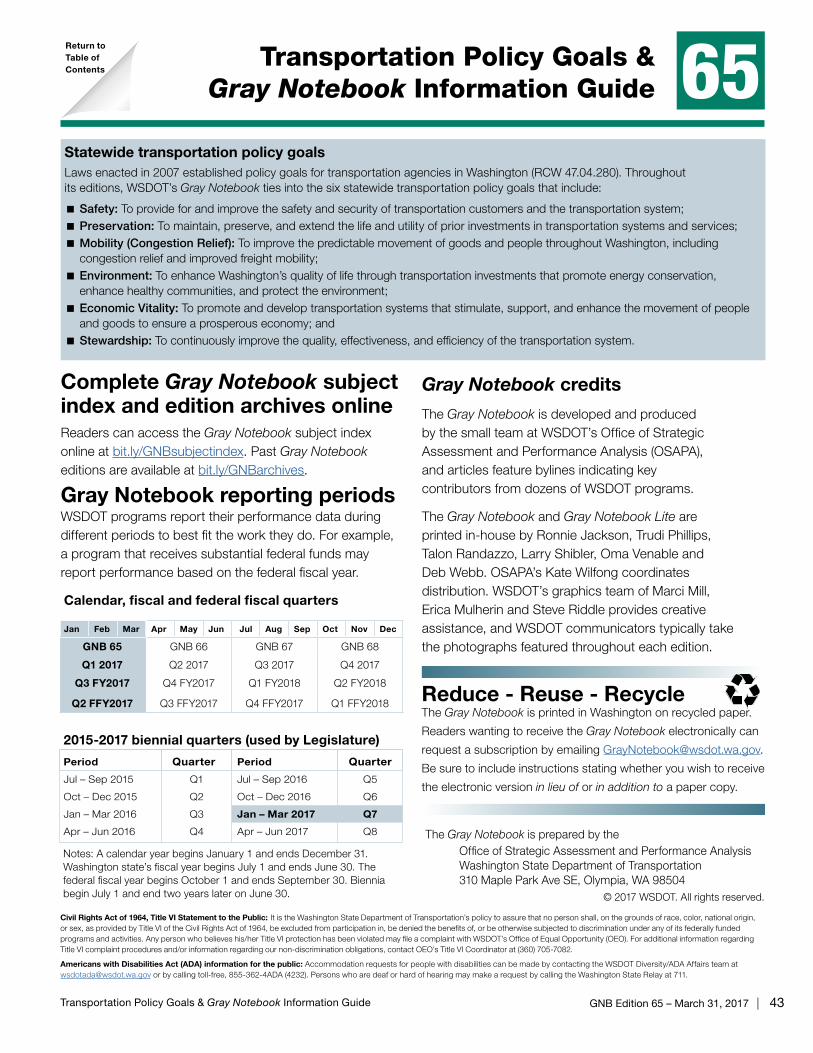
GNB Edition 65 – March 31, 2017 | 43Transportation Policy Goals & Gray Notebook Information Guide
Transportation Policy Goals & Gray Notebook Information Guide 65
Gray Notebook credits
The Gray Notebook is developed and produced by the small team at WSDOT’s Office of Strategic Assessment and Performance Analysis (OSAPA), and articles feature bylines indicating key contributors from dozens of WSDOT programs.
The Gray Notebook and Gray Notebook Lite are printed in-house by Ronnie Jackson, Trudi Phillips, Talon Randazzo, Larry Shibler, Oma Venable and Deb Webb. OSAPA’s Kate Wilfong coordinates distribution. WSDOT’s graphics team of Marci Mill, Erica Mulherin and Steve Riddle provides creative assistance, and WSDOT communicators typically take the photographs featured throughout each edition.
The Gray Notebook is prepared by theOffice of Strategic Assessment and Performance Analysis Washington State Department of Transportation 310 Maple Park Ave SE, Olympia, WA 98504
© 2017 WSDOT. All rights reserved.
Reduce - Reuse - RecycleThe Gray Notebook is printed in Washington on recycled paper.
Readers wanting to receive the Gray Notebook electronically can
request a subscription by emailing [email protected].
Be sure to include instructions stating whether you wish to receive
the electronic version in lieu of or in addition to a paper copy.
Calendar, fiscal and federal fiscal quarters
Jan Feb Mar Apr May Jun Jul Aug Sep Oct Nov Dec
GNB 65 GNB 66 GNB 67 GNB 68
Q1 2017 Q2 2017 Q3 2017 Q4 2017
Q3 FY2017 Q4 FY2017 Q1 FY2018 Q2 FY2018
Q2 FFY2017 Q3 FFY2017 Q4 FFY2017 Q1 FFY2018
2015-2017 biennial quarters (used by Legislature)
Period Quarter Period Quarter
Jul – Sep 2015 Q1 Jul – Sep 2016 Q5
Oct – Dec 2015 Q2 Oct – Dec 2016 Q6
Jan – Mar 2016 Q3 Jan – Mar 2017 Q7
Apr – Jun 2016 Q4 Apr – Jun 2017 Q8
Notes: A calendar year begins January 1 and ends December 31. Washington state’s fiscal year begins July 1 and ends June 30. The federal fiscal year begins October 1 and ends September 30. Biennia begin July 1 and end two years later on June 30.
Complete Gray Notebook subject index and edition archives onlineReaders can access the Gray Notebook subject index online at bit.ly/GNBsubjectindex. Past Gray Notebook editions are available at bit.ly/GNBarchives.
Gray Notebook reporting periodsWSDOT programs report their performance data during different periods to best fit the work they do. For example, a program that receives substantial federal funds may report performance based on the federal fiscal year.
Civil Rights Act of 1964, Title VI Statement to the Public: It is the Washington State Department of Transportation’s policy to assure that no person shall, on the grounds of race, color, national origin, or sex, as provided by Title VI of the Civil Rights Act of 1964, be excluded from participation in, be denied the benefits of, or be otherwise subjected to discrimination under any of its federally funded programs and activities. Any person who believes his/her Title VI protection has been violated may file a complaint with WSDOT’s Office of Equal Opportunity (OEO). For additional information regarding Title VI complaint procedures and/or information regarding our non-discrimination obligations, contact OEO’s Title VI Coordinator at (360) 705-7082.
Americans with Disabilities Act (ADA) information for the public: Accommodation requests for people with disabilities can be made by contacting the WSDOT Diversity/ADA Affairs team at [email protected] or by calling toll-free, 855-362-4ADA (4232). Persons who are deaf or hard of hearing may make a request by calling the Washington State Relay at 711.
Statewide transportation policy goalsLaws enacted in 2007 established policy goals for transportation agencies in Washington (RCW 47.04.280). Throughout its editions, WSDOT’s Gray Notebook ties into the six statewide transportation policy goals that include:
� Safety: To provide for and improve the safety and security of transportation customers and the transportation system; � Preservation: To maintain, preserve, and extend the life and utility of prior investments in transportation systems and services; �Mobility (Congestion Relief): To improve the predictable movement of goods and people throughout Washington, including congestion relief and improved freight mobility; � Environment: To enhance Washington’s quality of life through transportation investments that promote energy conservation, enhance healthy communities, and protect the environment; � Economic Vitality: To promote and develop transportation systems that stimulate, support, and enhance the movement of people and goods to ensure a prosperous economy; and � Stewardship: To continuously improve the quality, effectiveness, and efficiency of the transportation system.
Return toTable of Contents