Embed Size (px)
Citation preview

Kellyville Ridge Public School Annual Report
4639
2015

Introduction
The Annual Report for 2015 is provided to the community of Kellyville Ridge Public School as an account of the school’s operations and achievements throughout the year.
It provides a detailed account of the progress the school has made to provide high quality educational opportunities for all students, as set out in the school plan. It outlines the findings from self-assessment that reflect the impact of key school strategies for improved learning and the benefit to all students from the expenditure of resources, including equity funding.
Mrs Debra Edwards – Principal
School contact details:
Kellyville Ridge Public School Cnr Singleton Ave & Greenwich St Kellyville Ridge 2155 [email protected] [email protected] 888 304 80
School background
School vision statement
At Kellyville Ridge Public School, our aim is for students to reach their individual potential academically, physically and socially.
We provide every student with access to a rich and diverse curriculum which is engaging and challenging. Our school culture is inclusive and recognises and values the rights of every individual to learn in a safe and supportive environment.
A positive approach to student welfare is a focus and student achievement is regularly recognised and celebrated. We are committed to:
ensuring quality teaching and learning;
catering for and respecting the individual;
encouraging and recognising individual and group achievements;
building relationships within the school community; and
enhancing the school image.
The ideal ‘Learn, Grow, Succeed’ underpins all action taken.
School context
Kellyville Ridge Public School opened in 2004 and is located in the growth corridor of north western Sydney. KRPS is a multicultural school with a current enrolment of 850 of which 56% are from non-English speaking backgrounds.
It has an established reputation for excellence and experiences an active and supportive community, with which we enjoy a strong and productive partnership. We have a large and well-trained staff with a diverse range of experience. All staff are committed to delivering a broad, well balanced and high quality learning program catering for all students.
There is an outstanding extra-curricular program that includes band, choir, dance, chess, gardening and art.
The school provides multiple sporting opportunities and experiences great success in representative sports and carnivals.

Self-assessment and school achievements
Self-assessment using the School Excellence Framework
This section of the Annual Report outlines the findings from self-assessment using the School Excellence Framework, our school achievements and the next steps to be pursued. The Framework supports schools throughout NSW in the pursuit of excellence by providing a clear description of high quality practice across the three domains of Learning, Teaching and Leading.
This year, our school undertook self-assessment using the elements of the School Excellence Framework. The results of this self-assessment process will be used to refine the strategic priorities in our School plan for 2016.
As a staff we thoroughly examined the school plan and reflected on the progress being made across the school, based on the expectations identified in the Framework. This has provided an important overview to ensure our improvement efforts align with these high level expectations.
The results of this process indicated that:
In the domain of Learning, positive and respectful relationships are evident among students, promoting student wellbeing and ensuring good conditions for student learning. The school consistently implements a whole-school approach to wellbeing that has clearly defined behavioural expectations and creates a positive teaching and learning environment. Teachers involve students and parents in planning to support students as they progress through the stages of education. There are systematic policies, programs and processes to identify and address student learning needs.
Individual student reports include descriptions of the student’s strengths and areas of growth. Parents are updated on the progress of their children. The school achieves good value-added results and around 20% of students achieve at high levels of performance on external performance measures. Students are showing a higher than expected growth on internal school performance measures.
In the domain of Teaching, teachers regularly use student performance data and other student feedback to evaluate the effectiveness of their own teaching practice. Teachers provide explicit, specific and timely formative feedback to students on how to improve. Teachers incorporate data analysis in their planning for learning. Assessment instruments are used regularly to help monitor student learning progress and to identify skill gaps for improvement.
Teachers work together to improve teaching and learning in their year groups, stages or for particular student groups. Teachers provide and receive planned constructive feedback from peers, school leaders and students to improve teaching practice. Teachers actively share learning from targeted professional development with others. There is a particular focus on improving teaching methods in literacy and numeracy, with professional learning activities focused on building teachers’ understanding of effective teaching strategies in these areas. Teachers are actively engaged in planning their own professional development to improve their performance.
Teachers demonstrate responsibility, adaptability and ethical practice in working towards the school’s goals. Teachers work beyond their classrooms to contribute to broader school programs.
In the domain of Leading, the school solicits and addresses feedback on school performance. Leadership development is central to school capacity building. The school has productive relationships with external agencies such as universities, business, industry and community organisations to improve educational opportunities for students.
Monitoring, evaluation and review processes are embedded and undertaken routinely. Clear processes, with accompanying timelines and milestones, direct school activity towards effective implementation of the school plan. Strategic financial management is used to gain efficiencies and to maximise resources available to implement the school plan. Physical learning spaces are used flexibly and technology is accessible to staff and students.
Streamlined, flexible processes exist to deliver services and information and strengthen parental engagement.
For more information about the School Excellence Framework please visit: http://www.dec.nsw.gov.au/about-the-department/our-reforms/school-excellence-framework.

Strategic Direction 1 – Student Learning & Wellbeing
Purpose
To develop students who:
- are literate and numerate; - are visible learners; - are empowered in their learning; - effective users of technology; and - are learning in a safe and secure environment.
Overall summary of progress
The procedures undertaken by the learning and support team have been enhanced and clearly communicated to staff. Processes to monitor and plan student progress in literacy and numeracy have been clearly documented. This has enabled us to provide consistent and more focused early identification and intervention support to individual students in partnership with their parents/carers. The introduction of the positive behaviour for learning philosophy was started, with a team being formed and trained and an introduction to the program provided for staff. Staff undertook the initial identification of suitable expectations for outside areas.
Progress towards achieving improvement measures – to be achieved over 3 years Resources
Improvement measure (to be achieved over 3 years)
Progress achieved this year $
Overall mean achievement in end of year school based assessments in Reading and Mathematics increasing annually.
READING K Yr 1 Yr 2 Yr 3 Yr 4 Yr 5 Yr 6 2015 79% 75% 80% 68% 84% 78% 78% MATHEMATICS 2015 75% 75% 75% 75% 75% 76% 72%
Technology
$ 26,256
Educational Delivery
$50,931
Curriculum
$117.58
School value added as reported in annual School Excellence Framework reports consistently performing above similar schools (Year 3 –Year 5)
Yr 3 – Yr 5 2014 2105 Yr5 – Yr 7 2014 2015 KRPS 85.3 84.8 41.6 44.7 Similar schools 83.7 84.7 42.3 43.7
Proportion of students at or above National minimum standards in NAPLAN results, consistently higher than like schools.
Yr 3 2014 2015 Yr 5 2014 2015 KRPS 98% 99% 99% 97% Similar schools 98% 98% 98% 98%
Attendance rates consistently higher than state average and like schools.
Attendance 2014 2015 KRPS 95% 95% Similar schools 95% 95%
Responses to social-emotional questions as measured through the ‘Tell them from Me’ survey, at or above NSW Government norms.
Social Aspects KRPS NSW Gov Norm Sense of belonging 81% 81% Positive relationships 90% 88% Value schooling 97% 97% Interested & motivated 82% 78% Effort 92% 88% Challenged 44% 53% Extra-curricular 72% 55%
Next steps
Future Directions
Development of whole school plan to guide systematic collection of a range of student assessment data.
Teacher access to tools, skills and training to help them interpret and use this data effectively.
Systems will be established that enable students and parents to have an active voice in the implementation of PBL.

Strategic Direction 2 – Quality Teaching & Learning
Purpose
To develop teachers and leaders who are committed to quality teaching and leading through:
- continuous involvement in professional learning, including teacher accreditation procedures and the development of annual professional development plans; - the use of assessment data to develop effective teaching & learning programs and set school targets; - use of visible learning and inquiry based learning in class programs; and - effective implementation of the NSW DEC syllabus documents.
Overall summary of progress
Professional learning has continued with a focus on deepening the understanding for all staff of the new mathematics, science and history syllabuses. Staff participated in a combined professional learning conference with other schools from the Norwest Learning Community and executive networking with local schools has continued to be an important part of professional development.
The school implemented the new Performance Development Framework this year. Staff were involved in a collaborative discussion on the reflective process that is now guiding this process. We implemented a structured process of class observations and regular and effective monitoring and feedback processes are in place.
Progress towards achieving improvement measures – to be achieved over 3 years Resources Improvement measure (to be achieved over 3 years)
Progress achieved this year $
Results on ‘Visible Learning’ developmental matrix show improvement in the areas of need as indicated in the annual reviews.
On-line survey results indicate maintenance or growth in specific elements as follows: 1. The Visible Learner – 8/12 2. Know thy Impact – 11/16 3. Inspired and Passionate Teachers – 7/12 4. Feedback – 9/11 5. School Climate – 7/8 6. Strategic Planning – 4/5 7. Walkthroughs/ Observations – 6/6
Salaries - Teaching
$4,694,956
Salaries – Non Teaching
$395287
Professional Learning
$17,129
Improvement in the level of staff satisfaction as measured through the ‘Tell them from Me’ survey, from a baseline established in 2015.
Drivers of Student Learning - scores out of 10 1. Leadership – 7.4 2. Collaboration – 7.9 3. Learning Culture – 7.8 4. Data informs Practice – 7.9 5. Teaching Strategies – 7.9 6. Technology – 6.8 7. Inclusive School – 8.1 8. Parent Involvement – 6.6
All teachers will participate in targeted professional learning and will demonstrate that they meet the Australian Professional Standards for Teachers.
Early Years Teacher Support provided – 13 Initial Accreditation – working towards - 4 Maintenance of Accreditation - 5
Next steps
Continued professional development on: - best practice in the teaching of literacy and numeracy; - implementation of syllabus documents; - provision of effective feedback to students; - effective and systematic use of syllabus outcomes and the literacy and numeracy continuum tracking to inform the development of teaching and learning programs; and - Provision of effective feedback to staff through use of class walkthroughs and peer observations.

Strategic Direction 3 – School & Community Culture
Purpose
To enhance school and community culture by:
- developing partnerships with neighbouring schools, community businesses and welfare agencies; and - building a culture of educational partnership by providing opportunities for members of the wider community to become more involved with the school.
Overall summary of progress
The school has continued to provide a broad range of extra-curricular activities from the areas of creative and performing arts, sport, gardening, chess and public speaking. Extra-curricular activities are embedded into the school timetable and focus on the engagement and wellbeing of students. These programs have been strongly supported by the school community.
School program of homework was evaluated with parent input sought. The response to the survey was excellent with 20% of our parent community responding.
Progress towards achieving improvement measures Resources
Improvement measure (to be achieved over 3 years)
Progress achieved this year $
“Tell them From Me’ surveys show increasing parent satisfaction with the implementation of a school culture of collaborative planning, reflection on instruction and peer coaching.
Drivers of Parents – Partners in Learning Scores out of 10 - 1. Parents feel welcome – 6.9 2. Parents are Informed – 6.1 3. Parents support learning at home – 6.5 4. The school supports learning – 7.2 5. The school supports positive behavior – 7.8 6. The school is a safe school – 7.3 7. Inclusive School – 6.3
Maintenance $9030
Administration
$122,736
Increasing numbers of community members accessing school information via the school app, school website and school facebook page.
No data available at this time. Facebook page, school app and school website – new in 2016.
Next steps
- General school communication will be improved through use of school app, school facebook page and the school website;
- The DEC ‘Strengthening Family and Community Engagement in Student Learning Resource’ will be used to analyse current practice, determine priorities for action and develop an action plan; and
- Administrative practices and communication between the office, staff teaching staff, Principal and the wider community will be reviewed for effectiveness and efficiency.
Next Steps

Key initiatives and other school focus areas
Key initiatives (annual) Impact achieved this year Resources (annual)
Aboriginal background funding
During 2015, we used this funding to enable every indigenous student to receive additional teacher aide support in literacy and numeracy.
These funds were also used to allow students to access specialist programs in the school including sport in schools and music programs.
$5207
English language proficiency funding
EAL/D learners are students whose first language is a language or dialect other than Standard Australian English. These students sometimes require additional support to assist them to develop English language proficiency. At Kellyville Ridge Public School we have 56% of students who identify as EAL/D.
Our funding was used to staff 1.6 EAL/D teaching positions as well as fund other targeted support initiatives. These initiatives included whole school events such as the celebration of Harmony Day and a Multicultural Day in November.
$162,540
Targeted students support for refugees and new arrivals
Refugee and newly arrived students were identified initially upon enrolment. Ongoing support was provided by the EAL/D staff in orienting these students and their parents into the school. Additional in-class assistance was also provided in literacy and numeracy.
$3103
Socio-economic funding
Funding was used to provide additional staff positions including an IT mentor, who provided support to class teachers in the implementation and use of IT in teaching/ learning programs, an additional Assistant Principal to provide ongoing support to the early years teachers and additional school learning and support time.
$20,928
Low level adjustment for disability funding
The School Learning & Support Officer, under the guidance of the Learning & Support Teacher, provided support for all students requiring learning adjustments. Focus was placed on those students requiring additional support in literacy. The School Learning & Support Officer (SLSO) was provided within the class setting, working with individual students or small groups.
Additional SLSO Support was provided to supplement the SLSO timetable.
$19,418
Support for beginning teachers
Beginning teachers were released from class for two hours per week to undertake a range of activities. These activities included support meetings with their supervisors and the Assistant Principal responsible for overseeing the program, in-class observations of experienced teachers and professional learning linked to their professional learning goals.
Teachers were also given support with gathering and annotating evidence towards their accreditation.
$71,356

0
200
400
600
800
1000
2009 2010 2011 2012 2013 2014 2015
Stu
den
ts
Year
Enrolments
Male Female
Student information
It is a requirement that the reporting of information for all students be consistent with privacy and personal information policies.
Student enrolment profile Enrolments remain steady with approximately 844 students by the end of the year. There continue to be more boys than girls enrolled.
Student attendance profile The average attendance rate for all students during 2015 was 94.7%. This continues to be higher than the State level
Year 2012 2013 2014 2015
Sch
oo
l
K 95.5 96.7 96.4 94.3
1 94.9 95.0 95.3 94.1
2 95.8 96.1 95.1 94.6
3 96.1 95.2 95.7 95.5
4 95.7 96.1 95.3 95.2
5 95.3 95.9 96.1 94.1
6 96.6 95.6 94.6 95.0
Total 95.7 95.8 95.5 94.7
Stat
e D
oE
K 94.3 95.0 95.2 94.4
1 93.9 94.5 94.7 93.8
2 94.2 94.7 94.9 94.0
3 94.4 94.8 95.0 94.1
4 94.3 94.7 94.9 94.0
5 94.2 94.5 94.8 94.0
6 93.8 94.1 94.2 93.5
Total 94.2 94.7 94.8 94.0
Class Sizes
Roll class Year Total in class Total per year
KC K 22 22
KH K 22 22
KM K 23 23
KS K 22 22
KWL K 21 21
K-1O K 12 21
1 9 21
1B 1 24 24
1G 1 23 23
1M 1 25 25
1SW 1 24 24
2E 2 25 25
2F 2 24 24
2I 2 24 24
2M 2 25 25
2PB 2 25 25
3D 3 27 27
3KD 3 27 27
3M 3 25 25
3N 3 24 24
3S 3 27 27
4C 4 27 27
4D 4 29 29
4H 4 29 29
4L 4 28 28
5 S 5 29 29
5K 5 30 30
5R 5 29 29
5Z 5 29 29
6B 6 27 27
6HR 6 27 27
6K 6 29 29
1-2G 1 13 24
2 11 24
5-6A 5 13 28
6 15 28
Gender 2011 2012 2013 2014 2015
Male 342 386 433 443 447
Female 371 385 398 404 392

Workforce information
Reporting of information for all staff must be consistent with privacy and personal information policies.
Workforce composition
Position Number
Principal 1
Deputy Principals 2
Assistant Principals 4
Classroom Teachers 31.912
Learning and Support Teacher 1.2
Teacher Librarian 1.4
Teachers of ESL 1.6
School Counsellor 0.3
School Administrative & Support Staff 5.172
Total 48.584
The Australian Education Regulation, 2014 requires schools to report on the Aboriginal composition of their workforce.
We have no indigenous employees on staff.
Teacher qualifications All teaching staff meet the professional requirements for teaching in NSW public schools.
Qualifications % of staff
Undergraduate degree or diploma 100
Postgraduate degree 17
Professional learning and teacher accreditation
Professional Learning
Teacher professional learning was funding to the amount on $17,129 in 2015. Shared professional learning experiences by staff included:
mandatory training in anaphylaxis, CPR, asthma, code of conduct and child protection;
completion of an on-line course ‘Inclusion of Learners with Speech, Language and Communication Needs’ by the K-1 staff;
participation in adobe on-line courses in LMBR by Principal and the School Office Manager;
school based training in English, PBL implementation and creative arts; and
provision of support for beginning and early
years teachers in literacy and numeracy.
Financial information
Financial summary
This summary covers funds for operating costs and does not involve expenditure areas such as permanent salaries, building and major maintenance.
A full copy of the school’s 2015 financial statement is tabled at the annual general meetings of the parent and/or community groups. Further details concerning the statement can be obtained by contacting the school.
Financial summary for 229 (SAP) schools
2015 Actual ($)
Opening Balance
Revenue
Appropriation
Sale of Goods and Services
Grants and Contributions
Investment Income
Gain and loss
Other Revenue
Expenses
Recurrent Expenses
Employee Related
Operating Expenses
Capital Expenses
Employee Related
Operating Expenses
Surplus/Deficit for the Year
Balance Carried Forward
686,454
6,144,227
5,385,962
-
-
150,564
837,018
260,248
482,476
15,540
-
-
(5,993,663)
(5,409,570)
(584,093)
Component RAM
4,918,798 4,947,351 0.93417 Education (93.4%)
Location -
Other Base 4,918,798
Equity 348,625
Aboriginal 5,207 5,207 0.00098 Aboriginal (0.1%)
Socio-Economic 20,928 20,928 0.00395 Socio-Economic (0.4%)
Language 162,540 162,540 0.03069 Language (3.1%)
Disability 159,950 159,950 0.0302 Disability (3%)
Equity Transition - - 0 Equity Transition (0%)
22,521 0 Targeted Total (0%)
6,032 0 Other Total (0%)
Total 5,295,976
Base
Targeted Total
Other Total
RAM Funds
Education (93.4%) Aboriginal (0.1%)
Socio-Economic (0.4%) Language (3.1%)
Disability (3%) Equity Transition (0%)

SPORT
Athletics Carnival
The 2015 school athletics carnival was our most successful yet. All students performed at their personal best and showed great sportsmanship. KRPS received outstanding results at the Ridges carnival with many students progressing to the Sydney West and State carnivals.
Sydney West Athletics Carnival
Eighteen Kellyville Ridge PS athletes competed at the Sydney West Athletics Championships, out-performing 124 other schools to finish as the 5th best athletics team in the Sydney West Region. There were many excellent individual and relay team results and three standout athletes also qualified to compete at the NSWPSSA State Championships.
Cross Country
“It’s hard to beat a person who never gives up” – Babe Ruth Despite two postponements, KRPS descended upon Connor Greasby Reserve, for the running of the much-anticipated 2015 Cross Country Carnival. Students from Kindergarten to Year 6 provided all assembled with some nail-biting finishes on arguably the toughest cross country course the Ridges area has to offer.
Our competitors dug-in and attacked K-Ridge’s very own version of ‘Heartbreak Hill’, demonstrating perseverance, courage and enthusiasm to ‘give something a go’. The students enjoyed their day in the sun and some excellent performances ensured a very competitive team for the next level of competition – the Ridges Cross Country Carnival.
Swimming Carnival
This year during Term 1, students from Years 2 to 6, had the opportunity to compete in the KRPS school swimming carnival. Students showed off their talents in the pool, and recorded excellent results. Congratulations to all the students who participated in this year’s carnival.
Summer PSSA
Cricket
2015 proved to be a fantastic year in cricket for KRPS in the PSSA Summer competition. The senior team, were dominant premiers in their competition. Consistent run scoring, tight bowling and enthusiastic fielding were features of their play each week.
The junior team also were very successful and remained undefeated for the season, for the second year in a row! There were many great team performances during the year and always good sportsmanship shown throughout the year. Well done to our junior team!
Oz Tag
Playing under League Tag rules for the first time, the junior and senior teams adapted well and demonstrated resilience when faced with confusion or inconsistent rule interpretations.
Consisting of a mix of experienced state-level, competition and beginner players, both teams committed themselves to the competition played over Terms 1 and 4, and provided some exceptional and entertaining play – who could forget the junior team’s nail-biting victory against Rouse Hill in the final minute! Undefeated in their competition, the junior

team showed their class and achieved the title of 2015 Premiers.
The senior team overcame a wobbly end to Term 1 and bonded together as a team to win every game in Term 4 to stage a fantastic comeback and finish equal Runners-Up. Congratulations to both 2015 teams.
Newcombeball
Trials for the Open Boys and Girls PSSA Newcombe Ball Teams were extremely well attended, which ensured the selection of two quality teams. Regularly dominating their competition, the boy’s team played with a friendly spirit and integrity and deserved their final placing as joint premiers.
The girl’s team persevered despite tough competition and began to taste success through hard work and coming together as a team. Despite a large number of wet-weather affected weeks, both teams enjoyed travelling to other schools as a team in the PSSA Newcombe ball competition.
Winter PSSA
Boys Soccer
The 2015 junior and senior boys soccer competitions were the closest in Ridges history. Our senior boys made a slow start to the season, but showed great determination and skill to climb to third overall. Congratulations to our junior boys who won many hard fought matches and claimed the title for the second year in a row.
Girls Soccer
PSSA Girls Soccer had a great year. Both seniors and juniors performed well showing an increasing level of skill as the season progressed. The girls had excellent results with both juniors and seniors winning or drawing a respectable amount of games. The girls showed fantastic sportsmanship and played each game with fairness and pride.
We have a committed team who will continue to develop their skills and progress even further next year.
Netball
In 2015 Kellyville Ridge PS had a very successful year in both junior and senior netball. Unfortunately, the season was continually interrupted with poor weather, cancelling many games. However, both teams were undefeated and were the premiers of the winter competition. There were many games when the teams experienced high scores.
There was an even amount of attacking and defending during each game. Every player contributed their best in their given position and was always encouraging to each other.
It was especially wonderful to see the senior players mentoring the juniors, teaching them a range of new skills. Both teams were enthusiastic cheer squads for the other.
The girls were quite independent in the training sessions and shared their own thoughts regarding different practice activities.
Overall, a standout year for all the students involved. It had been a pleasure to coach the netball teams this year.
Rugby League
The KRPS Senior and Junior Rugby League teams performed well throughout the 2015 season, managing to win the majority of their games.
Once again, our juniors and seniors both finished the season strongly, finishing Runners Up to the talented Rouse Hill teams in their respective competitions.
Rock solid defence, attacking ball movement and good organisation were all features of our play during the season!

PERFORMANCE
School Band
The band program in 2015 again consisted of over 200 students from Years 3 to 6. The Performance Band which consists of 55 players featured at the Ridges Music Festival. Both the Junior Band and Performance band performed at events such as Education week and Presentation assemblies.
This year saw the recording of “Ridge Renditions 3” with the Guitar groups recording two tracks, the percussion Ensemble recording one track, the junior band recording two tracks and the Performance Band recording 8 tracks. Expressions of Interest for band in 2016 have exceeded all expectations.
School Choirs
2015 was a very successful year for the Junior Choir. The junior Choir consists of 60 Year 1 and 2 students. Performances included Presentation Assemblies, Twilight markets and Education Week. Our year culminated in the recording of two tracks of the “Ridge Renditions 3” school CD.
The Senior Choir consisted of 60 students from Years 3 to 6 who were auditioned in Term 1. They Performed at the Ridges Music Festival, Presentation Assemblies and Education Week. Our year culminated in the recording of three tracks of the “Ridge Renditions 3” school CD.
2015 was a very successful year for the Chamber Choir. These top 30 students went through a rigorous audition process at the start of 2015. Performances included Ridges Music Festival, Presentation Assemblies and Education Week. Our year culminated in the recording of six tracks of the “Ridge Renditions 3” school CD.
Dance
Kindergarten Dance was established at the beginning of the year with 24 enthusiastic girls. They learnt jazz dance steps and rehearsed 2 routines. They performed Little Saint Nick in Christmas costumes at our final K-2 Assembly to a delighted audience. Christmas elves, fairies, Mrs Claus and Santa’s reindeers were fantastic.
This year, the Year 2 Dance Group were committed to Thursday lunch time dance practices and mastered the choreography to the well-known pop song ‘Uptown Funk’ by Mark Ronson, featuring Bruno Mars.
The Year 2 Dance Group performed at the Twilight Markets in front of families in our local community.
Their performance was outstanding and they are commended for their consistent effort throughout the year. Well done girls!
At the beginning of the year, many boys auditioned for the twenty places open for eager students who wished to improve their dance skills and have fun. The boys watched closely, innovated on simple dance steps and learned to move with increased timing.
They worked as a team, encouraging and supporting each other throughout the year as we had fun and developed our hip-hop moves.
Skipping Groups
This year saw dozens of eager boys and girls auditioning for the K-2 skipping group. The final squad of 14 met and practised every week and progressed from basic skills to advanced skipping tricks. A very excited group gave their grand finale performance at the K-2 Christmas Assembly.
22 energetic and committed skippers were selected from a pool of over 250 hopefuls to join the popular senior skipping team. Consisting of a mix of experienced and developing talent, the group met weekly to practice, refine and invent new tricks, incorporating dance techniques and acrobatics for use with short, long, individual and multiple ropes.
The group worked tirelessly to collaboratively choreograph a dynamic and unique routine to “Bills” (by Lunch Money Lewis) to perform during the Education Week Open Day and Twilight Markets.

Senior skipping team members gave up their lunch breaks in the lead up the Jump Rope for Heart Jump OFF Day to hold skipping workshops, and led activity stations on the day itself.
Attention to talent identification and development this year will enable skipping to progress in 2016
Drama
The year began with introducing theatre sports games and theatrical techniques to work the group towards a performance. Our talented drama group worked tirelessly all of Term 3 and 4 to produce an outstanding multi-media play that was the highlight of the 3-6 assembly.
The children auditioned for the main roles as well as workshopping their characters. Scenes were filmed all over the school and the children explored many acting techniques to expand on the quality of the performance. Some students engaged in the beginnings of method acting, resulting in well-developed character portrayals.
Student Achievement in 2015
Student Representative Council
What another productive year the SRC had in 2015!
The two discos were lots of fun as students dressed up as a variety of different characters of all shapes and sizes in Term 3 and many types of freaky outfits in a range of colours in Term 2.
Our SRC helpers were always willing to lend a hand selling glow sticks, handing out lollies or leading a dance or two.
This year we enjoyed crazy sock and hat day. Due to the cooler weather we were able to add a colourful scarf or two. Money raised went to support the school’s chosen charity of Stewart House. We were able to send them $727. The second charity that we chose to support this year was CANTEEN with Bandana Day. Students bought bandanas to wear on a
Friday at school. The SRC successfully raised $2400 and sold every single bandana. How amazing!
A very big thank you to all the students of the SRC! They were always willing and eager to be involved any way possible. Their enthusiasm was greatly appreciated.
Chess Club
The Chess Club would get together every Tuesday at recess and compete against each other, aiming to build their skills and knowledge of the game. Each Friday in Term 2, selected members of the chess group would compete in chess competitions at local schools. They are commended for their efforts and won every game they played. There were also one day competitions in which this team placed well.
On the 19th October, Kellyville Ridge P.S. participated in a One Day - Three Man Chess Competition. Our three players placed 4th overall. With this highly placed result, Kellyville Ridge was offered a place in the Finals. On Sunday 29th November Kellyville Ridge participated in the finals. The players played well against some highly competitive teams from all over NSW. Well done to all four players who participated over the two days.
Debating
This year saw the beginning of a new debating competition, “Ridges Friendly Debating”. Kellyville Ridge organised and hosted 2 out of 3 competition days with Parklea and John Palmer participating. This competition was open to Stage 3 students from all Ridges schools.
Our debating team was successful in winning all 3 debates with solid arguments and supporting evidence that carried their team. They were able to rebut any arguments put forward by their opposing team and grew in confidence throughout the year. I would like to congratulate the boys on an excellent performance and wish them all the best in the next year’s bigger and better competition.
Premier’s Spelling Bee
As a new initiative this year, a spelling group was started for Years 3-6 to provide opportunities for students gifted and talented in spelling and for those students who have a keen interest in this area.
The spelling group consisted of 8 students from Years 3-6. The students participated in weekly practice sessions where they were provided with opportunities to engage and critically analyse a variety of spelling techniques including written and verbal strategies. Four enthusiastic and committed spellers were then selected from these spellers to represent KRPS at the NSW Premier’s Spelling Bee, 2015.
These students participated in the semi-finals held at Matthew Pearce Public School on the 15th September, 2015. They performed extremely well, spelling some exceptionally tricky words with ease and confidence. It was a great achievement for one of these participants to reach all the way up to round 9 of the semi -finals. Well done to all the four participants who represented the school in this challenge.
Significant programs and initiatives
Aboriginal Education
The school’s students K-6 have continued to learn aspects of Aboriginal history and culture through the relevant Human Society and it’s Environment (HSIE) units.
The school marked the special occasion of NAIDOC Week in July, with assemblies and the flying of the Aboriginal flag.
Whilst the Aboriginal student population is very small, Aboriginal origins of this local community are recognised through the ‘Acknowledgment of Country’ at the beginning of special assemblies.
EAL/D Program
Kellyville Ridge Public School’s enrolment of children with a language background other than English remains at approximately 58% of the school’s total. The EAL/D allocation of staff for 2015 remained at 1.6 teacher days.
All students whose first language is not English are assisted to become competent enough in English so that they can take an effective part in mainstream Australian social and educational activities and also so that they can participate in the wider context of society.
The EAL/D program at Kellyville Ridge focuses on language acquisition and learning across all curriculum areas.
Multicultural Education
In 2015 Kellyville Ridge Public School celebrated Harmony Day 19th March 2015. The children were able to dress up in orange, the traditional colour of Harmony Day to remind them that this means we should live in peace and agree with each other. The children were able to contribute to discussions on ‘Peace, Tolerance and Harmony‘which was the main theme of Harmony Day. They also drew pictures, played different games, listened to and shared stories.
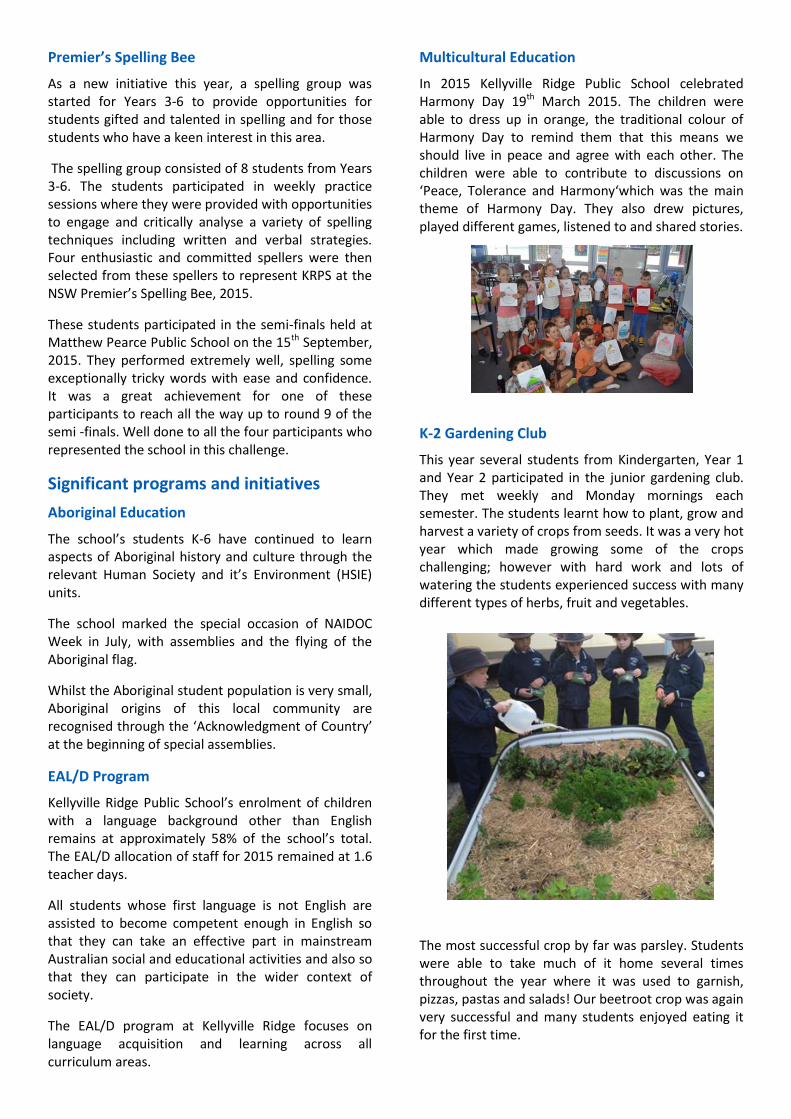
K-2 Gardening Club
This year several students from Kindergarten, Year 1 and Year 2 participated in the junior gardening club. They met weekly and Monday mornings each semester. The students learnt how to plant, grow and harvest a variety of crops from seeds. It was a very hot year which made growing some of the crops challenging; however with hard work and lots of watering the students experienced success with many different types of herbs, fruit and vegetables.
The most successful crop by far was parsley. Students were able to take much of it home several times throughout the year where it was used to garnish, pizzas, pastas and salads! Our beetroot crop was again very successful and many students enjoyed eating it for the first time.

3-6 Gardening Club
The 3-6 participated in gardening club this year. The students attended the weekly gardening club sessions with enthusiasm and willingness to learn more about gardening. The sessions involved planning and choosing the right seeds for the season. This was followed by careful planting of seeds and sufficient watering of plants, being mindful when it had been raining a lot or alternatively, not raining enough.
Semester one was successful, growing broad beans and lettuce, so the children’s weekly hard work paid off. Towards the end of the semester, students brought home their broad beans and lettuce to share with their loved ones.
Semester two, was particularly exciting for the children, as they were fortunate enough to experience heavy rainfall, resulting in the carrots and tomatoes they planted, growing rapidly, giving children the opportunity to bring home carrots and tomatoes.
This exercise helps to promote lessons in sustainability in Agriculture, as well as healthy eating.
Further, the gardening beds continue to deliver more of what the children planted, so well done children you all did a great job.
ICAS Competitions
The International Competitions and Assessments for Schools (ICAS) are independent skills-based assessments with a competition element. ICAS are developed annually for primary students in the subject areas of Digital Technologies, English, Mathematics and Science.
Kellyville Ridge Public School participation and results have been outstanding this year with over 400 children completing the four assessments.
The combined results were as follows:
TEST HIGH DISTINCTION
DISTINCTION CREDIT
Digital Technology
4 7 29
English 4 7 29 Mathematics 2 8 32 Science 1 10 20
Premier’s Reading Challenge
Kellyville Ridge Public School again participated in the NSW Premier’s Reading Challenge this year. All students in Years K, 1 and 2 experienced 30 books from the PRC booklist with their classroom teacher.
A record number of 3 – 6 students, who needed to individually read 20 of the designated books and log their results on the PRC website, completed the challenge this year many of whom received a ‘Gold Certificate’ as recognition of completing the challenge for four straight years.
Year 6 Token Day
During Term 2 in the lead up to the annual Token Day, Year 6 students were engaged in inquiry-based and open-ended learning tasks aimed at developing an understanding of best practice in running a commercial business. In doing this, students investigated the mechanics of a business, focusing on the day-to-day operation and marketing of their products and services.
Token Day was a fundraiser that involved fun activities for students in Kindergarten to Year 5. It encouraged student leadership where Year 6 had to organise and run stalls for the enjoyment of other students and in turn, raise funds for the school.

0
10
20
30
40
50
1 2 3 4 5 6
Pe
rce
nta
ge o
f st
ud
en
ts
Bands
Percentage in bands:Year 3 Writing
Percentage in Bands
School Average 2011-2015
State DoE % in Bands 2015
0
10
20
30
40
1 2 3 4 5 6
Pe
rce
nta
ge o
f st
ud
en
ts
Bands
Percentage in bands:Year 3 Reading
Percentage in Bands
School Average 2011-2015
State DoE % in Bands 2015
School performance
NAPLAN – Year 3
In the National Assessment Program, the results across the Years 3, 5, 7 and 9 literacy and numeracy assessments are reported on a scale from Band 1 to Band 10.
The achievement scale represents increasing levels of skills and understandings demonstrated in these assessments.
Literacy
In Year 3, 130 students sat for the NAPLAN in literacy, 77 boys and 53 girls.
Of these students, 65 students identified as having someone at home who speaks a language other than English.
Performance within school between boys and
girls indicated that overall, girls performed better than boys in Year 3.
The average mark in reading for the school was 442 compared to 430 for the State DEC.
The average mark in writing for the school was 439 compared to 423 for the State DEC.
1 2 3 4 5 6
1 6 18 34 28 43
0.8 4.6 13.8 26.2 21.5 33.1
1.6 6.9 15.5 29.9 20.6 25.5
2.1 2.8 15.6 19.6 23.0 36.9
5.3 6.7 20.4 21.1 18.4 27.9
Year 3 NAPLAN Reading
Average score, 2015
Skill Band Distribution
Number in Bands
Percentage in Bands
School Average 2011-2015
SSG % in Bands 2015
State DoE % in Bands 2015
Band
422.4
State DoE
449.4
SSG
442.6
School
1 2 3 4 5 6
3 10 17 26 31 43
2.3 7.7 13.1 20.0 23.8 33.1
1.8 5.3 13.0 20.0 26.2 33.7
1.7 6.2 15.2 23.0 21.9 32.1
5.0 10.7 18.9 20.3 19.0 26.1
Band
Number in Bands
Percentage in Bands
State DoE
Average score, 2015 439.7 435.1 413.3
Year 3 NAPLAN Spelling
School SSG
Skill Band Distribution
School Average 2011-2015
SSG % in Bands 2015
State DoE % in Bands 2015
Skill Band Distribution
1 2 3 4 5 6
1 2 9 35 61 22
0.8 1.5 6.9 26.9 46.9 16.9
0.7 2.8 11.8 21.1 46.4 17.2
0.7 2.8 10.4 24.0 44.6 17.5
2.3 5.1 18.5 23.6 36.3 14.2
School Average 2011-2015
State DoESSG
434.8 417.1
Band
Number in Bands
Percentage in Bands
SSG % in Bands 2015
State DoE % in Bands 2015
School
Average score, 2015 439.6
Year 3 NAPLAN Writing

0
10
20
30
40
1 2 3 4 5 6
Pe
rce
nta
ge o
f st
ud
en
ts
Bands
Percentage in bands:Year 3 Grammar & Punctuation
Percentage in Bands
School Average 2011-2015
State DoE % in Bands 2015
0
10
20
30
40
1 2 3 4 5 6
Pe
rce
nta
ge o
f st
ud
en
ts
Bands
Percentage in bands:Year 3 Numeracy
Percentage in Bands
School Average 2011-2015
State DoE % in Bands 2015
Skill Band Distribution
1 2 3 4 5 6
3 5 17 31 33 41
2.3 3.8 13.1 23.8 25.4 31.5
1.4 3.7 14.2 23.0 25.0 32.7
1.5 3.9 9.5 22.8 21.7 40.5
5.1 8.5 13.6 24.0 19.2 29.6
Year 3 NAPLAN Grammar and Punctuation
State DoE % in Bands 2015
SSG % in Bands 2015
Percentage in Bands
Number in Bands
Band
School Average 2011-2015
SSG State DoE
Average score, 2015 444.8 463.5 431.7
School
Numeracy
In Year 3, 130 students sat for the NAPLAN in literacy, 77 boys and 53 girls.
Of these students, 65 students identified as having someone at home who speaks a language other than English.
Performance within school between boys and girls indicated that overall, boys performed better than girls.
The average mark in numeracy for the school was 414 compared to 402 for the State DEC.
NAPLAN – Year 5
In the National Assessment Program, the results across the Years 3, 5, 7 and 9 literacy and numeracy assessments are reported on a scale from Band 1 to Band 10.
The achievement scale represents increasing levels of skills and understandings demonstrated in these assessments.
Literacy
In Year 3, 110 students sat for the NAPLAN in literacy, 67 boys and 59 girls.
Of these students, 57 students identified as having someone at home who speaks a language other than English.
Performance within school between boys and
girls indicated that overall, girls performed better than boys in Year 3.
The average mark in reading for the school was 497 compared to 502 for the State DEC.
The average mark in writing for the school was 488 compared to 483 for the State DEC.
1 2 3 4 5 6
1 10 27 35 35 22
0.8 7.7 20.8 26.9 26.9 16.9
1.6 6.0 21.0 29.0 27.1 15.3
2.1 8.8 18.9 25.2 22.3 22.8
5.5 14.3 22.0 22.9 17.9 17.5
Skill Band Distribution
State DoE % in Bands 2015
SSG % in Bands 2015
School Average 2011-2015
Percentage in Bands
Number in Bands
Band
SSG
418.1
School
414.0
Year 3 NAPLAN Numeracy
Average score, 2015
State DoE
395.9

0
10
20
30
3 4 5 6 7 8
Pe
rce
nta
ge o
f st
ud
en
ts
Bands
Percentage in bands:Year 5 Grammar & Punctuation
Percentage in Bands
School Average 2011-2015
State DoE % in Bands 2015
3 4 5 6 7 8
5 16 23 39 27 15
4.0 12.8 18.4 31.2 21.6 12.0
2.6 10.1 24.0 31.5 23.6 8.3
1.6 9.6 17.6 24.6 24.5 22.2
5.8 17.3 21.4 20.9 18.7 15.9
497.9Average score, 2015
Year 5 NAPLAN Reading
State DoESSGSchool
494.3522.6
SSG % in Bands 2015
Skill Band Distribution
Band
Number in Bands
Percentage in Bands
State DoE % in Bands 2015
School Average 2011-2015
Skill Band Distribution
3 4 5 6 7 8
6 7 34 50 18 8
4.9 5.7 27.6 40.7 14.6 6.5
3.0 6.8 34.1 35.7 15.1 5.4
2.4 6.1 31.4 35.5 17.4 7.2
7.3 10.2 33.9 29.6 13.4 5.6
School Average 2011-2015
Year 5 NAPLAN Writing
495.1 476.9Average score, 2015
Number in Bands
Percentage in Bands
SSG % in Bands 2015
State DoE % in Bands 2015
Band
School SSG State DoE
488.7
3 4 5 6 7 8
4 8 25 24 43 19
3.3 6.5 20.3 19.5 35.0 15.4
2.6 3.6 17.9 29.5 30.7 15.7
2.1 6.7 17.1 28.2 32.3 13.7
5.7 11.6 20.4 24.3 25.5 12.4
Year 5 NAPLAN Spelling
519.9
Percentage in Bands
School Average 2011-2015
School SSG State DoE
Average score, 2015 519.7 501.4
Skill Band Distribution
Band
SSG % in Bands 2015
State DoE % in Bands 2015
Number in Bands
Skill Band Distribution
3 4 5 6 7 8
5 13 31 29 27 18
4.1 10.6 25.2 23.6 22.0 14.6
2.4 10.2 21.7 26.7 21.5 17.5
2.4 8.0 19.8 23.5 22.8 23.7
8.2 12.3 23.5 20.7 18.8 16.5
SSG State DoE
500.9
School
508.8 529.8
Number in Bands
Percentage in Bands
School Average 2011-2015
SSG % in Bands 2015
State DoE % in Bands 2015
Year 5 NAPLAN Grammar and Punctuation
Band
Average score, 2015

2009-2011 2010-2012 2011-2013 2012-2014 2013-2015
School 86.9 79.2 81.0 75.0 81.8
SSG 71.4 92.2 82.5 84.3 79.5
State DoE 75.4 95.4 84.9 80.6 83.9
Average progress in Spelling
between Year 3 and 5*
0
20
40
60
80
2011-2013 2012-2014 2013-2015
Pro
gre
ss
Average progress in Writing between Year 3 and 5
School State DoE
0
50
100
150
2009-2011 2010-2012 2011-2013 2012-2014 2013-2015
Pro
gre
ss
Average progress in Spelling between Year 3 and 5
School State DoE
Numeracy
In Year 3, 110 students sat for the NAPLAN in literacy, 67 boys and 59 girls.
Of these students, 57 students identified as having someone at home who speaks a language other than English.
Performance within school between boys and girls indicated that overall, boys performed better than girls.
The average mark in numeracy for the school was 500 compared to 498 for the State DEC.
The average mark in numeracy for boys was 503.
The average mark in numeracy for girls was 496
Progress in Literacy and Numeracy
Matched students are those students who were attending the same school when they completed the Basic Skills Test and NAPLAN in Year 3 and in Year 5 and who could be matched in the Year 3 and Year 5 data sets. Students who changed schools between test dates are not included.
3 4 5 6 7 8
3 16 33 38 17 18
2.4 12.8 26.4 30.4 13.6 14.4
1.2 11.5 24.8 31.7 17.6 13.3
1.3 9.6 24.3 27.8 19.7 17.3
3.8 17.6 26.0 23.9 15.0 13.6
Year 5 NAPLAN Numeracy
513.1500.6
School State DoE
Skill Band Distribution
Average score, 2015
SSG
SSG % in Bands 2015
Number in Bands
Percentage in Bands
School Average 2011-2015
State DoE % in Bands 2015
Band
493.1
0
10
20
30
40
3 4 5 6 7 8
Pe
rce
nta
ge o
f st
ud
en
ts
Bands
Percentage in bands:Year 5 Numeracy
Percentage in Bands
School Average 2011-2015
State DoE % in Bands 2015
2009-2011 2010-2012 2011-2013 2012-2014 2013-2015
School 77.3 69.7 89.6 77.9 86.7
SSG 73.6 80.7 78.7 82.3 79.6
State DoE 74.0 79.2 85.7 78.8 76.4
Average progress in Reading
between Year 3 and 5*
Average progress in Writing between Year 3 and 5*
2011-2013 2012-2014 2013-2015
School 39.5 42.1 60.5
SSG 58.8 52.8 61.4
State DoE 55.2 49.3 61.3

96.0
95.1
96.7
95.9
97.6
Grammar & Punctuation
Reading
Writing
Spelling
Numeracy
Percentage of Year 5 students achieving at or
above minimum standard (exempt students
included)
The performance of the students in our school in the National Assessment Program – Literacy and Numeracy is compared to these minimum standards. The percentages of our students achieving these standards are reported below.
School Evaluation Processes
Educational and Management Practice
Homework
As a growing school, it is important to establish best practice in all areas of school life. We are continually identifying student needs and are implementing effective programs aimed at assisting student learning. Homework was the focus of the school assessment for 2015.
Findings and conclusions
A survey was provided to parents. Parent responses indicated:
91% believed that children should do homework;
the average time spend doing homework was between 20-30 minutes;
homework should be given weekly (85%);
homework should be set for up to 4 days each week (73%); and
children should not be given homework over the weekend (75%).
Areas for future development include:
focusing on the difficulty level of the tasks that are being set for homework across the school;
setting content consistency of the homework that is sent home; and
ensuring teacher expectations of homework are common across the school.
2009-2011 2010-2012 2011-2013 2012-2014 2013-2015
School 109.7 111.1 101.0 93.1 103.5
SSG 103.2 101.5 99.1 87.4 92.7
State DoE 95.8 98.2 89.7 89.1 94.1
Average progress in Numeracy
between Year 3 and 5*
0
50
100
150
2009-2011 2010-2012 2011-2013 2012-2014 2013-2015
Pro
gre
ss
Average progress in Numeracy between Year 3 and 5
School State DoE
99.2
99.2
97.7
97.7
99.2
Percentage of Year 3 students achieving at or
above minimum standard (exempt students
included)
Reading
Writing
Spelling
Grammar & Punctuation
Numeracy