Embed Size (px)
Citation preview

interim rePOrt
For the Financial Period from 1 March 2017 to 31 August 2017
KenAnGA Premier fund


Kenanga Premier Fund Interim Report i
KenAnGA Premier fund
Contents Page
Corporate directory iiDirectory of Manager’s Offices iiifund information 1manager’s report 2 - 5fund Performance 6 - 8trustee’s report 9Statement by the manager 10financial Statements 11 - 40

ii Kenanga Premier Fund Interim Report
COrPOrAte direCtOrYmanager: Kenanga investors Berhad (Company No. 353563-P)
Registered OfficeLevel 17, Kenanga Tower,237, Jalan Tun Razak,50400 Kuala Lumpur, Malaysia.Tel: 03-2172 2888 Fax: 03-2172 2999
Business OfficeLevel 14, Kenanga Tower,237, Jalan Tun Razak,50400 Kuala Lumpur, Malaysia.Tel: 03-2172 3000 Fax: 03-2172 3080E-mail:[email protected]: www.KenangaInvestors.com.my
Board Of directorsDatuk Syed Ahmad Alwee Alsree (Chairman)Syed Zafilen Syed Alwee (independent
director)Peter John Rayner (independent director)Imran Devindran bin Abdullah (independent
director)Dato’ Bruce Kho Yaw HuatIsmitz Matthew De Alwis
investment Committee Dato’ Bruce Kho Yaw Huat (Chairman) Syed Zafilen Syed Alwee (independent
member)Peter John Rayner (independent member)Imran Devindran bin Abdullah (independent
member)Ismitz Matthew De Alwis
Company Secretary: norliza Abd Samad (MAICSA 7011089)
Level 17, Kenanga Tower, 237, Jalan Tun Razak, 50400 Kuala Lumpur, Malaysia
trustee: CimB Commerce trustee Berhad (Company No. 313031-A)
Registered Office Level 13, Menara CIMBJalan Stesen Sentral 2Kuala Lumpur Sentral50490 Kuala Lumpur.Tel: 03-2261 8888Fax: 03-2261 0099Website: www.cimb.com
Business Office Level 21, Menara CIMBJalan Stesen Sentral 2Kuala Lumpur Sentral50490 Kuala Lumpur.Tel: 03-2261 8888Fax: 03-2261 9889
Auditor: ernst & Young (AF: 0039)
Level 23A, Menara Milenium, Jalan Damanlela, Pusat Bandar Damansara, 50490 Kuala Lumpur.Tel: 03-7495 8000 Fax: 03-2095 5332
tax Adviser: ernst & Young tax Consultants Sdn Bhd (Company No. 179793-K)
Level 23A, Menara Milenium, Jalan Damanlela, Pusat Bandar Damansara, 50490 Kuala Lumpur.Tel: 03-7495 8000 Fax: 03-2095 5332
membership: federation Of investment managers malaysia (fimm)19-06-1, 6th Floor, Wisma Tune, 19, Lorong Dungun, Damansara Heights, 50490 Kuala Lumpur, Malaysia.Tel: 03-2093 2600 Fax: 03-2093 2700 Website: www.fimm.com.my

Kenanga Premier Fund Interim Report iii
direCtOrY Of mAnAGer’S OffiCeSRegional Branch Offices :
Kuala LumpurLevel 13, Kenanga Tower,237, Jalan Tun Razak,50400 Kuala Lumpur, Malaysia.Tel: 03-2172 3123 Fax: 03-2172 3133
Johor BahruLot 11.03, 11th Floor, Menara MSC CyberportNo. 5, Jalan Bukit Meldrum80300 Johor Bahru , JohorTel: 07-223 7505 / 4798 Fax: 07-223 4802
melakaNo. 25-1, Jalan Kota Laksamana 2/17Taman Kota Laksamana, Seksyen 275200 MelakaTel: 06-281 8913 / 06-282 0518Fax: 06-281 4286
Kuching1st Floor, No 71Lot 10900, Jalan Tun Jugah93350 Kuching, SarawakTel: 082-572 228 Fax: 082-572 229
KlangNo. 12, Jalan Batai Laut 3, Taman Intan41300 Klang, Selangor Darul EhsanTel: 03-3341 8818 / 03-3348 7889 Fax: 03-3341 8816
KuantanNo. B8, Ground Floor, Jalan Tun Ismail 125000 Kuantan Pahang.Tel : 09-514 3688Fax : 09-514 3838
Penang5.04, 5th Floor, Menara Boustead Penang No. 39, Jalan Sultan Ahmad Shah 10050 Penang. Tel : 04-210 6628Fax : 04-210 6644
ipohSuite 1, 2nd Floor,No. 63, Persiaran Greenhill,30450 Ipoh, Perak, MalaysiaTel: 05-254 7573 / 7570 / 7575Fax: 05-254 7606
miri 2nd Floor, Lot 1264, Centre Point Commercial Centre, Jalan Melayu, 98000 Miri, Sarawak Tel: 085-416 866 Fax: 085-322 340
Kota KinabaluA-03-11, 3rd FloorBlock A, Warisan SquareJalan Tun Fuad Stephens88000 Kota Kinabalu, SabahTel: 088-447 089 / 088-448 106 Fax: 088-447 039
Seremban 2nd Floor, No. 1D-2, Jalan Tuanku Munawir 70000 Seremban, Negeri Sembilan Tel: 06-761 5678 Fax: 06-761 2242
Petaling Jaya44B, Jalan SS21/35Damansara Utama47400 Petaling Jaya, SelangorTel: 03-7710 8828Fax: 03-7710 8830

1 Kenanga Premier Fund Interim Report
1. fund infOrmAtiOn
1.1 fund name
Kenanga Premier fund (KPf or the fund) 1.2 fund Category / type
Equity / Growth
1.3 investment Objective
The Fund aims to provide consistent annual returns and medium to long-term capital appreciation.
1.4 investment Strategy
The Fund seeks to maximise total returns by providing investors with a combination of capital appreciation and income distribution, if any, while reducing risk through diversified investments mainly in equities.
1.5 duration
The Fund was launched on 26 November 1996 and shall exist as long as it appears to the Manager and the Trustee that it is in the interests of the unitholders for it to continue.
1.6 Performance Benchmark
FTSE-Bursa Malaysia 100 Index
1.7 distribution Policy
The Fund intends to pay income by way of distributions or by the creation of additional units after the end of each Accrual Period (i.e. 12-month period ending on the last day of December of each year) or any specified period, where possible.
1.8 Breakdown of unit holdings of KPf as at 31 August 2017
Size of holdingsno. of
unitholdersno. of units
held5,000 and below 332 752,5045,001 - 10,000 311 2,306,13610,001-50,000 938 24,318,35950,001-500,000 556 71,318,037500,001 and above 55 124,944,033total 2,192 223,639,069

Kenanga Premier Fund Interim Report 2
2. mAnAGer’S rePOrt
2.1 explanation on whether the fund has achieved its investment objective.
The Fund has returned 0.4% in net asset value terms underperforming the FBM100 benchmark marginally. The underperformance was attributable to a more conservative and defensive asset allocation position held by the Fund.
2.2 Comparison between the fund’s performance and performance of the benchmark
Performance Chart Since Launch (26/11/1996 - 31/08/2017)Kenanga Premier fund vs ftSe-Bursa malaysia 100 index
Source: Novagni Analytics and Advisory Sdn Bhd
2.3 Investment strategies and policies employed during the financial period under review.
For the financial year under review, the Fund continued with its strategy of investing in companies with strong fundamentals and good growth prospect. The Fund has also increased its exposure to defensive high dividend yield stocks to reduce volatility.
2.4 the fund’s asset allocation as at 31 August 2017 and comparison with the previous financial period
Asset 31 Aug 2017 31 Aug 2016Listed investment securities 85.5% 72.3%Short term deposits and cash 14.5% 27.7%
reason for the differences in asset allocation
As of 31 August 2017, the Fund’s asset allocation, invested levels has increased from 72.3% to 85.5%
3 Kenanga Premier Fund Interim Report
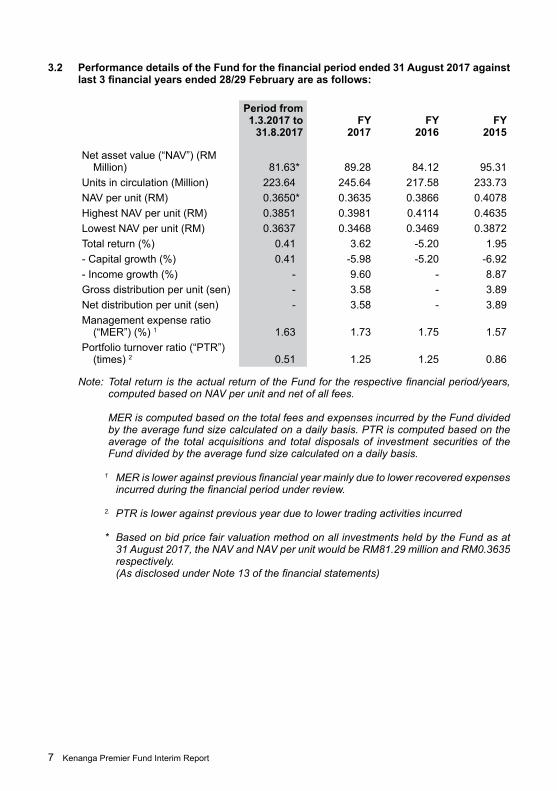
2.5 fund performance analysis based on nAV per unit (adjusted for income distribution; if any) since last review period
Period under review
Kenanga Premier fund 0.41%ftSe-Bursa malaysia 100 index 5.50%
Source: Lipper
For the financial period under review to 31 August 2017, the Fund returned 0.4% underperforming the positive 5.5% return in the FBM 100 index. The underperformance was attributable to a more conservative asset allocation position.
2.6 review of the market
market review
The FBMKLCI increased 5.50% for the period under review (1st March 2017 – 31st August 2017). US Fed kept its policy rate unchanged on 21 September for the sixth consecutive meeting. The market was pretty flattish in October, as investors remained on the side-lines ahead of the US Presidential election. There were no major surprises from the 2017 Malaysian budget unveiled by the government in October 2016. The government projects higher GDP growth of 4%-5% in 2017 vs 4%-4.5% in 2016. Stronger growth will be supported by resilient domestic demand and exports recovery attributed to higher commodities price. Meanwhile, 2017 fiscal deficit is expected to narrow to 3.0% from 3.1% in 2016.
Prime Minister Najib visited China in November 2016 and signed 14 MOUs worth RM144 billion. The key Chinese FDI from the visit was the RM55 billion East Coast Railway Link. The project will be on a fast-track basis where ground breaking is expected in 2017.
Markets were caught off-guard by Trump’s victory in the US Presidential election. Asian markets were the first to react with a sharp-sell down as investors flocked towards safe havens such as bonds, gold and Japanese Yen. The dollar surged against Asian currencies as interest rate hike expectations jumped and markets continue to focus on Trump’s pro-growth and inflationary economic policies. Ringgit fell to the low MYR4.4183 on 18 November. To prevent further weakening of the MYR, Bank Negara curtailed activity on the non-deliverable forward (NDF) market for currency-hedging traders. Bank Negara later also introduced new forex rule where exporters are required to convert 75% of export proceeds into Ringgit.
As expected, the Federal Reserve hiked rate by 25bps in the December 2016 FOMC meeting. Given the stronger underlying growth of the US economy, the Fed also raised interest rate expectations by guiding hikes in 2017 (vs previous expectation of 2 hikes).
January and February 2017 were active months for the equity markets. The KLCI Index rose 3.2% to 1722.47 points in the first two months of 2017. 2017 year also started with more exciting corporate news, led by PNB related companies including demerger of UMW Holdings from its oil & gas business and the proposed splitting of Sime Darby into 3 separate entities for its plantations, property and industrial divisions.

Kenanga Premier Fund Interim Report 4
2.6 review of the market (Contd.)
market review (Contd.)
The KLCI Index continue to surge in March courtesy to persistent foreign buying after being absent in the domestic market for more than 3 years. March 2017 also recorded the foreign inflow of RM4.4bil (Mar 16: RM6.1bil foreign net inflow) after three consecutive years (2014-2016) of foreigners’ net selling totalling about RM30bil. Malaysia recorded 4Q2016 GDP growth of 4.5% yoy, above estimate of 4.4%, bringing 2016 growth to 4.2%. This was the lowest growth in the past 3 years (2015: +5%; 2014: +6%) but is poised to pick up in 2017 with the recovery of oil price and CPO price.
There was no surprise monetary actions from the central banks in 1Q2017, both ECB and BOJ stay pat but Fed hiked 25bps as widely expected. The Bank Negara’s annual report released by end March provided GDP growth forecast of 4.3%-4.8% and CPI projection of 3%-4%, which were well within market expectations.
The KLCI charted another positive month in April but took a breather in May which is always a seasonally slow month. There were also rising geopolitical tension and surprised political happenings in April and May. The US launched a military strike on a Syrian government airbase in response to a chemical weapons attack killing civilians and later dropped the largest conventional bomb on an ISIS area in eastern Afghanistan. North Korea also unveiled its new missile technology where US President Donald Trump was hoping on China to rein in North Korea’s military aggression. In EU, UK Prime Minister Theresa May called for snap UK general election to strengthen her political grips before Brexit negotiation. Meanwhile, Emmanuel Macron defeated Marine Le Pen in the French presidential election which removed the risk of France leaving EU. In a widely expected move, OPEC and non-members agreed to extend production cuts by another nine months to March 2018.
On the local front, Bank Negara announced liberalisation of MGS market where investors and issuers can short sell from May onwards. The market and corporates was however shocked by a surprised announcement from TRX City voiding the sales of 60%-stake in Bandar Malaysia to IWH-CREC consortium done in 2015. Mid-small caps started a price correction as investors took profit following a strong rally since beginning of the year. Malaysia also reported 1Q2017 GDP of 5.6% yoy which was above the 4.8% forecast, which is the strongest growth rate since 1Q2015. In the March 2017 corporate result reporting, results were generally within expectations. 48% companies’ results were in line, 15% was above while 37% were below expectations. Result of big caps including banks, plantation and telcos were generally in line with expectations. Sectors with weaker earnings were automobile, gaming and logistics.
May and June 2017 were relatively flattish months for KLCI Index with marginal negative return in (-0.12% month-on-month in both months). As expected by the market, the Fed raised rate by another 25bps leaving guidance unchanged of another hike in 2017. The Fed also plans to start trimming its $4.5trillion balance sheet later in 2017. Another geopolitical event was the alleged Qatar support of IS terrorism which resulted in Saudi, Bahrain, UAE and Egypt cutting diplomatic ties with Qatar. In UK, Prime Minister Theresa May lost her parliament majority in the early election but managed to form a government with the support of other smaller parties. July was generally quiet for the local market. IMF upgraded Malaysia 2017 GDP forecast to 4.8% from its earlier projection of 4.5%.
Foreigners were net buyer of the equity market totalling RM10.3billion from January to August 2017. The Ringgit strengthened against US dollar for 4.8% for the first eighth months of 2017 to end at RM4.2710 as of end August 2017.

5 Kenanga Premier Fund Interim Report
2.6 review of the market (Contd.)
market Outlook
We have a positive outlook on the domestic equity market in 2017 after 3 years of underperformance from 2014 to 2016. The re-rating catalysts include:
a) Stronger 2017 GDP growth to be underpinned by better oil and CPO price, sustained infrastructure spending and rising China FDI;
b) Corporate earnings growth in 2017/18 expected at 7.6%/5.9% respectively after 3 years of earnings contraction;
c) GLC (Government Linked Companies) reforms for PNB related and other companies for better value creation.
d) Low foreign ownership after 3 years of foreign selling amounted to about RM30bil. e) Expectation of general election in 2017/18. Historically markets rallied a few months
before general election.
fund Strategy
We remain steadfast to our bottom up stock picking strategy favouring growth-oriented companies which should continue to outperform the general market. We continue to like consumer, construction and utility sectors. The award of various construction projects including Pan-Borneo, MRT2, LRT3, East Coast Railway Link will continue to drive construction spending.
2.7 distribution
For the financial period under review, the Fund did not declare any distribution.
2.8 details of any unit split exercise
The Fund did not carry out any unit split exercise during the financial period under review.
2.9 Significant changes in the state of affair of the Fund during the financial period
There were no significant changes in the state of affair of the Fund during the financial period and up until the date of the manager’s report, not otherwise disclosed in the financial statements.
2.10 Circumstances that materially affect any interests of the unitholders
During the financial period under review, there were no circumstances that materially affected any interests of the unitholders.
2.11 rebates & Soft commissions
Any rebates received are channeled back to the Fund. On the other hand, soft commissions received from the stockbrokers for goods and services such as technical analysis software, fundamental database, financial wire services, stock quotation system and portfolio management software incidental to investment management of the Fund shall be retained by the Manager. For the financial period under review, the Manager has received soft commissions from stockbrokers.
Kenanga Premier Fund Interim Report 6
3. fund PerfOrmAnCe
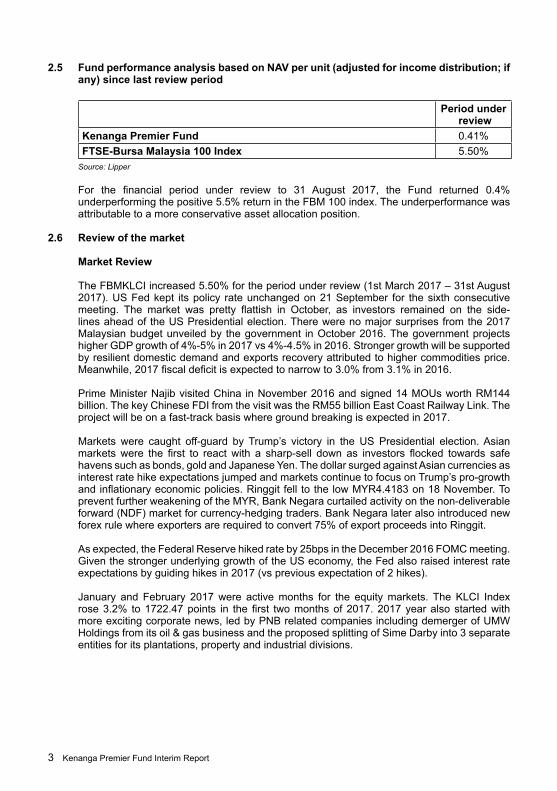
3.1 Details of portfolio composition of Kenanga Premier Fund (“the Fund”) for the financial period as at 31 August 2017 against last 3 financial years as at 28/29 February are as follows:
a. distribution among industry sectors and category of investments:
As at fY fY fY31.8.2017 2017 2016 2015
% % % %
Consumer products 22.3 15.0 15.0 5.9Trading/Services 17.9 8.8 11.4 10.7Finance 14.0 14.9 14.3 11.4Industrial products 8.1 11.8 9.6 9.6Constructions 7.5 6.3 4.5 9.2Plantations 6.4 10.0 7.9 6.0Properties 4.6 4.3 7.6 13.7Infrastructure 0.5 - 1.8 2.5Special Purpose
Acquisition Company 0.3 0.2 0.2 -
Technology - - 2.6 0.7Real Estate
Investments Trusts 3.8 5.0 5.0 5.5
Warrants 0.1 - 0.1 0.1Short term deposits
and cash 14.5 23.7 20.0 24.7
100.0 100.0 100.0 100.0
Note: The above mentioned percentages are based on total investment market value plus cash.
b. distribution among markets
The Fund invests in local listed investment securities and cash instruments only.
7 Kenanga Premier Fund Interim Report
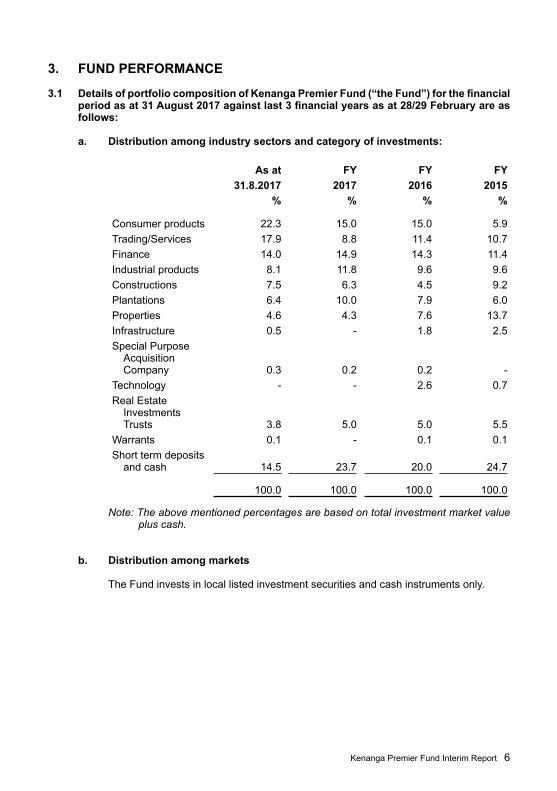
3.2 Performance details of the Fund for the financial period ended 31 August 2017 against last 3 financial years ended 28/29 February are as follows:
Period from 1.3.2017 to
31.8.2017fY
2017fY
2016fY
2015
Net asset value (“NAV”) (RM Million) 81.63* 89.28 84.12 95.31
Units in circulation (Million) 223.64 245.64 217.58 233.73NAV per unit (RM) 0.3650* 0.3635 0.3866 0.4078Highest NAV per unit (RM) 0.3851 0.3981 0.4114 0.4635Lowest NAV per unit (RM) 0.3637 0.3468 0.3469 0.3872Total return (%) 0.41 3.62 -5.20 1.95- Capital growth (%) 0.41 -5.98 -5.20 -6.92- Income growth (%) - 9.60 - 8.87Gross distribution per unit (sen) - 3.58 - 3.89Net distribution per unit (sen) - 3.58 - 3.89Management expense ratio
(“MER”) (%) 1 1.63 1.73 1.75 1.57Portfolio turnover ratio (“PTR”)
(times) 2 0.51 1.25 1.25 0.86
Note: TotalreturnistheactualreturnoftheFundfortherespectivefinancialperiod/years,computed based on NAV per unit and net of all fees.
MER is computed based on the total fees and expenses incurred by the Fund divided by the average fund size calculated on a daily basis. PTR is computed based on the average of the total acquisitions and total disposals of investment securities of the Fund divided by the average fund size calculated on a daily basis.
1 MERisloweragainstpreviousfinancialyearmainlyduetolowerrecoveredexpensesincurredduringthefinancialperiodunderreview.
2. PTR is lower against previous year due to lower trading activities incurred
* Based on bid price fair valuation method on all investments held by the Fund as at 31August2017,theNAVandNAVperunitwouldbeRM81.29millionandRM0.3635respectively.(AsdisclosedunderNote13ofthefinancialstatements)

Kenanga Premier Fund Interim Report 8
3.3 Average total return of the fund
1 Year 31 Aug 16 -31 Aug 17
3 Years31 Aug 14 -31 Aug 17
5 Years31 Aug 12 -31 Aug 17
Kenanga Premier fund 1.22% -0.34% 4.37%ftSe-Bursa malaysia 100 index 6.83% -0.50% 2.42%
Source: Lipper
3.4 Annual total return of the fund
Period under review28 feb 17 - 31 Aug 17
1 Year 29 feb 16 - 28 feb 17
1 Year 28 feb 15 - 28 feb 16
1 Year 28 feb 14 - 28 feb 15
Period 31 dec 12 - 28 feb 14
1 Year 31 dec 11 - 31 dec 12
Kenanga Premier fund 0.41% 3.62% -5.20% 1.95% 19.01% 5.92%ftSe-Bursa malaysia 100 index 5.50% 3.87% -8.39% -0.99% 9.32% 9.60%
Source: Lipper
investors are reminded that past performance is not necessarily indicative of future performance. Unit prices and investment returns may fluctuate.

9 Kenanga Premier Fund Interim Report
4. truStee’S rePOrt tO tHe unitHOLderS Of KenAnGA Premier fund
We, CIMB Commerce Trustee Berhad being the trustee of Kenanga Premier Fund (“the Fund”), are of the opinion that Kenanga Investors Berhad (“the Manager”), acting in the capacity as Manager of the Fund, has fulfilled its duties in the following manner for the financial period from 1 March 2017 to 31 August 2017.
a) The Fund has been managed in accordance with the limitations imposed on the
investment powers of the Manager under the Deed, the Securities Commission Malaysia’s Guidelines on Unit Trust Funds, the Capital Markets and Services Act 2007 (as amended from time to time) and other applicable laws;
b) Valuation and pricing for the Fund has been carried out in accordance with the Deed and relevant regulatory requirements; and
c) Creation and cancellation of units have been carried out in accordance with the Deed
and relevant regulatory requirements. For and on behalf of CIMB Commerce Trustee Berhad Lee Kooi Yoke Chief Operating Officer Kuala Lumpur, Malaysia
26 October 2017

Kenanga Premier Fund Interim Report 10
5. StAtement BY tHe mAnAGer I, Ismitz Matthew De Alwis, being a director of Kenanga Investors Berhad, do hereby state
that, in the opinion of the Manager, the accompanying statement of financial position as at 31 August 2017 and the related statement of comprehensive income, statement of changes in net asset value and statement of cash flows for the financial period from 1 March 2017 to 31 August 2017 together with notes thereto, are drawn up in accordance with Malaysian Financial Reporting Standards and International Financial Reporting Standards so as to give a true and fair view of the financial position of Kenanga Premier Fund as at 31 August 2017 and of its financial performance and cash flows for the financial period from 1 March 2017 to 31 August 2017 and comply with the requirements of the Deed.
For and on behalf of the Manager Kenanga Investors Berhad
Ismitz Matthew De AlwisExecutive Director/Chief Executive Officer
Kuala Lumpur, Malaysia
26 October 2017
11 Kenanga Premier Fund Interim Report
6. finAnCiAL StAtementS
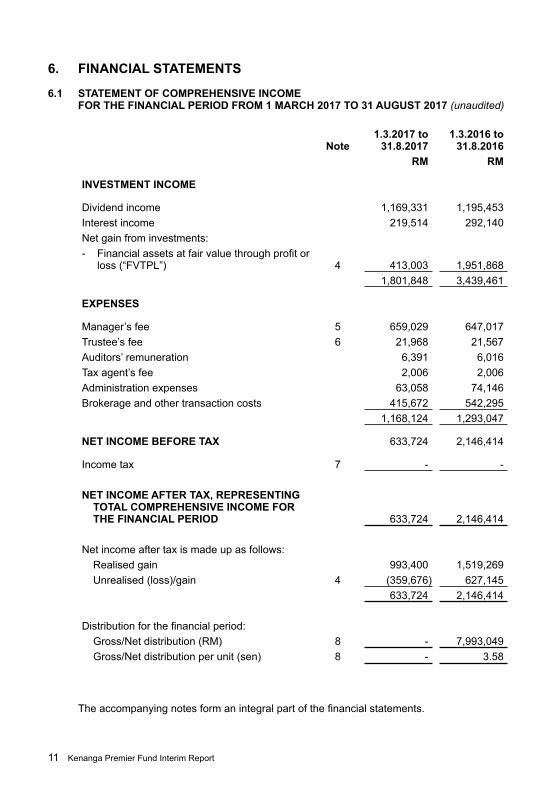
6.1 StAtement Of COmPreHenSiVe inCOme fOr tHe finAnCiAL PeriOd frOm 1 mArCH 2017 tO 31 AuGuSt 2017 (unaudited)
note1.3.2017 to
31.8.20171.3.2016 to 31.8.2016
rm rm
inVeStment inCOme
Dividend income 1,169,331 1,195,453 Interest income 219,514 292,140 Net gain from investments:- Financial assets at fair value through profit or
loss (“FVTPL”) 4 413,003 1,951,868 1,801,848 3,439,461
eXPenSeS
Manager’s fee 5 659,029 647,017 Trustee’s fee 6 21,968 21,567 Auditors’ remuneration 6,391 6,016 Tax agent’s fee 2,006 2,006 Administration expenses 63,058 74,146 Brokerage and other transaction costs 415,672 542,295
1,168,124 1,293,047
net inCOme BefOre tAX 633,724 2,146,414
Income tax 7 - -
net inCOme After tAX, rePreSentinG tOtAL COmPreHenSiVe inCOme fOr tHe finAnCiAL PeriOd 633,724 2,146,414
Net income after tax is made up as follows:Realised gain 993,400 1,519,269 Unrealised (loss)/gain 4 (359,676) 627,145
633,724 2,146,414
Distribution for the financial period:Gross/Net distribution (RM) 8 - 7,993,049 Gross/Net distribution per unit (sen) 8 - 3.58
The accompanying notes form an integral part of the financial statements.

Kenanga Premier Fund Interim Report 12
6.2 SAtement Of finAnCiAL POSitiOn AS At 31 AuGuSt 2017 (unaudited)
note 31.8.2017 31.8.2016rm rm
ASSetS
inVeStmentS
Financial assets at FVTPL 4 69,840,772 65,526,310 Short term deposits 9 11,779,000 24,987,000
81,619,772 90,513,310
OtHer ASSetS
Other receivables 10 89,352 815,096 Cash at bank 50,942 62,195
140,294 877,291
tOtAL ASSetS 81,760,066 91,390,601
LiABiLitieS
Amount due to Manager 163,434 122,881 Amount due to Trustee 3,371 3,603 Other payables 11 299,800 3,127,057 tOtAL LiABiLitieS 466,605 3,253,541
eQuitY
Unit holders’ contribution 65,862,763 74,061,230 Retained earnings 15,430,698 14,075,830
net ASSet VALue (“nAV”) AttriButABLe tO unit HOLderS 12 81,293,461 88,137,060
tOtAL LiABiLitieS And eQuitY 81,760,066 91,390,601
numBer Of unitS in CirCuLAtiOn 12(a) 223,639,069 245,519,927
net ASSet VALue Per unit (rm) 13 0.3635 0.3590
The accompanying notes form an integral part of the financial statements.

13 Kenanga Premier Fund Interim Report
6.3 StAtement Of CHAnGeS in net ASSet VALue fOr tHe finAnCiAL PeriOd frOm 1 mArCH 2017 tO 31 AuGuSt 2017 (unaudited)
noteunit holders’ contribution
retained earnings total nAV
rm rm rm
1.3.2017 to 31.8.2017At beginning of the financial
period 74,126,178 14,796,974 88,923,152Total comprehensive income - 633,724 633,724Creation of units 12(a) 947,288 - 947,288Cancellation of units 12(a) (9,033,247) - (9,033,247)Distribution equalisation 12(a) (177,456) - (177,456)At end of the financial period 65,862,763 15,430,698 81,293,461
1.3.2016 to 31.8.2016At beginning of the financial
period 44,586,273 39,227,837 83,814,110Total comprehensive income - 2,146,414 2,146,414Creation of units 12(a) 8,123,569 - 8,123,569Cancellation of units 12(a) (3,690,128) - (3,690,128)Distribution equalisation 12(a) (1,835) - (1,835)Distribution 8 19,305,372 (27,298,421) (7,993,049)Reinvestment of income
distributed 12(a) 5,737,979 - 5,737,979At end of the financial period 74,061,230 14,075,830 88,137,060
The accompanying notes form an integral part of the financial statements.

Kenanga Premier Fund Interim Report 14
6.4 StAtement Of CASH fLOWS fOr tHe finAnCiAL PeriOd frOm 1 mArCH 2017 tO 31 AuGuSt 2017(unaudited)
1.3.2017 to 31.8.2017
1.3.2016 to 31.8.2016
rm rm
CASH fLOWS frOm OPerAtinG And inVeStinG ACtiVitieS
Proceeds from sale of financial assets at FVTPL 43,912,980 75,200,629 Dividends received 1,235,779 1,161,894 Interest from deposits received 226,241 289,855 Tax agent’s fee paid - (2,000)Auditors’ remuneration paid (13,000) (12,000)Trustee’s fee paid (22,034) (21,284)Payment for other fees and expenses (58,576) (52,803)Manager’s fee paid (660,994) (638,530)Purchase of financial assets at FVTPL (45,675,048) (69,446,160)Net cash (used in)/generated from operating and
investing activities (1,054,652) 6,479,601
CASH fLOWS frOm finAnCinG ACtiVitieS
Cash received from units created 1,005,829 8,123,284 Cash paid on units cancelled (9,167,689) (3,681,517)Distribution paid - (2,255,070)Net cash (used in)/generated from financing activities (8,161,860) 2,186,697
net (deCreASe)/inCreASe in CASH And CASH eQuiVALentS (9,216,512) 8,666,298
CASH And CASH eQuiVALentS At BeGinninG Of tHe finAnCiAL PeriOd 21,046,454 16,382,897
CASH And CASH eQuiVALentS At end Of tHe finAnCiAL PeriOd 11,829,942 25,049,195
Cash and cash equivalents comprise:Cash at bank 50,942 62,195 Short term deposits 11,779,000 24,987,000
11,829,942 25,049,195
The accompanying notes form an integral part of the financial statements.

15 Kenanga Premier Fund Interim Report
6.5 nOteS tO tHe finAnCiAL StAtementS fOr tHe finAnCiAL PeriOd frOm 1 mArCH 2017 tO 31 AuGuSt 2017(unaudited)
1. tHe fund, tHe mAnAGer And tHeir PrinCiPAL ACtiVitieS
Kenanga Premier Fund (“the Fund”) was constituted pursuant to the executed Deed dated 21 November 1996 (collectively, together with deeds supplemental thereto, referred to as “the Deed”) between the Manager, Kenanga Investors Berhad, and Universal Trustee (Malaysia) Berhad (“the Trustee” prior to 15 April 2005). Pursuant to the executed Fourth Supplemental Deed dated 15 April 2005, the Fund changed its trustee to HSBC (Malaysia) Trustee Berhad (“the Trustee” for the period from 15 April 2005 to 2 December 2013). The Fund has subsequently changed its trustee to CIMB Commerce Trustee Berhad (“the Trustee” with effect from 3 December 2013). The aforesaid change was effected on 3 December 2013 via a Fourth Master Supplemental Deed dated 19 November 2013. The Fund commenced operations on 26 November 1996 and will continue to be in operation until terminated in accordance to Part 12 of the Deed.
Kenanga Investors Berhad is a wholly-owned subsidiary of Kenanga Investment Bank Berhad. Prior to 1 November 2016, Kenanga Investment Bank Berhad was a wholly-owned subsidiary of K & N Kenanga Holdings Berhad that was listed on the Main Market of Bursa Malaysia Securities Berhad. Pursuant to an internal reorganisation exercise completed on 1 November 2016, Kenanga Investment Bank Berhad has become the holding company of K & N Kenanga Holdings Berhad. On 2 November 2016, Kenanga Investment Bank Berhad has assumed the listing status of K & N Kenanga Holdings Berhad. All of these companies are incorporated in Malaysia.
The principal place of business of the Manager is Level 14, Kenanga Tower, 237, Jalan Tun Razak, 50400 Kuala Lumpur.
The Fund seeks to provide consistent annual returns and medium to long term capital appreciation.
2. finAnCiAL riSK mAnAGement OBJeCtiVeS And POLiCieS
The Fund is exposed to a variety of risks including market risk (which includes interest rate risk and price risk), credit risk and liquidity risk. Whilst these are the most important types of financial risks inherent in each type of financial instruments, the Manager and the Trustee would like to highlight that this list does not purport to constitute an exhaustive list of all the risks inherent in an investment in the Fund.
The Fund has an approved set of investment guidelines and policies as well as internal
controls which sets out its overall business strategies to manage these risks to optimise returns and preserve capital for the unit holders, consistent with the long term objectives of the Fund.

Kenanga Premier Fund Interim Report 16
2. finAnCiAL riSK mAnAGement OBJeCtiVeS And POLiCieS (COntd.)
a. market risk
Market risk is the risk that the fair value or future cash flows of a financial instrument will fluctuate because of changes in market prices. Market risk includes interest rate risk and price risk.
Market risk arises when the value of the investments fluctuates in response to the activities of individual companies, general market or economic conditions. It stems from the fact that there are economy-wide perils, which threaten all businesses. Hence, investors are exposed to market uncertainties. Fluctuation in the investments’ prices caused by uncertainties in the economic, political and social environment will affect the NAV of the Fund.
The Manager manages the risk of unfavourable changes in prices by cautious review of the investments and continuous monitoring of their performance and risk profiles.
i. interest rate risk
Interest rate risk refers to how the changes in the interest rate environment would affect the performance of Fund’s investments. Rate offered by the financial institutions will fluctuate according to the Overnight Policy Rate determined by Bank Negara Malaysia and this has direct correlation with the Fund’s investments in deposits.
The Fund is not exposed to significant interest rate risk as its deposits are short term in nature and have fixed interest rates.
interest rate risk exposure
The following table analyses the Fund’s interest rate risk exposure. The Fund’s financial assets and financial liabilities are disclosed at fair value and categorised by the earlier of contractual re-pricing or maturity dates.
up to 1 year
rm
non-exposure
to interest rate
movementrm
totalrm
Weighted average effective interest
rate*%
31.8.2017AssetsFinancial assets at
FVTPL - 69,840,772 69,840,772Short term deposits 11,779,000 - 11,779,000 3.0Other assets - 140,294 140,294
11,779,000 69,981,066 81,760,066
17 Kenanga Premier Fund Interim Report
2. finAnCiAL riSK mAnAGement OBJeCtiVeS And POLiCieS (COntd.)
a. market risk (Contd.)
i. interest rate risk (Contd.)
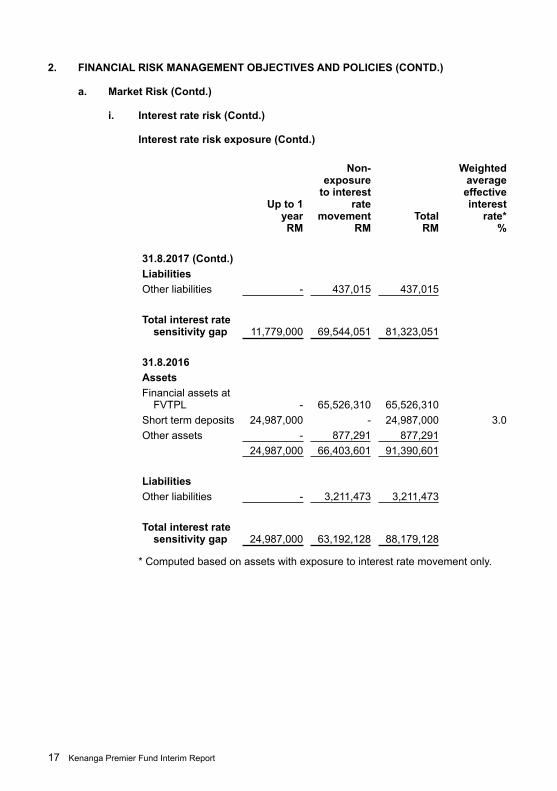
interest rate risk exposure (Contd.)
up to 1 year
rm
non-exposure
to interest rate
movementrm
totalrm
Weighted average effective interest
rate*%
31.8.2017 (Contd.)LiabilitiesOther liabilities - 437,015 437,015
total interest rate sensitivity gap 11,779,000 69,544,051 81,323,051
31.8.2016AssetsFinancial assets at
FVTPL - 65,526,310 65,526,310Short term deposits 24,987,000 - 24,987,000 3.0Other assets - 877,291 877,291
24,987,000 66,403,601 91,390,601
LiabilitiesOther liabilities - 3,211,473 3,211,473
total interest rate sensitivity gap 24,987,000 63,192,128 88,179,128
* Computed based on assets with exposure to interest rate movement only.

Kenanga Premier Fund Interim Report 18
2. finAnCiAL riSK mAnAGement OBJeCtiVeS And POLiCieS (COntd.)
a. market risk (Contd.)
ii. Price risk
Price risk is the risk of unfavorable changes in the fair values of listed equity securities, listed collective investment schemes and listed warrants. The Fund invests in listed equity securities, listed collective investment schemes and listed warrants which are exposed to price fluctuations. This may then affect the NAV per unit of the Fund.
Price risk sensitivity
The Manager’s best estimate of the effect on the profit for the financial period due to a reasonably possible change in investments in listed equity securities, listed collective investment schemes and listed warrants with all other variables held constant is indicated in the table below:
Changes in priceincrease/
(decrease)Basis points
Effects on profit for the financial
periodincrease/
(decrease)rm
31.8.2017Financial assets at FVTPL 5/(5) 34,920/(34,920)
31.8.2016Financial assets at FVTPL 5/(5) 32,763/(32,763)
In practice, the actual trading results may differ from the sensitivity analysis above and the difference could be material.
Price risk concentration
The following table sets out the Fund’s exposure and concentration to price risk based on its portfolio of financial instruments as at the reporting date.
fair value Percentage of nAV31.8.2017 31.8.2016 31.8.2017 31.8.2016
rm rm % %
Financial assets at FVTPL 69,840,772 65,526,310 85.9 74.3

19 Kenanga Premier Fund Interim Report
2. finAnCiAL riSK mAnAGement OBJeCtiVeS And POLiCieS (COntd.)
a. market risk (Contd.)
ii. Price risk (Contd.)
Price risk concentration (Contd.)
The Fund’s concentration of price risk from the Fund’s listed equity securities, listed collective investment schemes and listed warrants analysed by sector is as follows:
fair value Percentage of nAV31.8.2017 31.8.2016 31.8.2017 31.8.2016
rm rm % %
Consumer products 18,183,863 11,451,516 22.4 13.0 Trading/Services 14,591,350 11,262,146 18.0 12.7 Finance 11,470,263 13,507,805 14.1 15.4 Industrial products 6,612,617 8,260,915 8.1 9.4 Constructions 6,147,240 4,579,521 7.6 5.1 Plantations 5,261,423 9,573,454 6.5 10.9 Properties 3,774,420 3,815,434 4.6 4.3 Infrastructure 433,016 - 0.5 - Special Purpose
Acquisition Company 199,980 179,982 0.2 0.2
Technology - 775,148 - 0.9 Real Estate
Investments Trusts 3,125,571 2,084,646 3.8 2.4
Warrants 41,029 35,743 0.1 - 69,840,772 65,526,310 85.9 74.3
b. Credit risk
Credit risk is the risk that the counterparty to a financial instrument will cause a financial loss to the Fund by failing to discharge an obligation. The Manager manages the credit risk by undertaking credit evaluation to minimise such risk.
i. Credit risk exposure
As at the reporting date, the Fund’s maximum exposure to credit risk is represented by the carrying amount of each class of financial asset recognised in the statement of financial position.
ii. financial assets that are either past due or impaired
As at the reporting date, there are no financial assets that are either past due or impaired.

Kenanga Premier Fund Interim Report 20
2. finAnCiAL riSK mAnAGement OBJeCtiVeS And POLiCieS (COntd.)
b. Credit risk (Contd.)
iii. Credit quality of financial assets
The Fund invests in deposits with financial institutions licensed under the Financial Services Act 2013 and Islamic Financial Services Act 2013. The following table analyses the licensed financial institutions by rating category:
Short term deposits
Percentage of total short term deposits Percentage of nAV
31.8.2017 31.8.2016 31.8.2017 31.8.2016% % % %
ratingP1 100.0 100.0 14.5 28.4
c. Liquidity risk
Liquidity risk is defined as the risk that the Fund will encounter difficulty in meeting obligations associated with financial liabilities that are to be settled by delivering cash or another financial asset. Exposure to liquidity risk arises because of the possibility that the Fund could be required to pay its liabilities or cancel its units earlier than expected. The Fund is exposed to cancellation of its units on a regular basis. Units sold to unit holders by the Manager are cancellable at the unit holders’ option based on the Fund’s NAV per unit at the time of cancellation calculated in accordance with the Deed.
The liquid assets comprise cash, short term deposits with licensed financial institutions and other instruments, which are capable of being converted into cash within 7 days.
The following table analyses the maturity profile of the Fund’s financial assets and financial liabilities in order to provide a complete view of the Fund’s contractual commitments and liquidity.
up to 1 yearnote 31.8.2017 31.8.2016
rm rm
AssetsFinancial assets at FVTPL 69,840,772 65,526,310 Short term deposits 11,779,000 24,987,000 Other assets 140,294 877,291
i. 81,760,066 91,390,601
LiabilitiesOther liabilities ii. 437,015 3,211,473
Equity iii. 81,293,461 88,137,060
Liquidity gap 29,590 42,068

21 Kenanga Premier Fund Interim Report
2. finAnCiAL riSK mAnAGement OBJeCtiVeS And POLiCieS (COntd.)
c. Liquidity risk (Contd.)
i. financial assets
Analysis of financial assets at FVTPL into maturity groupings is based on the expected date on which these assets will be realised. The Fund’s investments in listed equity securities, listed collective investment schemes and listed warrants have been included in the “up to 1 year” category on the assumption that these are highly liquid investments which can be realised should all of the Fund’s unit holders’ equity be required to be redeemed. For other assets, the analysis into maturity groupings is based on the remaining period from the end of the reporting period to the contractual maturity date or if earlier, the expected date on which the assets will be realised.
ii. financial liabilities
The maturity grouping is based on the remaining period from the end of the reporting period to the contractual maturity date or if earlier, the date on which liabilities will be settled. When the counterparty has a choice of when the amount is paid, the liability is allocated to the earliest period in which the Fund can be required to pay.
iii. equity
As the unit holders can request for redemption of their units, they have been categorised as having a maturity of “up to 1 year”.
3. SummArY Of SiGnifiCAnt ACCOuntinG POLiCieS
a. Basis of Accounting
The financial statements of the Fund have been prepared in accordance with Malaysian Financial Reporting Standards (“MFRS”) as issued by the Malaysian Accounting Standards Board (“MASB”) and International Financial Reporting Standards (“IFRS”) as issued by the International Accounting Standards Board (“IASB”).
The accounting policies adopted are consistent with those of the previous financial period except for the adoption of the new and amended MFRS which became effective for the Fund on 1 March 2017. The adoption of the new and amended MFRS did not have any significant impact on the financial position or performance of the Fund.
The financial statements have been prepared on the historical cost basis except as disclosed in the accounting policies below.

Kenanga Premier Fund Interim Report 22
3. SummArY Of SiGnifiCAnt ACCOuntinG POLiCieS (COntd.)
b. Standards, Amendments and interpretation issued But not Yet effective
As at the reporting date, the following Standards, Amendments and Interpretation Committee’s (“IC”) Interpretation that have been issued by MASB will be effective for the Fund in future periods. The Fund intends to adopt the relevant standards when they become effective.
description
effective for financial period beginning on or
after
Amendments to MFRS contained in the documents entitled “Annual improvements to MFRS Standards 2014 - 2016 Cycle” 1 January 2017
Amendments to MFRS 107: Disclosure Initiative 1 January 2017Amendments to MFRS 112: Recognition of Deferred Tax
Assets for Unrealised Losses 1 January 2017Amendments to MFRS contained in the documents entitled
“Annual improvements to MFRS Standards 2014 - 2016 Cycle” 1 January 2018
Amendments to MFRS 2: Classification and Measurement of Shared-based Payment Transactions 1 January 2018
Amendments to MFRS 4: Applying MFRS 9 Financial Instruments with MFRS 4 Insurance Contracts 1 January 2018
Amendments to MFRS 140: Transfers of Investment Property 1 January 2018
MFRS 9: Financial Instruments 1 January 2018MFRS 15: Revenue from Contracts with Customers 1 January 2018MFRS 15: Clarifications to MFRS 15 1 January 2018IC Interpretation 22: Foreign Currency Transactions and
Advance Consideration 1 January 2018MFRS 16: Leases 1 January 2019MFRS 17: Insurance Contracts 1 January 2021Amendments to MFRS 10 and MFRS 128: Sale or Contribution of Assets between an Investor and its Associate or Joint Venture
To be announced by MASB
The Fund will adopt the above pronouncements when they become effective in the respective financial periods. These pronouncements are not expected to have any significant impact to the financial statements of the Fund upon their initial application, other than MFRS 9.
MFRS 9 replaces MFRS 139 on the following requirements: classification and measurement of financial assets and financial liabilities as defined in MFRS 139, impairment methodology and hedge accounting. The Fund is in the process of making an assessment of the impact of this Standard.

23 Kenanga Premier Fund Interim Report
3. SummArY Of SiGnifiCAnt ACCOuntinG POLiCieS (COntd.)
c. financial Assets
Financial assets are recognised in the statement of financial position when, and only when, the Fund becomes a party to the contractual provisions of the financial instruments.
When financial assets are recognised initially, they are measured at fair value, plus, in the case of financial assets not at FVTPL, directly attributable transaction costs.
The Fund determines the classification of its financial assets at initial recognition.
i. financial assets at fVtPL
Financial assets are classified as financial assets at FVTPL if they are held for trading or are designated as such upon initial recognition.
Financial assets held for trading include listed equity securities, listed collective investment schemes and listed warrants acquired principally for the purpose of selling in the near term.
Subsequent to initial recognition, financial assets at FVTPL are measured at fair value. Changes in the fair value of those financial instruments are recorded in profit or loss.
Interest earned and dividend revenue elements of such instruments are recorded separately in “interest income” and “dividend income”, respectively.
ii. receivables
Financial assets with fixed or determinable payments that are not quoted in an active market are classified as receivables.
Subsequent to initial recognition, receivables are measured at amortised cost using the effective interest method. Gain or loss is recognised in profit or loss when the receivable is derecognised or impaired, and through the amortisation process.
A financial asset is derecognised when the contractual right to receive cash flows from the asset has expired. On derecognition of a financial asset, the difference between the carrying amount and the sum of the consideration received is recognised in profit or loss.

Kenanga Premier Fund Interim Report 24
3. SummArY Of SiGnifiCAnt ACCOuntinG POLiCieS (COntd.)
d. impairment of financial Assets
The Fund assesses at each reporting date whether there is any objective evidence that a financial asset is impaired.
To determine whether there is objective evidence that an impairment loss on financial assets has been incurred, the Fund considers factors such as the probability of insolvency or significant financial difficulties of the debtor and default or significant delay in payments.
If any such evidence exists, the amount of impairment loss is measured as the difference between the asset’s carrying amount and the present value of estimated future cash flows discounted at the financial asset’s original effective interest rate. The impairment loss is recognised in profit or loss.
The carrying amount of the financial asset is reduced by the impairment loss directly for all financial assets, with the exception of receivables, where the carrying amount is reduced through the use of an allowance account. When a receivable becomes uncollectible, it is written off against the allowance account.
If, in a subsequent period, the amount of the impairment loss decreases and the decrease can be related objectively to an event occurring after the impairment was recognised, the previously recognised impairment loss is reversed to the extent that the carrying amount of the assets does not exceed its amortised cost at the reversal date. The amount of reversal is recognised in profit or loss.
e. income
Income is recognised to the extent that it is probable that the economic benefits will flow to the Fund and the income can be reliably measured. Income is measured at the fair value of consideration received or receivable.
Interest income is recognised using the effective interest method.
Dividend income is recognised on declared basis, when the right to receive the dividend is established.
The realised gain or loss on sale of investments is measured as the difference between the net disposal proceeds and the carrying amount of the investment.
f. Cash and Cash equivalents
For the purposes of the statement of cash flows, cash and cash equivalents include cash at bank and short term deposits with licensed financial institutions with insignificant risk of changes in value.
g. income tax
Income tax on the profit or loss for the financial period comprises current tax. Current tax is the expected amount of income taxes payable in respect of the taxable profit for the financial period.
As no temporary differences have been identified, no deferred tax has been recognised.

25 Kenanga Premier Fund Interim Report
3. SummArY Of SiGnifiCAnt ACCOuntinG POLiCieS (COntd.)
h. unrealised reserves
Unrealised reserves represent the net gain or loss arising from carrying investments at their fair values at reporting date. This reserve is not distributable.
i. financial Liabilities
Financial liabilities are classified according to the substance of the contractual arrangements entered into and the definitions of a financial liability.
Financial liabilities are recognised in the statement of financial position when, and only when, the Fund becomes a party to the contractual provisions of the financial instrument. The Fund’s financial liabilities are classified as other financial liabilities. The Fund’s financial liabilities are recognised initially at fair value and subsequently measured at amortised cost using the effective interest method.
A financial liability is derecognised when the obligation under the liability is extinguished. Gains and losses are recognised in profit or loss when the liabilities are derecognised, and through the amortisation process.
j. unit holders’ Contribution – nAV Attributable to unit holders
The unit holders’ contribution to the Fund is classified as equity instruments.
Distribution equalisation represents the average amount of undistributed net income included in the creation or cancellation price of units. This amount is either refunded to unit holders by way of distribution and/or adjusted accordingly when units are released back to the Trustee.
k. functional and Presentation Currency
The financial statements of the Fund are measured using the currency of the primary economic environment in which the Fund operates (“the functional currency”). The financial statements are presented in Ringgit Malaysia (“RM”), which is also the Fund’s functional currency.
l. distribution
Distributions are at the discretion of the Manager. A distribution to the Fund’s unit holders is accounted for as a deduction from retained earnings.
m. Significant Accounting Judgments and Estimates
The preparation of financial statements requires the use of certain accounting estimates and exercise of judgment. Estimates and judgments are continually evaluated and are based on past experience, reasonable expectations of future events and other factors.
i. Critical judgments made in applying accounting policies
There are no major judgments made by the Manager in applying the Fund’s accounting policies.
ii. Key sources of estimation uncertainty
There are no key assumptions concerning the future and other key sources of estimation uncertainty at the reporting date, that have a significant risk of causing a material adjustment to the carrying amounts of assets and liabilities within the next financial period.

Kenanga Premier Fund Interim Report 26
4. finAnCiAL ASSetS At fVtPL
31.8.2017 31.8.2016 rm rmFinancial assets held for trading, at FVTPL:
Listed equity securities 66,674,172 63,405,921 Listed collective investment schemes 3,125,571 2,084,646 Listed warrants 41,029 35,743
69,840,772 65,526,310
1.3.2017 to 31.8.2017
1.3.2016 to 31.8.2016
rm rmNet gain on financial assets at FVTPL comprised:
Realised gain on disposals 772,679 1,324,723 Unrealised changes in fair values (359,676) 627,145
413,003 1,951,868
Details of financial assets at FVTPL as at 31 August 2017:
Quantity Aggregate
cost fair valuePercentage
of nAVrm rm %
Listed equity securities
Consumer productsA & M Realty Berhad 421,500 729,195 585,885 0.7Apex Healthcare Berhad 159,300 778,977 750,303 0.9Carlsberg Brewery
Malaysia Berhad 178,100 2,470,273 2,639,442 3.2CCK Consolidated
Holdings Berhad 902,900 888,300 880,327 1.1Dutch Lady Milk
Industries Berhad 37,200 1,730,181 2,176,944 2.7Fraser &Neave Holdings
Bhd 85,100 2,092,437 2,059,420 2.5Homeritz Corporation
Berhad 1,423,500 1,448,572 1,330,973 1.6Johore Tin Berhad 47,300 73,315 66,220 0.1Lii Hen Industries Bhd. 263,500 847,019 882,725 1.1Nestlé (M) Berhad 39,300 2,668,920 3,301,200 4.1NTPM Holdings Berhad 499,500 446,902 389,610 0.5O&C Resources Berhad 1,018,000 606,819 570,080 0.7Panasonic Manufacturing
Malaysia Berhad 24,700 617,552 955,396 1.2

27 Kenanga Premier Fund Interim Report
4. finAnCiAL ASSetS At fVtPL (COntd.)
Details of financial assets at FVTPL as at 31 August 2017: (Contd.)
Quantity Aggregate
cost fair valuePercentage
of nAVrm rm %
Listed equity securities (Contd.)
Consumer products (Contd.)
Power Root Berhad 581,900 1,466,790 1,128,886 1.4Tek Seng Holdings
Berhad 863,800 965,467 466,452 0.617,830,719 18,183,863 22.4
trading/ServicesAirAsia X Berhad 4,434,400 2,239,767 1,618,556 2.0 Amway (M) Holdings
Berhad 110,600 1,215,039 805,168 1.0 AWC Berhad 100,200 114,168 109,218 0.2 Century Logistics
Holdings Berhad 363,000 381,917 377,520 0.5 Cypark Resources
Berhad 842,500 1,768,556 2,055,700 2.5 EITA Resources Berhad 105,100 195,223 174,466 0.2 Petra Energy Bhd 822,900 977,200 802,328 1.0 Sapura Energy Berhad
(formerly know as SapuraKencana Petroleum Berhad) 1,358,800 2,226,046 1,875,144 2.3
Tenaga Nasional Berhad 246,900 3,465,972 3,520,794 4.3 TIME dotCom Berhad 233,000 2,050,541 2,180,880 2.7 Yinson Holdings Berhad 295,200 893,144 1,071,576 1.3
15,527,573 14,591,350 18.0
financeAMMB Holdings Berhad 165,300 864,984 705,831 0.9 BIMB Holdings Berhad 598,200 2,359,823 2,632,080 3.2 Bursa Malaysia Berhad 166,900 1,644,996 1,695,704 2.1 LPI Capital Berhad 160,750 1,713,600 2,867,780 3.5 Malayan Banking Berhad 338,300 3,166,327 3,200,318 3.9

Kenanga Premier Fund Interim Report 28
4. finAnCiAL ASSetS At fVtPL (COntd.)
Details of financial assets at FVTPL as at 31 August 2017: (Contd.)
Quantity Aggregate
cost fair valuePercentage
of nAVrm rm %
Listed equity securities (Contd.)
finance (Contd.)RHB Capital Berhad 144,480 - - - Tune Protect Group
Berhad 351,000 494,794 368,550 0.5 10,244,524 11,470,263 14.1
industrial productsJaya Tiasa Holdings
Berhad 1,088,600 1,646,172 1,132,144 1.4 PETRONAS Gas Berhad 87,100 1,800,043 1,600,898 2.0 SCGM Berhad 229,466 550,720 679,219 0.8 Scientex Berhad 50,000 390,000 430,500 0.5 SKP Resources Bhd 1,272,400 1,646,357 1,883,152 2.3 Supermax Corporation
Berhad 152,100 365,298 269,217 0.3 Uchi Technologies
Berhad 276,900 527,067 617,487 0.8 6,925,657 6,612,617 8.1
ConstructionsHock Seng Lee Berhad 929,000 1,648,198 1,356,340 1.7 Malaysian Resources
Corporation Berhad 1,233,600 1,610,294 1,467,984 1.8 ML Global Berhad 657,900 517,152 828,954 1.0 Muhibbah Engineering
(M) Berhad 665,100 1,636,890 1,888,884 2.3 TRC Synergy Berhad 737,900 593,878 605,078 0.8
6,006,412 6,147,240 7.6

29 Kenanga Premier Fund Interim Report
4. finAnCiAL ASSetS At fVtPL (COntd.)
Details of financial assets at FVTPL as at 31 August 2017: (Contd.)
QuantityAggregate
cost fair valuePercentage
of nAVrm rm %
Listed equity securities (Contd.)
PlantationsSarawak Oil Palms
Berhad 442,428 1,580,185 1,636,984 2.0TSH Resources Berhad 863,050 1,618,695 1,475,815 1.8United Plantations Berhad 77,400 2,016,525 2,148,624 2.7
5,215,405 5,261,423 6.5
PropertiesMCT Berhad 341,400 436,992 300,432 0.4S P Setia Berhad -
ordinary shares 575,114 2,024,241 1,932,383 2.4S P Setia Berhad -
preference shares 102,080 102,080 108,205 0.1Tambun Indah Land
Berhad 161,700 274,702 195,657 0.2Titijaya Land Berhad -
ordinary shares 830,700 1,422,374 1,237,743 1.5Titijaya Land Berhad -
preference shares 1,246,050 - - -4,260,389 3,774,420 4.6
infrastructureMalakoff Corporation
Berhad 383,200 471,810 433,016 0.5
Special Purpose Acquisition Company
Red Sena Berhad 444,400 222,200 199,980 0.2
total listed equity securities 66,704,689 66,674,172 82.0
Kenanga Premier Fund Interim Report 30
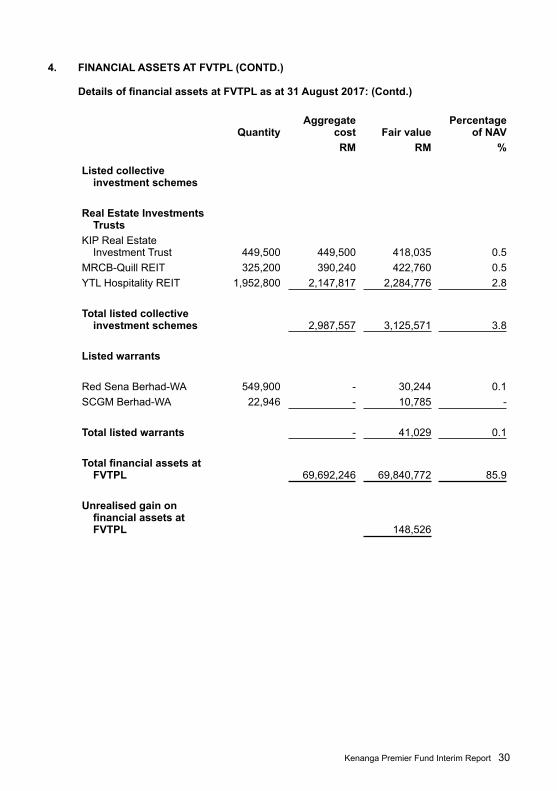
4. finAnCiAL ASSetS At fVtPL (COntd.)
Details of financial assets at FVTPL as at 31 August 2017: (Contd.)
Quantity Aggregate
cost fair valuePercentage
of nAVrm rm %
Listed collective investment schemes
real estate investments trusts
KIP Real Estate Investment Trust 449,500 449,500 418,035 0.5
MRCB-Quill REIT 325,200 390,240 422,760 0.5 YTL Hospitality REIT 1,952,800 2,147,817 2,284,776 2.8
total listed collective investment schemes 2,987,557 3,125,571 3.8
Listed warrants
Red Sena Berhad-WA 549,900 - 30,244 0.1 SCGM Berhad-WA 22,946 - 10,785 -
total listed warrants - 41,029 0.1
Total financial assets at fVtPL 69,692,246 69,840,772 85.9
unrealised gain on financial assets at fVtPL 148,526

31 Kenanga Premier Fund Interim Report
5. mAnAGer’S fee
The Manager’s fee is calculated on a daily basis at a rate not exceeding 2.0% per annum of the NAV of the Fund as provided under Division 13.1 of the Deed.
The Manager is currently charging Manager’s fee of 1.50% per annum of the NAV of the Fund (financial period from 1 March 2016 to 31 August 2016: 1.50% per annum).
6. truStee’S fee
Pursuant to the Fifth Master Supplemental Deed dated 25 July 2014, the Trustee’s fee is calculated at a rate not exceeding 0.05% per annum of the NAV of the Fund effective from 1 August 2014.
The Trustee’s fee is currently calculated at 0.05% per annum of the NAV of the Fund (financial period from 1 March 2016 to 31 August 2016: 0.05% per annum).
7. inCOme tAX
Income tax is calculated at the Malaysian statutory tax rate of 24% of the estimated assessable income for the current and previous financial periods.
Income tax is calculated on investment income less partial deduction for permitted expenses as provided for under Section 63B of the Income Tax Act, 1967.
A reconciliation of income tax expense applicable to net income before tax at the statutory income tax rate to income tax expense at the effective income tax rate of the Fund is as follows:
1.3.2017 to 31.8.2017
1.3.2016 to 31.8.2016
rm rm
Net income before tax 633,724 2,146,414
Tax at Malaysian statutory tax rate of 24% (financial period from 1 March 2016 to 31 August 2016: 24%) 152,094 515,139
Tax effect of:Income not subject to tax (518,766) (825,471)Expenses not deductible for tax purposes 86,322 150,836 Restriction on tax deductible expenses for unit trust fund 118,844 159,496
Income tax for the financial period - -

Kenanga Premier Fund Interim Report 32
8. diStriButiOn
Distribution to unit holders was from the following sources:
1.3.2017 to 31.8.2017
1.3.2016 to 31.8.2016
rm rm
Undistributed income brought forward - 27,622,195Less: Expenses - (321,939)Distribution out of realised reserve - 27,300,256Distribution equalisation (Note 12(a)) - (19,307,207)Distribution for the financial period - 7,993,049
Gross/Net distribution per unit (sen) - 3.58
Date of distribution - 16.05.2016
The income distribution for the financial period from 1 March 2016 to 31 August 2016 included an amount of RM27,622,195 which was made from realised gain of preceding financial years’ realised gain.
The income distribution for the financial period1 March 2016 to 31 August 2016 was made before taking into account the unrealised loss brought forward of RM1,603,375.
9. SHOrt term dePOSitS
Short term deposits are held with licensed financial institutions in Malaysia at the prevailing interest rates.
10. OtHer reCeiVABLeS
31.8.2017 31.8.2016rm rm
Amount due from licensed financial institutions - 648,975 Dividend receivable 88,384 158,714 Interest receivable from short term deposits 968 7,407
89,352 815,096
33 Kenanga Premier Fund Interim Report
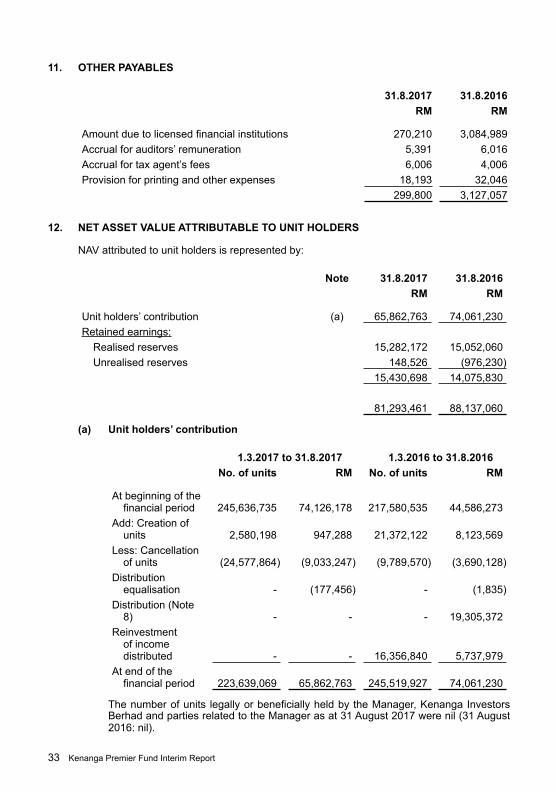
11. OtHer PAYABLeS
31.8.2017 31.8.2016rm rm
Amount due to licensed financial institutions 270,210 3,084,989 Accrual for auditors’ remuneration 5,391 6,016 Accrual for tax agent’s fees 6,006 4,006 Provision for printing and other expenses 18,193 32,046
299,800 3,127,057
12. net ASSet VALue AttriButABLe tO unit HOLderS
NAV attributed to unit holders is represented by:
note 31.8.2017 31.8.2016rm rm
Unit holders’ contribution (a) 65,862,763 74,061,230 Retained earnings:
Realised reserves 15,282,172 15,052,060 Unrealised reserves 148,526 (976,230)
15,430,698 14,075,830
81,293,461 88,137,060
(a) unit holders’ contribution
1.3.2017 to 31.8.2017 1.3.2016 to 31.8.2016no. of units rm no. of units rm
At beginning of the financial period 245,636,735 74,126,178 217,580,535 44,586,273
Add: Creation of units 2,580,198 947,288 21,372,122 8,123,569
Less: Cancellation of units (24,577,864) (9,033,247) (9,789,570) (3,690,128)
Distribution equalisation - (177,456) - (1,835)
Distribution (Note 8) - - - 19,305,372
Reinvestment of income distributed - - 16,356,840 5,737,979
At end of the financial period 223,639,069 65,862,763 245,519,927 74,061,230
The number of units legally or beneficially held by the Manager, Kenanga Investors Berhad and parties related to the Manager as at 31 August 2017 were nil (31 August 2016: nil).

Kenanga Premier Fund Interim Report 34
13. net ASSet VALue Per unit
In line with the adoption of MFRS 139, financial assets at FVTPL have been valued at the bid prices at the close of business. In accordance with the Deed, the calculation of NAV attributable to unit holders per unit for the creation and cancellation of units is computed based on financial assets at FVTPL valued at the last done market price.
A reconciliation of NAV attributable to unit holders for creation/cancellation of units and the NAV attributable to unit holders per the financial statements is as follows:
31.8.2017 31.8.2016rm rm/unit rm rm/unit
NAV attributable to unit holders for creation/cancellation of units 81,631,630 0.3650 88,539,210 0.3606
Effects of adopting bid prices as fair value (338,169) (0.0015) (402,150) (0.0016)
NAV attributable to unit holders per statement of financial position 81,293,461 0.3635 88,137,060 0.3590
14. POrtfOLiO turnOVer rAtiO (“Ptr”)
PTR for the financial period from 1 March 2017 to 31 August 2017 is 0.51 times (financial period from 1 March 2016 to 31 August 2016: 0.82 times).
PTR is the ratio of average sum of acquisitions and disposals of investments of the Fund for the financial period to the average NAV of the Fund, calculated on a daily basis.
15. mAnAGement eXPenSe rAtiO (“mer”)
MER for the financial period from 1 March 2017 to 31 August 2017 is 1.63% (financial period from 1 March 2016 to 31 August 2016: 1.65%).
MER is the ratio of total fees and recovered expenses of the Fund expressed as a percentage of the Fund’s average NAV, calculated on a daily basis.

35 Kenanga Premier Fund Interim Report
16. trAnSACtiOnS WitH LiCenSed finAnCiAL inStitutiOnS
transaction value
Percentage of total
Brokerage, stamp duty
and clearing fee
Percentage of total
rm % rm %
CIMB Investment Bank Berhad 19,987,284 22.2 59,201 23.3
Kenanga Investment Bank Berhad* 18,221,209 20.3 49,183 19.4
RHB Investment Bank Berhad 11,302,552 12.6 32,421 12.8
Maybank Investment Bank Berhad 10,615,307 11.8 29,343 11.6
Affin Hwang Investment Bank Berhad 8,674,355 9.7 24,824 9.8
Public Investment Bank Berhad 5,368,973 6.0 14,648 5.8
UOB Kay Hian Securities (M) Sdn Bhd 5,364,910 6.0 14,518 5.7
Hong Leong Investment Bank Berhad 3,325,705 3.7 9,747 3.8
Alliance Investment Bank Berhad 2,068,691 2.3 5,646 2.2
MIDF Amanah Investment Bank Berhad 1,791,979 2.0 5,157 2.0
Others 3,095,918 3.4 9,183 3.689,816,883 100.0 253,871 100.0
* Kenanga Investment Bank Berhad is a related party of Kenanga Investors Berhad.
The above transactions values are in respect of listed equity securities and listed collective investment schemes.
The directors of the Manager are of the opinion that the transactions with the related party have been entered into in the normal course of business and have been established on terms and conditions that are not materially different from that obtainable in transactions with unrelated parties. The Manager is of the opinion that the above dealings have been transacted on an arm’s length basis.

Kenanga Premier Fund Interim Report 36
17. SeGmentAL rePOrtinG
a. Business Segments
In accordance with the objective of the Fund, the Fund can invest 70% to 98% of its fund in listed Malaysian investment securities. The following table provides an analysis of the Fund’s revenue, results, assets and liabilities by business segments:
Listed investment
securitiesOther
investments totalrm rm rm
1.3.2017 to 31.8.2017revenueSegment income 1,582,334 219,514 Segment expenses (415,672) - Net segment income representing
segment results 1,166,662 219,514 1,386,176 Unallocated expenditure (752,452)Income before tax 633,724 Income tax - Net income after tax 633,724
31.8.2017AssetsFinancial assets at FVTPL 69,840,772 - Short term deposits - 11,779,000 Other segment assets 88,384 968 Total segment assets 69,929,156 11,779,968 81,709,124 Unallocated assets 50,942
81,760,066
LiabilitiesSegment liabilities 270,210 - 270,210 Unallocated liabilities 196,395
466,605

37 Kenanga Premier Fund Interim Report
17. SeGmentAL rePOrtinG (COntd.)
a. Business Segments (Contd.)
Listed investment
securitiesOther
investments totalrm rm rm
1.3.2016 to 31.8.2016revenueSegment income 3,147,321 292,140Segment expenses (542,295) -Net segment income representing
segment results 2,605,026 292,140 2,897,166Unallocated expenditure (750,752)Income before tax 2,146,414Income tax -Net income after tax 2,146,414
31.8.2016AssetsFinancial assets at FVTPL 65,526,310 -Short term deposits - 24,987,000Other segment assets 807,689 7,407Total segment assets 66,333,999 24,994,407 91,328,406Unallocated assets 62,195
91,390,601
LiabilitiesSegment liabilities 3,084,989 - 3,084,989Unallocated liabilities 168,552
3,253,541
b. Geographical Segments
As all of the Fund’s investments are located in Malaysia, disclosure by geographical segments is not relevant.

Kenanga Premier Fund Interim Report 38
18. finAnCiAL inStrumentS
a. Classification of financial instruments
The Fund’s financial assets and financial liabilities are measured on an ongoing basis at either fair value or at amortised cost based on their respective classification. The significant accounting policies in Note 3 describe how the classes of financial instruments are measured, and how income and expenses, including fair value gains and losses, are recognised.
The following table analyses the financial assets and financial liabilities of the Fund in the statement of financial position by the class of financial instruments to which they are assigned and therefore by the measurement basis.
financial assets at
fVtPL receivablesfinancial liabilities total
rm rm rm rm
31.8.2017AssetsListed equity
securities 66,674,172 - - 66,674,172Listed collective
investment schemes 3,125,571 - - 3,125,571
Listed warrants 41,029 - - 41,029Short term deposits - 11,779,000 - 11,779,000Other receivables - 89,352 - 89,352Cash at bank - 50,942 - 50,942
69,840,772 11,919,294 - 81,760,066
LiabilitiesAmount due to
Manager - - 163,434 163,434Amount due to
Trustee - - 3,371 3,371Other payables - - 270,210 270,210
- - 437,015 437,015

39 Kenanga Premier Fund Interim Report
18. finAnCiAL inStrumentS (COntd.)
a. Classification of financial instruments (Contd.)
financial assets at
fVtPL receivablesfinancial liabilities total
rm rm rm rm
31.8.2016AssetsListed equity
securities 63,405,921 - - 63,405,921Listed collective
investment schemes 2,084,646 - - 2,084,646
Listed warrants 35,743 - - 35,743Short term deposits - 24,987,000 - 24,987,000Other receivables - 815,096 - 815,096Cash at bank - 62,195 - 62,195
65,526,310 25,864,291 - 91,390,601
LiabilitiesAmount due to
Manager - - 122,881 122,881Amount due to
Trustee - - 3,603 3,603Other payables - - 3,084,989 3,084,989
- - 3,211,473 3,211,473
b. financial instruments that are carried at fair value
The Fund’s financial assets at FVTPL are carried at fair value. The fair values of these financial assets were determined using prices in active markets.
The following table shows the fair value measurements by level of the fair value measurement hierarchy:
Level 1 Level 2 Level 3 totalrm rm rm rm
investments:31.8.2017Listed equity
securities 66,674,172 - - 66,674,172 Listed collective
investment schemes 3,125,571 - - 3,125,571
Listed warrants 41,029 - - 41,029

Kenanga Premier Fund Interim Report 40
18. finAnCiAL inStrumentS (COntd.)
b. financial instruments that are carried at fair value (Contd.)
Level 1 Level 2 Level 3 totalrm rm rm rm
investments: (Contd.)
31.8.2016Listed equity
securities 63,405,921 - - 63,405,921 Listed collective
investment schemes 2,084,646 - - 2,084,646
Listed warrants 35,743 - - 35,743
Level 1: Listed prices in active marketLevel 2: Model with all significant inputs which are observable market dataLevel 3: Model with inputs not based on observable market data
The fair values of listed equity securities, listed collective investment schemes and listed warrants are determined by reference to Bursa Malaysia Securities Berhad’s bid prices at reporting date.
c. financial instruments not carried at fair value and which their carrying amounts are reasonable approximations of fair value
The carrying amounts of the Fund’s other financial assets and financial liabilities are not carried at fair value but approximate fair values due to the relatively short term maturity of these financial instruments.
19. CAPitAL mAnAGement
The capital of the Fund can vary depending on the demand for creation and cancellation of units to the Fund.
The Fund’s objectives for managing capital are:
a. To invest in investments meeting the description, risk exposure and expected return indicated in its prospectus;
b. To maintain sufficient liquidity to meet the expenses of the Fund, and to meet cancellation requests as they arise; and
c. To maintain sufficient fund size to make the operations of the Fund cost-efficient.
No changes were made to the capital management objectives, policies or processes during the current and previous financial periods.

This page has been intentionally left blank


investor Services CenterToll Free Line: 1 800 88 3737Fax: +603 2172 3133Email: [email protected]
Head Office, Kuala LumpurLevel 14, Kenanga Tower, 237 Jalan Tun Razak, 50400 Kuala Lumpur, Malaysia.Tel: 03-2172 3000 Fax: 03-2172 3080