Embed Size (px)
Citation preview

energy.ky.gov

2 2 energy.ky.gov

energy.ky.gov 3
Foreword
Fellow Kentuckians,
The Energy and Environment Cabinet and the Department for Energy Development and Inde-
pendence (DEDI) present the second edition of the Kentucky Energy Profile to provide Kentucki-
ans with a snapshot of energy production and consumption within the Commonwealth, as well as
a foundation for discussing Kentucky’s energy future. All of the information summarized in this
report was obtained from public sources, including a variety of state and Federal Government
agencies.
Kentucky continues to be a national leader in energy production. Kentucky is the nation’s third
largest producer of coal, with rich deposits of low-sulfur coal in the Appalachian mountains of
Eastern Kentucky and deposits of Illinois Basin coal in Western Kentucky. The Commonwealth
also produces natural gas, a limited amount of crude oil, and is home to a 212,000 barrel per
day petroleum refinery and two ethanol production facilities.
Kentucky is also a leading consumer of energy with the 8th highest per capita energy consump-
tion in the United States. In 2009, Kentucky consumed a total of 41 million tons of coal, 125 mil-
lion barrels of petroleum products, and 206 billion cubic feet of natural gas. This energy con-
sumption cost Kentucky’s citizens, institutions, and businesses over $17.4 billion, which was 11%
of the Commonwealth’s total Gross Domestic Product. The majority of this energy was consumed
by large manufacturing facilities, which have located in Kentucky in part because of low and
stable energy costs.
Clearly, energy is of critical importance to the Commonwealth. We hope that you will find this
report informative and useful. We welcome your questions and feedback—please direct all
inquiries to Alan Waddell ([email protected]) or call 1-502-564-7192.
Sincerely,
Secretary Leonard K. Peters,
Kentucky Energy and Environment Cabinet

4 4 energy.ky.gov
energy.ky.gov 5
Table of Contents
Executive Summary ................................................................................................ 7
Executive Summary Graphics ................................................................................. 9
Kentucky Energy Commodity Prices ..................................................................... 11
Kentucky Energy Commodity Expenditures.......................................................... 12
Kentucky Energy Expenditures ............................................................................. 13
Energy Consumption Introduction ........................................................................ 17
Kentucky Total Energy Consumption ................................................................... 18
Kentucky Energy Use by Sector ............................................................................ 19
Industrial Sector & Commercial Sector .................................................. 19
Residential Sector & Transportation Sector ........................................... 20
Kentucky Energy Intensity by Sector .................................................................... 21
Energy Consumption per Capita by Sector ........................................... 21
Energy Consumption per Real Dollar GDP ........................................... 22
Kentucky Electricity Consumption by Sector ......................................................... 23
Electricity Load by Sector ...................................................................... 24
Kentucky Electricity Intensity by Sector ................................................................ 25
Electricity Consumption per Capita by Sector ....................................... 25
Electricity Consumption per Real Dollar GDP ....................................... 26
Kentucky Coal Consumption ............................................................................... 27
Kentucky Coal Imports ........................................................................................ 28
Kentucky Natural Gas Consumption .................................................................... 29
Kentucky Liquid Fuel Consumption ...................................................................... 30
Gasoline & Diesel ................................................................................ 30
Propane & Kerosene ............................................................................ 31
Energy Production Introduction ............................................................................ 33
Kentucky Total Energy Production ........................................................................ 34
Kentucky Renewable Energy Production .............................................................. 35
Kentucky Natural Gas Production ........................................................................ 36
Kentucky Crude Oil Production ............................................................................ 37
Kentucky Coal Production .................................................................................... 38
Coal Production by County .................................................................. 38

6 6 energy.ky.gov
Table of Contents
Kentucky Coal Production (cont.) ........................................................................ 38
Total Production (East & West) ............................................................. 39
Underground Production vs. Surface Production .................................. 39
Eastern Kentucky Coal Production ........................................................................ 40
Underground Production vs. Surface Production .................................. 40
Exported Production vs. In-State Consumption .................................... 40
Western Kentucky Coal Production ....................................................................... 41
Underground Production vs. Surface Production .................................. 41
Exported Production vs. In-State Consumption .................................... 41
Kentucky Coal Exports ......................................................................................... 42
Eastern Kentucky Coal Exports ............................................................ 42
Western Kentucky Coal Exports ........................................................... 42
Kentucky Electricity Service & Rates ..................................................................... 43
Kentucky Electricity Generation Infrastructure ...................................................... 44
Kentucky Electricity Generation ............................................................................ 45
Electricity Generation by Fuel Type ...................................................... 45
Electric Generator Data ......................................................................... 45
Electric Power Sector Emissions ........................................................... 46
Kentucky Electricity Prices by Sector ..................................................................... 47
Kentucky Electric Service Areas ............................................................................ 48
Kentucky Residential Electricity Prices .................................................................. 49
Kentucky Average Residential Electricity Usage .................................................. 50
Kentucky Average Residential Electricity Bill ....................................................... 51
Kentucky Commercial Electricity Prices ................................................................ 52
Kentucky Industrial Electricity Prices .................................................................... 53
Authors ................................................................................................................ 54
Acknowledgements .............................................................................................. 55
Basic Methodology ............................................................................................... 56
Glossary ............................................................................................................... 57

energy.ky.gov 7
Executive Summary
The second edition of the Kentucky Energy Profile is offered to the public to serve as an impartial point of reference for data regarding energy within the Commonwealth of Kentucky. A product of ex-tensive research, database construction, and quantitative analysis, this profile is designed to help identify and explain the aggregate dynamics of energy consumption and energy production that are particular to Kentucky. Using summary statistics and time series graphics, the Kentucky Energy Profile 2011 ap-proaches these topics from the perspectives of energy commodities and supply requirements, as well as energy usage by specific sectors of the economy. Additionally, great effort is focused on supplying the reader with the most recent data. Most data is from calendar year 2009, with 2010 data used where
available.
Organization
This document is divided into four general sections: Energy Commodity Costs & Expenditures, Energy Consumption, Energy Production, and Electricity. The division of this material is designed to focus information and analysis on particular areas of interest, while providing a holistic perspective on the broader dynamics and relationships of energy and the economy. It is the desire of the Kentucky Depart-ment for Energy Development and Independence (DEDI) that this document be used by policy-makers, researchers, businesses, and interested citizens to frame and inform discussions and decisions related to energy policy within the Commonwealth of Kentucky.
Expenditures
Expenditures relating to energy consumption in Kentucky in 2009 totaled over $17.4 Billion. Re-flecting a 24% decrease in total energy expenditures compared with 2008, the analysis in expenditures is divided between expenditures by economic sector or expenditures by fuel type (or commodity). In 2009, the Transportation Sector was the largest concentration of energy expenditures, accounting for 46% of total expenditures. The Industrial Sector was the next largest focus of energy expenditures, ac-counting for approximately 26% of total expenditures, followed by the Residential and Commercial sec-tors. In terms of commodity-based expenditures, electricity represented one-third of all energy expendi-tures in 2009. Gasoline was the next largest component of energy expenditures with 30% of the total, followed by purchases connected to Diesel, coal, and natural gas consumption.
Consumption
For matters relating to energy consumption in Kentucky, data are divided between the usage of fuels (or energy resources) and the energy requirements of specific economic sectors. In 2009, the Com-monwealth consumed 1.8 Quadrillion BTU of energy, ranking Kentucky 18th highest in total energy con-sumption (8th highest in total energy consumption per capita). This amount represented a 5% decline in total, statewide energy consumption compared with 2008.
Fuel usage in the Commonwealth in 2009 was led by coal consumption, which contributed to 49% of Kentucky’s energy requirements. This usage was focused almost exclusively in the Electric Power Sector, with a small amount of coal consumption based in the Industrial Sector. The second largest source of energy consumption was petroleum (and its associated products) with 36% of total consumption, and was divided between the Transportation Sector and industrial processes. The remaining 15% of energy consumption for the Commonwealth, divided by energy commodity or resource, was fulfilled by natural gas, biomass, and other renewable resources in 2009.
From an economic perspective, the Industrial Sector of Kentucky was by far the largest consumer of energy in 2009, accounting for approximately 43% of total energy consumption. Compared across States, the proportional size of Kentucky’s Industrial Sector is notably larger than the national average,

8 8 energy.ky.gov
Executive Summary
and is reflective of the importance of industry to the economy of the Commonwealth. The substantial en-ergy demands of Kentucky’s Industrial Sector can be linked to energy-intensive firms and operations such as steel, aluminum, and automotive manufacturing located within the Commonwealth. The Transportation Sector was the next largest consumer of energy, accounting for 25% of total energy consumption. The remaining balance of energy consumption in Kentucky in 2009 was divided between the Residential and Commercial sectors (in order of consumption).
Production
Energy production within the Commonwealth of Kentucky involves both the extraction of fossil fuels and collection of renewable energy resources, and has been historically dominated by coal produc-tion. In 2009, the Commonwealth produced 2.8 Quadrillion BTU of energy, making Kentucky a net ex-porter of energy for the year. This amount represented a 10% decrease in total energy production compared with 2008, yet still qualified Kentucky as the fifth largest energy producer in the United States. Of this amount, coal accounted for 93% of all energy production in Kentucky in 2009, and posi-tioned Kentucky as the nation’s third largest producer of coal. Natural gas extraction constituted 4% of energy production, while combined renewable energy resources comprised 2% of total energy produc-tion in the Commonwealth. Additionally, Kentucky produced 2.47 Million Barrels of crude oil in 2009 (though this commodity reflected less than 1% of total energy production).
Electricity Generation
The Electric Power Sector, profoundly influential in the demand and consumption of energy sup-plies as well as economic activity, consumed 0.96 Quadrillion BTU of energy in 2009 while generating 90,630 Gigawatt-hours of electricity. Representing a 7% decrease in electricity generation compared with the previous year, the vast majority (92%) of this electricity generation was fueled by the combus-tion of coal. Hydroelectric power was the next largest fuel source for electricity production, contributing to 4% of total generation. Combustion of petroleum products, natural gas, wood products, and biomass comprised the remaining 4% of electricity generation in Kentucky in 2009. Additionally, the average price for electricity across economic sectors in Kentucky through 2010 was 6.75 cents per kilowatt-hour. Reflecting a 4% increase in the average price of electricity from 2009, this multi-sector weighted aver-age nonetheless gave the Commonwealth the fourth lowest price of electricity in the Nation. However, the price of electricity varies widely across economic sectors and geography.
Electricity Demand
Demand for electricity in 2010 was led by the Industrial Sector, which accounted for approxi-mately half of total electricity consumption. In a national context, the Industrial Sector’s significance in the consumption of electricity is much greater in Kentucky than in most other states. An average national electricity portfolio apportions just 25% of total electricity use to the Industrial Sector, which proportion-ally would meet only half of Kentucky’s industrial requirements. The Residential Sector was the next larg-est consumer of electricity, registering nearly 30% of total consumption and ranking Kentucky 6th nation-ally in terms of residential electricity consumption per capita. The Commercial Sector consumed the re-maining 21% of electricity in 2010.

energy.ky.gov 9
Executive Summary
In 2009, coal was the largest fuel source for energy con-sumption in Kentucky. The predominance of coal in sourcing energy consumption was linked to the generation of electric-ity and manufacturing processes in the Commonwealth. Pe-troleum products (gasoline, diesel, etc.) were the next largest sources of energy consumption in 2009.
Energy Consumption by Fuel Type
In 2010, coal combustion accounted for the super-majority of electricity generated within Kentucky. Additional base-load electricity generation was supplied through hydro power, wood, and biomass resources. Peak power requirements were predominantly met through the combustion of natural gas and petroleum products.
Electricity Generation by Fuel Type
In 2010, the Industrial Sector was the largest consumer of electricity in Kentucky. Again, the location of heavy industry operations, such as steel and aluminum production, and auto-motive manufacturing accounted for the electricity require-ments of the Industrial Sector in Kentucky. The Residential Sector was the next largest consumer of electricity in 2010.
Electricity Consumption by Sector
In 2009, the Industrial Sector was the largest consumer of energy in Kentucky. The location of heavy industry opera-tions, such as steel and aluminum production, and automotive manufacturing accounted for the significance and energy requirements of the Industrial Sector in Kentucky. The Trans-portation Sector was the next largest consumer of energy.
Energy Consumption by Sector
10 10 energy.ky.gov
Executive Summary
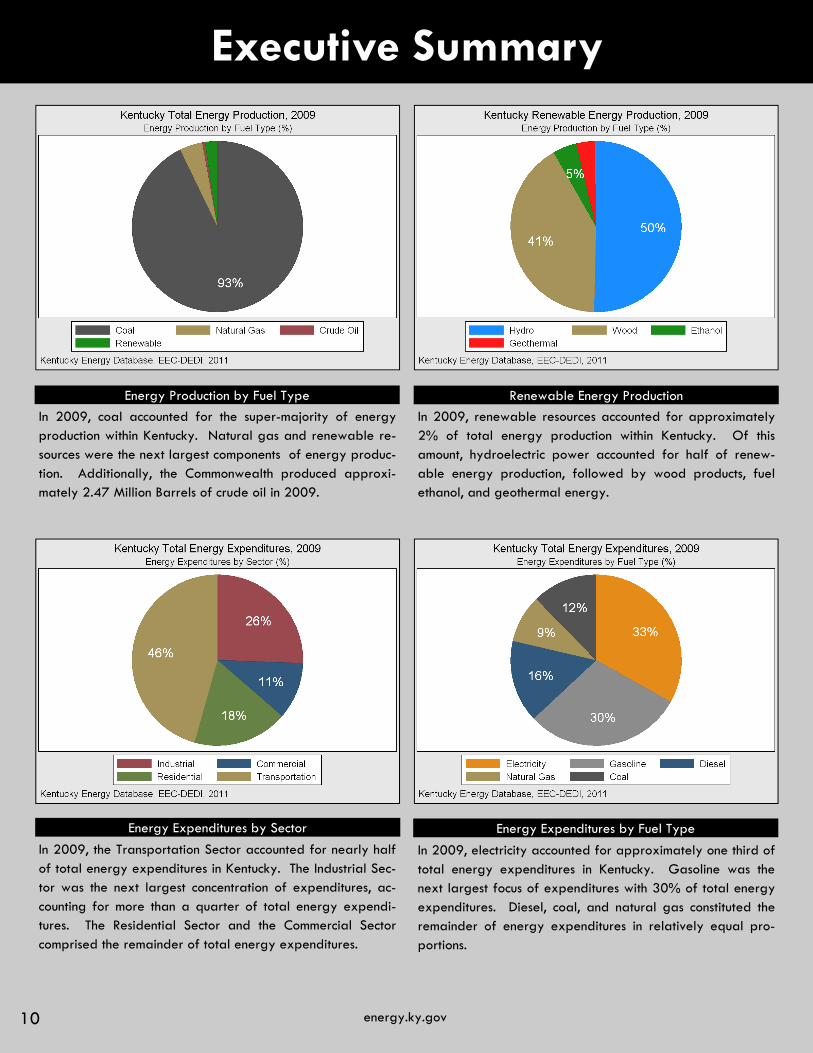
In 2009, renewable resources accounted for approximately 2% of total energy production within Kentucky. Of this amount, hydroelectric power accounted for half of renew-able energy production, followed by wood products, fuel ethanol, and geothermal energy.
Renewable Energy Production
In 2009, electricity accounted for approximately one third of total energy expenditures in Kentucky. Gasoline was the next largest focus of expenditures with 30% of total energy expenditures. Diesel, coal, and natural gas constituted the remainder of energy expenditures in relatively equal pro-portions.
Energy Expenditures by Fuel Type
In 2009, the Transportation Sector accounted for nearly half of total energy expenditures in Kentucky. The Industrial Sec-tor was the next largest concentration of expenditures, ac-counting for more than a quarter of total energy expendi-tures. The Residential Sector and the Commercial Sector comprised the remainder of total energy expenditures.
Energy Expenditures by Sector
In 2009, coal accounted for the super-majority of energy production within Kentucky. Natural gas and renewable re-sources were the next largest components of energy produc-tion. Additionally, the Commonwealth produced approxi-mately 2.47 Million Barrels of crude oil in 2009.
Energy Production by Fuel Type

energy.ky.gov 11
Kentucky Commodity Prices
Fuel Type ($US)/MMBTU ($US)/Gallon Gasoline 22.19 2.75
Fuel Type (($US)/MMBTU ($US)/Mcf Natural Gas 5.77 5.77
Fuel Type ($US)/MMBTU ($US)/Ton
Coal 2.26 51.67
Fuel Type ($US)/MMBTU ($US)/Gallon
Diesel 21.68 2.99
The average price of gasoline in Kentucky in 2010 was $2.75 per gallon. This represented a 17% increase in the price of gasoline compared with 2009, and was measured by the average retail sales price of gasoline.
The average price of natural gas in Kentucky in 2010 was $5.77 per thousand cubic feet. This represented a 4% de-crease in the price of natural gas compared with 2009, and was measured by the average city gate price of natural gas.
The average price of steam coal in Kentucky in 2010 was $51.67 per ton. This represented a 4% increase in the price of steam coal compared with 2009, and was measured by a weighted average of steam coal prices from the particular coal mine states of origin.
The average price of Diesel in Kentucky in 2010 was $2.99 per gallon. This represented a 23% increase in the price of Diesel compared with 2009, and was measured by the aver-age retail sales price of Diesel.

12 12 energy.ky.gov
Kentucky Commodity Expenditures
Fuel Type (Million $ US) % of Total Gasoline 5,153 30%
Fuel Type ((Million $ US) % of Total Natural Gas 1,560 9%
Fuel Type (Million $ US) % of Total
Coal 2,123 12%
Fuel Type (Million $ US) % of Total
Diesel 2,697 16%
Residents, businesses, and industries in the Commonwealth of Kentucky spent approximately $5.1 Billion on gasoline in 2009. This amount represented a 25% decrease in gasoline expenditures compared with 2008, and accounted for 30% of total energy expenditures in the State.
Residents, businesses, and industries in the Commonwealth of Kentucky spent approximately $1.5 Billion on natural gas in 2009. This amount represented a 34% decrease in natural gas expenditures compared with 2008, and accounted for 9% of total energy expenditures in the State.
Electric utilities, municipalities, public institutions, and industries in the Commonwealth of Kentucky spent approximately $2.1 Billion on coal in 2009. This amount represented an 8% de-crease in coal expenditures compared with 2008, and ac-counted for 12% of total energy expenditures in the State.
Residents, businesses, and industries in the Commonwealth of Kentucky spent approximately $2.7 Billion on Diesel in 2009. This amount represented a 42% decrease in Diesel expendi-tures compared with 2008, and accounted for 16% of total energy expenditures in the State.

energy.ky.gov 13
Kentucky Energy Expenditures
Fuel Type Million ($ US) Percentage
Total 17,477 100%
Electricity 5,713 33%
Gasoline 5,153 30% Diesel 2,697 16% Coal 2,123 12%
Natural Gas 1,560 6%
Sector Million ($ US) Percentage Total 17,477 100%
Transportation 7,979 46%
Industrial 4,471 26% Residential 3,140 18% Commercial 1,887 11%
In 2009, citizens, institutions, and firms spent over $17.4 Bil-
lion on energy commodities and energy consumption in Ken-
tucky. This amount reflected a 24% decrease in total energy
expenditures compared with 2008. Of this total, the Trans-
portation Sector accounted for nearly half of energy expen-
ditures, followed by the Industrial Sector with more than a
quarter of total energy expenditures. The Residential Sector
and Commercial Sector accounted for the remaining 29% of
total energy expenditures in 2009.
In 2009, citizens, institutions, and firms spent over $17.4 Bil-
lion on energy commodities and energy consumption in Ken-
tucky. This amount reflected a 24% decrease in total energy
expenditures compared with 2008. Electricity alone ac-
counted for one third of total energy expenditures. Com-
bined, gasoline and Diesel accounted for nearly half of total
energy expenditures. Coal, natural gas, and other petro-
leum products accounted for the remainder of total energy
expenditures in 2009.

14 14 energy.ky.gov
Kentucky Energy Expenditures
Fuel Type Million ($ US) Percentage
Total 1,887 100%
Electricity 1,426 76%
Natural Gas 386 21% Diesel 35 1%
Liquid Propane Gas 26 1%
Wood 5 >1%
Sector Million ($ US) Percentage Total 4,471 100%
Electricity 2,066 56%
Diesel 534 14% Natural Gas 517 14%
Liquid Propane Gas 369 10%
Coal 178 5%
In 2009, firms of the Industrial Sector in Kentucky spent over
$4.4 Billion on energy commodities and energy consumption.
This amount reflected a 27% decrease in industrial energy
expenditures compared with 2008. Electricity was the larg-
est component of expenditures, accounting for over half of
industrial energy expenditures. Natural gas and Diesel ac-
counted evenly for 28% of industrial energy expenditures.
Propane, coal, and wood products accounted for the remain-
der of industrial energy expenditures in 2009.
In 2009, firms of the Commercial Sector in Kentucky spent
over $1.8 Billion on energy commodities and energy con-
sumption. This amount reflected an 8% decrease in commer-
cial energy expenditures compared with 2008. Electricity
accounted for three quarters of commercial energy expendi-
tures in 2009. Natural gas accounted for 21% of commer-
cial energy expenditures. Diesel, propane, and wood prod-
ucts comprised the remainder of commercial energy expen-
ditures in 2009.
energy.ky.gov 15
Kentucky Energy Expenditures
Fuel Type Million ($ US) Percentage
Total 7,979 100%
Gasoline 5,071 64%
Diesel 2,073 26% Jet Fuel 711 9%
Other Petroleum* 119 1%
Sector Million ($ US) Percentage Total 3,140 100%
Electricity 2,220 71%
Natural Gas 617 20% Liquid Propane Gas 223 7%
Wood 32 1%
Diesel 31 1%
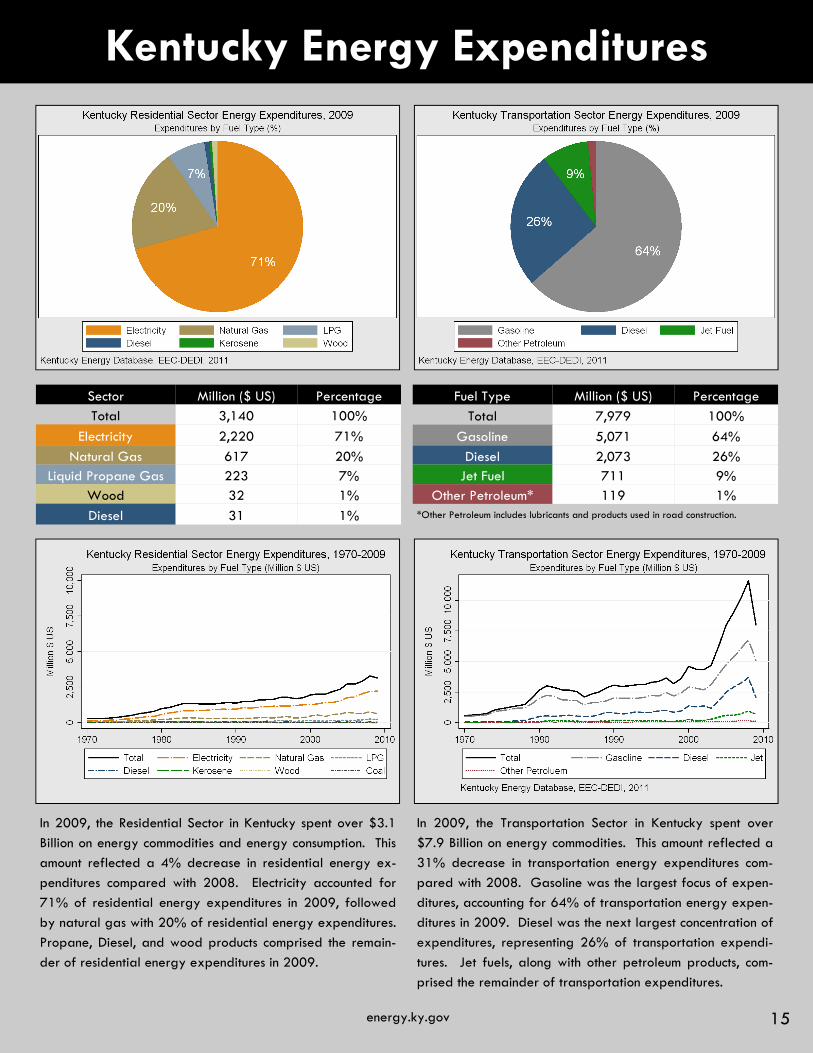
In 2009, the Residential Sector in Kentucky spent over $3.1
Billion on energy commodities and energy consumption. This
amount reflected a 4% decrease in residential energy ex-
penditures compared with 2008. Electricity accounted for
71% of residential energy expenditures in 2009, followed
by natural gas with 20% of residential energy expenditures.
Propane, Diesel, and wood products comprised the remain-
der of residential energy expenditures in 2009.
In 2009, the Transportation Sector in Kentucky spent over
$7.9 Billion on energy commodities. This amount reflected a
31% decrease in transportation energy expenditures com-
pared with 2008. Gasoline was the largest focus of expen-
ditures, accounting for 64% of transportation energy expen-
ditures in 2009. Diesel was the next largest concentration of
expenditures, representing 26% of transportation expendi-
tures. Jet fuels, along with other petroleum products, com-
prised the remainder of transportation expenditures.
*Other Petroleum includes lubricants and products used in road construction.

16 16 energy.ky.gov
Kentucky Energy Expenditures
In 2010, the Gross Domestic Product of Kentucky was $163 Billion. This amount reflected a 3% increase in State GDP compared with 2009. Since 1970, the State GDP of Ken-tucky has increased by 108%, with a constant annual growth rate of 1.8%. This analysis utilizes nominal GDP data ad-justed for inflation and chained to year 2010 values.
Gross Domestic Product
In 2010, the population of Kentucky was estimated to be around 4.33 million. This estimate reflects a 7% increase in Kentucky’s population since 2000. Since 1990, Kentucky has witnessed a consistent trend of increasing urbanization and urban population growth.
Rural & Urban Population
In 2010, the State Gross Domestic Product per capita in Ken-tucky was $37,625. This per capita income level places Ken-tucky below the national average of $47,140.
This analysis utilizes nominal income data adjusted for infla-tion and chained to year 2010 values.
Gross Domestic Product per Capita
In 2009, citizens, institutions, and firms in Kentucky on aver-age required $0.11 of energy commodities and/or energy consumption to produce $1 of State Gross Domestic Product. This metric of total energy expenditures to State Gross Do-mestic Product ranks Kentucky high nationally in terms of en-ergy expenses to state economic output.
Energy Expenditures & GDP

energy.ky.gov 17
Energy Consumption Accounting:
For the purposes of standardized measurement and accounting, energy consumption within the
Commonwealth is quantified by converting all supplies of energy into a British Thermal Unit (BTU) value.
Though more widely used physical measurements may be included to reflect usage of a particular energy
resource, this conversion is necessary to form a balanced comparison of consumption across energy sup-
plies. Subsequent to this conversion, energy consumption is then measured in terms of fuel type and/or by
economic sector. Measurements of energy consumption by fuel type (coal, natural gas, solar, etc.) can
help explain which resource(s) is enabling activities associated with energy consumption. Measurements
of energy consumption by economic sector (Industrial, Commercial, Residential, Transportation, Electric
Power) can help explain where and how energy resources are being utilized to enable activities associ-
ated with energy consumption.
An important distinction must be made between accounting for “primary” energy consumption
and “end-use” energy consumption. Primary energy consumption reflects the total, potential BTU value of
all energy resources consumed within the Commonwealth within a given period. Therefore, primary en-
ergy consumption should be understood as total energy consumption. End-use energy consumption re-
flects the ultimate, functional use of energy within the Commonwealth, subtracting losses due to thermody-
namic processes, transmission losses, or energy inefficiencies. End-use energy consumption should be un-
derstood as the quantification of how energy is ultimately used within an economic sector.* End-use en-
ergy consumption may also be described as the total net consumption of energy by economic sector. Ad-
ditionally, energy consumption data is provided for the most recent year of observation, usually 2009.
Summary:
In 2009, the Commonwealth of Kentucky consumed 1.8 Quadrillion BTU of energy. This amount
reflected a 5% decline in total statewide energy consumption, compared with 2008. Viewed nationally,
Kentucky was the 18th highest consumer of energy versus all other states, and ranked 8th highest in terms
of total energy consumption per capita. Overall, energy consumption in Kentucky in 2009 was domi-
nated by the use of coal and the energy requirements of the Industrial Sector.
In terms of energy consumption by fuel type, coal remained Kentucky’s single largest source of
energy, supplying 49% of the Commonwealth’s energy requirements in 2009. The sustained position and
importance of coal can be explained by predominant coal-fired electricity generation and industrial coal
usage within the Commonwealth. Petroleum products, utilized mainly for transportation and industry,
were the second largest source of energy consumption (36%). Natural gas, applied in industrial proc-
esses, home heating, and electricity generation constituted 11% of total energy consumption. Renewable
energy resources constituted 4% of energy consumption in 2009, and were harnessed primarily for home
heating use and electricity generation.
End-use energy consumption was led by the Industrial Sector in Kentucky in 2009. Accounting for
43% of total energy consumption, this dynamic is explained by the location of numerous energy-intensive
firms within the Commonwealth (such as steel production, aluminum production, and automotive manufac-
turing) which require substantial supplies of electricity, natural gas, petroleum products, and coal. The
remainder of end-use energy consumption in Kentucky was comprised by the Transportation Sector
(25%), Residential Sector (19%), and Commercial Sector (13%). * Electricity consumption is an example of end-use energy consumption. A customer may consume 1000 BTUs of electricity but 3000 BTUs were
consumed to generate and transmit that electricity.
18 18 energy.ky.gov
Kentucky Total Energy Consumption
Fuel Type Billion BTU Percentage
Total 1,876,629 100%
Coal 937,106 49%
Petroleum 680,093 36% Natural Gas 213,970 11% Renewables 80,125 4%
Net Electricity Imports -17,799 -
Sector Billion BTU Percentage
Total 1,876,629 100%
Industrial 811,058 43%
Transportation 465,189 25% Residential 358,057 19% Commercial 242,325 13%
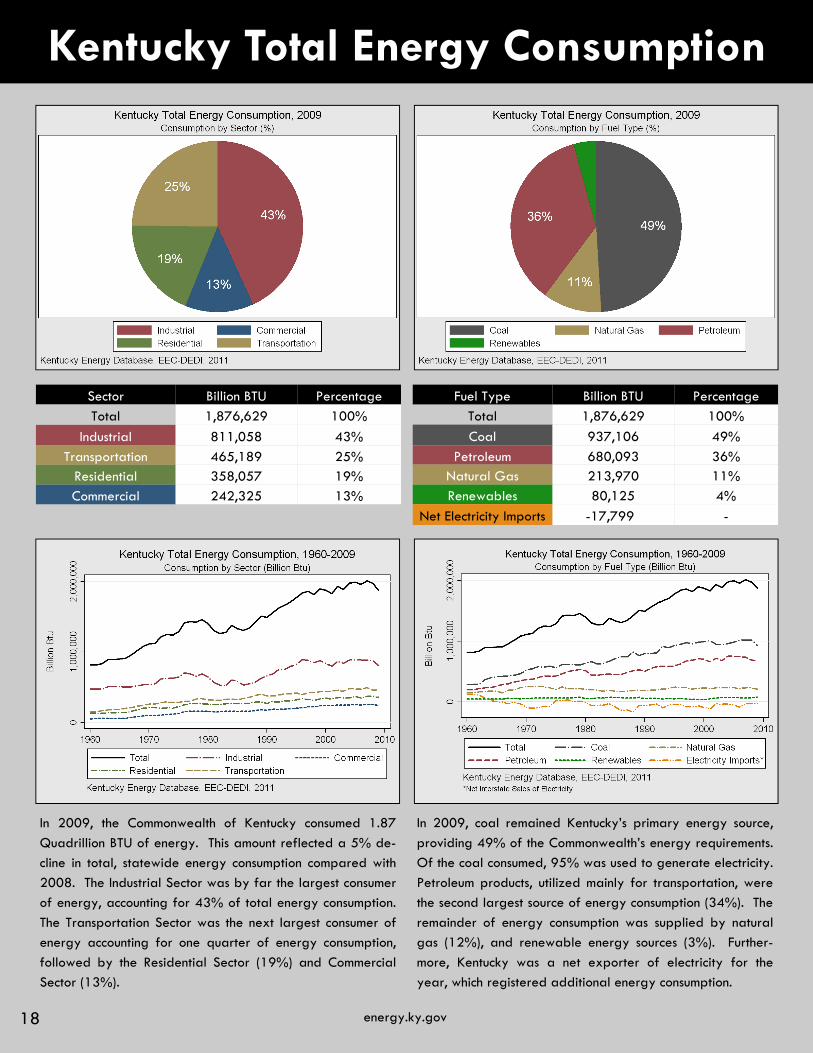
In 2009, the Commonwealth of Kentucky consumed 1.87
Quadrillion BTU of energy. This amount reflected a 5% de-
cline in total, statewide energy consumption compared with
2008. The Industrial Sector was by far the largest consumer
of energy, accounting for 43% of total energy consumption.
The Transportation Sector was the next largest consumer of
energy accounting for one quarter of energy consumption,
followed by the Residential Sector (19%) and Commercial
Sector (13%).
In 2009, coal remained Kentucky’s primary energy source,
providing 49% of the Commonwealth’s energy requirements.
Of the coal consumed, 95% was used to generate electricity.
Petroleum products, utilized mainly for transportation, were
the second largest source of energy consumption (34%). The
remainder of energy consumption was supplied by natural
gas (12%), and renewable energy sources (3%). Further-
more, Kentucky was a net exporter of electricity for the
year, which registered additional energy consumption.
energy.ky.gov 19
Kentucky Energy Use by Sector
Fuel Type Billion BTU Percentage Total 108,091 100%
Electricity 63,790 59%
Natural Gas 36,733 34% Petroleum 4,040 4%
Wood 1,686 1%
Coal 1,178 1%
Fuel Type Billion BTU Percentage Total 498,099 100%
Petroleum 187,954 38%
Electricity 148 ,722 30% Natural Gas 102,210 21%
Coal 43,407 9% Wood 13,824 2%
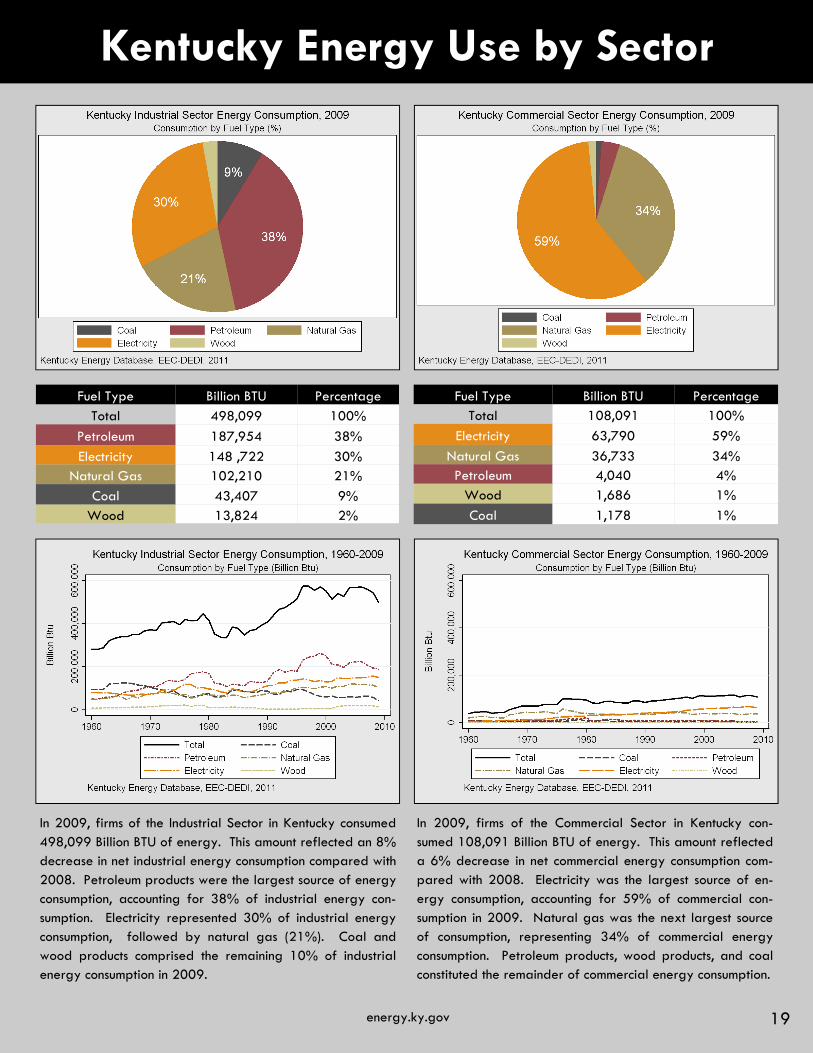
In 2009, firms of the Industrial Sector in Kentucky consumed 498,099 Billion BTU of energy. This amount reflected an 8% decrease in net industrial energy consumption compared with 2008. Petroleum products were the largest source of energy consumption, accounting for 38% of industrial energy con-sumption. Electricity represented 30% of industrial energy consumption, followed by natural gas (21%). Coal and wood products comprised the remaining 10% of industrial energy consumption in 2009.
In 2009, firms of the Commercial Sector in Kentucky con-sumed 108,091 Billion BTU of energy. This amount reflected a 6% decrease in net commercial energy consumption com-pared with 2008. Electricity was the largest source of en-ergy consumption, accounting for 59% of commercial con-sumption in 2009. Natural gas was the next largest source of consumption, representing 34% of commercial energy consumption. Petroleum products, wood products, and coal constituted the remainder of commercial energy consumption.
20 20 energy.ky.gov
Kentucky Energy Use by Sector
Fuel Type Billion BTU Percentage
Total 465,189 100%
Gasoline 274,411 59%
Diesel 119,192 26% Jet Fuel 55,814 12%
Natural Gas* 12,925 3%
Other Petroleum 2,639 1%
Fuel Type Billion BTU Percentage Total 167,606 100%
Electricity 90,505 54%
Natural Gas 53,499 32% Petroleum 11,586 7%
Wood 10,204 6%
Geothermal 1,590 1%
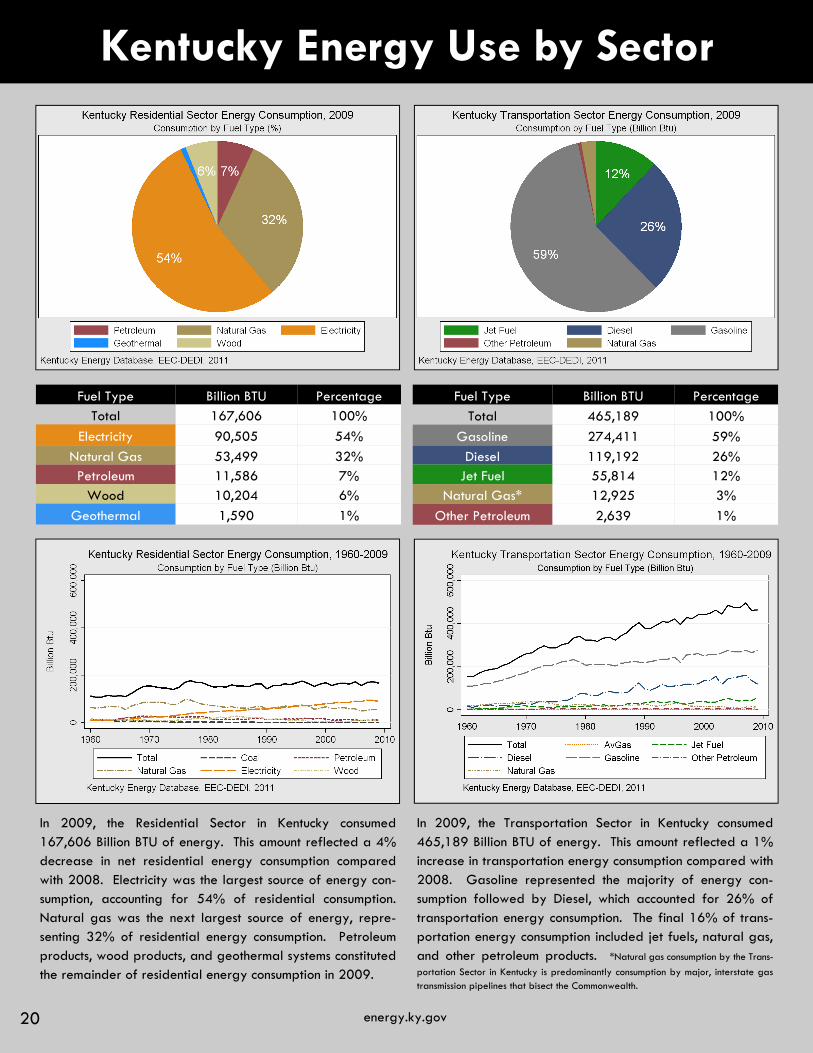
In 2009, the Residential Sector in Kentucky consumed 167,606 Billion BTU of energy. This amount reflected a 4% decrease in net residential energy consumption compared with 2008. Electricity was the largest source of energy con-sumption, accounting for 54% of residential consumption. Natural gas was the next largest source of energy, repre-senting 32% of residential energy consumption. Petroleum products, wood products, and geothermal systems constituted the remainder of residential energy consumption in 2009.
In 2009, the Transportation Sector in Kentucky consumed 465,189 Billion BTU of energy. This amount reflected a 1% increase in transportation energy consumption compared with 2008. Gasoline represented the majority of energy con-sumption followed by Diesel, which accounted for 26% of transportation energy consumption. The final 16% of trans-portation energy consumption included jet fuels, natural gas, and other petroleum products. *Natural gas consumption by the Trans-
portation Sector in Kentucky is predominantly consumption by major, interstate gas transmission pipelines that bisect the Commonwealth.
energy.ky.gov 21
Kentucky Energy Intensity by Sector
State MMBtu per Capita Rank Wyoming 956 1st Kentucky 435 8th New York 195 50th
State MMBtu per Capita Rank North Dakota 102 1st
Kentucky 83 9th Hawaii 28 50th
State MMBtu per Capita Rank Wyoming 533 1st Kentucky 188 7th New York 19 50th
State MMBtu per Capita Rank Alaska 273 1st
Kentucky 108 10th New York 56 50th
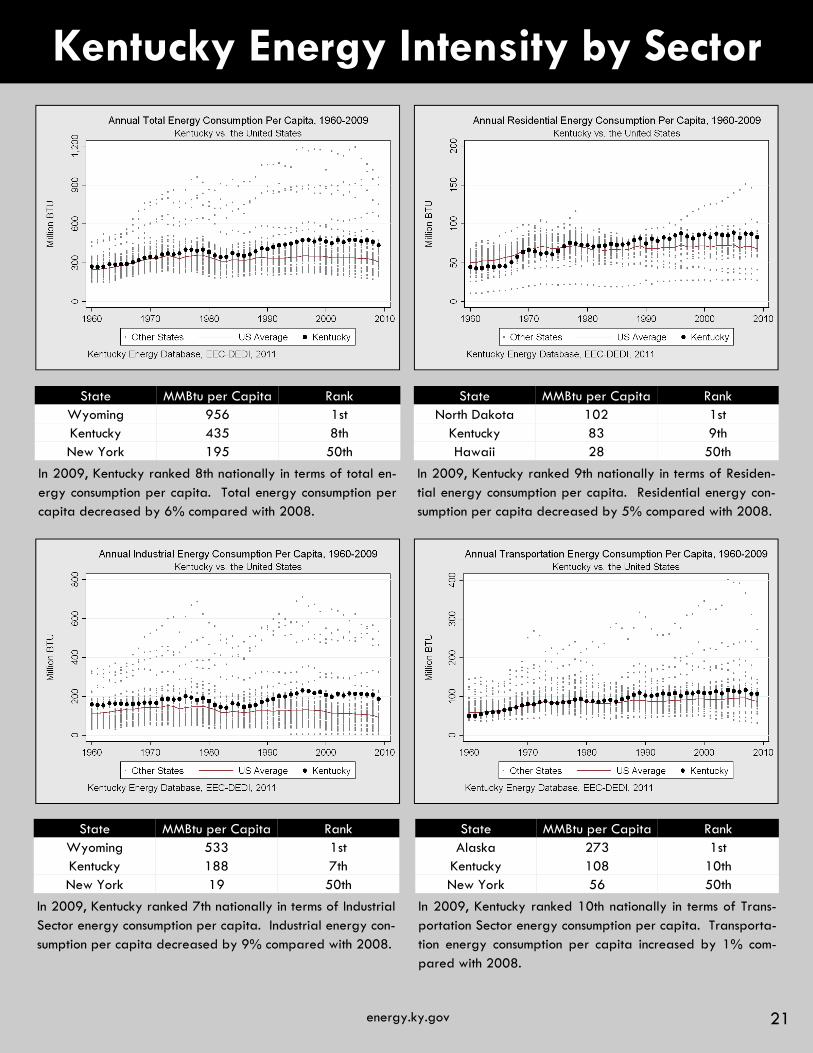
In 2009, Kentucky ranked 8th nationally in terms of total en-ergy consumption per capita. Total energy consumption per capita decreased by 6% compared with 2008.
In 2009, Kentucky ranked 9th nationally in terms of Residen-tial energy consumption per capita. Residential energy con-sumption per capita decreased by 5% compared with 2008.
In 2009, Kentucky ranked 10th nationally in terms of Trans-portation Sector energy consumption per capita. Transporta-tion energy consumption per capita increased by 1% com-pared with 2008.
In 2009, Kentucky ranked 7th nationally in terms of Industrial Sector energy consumption per capita. Industrial energy con-sumption per capita decreased by 9% compared with 2008.
22 22 energy.ky.gov
Kentucky Energy Intensity by Sector
State Btu / $ US GDP Rank Louisiana 15,894 1st Kentucky 11,794 5th
Connecticut 3,411 50th
State Btu / $ US GDP Rank Alaska 4,103 1st
Kentucky 2,923 5th New York 928 50th
State Btu / $ US GDP Rank Louisiana 9,817 1st Kentucky 5,097 5th New York 329 50th
State Btu / $ US GDP Rank Montana 2,124 1st Kentucky 1,523 17th Hawaii 623 50th
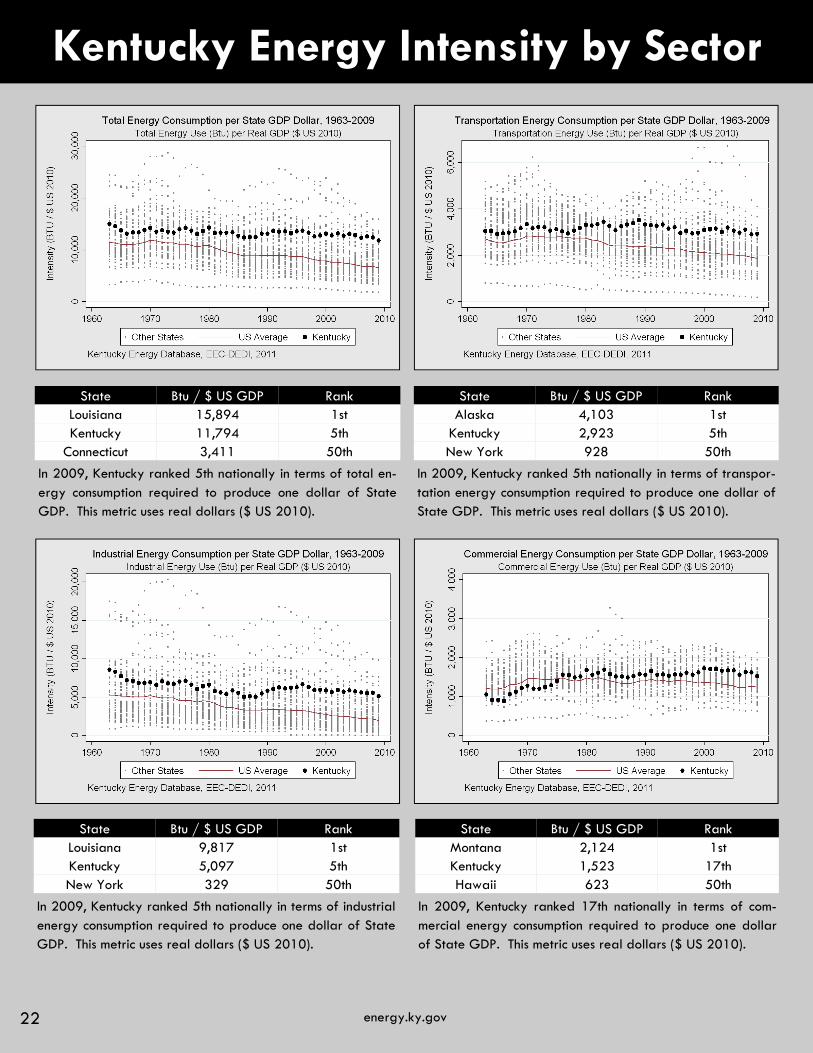
In 2009, Kentucky ranked 5th nationally in terms of total en-ergy consumption required to produce one dollar of State GDP. This metric uses real dollars ($ US 2010).
In 2009, Kentucky ranked 5th nationally in terms of transpor-tation energy consumption required to produce one dollar of State GDP. This metric uses real dollars ($ US 2010).
In 2009, Kentucky ranked 17th nationally in terms of com-mercial energy consumption required to produce one dollar of State GDP. This metric uses real dollars ($ US 2010).
In 2009, Kentucky ranked 5th nationally in terms of industrial energy consumption required to produce one dollar of State GDP. This metric uses real dollars ($ US 2010).

energy.ky.gov 23
Kentucky Electricity Consumption
Fuel Type Gigawatt Hours Percentage
Total 98,218 100%
Coal 91,054 92%
Hydro 2,580 3% Petroleum 2,285 2%
Natural Gas 1,841 2%
Wood & Biomass 458 >1%
Sector Gigawatt Hours Percentage Total 93,608 100%
Industrial 45,332 48%
Residential 28,887 31% Commercial 19,389 21%
In 2010, the Commonwealth of Kentucky consumed over 93,608 Gigawatt-hours of electricity. This amount reflected a 5% increase in electricity consumption compared with 2009. The Industrial Sector of Kentucky was by far the larg-est consumer of electricity, accounting for nearly half of total electricity consumption. The Residential Sector was the next largest consumer of electricity, representing 31% of total consumption. The Commercial Sector constituted the remain-ing 21% of total electricity consumption in 2010.
In 2010, electric power facilities in Kentucky generated over 98,218 Gigawatt-hours of electricity. Of this amount, over 92% of the electricity generated in Kentucky was derived through the combustion of coal. Hydroelectric facilities were the next largest source of electricity, supplying approxi-mately 3% of total generation. Petroleum products and natural gas fueled the remaining 4% of electricity genera-tion in 2010. (Wood and biomass products represented less than 1% of electricity generation in 2010).
*This section includes the most recent data on electricity consumption by sector. A longer time lag exists in reporting data on electricity generation by fuel type. This lag explains the difference in reporting years between these two measurements.
24 24 energy.ky.gov
Kentucky Electricity Consumption
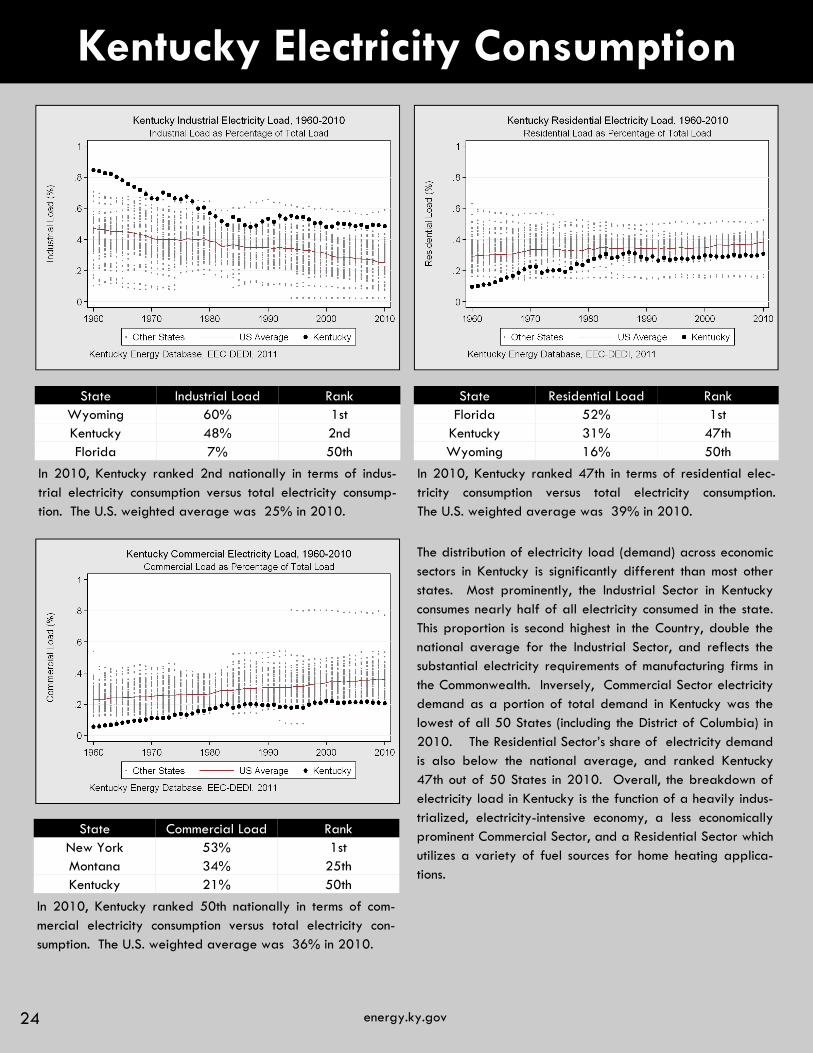
State Industrial Load Rank Wyoming 60% 1st Kentucky 48% 2nd Florida 7% 50th
State Residential Load Rank Florida 52% 1st
Kentucky 31% 47th Wyoming 16% 50th
State Commercial Load Rank New York 53% 1st Montana 34% 25th Kentucky 21% 50th
In 2010, Kentucky ranked 2nd nationally in terms of indus-trial electricity consumption versus total electricity consump-tion. The U.S. weighted average was 25% in 2010.
In 2010, Kentucky ranked 47th in terms of residential elec-tricity consumption versus total electricity consumption. The U.S. weighted average was 39% in 2010.
In 2010, Kentucky ranked 50th nationally in terms of com-mercial electricity consumption versus total electricity con-sumption. The U.S. weighted average was 36% in 2010.
The distribution of electricity load (demand) across economic sectors in Kentucky is significantly different than most other states. Most prominently, the Industrial Sector in Kentucky consumes nearly half of all electricity consumed in the state. This proportion is second highest in the Country, double the national average for the Industrial Sector, and reflects the substantial electricity requirements of manufacturing firms in the Commonwealth. Inversely, Commercial Sector electricity demand as a portion of total demand in Kentucky was the lowest of all 50 States (including the District of Columbia) in 2010. The Residential Sector’s share of electricity demand is also below the national average, and ranked Kentucky 47th out of 50 States in 2010. Overall, the breakdown of electricity load in Kentucky is the function of a heavily indus-trialized, electricity-intensive economy, a less economically prominent Commercial Sector, and a Residential Sector which utilizes a variety of fuel sources for home heating applica-tions.
energy.ky.gov 25
Kentucky Electricity Consumption
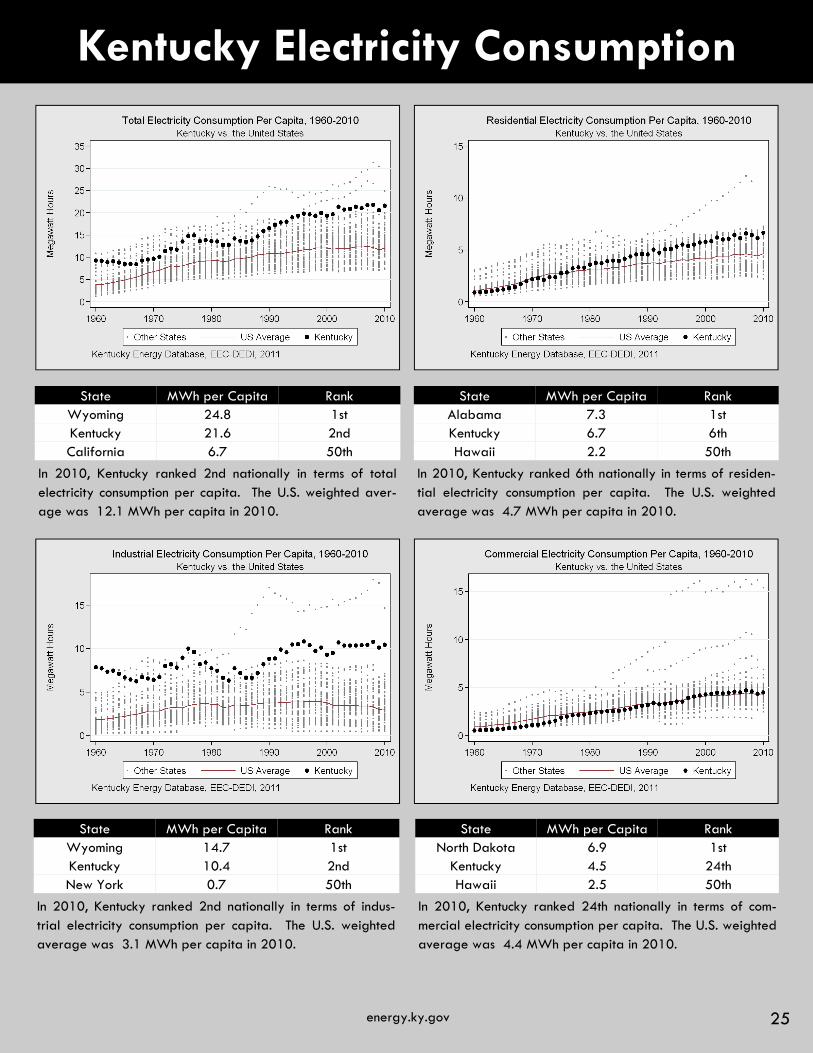
State MWh per Capita Rank Wyoming 24.8 1st Kentucky 21.6 2nd California 6.7 50th
State MWh per Capita Rank Alabama 7.3 1st Kentucky 6.7 6th Hawaii 2.2 50th
State MWh per Capita Rank Wyoming 14.7 1st Kentucky 10.4 2nd New York 0.7 50th
State MWh per Capita Rank North Dakota 6.9 1st
Kentucky 4.5 24th Hawaii 2.5 50th
In 2010, Kentucky ranked 2nd nationally in terms of total electricity consumption per capita. The U.S. weighted aver-age was 12.1 MWh per capita in 2010.
In 2010, Kentucky ranked 6th nationally in terms of residen-tial electricity consumption per capita. The U.S. weighted average was 4.7 MWh per capita in 2010.
In 2010, Kentucky ranked 24th nationally in terms of com-mercial electricity consumption per capita. The U.S. weighted average was 4.4 MWh per capita in 2010.
In 2010, Kentucky ranked 2nd nationally in terms of indus-trial electricity consumption per capita. The U.S. weighted average was 3.1 MWh per capita in 2010.
26 26 energy.ky.gov
Kentucky Electricity Consumption
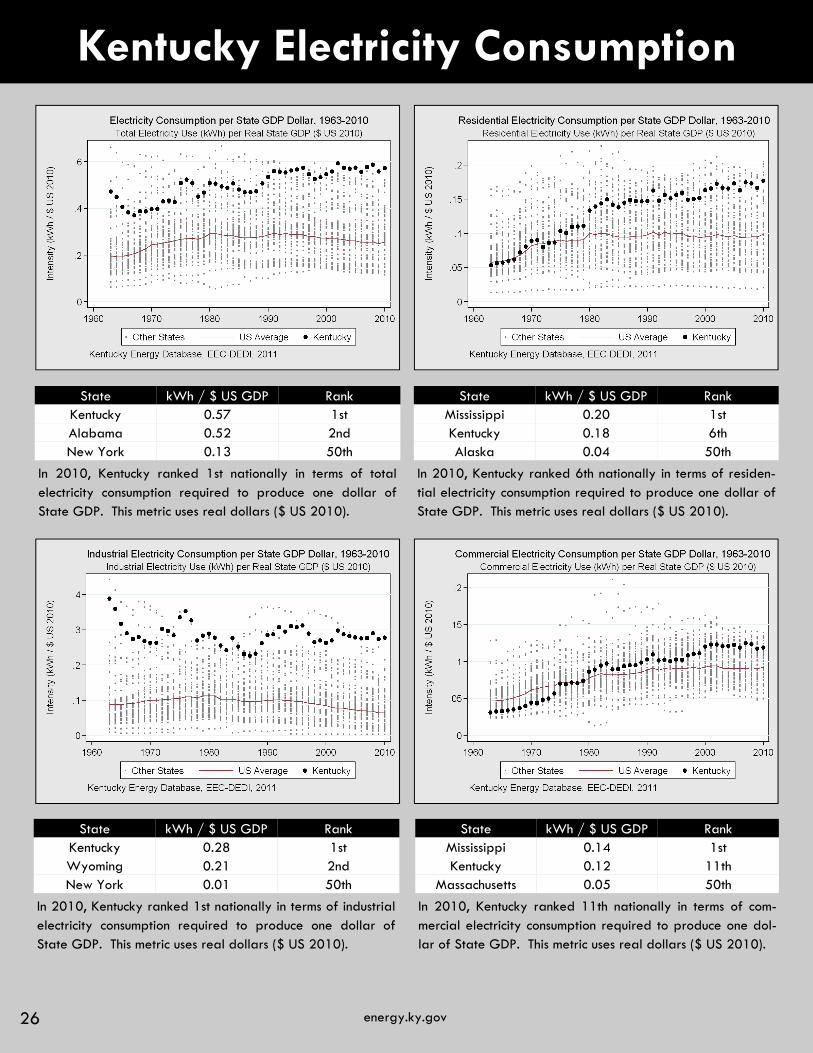
State kWh / $ US GDP Rank Kentucky 0.57 1st Alabama 0.52 2nd New York 0.13 50th
State kWh / $ US GDP Rank Mississippi 0.20 1st Kentucky 0.18 6th Alaska 0.04 50th
State kWh / $ US GDP Rank Kentucky 0.28 1st Wyoming 0.21 2nd New York 0.01 50th
State kWh / $ US GDP Rank Mississippi 0.14 1st Kentucky 0.12 11th
Massachusetts 0.05 50th
In 2010, Kentucky ranked 1st nationally in terms of total electricity consumption required to produce one dollar of State GDP. This metric uses real dollars ($ US 2010).
In 2010, Kentucky ranked 6th nationally in terms of residen-tial electricity consumption required to produce one dollar of State GDP. This metric uses real dollars ($ US 2010).
In 2010, Kentucky ranked 11th nationally in terms of com-mercial electricity consumption required to produce one dol-lar of State GDP. This metric uses real dollars ($ US 2010).
In 2010, Kentucky ranked 1st nationally in terms of industrial electricity consumption required to produce one dollar of State GDP. This metric uses real dollars ($ US 2010).

energy.ky.gov 27
Kentucky Coal Consumption
Origin of Coal Thousand Tons Percentage Total 40,148 100%
Western Kentucky 22,055 55%
Imports 13,648 34% Eastern Kentucky 4,444 11%
Sector Thousand Tons Percentage Total 40,992 100%
Electric Power 39,271 96%
Industrial 1,673 4%
Kentucky consumed 40,992,300 tons of coal in 2009, which
represented an 8% decrease in total coal consumption from
2008. The electric power sector consumed the super major-
ity of this amount, accounting for 96% of total coal consump-
tion in 2009. The industrial sector accounted for the remain-
ing 4% of coal consumption, with the commercial and resi-
dential sectors consuming negligible amounts of coal.
In 2010, the Commonwealth of Kentucky consumed
40,148,000 tons of coal.* This amount reflected a 13% de-
cline in total coal consumption, compared with 2009. West-
ern Kentucky supplied the majority (55%) of coal consumed
in Kentucky in 2010, followed by imported coal (34%) from
eight different states, and Eastern Kentucky coal (11%).
* Total coal consumption numbers for 2010 are likely to be revised, fol-lowing updated federal reporting which combines steam coal and metal-lurgical coal usage for the year. The current total for 2010 reflects steam coal consumption by electric power facilities in Kentucky.
* A time lag exists in reporting total coal consumption by economic sector versus the adjacent data which tracks coal consumption by coalmine state of origin.

28 28 energy.ky.gov
Kentucky Coal Imports
Origin of Coal Thousand Tons Percentage Total 40,148 100%
Total Imports 13,648 34%
Exporting States No. of States Year
Total 8 2010
Origin of Coal Thousand Tons Percentage
Total 40,148 100%
Western Kentucky 22,055 55%
Eastern Kentucky 4,444 11%
Illinois 3,401 9% West Virginia 3,064 8%
Ohio 2,177 5%
Colorado 2,123 5%
Wyoming 1,565 4%
Indiana 1,003 3%
Utah 308 <1%
Tennessee 9 <1%
The Commonwealth of Kentucky imported 13,648,000 tons of coal for the generation of electricity in 2010. Originating in eight different states, this amount represented an increase of slightly less than 1% in coal imports from 2009. As a por-tion of statewide coal deliveries, imported coal represented 34% of all coal delivered in Kentucky in 2010. This propor-tion remained effectively constant, compared with the previ-ous year.
The market variables influencing the importation of coal into Kentucky focus primarily on price, heat content of a particu-lar coal, and the sulfur content of a particular coal. For elec-trical power generation, electric utilities and electric power producers must balance concern for these variables when purchasing coal. As a result, electric utilities, municipalities, and power producers elect to blend coal from in-state and out-of-state sources so as to maintain a diversified fuel re-source while complying with environmental regulations. Since 1990, electric generation in Kentucky has increasingly util-ized higher sulfur coal which can be attributed to the installa-tion of sulfur dioxide scrubbers on coal-fired generators throughout the state. Additionally, the relatively low price of coal from several Western States has also increased imports for electric power generation.

energy.ky.gov 29
Kentucky Natural Gas Consumption
Sector Million Cubic Feet Percentage Total 206,534 100%
Industrial 98,611 48%
Residential 51,615 25% Commercial 35,439 17%
Transportation* 12,470 6%
Electric Power 8,399 4%
In 2009, the Commonwealth of Kentucky consumed 206,534 million cubic feet of natural gas, representing an 8% decline in
statewide consumption compared with 2008. The Industrial Sector was by far the largest consumer of natural gas, accounting
for 48% of total consumption. The Residential Sector was the next largest consumer of natural gas with 25% of consumption,
followed by the Commercial Sector with 17% of consumption. The Transportation Sector represented 6% of consumption, with
the Electric Power Sector representing the remaining 4% of consumption.
In the Commercial and Residential sectors natural gas is combusted to generate heat, with consumption following a seasonal
pattern and notable fluctuation due to weather. In the Industrial Sector, however, natural gas is used as a process feed stock
in manufacturing operations in addition to its heating applications. As a result, Industrial Sector natural gas consumption is
more consistent throughout the year, while the quantity and magnitude of natural gas consumption is reflective of the size and
type of industrial firms within Kentucky.
*Natural Gas consumption by the Transportation Sector is the summation of vehicle fuel usage and natural gas utilized in the movement of natural gas resources through transmission and distribution pipelines. In Kentucky in 2009, direct vehicle fuel usage of natural gas was approximately 8 MMcf. The remainder (12,462 MMcf) was consumed as natural gas pipeline fuel.
30 30 energy.ky.gov
Kentucky Liquid Fuel Consumption
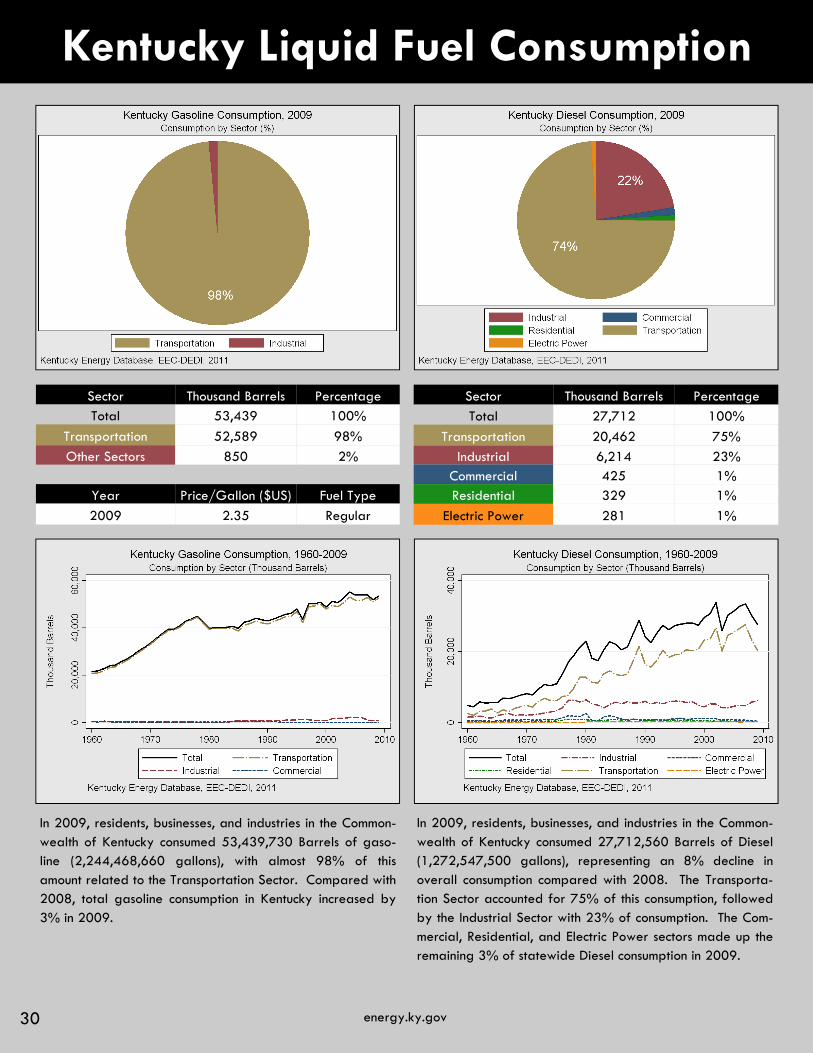
Sector Thousand Barrels Percentage
Total 27,712 100%
Transportation 20,462 75%
Industrial 6,214 23% Commercial 425 1% Residential 329 1%
Electric Power 281 1%
Sector Thousand Barrels Percentage Total 53,439 100%
Transportation 52,589 98%
Other Sectors 850 2%
Year Price/Gallon ($US) Fuel Type
2009 2.35 Regular
In 2009, residents, businesses, and industries in the Common-wealth of Kentucky consumed 53,439,730 Barrels of gaso-line (2,244,468,660 gallons), with almost 98% of this amount related to the Transportation Sector. Compared with 2008, total gasoline consumption in Kentucky increased by 3% in 2009.
In 2009, residents, businesses, and industries in the Common-wealth of Kentucky consumed 27,712,560 Barrels of Diesel (1,272,547,500 gallons), representing an 8% decline in overall consumption compared with 2008. The Transporta-tion Sector accounted for 75% of this consumption, followed by the Industrial Sector with 23% of consumption. The Com-mercial, Residential, and Electric Power sectors made up the remaining 3% of statewide Diesel consumption in 2009.
energy.ky.gov 31
Kentucky Liquid Fuel Consumption
Sector Thousand Barrels Percentage
Total 142 100%
Residential 114 80%
Industrial 22 15%
Commercial 6 5%
Sector Thousand Barrels Percentage Total 8,602 100%
Industrial 5,611 65%
Residential 2,536 29% Commercial 366 4%
Transportation 89 1%
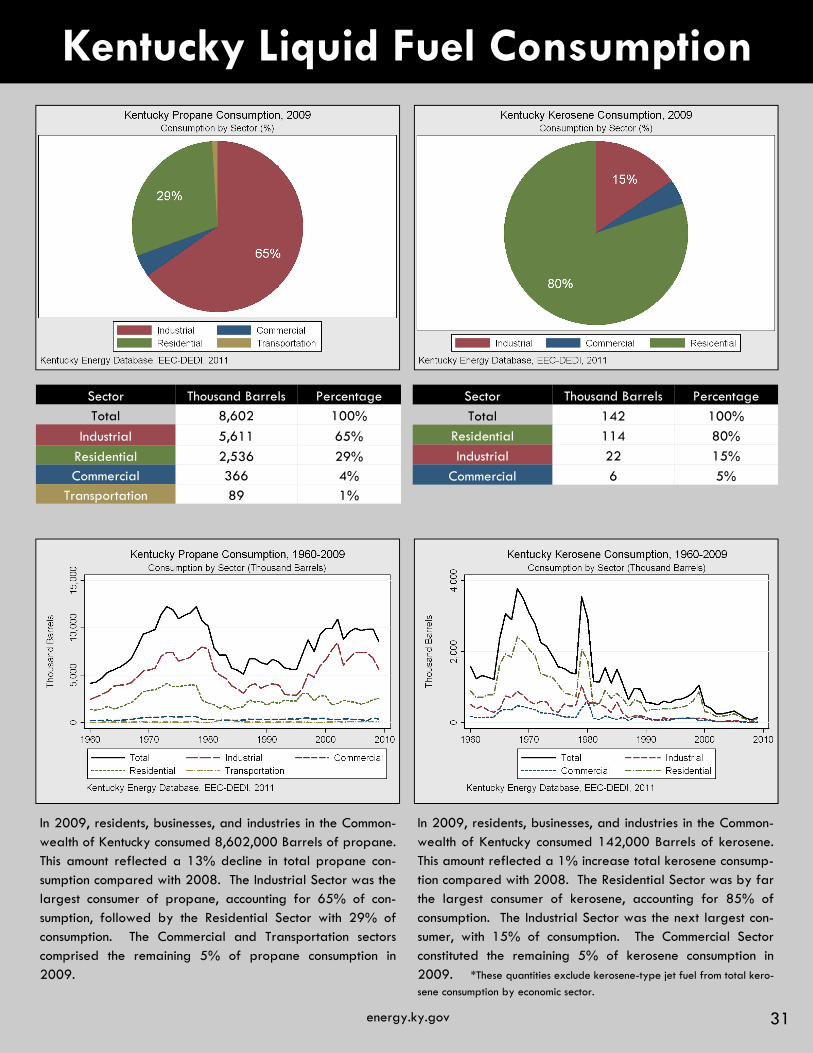
In 2009, residents, businesses, and industries in the Common-wealth of Kentucky consumed 8,602,000 Barrels of propane. This amount reflected a 13% decline in total propane con-sumption compared with 2008. The Industrial Sector was the largest consumer of propane, accounting for 65% of con-sumption, followed by the Residential Sector with 29% of consumption. The Commercial and Transportation sectors comprised the remaining 5% of propane consumption in 2009.
In 2009, residents, businesses, and industries in the Common-wealth of Kentucky consumed 142,000 Barrels of kerosene. This amount reflected a 1% increase total kerosene consump-tion compared with 2008. The Residential Sector was by far the largest consumer of kerosene, accounting for 85% of consumption. The Industrial Sector was the next largest con-sumer, with 15% of consumption. The Commercial Sector constituted the remaining 5% of kerosene consumption in 2009. *These quantities exclude kerosene-type jet fuel from total kero-
sene consumption by economic sector.

32 32 energy.ky.gov
energy.ky.gov 33
Energy Production
Description:
Energy production is the process of mining, collecting, or cultivating an energy resource that can be harnessed or converted into a more useful form of energy such as heat, steam, locomotion, or electric-ity. Energy production is based on naturally occurring or man-made resources such as coal, natural gas, crude oil, and renewable sources (hydroelectric power, biomass, etc.). Consequently, it is of great interest to measure and understand the reality and magnitude of energy production within Kentucky, as this dy-namic powerfully influences both the energy security and economic security of the Commonwealth.
Accounting:
For the purposes of standardized measurement and accounting, energy production within the Commonwealth is quantified by converting all supplies of energy into a British Thermal Unit (BTU) value. Though more widely used physical measurements may be included to reflect production of a particular energy resource, this conversion is necessary to form a balanced comparison of production across energy supplies. Subsequently, a general understanding of the significance of a specific energy resource and its related production can be developed.
Summary:
In 2009, the Commonwealth of Kentucky produced 2.8 Quadrillion BTU of energy. Compared with an energy consumption total of 1.8 Quadrillion BTU for the same year, this production total made Kentucky a net exporter of energy supplies. The super majority of energy exports from the Common-wealth were related to the export and sale of coal mined in Kentucky. Overall, total energy production in the State decreased by 10%, compared with 2008.
In an aggregate comparison of energy production, coal by far remained the Commonwealth’s primary source of energy production. Ranking third nationally, Kentucky produced over 107 million tons of coal in 2009 (of which 70% was exported to one of 20 different States). This amount equated to 2.6 Quadrillion BTU, or approximately 93% of total energy production in the Commonwealth. The suprem-acy of coal for energy production in Kentucky for 2009 follows long standing historical trends, and is unlikely to change in the near term.
Other forms of energy production within Kentucky in 2009 included the extraction of crude oil and natural gas, as well as the collection and/or cultivation of renewable energy resources. The produc-tion of these resources comprised the remaining 7% of total energy production in the State. Natural gas production was the leader of this group, accounting for 0.12 Quadrillion BTU, or approximately 4% of Kentucky’s total energy production. Renewable resources, such as hydroelectric power, wood products, ethanol, and geothermal sources, constituted approximately 2% of statewide energy production. Crude oil production, which has remained effectively stable at around 2.5 million barrels a year, generated 0.01 Quadrillion BTU of energy in 2009, or less than 1% of Kentucky’s total energy production.
34 34 energy.ky.gov
Kentucky Total Energy Production
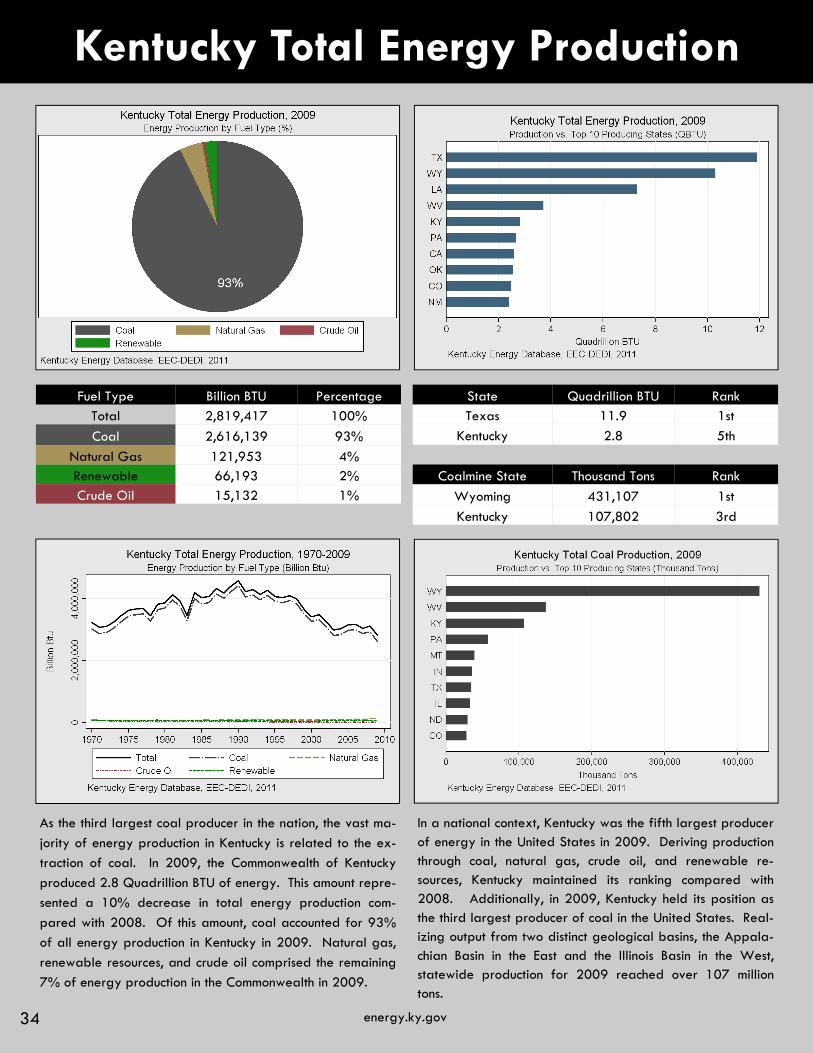
Fuel Type Billion BTU Percentage Total 2,819,417 100%
Coal 2,616,139 93%
Natural Gas 121,953 4% Renewable 66,193 2% Crude Oil 15,132 1%
State Quadrillion BTU Rank Texas 11.9 1st
Kentucky 2.8 5th
Coalmine State Thousand Tons Rank
Wyoming 431,107 1st
Kentucky 107,802 3rd
As the third largest coal producer in the nation, the vast ma-
jority of energy production in Kentucky is related to the ex-
traction of coal. In 2009, the Commonwealth of Kentucky
produced 2.8 Quadrillion BTU of energy. This amount repre-
sented a 10% decrease in total energy production com-
pared with 2008. Of this amount, coal accounted for 93%
of all energy production in Kentucky in 2009. Natural gas,
renewable resources, and crude oil comprised the remaining
7% of energy production in the Commonwealth in 2009.
In a national context, Kentucky was the fifth largest producer of energy in the United States in 2009. Deriving production through coal, natural gas, crude oil, and renewable re-sources, Kentucky maintained its ranking compared with 2008. Additionally, in 2009, Kentucky held its position as the third largest producer of coal in the United States. Real-izing output from two distinct geological basins, the Appala-chian Basin in the East and the Illinois Basin in the West, statewide production for 2009 reached over 107 million tons.

energy.ky.gov 35
Kentucky Renewable Energy
Fuel Type Gigawatt Hours Percentage
Total 3,038 100%
Hydroelectric* 2,580 85%
Wood & Biomass 458 15%
Fuel Type Billion BTU Percentage
Total 66,193 100%
Hydroelectric* 32,380 50%
Wood & Biomass 26,552 41% Ethanol 2,947 5%
Geothermal 2,258 4%
Losses in Production 2,056 -
*Hydroelectric generation is directly accounted through Gigawatt-hour consumption, whereas hydroelectric production (Billion BTU) is a calculated fossil fuel displacement conversion. This conversion represents the amount of fossil fuel energy required to generate an equal amount of electricity.
In 2009, Kentucky produced 0.06 Quadrillion BTU of energy from renewable resources. This amount reflected a 15% increase in renewable energy production compared with 2008. Of available renewable energy resources, hydroe-lectric power and wood products were the largest contribu-tors to renewable energy production. In 2009, hydroelectric facilities produced 50% of renewable energy in Kentucky, while wood and biomass resources accounted for 41% of renewable energy production. Fuel ethanol production and geothermal energy systems accounted for the remaining 6% of renewable energy production in 2009.
In Kentucky, electricity generation from renewable energy sources primarily involves hydroelectric power. The amount of electricity that is generated from hydroelectric dams in Kentucky fluctuates annually due to varying levels of precipi-tation, temperature, and electricity demand. In 2010, re-newable energy resources generated 3,038 Gigawatt-hours of electricity. This amount represented a 23% decrease in renewable electricity generation compared with 2009. Of this amount, hydroelectric power accounted for 85% of re-newable electricity generation, followed by wood and bio-mass resources with 15% of renewable generation.

36 36 energy.ky.gov
Kentucky Natural Gas Production
Production Million Cubic Feet Rank
U.S.A 22,568,863 1
Kentucky 135,147 17
The Commonwealth of Kentucky produced 135,147 Million
cubic feet of natural gas in 2010. This amount represented
a 19% increase in total natural gas production compared
with 2009. As reflected in the map of Kentucky Natural Gas
Production, the preponderance of natural gas is located and
extracted in Eastern Kentucky. Though statewide natural gas
production is projected to increase substantially, in a national
context, gas production in Kentucky contributes to less than
1% of total U.S. production.
energy.ky.gov 37
Kentucky Crude Oil Production
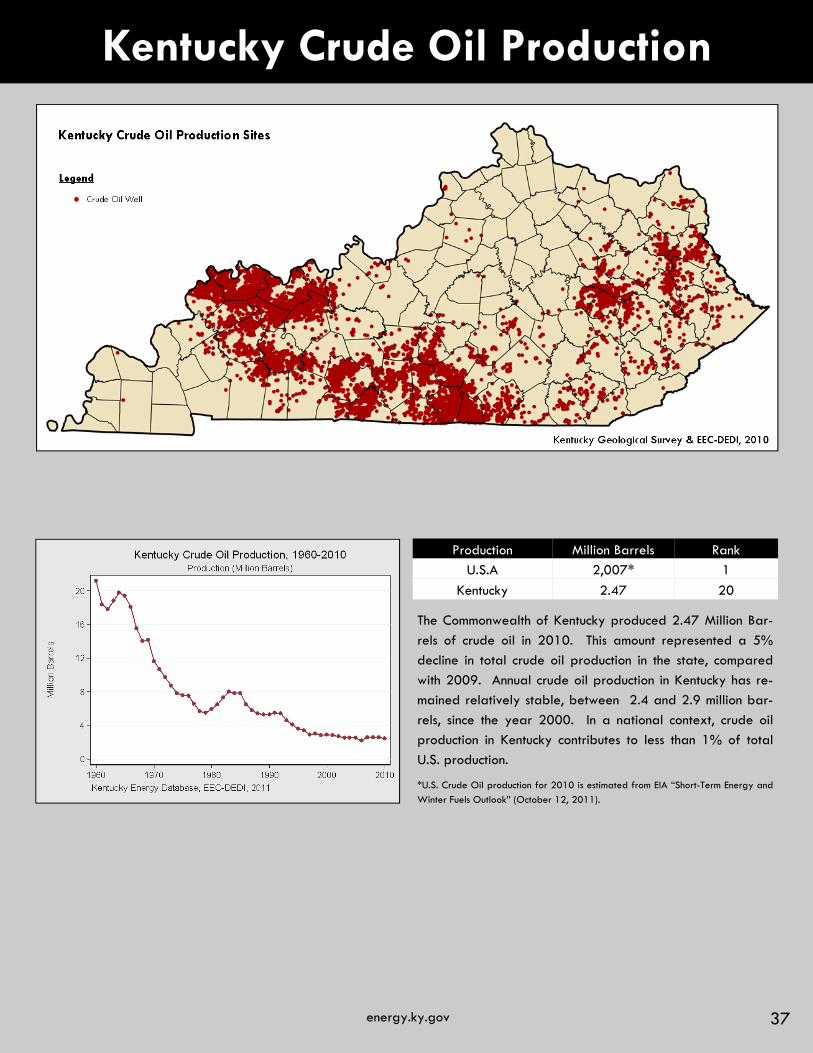
Production Million Barrels Rank
U.S.A 2,007* 1
Kentucky 2.47 20
The Commonwealth of Kentucky produced 2.47 Million Bar-
rels of crude oil in 2010. This amount represented a 5%
decline in total crude oil production in the state, compared
with 2009. Annual crude oil production in Kentucky has re-
mained relatively stable, between 2.4 and 2.9 million bar-
rels, since the year 2000. In a national context, crude oil
production in Kentucky contributes to less than 1% of total
U.S. production.
*U.S. Crude Oil production for 2010 is estimated from EIA “Short-Term Energy and
Winter Fuels Outlook” (October 12, 2011).

38 38 energy.ky.gov
Kentucky Coal Production
Of the 120 counties of the Commonwealth of Kentucky, 25 counties reported coal production in 2010. Coal production was dispersed between the Central Appalachian Basin of Eastern Kentucky and the Illinois Basin of Western Kentucky, and totaled 105,007,300 tons. Compared with 2009, total coal production in 2010 fell by 3% and saw four fewer counties register pro-duction for the year. Overall, coal production was substantially lead by the counties of Eastern Kentucky, which is consistent with historical output levels.
County Production (Tons) Percentage
Total 105,007,300 100%
Pike 15,800,000 15%
Perry 14,200,000 14%
Harlan 10,500,000 10%
Union 10,300,000 10%
Hopkins 9,237,887 9%
Webster 5,871,517 6%
Martin 5,228,615 5%
Knott 5,058,867 5%
Muhlenberg 4,599,013 4%
Ohio 4,158,758 4%
Letcher 3,979,372 4%
Leslie 3,684,544 4%
Magoffin 2,710,662 3%
Henderson 2,332,566 2%
County Production (Tons) Percentage
Bell 2,185,176 2%
Floyd 2,057,758 2%
Breathitt 1,044,506 1%
Knox 499,285 <1%
Clay 488,874 <1%
Daviess 373,954 <1%
Whitley 352,760 <1%
Lawrence 158,896 <1%
Johnson 156,849 <1%
Jackson 27,462 <1%
Owsley 4,363 <1%
energy.ky.gov 39
Kentucky Coal Production
Mine Type Thousand Tons Percentage
Total 105,007 100%
Underground 63,780 61%
Surface 40,617 39%
Region Thousand Tons Percentage Total 105,007 100%
Eastern Kentucky 68,112 65%
Western Kentucky 36,896 35%
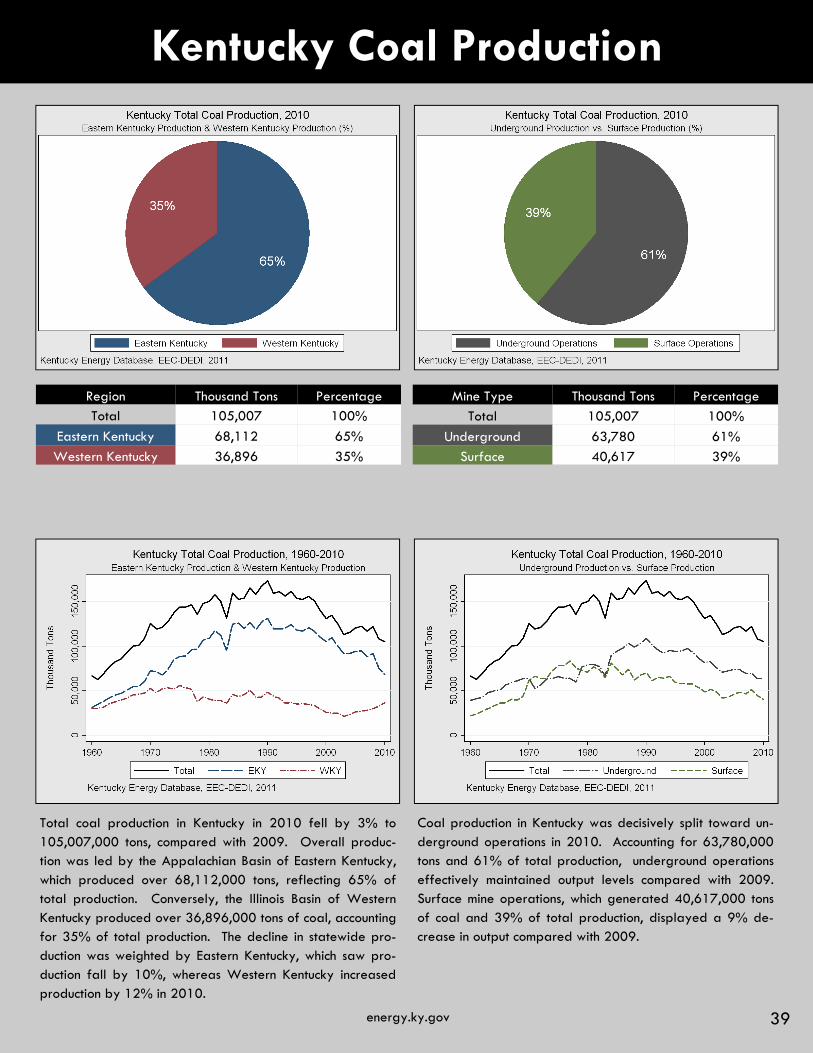
Total coal production in Kentucky in 2010 fell by 3% to 105,007,000 tons, compared with 2009. Overall produc-tion was led by the Appalachian Basin of Eastern Kentucky, which produced over 68,112,000 tons, reflecting 65% of total production. Conversely, the Illinois Basin of Western Kentucky produced over 36,896,000 tons of coal, accounting for 35% of total production. The decline in statewide pro-duction was weighted by Eastern Kentucky, which saw pro-duction fall by 10%, whereas Western Kentucky increased production by 12% in 2010.
Coal production in Kentucky was decisively split toward un-derground operations in 2010. Accounting for 63,780,000 tons and 61% of total production, underground operations effectively maintained output levels compared with 2009. Surface mine operations, which generated 40,617,000 tons of coal and 39% of total production, displayed a 9% de-crease in output compared with 2009.
40 40 energy.ky.gov
Eastern Kentucky Coal Production
Production Thousand Tons Percentage
Total 68,112 100%
Exported Production* 57,071 84%
In-State Consumption 4,444 7% Industrial/Unknown 6,597 10%
Mine Type Thousand Tons Percentage Total 68,112 100%
Underground 34,320 50%
Surface 33,638 50%
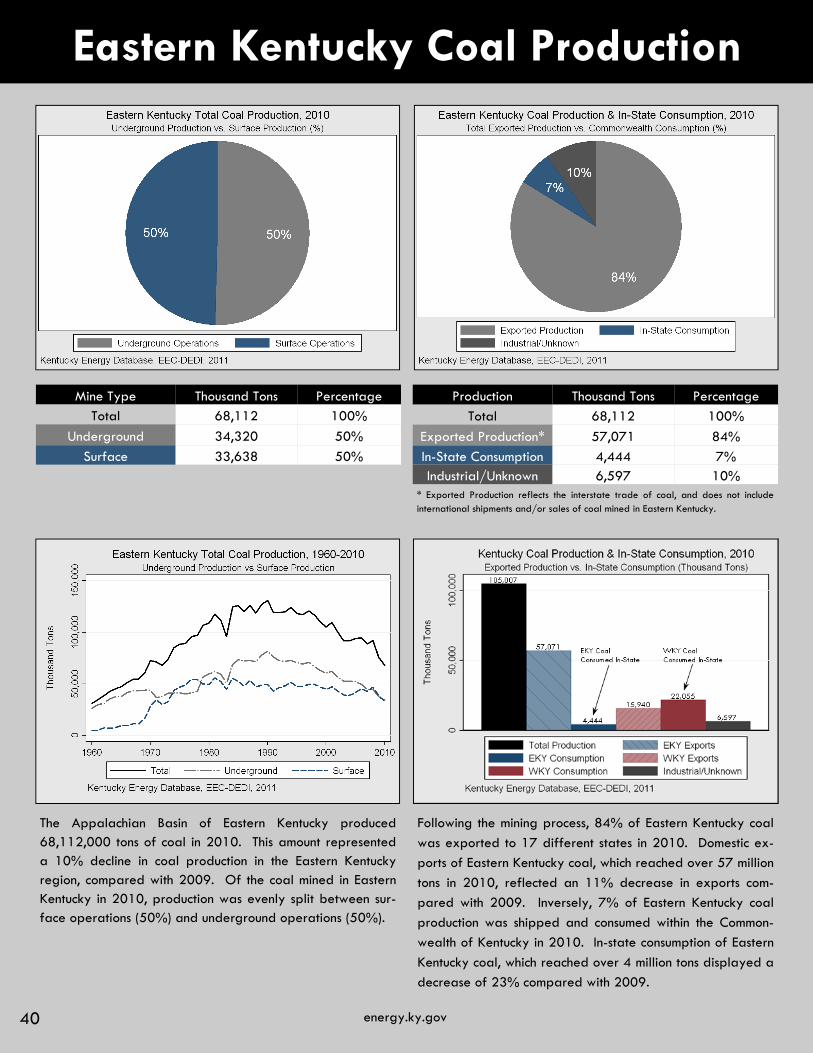
The Appalachian Basin of Eastern Kentucky produced 68,112,000 tons of coal in 2010. This amount represented a 10% decline in coal production in the Eastern Kentucky region, compared with 2009. Of the coal mined in Eastern Kentucky in 2010, production was evenly split between sur-face operations (50%) and underground operations (50%).
Following the mining process, 84% of Eastern Kentucky coal
was exported to 17 different states in 2010. Domestic ex-
ports of Eastern Kentucky coal, which reached over 57 million
tons in 2010, reflected an 11% decrease in exports com-
pared with 2009. Inversely, 7% of Eastern Kentucky coal
production was shipped and consumed within the Common-
wealth of Kentucky in 2010. In-state consumption of Eastern
Kentucky coal, which reached over 4 million tons displayed a
decrease of 23% compared with 2009.
* Exported Production reflects the interstate trade of coal, and does not include international shipments and/or sales of coal mined in Eastern Kentucky.

energy.ky.gov 41
Western Kentucky Coal Production
Production Thousand Tons Percentage
Total 36,896 100%
In-State Consumption 22,055 58%
Exported Production* 15,940 42%
Mine Type Thousand Tons Percentage Total 36,896 100%
Underground 29,550 81%
Surface 6,979 19%
The Illinois Basin of Western Kentucky produced 36,896,000 tons of coal in 2010. This amount represented a 12% in-crease in coal production in the Western Kentucky region, compared with 2009. Of the coal mined in Western Ken-tucky in 2010, underground operations comprised 81% of total production while surface operations accounted for the remaining 20% of production.
Following the mining process, 42% of Western Kentucky coal
was exported to 8 different States in 2010. Domestic ex-
ports of Western Kentucky coal, which reached nearly 16
million tons in 2010, reflected a 65% increase in exports
compared with 2009. Inversely, 58% of Western Kentucky
coal production was shipped and consumed within the Com-
monwealth of Kentucky in 2010. In-state consumption of
Western Kentucky coal, which reached over 22 million tons,
also displayed an increase of 37% compared with 2009.
* Exported Production reflects the interstate trade of coal, and does not include international shipments and/or sales of coal mined in Western Kentucky.

42 42 energy.ky.gov
Kentucky Coal Exports
Importing State Thousand Tons Percentage
Total 15,940 100%
Florida 6,401 41%
Tennessee 2,634 17%
Alabama 2,615 17%
Ohio 1,717 11%
Indiana 918 6%
West Virginia 706 4%
Pennsylvania 601 4%
Illinois 167 1%
Importing State Thousand Tons Percentage
Total 57,071 100%
South Carolina 12,642 22%
Georgia 12,511 22%
North Carolina 8,885 16%
Florida 5,647 10%
Virginia 4,540 8%
Michigan 4,407 8%
Tennessee 2,841 5%
Ohio 1,962 3%
West Virginia 1,033 2%
Maryland 897 2%
Indiana 637 1%
Alabama 435 1%
Delaware 312 1%
Mississippi 171 <1%
New York 82 <1%
Wisconsin 31 <1%
Connecticut 24 <1%
Coal Field Thousand Tons Percentage
Total Exports 73,011 100%
Eastern Kentucky 57,071 78%
Western Kentucky 15,940 22%
Importing States Western Kentucky Eastern Kentucky
Total 8 17
In 2010, coal mined from the Illinois Basin in Western Ken-tucky was exported to 8 different States. The total amount of coal exported domestically from Western Kentucky reached over 15,940,000 tons, and represented a 65% in-crease in exports from this region compared with the previ-ous year of 2009. The States importing the largest amounts of Western Kentucky Coal in 2010 were Florida (43%), Ten-nessee (13%), Alabama (12%), and Ohio (17%). However, Kentucky remained by far the largest market for Western Kentucky coal in 2010.
In 2010, coal mined from the Appalachian Basin in Eastern Kentucky was exported to 17 different States. The total amount of coal exported domestically from Eastern Kentucky reached over 57,071,000 tons, and represented an 11% decline in exports from this region compared with the previ-ous year of 2009. The States importing the largest amounts of Eastern Kentucky Coal in 2010 were South Carolina (22%), Georgia (22%), North Carolina (16%), and Florida (10%).

energy.ky.gov 43
Electricity Service & Rates
Retail Service:
Electricity in Kentucky is provided to customers by one of the following types of entities, One:
Retail electric suppliers that are regulated by the Kentucky Public Service Commission (PSC); Two: Munici-
pally-owned utilities (MOUs); or Three: By the Tennessee Valley Authority (TVA) and its associated dis-
tributors within the Commonwealth. Furthermore, each electric supplier has the exclusive right to serve
the customers within its territory. (See maps on following pages.)
Electric suppliers that are regulated by the PSC fall into two categories: Investor Owned Utilities
and Rural Electric Cooperative Companies (RECCs). There are four investor-owned companies in Ken-
tucky: Duke Kentucky, Kentucky Power Company (aka. AEP), Kentucky Utilities, and LG&E. Each of these
companies generates or purchases the power required to meet its respective customers’ electricity de-
mands. There are 19 rural electric cooperatives that are regulated by the PSC. Sixteen of these jointly
own and purchase power from East Kentucky Power Cooperative. The remaining three jointly own and
purchase power from Big Rivers Electric Corporation. A “distribution” cooperative typically receives
power from its respective “generation and transmission” cooperative at a substation in the distributor’s
service territory.
There are five Rural Electric Cooperative Companies (RECCs) and ten municipal companies that
secure all of their electricity from TVA. These RECCs and municipalities then resell and distribute electric-
ity to customers within their service territories. Separately, TVA also serves several large industrial cus-
tomers within Kentucky directly.
Additionally, there are eighteen municipal electric suppliers that do not receive electricity from
TVA. These municipalities either self-generate electricity - by owning and/or operating generating facili-
ties - or purchase power from various sources. In the case of purchased power, a municipality may ne-
gotiate a guaranteed delivery of electricity from an investor owned utility or independent power pro-
ducer, or purchase electricity on the market for distribution within its service area.
Electricity Rates:
Retail electricity rates are set by either the PSC, the owner or board governing a municipal util-
ity, or TVA.* Rates are generally established to cover the operating expenses and the capital costs of
the utilities. Operating expenses typically include personnel costs, fuel costs, generation costs, and main-
tenance costs. Capital costs typically include the costs to construct facilities, environmental equipment, and
transmission lines, service the outstanding interest on debt, and earn a scheduled return on equity. The
particular authority that sets a rate is to ensure that these costs are fair, just, and reasonable.
*The Tennessee Valley Authority sets the wholesale rate for electricity supplied to its distributors, and approves the distributors’ retail rate.
44 44 energy.ky.gov
Electricity Generation Infrastructure
Capacity
There is approximately 19.9 Gigawatts of electric generating capacity in Kentucky. Capacity is
the maximum amount of electricity that can be produced at one moment in time. Of total capacity, ap-
proximately 14.3 Gigawatts (72%) of this capacity is coal fired, 4.7 Gigawatts (24%) is gas or petro-
leum fired, 0.8 GW (4%) is hydro power, and .06 GW (>1%) is other renewable generation capacity.
Generation
In 2010 there were 98,218 Gigawatt-hours of electricity (electric energy) produced in Ken-
tucky. This total represented an 8% increase in total generation, compared with 2009. Ninety-two per-
cent of this generation was produced by coal combustion, 3% from hydroelectric generation, 2% from
petroleum and natural gas combustion respectively, and less than 1% from other renewable sources.
The variation between the percentage of capacity and electricity (electric energy) produced by
the various energy sources is created because some types of generating plants operate more hours dur-
ing the year than others. Coal plants are “base load” units which typically run 24 hours per day, 365
days per year. Currently, the natural gas and petroleum units in Kentucky are “peaking units” and only
run when the demand for electricity is very high**. They function to rapidly increase or decrease electric-
ity production to match “peak” demand. Existing hydroelectric facilities and other renewable generating
units operate whenever their specific resource is available (which can be intermittent).
** There are natural gas combined cycle plants that are proposed to be built in Kentucky. These facilities would be considered base load plants
because they will run a high percentage of the time compared to existing peaking plants.
energy.ky.gov 45
Kentucky Electricity Generation
Fuel Type Gigawatt Hours Percentage
Total 98,218 100%
Coal 91,054 92%
Hydro 2,580 3% Petroleum 2,285 2%
Natural Gas 1,841 2%
Wood & Biomass 458 >1%
Primary Fuel Average Unit Age Average Unit Size
All Units 40 151 MW
Coal 42 300 MW
Natural Gas 17 112 MW Petroleum 49 38 MW
Hydro 68 27 MW
Biomass 9 1 MW
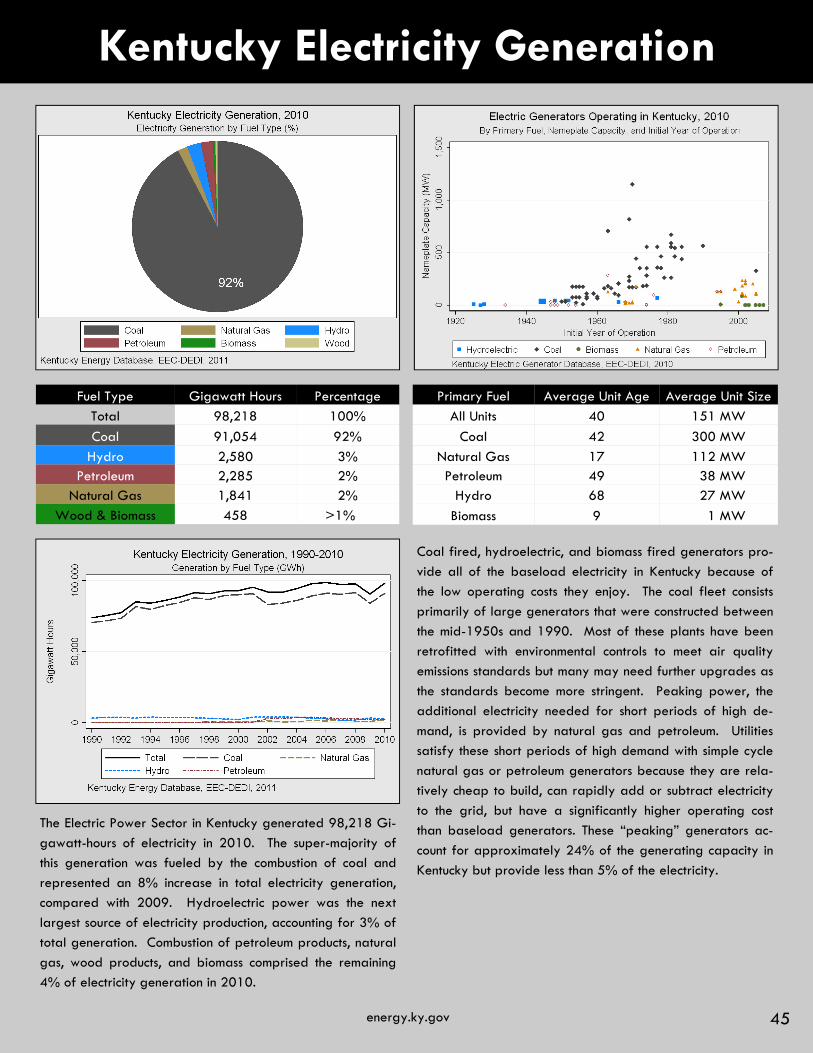
The Electric Power Sector in Kentucky generated 98,218 Gi-
gawatt-hours of electricity in 2010. The super-majority of
this generation was fueled by the combustion of coal and
represented an 8% increase in total electricity generation,
compared with 2009. Hydroelectric power was the next
largest source of electricity production, accounting for 3% of
total generation. Combustion of petroleum products, natural
gas, wood products, and biomass comprised the remaining
4% of electricity generation in 2010.
Coal fired, hydroelectric, and biomass fired generators pro-
vide all of the baseload electricity in Kentucky because of
the low operating costs they enjoy. The coal fleet consists
primarily of large generators that were constructed between
the mid-1950s and 1990. Most of these plants have been
retrofitted with environmental controls to meet air quality
emissions standards but many may need further upgrades as
the standards become more stringent. Peaking power, the
additional electricity needed for short periods of high de-
mand, is provided by natural gas and petroleum. Utilities
satisfy these short periods of high demand with simple cycle
natural gas or petroleum generators because they are rela-
tively cheap to build, can rapidly add or subtract electricity
to the grid, but have a significantly higher operating cost
than baseload generators. These “peaking” generators ac-
count for approximately 24% of the generating capacity in
Kentucky but provide less than 5% of the electricity.

46 46 energy.ky.gov
Kentucky Electric Power Emissions
* The last major amendments to the Clean Air Act were implemented in 1990. These amendments focused on National Ambi-
ent Air Quality Standards and the mechanisms which would ensure attainment and compliance with emission reduction targets.
Subsequently, the emission of Sulfur Dioxide (SO2) and Nitrogen Oxides (NOx) from electric generating plants were regu-
lated and scheduled for reduction. The dual display of electricity generation and regulated emissions indicates that over
time, though electricity demand and generation have increased, the release of targeted pollutants has actually decreased.
Therefore, both the aggregate emissions as well as intensity of emissions per Gigawatt-hour of criteria pollutants, such as Su-
flur Dioxide and Nitrogen Oxides, have been decreasing in the Commonwealth since 1990. These reductions have been
made through a combination of burning low sulfur coal and the installation of SO2 Scrubbers and Select Catalytic Reduction
(SCR) for NOx at coal-fired power plants in Kentucky.
Emission Metric Tons Since 1990* Carbon Dioxide 86,155,120 29%
Sulfur Dioxide 232,401 - 72%
Nitrogen Oxides 73,900 - 75%
Sulfur Dioxide is a highly reactive gas and major pollutant that is monitored and regulated at the State and Federal level. In 2009, the Electric Power Sector of Kentucky emitted 232,401 metric tons of sulfur dioxide, representing a 27% decrease from 2008. Overall, the Electric Power Sector of Kentucky has reduced sulfur dioxide emissions by 72% since 1990.
Nitrogen Oxides are a group of highly reactive gasses which are monitored and regulated at the State and Federal level. In 2009, the Electric Power Sector of Kentucky emitted 73,900 metric tons of nitrogen oxides, representing a 49% decrease from 2008. Overall, the Electric Power Sector of Kentucky has reduced the emission of nitrogen oxides by 75% since 1990.
Carbon Dioxide emissions from fossil fuel power plants have been monitored over time at the State and Federal level. In 2009, the Electric Power Sector of Kentucky emitted 86,155,120 metric tons of carbon dioxide. This amount rep-resented a 8% decrease in electric power carbon dioxide emissions in the State, compared with 2008. Overall, the Electric Power Sector of Kentucky has increased carbon di-oxide emissions by 29% since 1990.
energy.ky.gov 47
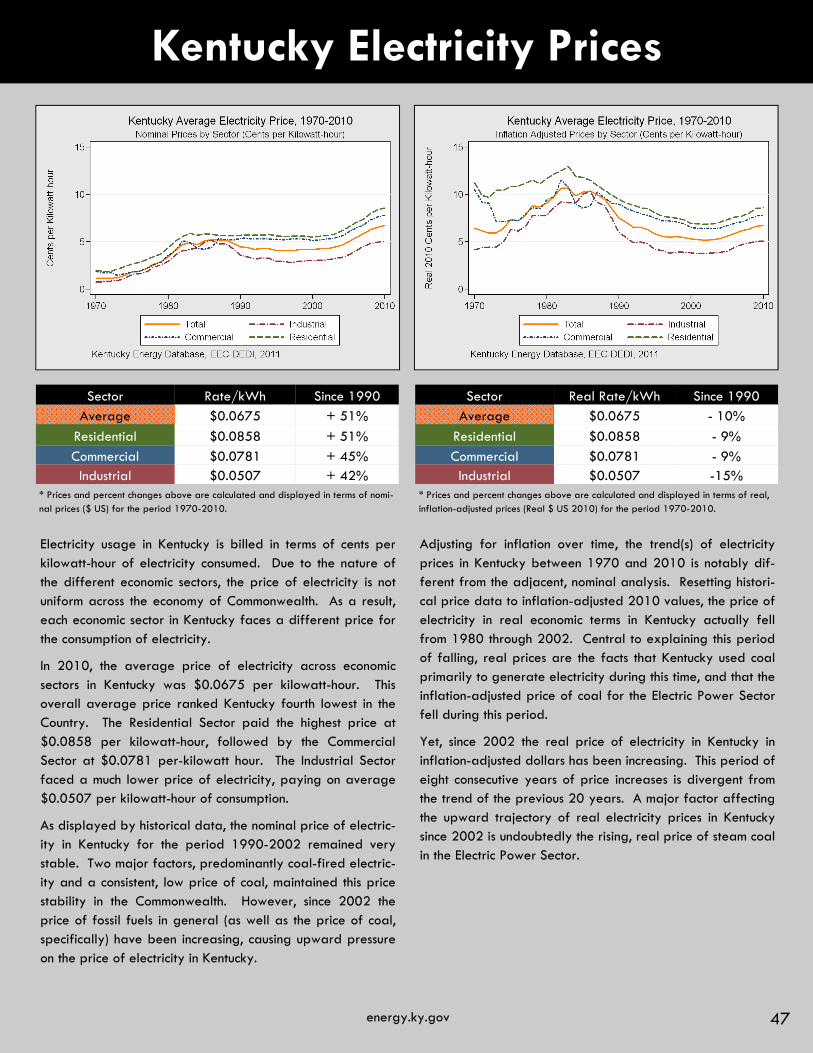
Kentucky Electricity Prices
Sector Real Rate/kWh Since 1990 Average $0.0675 - 10%
Residential $0.0858 - 9%
Commercial $0.0781 - 9% Industrial $0.0507 -15%
Adjusting for inflation over time, the trend(s) of electricity prices in Kentucky between 1970 and 2010 is notably dif-ferent from the adjacent, nominal analysis. Resetting histori-cal price data to inflation-adjusted 2010 values, the price of electricity in real economic terms in Kentucky actually fell from 1980 through 2002. Central to explaining this period of falling, real prices are the facts that Kentucky used coal primarily to generate electricity during this time, and that the inflation-adjusted price of coal for the Electric Power Sector fell during this period.
Yet, since 2002 the real price of electricity in Kentucky in inflation-adjusted dollars has been increasing. This period of eight consecutive years of price increases is divergent from the trend of the previous 20 years. A major factor affecting the upward trajectory of real electricity prices in Kentucky since 2002 is undoubtedly the rising, real price of steam coal in the Electric Power Sector.
Sector Rate/kWh Since 1990 Average $0.0675 + 51%
Residential $0.0858 + 51%
Commercial $0.0781 + 45% Industrial $0.0507 + 42%
Electricity usage in Kentucky is billed in terms of cents per kilowatt-hour of electricity consumed. Due to the nature of the different economic sectors, the price of electricity is not uniform across the economy of Commonwealth. As a result, each economic sector in Kentucky faces a different price for the consumption of electricity.
In 2010, the average price of electricity across economic sectors in Kentucky was $0.0675 per kilowatt-hour. This overall average price ranked Kentucky fourth lowest in the Country. The Residential Sector paid the highest price at $0.0858 per kilowatt-hour, followed by the Commercial Sector at $0.0781 per-kilowatt hour. The Industrial Sector faced a much lower price of electricity, paying on average $0.0507 per kilowatt-hour of consumption.
As displayed by historical data, the nominal price of electric-ity in Kentucky for the period 1990-2002 remained very stable. Two major factors, predominantly coal-fired electric-ity and a consistent, low price of coal, maintained this price stability in the Commonwealth. However, since 2002 the price of fossil fuels in general (as well as the price of coal, specifically) have been increasing, causing upward pressure on the price of electricity in Kentucky.
* Prices and percent changes above are calculated and displayed in terms of nomi-nal prices ($ US) for the period 1970-2010.
* Prices and percent changes above are calculated and displayed in terms of real, inflation-adjusted prices (Real $ US 2010) for the period 1970-2010.

48 48 energy.ky.gov
Kentucky Electric Service Areas
The Commonwealth of Kentucky is divided into certified electric service territories as determined by the Kentucky Public Ser-
vice Commission (KRS 278.016). Within these certified electric service areas, electricity service and delivery is restricted to
one electricity provider per service area. Providers of electricity in Kentucky are either Investor-Owned Utilities (IOU), Munici-
pal-Owned Utilities (MOU), or Rural Electric Cooperative Corporations (RECC). Municipal Utilities and TVA Distributors are not
subject to Kentucky Public Service Commission regulation.
** TVA Distributor
All Municipal Utilities Kentucky Utilities Big Sandy RECC Licking Valley RECC Blue Grass ECC Louisville Gas & Electric Clark ECC Meade County RECC Cumberland Valley RECC Nolin RECC Duke Energy Kentucky Owen ECC Farmers RECC Pennyrile RECC** Fleming-Mason ECC Salt River ECC Grayson RECC Shelby ECC Hickman-Fulton Counties RECC** South Kentucky RECC Inter County ECC Taylor County RECC Jackson ECC Tri-County Electric Member Corporation** Jackson Purchase Energy Corporation Warren RECC** Kenergy Corporation West Kentucky RECC** Kentucky Power

energy.ky.gov 49
Residential Electricity Prices, 2010
Henderson City Utility Commission 5.96¢ City of Owensboro 9.30¢ City of Paris 6.83¢ Madisonville Municipal Utilities 9.35¢ City of Nicholasville 6.95¢ City of Jellico 9.36¢ Meade County R.E.C.C 6.98¢ Shelby Energy Co-op, Inc 9.36¢ Kenergy Corporation 7.03¢ Warren R.E.C.C 9.38¢ Jackson Purchase Energy Corporation 7.07¢ Tri-County Electric Member Corporation 9.41¢ City of Frankfort 7.11¢ South Kentucky R.E.C.C 9.46¢ City of Benham 7.15¢ Nolin R.E.C.C. 9.50¢ City of Berea Municipal Utility 7.27¢ City of Murray 9.55¢ City of Bardstown 7.48¢ City of Glasgow 9.65¢ Kentucky Utilities Company 7.54¢ Farmers R.E.C.C. 9.82¢ Barbourville Utility Commission 7.78¢ Pennyrile R.E.C.C. 9.84¢ Louisville Gas & Electric Company 7.98¢ Big Sandy R.E.C.C. 9.89¢ Williamstown Utility Commission 8.10¢ Owen Electric Coop Inc 9.96¢ Duke Energy Kentucky, Inc. 8.26¢ City of Fulton 10.01¢ City of Falmouth 8.47¢ City of Mayfield Plant Board 10.05¢ Corbin City Utilities Commission 8.60¢ Blue Grass E.C.C. 10.05¢ Kentucky Power Company 8.64¢ Fleming-Mason Energy Coop Inc 10.06¢ City of Franklin 8.69¢ Clark Energy Coop Inc 10.10¢ City of Paducah 8.74¢ City of Benton 10.28¢ Salt River Electric Coop Corporation 8.79¢ City of Princeton 10.38¢ City of Bowling Green 8.94¢ Inter County Energy Cooperative Corporation 10.43¢ City of Bardwell 9.04¢ Licking Valley R.E.C.C. 10.45¢ City of Hopkinsville 9.07¢ Jackson Energy Coop Corp 10.75¢ Taylor County R.E.C.C 9.08¢ City of Hickman 10.85¢ City of Providence 9.11¢ West Kentucky R.E.C.C. 11.11¢ Cumberland Valley R.E.C.C 9.17¢ City of Vanceburg 11.58¢ City of Olive Hill 9.20¢ Grayson R.E.C.C. 11.67¢ City of Russellville 9.21¢ Hickman-Fulton Counties R.E.C.C. 12.16¢

50 50 energy.ky.gov
Residential Electricity Usage, 2010
City of Falmouth 0.68 South Kentucky R.E.C.C. 1.20 City of Bardwell 0.78 Barbourville Utility Commission 1.20 City of Owensboro 0.94 City of Frankfort 1.21 Madisonville Municipal Utilities 0.98 City of Hopkinsville 1.23 City of Princeton 1.02 City of Bardstown 1.23 City of Bowling Green 1.04 City of Berea Municipal Utility 1.23 City of Murray 1.04 City of Benton 1.23 City of Mayfield Plant Board 1.05 Farmers R.E.C.C. 1.24 City of Russellville 1.05 Henderson City Utility Commission 1.24 City of Paducah 1.07 City of Jellico 1.25 Duke Energy Kentucky, Inc. 1.08 Inter County Energy Coop Corporation 1.28 Licking Valley R.E.C.C. 1.09 Tri-County Electric Member Corporation 1.32 Louisville Gas & Electric Company 1.10 Kentucky Utilities Company 1.33 City of Vanceburg 1.10 Cumberland Valley R.E.C.C. 1.33 City of Glasgow 1.12 Jackson Energy Coop Corporation 1.33 City of Fulton 1.12 Hickman-Fulton Counties R.E.C.C. 1.34 Grayson R.E.C.C. 1.12 Blue Grass Energy Coop Corporation 1.35 City of Paris 1.13 Big Sandy R.E.C.C. 1.36 Corbin City Utilities Commission 1.13 West Kentucky R.E.C.C. 1.36 City of Nicholasville 1.14 Nolin R.E.C.C. 1.37 Fleming-Mason Energy Coop Inc 1.14 Pennyrile Rural Electric Cooperative 1.40 City of Olive Hill 1.16 Shelby Energy Co-op, Inc 1.40 City of Franklin 1.17 Jackson Purchase Energy Corporation 1.41 Taylor County R.E.C.C. 1.18 Salt River Electric Coop Corporation 1.41 Owen Electric Coop Inc 1.18 Williamstown Utility Commission 1.43 City of Hickman 1.19 Warren R.E.C.C. 1.45 Meade County R.E.C.C. 1.19 Kenergy Corporation 1.50 City of Providence 1.19 Kentucky Power Company 1.52 Clark Energy Coop Inc 1.19 City of Benham 1.80

energy.ky.gov 51
City of Falmouth $57.72 City of Hopkinsville $111.21 City of Bardwell $70.25 City of Fulton $112.27 Henderson City Utility Commission $74.14 South Kentucky R.E.C.C. $113.34 City of Paris $77.07 Licking Valley R.E.C.C. $113.80 City of Nicholasville $78.89 Fleming-Mason Energy Coop Inc $114.63 Meade County R.E.C.C. $82.75 Williamstown Utility Commission $115.90 City of Frankfort $85.79 City of Jellico $117.01 Louisville Gas & Electric Company $87.50 Owen Electric Coop Inc $117.88 City of Owensboro $87.57 Clark Energy Coop Inc $120.17 Duke Energy Kentucky, Inc. $89.10 Farmers R.E.C.C. $121.25 City of Berea Municipal Utility $89.44 Cumberland Valley R.E.C.C. $121.87 City of Bardstown $91.70 Tri-County Electric Member Corporation $123.91 Madisonville Municipal Utilities $91.94 Salt River Electric Coop Corporation $124.17 City of Bowling Green $92.64 City of Benton $126.52 Barbourville Utility Commission $93.45 City of Vanceburg $127.79 City of Paducah $93.88 City of Hickman $128.67 City of Russellville $97.12 City of Benham $129.03 Corbin City Utilities Commission $97.49 Nolin R.E.C.C. $130.37 City of Murray $99.77 Grayson R.E.C.C. $131.00 Jackson Purchase Energy Corporation $99.92 Shelby Energy Co-op, Inc $131.43 Kentucky Utilities Company $99.95 Kentucky Power Company $131.69 City of Franklin $102.06 Inter County Energy Coop Corporation $133.20 City of Mayfield Plant Board $105.19 Big Sandy R.E.C.C. $134.09 Kenergy Corporation $105.36 Blue Grass Energy Coop Corporation $135.67 City of Olive Hill $106.28 Warren R.E.C.C. $136.41 City of Princeton $106.37 Pennyrile Rural Electric Cooperative $137.23 Taylor County R.E.C.C. $106.85 Jackson Energy Coop Corporation $143.20 City of Glasgow $107.94 West Kentucky R.E.C.C. $151.65 City of Providence $108.19 Hickman-Fulton Counties R.E.C.C. $162.39
Residential Electricity Bill, 2010
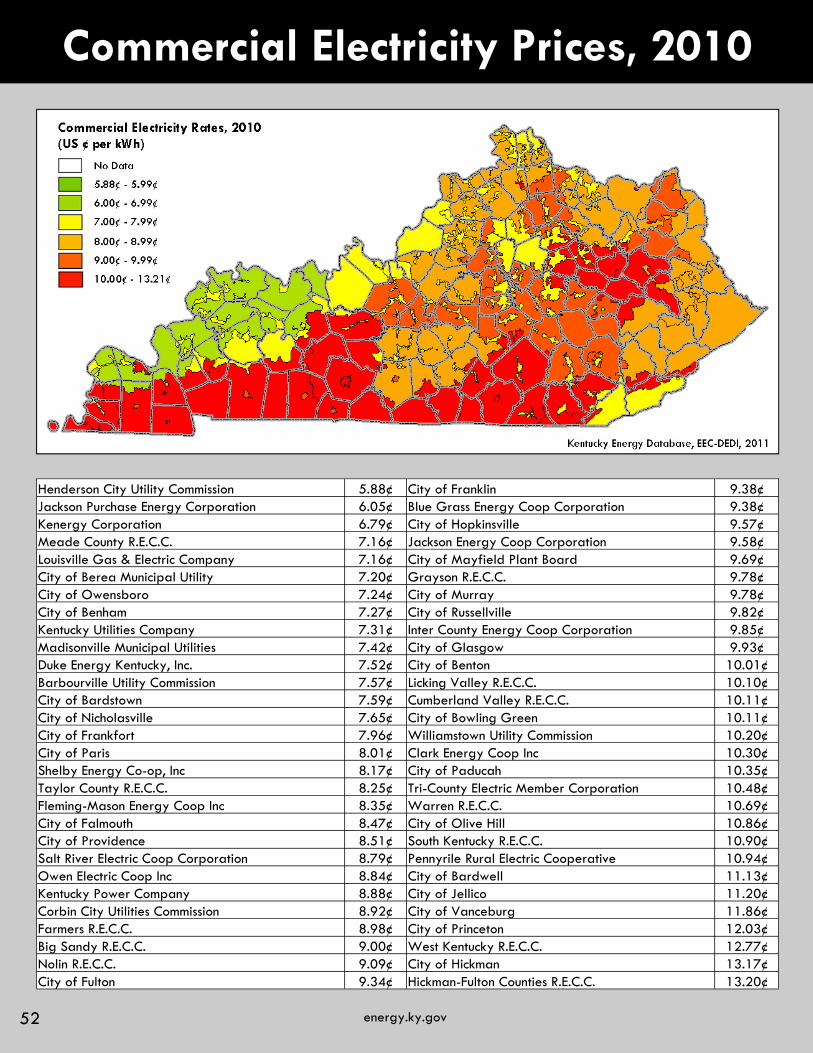
52 52 energy.ky.gov
Commercial Electricity Prices, 2010
Henderson City Utility Commission 5.88¢ City of Franklin 9.38¢ Jackson Purchase Energy Corporation 6.05¢ Blue Grass Energy Coop Corporation 9.38¢ Kenergy Corporation 6.79¢ City of Hopkinsville 9.57¢ Meade County R.E.C.C. 7.16¢ Jackson Energy Coop Corporation 9.58¢ Louisville Gas & Electric Company 7.16¢ City of Mayfield Plant Board 9.69¢ City of Berea Municipal Utility 7.20¢ Grayson R.E.C.C. 9.78¢ City of Owensboro 7.24¢ City of Murray 9.78¢ City of Benham 7.27¢ City of Russellville 9.82¢ Kentucky Utilities Company 7.31¢ Inter County Energy Coop Corporation 9.85¢ Madisonville Municipal Utilities 7.42¢ City of Glasgow 9.93¢ Duke Energy Kentucky, Inc. 7.52¢ City of Benton 10.01¢ Barbourville Utility Commission 7.57¢ Licking Valley R.E.C.C. 10.10¢ City of Bardstown 7.59¢ Cumberland Valley R.E.C.C. 10.11¢ City of Nicholasville 7.65¢ City of Bowling Green 10.11¢ City of Frankfort 7.96¢ Williamstown Utility Commission 10.20¢ City of Paris 8.01¢ Clark Energy Coop Inc 10.30¢ Shelby Energy Co-op, Inc 8.17¢ City of Paducah 10.35¢ Taylor County R.E.C.C. 8.25¢ Tri-County Electric Member Corporation 10.48¢ Fleming-Mason Energy Coop Inc 8.35¢ Warren R.E.C.C. 10.69¢ City of Falmouth 8.47¢ City of Olive Hill 10.86¢ City of Providence 8.51¢ South Kentucky R.E.C.C. 10.90¢ Salt River Electric Coop Corporation 8.79¢ Pennyrile Rural Electric Cooperative 10.94¢ Owen Electric Coop Inc 8.84¢ City of Bardwell 11.13¢ Kentucky Power Company 8.88¢ City of Jellico 11.20¢ Corbin City Utilities Commission 8.92¢ City of Vanceburg 11.86¢ Farmers R.E.C.C. 8.98¢ City of Princeton 12.03¢ Big Sandy R.E.C.C. 9.00¢ West Kentucky R.E.C.C. 12.77¢ Nolin R.E.C.C. 9.09¢ City of Hickman 13.17¢ City of Fulton 9.34¢ Hickman-Fulton Counties R.E.C.C. 13.20¢

energy.ky.gov 53
Industrial Electricity Prices, 2010
Kenergy Corporation 3.91¢ Duke Energy Kentucky, Inc. 6.58¢ City of Benham 4.05¢ City of Owensboro 6.68¢ Henderson City Utility Commission 4.07¢ Inter County Energy Coop Corporation 6.69¢ Corbin City Utilities Commission 4.45¢ Williamstown Utility Commission 6.71¢ Tennessee Valley Authority 4.55¢ Jackson Energy Coop Corporation 6.71¢ Electric Energy Inc 4.77¢ City of Murray 6.86¢ Owen Electric Coop Inc 4.82¢ West Kentucky R.E.C.C. 6.89¢ City of Bardstown 5.04¢ City of Glasgow 7.14¢ Jackson Purchase Energy Corporation 5.09¢ City of Franklin 7.24¢ Louisville Gas & Electric Company 5.38¢ Tri-County Electric Member Corporation 7.26¢ Kentucky Utilities Company 5.57¢ Farmers R.E.C.C. 7.28¢ Kentucky Power Company 5.64¢ Licking Valley R.E.C.C. 7.41¢ City of Hopkinsville 5.66¢ Cumberland Valley R.E.C.C. 7.42¢ Nolin R.E.C.C. 5.79¢ Pennyrile Rural Electric Cooperative 7.50¢ Fleming-Mason Energy Coop Inc 5.80¢ Warren Rural Elec Coop Corporation 7.51¢ City of Nicholasville 5.81¢ South Kentucky R.E.C.C. 7.65¢ City of Paris 5.85¢ City of Russellville 8.21¢ City of Bowling Green 6.00¢ City of Fulton 8.38¢ Grayson R.E.C.C. 6.11¢ Clark Energy Coop Inc 8.39¢ City of Frankfort 6.17¢ Taylor County R.E.C.C. 8.50¢ Blue Grass Energy Coop Corporation 6.25¢ City of Mayfield Plant Board 8.72¢ Barbourville Utility Commission 6.26¢ City of Paducah 8.74¢ Big Sandy R.E.C.C. 6.36¢ City of Benton 9.28¢ Salt River Electric Coop Corporatoin. 6.37¢ City of Vanceburg 9.44¢ Shelby Energy Co-op, Inc 6.40¢ City of Princeton 10.15¢ City of Berea Municipal Utility 6.49¢ Hickman-Fulton Counties R.E.C.C. 11.97¢
54 54 energy.ky.gov
AUTHORS
The databases, graphics, and analyses for this report were developed by:
Aron Patrick
Senior Analyst
Data & Quantitative Modeling
Energy & Environment Cabinet
Department for Energy Development & Independence
Alan Waddell
Energy Analyst
Energy & Environment Cabinet
Department for Energy Development & Independence

energy.ky.gov 55
Acknowledgements
The Kentucky Department for Energy Development and Independence (DEDI)
would like to extend a special thanks to the following agencies, organizations, and individuals for their contributions to this project:
The Kentucky Geological Survey (KGS)
The Kentucky Public Service Commission (PSC)
The University of Kentucky Department of Statistics
and
Yang Luo,
Graduate Student Intern, University of Kentucky

56 56 energy.ky.gov
Basic Methodology
Purpose:
In December 2009, Kentucky Energy and Environment Cabinet Secretary Len Peters directed the Depart-ment for Energy Development and Independence (DEDI) to construct a comprehensive database concern-ing energy, environmental, and economic statistics for the purposes of quantitative analysis and policy interpretation. The outcome of this effort is the Kentucky Energy Database, a summary time series data set encapsulating energy related statistics for the Commonwealth of Kentucky for the period 1950 to 2010. An outgrowth of this undertaking is the Kentucky Energy Profile 2011, which utilizes the summary statistics of the Kentucky Energy Database to provide an annual snapshot of energy consumption and production within Kentucky. The Kentucky Energy Profile 2011 exists for the following three purposes:
1. To support the Commonwealth Energy Assurance Plan that identifies potential threats to energy systems in the Commonwealth.
2. To serve as an impartial repository of energy statistics for the general public, researchers, and policy makers.
3. To provide an understanding of the dynamics of energy consumption and production within the Commonwealth.
Construction:
The foundation of the Kentucky Energy Profile 2011, the Kentucky Energy Database, consists of one sum-mary time series data set and four supporting multidimensional panel data sets, each with a different unit of observation. The majority of the variables located in this database were acquired from publically available resources, primarily the Department of Energy State Energy Data System (SEDS). This data system is produced and maintained by the U.S. Energy Information Administration (EIA).
However, the SEDS database does not contain many critical variables - particularly economic, socioeco-nomic, and environmental - required for a holistic analysis of energy systems. Accordingly, the Kentucky Energy Database was supplemented with data sets from the following United States Government agen-cies: Federal Energy Regulatory Commission (FERC), National Renewable Energy Laboratory (NREL), Bu-reau of Economic Analysis (BEA), National Oceanic Atmospheric Administration (NOAA), U.S. Census Bu-reau, U.S. Census of Manufacturers, Environmental Protection Agency (EPA), Mine Safety and Health Ad-ministration (MSHA), and the Bureau of Labor Statistics (BLS).
Following the construction of the Kentucky Energy Database, DEDI analysts were able to conduct specified research involving economic and energy related issues of the Commonwealth. The collation of data pro-vided a platform on which summary statistics and time series data could be easily generated to answer questions of interest. Such information could then be transformed into accessible tables and graphics for general representation and distribution.
Production:
Incorporating the capabilities of the Kentucky Energy Database, DEDI analysts were able to produce an energy profile for the Commonwealth, which became the Kentucky Energy Profile 2011. This document intends to function as a comprehensive assessment of energy consumption and production within the state by supplying detailed summary statistics and identifying time series trends. The data and topics included within the document are represented through quantitative tables, analytic graphics and maps, as well as written analysis.
For a more detailed explanation of the Kentucky Energy Database, please examine the “Kentucky En-ergy Database Methodology” available in PDF format, under the Data & Modeling Section of DEDI Pro-grams (energy.ky.gov).
energy.ky.gov 57
Kentucky Energy Profile Glossary
Aviation Gasoline: A complex mixture of relatively volatile hydrocarbons with or without small quanti-ties of additives, blended to form a fuel suitable for use in aviation reciprocating engines.
Biomass: Organic non-fossil material of biological origin constituting a renewable energy source.
British Thermal Unit (BTU): The quantity of heat required to raise the temperature of 1 pound of liquid water by 1 degree Fahrenheit at the temperature at which water has its greatest density (approximately 39 degrees Fahrenheit).
Central Appalachian Basin: The Central Appalachian Coal Basin is the middle basin of three basins that comprise the Appalachian Coal Region of the eastern United States. It includes parts of Kentucky, Ten-nessee, Virginia, and West Virginia.(G)
Coal: a naturally occurring, combustible, sedimentary rock containing at least 50% by weight organic matter, a solid “fossil” fuel.(G)
Coal Export: A quantity of coal shipped, delivered, and combusted within a State different from the coal mine State of origin.(D)
Coal Field: A geographic region characterized by coal resources.(G)
Coal Import: A quantity of coal delivered and combusted within a State, but not originating from a coal mine within the same State.(D)
Commercial Sector: An energy-consuming sector that consists of service-providing facilities and equip-ment of businesses; Federal, State, and local governments; educational institutions, and other private and public organizations, such as religious, social, or fraternal groups.
Diesel: A fuel composed of distillates obtained in petroleum refining operation, or blends of such distil-lates with residual oil used in motor vehicles.
Electric Power Sector: An energy-consuming sector that consists of electricity only and combined heat and power (CHP) plants whose primary business is to sell electricity, or electricity and heat, to the public (NAICS 22). This sector includes electric utilities and independent power producers.
Electric Service Area: The geographic served exclusively by one retail electricity provider.(D)
Electricity Distribution: The delivery of electrical energy to a customer's home or business through low-voltage lines (typically at 69kV or less).(D)
Electricity Generation: The conversion of energy resources into electric power.
Electricity Rate: The average amount of money charged for each unit of electrical energy (kWh) distrib-uted to a customer.(D)
Electricity Transmission: The movement or transfer of electric energy at high voltage over an intercon-nected group of lines and associated equipment between points of supply and points at which it is trans-formed for delivery to consumers or is delivered to other electric systems.
Energy Consumption: The processes of converting energy supplies into useful forms such as heat, steam, electricity, and motion.(D)
Energy Production: The processes of extraction, collection, or utilization of energy resources for the pur-pose of creating accessible energy supplies (i.e. - available for sale and distribution).(D)
Ethanol: A clear, colorless, flammable alcohol. Ethanol is typically produced biologically from biomass
58 58 energy.ky.gov
Kentucky Energy Profile Glossary
Gigawatt (GW): A measure of electrical power. Specifically, one billion watts or one thousand mega-watts.
Gigawatt Hour (GWh): A measure of electrical energy defined as a unit of work, measured as 1 Gigawatt (1,000,000,000 watts) of power expended for 1 hour.
Hydroelectric Energy: The use of flowing water to produce electrical energy.
Illinois Basin: The coal producing areas of Western Kentucky, Southern Illinois, and Southwest Indiana.(G)
Industrial Sector: An energy-consuming sector that consists of all facilities and equipment used for pro-ducing, processing, or assembling goods. The industrial sector encompasses the following types of activity: manufacturing, agriculture, forestry, fishing and hunting; mining, oil and gas extraction, and construction.
Jet Fuel: A refined petroleum product used in jet aircraft engines. It includes kerosene-type Jet Fuel and naphtha-type Jet Fuel.
Kerosene: A light petroleum distillate that is used in space heaters, cook stoves, and water heaters and is suitable for use as a light source when burned in wick-fed lamps.
Kilowatt (kW): A measure of electrical power. Specifically, one thousand watts.
Kilowatt Hour (kWh): A measure of electrical energy defined as a unit of work, measured as 1 Kilowatt (1,000 watts) of power expended for 1 hour.
Megawatt (MW): A measure of electrical power. Specifically, one million watts.
Megawatt Hour (MWh): A measure of electrical energy defined as a unit of work, measured as 1 Megawatt (1,000,000 watts) of power expended for 1 hour.
Metallurgical Coal: Coking coal and pulverized coal containing the proper chemical characteristics to facilitate the production of steel.
Natural Gas: A naturally occurring combustible mixture of light hydrocarbon (primarily methane) and inorganic gases that often occurs in porous and permeable sedimentary rocks, a gaseous “fossil” fuel.(G)
Natural Gas Liquids: Propane and butanes, which are dissolved in natural gas at reservoir pressure but condense into liquids at normal atmospheric pressure. Also called condensates, these liquids are removed from initial natural gas production and refined into a variety of additional energy products.(D)
Net Energy Consumption: The measurement of the total British Thermal Unit (BTU) value of energy re-sources utilized or combusted, subtracting the quantity of energy lost in the conversion of a primary en-ergy source into a secondary, useful energy source.(D)
Petroleum: A mixture of hydrocarbons that exists in liquid phase in natural underground reservoirs and remains liquid at atmospheric pressure after passing through surface separating facilities.
Primary Energy: Energy in the form that it is first accounted for in a statistical energy balance, before any transformation to secondary or tertiary forms of energy.
Propane: A normally gaseous straight-chain hydrocarbon, that is extracted from natural gas or refinery gas streams.
Regulated Emissions: Relating to Sulfur Dioxide (SO2), Nitrogen Oxides (NOx), and other particulates, the release of these constituents by electric generating units are restricted by provisions of the Clean Air Act amendments of 1990. Federal and State regulatory agencies are required to monitor the production and movement of these emissions, and ensure their mandated control and reduction.(D)

energy.ky.gov 59
Kentucky Energy Profile Glossary
Residential Sector: An energy-consuming sector that consists of living quarters for private households. Common uses of energy associated with this sector include space heating, water heating, air conditioning, lighting, refrigeration, cooking, and running a variety of other appliances.
Steam Coal: Coal used in boilers to generate steam for the purpose of electricity generation or heat and power distribution.
Surface Coal Mine Operation: A coal mine operation that produces coal through extraction processes removing surface layers of soil, rock, and coal deposits.(D)
Total Energy Consumption: The measurement of the total British Thermal Unit (BTU) value of primary energy resources utilized or combusted.(D)
Transportation Sector: An energy-consuming sector that consists of all vehicles whose primary purpose is transporting people and/or goods from one physical location to another. This sector includes the natural gas utilized in the movement of natural gas resources through transmission pipeline.
Underground Coal Mine Operation: A coal mine operation that produces coal through solely subterra-nean extraction processes.(D)
Volt (V): A measure of electrical potential or electromotive force.
Watt (W): The unit of electrical power equal to one ampere under a pressure of one volt. A Watt is equal to 1/746 horse power.
Wood & Wood Waste: Wood and wood products, possibly including scrubs, branches, sawdust, etc., bought or gathered, and used by direct combustion.
*** All definitions are cited from the Energy Information Administration (E.I.A) Glossary unless otherwise noted.
(D) - Kentucky Department for Energy Development and Independence (DEDI)
(G) - Kentucky Geological Survey (KGS)

60 60 energy.ky.gov

energy.ky.gov 61

62 62 energy.ky.gov